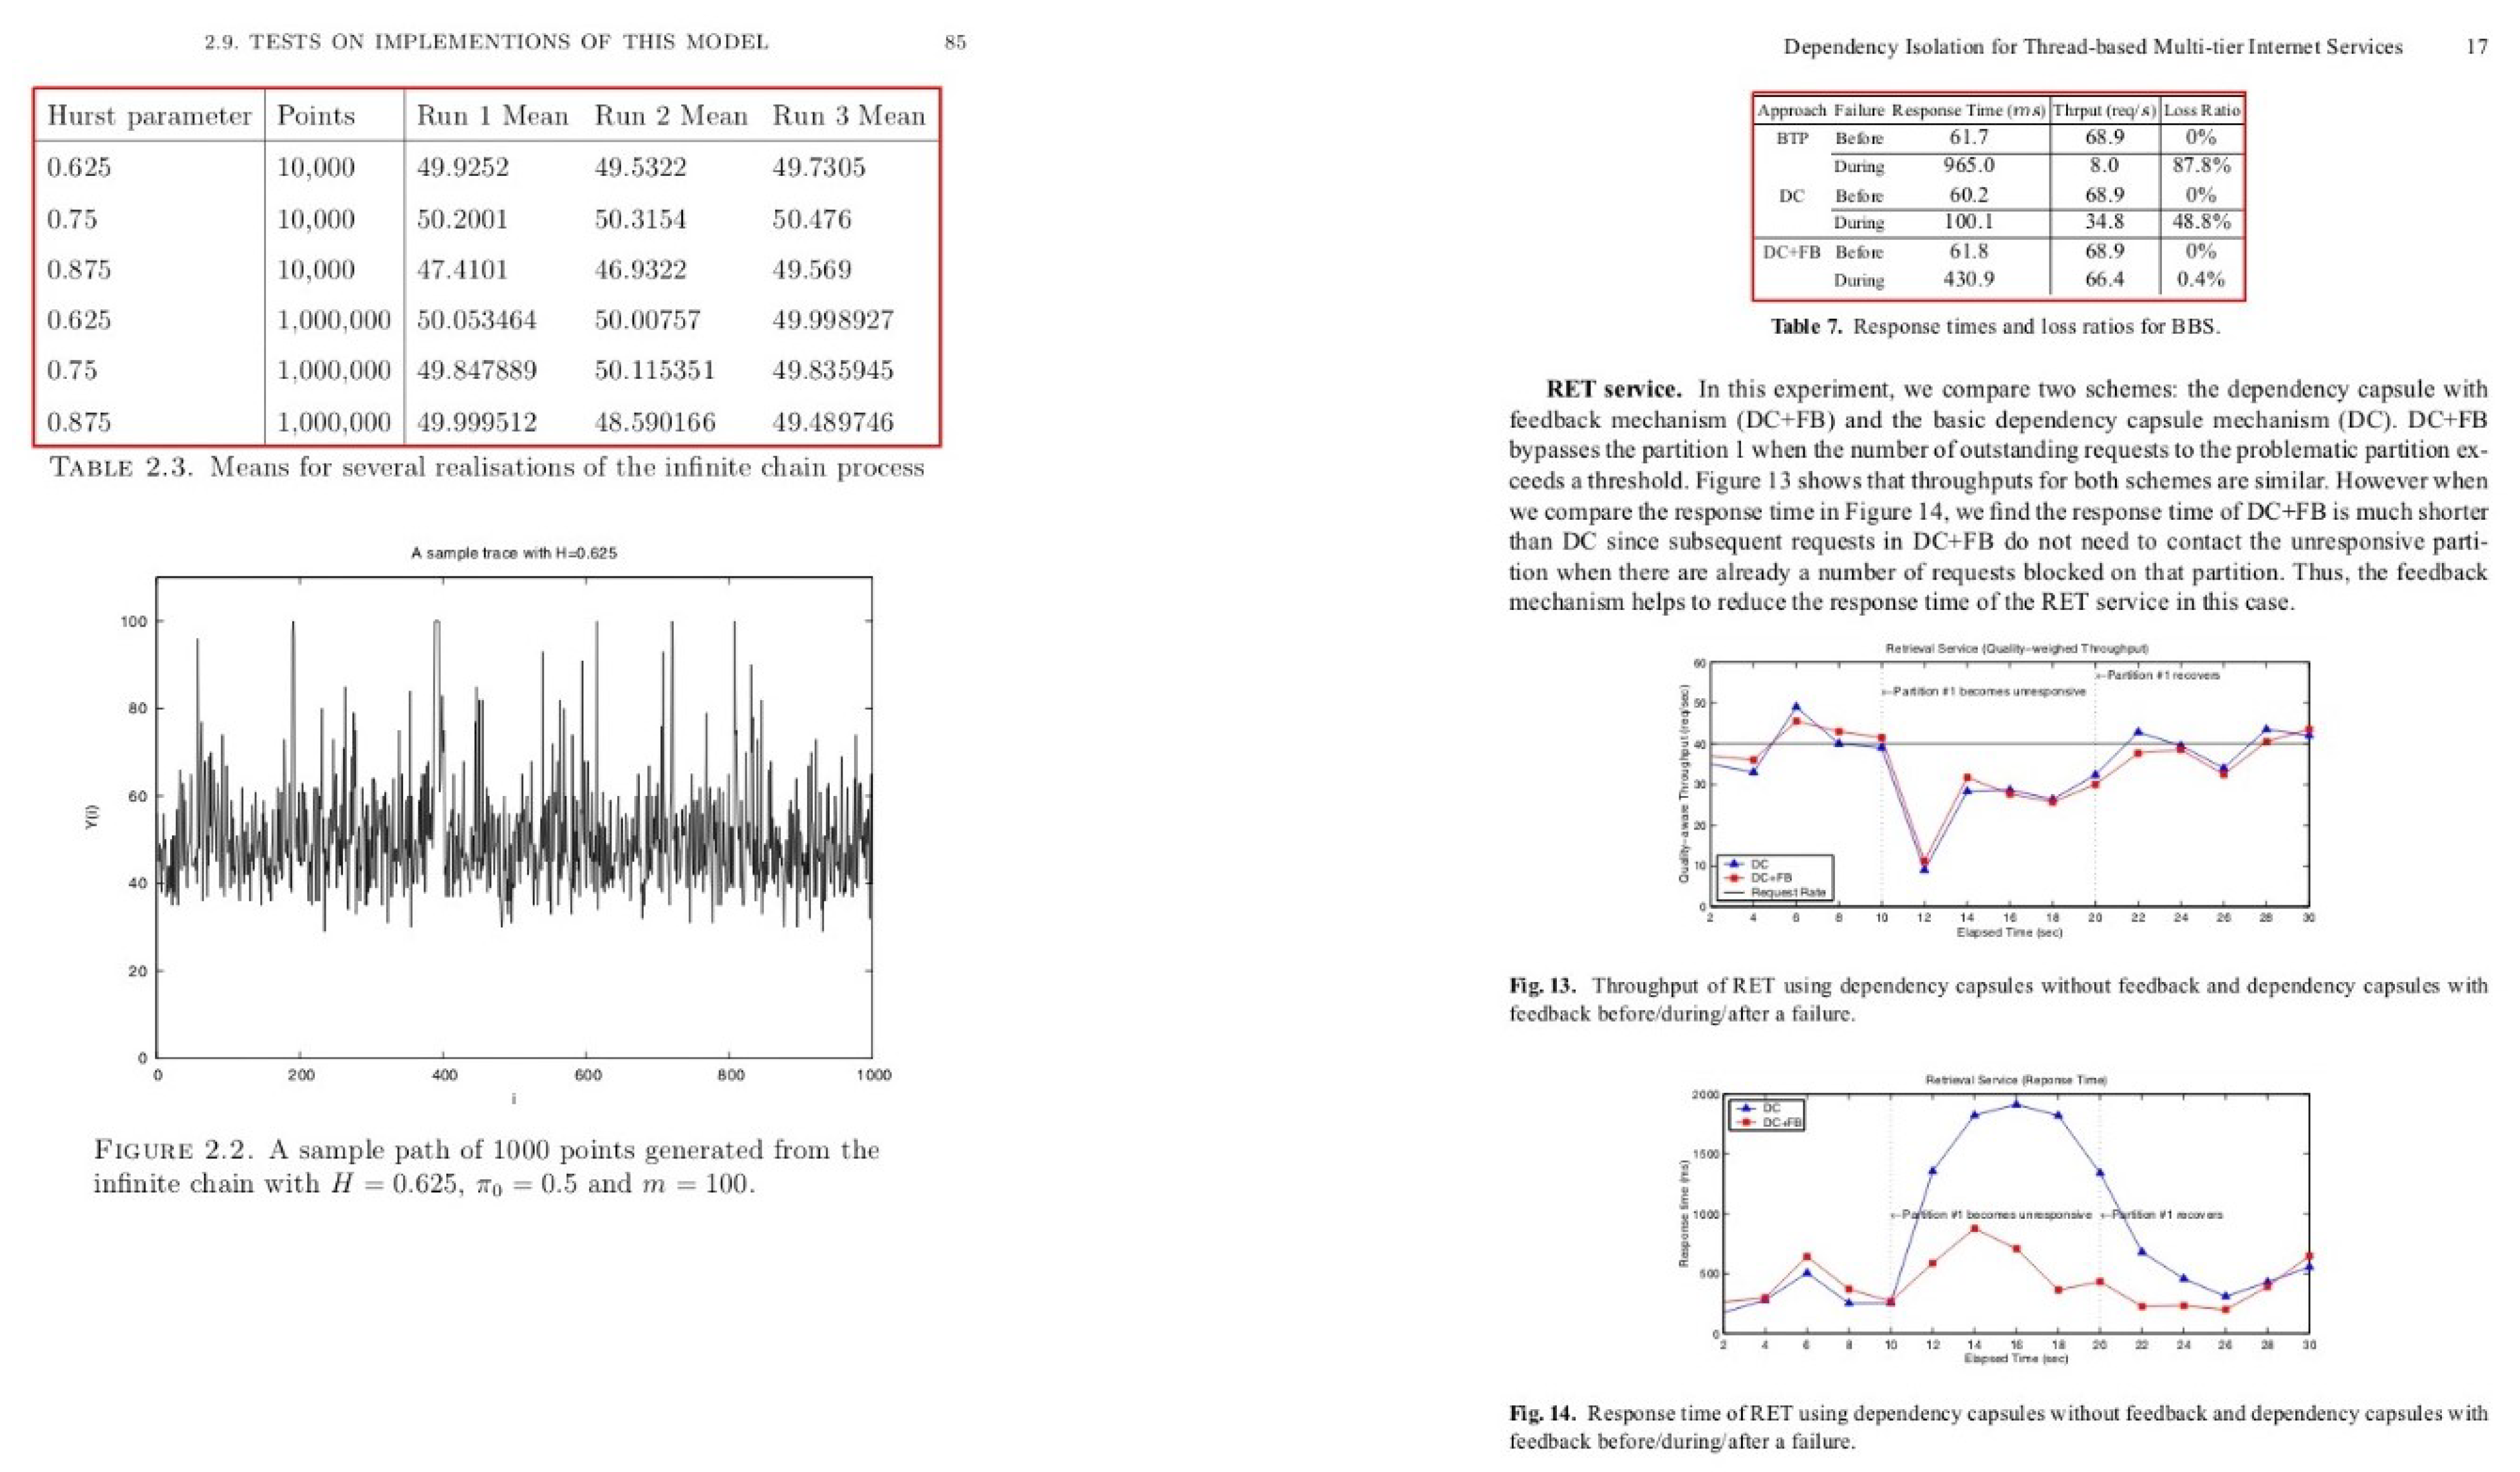
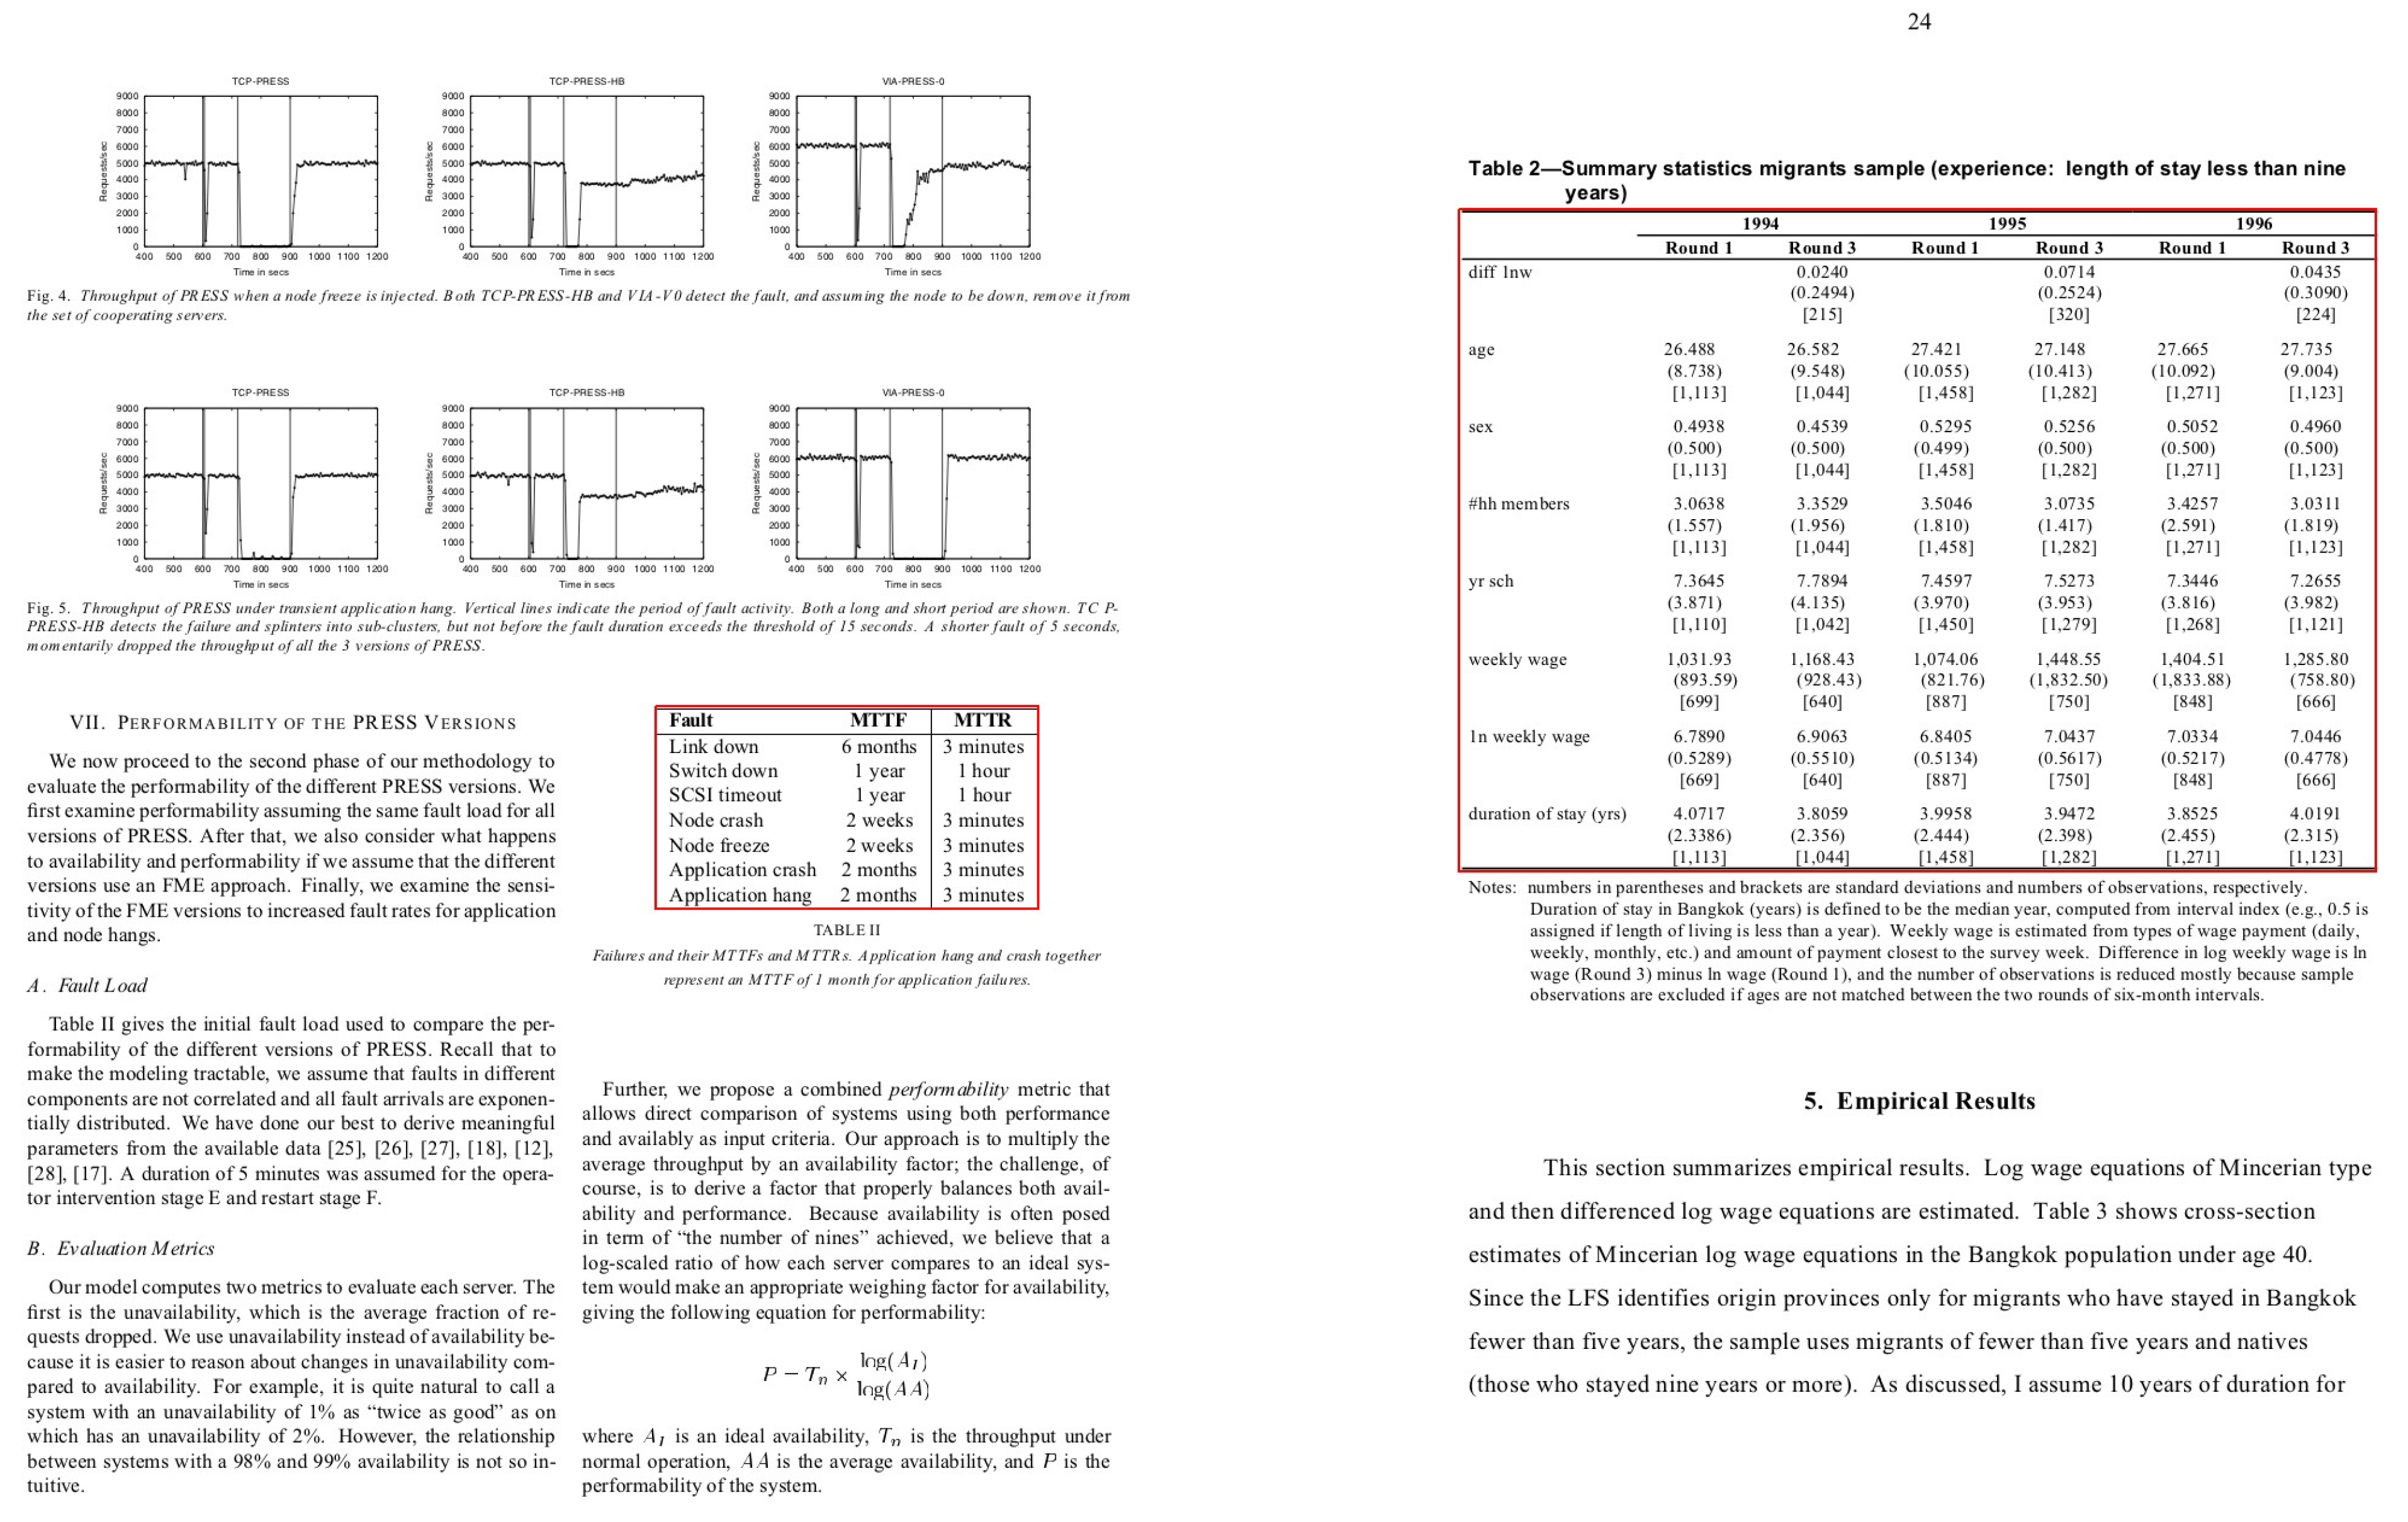
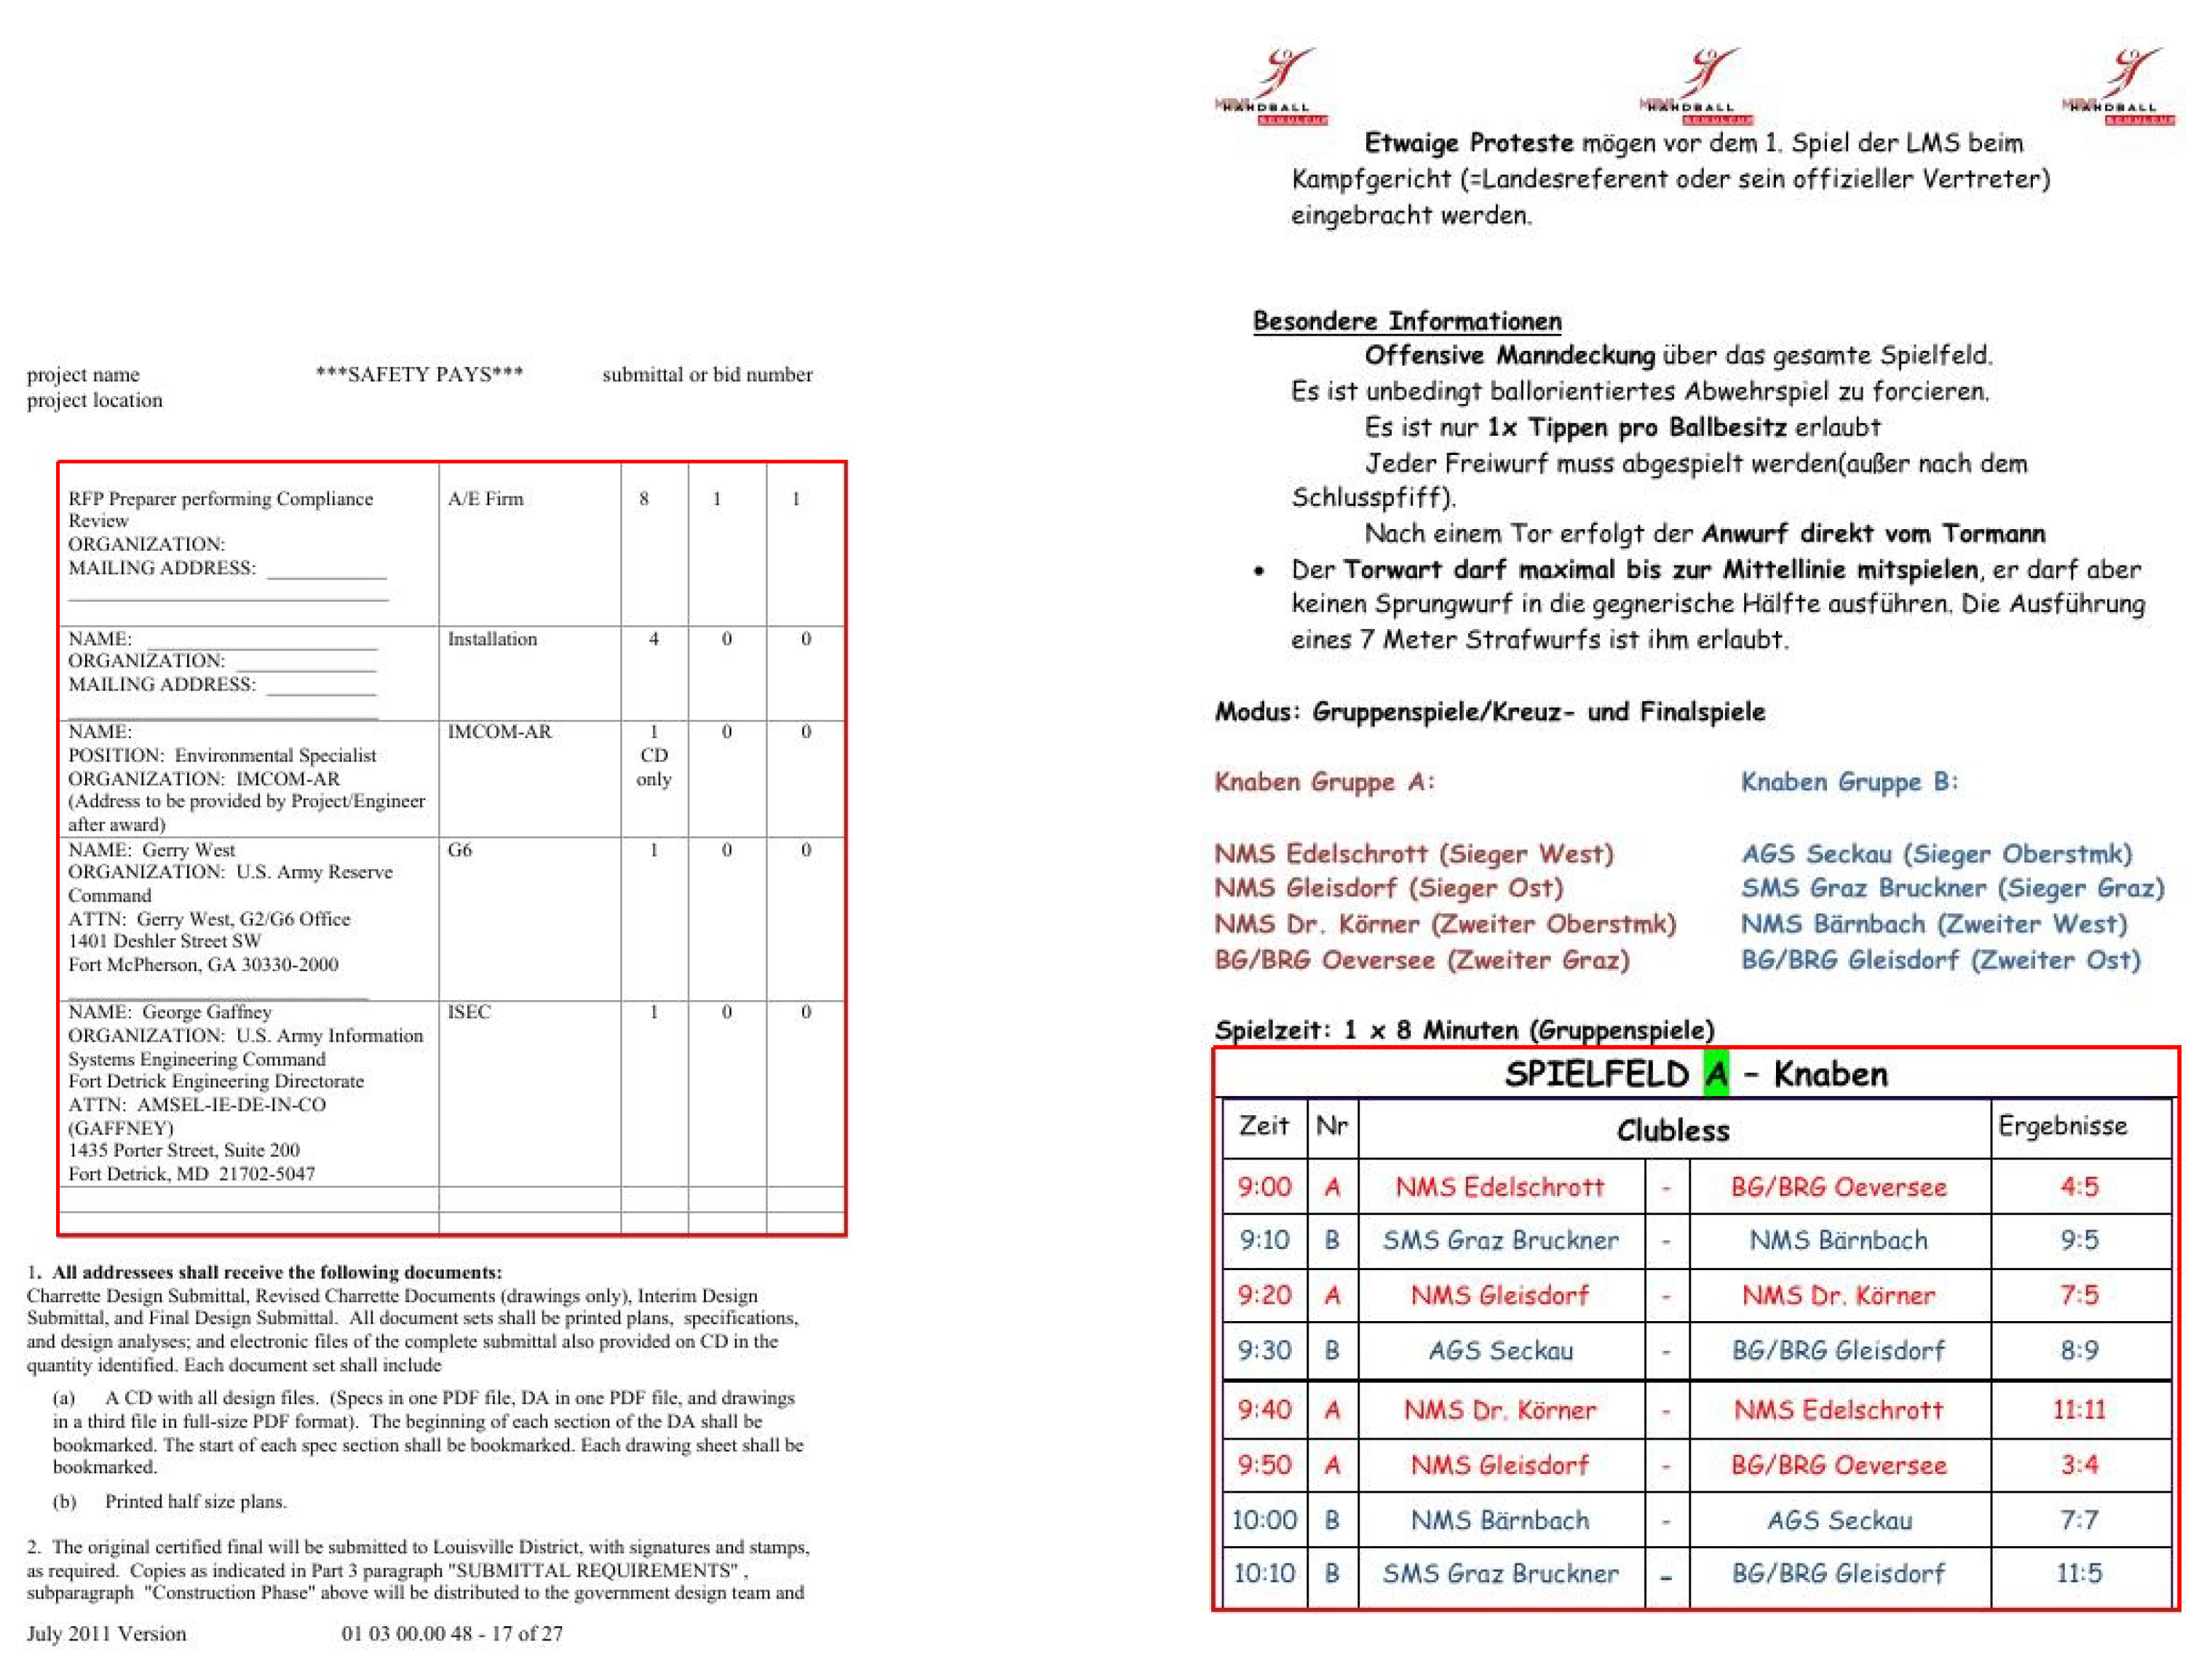
Figure 1.
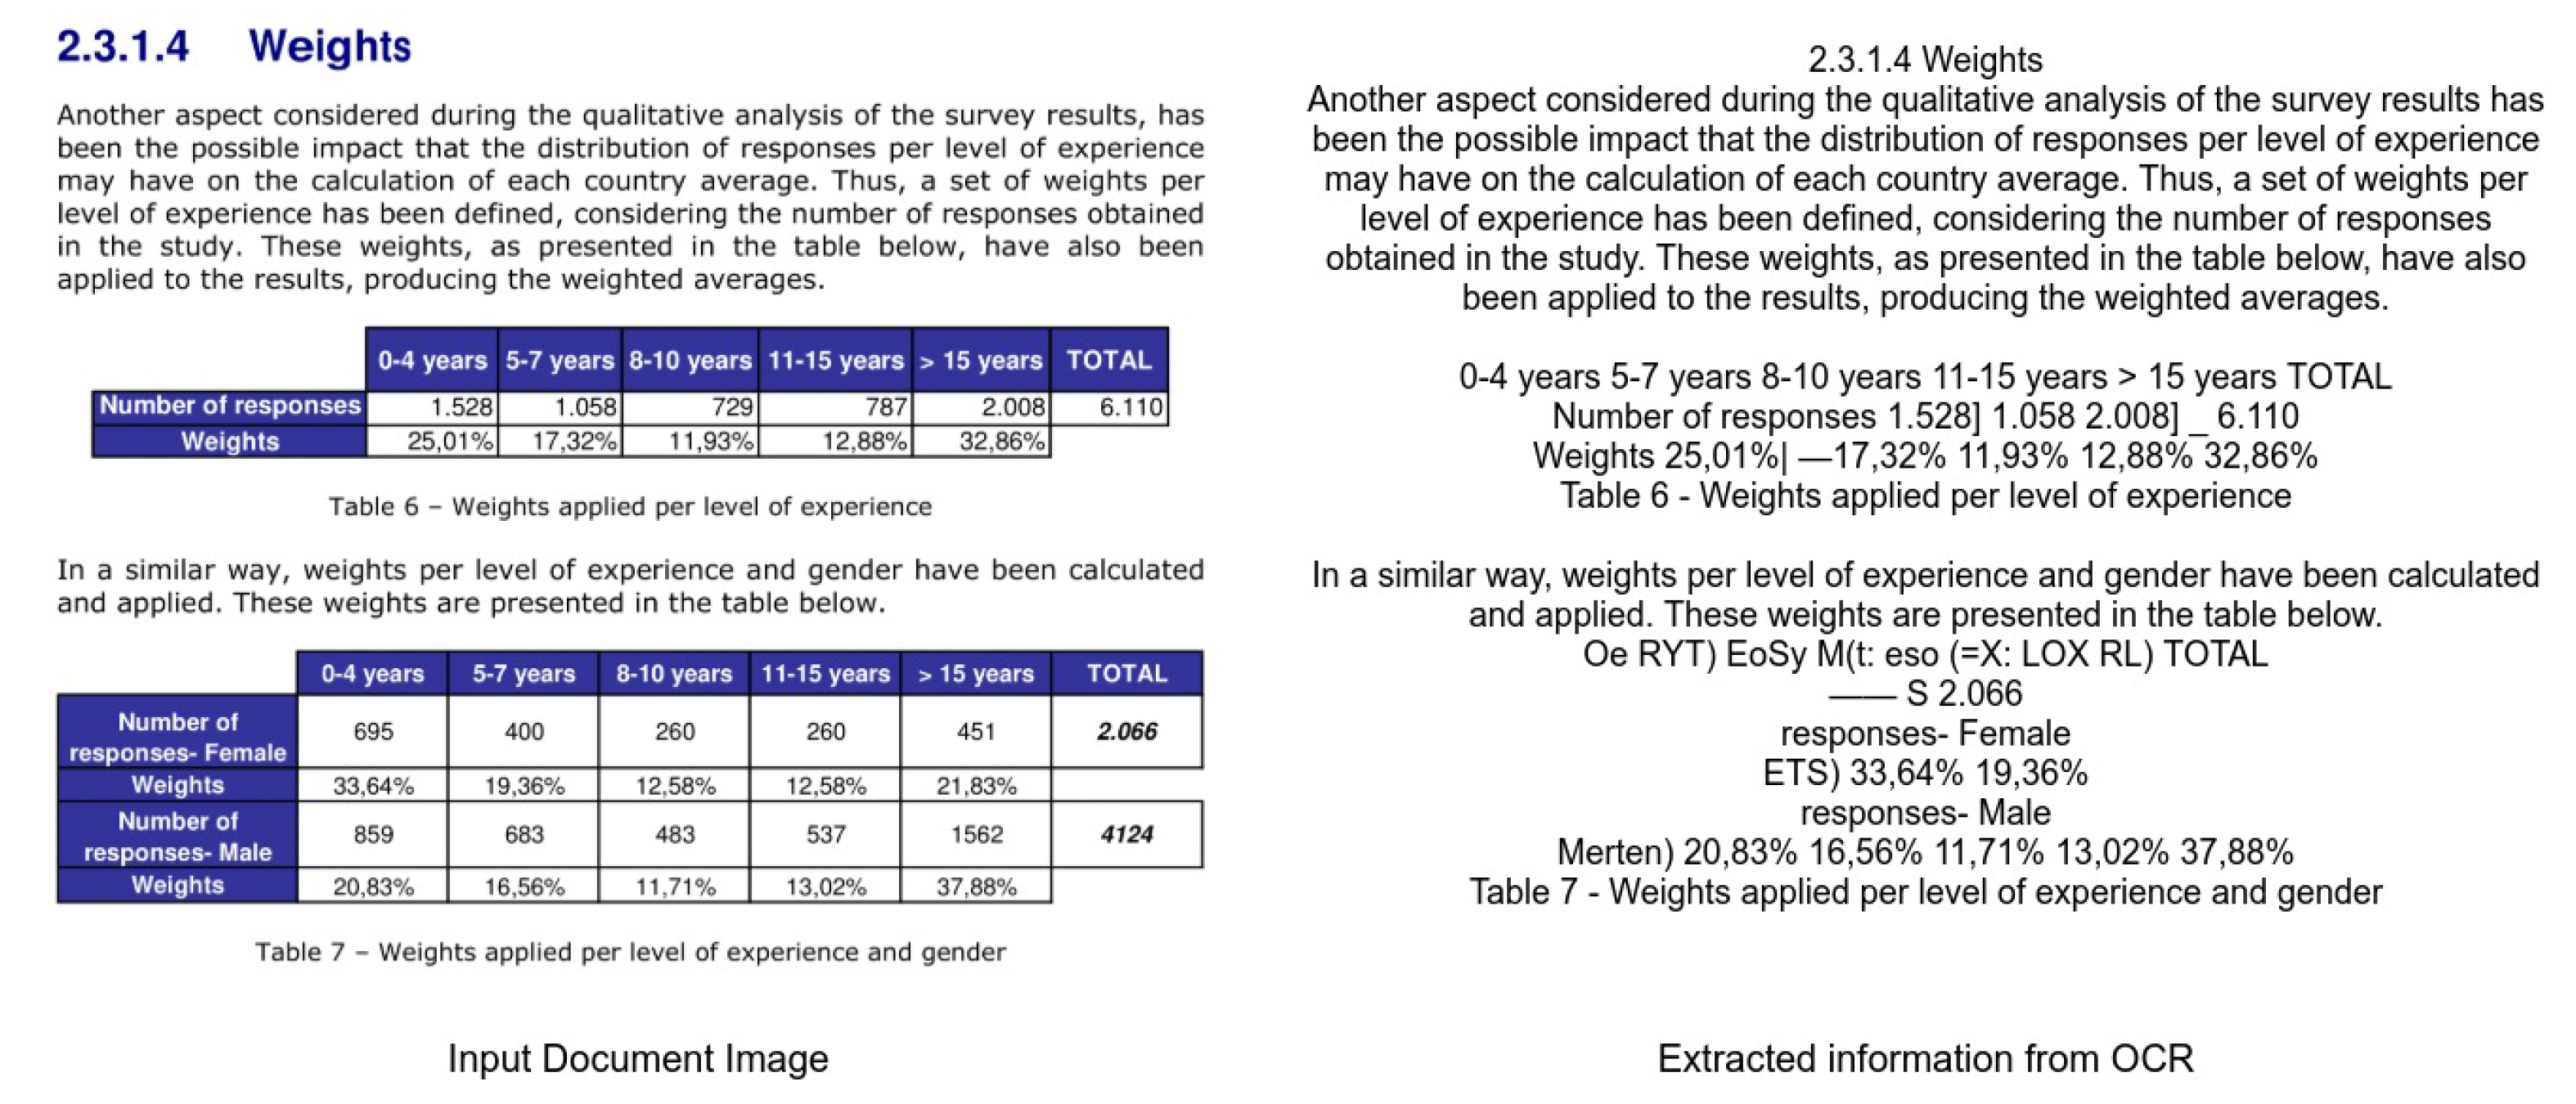
Illustrating the need of applying table detection before extracting information in document images. We apply open source Tesseract-OCR [
10] on a document image containing two tables. Besides the textual content, the OCR system fails miserably in interpreting information from tables.
Figure 1.
Illustrating the need of applying table detection before extracting information in document images. We apply open source Tesseract-OCR [
10] on a document image containing two tables. Besides the textual content, the OCR system fails miserably in interpreting information from tables.
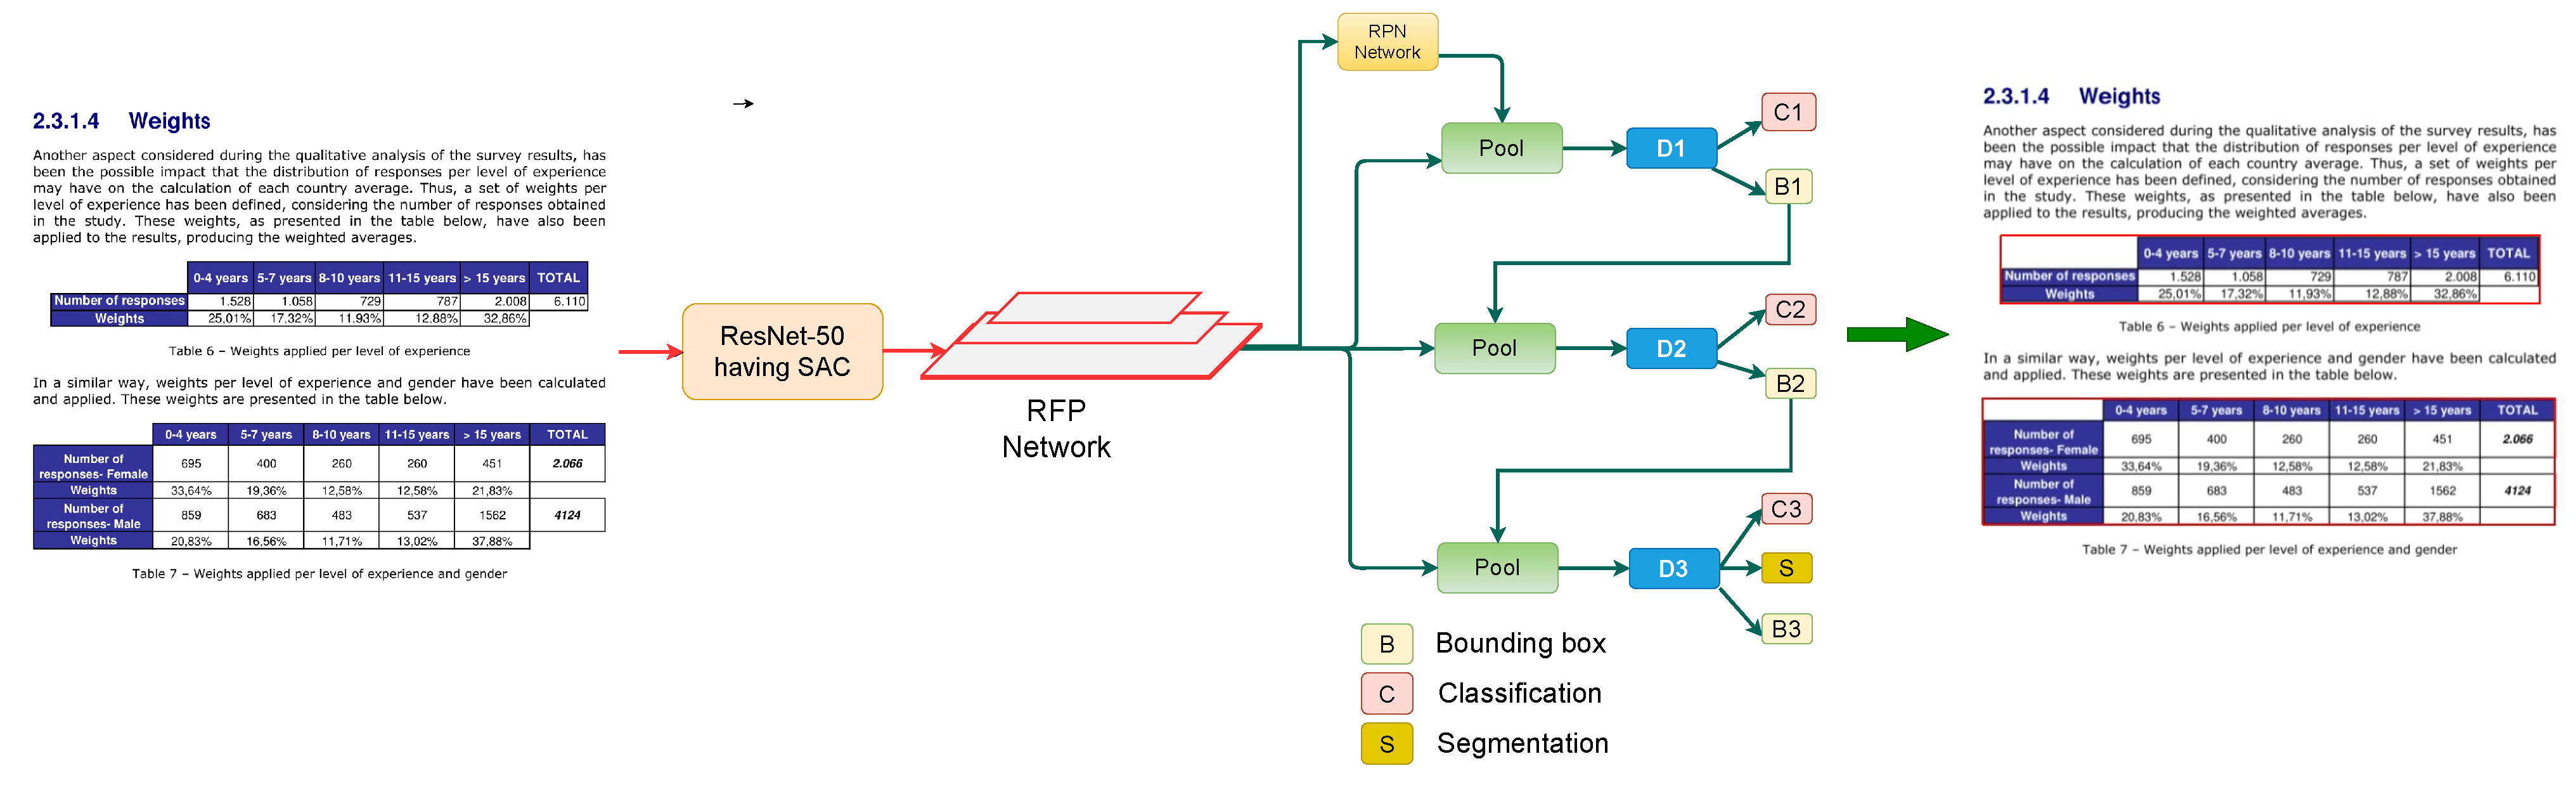
Figure 2.
Presented table detection framework consisting of Cascade Mask R-CNN, incorporating RFP and SAC in backbone network (ResNet-50). The modules RFP and SAC are illustrated in separate figures.
Figure 2.
Presented table detection framework consisting of Cascade Mask R-CNN, incorporating RFP and SAC in backbone network (ResNet-50). The modules RFP and SAC are illustrated in separate figures.
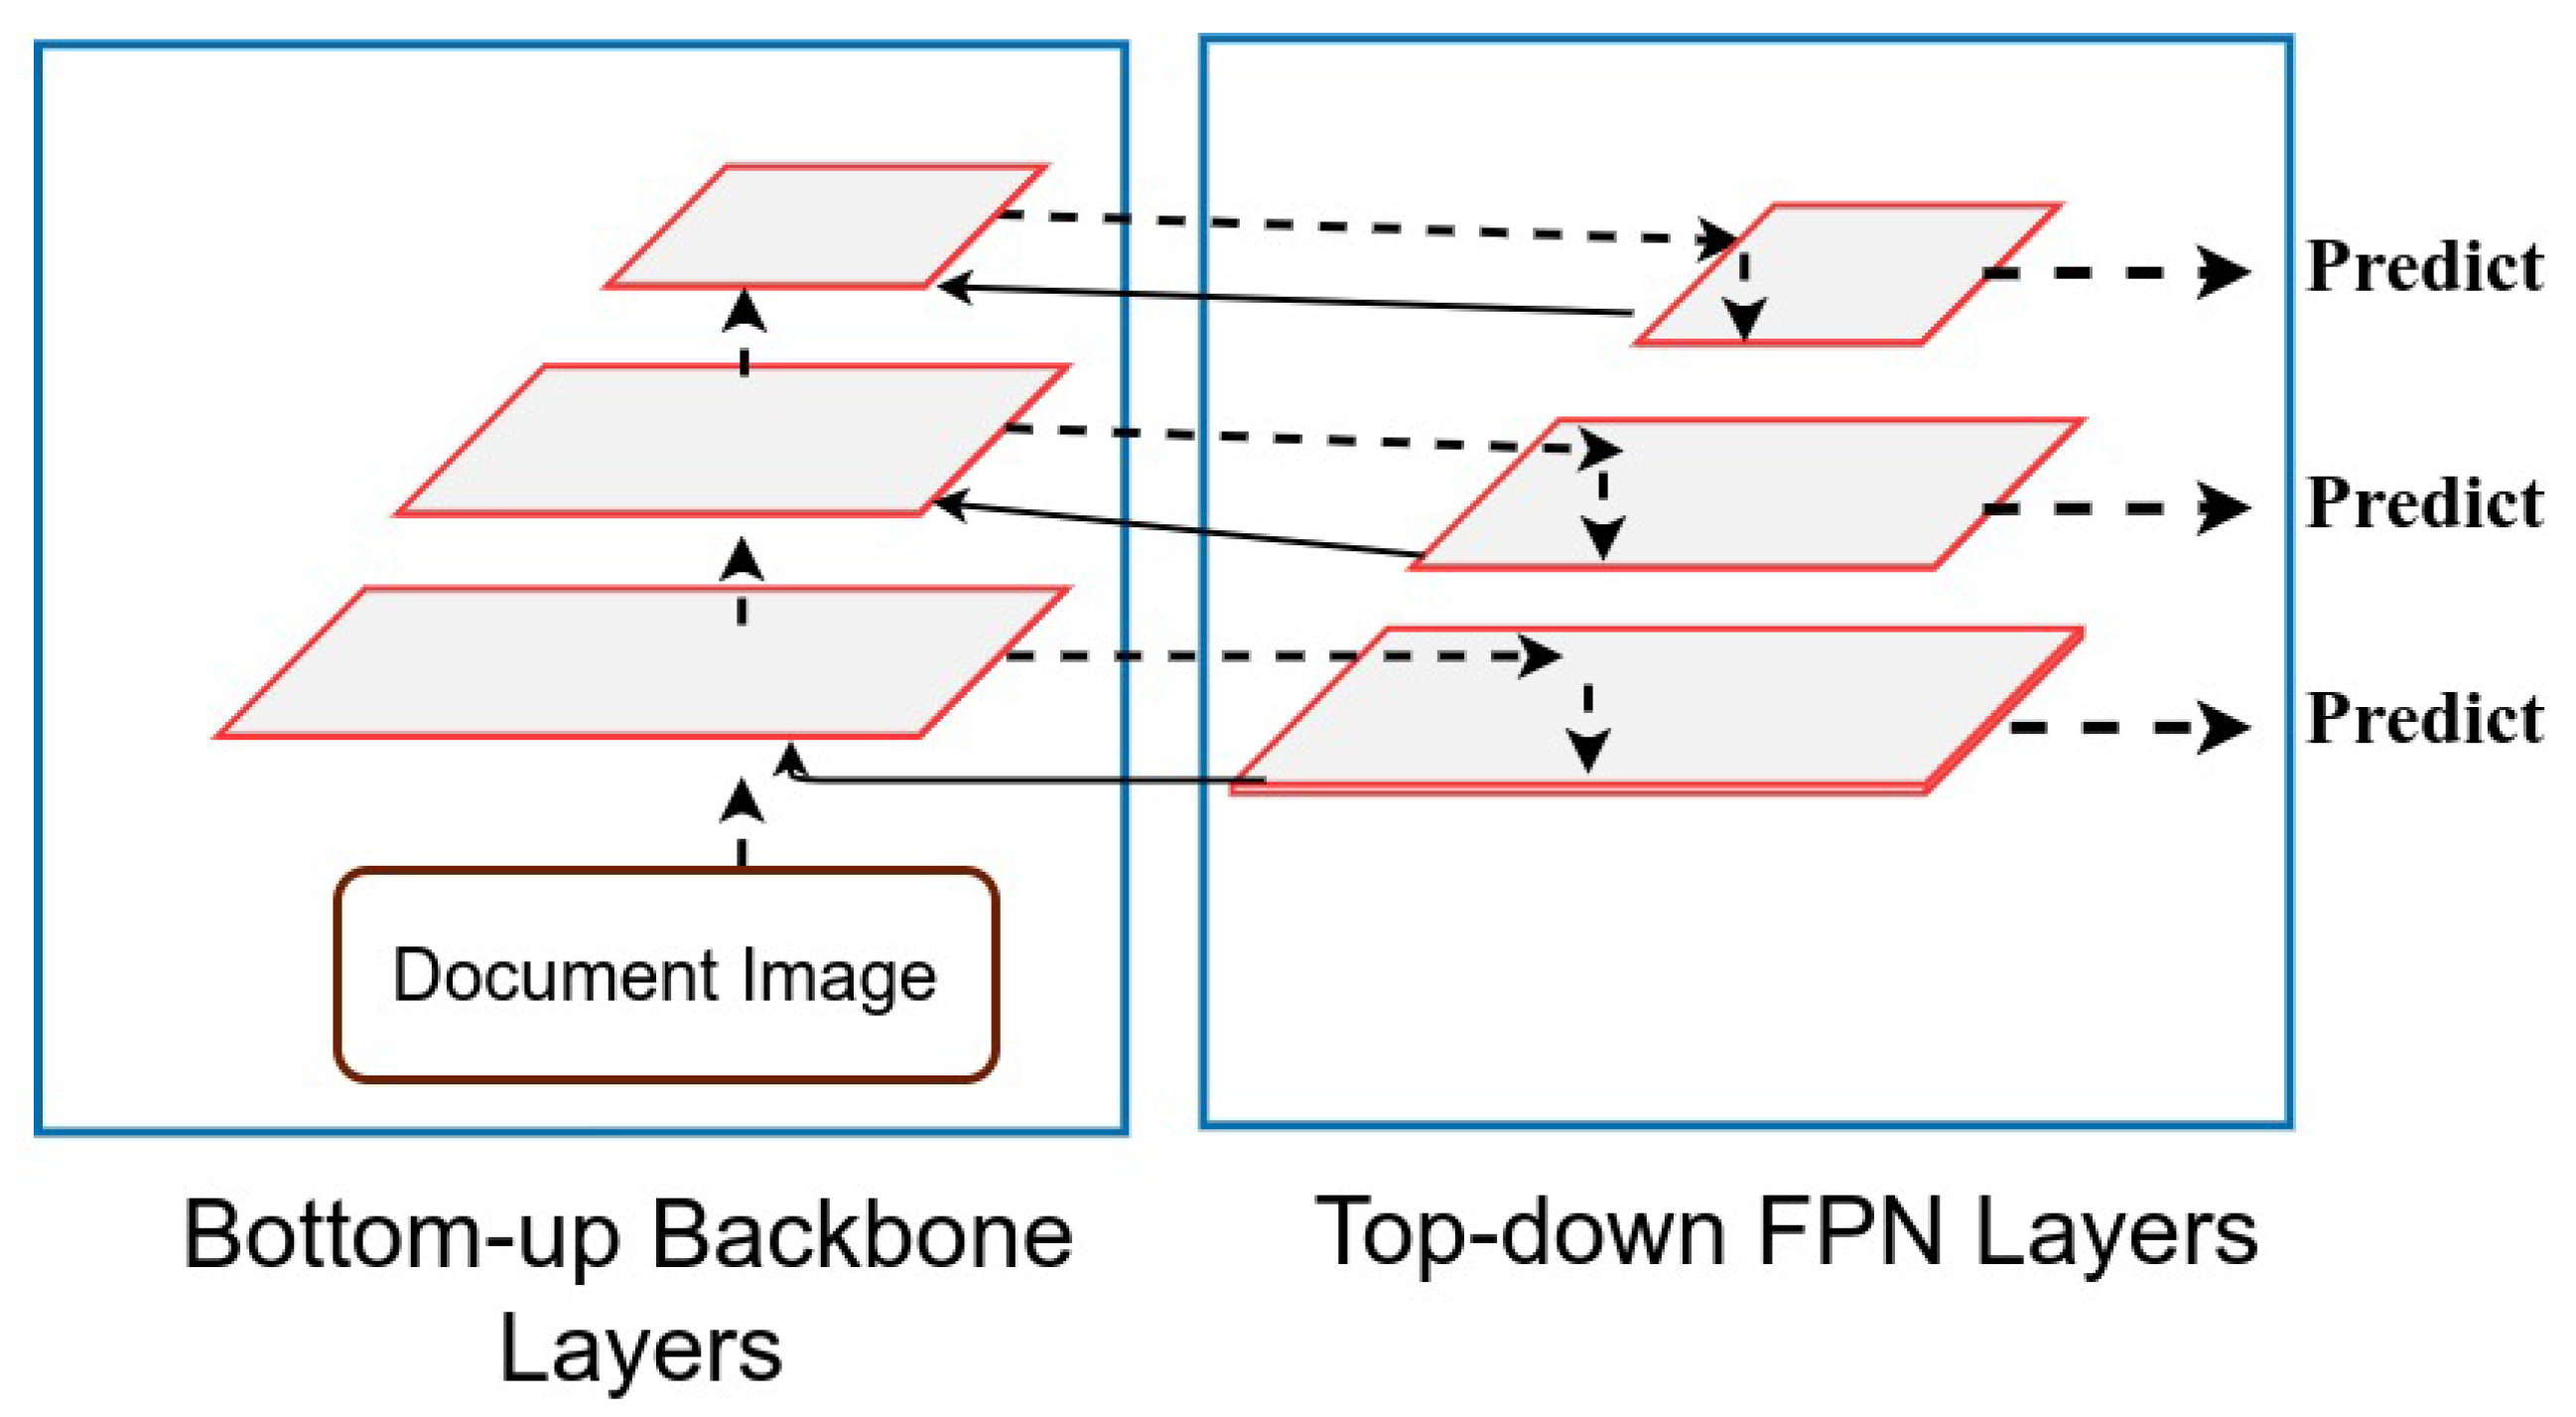
Figure 3.
Illustrating design of Recursive Feature Pyramid module. The Recursive Feature Pyramid includes feedback connections that are highlighted with solidines. The top-down FPNayers send the feedback to the bottom-up backboneayers by inspecting the image twice.
Figure 3.
Illustrating design of Recursive Feature Pyramid module. The Recursive Feature Pyramid includes feedback connections that are highlighted with solidines. The top-down FPNayers send the feedback to the bottom-up backboneayers by inspecting the image twice.
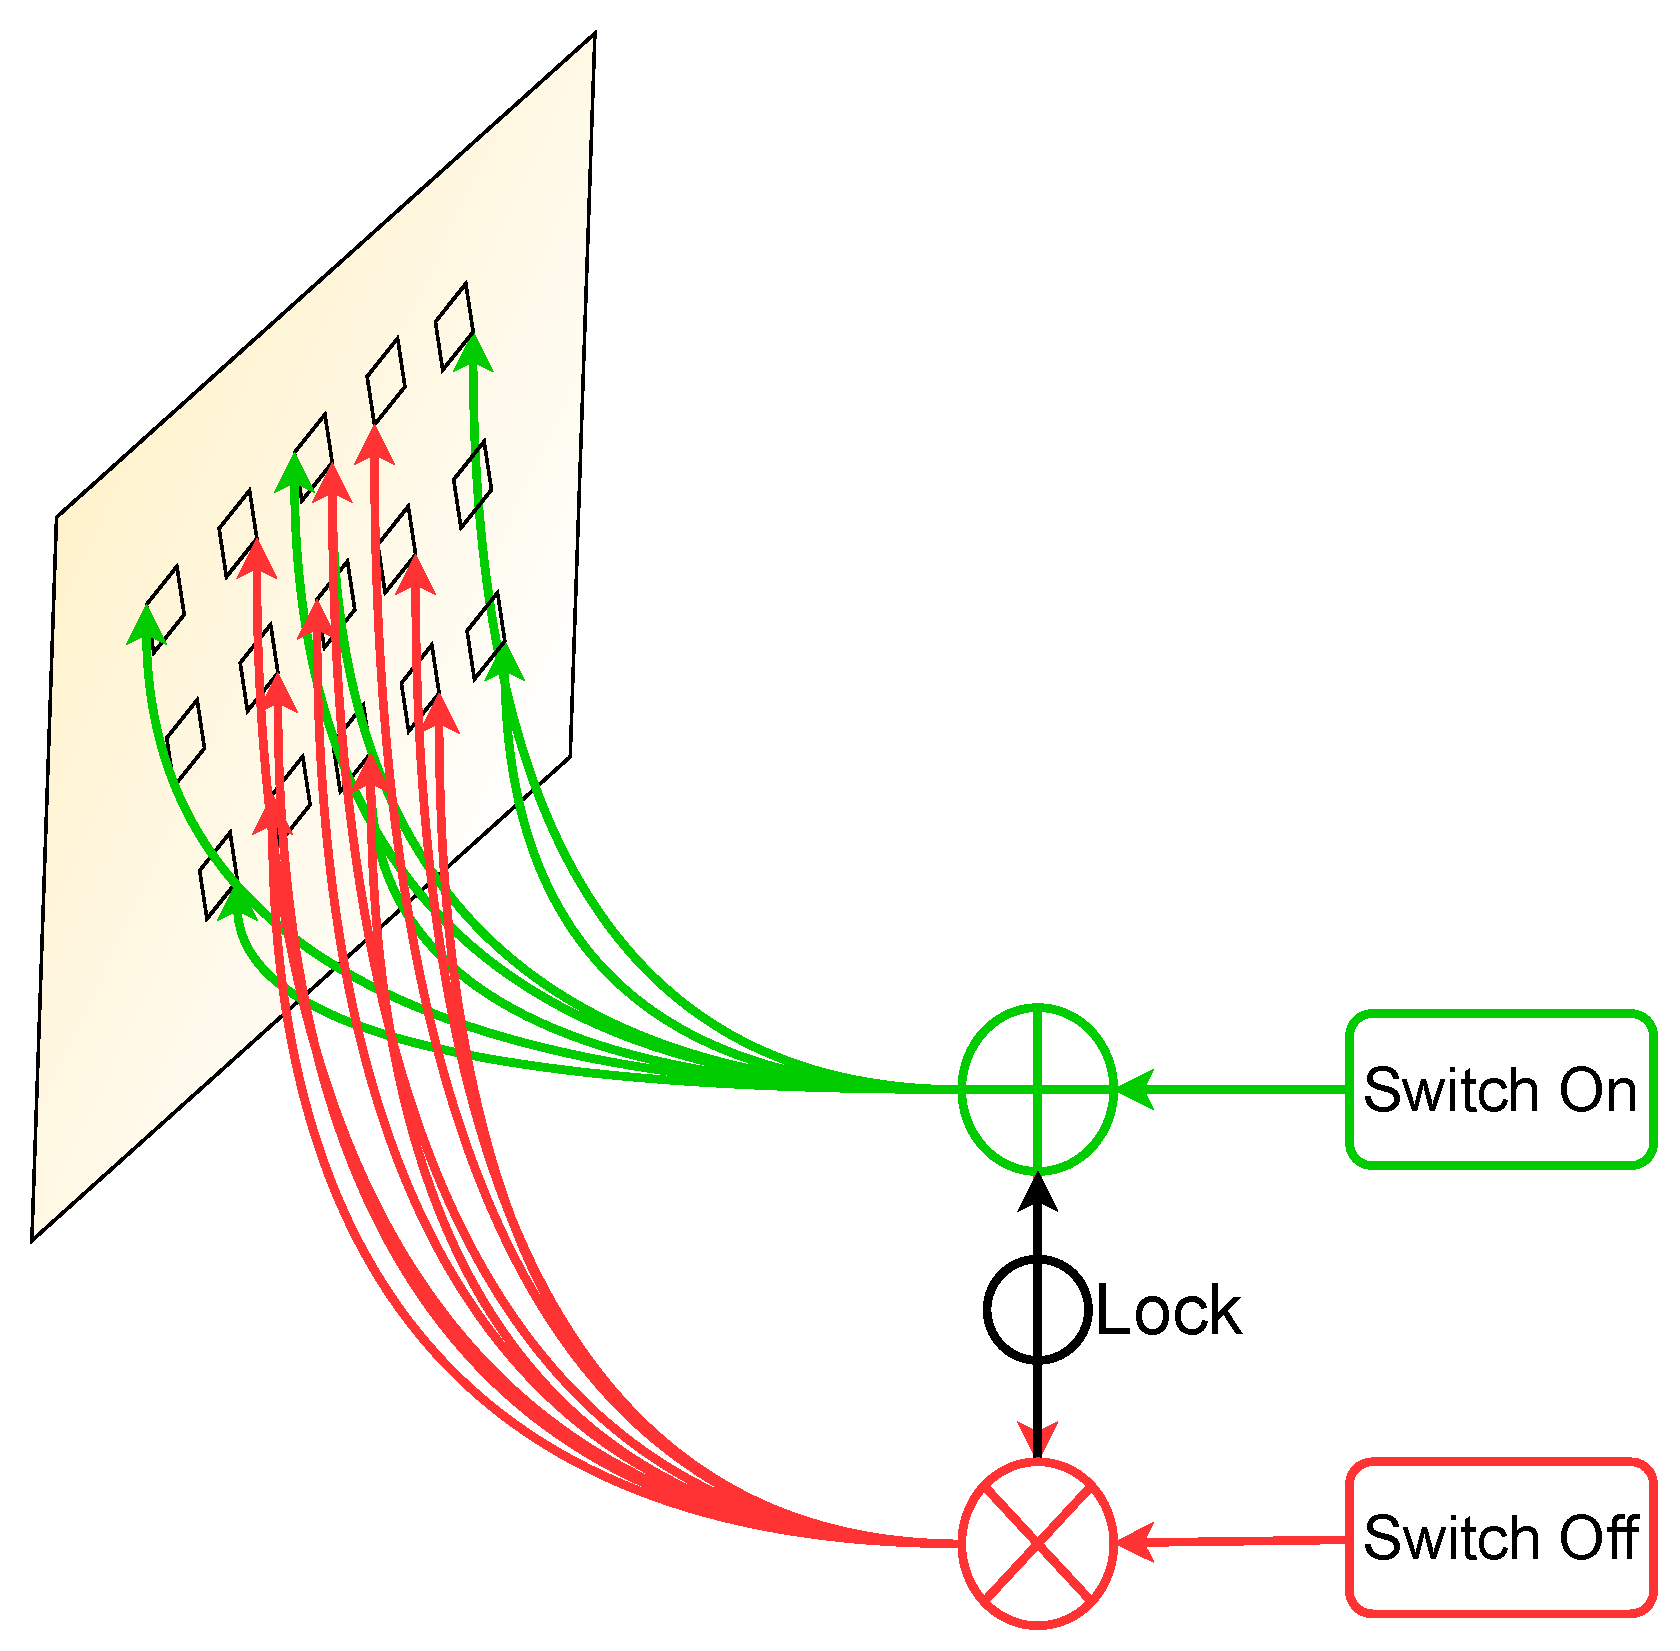
Figure 4.
Illustrating Switchable Atrous Convolution. The red symbol ⨂ depicts atrous convolutions with an atrous rate set to 1, whereas the green symbol ⨁ denotes an atrous rate of 2 in a 3 × 3 convolutionalayer.
Figure 4.
Illustrating Switchable Atrous Convolution. The red symbol ⨂ depicts atrous convolutions with an atrous rate set to 1, whereas the green symbol ⨁ denotes an atrous rate of 2 in a 3 × 3 convolutionalayer.
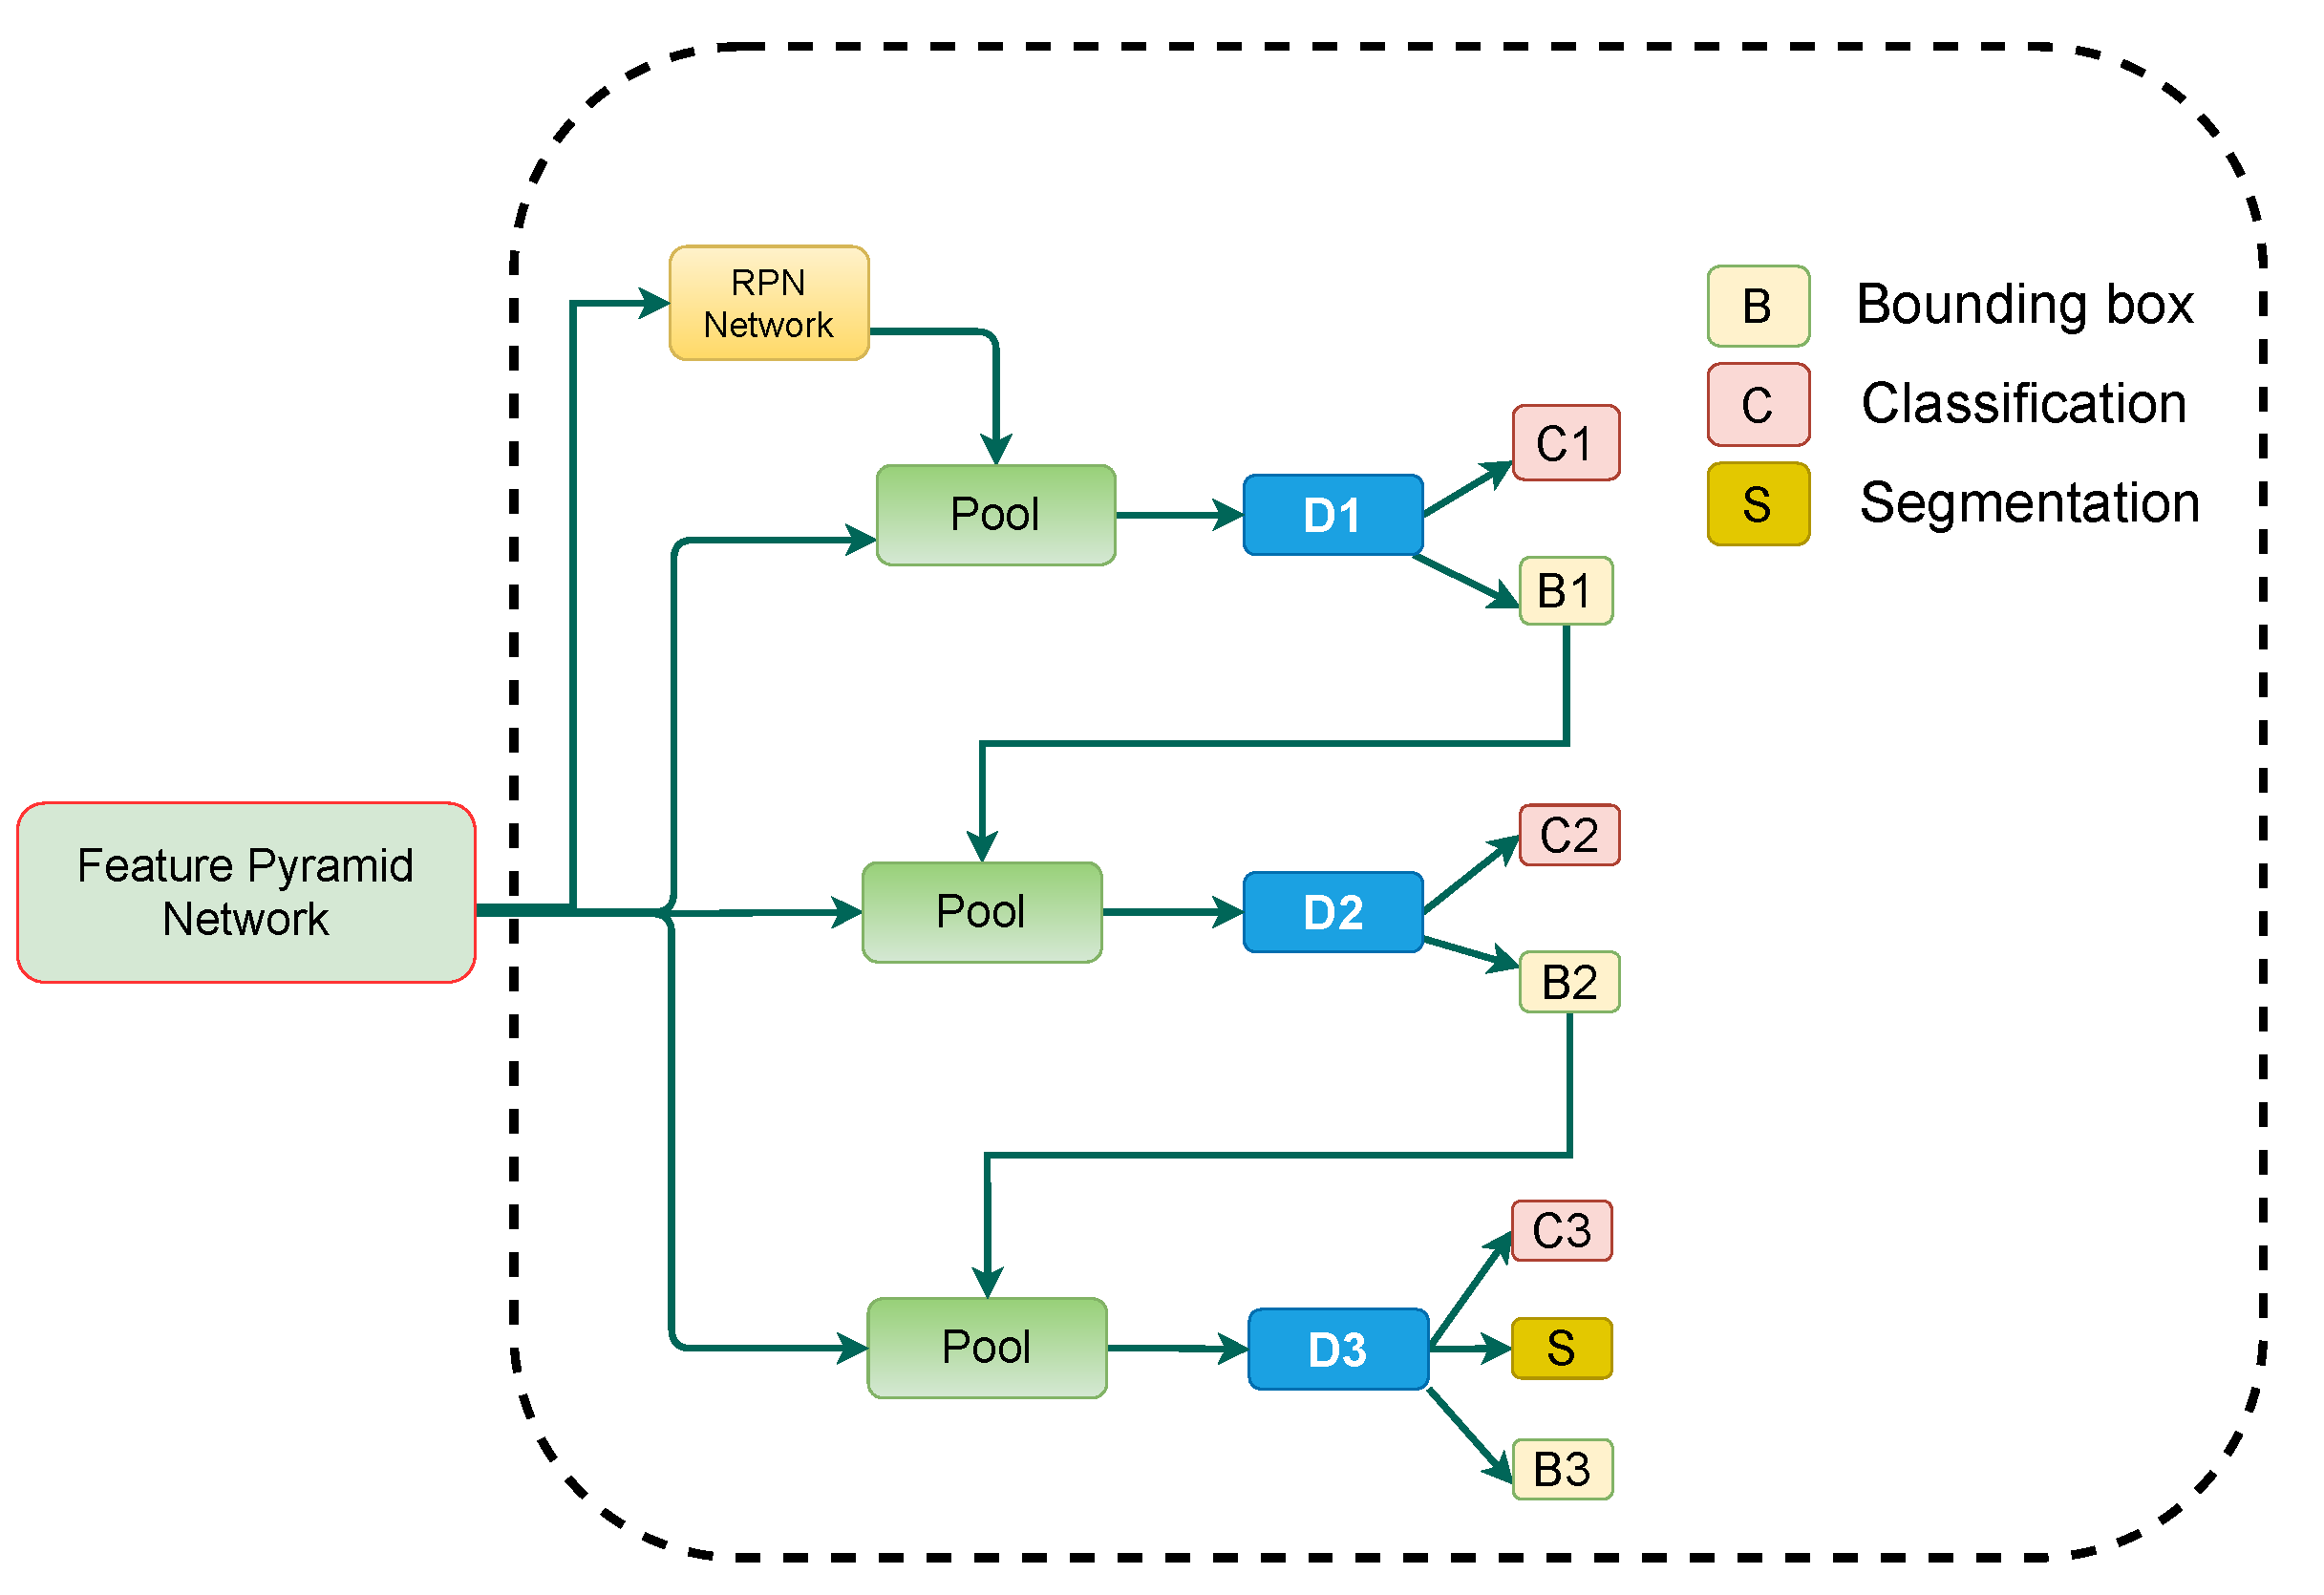
Figure 5.
Explained architecture of Cascade Mask R-CNN module employed in the proposed pipeline. The dotted boundary outlines the two-stage detection phase of Cascade Mask R-CNN.
Figure 5.
Explained architecture of Cascade Mask R-CNN module employed in the proposed pipeline. The dotted boundary outlines the two-stage detection phase of Cascade Mask R-CNN.
Figure 6.
Sample document images from the ICDAR-17 POD dataset [
1]. The red boundary represents the tabular area in document images.
Figure 6.
Sample document images from the ICDAR-17 POD dataset [
1]. The red boundary represents the tabular area in document images.
Figure 7.
Sample document images from the ICDAR 19 Track A (Modern) dataset [
65]. The red boundary highlights the tabular area in document images.
Figure 7.
Sample document images from the ICDAR 19 Track A (Modern) dataset [
65]. The red boundary highlights the tabular area in document images.
Figure 8.
Sample document images from the TableBank dataset [
66]. The red boundary outlines the tabular area in document images.
Figure 8.
Sample document images from the TableBank dataset [
66]. The red boundary outlines the tabular area in document images.
Figure 9.
Sample document images from the UNLV dataset [
67]. The red boundary marks the tabular area in document images.
Figure 9.
Sample document images from the UNLV dataset [
67]. The red boundary marks the tabular area in document images.
Figure 10.
Sample document images from the Marmot dataset [
68]. The red boundary denotes the tabular area in document images.
Figure 10.
Sample document images from the Marmot dataset [
68]. The red boundary denotes the tabular area in document images.
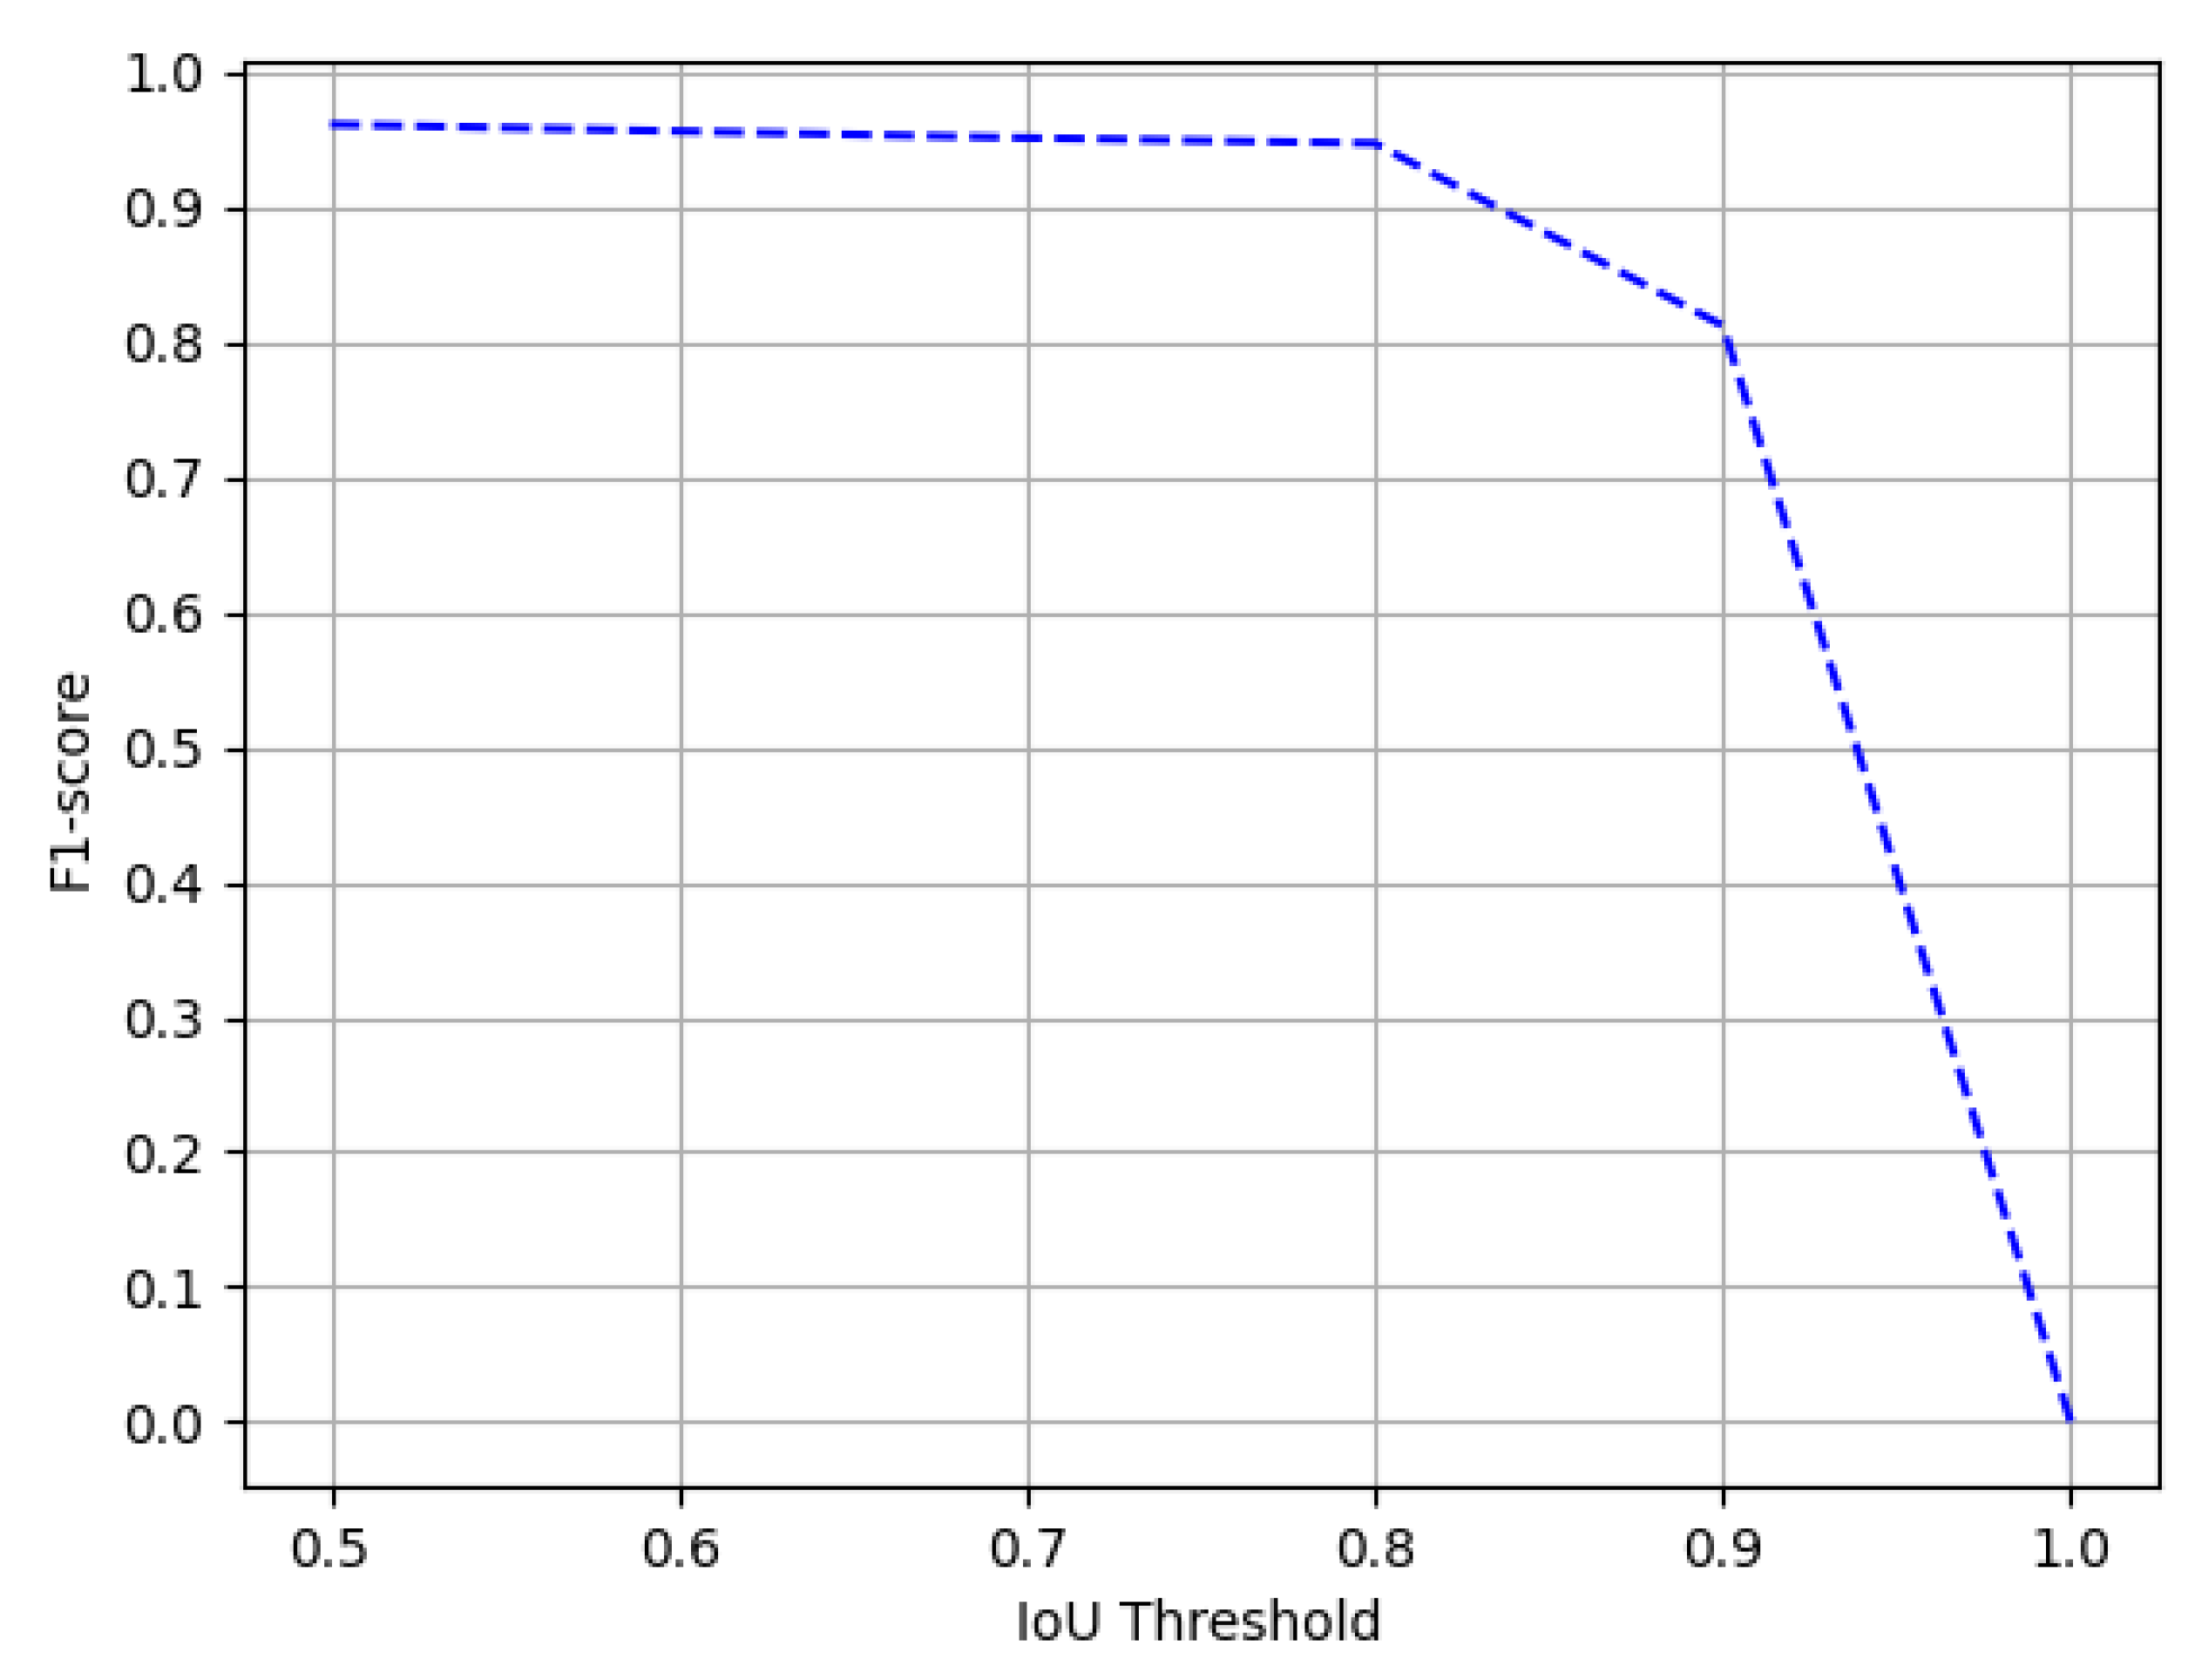
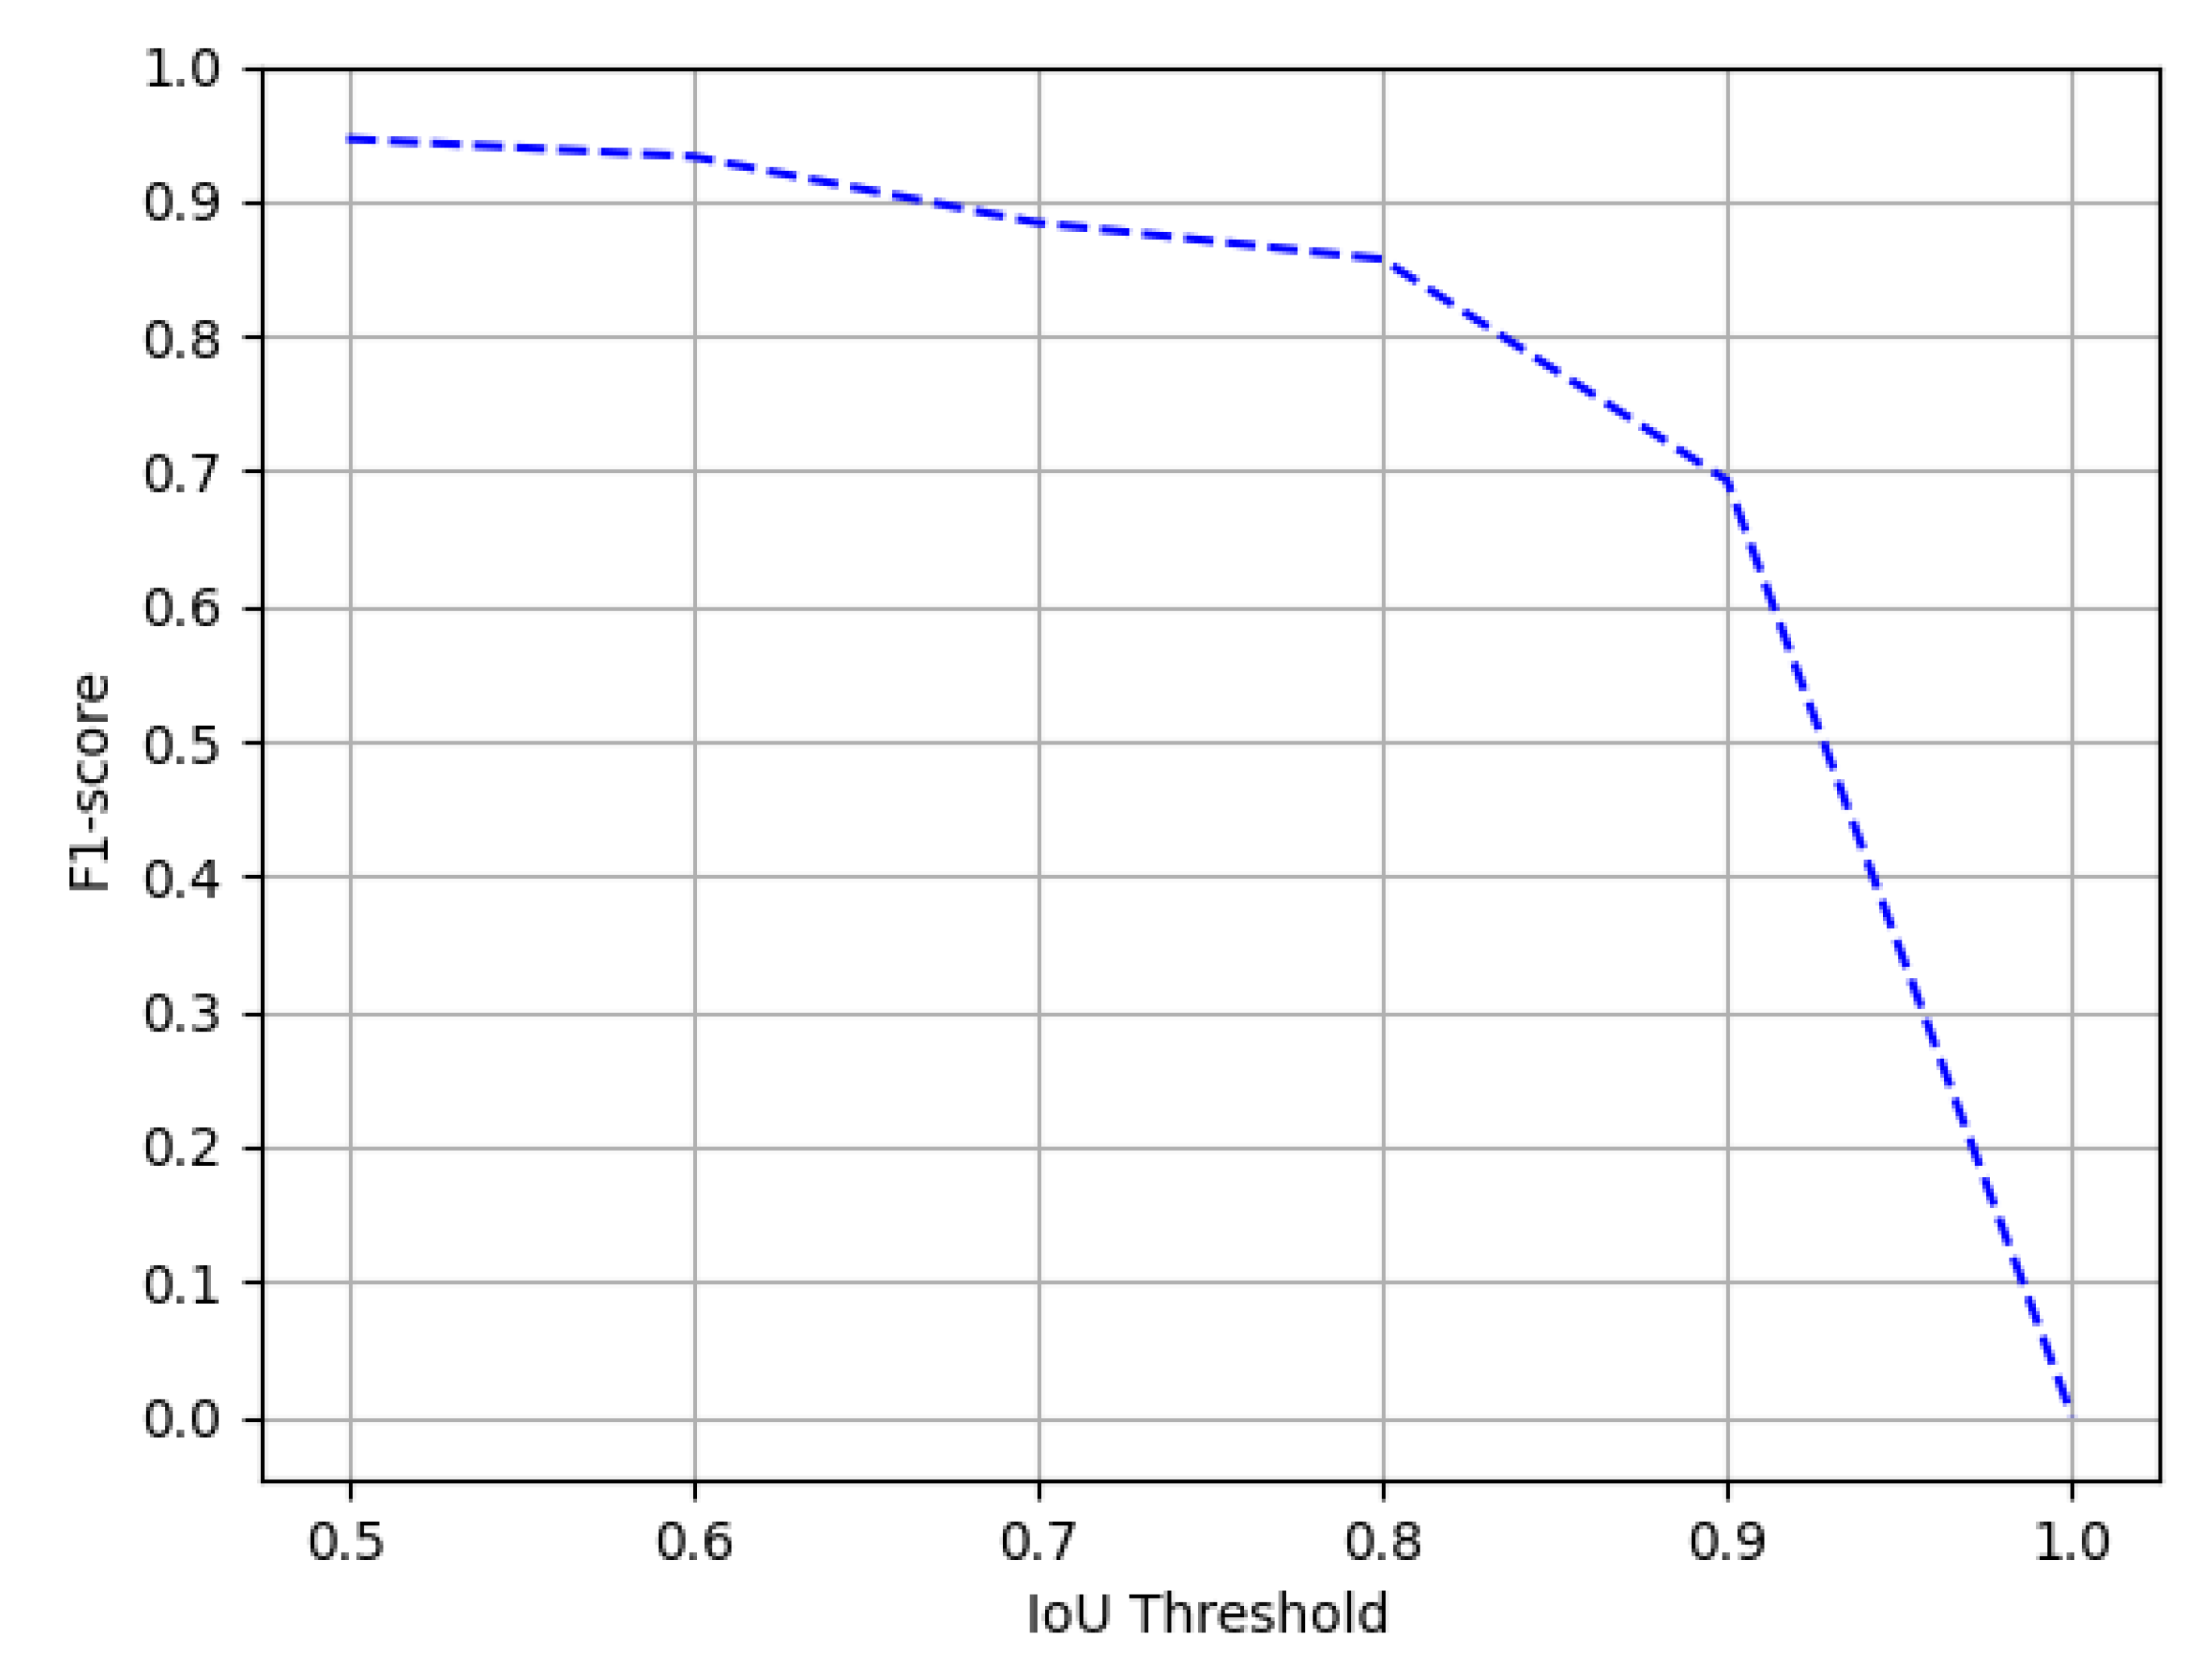
Figure 11.
Performance evaluation of our CasTabDetectoRS in terms of F1-score over the varying IoU thresholds ranging from 0.5 to 1.0 on the ICDAR-2017-POD table detection dataset.
Figure 11.
Performance evaluation of our CasTabDetectoRS in terms of F1-score over the varying IoU thresholds ranging from 0.5 to 1.0 on the ICDAR-2017-POD table detection dataset.
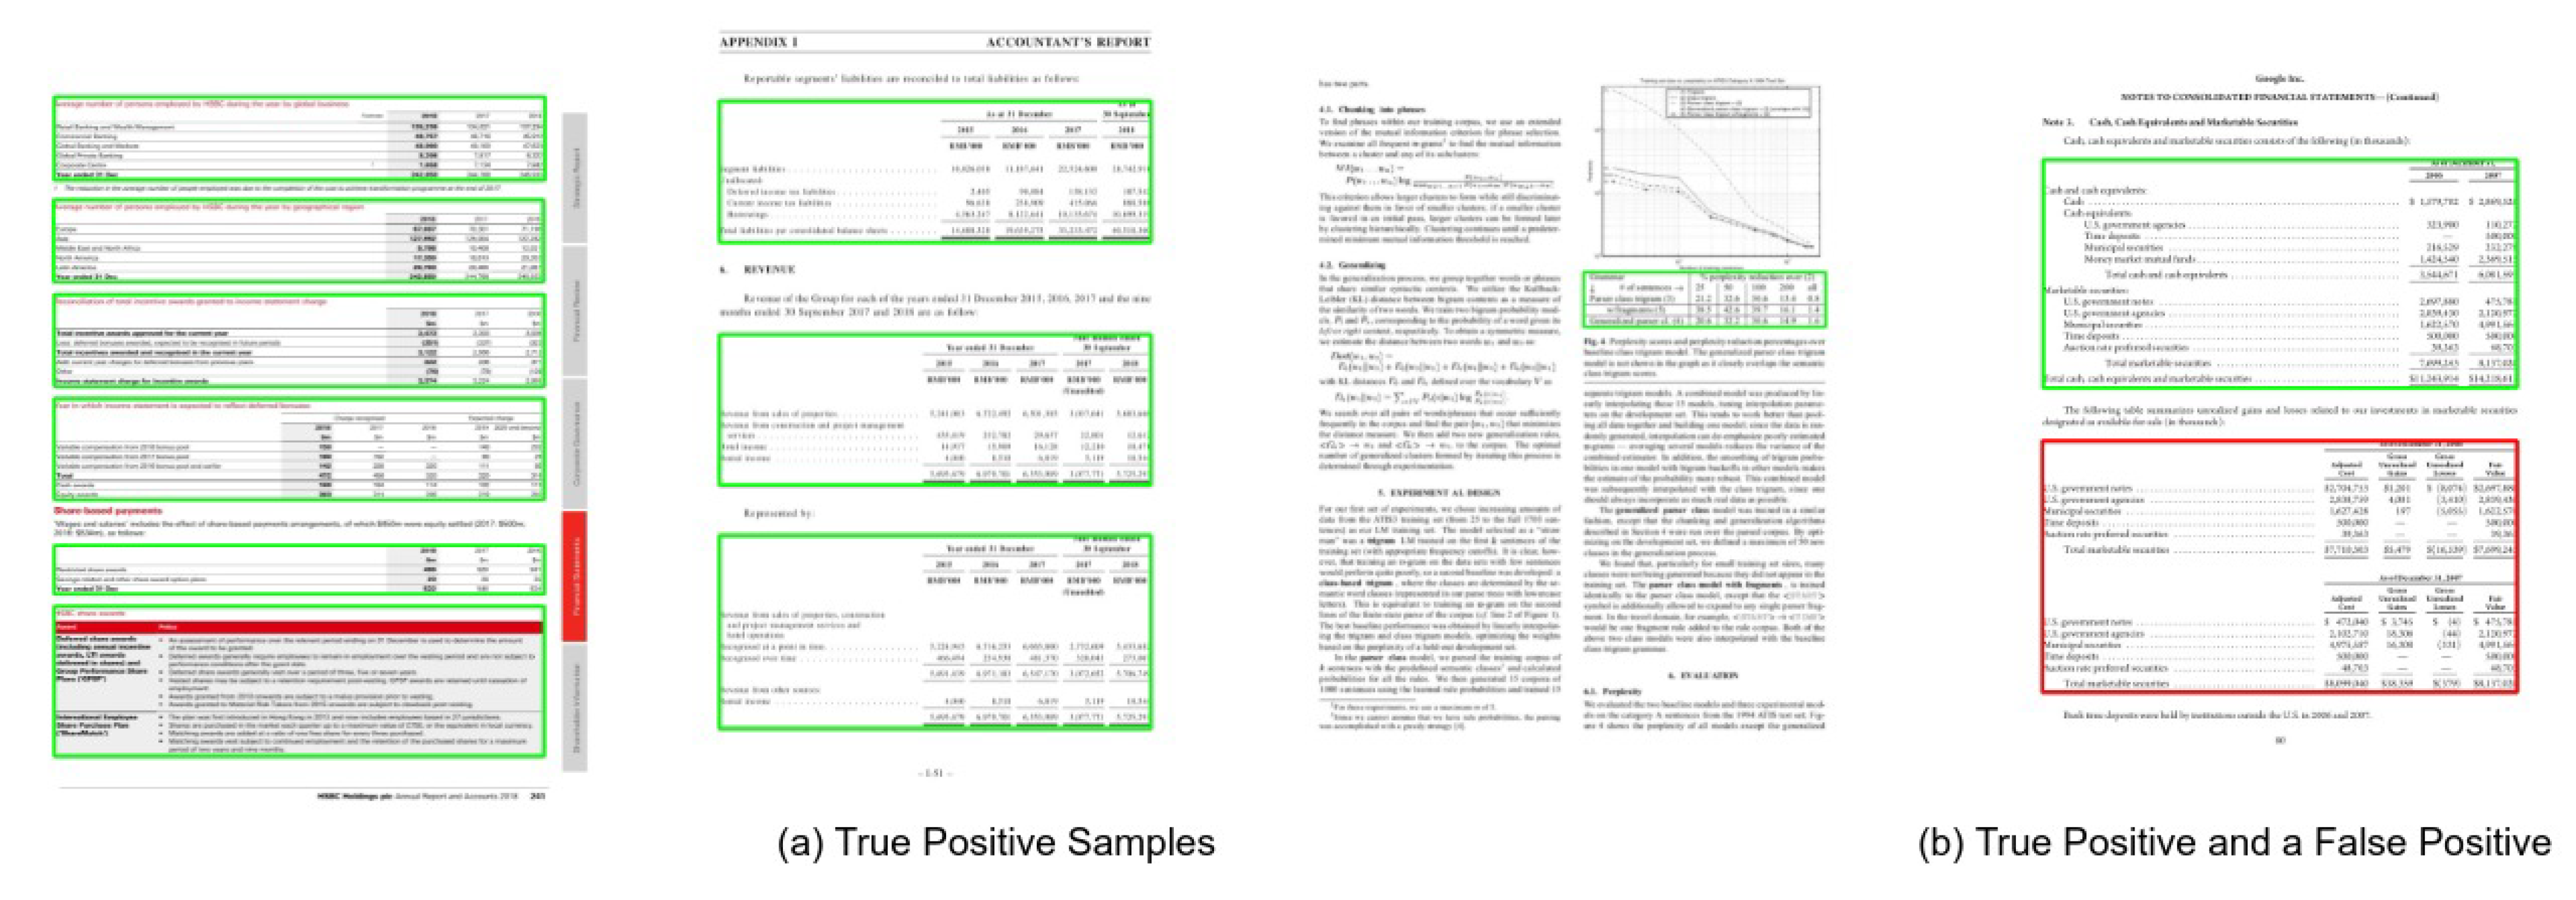
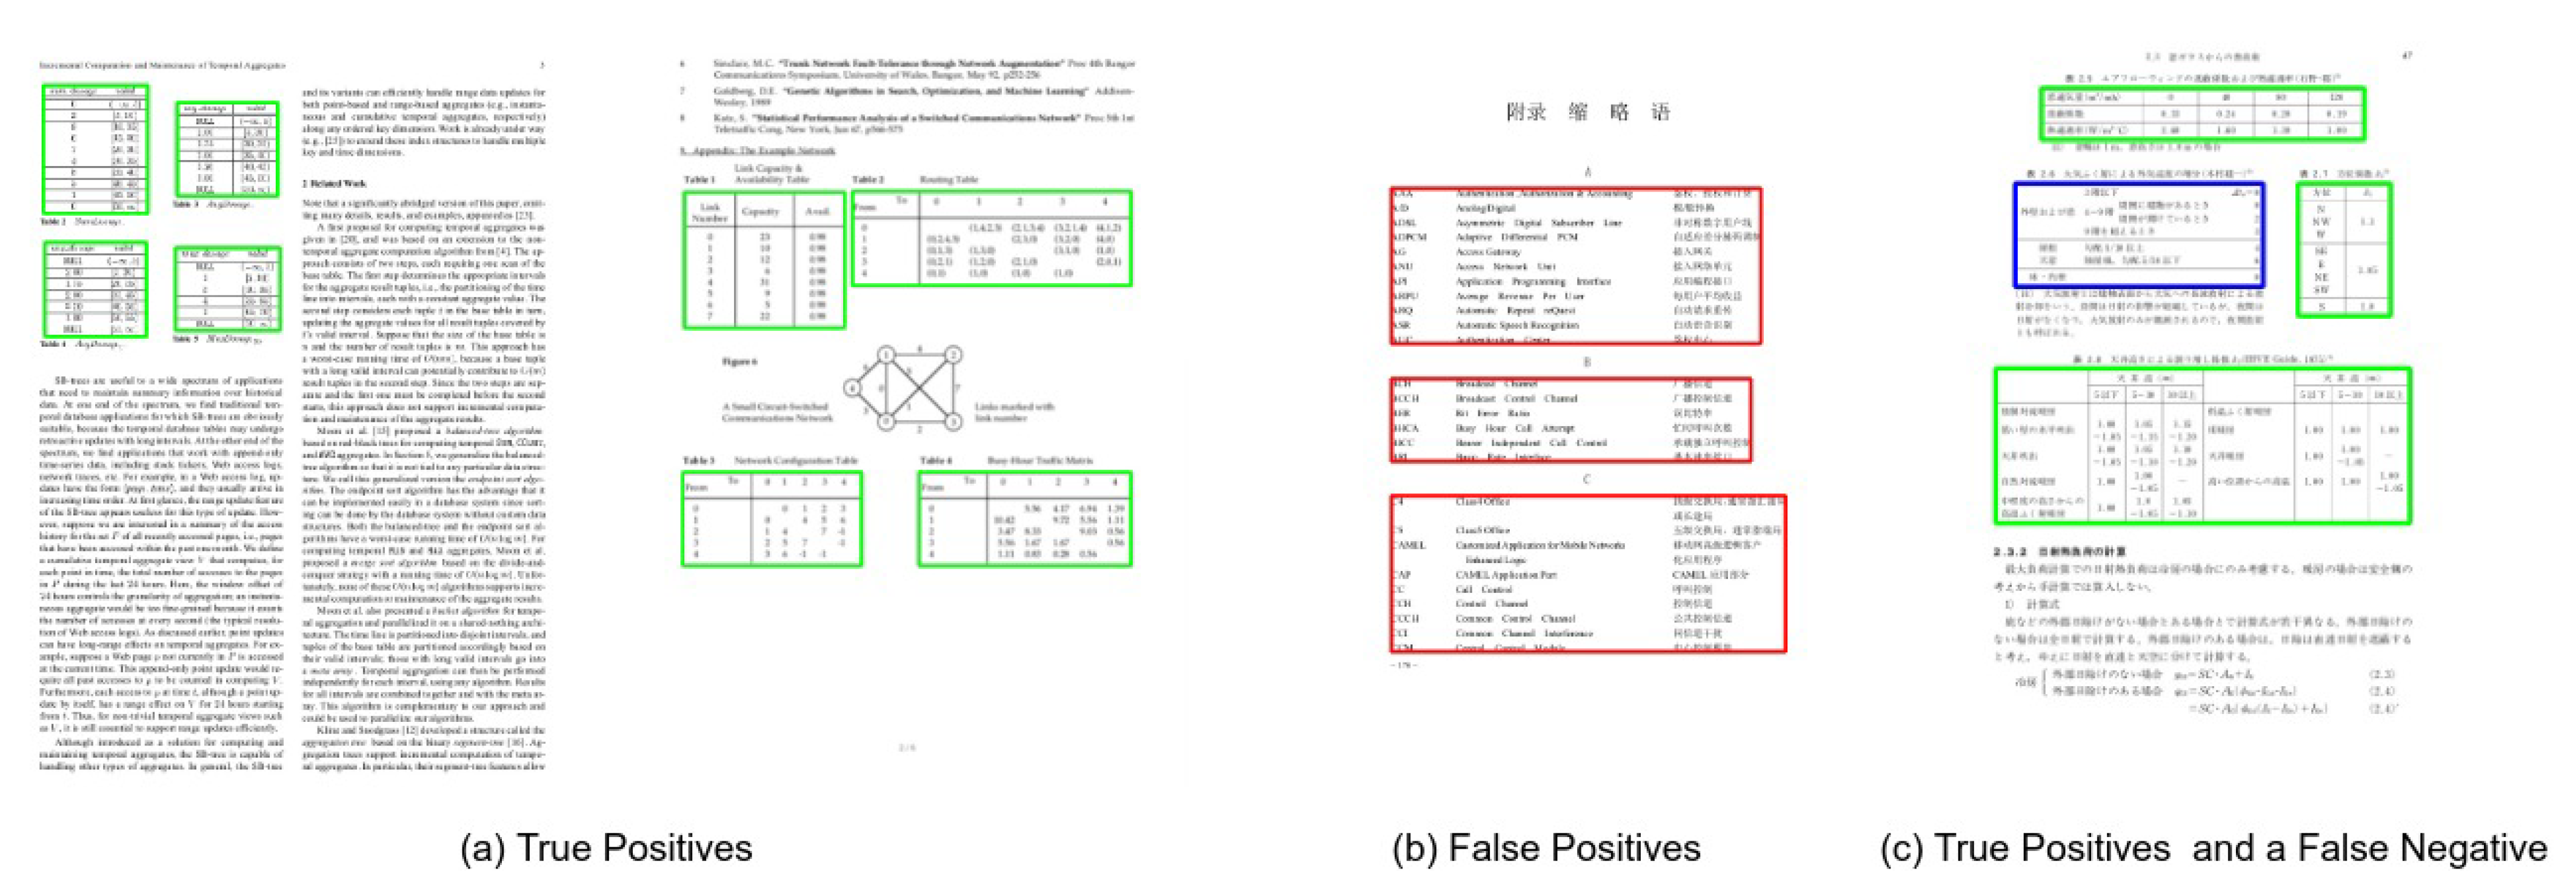
Figure 12.
CasTabDetectoRS results on the ICDAR-2017 POD table detection dataset. Green represents true positive, red denotes false positive, and blue color highlights false negative. In this figure, (a) represents a couple of samples containing true positives, (b) highlights true positive and false positives, and (c) depicts a true positive and a false negative.
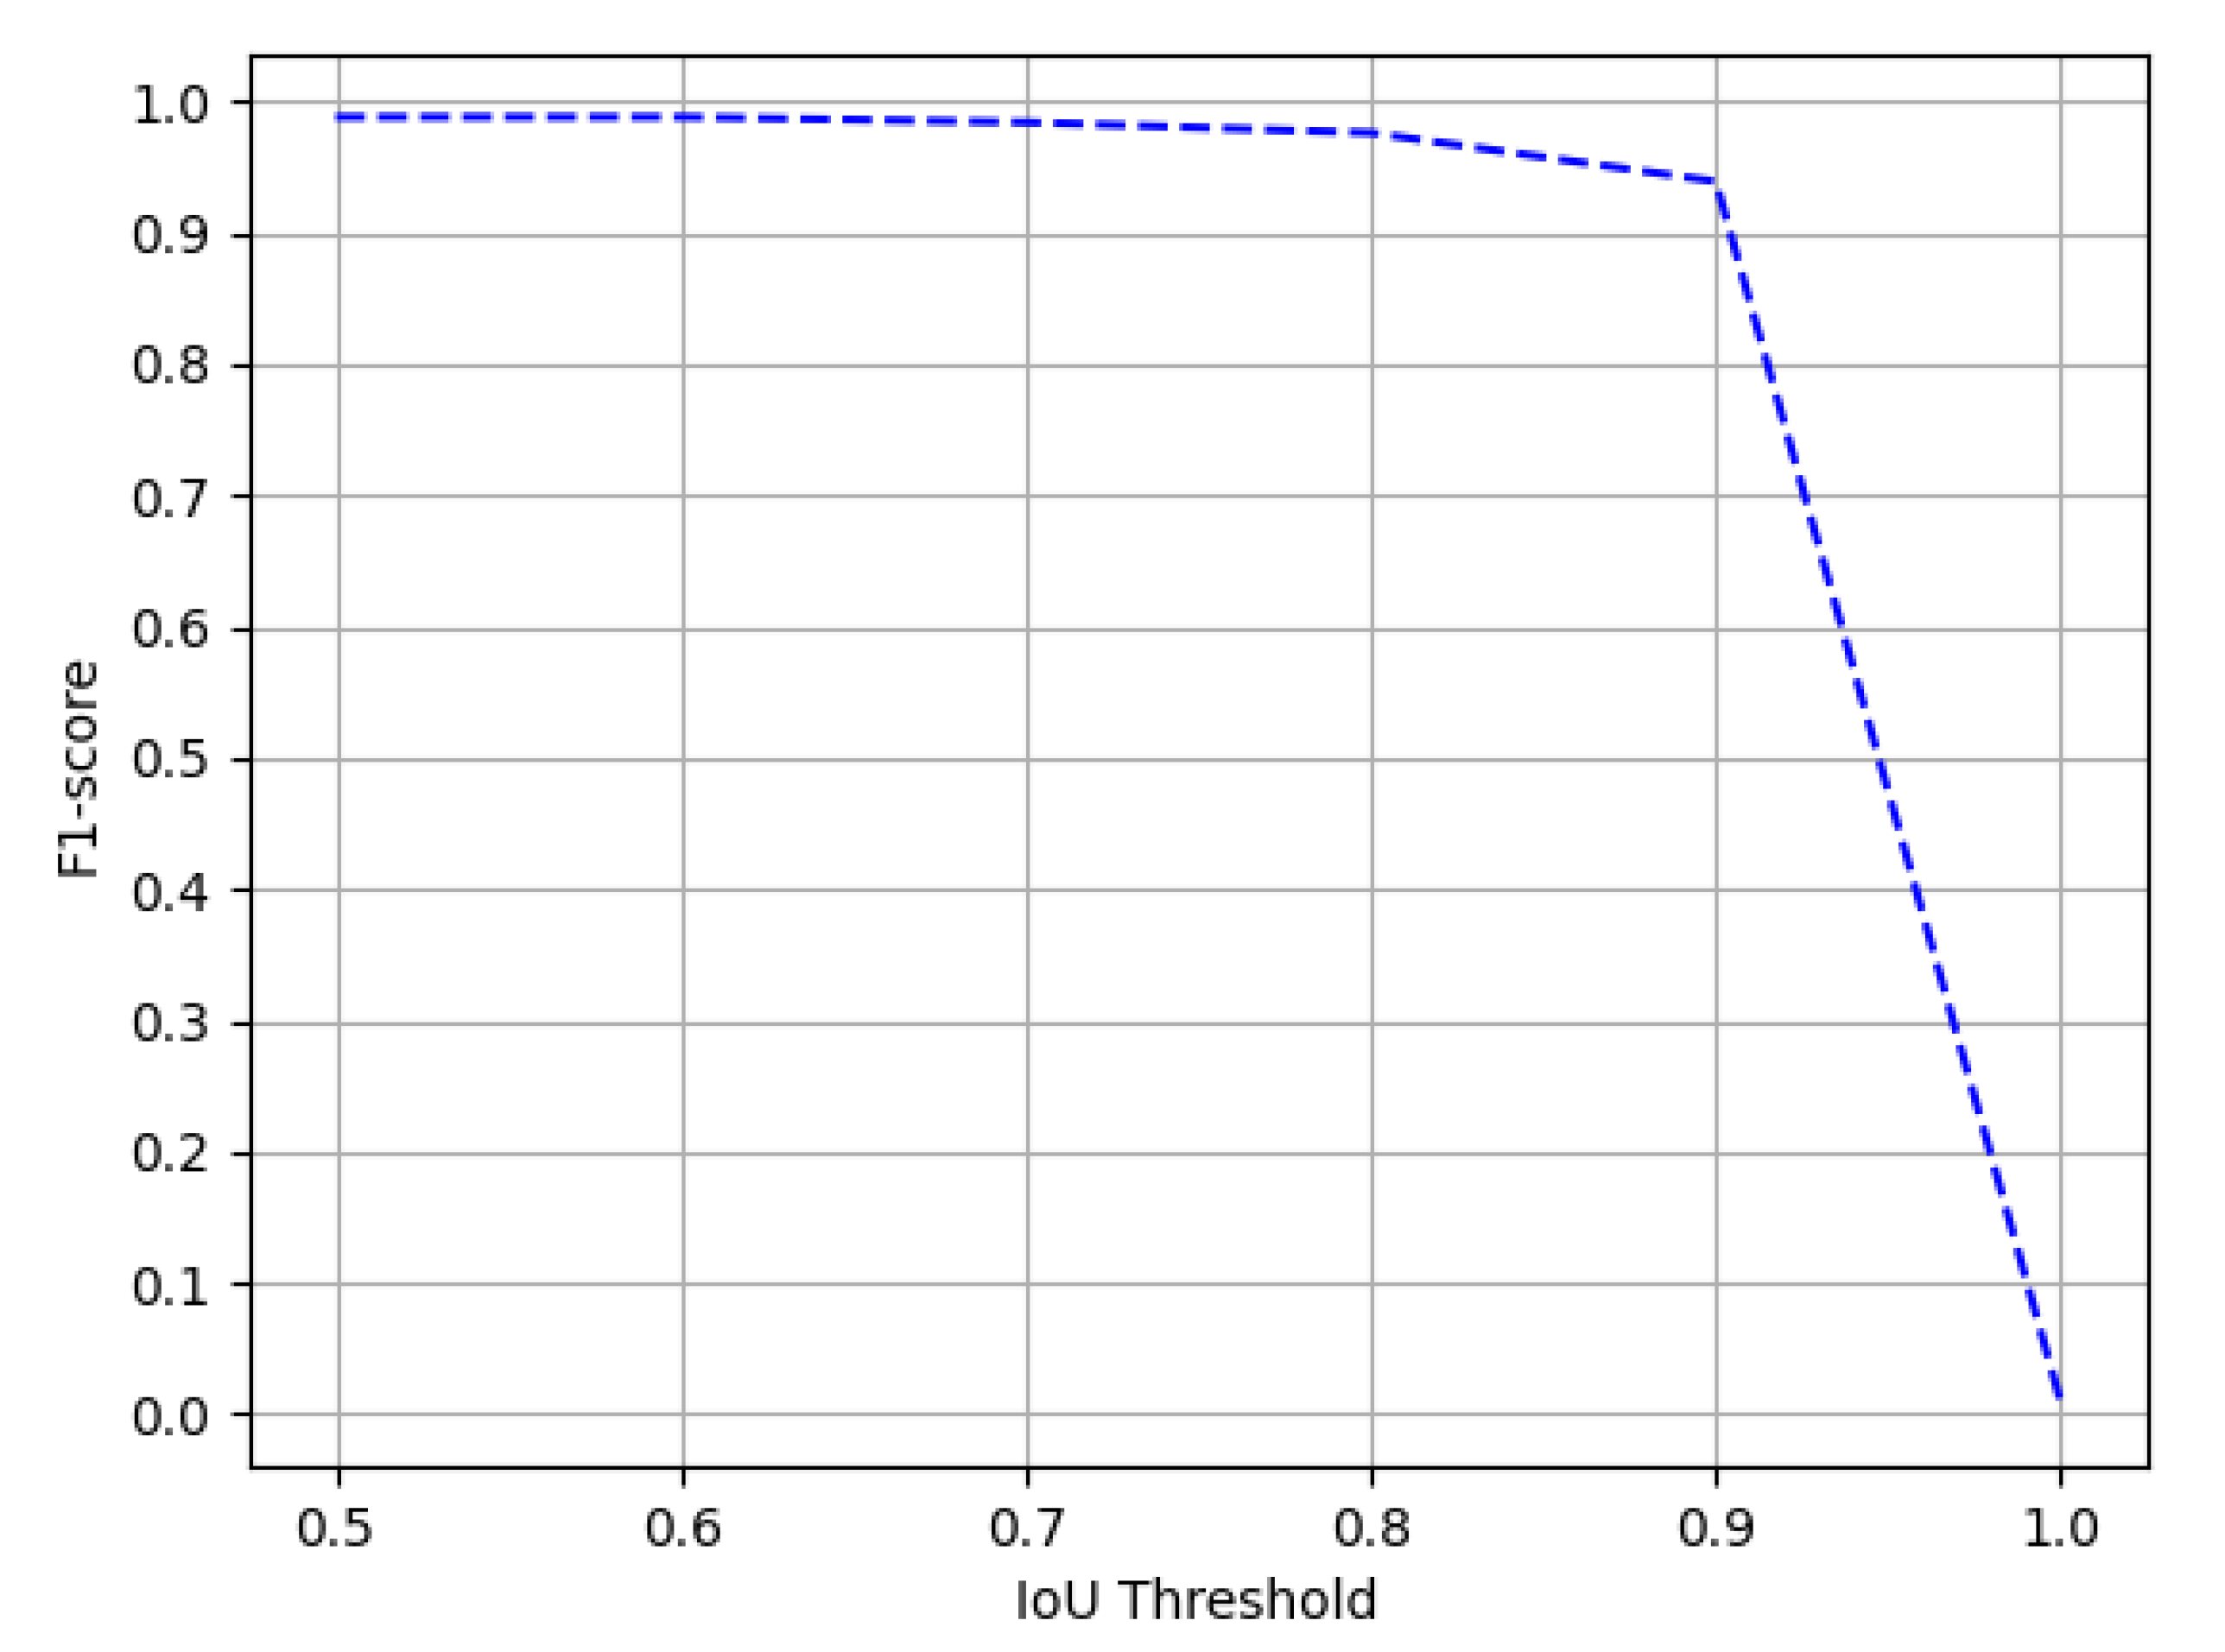
Figure 13.
Performance evaluation of our CasTabDetectoRS in terms of F1-score over the varying IoU thresholds ranging from 0.5 to 1.0 on the ICDAR-2019 Track A (Modern) dataset.
Figure 13.
Performance evaluation of our CasTabDetectoRS in terms of F1-score over the varying IoU thresholds ranging from 0.5 to 1.0 on the ICDAR-2019 Track A (Modern) dataset.
Figure 14.
CasTabDetectoRS results on the table detection dataset of ICDAR-2019 Track A (Modern). Green represents true positive, whereas red denotes false positive. In this figure, (a) highlights a couple of samples containing true positives, whereas (b) represents a true positive and a false positive.
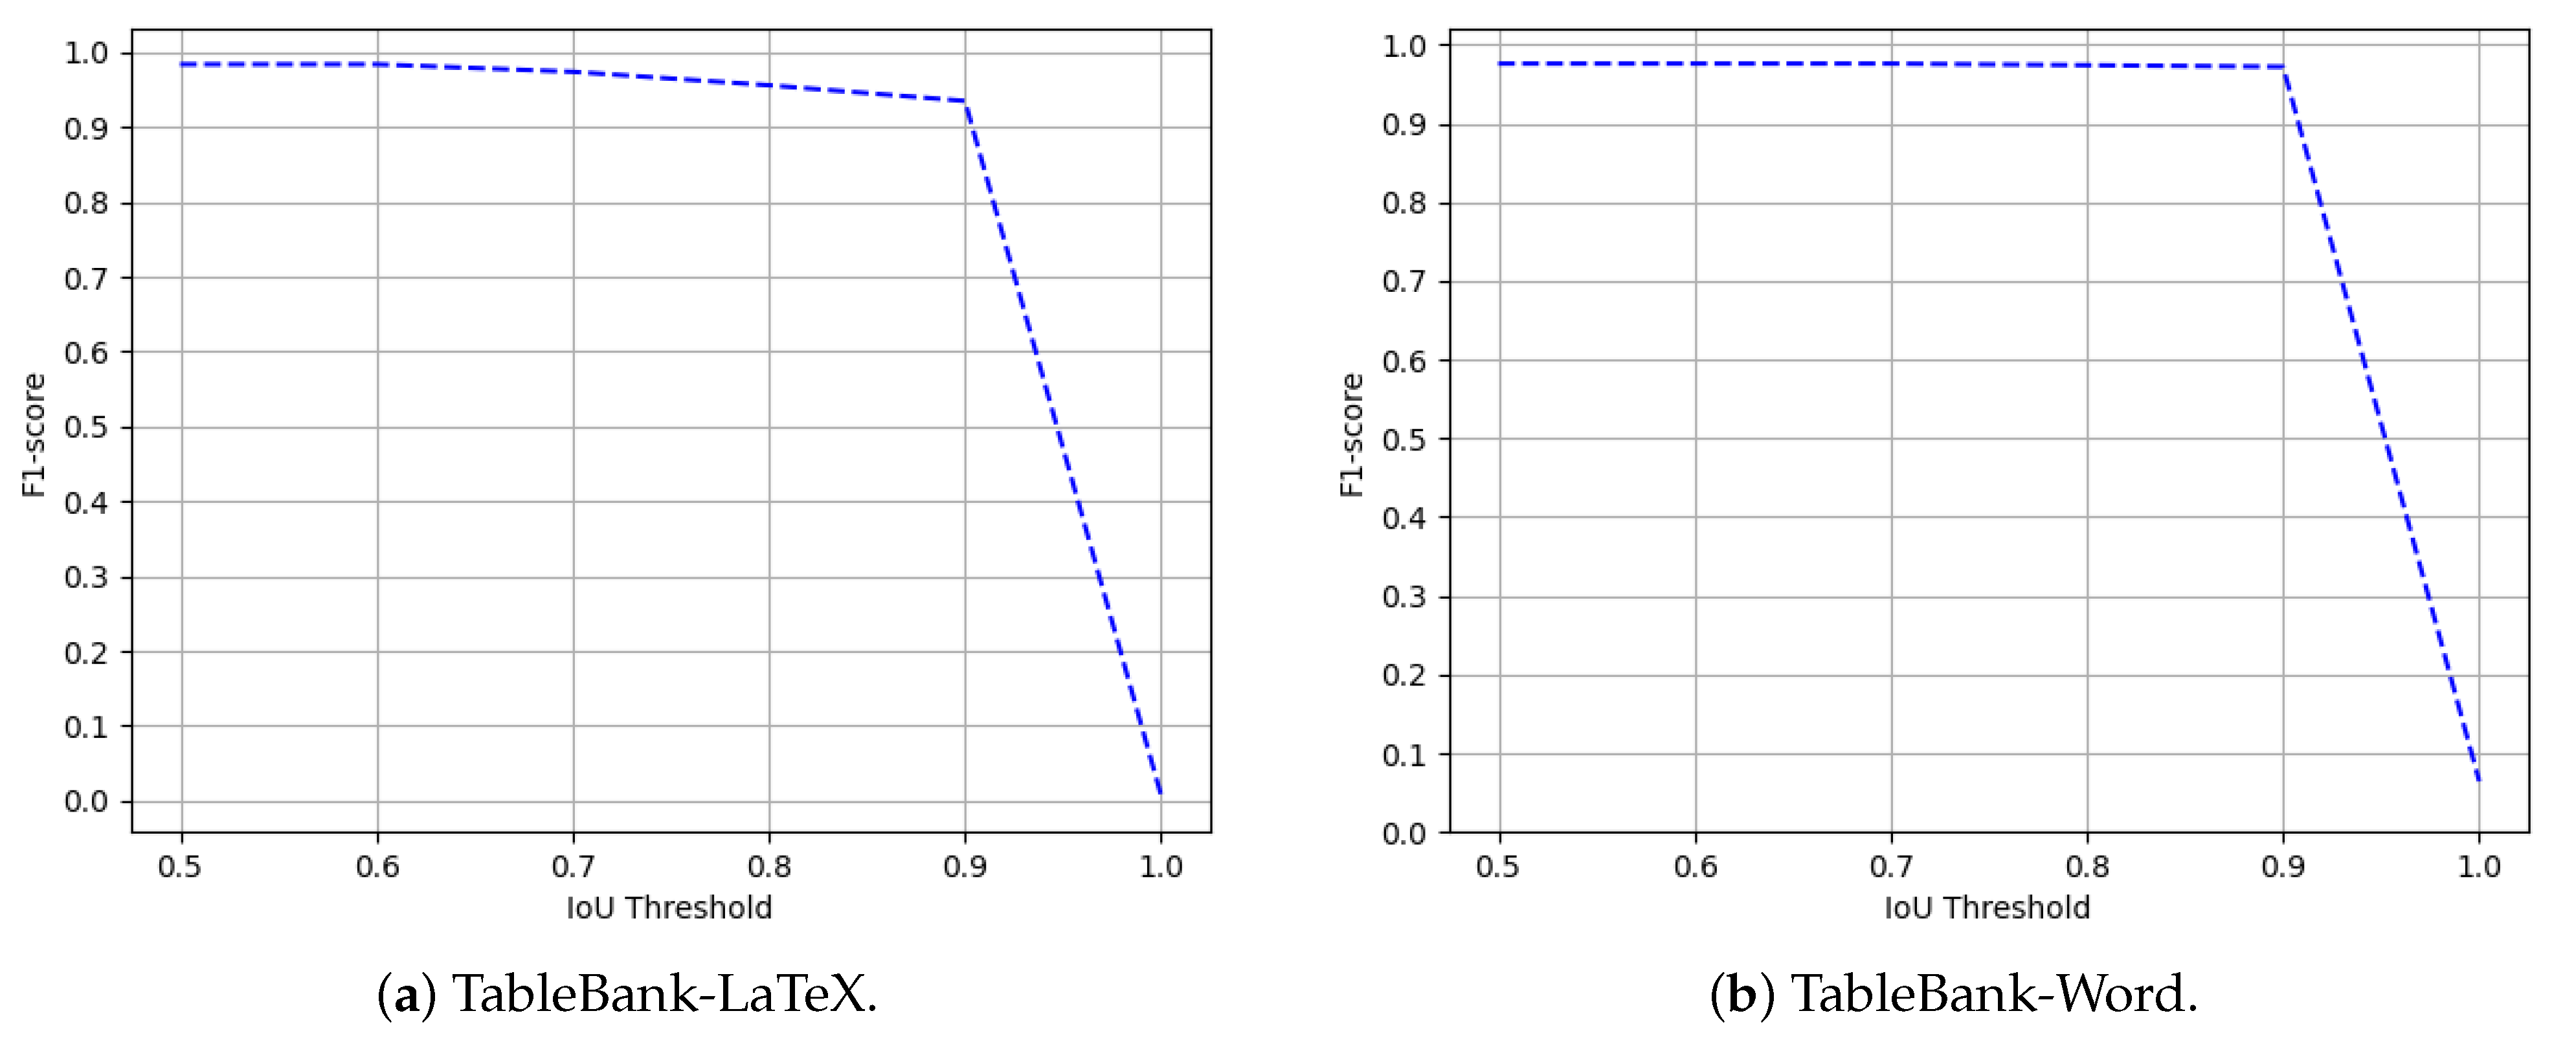
Figure 15.
Performance evaluation of our CasTabDetectoRS in terms of F1-score over the varying IoU thresholds ranging from 0.5 to 1.0 on the TableBank-LaTeX and TableBank-Word datasets.
Figure 15.
Performance evaluation of our CasTabDetectoRS in terms of F1-score over the varying IoU thresholds ranging from 0.5 to 1.0 on the TableBank-LaTeX and TableBank-Word datasets.
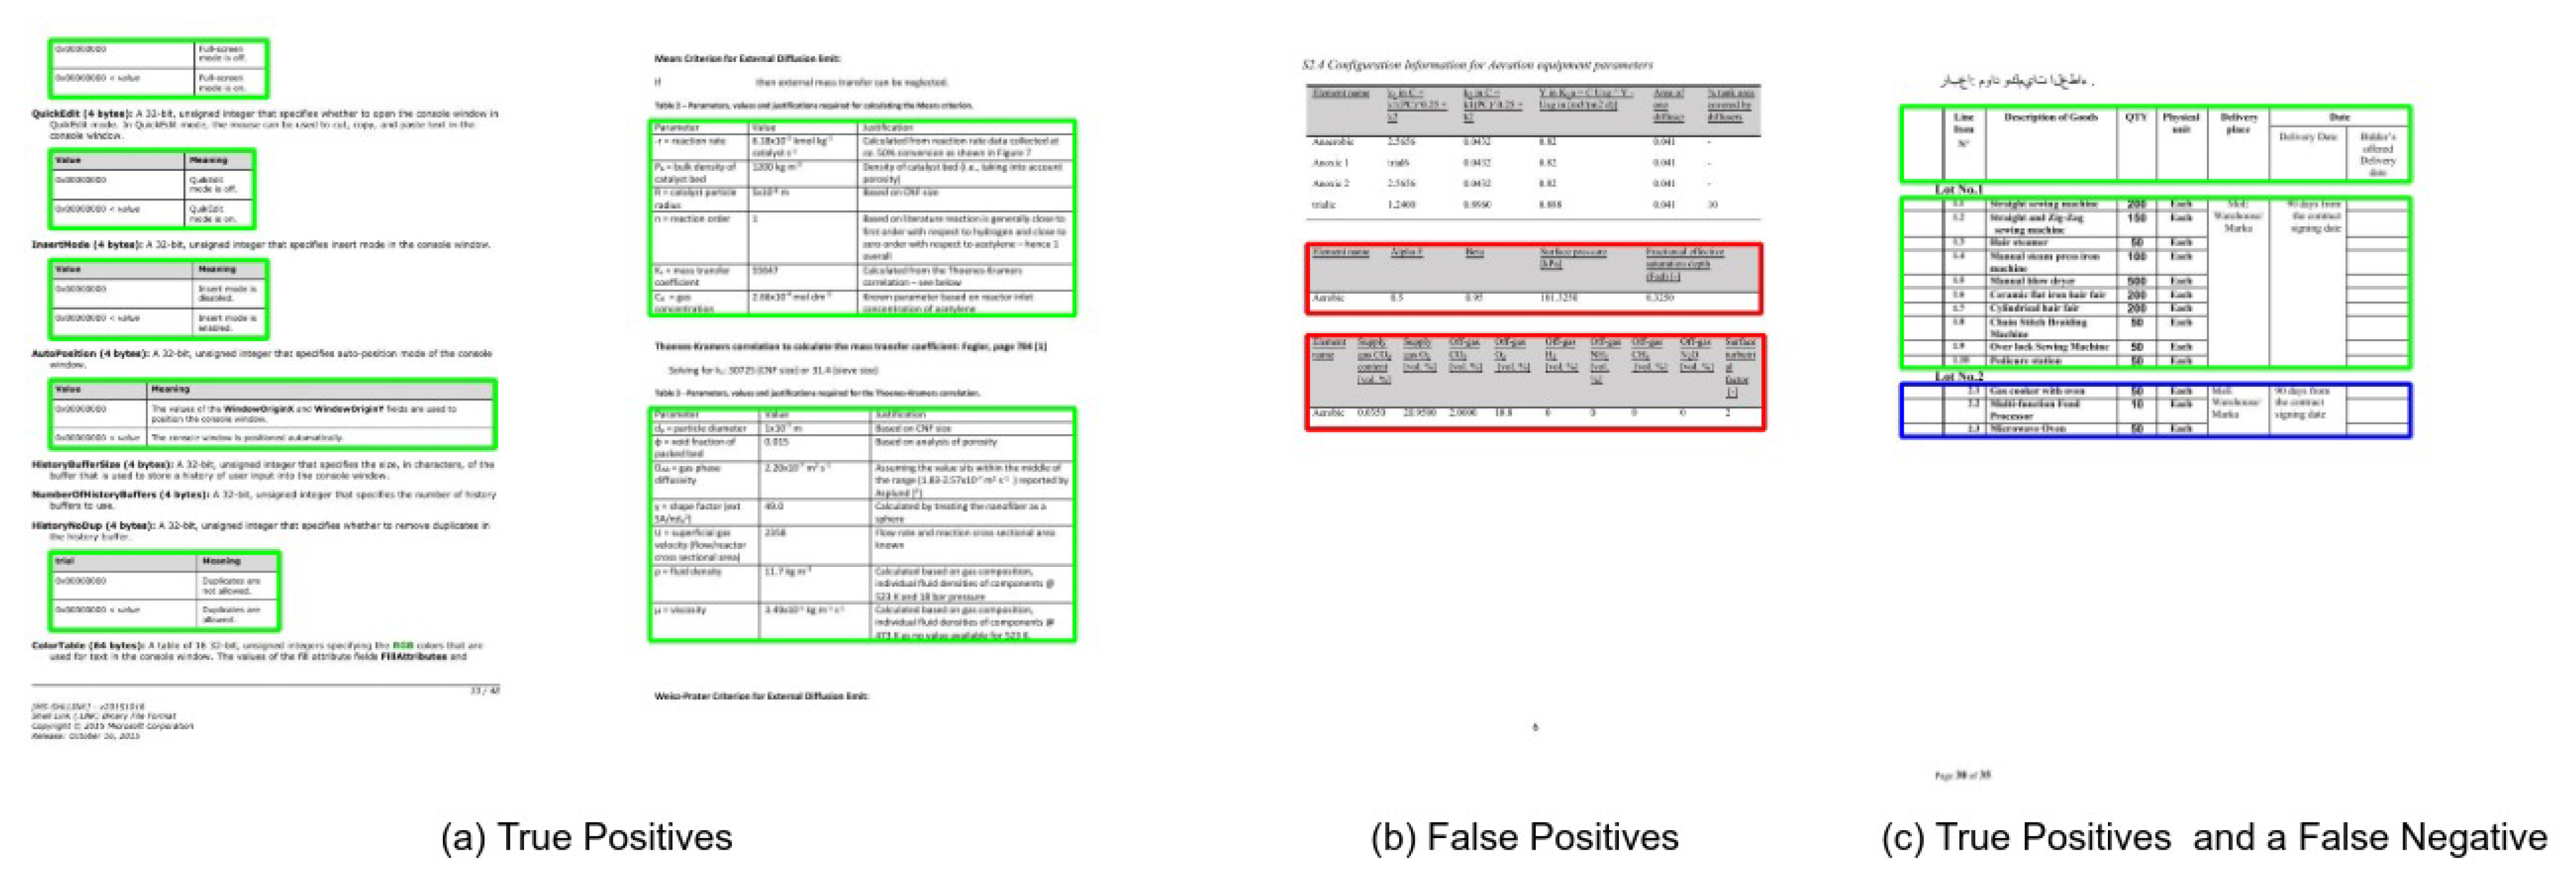
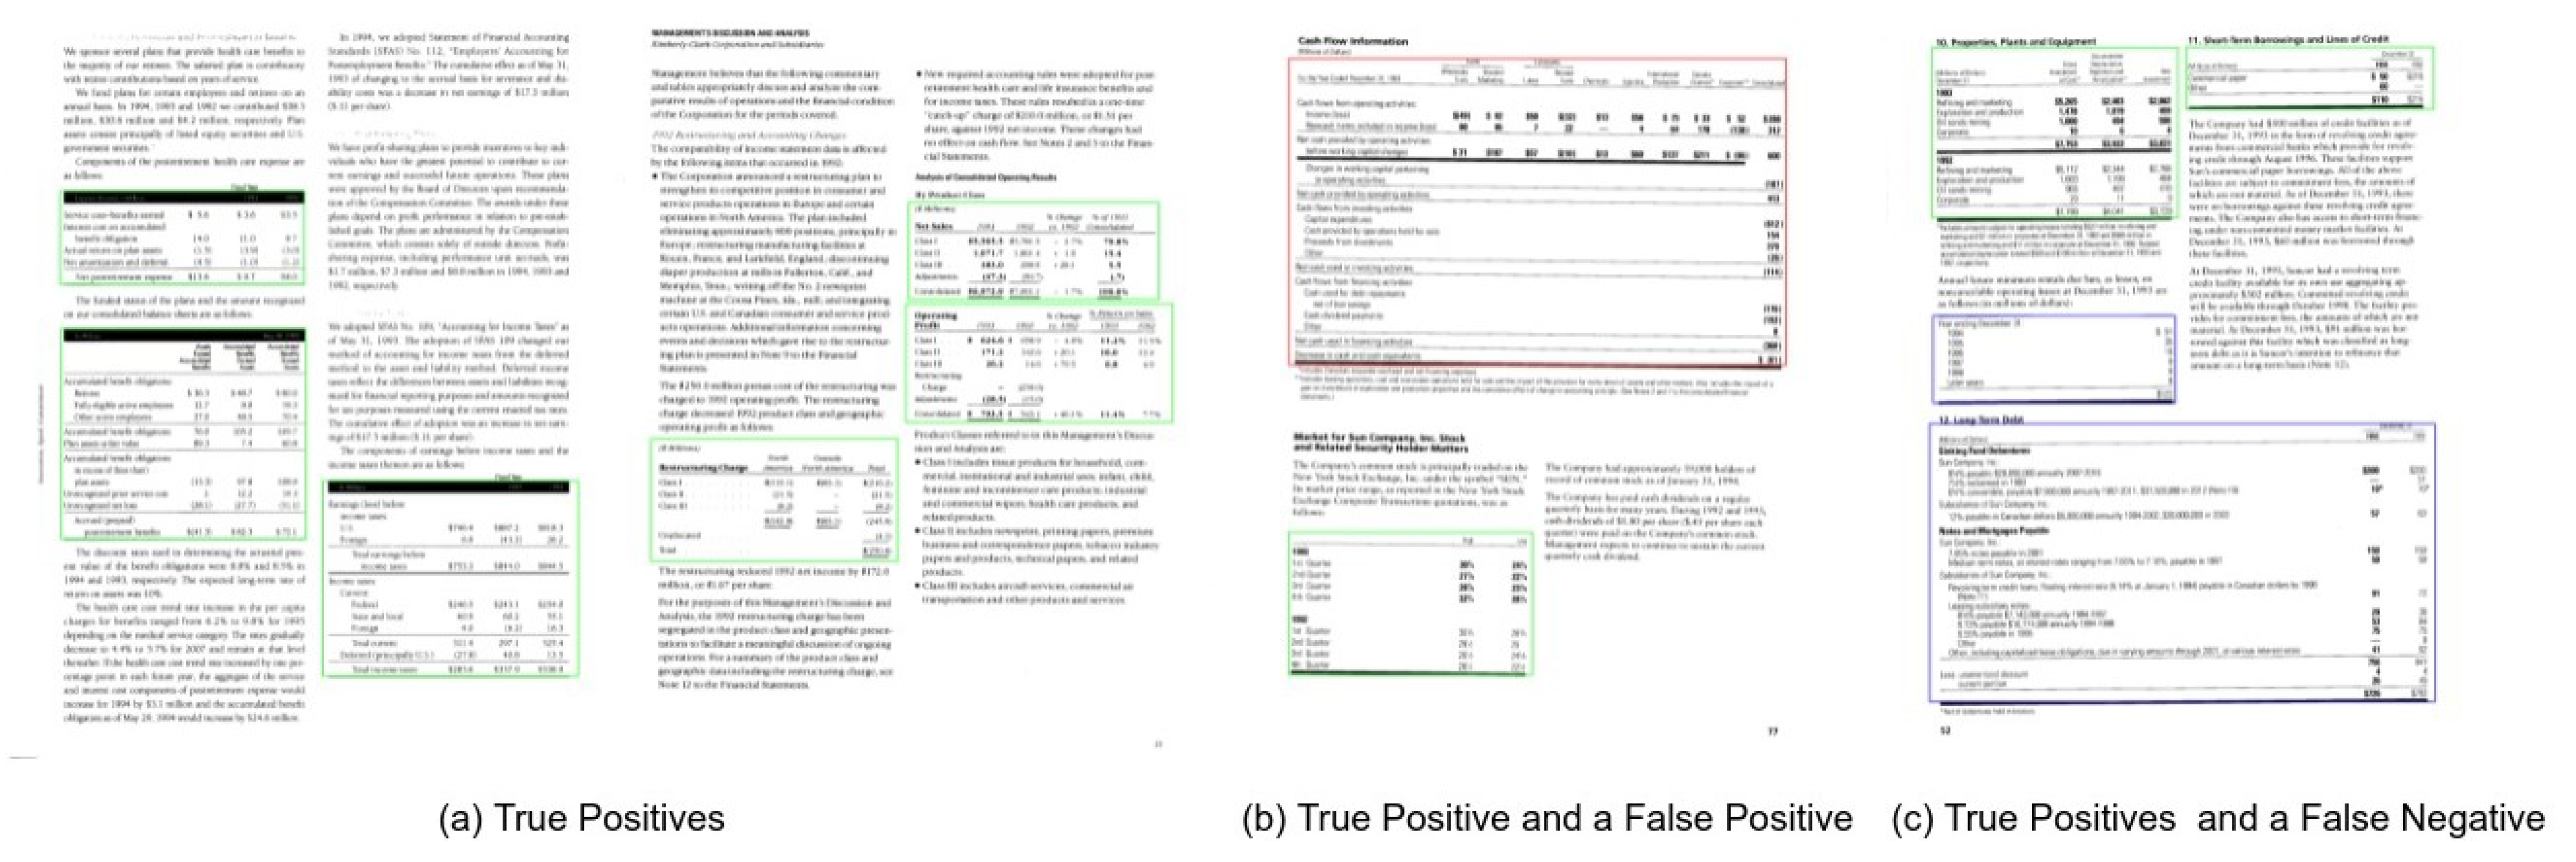
Figure 16.
CasTabDetectoRS results on the TableBank dataset. Green represents true positive, red denotes false positive, and blue color highlights false negative. In this figure, (a) represents a couple of samples containing true positives, (b) illustrates false positives, and (c) depicts true positives and false negatives.
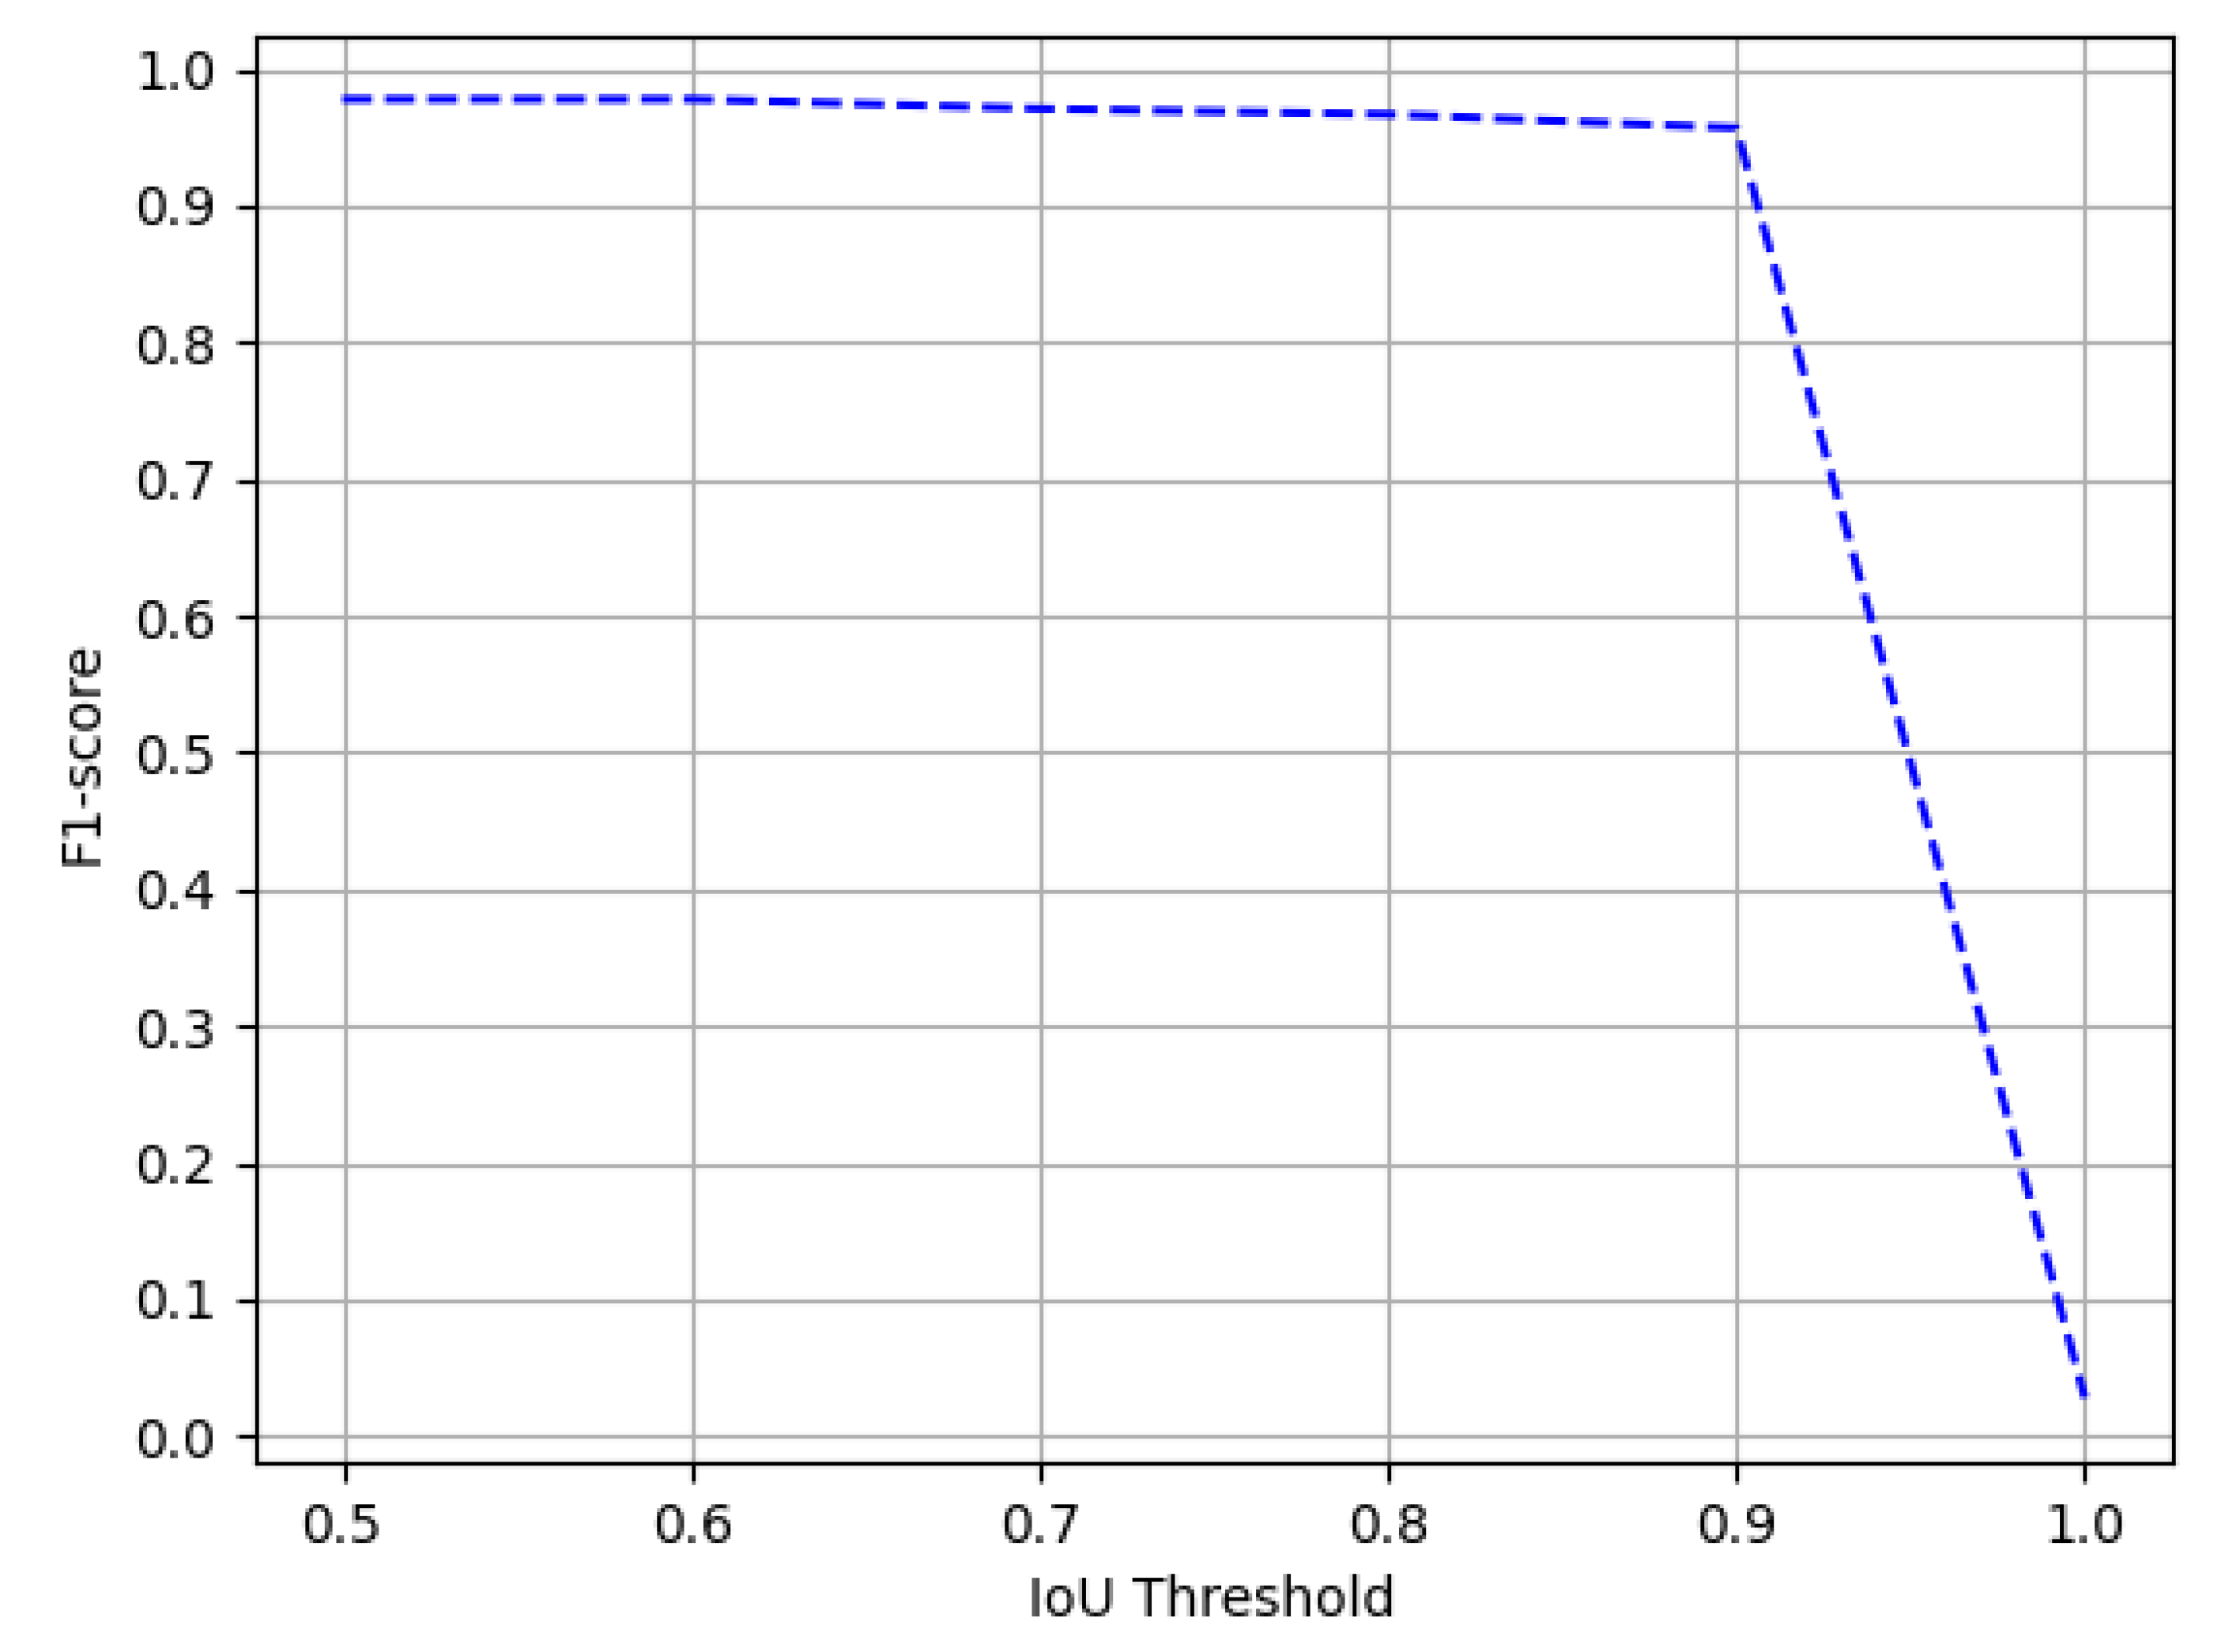
Figure 17.
Performance evaluation of our CasTabDetectoRS in terms of F1-score over the varying IoU thresholds ranging from 0.5 to 1.0 on the TableBank-Both dataset.
Figure 17.
Performance evaluation of our CasTabDetectoRS in terms of F1-score over the varying IoU thresholds ranging from 0.5 to 1.0 on the TableBank-Both dataset.
Figure 18.
Performance evaluation of our CasTabDetectoRS in terms of F1-score over the varying IoU thresholds ranging from 0.5 to 1.0 on the Marmot dataset.
Figure 18.
Performance evaluation of our CasTabDetectoRS in terms of F1-score over the varying IoU thresholds ranging from 0.5 to 1.0 on the Marmot dataset.
Figure 19.
CasTabDetectoRS results on the Marmot dataset. Green represents true positive, red denotes false positive, and blue color highlights false negative. In this figure, (a) exhibits a couple of samples containing true positives, (b) illustrates false positives, and (c) depicts true positives and false negatives.
Figure 20.
Performance evaluation of our CasTabDetectoRS in terms of F1-score over the varying IoU thresholds ranging from 0.5 to 1.0 on the UNLV dataset.
Figure 20.
Performance evaluation of our CasTabDetectoRS in terms of F1-score over the varying IoU thresholds ranging from 0.5 to 1.0 on the UNLV dataset.
Figure 21.
CasTabDetectoRS results on the UNLV dataset. Green represents true positive, red denotes false positive, and blue color highlights false negative. In this figure, (a) highlights a couple of samples containing true positives, and (b) represents a true positive and a false positive, whereas (c) depicts true positives and false negatives.
Table 1.
Performance comparison between the proposed CasTabDetectoRS and previous state-of-the-art results on table detection dataset of ICDAR-17 POD. Best results are highlighted in the table.
Table 1.
Performance comparison between the proposed CasTabDetectoRS and previous state-of-the-art results on table detection dataset of ICDAR-17 POD. Best results are highlighted in the table.
| Method | IoU = 0.6 | IoU = 0.8 |
|---|
| Recall | Precision | F1-Score | Recall | Precision | F1-Score |
|---|
| DeCNT [20] | 0.971 | 0.965 | 0.968 | 0.952 | 0.946 | 0.949 |
| NLPR-PAL [1] | 0.953 | 0.968 | 0.960 | 0.958 | 0.943 | 0.951 |
| VisInt [1] | 0.918 | 0.924 | 0.921 | 0.823 | 0.829 | 0.826 |
| GOD [54] | - | - | 0.989 | - | - | 0.971 |
| CDeC-Net [12] | 0.931 | 0.977 | 0.954 | 0.924 | 0.970 | 0.947 |
| HybridTabNet [14] | 0.997 | 0.882 | 0.936 | 0.994 | 0.879 | 0.933 |
| CasTabDetectoRS (Ours) | 0.941 | 0.972 | 0.956 | 0.932 | 0.962 | 0.947 |
Table 2.
Performance comparison between the proposed CasTabDetectoRS and previous state-of-the-art results on the dataset of ICDAR 19 Track A (Modern). Best results are highlighted in the table.
Table 2.
Performance comparison between the proposed CasTabDetectoRS and previous state-of-the-art results on the dataset of ICDAR 19 Track A (Modern). Best results are highlighted in the table.
| Method | IoU = 0.8 | IoU = 0.9 |
|---|
| Recall | Precision | F1-Score | Recall | Precision | F1-Score |
|---|
| TableRadar [65] | 0.940 | 0.950 | 0.945 | 0.890 | 0.900 | 0.895 |
| NLPR-PAL [65] | 0.930 | 0.930 | 0.930 | 0.860 | 0.860 | 0.860 |
| Lenovo Ocean [65] | 0.860 | 0.880 | 0.870 | 0.810 | 0.820 | 0.815 |
| CascadeTabNet [11] | - | - | 0.925 | - | - | 0.901 |
| CDeC-Net [12] | 0.934 | 0.953 | 0.944 | 0.904 | 0.922 | 0.913 |
| HybridTabNet [14] | 0.933 | 0.920 | 0.928 | 0.905 | 0.895 | 0.902 |
| CasTabDetectoRS (Ours) | 0.988 | 0.964 | 0.976 | 0.951 | 0.928 | 0.939 |
Table 3.
Performance comparison between the proposed CasTabDetectoRS and previous state-of-the-art results on various splits of TableBank dataset. The double horizontalines divide the different splits. Best results are highlighted in the table.
Table 3.
Performance comparison between the proposed CasTabDetectoRS and previous state-of-the-art results on various splits of TableBank dataset. The double horizontalines divide the different splits. Best results are highlighted in the table.
| Method | Dataset | IoU = 0.5 | IoU = 0.9 |
|---|
| Recall | Precision | F1-Score | Recall | Precision | F1-Score |
|---|
| CascadeTabNet [11] | TableBank-LaTeX | 0.972 | 0.959 | 0.966 | - | - | - |
| Li et al. [66] | TableBank-LaTeX | 0.962 | 0.872 | 0.915 | - | - | - |
| HybridTabNet [14] | TableBank-LaTeX | - | - | 0.980 | - | - | 0.934 |
| CasTabDetectoRS (Ours) | TableBank-LaTeX | 0.984 | 0.983 | 0.984 | 0.935 | 0.935 | 0.935 |
| CascadeTabNet [11] | TableBank-Word | 0.955 | 0.943 | 0.949 | - | - | - |
| Li et al. [66] | TableBank-Word | 0.803 | 0.965 | 0.877 | - | - | - |
| HybridTabNet [14] | TableBank-Word | - | - | 0.970 | - | - | 0.962 |
| CasTabDetectoRS (Ours) | TableBank-Word | 0.985 | 0.967 | 0.976 | 0.981 | 0.963 | 0.972 |
| CascadeTabNet [11] | TableBank-Both | 0.957 | 0.944 | 0.943 | - | - | - |
| Li et al. [66] | TableBank-Both | 0.904 | 0.959 | 0.931 | - | - | - |
| HybridTabNet [14] | TableBank-Both | - | - | 0.975 | - | - | 0.949 |
| CasTabDetectoRS (Ours) | TableBank-Both | 0.982 | 0.974 | 0.978 | 0.961 | 0.953 | 0.957 |
Table 4.
Performance comparison between the proposed CasTabDetectoRS and previous state-of-the-art results on the Marmot dataset. Best results are highlighted in the table.
Table 4.
Performance comparison between the proposed CasTabDetectoRS and previous state-of-the-art results on the Marmot dataset. Best results are highlighted in the table.
| Method | IoU = 0.5 | IoU = 0.9 |
|---|
| Recall | Precision | F1-Score | Recall | Precision | F1-Score |
|---|
| DeCNT [20] | 0.946 | 0.849 | 0.895 | - | - | - |
| CDeC-Net [12] | 0.930 | 0.975 | 0.952 | 0.765 | 0.774 | 0.769 |
| HybridTabNet [14] | 0.961 | 0.951 | 0.956 | 0.903 | 0.900 | 0.901 |
| CasTabDetectoRS (Ours) | 0.965 | 0.952 | 0.958 | 0.901 | 0.906 | 0.904 |
Table 5.
Performance comparison between the proposed CasTabDetectoRS and previous state-of-the-art results on the UNLV dataset. Best results are highlighted in the table.
Table 5.
Performance comparison between the proposed CasTabDetectoRS and previous state-of-the-art results on the UNLV dataset. Best results are highlighted in the table.
| Method | IoU = 0.5 | IoU = 0.6 |
|---|
| Recall | Precision | F1-Score | Recall | Precision | F1-Score |
|---|
| Gilani et al. [19] | 0.907 | 0.823 | 0.863 | - | - | - |
| CDeC-Net [12] | 0.906 | 0.914 | 0.910 | 0.805 | 0.961 | 0.883 |
| HybridTabNet [14] | 0.926 | 0.962 | 0.944 | 0.914 | 0.949 | 0.932 |
| CasTabDetectoRS (Ours) | 0.928 | 0.964 | 0.946 | 0.914 | 0.952 | 0.933 |
Table 6.
Examining the generalization capabilities of the proposed CasTabDetectoRS through cross datasets evaluation.
Table 6.
Examining the generalization capabilities of the proposed CasTabDetectoRS through cross datasets evaluation.
| Training Dataset | Testing Dataset | Recall | Precision | F1-Score | Average F1-Score |
|---|
| TableBank-LaTeX | ICDAR-19 | 0.605 | 0.778 | 0.680 | 0.865 |
| ICDAR-17 | 0.866 | 0.958 | 0.910 |
| TableBank-Word | 0.967 | 0.947 | 0.957 |
| Marmot | 0.893 | 0.963 | 0.927 |
| UNLV | 0.918 | 0.856 | 0.885 |
| ICDAR-17 | ICDAR-19 | 0.649 | 0.778 | 0.686 | 0.812 |
| TableBank-Word | 0.983 | 0.943 | 0.963 |
| Marmot | 0.965 | 0.952 | 0.958 |
| UNLV | 0.607 | 0.685 | 0.644 |
| ICDAR-19 | ICDAR-17 | 0.894 | 0.917 | 0.906 | 0.924 |
| TableBank-Word | 0.981 | 0.921 | 0.950 |
| Marmot | 0.925 | 0.956 | 0.940 |
| UNLV | 0.898 | 0.876 | 0.887 |
| UNLV | ICDAR-17 | 0.867 | 0.879 | 0.881 | 0.897 |
| TableBank-Word | 0.903 | 0.941 | 0.922 |
| Marmot | 0.874 | 0.945 | 0.908 |
| ICDAR-19 | 0.839 | 0.918 | 0.877 |


 ,
, 


