
Validation of Image Qualities of a Novel Four-Mice Bed PET System as an Oncological and Neurological Analysis Tool

 , , and
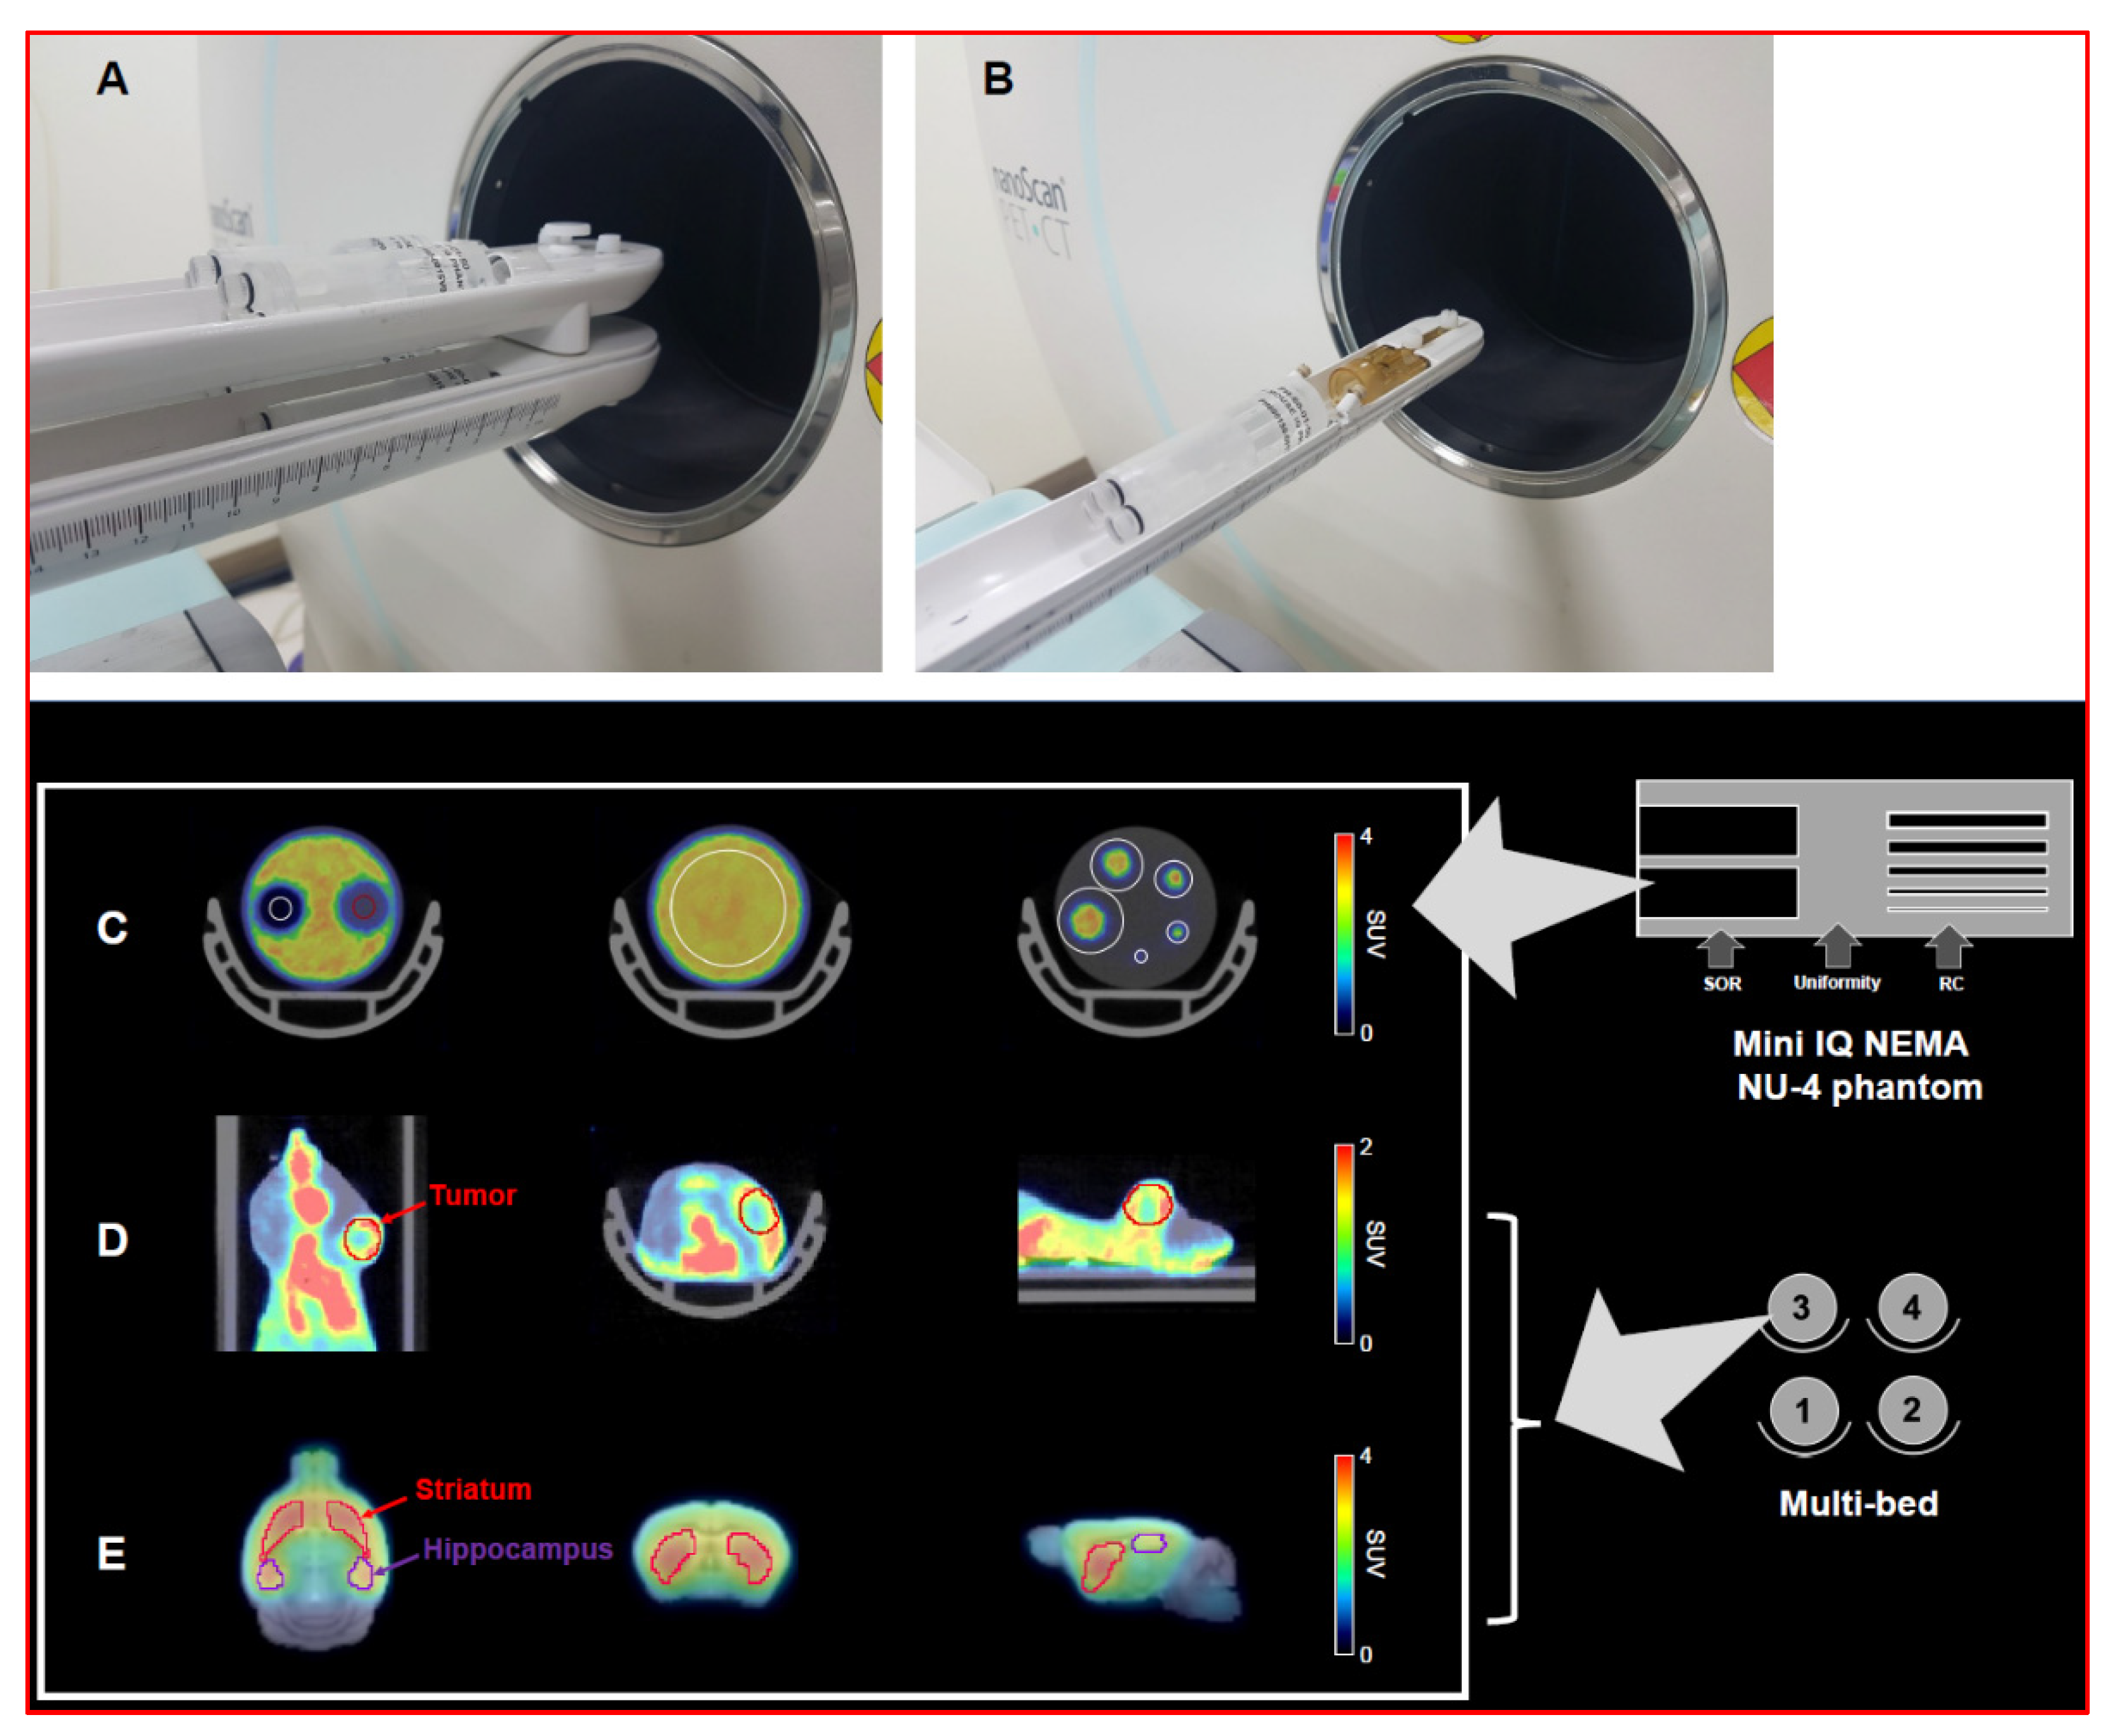
Abstract
:1. Introduction
2. Materials and Methods
2.1. Mini Image Quality Phantom
2.2. Animals
2.3. Radiosynthesis of PET Tracers
2.4. PET Imaging
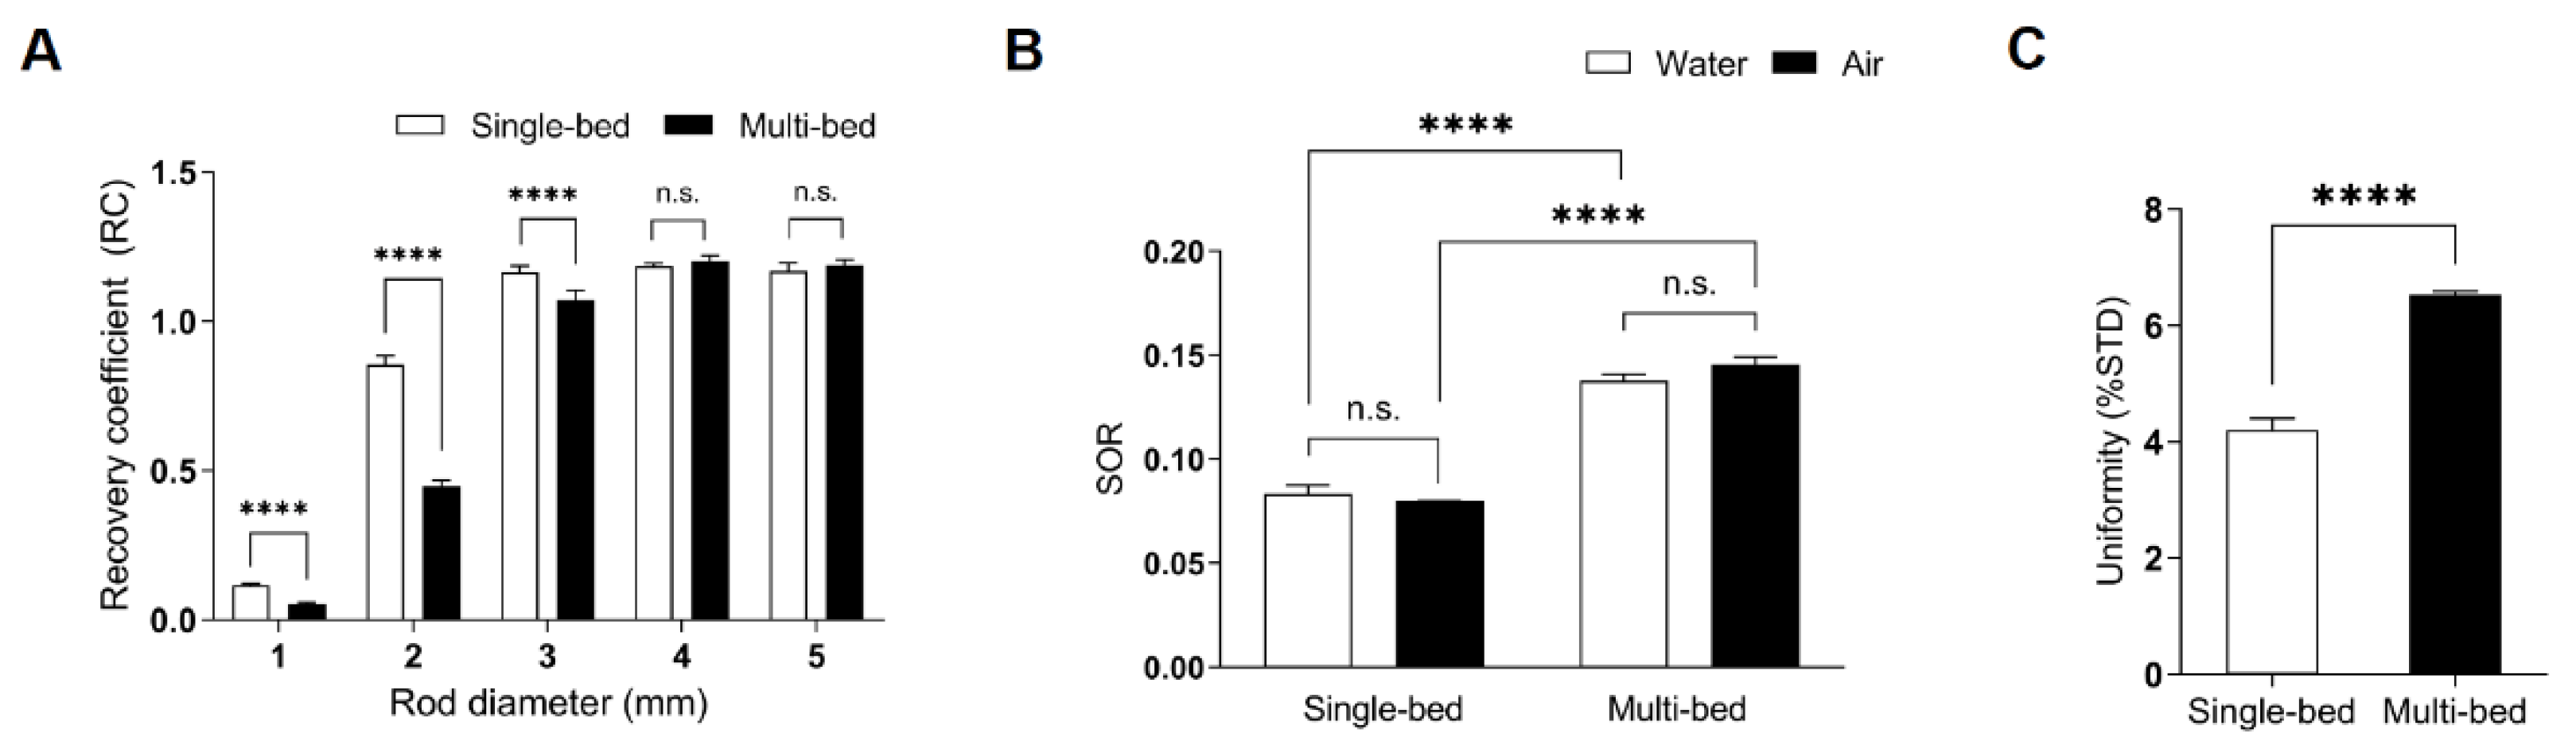
2.4.1. Phantom Study
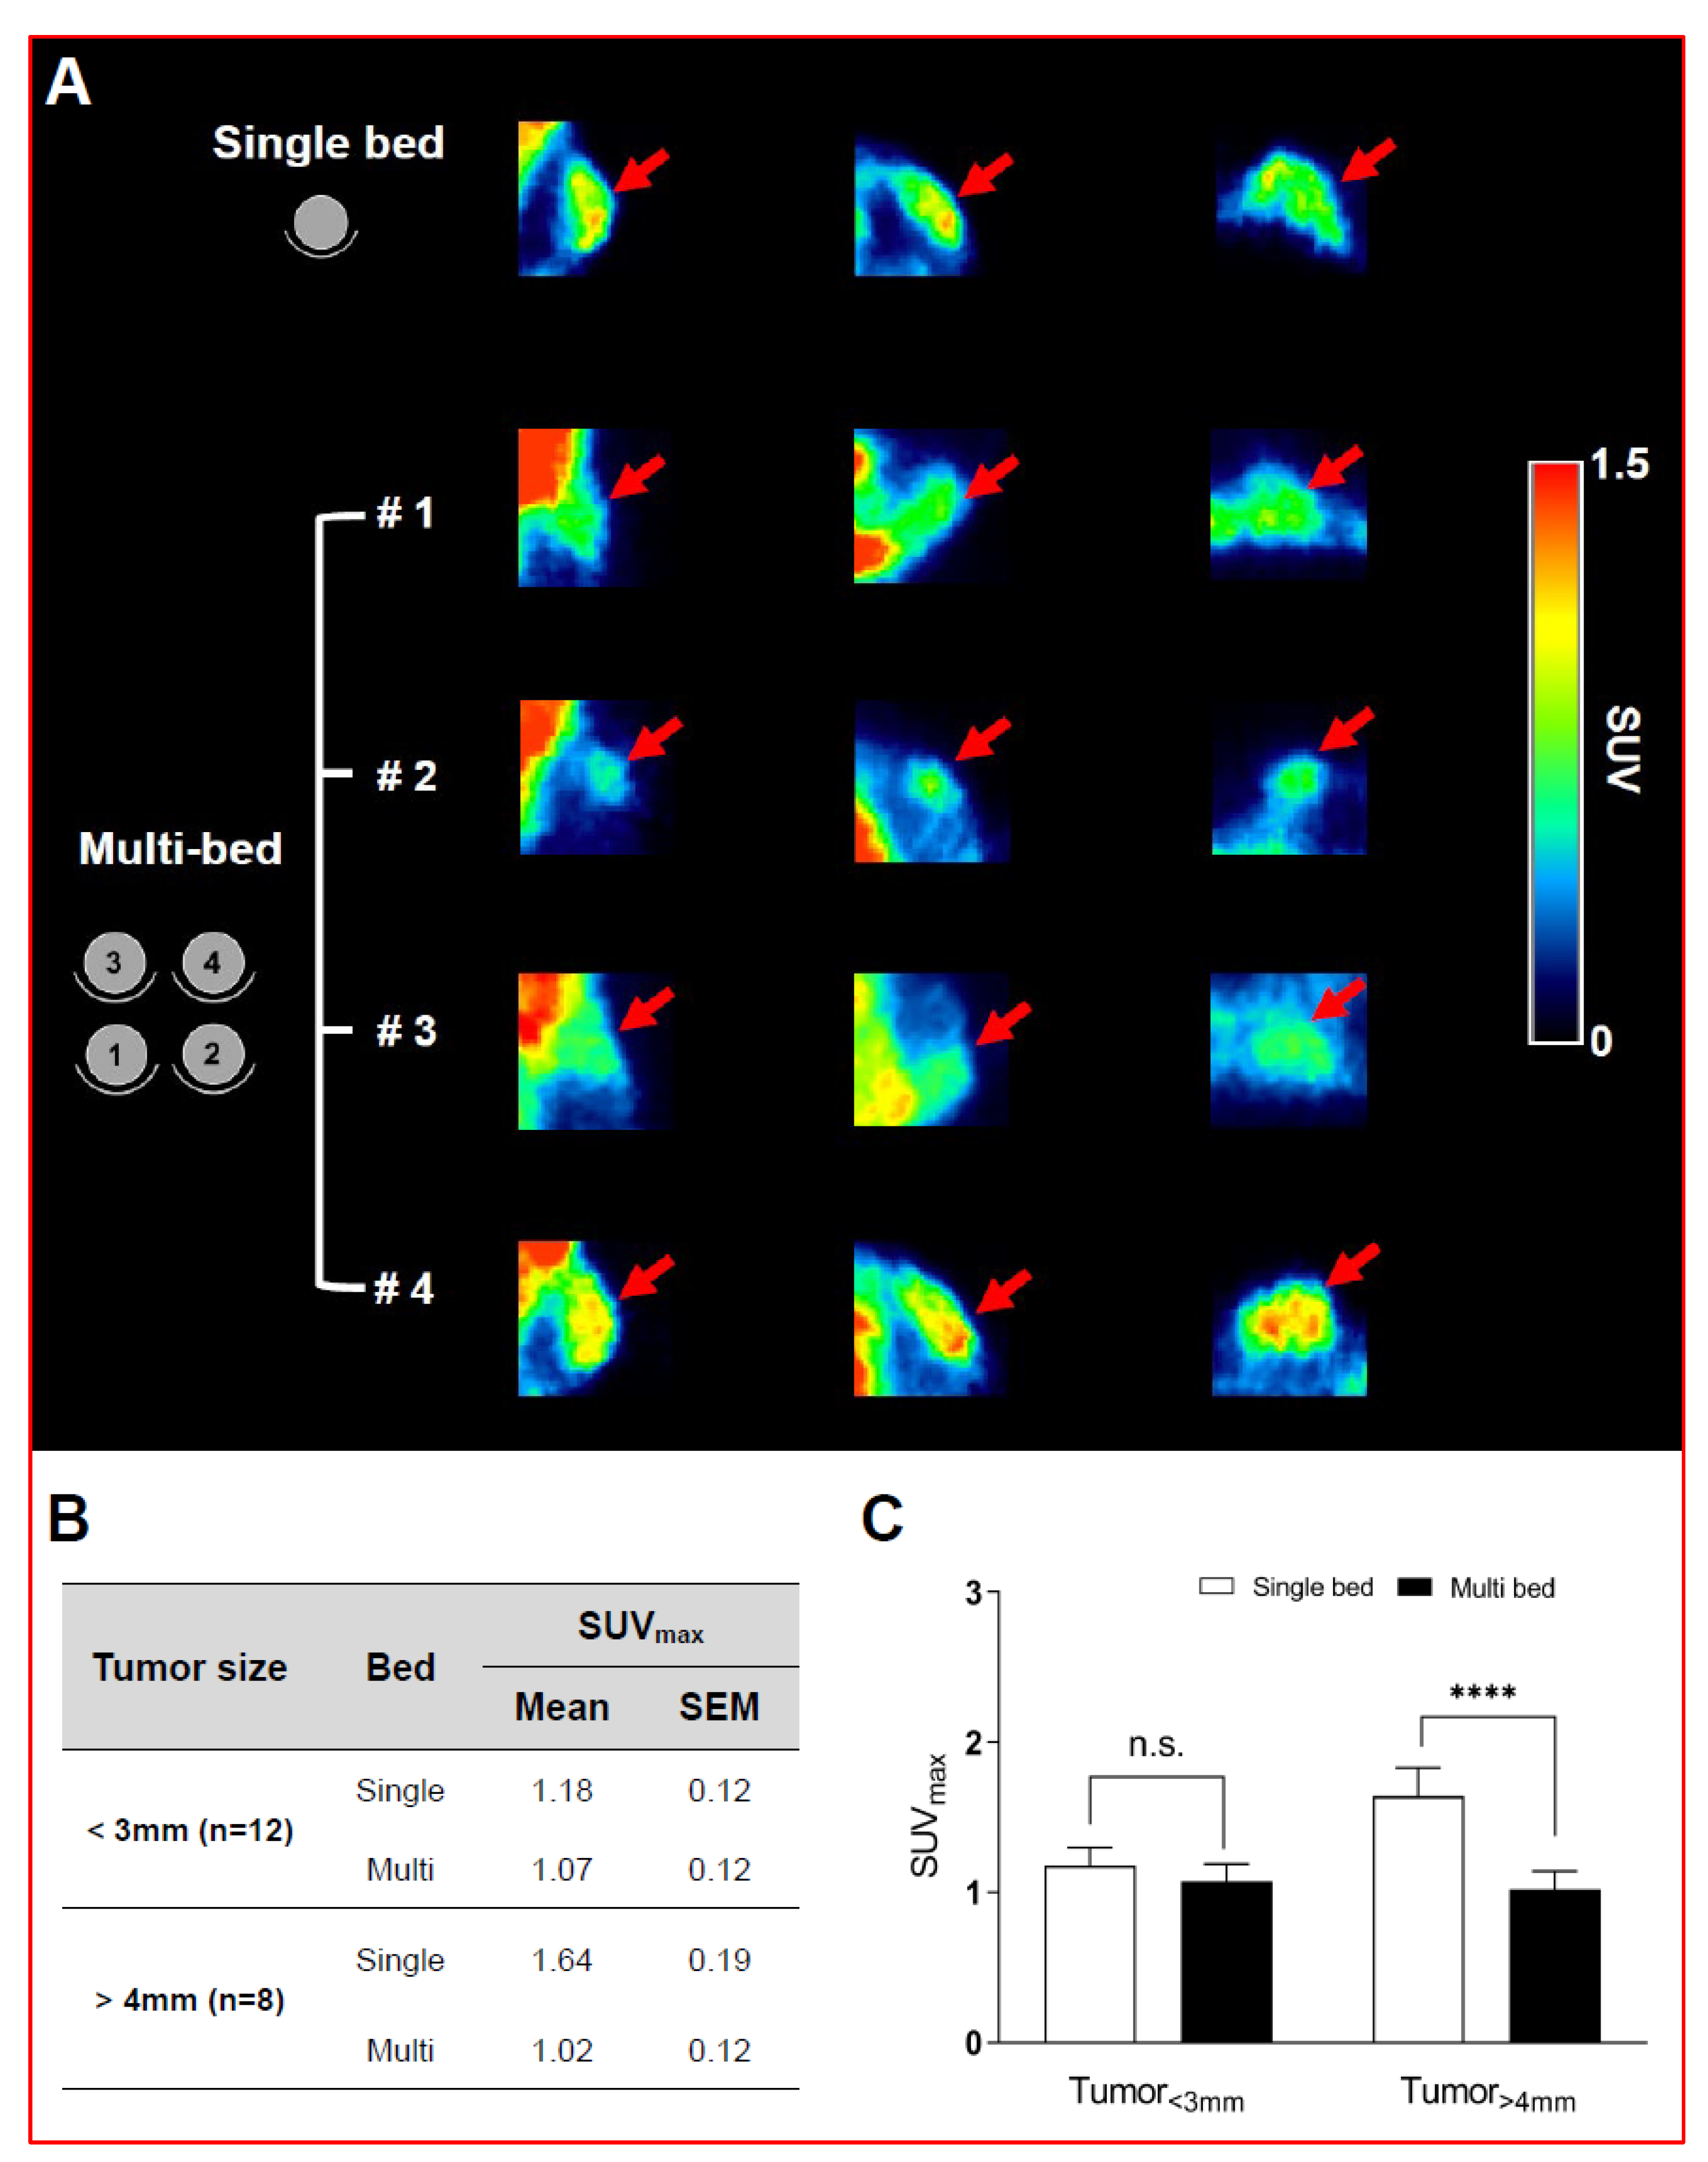
2.4.2. Animal PET Studies
2.5. Image Analysis
2.5.1. NEMA NU-4 2008 Standard Process
2.5.2. Animal PET
2.6. Statistical Analysis
3. Results and Discussion
3.1. Phantom Studies
3.2. Animal Studies
3.2.1. Oncological Study
3.2.2. Neurological Study
4. Conclusions
Author Contributions
Funding
Institutional Review Board Statement
Informed Consent Statement
Data Availability Statement
Conflicts of Interest
References
- Cai, W.; Rao, J.; Gambhir, S.S.; Chen, X. How molecular imaging is speeding up antiangiogenic drug development. Mol. Cancer Ther. 2006, 5, 2624–2633. [Google Scholar] [CrossRef] [PubMed]
- Massoud, T.F.; Gambhir, S.S. Molecular imaging in living subjects: Seeing fundamental biological processes in a new light. Genes. Dev. 2003, 17, 545–580. [Google Scholar] [CrossRef] [PubMed]
- Aebersold, R.; Anderson, L.; Caprioli, R.; Druker, B.; Hartwell, L.; Smith, R. Perspective: A program to improve protein biomarker discovery for cancer. J. Proteome Res. 2005, 4, 1104–1109. [Google Scholar] [CrossRef] [PubMed]
- Hartwell, L.; Mankoff, D.; Paulovich, A.; Ramsey, S.; Swisher, E. Cancer biomarkers: A systems approach. Nat. Biotechnol. 2006, 24, 905–908. [Google Scholar] [CrossRef] [PubMed]
- Vaquero, J.; Kinahan, P. Positron Emission Tomography: Current Challenges and Opportunities for Technological Advances in Clinical and Preclinical Imaging Systems. Physiol. Behav. 2017, 176, 139–148. [Google Scholar] [CrossRef] [PubMed]
- Weber, W.A.; Schwaiger, M.; Avril, N. Quantitative Assessment of Tumor Metabolism Using FDG-PET Imaging. Nucl. Med. Biol. 2000, 27, 683–687. [Google Scholar] [CrossRef]
- Zimmer, L.; Luxen, A. PET radiotracers for molecular imaging in the brain: Past, present and future. Neuroimage 2012, 61, 363–370. [Google Scholar] [CrossRef] [PubMed]
- Yao, R.; Lecomte, R.; Crawford, E.S. Small-animal PET: What is it, and why do we need it? J. Nucl. Med. Technol. 2012, 40, 157–165. [Google Scholar] [CrossRef] [PubMed]
- Habte, F.; Ren, G.; Doyle, T.C.; Liu, H.; Cheng, Z.; Paik, D.S. Impact of a Multiple Mice Holder on Quantitation of High-Throughput MicroPET Imaging With and Without Ct Attenuation Correction. Physiol. Behav. 2017, 176, 139–148. [Google Scholar] [CrossRef] [PubMed]
- Greenwood, H.E.; Nyitrai, Z.; Mocsai, G.; Hobor, S.; Witney, T. High Throughput PET/CT Imaging Using a Multiple Mouse Imaging System. J. Nucl. Med. 2019, 44, 1–22. [Google Scholar] [CrossRef] [PubMed]
- Takkinen, J.S.; López-Picón, F.R.; Majidi, R.A.; Eskola, O.; Haaparanta-Solin, M. Brain energy metabolism and neuroinflammation in ageing APP/PS1-21 mice using longitudinal 18F-FDG and 18F-DPA-714 PET imaging. J. Cereb. Blood Flow Metab. 2017, 37, 2870–2882. [Google Scholar] [CrossRef] [PubMed]
- Wang, J.-Q.; Tueckmantel, W.; Zhu, A.; Pellegrino, D.; Brownell, A.-L. Synthesis and Preliminary Biological Evaluation of 3-[18F]Fluoro-5-(2-pyridinylethynyl)benzonitrile as a PET Radiotracer for Imaging Metabotropic Glutamate Receptor Subtype 5. Synapse 2007, 61, 951–961. [Google Scholar] [CrossRef] [PubMed]
- Ahmed, M.; Tegnebratt, T.; Tran, T.A.; Lu, L.; Damberg, P.; Gisterå, A.; Tarnawski, L.; Bone, D.; Hedin, U.; Eriksson, P.; et al. Molecular imaging of inflammation in a mouse model of atherosclerosis using a zirconium-89-labeled probe. Int. J. Nanomed. 2020, 15, 6137–6152. [Google Scholar] [CrossRef] [PubMed]
- Lee, M.; Lee, H.J.; Jeong, Y.J.; Oh, S.J.; Kang, K.J.; Han, S.J.; Nam, K.R.; Lee, Y.J.; Lee, K.C.; Ryu, Y.H.; et al. Age dependency of mGluR5 availability in 5xFAD mice measured by PET. Neurobiol. Aging 2019, 84, 208–216. [Google Scholar] [CrossRef] [PubMed]


Publisher’s Note: MDPI stays neutral with regard to jurisdictional claims in published maps and institutional affiliations. |
© 2021 by the authors. Licensee MDPI, Basel, Switzerland. This article is an open access article distributed under the terms and conditions of the Creative Commons Attribution (CC BY) license (http://creativecommons.org/licenses/by/4.0/).
Share and Cite
Kang, K.J.; Oh, S.J.; Nam, K.R.; Ahn, H.; Park, J.-A.; Lee, K.C.; Choi, J.Y. Validation of Image Qualities of a Novel Four-Mice Bed PET System as an Oncological and Neurological Analysis Tool. J. Imaging 2021, 7, 43. https://0-doi-org.brum.beds.ac.uk/10.3390/jimaging7030043
Kang KJ, Oh SJ, Nam KR, Ahn H, Park J-A, Lee KC, Choi JY. Validation of Image Qualities of a Novel Four-Mice Bed PET System as an Oncological and Neurological Analysis Tool. Journal of Imaging. 2021; 7(3):43. https://0-doi-org.brum.beds.ac.uk/10.3390/jimaging7030043
Chicago/Turabian StyleKang, Kyung Jun, Se Jong Oh, Kyung Rok Nam, Heesu Ahn, Ji-Ae Park, Kyo Chul Lee, and Jae Yong Choi. 2021. "Validation of Image Qualities of a Novel Four-Mice Bed PET System as an Oncological and Neurological Analysis Tool" Journal of Imaging 7, no. 3: 43. https://0-doi-org.brum.beds.ac.uk/10.3390/jimaging7030043