1. Introduction
The current measure of survivability of a damaged ship in a seaway has been shown to be inaccurate and inadequate practically from the moment of its introduction within the probabilistic framework of damage stability, known commonly as SOLAS 2009 [
1]. Some research indicated existence of a safety gap between the new SOLAS and SOLAS90 + Stockholm Agreement (SA [
2]), e.g., [
3] where in conclusions, the authors state that “
Applied to two new RoPax designs, it has been revealed that the safety level provided by the new SOLAS 2009 rules is significantly lower compared to the old damage stability rules SOLAS 90 in conjunction with the Stockholm Agreement.”, while other suggested that the new regulations were more demanding (e.g., in terms of GM requirements than the SOLAS90 + Stockholm Agreement) for large RoPax ships while being generally less stringent for small ferries [
4]. The latter observation was later “extrapolated” to all passenger vessels and common understanding was that the formula underestimates actual safety levels of large cruise vessels (the HARDER [
5], sample of ships included two RoPax ships and one cruise liner) while the safety performance of RoPax ships may be seriously overrated [
6].
From this perspective, given the controversies associated with the s-factor it is important to make a clear distinction between findings of and subsequent recommendations by the project HARDER and the formula adopted by the IMO. The brief summary of the outcome of the project HARDER can be found in [
7] and there an attentive reader can readily see that the IMO adoption deviated in significant details from the project’s proposals (e.g., the authors recommended use of SEM—static equivalent method [
8]—accounting for effects associated with accumulation of floodwater on the vehicle deck of Ro-Ro vessels, either in place or in conjunction with conventional, GZ-based model). Therefore, while considering the shortcomings of the present formula, the reader should not undermine the quality of the HARDER research. On the contrary, the outcome of the project had such gravity that the IMO decided to use it as a basis for the new s-factor formulation, despite the fact that the HARDER’s regression models were derived for a rather modest sample. The historical background behind the development of “harmonised” regulations and concerns related to the adopted survivability model are discussed in detail in [
9].
In the course of more recent research activities it has been shown that the issue is much more complex and it is generally a consequence of a few, yet critical, ill-founded decisions made at the time of the s-factor development and its adoption by IMO. As far as the project HARDER is concerned it seems that its most significant shortcoming was the fact that it did not emphasize strongly enough that although the survivability model seemed “satisfactory” at the time of development the evidence supporting it was scarce and insufficient (small, largely homogenous ship sample and incomplete parametric investigation), and that more research was needed in order to conclude the work. Irrespective of this, given that the HARDER’s proposal resulted in a dramatic change in the definition of the factor “s” (as compared with A.265 [
10], where the survivability model was based on more intuitive parameters and concepts such as residual GM or freeboard) the decision by IMO to adopt the “conventional” methodology discussed within the project without further studies can be perceived as a serious oversight.
This, combined with some basic notional inconsistencies related to the definition of survivability, led to the situation that the s-factor is biased towards the specific sample. Furthermore, it does not account for certain built-in stability-enhancing features above the deck which practically prohibits harmonisation of the stability framework with relevant goal-based regulations like the Safe Return to Port (SRtP). Finally, the current formulation has been often criticized, e.g., [
9] due to the fact that it does not signify key attributes of a damaged ship, such as residual freeboard, accumulation of floodwater on deck [
11],
etc.
As a result, the s-factor formulation has been perceived as a flawed, inaccurate and confusing instrument that may complicate the design process, misguide the designer and even compromise safety [
4].
On one hand (as earlier indications suggested and recent research confirms) the flaws within the s-factor have a minor impact on the attained index of subdivision (the A-Index - an expected (weighted average) probability of survival of any feasible flooding scenario in three distinct loading conditions) of contemporary designs (as the marginal survivability cases, i.e., damage cases with a probability of survival between 0 and 1, constitute only a small percentage of all feasible flooding casualties; this in fact was part of the reason why the current s-factor formulation was adopted in SOLAS 2009). On the other hand, however, the present s-factor formulation is likely to fail precisely where it is particularly needed, that is in those scenarios that are likely to happen and can potentially result in catastrophic losses. Furthermore, these are usually complex cases, difficult to deal with, resulting from design limitations and/or conflicting objectives and in these cases the s-factor fails at least twice. Firstly, this is by failing to provide an accurate assessment of survivability (particularly for the ships of watertight arrangements deviating significantly from that of HARDER’s sample) in dynamic environment. Secondly, it fails because the GZmax and residual range of positive stability cannot be readily linked to the easily measurable design attributes, such as freeboard or compartment length (the relationship between these parameters and the GZ curve exists through several other parameters), which could be used by a designer to resolve the technical problems at hand. Comparison between distinct designs purely on a basis of maximum righting lever and a range of positive stability is neither easy nor complete and in this respect the present s-factor formula may prevent safe and rational design.
The EU-funded project GOALDS (Goal Based Design for Damage Stability, 2009–2012 [
12]) set the review of the existing s-factor as one if its core objectives (along with the development of equivalent safety factor for grounding damages and harmonisation of damage stability requirements with the goal-based regulatory framework).
In the following the authors present briefly the work carried within GOALDS and leading to formulation of a new proposal for the factor s.
2. Background Concepts
The three, most fundamental from the perspective of damaged ship survivability, notions are associated with modes of loss, the capsize band and accumulation of water on deck. These concepts were introduced by earlier research and in GOALDS they were examined specifically from the point of view of methodology and generalisation of the results.
2.1. Modes of Ship Loss
In the most general case there are three distinct mechanisms or “modes” of ship loss in a damaged condition: capsize, sinking and transient capsize. The first two are to be understood as gradual processes of diminishing residual stability or residual buoyancy as a direct result of the flooding process. The mechanism of capsize or sinking is a stochastic (but not ergodic) process resulting in quasi-static loss. The third mode is a dynamic process that can be seen as a response of an intact ship to the rapid floodwater ingress. Given that in a transient mode the potential “memory effects” should diminish within a relatively short time (a matter of seconds) for all cases reaching equilibrium post-damage the action of waves can be neglected in this mode of loss.
In the following, the term capsize shall be used to denote any kind of ship loss unless stated otherwise.
2.2. Capsize Band
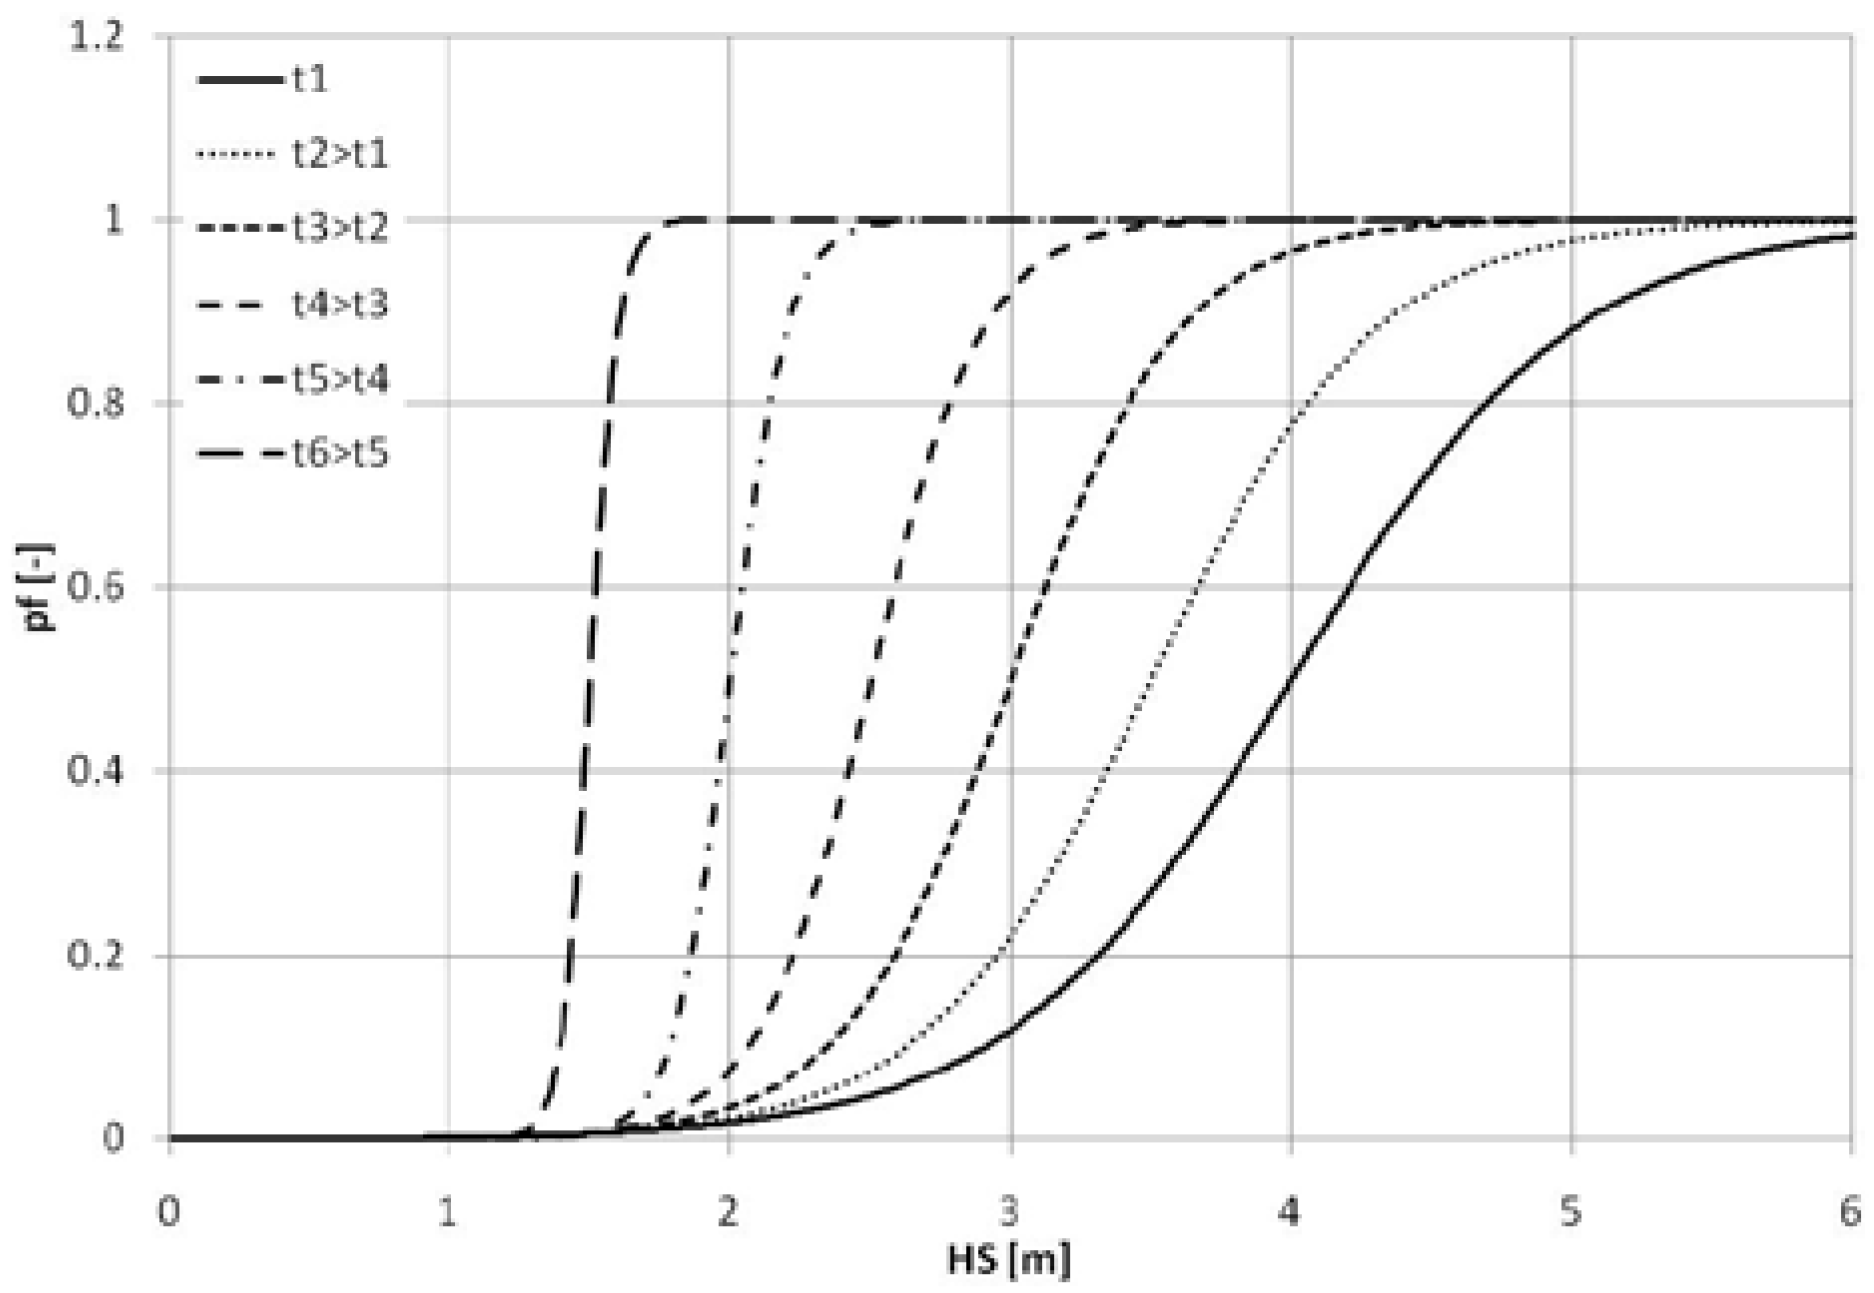
Capsize band is a concept describing range of sea-states within which a transition from unlikely (lower boundary) to certain (upper boundary) capsizes is observed (in the light of the considerations presented in the previous section, the term “capsize” can be generalized to account for both capsize and sinking).
For a finite observation time, the probability of capsize can be approximated with the help of a sigmoid function [
13] of the form:
where: p
f is probability of capsizing, H
S is the sea-state in question, x
0 and Δx are regression parameters—the abscissa of the sigmoid’s inflection point and the bandwidth parameter, respectively.
Alternatively to the above (so called Bolzman’s) representation, earlier publications [
14] demonstrated use of normal (Gaussian) representation, where the probability of capsize is approximated by an integral curve of the normal distribution, where x
0 would become modal value, μ, of the dp
f/dH
S distribution and Δx would be replaced by standard deviation, σ.
A significant feature of the capsize band is that as the time of observation increases the capsize band contracts towards its lower boundary, becoming a unit step function as time of exposure to action of environment approaches infinity (see
Figure 1).
This property is of major importance and, as will be shown in the following, it had become one of the key findings made during the re-engineering of the s-factor.
It is worth noting that the concept of the critical sea state, HScrit, as used for the s-factor in force, is associated with the sea state at which the probability of capsize (pf) is equal to 0.5, based on half hour tests.
2.3. Water on Deck
Accumulation of water on vehicle deck of a RoRo ships (or more generally accumulation of floodwater inside a damaged ship) has always been considered as a prime factor affecting damaged ship survivability (the SEM approach was derived based on the observed correlation between the amount of floodwater accumulated on deck and survivability of the vessel and the loss of
m/
v Estonia gave the IMO an impetus for introducing regional requirements for RoPax ships operating in NW Europe, known as the Stockholm Agreement [
2]). The problem of floodwater accumulation is usually referred to as the Water on Deck (or WoD) problem.
The major difficulty in addressing the survivability from the WoD angle is the stochastic and non-ergodic character of the flooding process, which generally makes analysis very complex and time consuming (necessity of analysing very long time histories). Proper analysis of flooding history is difficult even for numerical tests and physical experiments suffer additionally due to short time realisations, complex set-up and inherent uncertainty of measurements.
In this context properties of the capsize band came to aid by hinting an unconventional approach for processing WoD time series: the analysis of WoD accumulation should be based not on the cases within the capsize band (i.e., capsizing cases) but just outside its lower boundary, towards which the band contracts (i.e., cases likely to survive for “infinite” time). Such an approach has certain advantages—firstly, long but finite observation time around the lower boundary practically guarantees infinite survival time (the lower boundary can be assumed time invariant, as previously shown) and secondly, analysis of surviving cases allows relaxing the limitation with respect to ergodicity of the process—i.e., flooding, similar to ship response, can be assumed (for engineering purposes) to be ergodic.
The above reasoning allowed formulating a procedure for analysing WoD (or floodwater accumulation in the general case) based on an averaged 95th percentile of floodwater mass (derived from numerical simulations) calculated within the cumulative time (i.e., measured at intervals equal to the wave period).
The main shortcoming of such approach was the difficulty of the inclusion of the transient phase of the time history (non-stationary) but the main purpose was the visualisation and qualitative assessment of the flooding processes without the need to withdraw any quantitative conclusions with respect to the critical amount of floodwater.
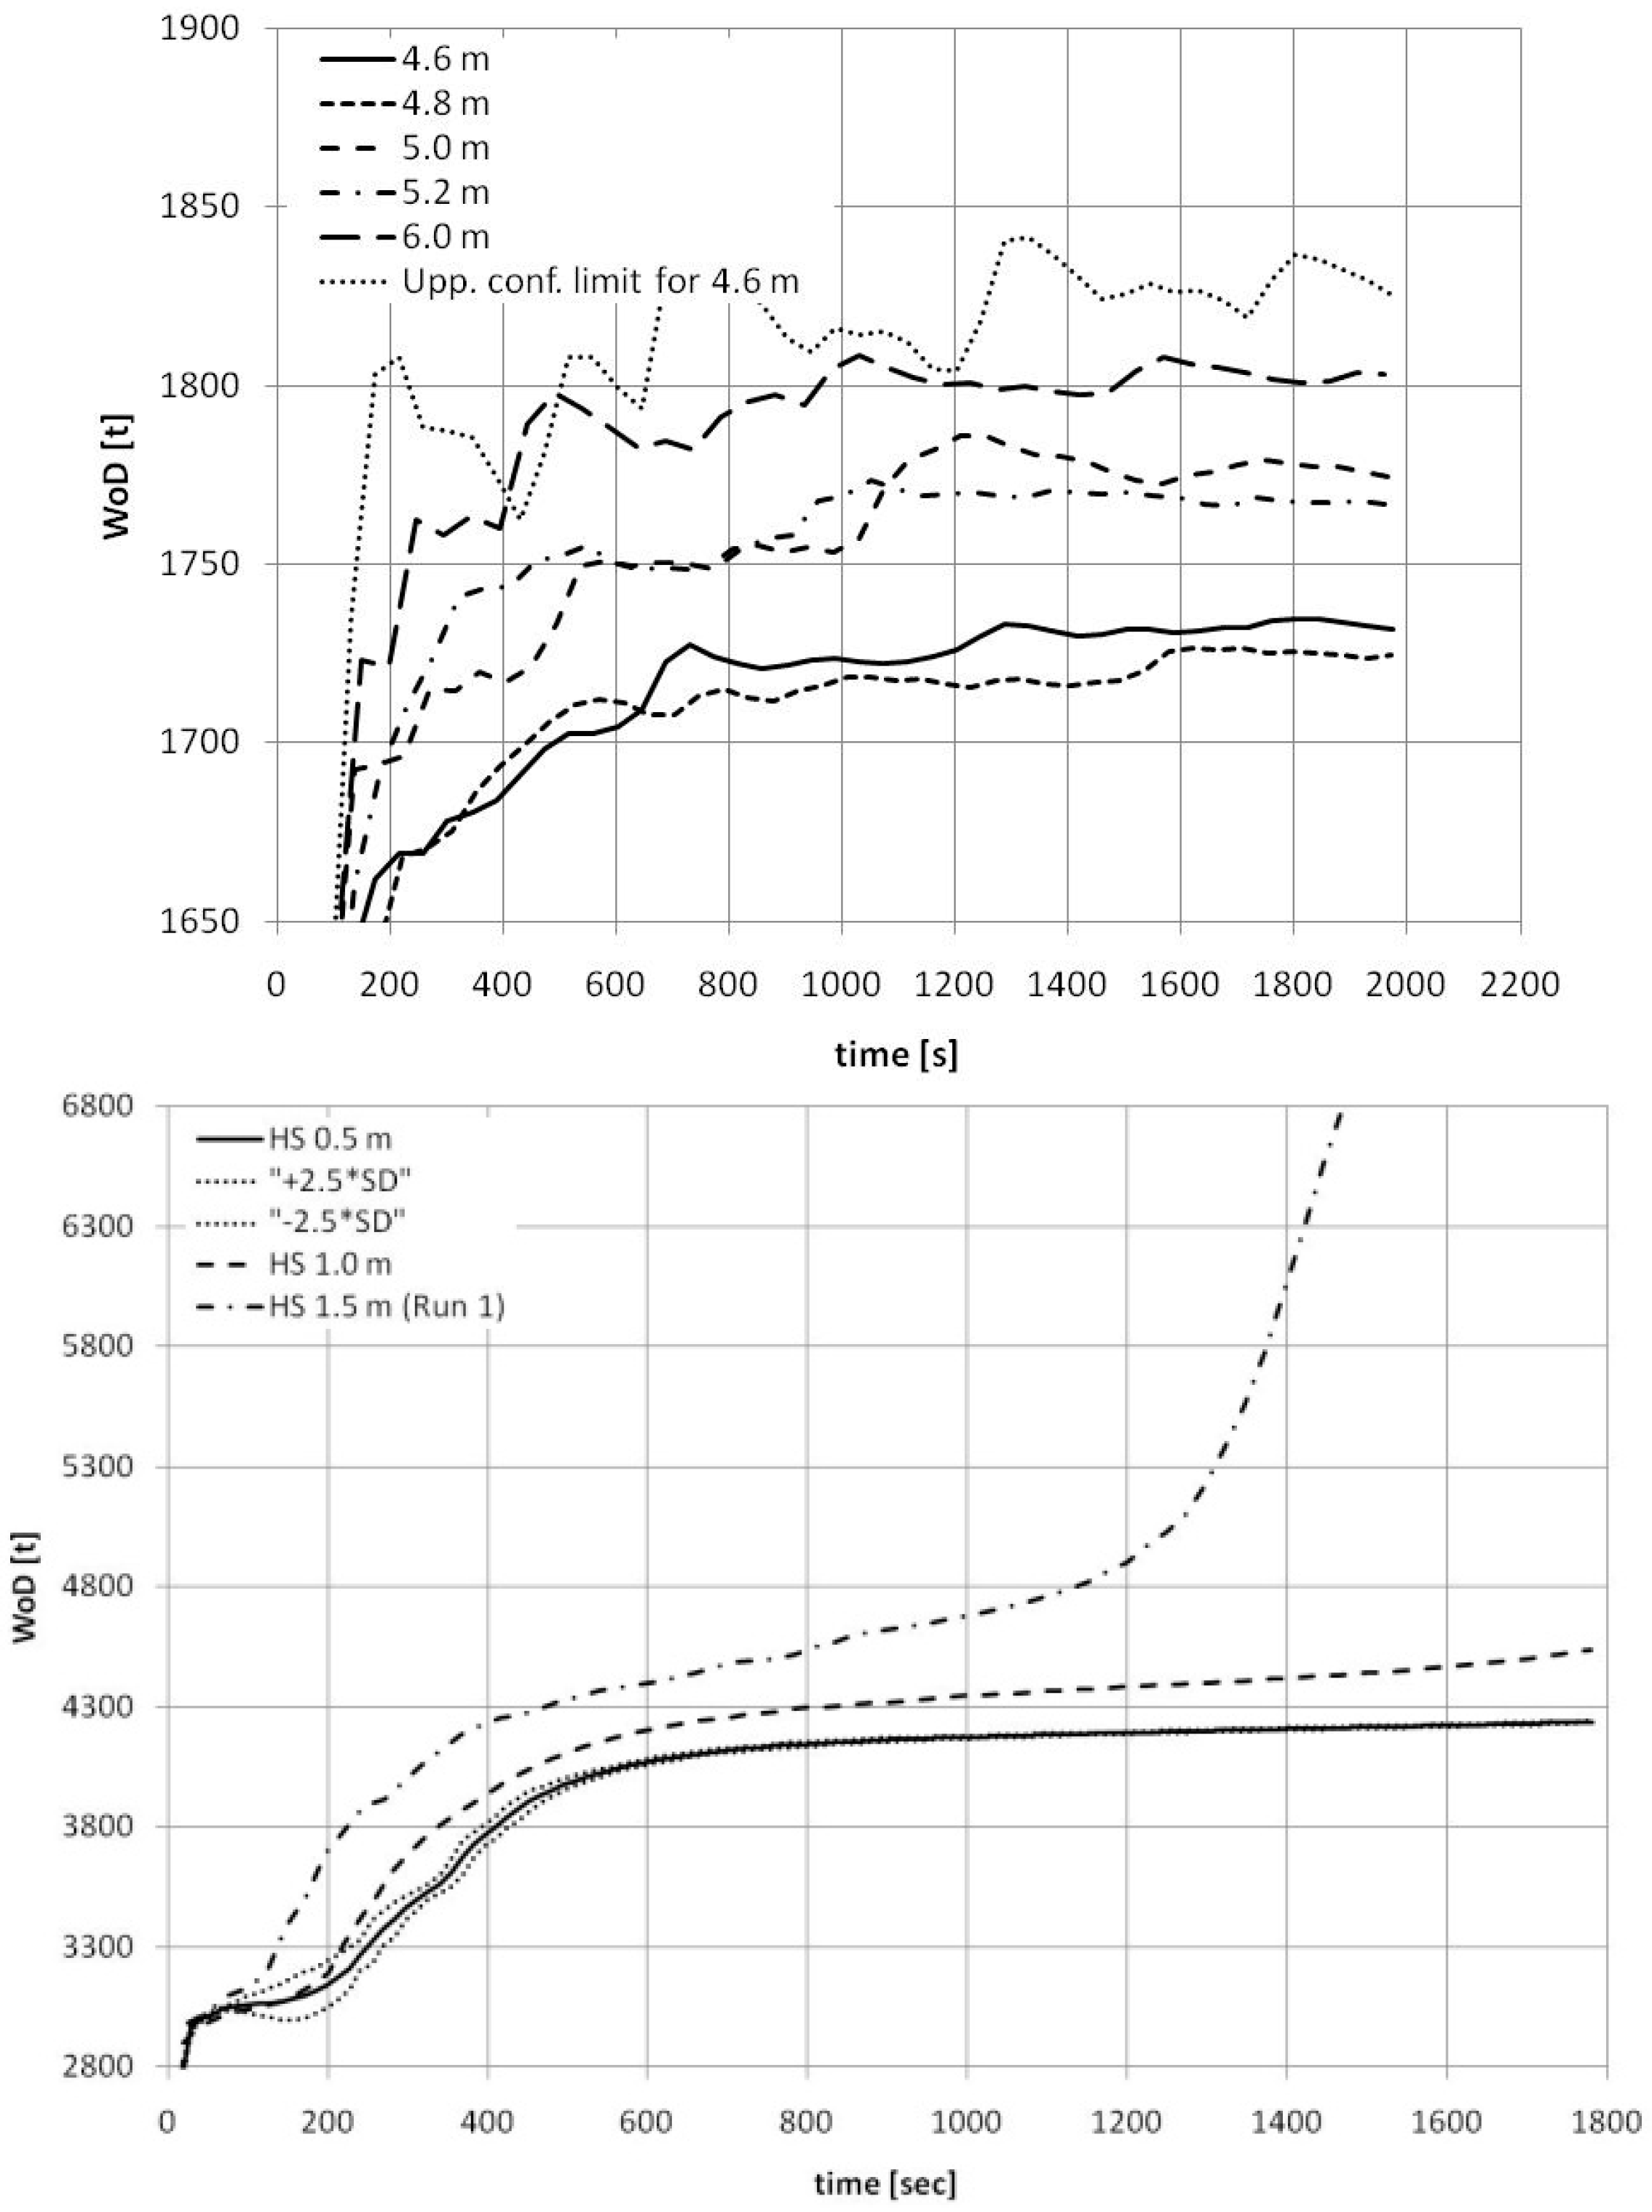
The analysis, in spite of certain mathematical deficiencies, conveyed very important information. Firstly, it has been noticed that the 95th percentile curves were asymptotic, i.e., all the surviving cases were limited by a horizontal asymptote whilst a slant asymptote indicated underlying progressive flooding; the latter cases would often result in a loss.
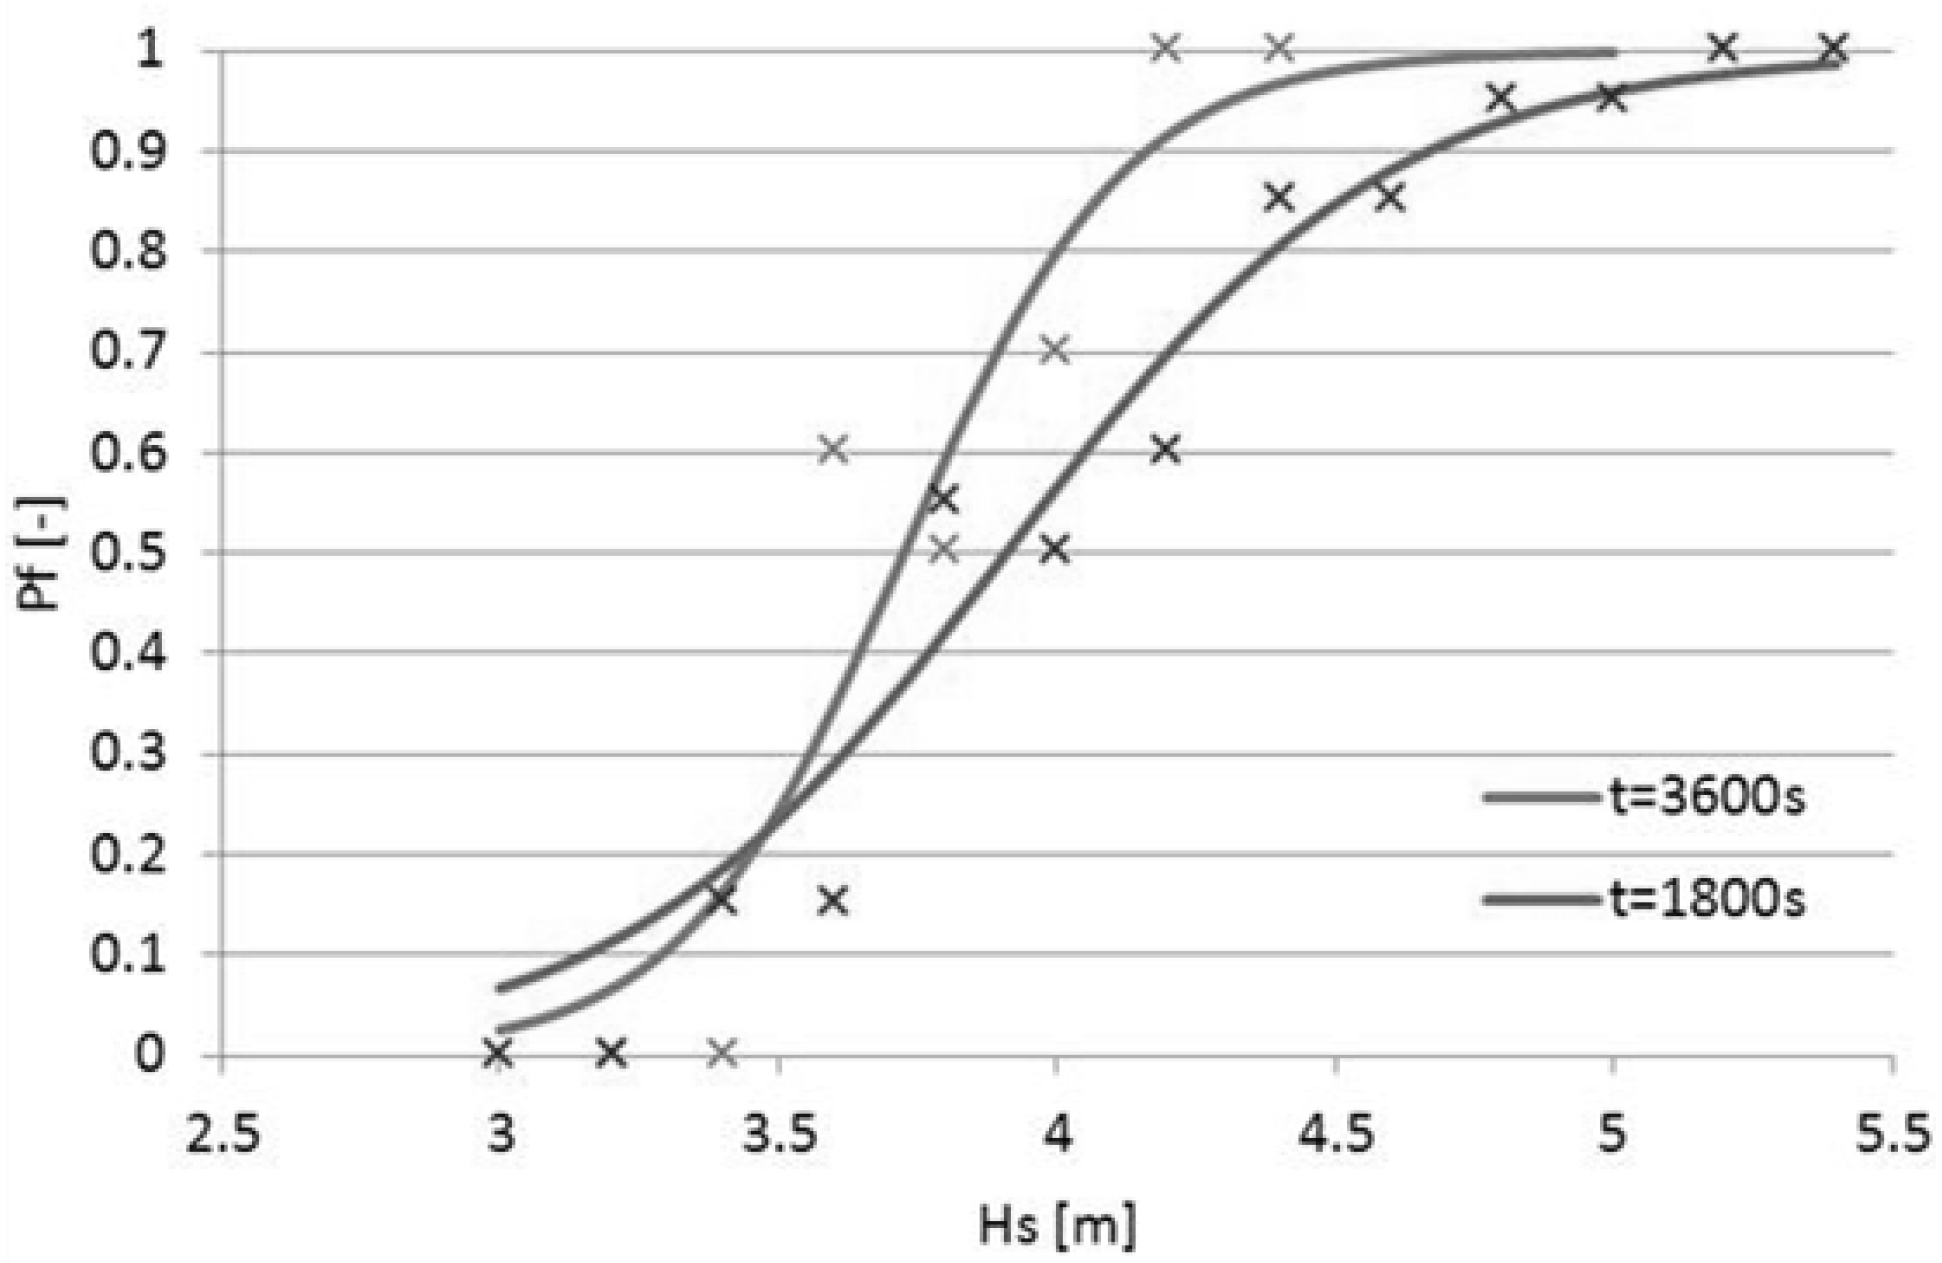
Secondly, although the limiting amount of floodwater would vary with H
S, such variability proved to be statistically insignificant (
i.e., individual realisations would generally fall within confidence bands of the realisations of sea state corresponding to the lower boundary of the capsize band, e.g.,
Figure 2).
Furthermore, in most of the cases, should the floodwater characteristic of any particular realisation exceeded (by some statistically significant amount) the upper confidence limit calculated for the lower boundary of the capsize band this would be a clear indication of subsequent loss, see
Figure 3.
The final outcome of the WoD analysis was that the flooding process of the surviving cases could be characterised by a statistically unique (for any given damage) limiting mass of floodwater, independent of sea-state and time of exposure. It is important to note that the limiting amount of floodwater coincides with the quantity obtained for the highest sea-state at which no losses were observed—the lower boundary of the capsize band. Increasing the sea-state further does not have an impact on the limiting value but it simply increases the probability of exceeding it (i.e., the higher is the sea state the higher is the probability that the limit amount of floodwater will be exceeded and the ship will capsize). This probability is dependent on time of exposure—in the extreme case of infinite observation time, all realisations in sea-states higher than the lower capsize boundary would at some point experience floodwater accumulation in excess of the critical mass and face inevitable loss (this is well in-line with the unit-step representation of the capsize band).
3. The s-Factor Development
The GOALDS project utilised to a large extent the knowledge generated by the past decades’ research. One of the important lessons learnt was that the key problems of the earlier studies were due to insufficiently diversified sample (in terms of ship types, sizes and internal arrangements) and that the parameters used for regression models were often selected in an arbitrary fashion. In order to avoid similar issues a decision was made to base the development primarily on the numerical results and use the physical experiments mainly for the model verification. This combined with reasonably diversified sample allowed for generating dataset large enough for the systematic parametric investigation.
3.1. Physical and Numerical Survivability Tests
In order to generate the dataset large enough for parametric investigation a significant number of physical tests and numerical simulations were performed with use of several ship models operating at different loading conditions. Although all the ships were subdivided according to SOLAS ’90 (pre-SOLAS2009 vessels) special attention was paid to diversification of the sample—ships varied in size and the subdivisions included stability enhancing features above the traditional bulkhead deck (e.g., side-casings) as well as large unsubdivided cargo spaces below the deck (Long Lower Hold). The GOALDS sample was further supplemented by the ships investigated within the HARDER and EMSA projects.
In total the sample consisted of over twenty various RoPax designs and three cruise ships (small, medium and large).
3.2. Probability of Surviving Collision Damage
Before proceeding further with the results of parametric modelling it might be worthwhile to look into the underlying concepts (though not explicitly referenced to in the SOLAS convention) making the s-factor a measure of ship survivability in waves.
Formally the probability of survival following collision, hull breach and flooding is given as [
15]:
where:
is the probability density distribution of sea states expected to be encountered during collision and
is the probability of survival in that sea state when exposed to a specific flooding case.
It should be noted here that, given that all the tests performed during the s-factor development were limited to 30 min, the probability of survival is in fact a conditional probability:
Assuming that the probability of survival,
, can be approximated by a unit step function centered on the sea state the Hs
crit constitutes the 50th percentile significant wave height the vessel subjected to particular damage scenario may survive for 30 min (this corresponds to the abscissa of the inflection point of the sigmoid obtained for
t = 30 min and is in line with the previous research):
It should be noted that although replacing the pf distribution with the step function is in this particular case supported with little evidence, it “does the trick” and allows the integration to be avoided with negligible impact on accuracy of the prediction (for as long as the bandwidth of the capsize band is narrow).
Eventually, the final formulation becomes:
where the
HS crit is given as:
In the essence, the approach adopted within the GOALDS project is consistent with other research projects on ship survivability, particularly HARDER and EMSA. To this end the only major difference stems from the adoption of the lower capsize boundary as HS crit and subsequent time invariance of the probability of capsize. At this stage it becomes apparent that the postulated flaw in s-factor (i.e., its inaccuracy) must have been related to the improper or incomplete parametric model.
3.3. Study on Dominant Parameters
In spite of the extensive use of numerical simulations the sample size available within the GOALDS project did not allow for performing the sensitivity analysis based solely on advanced techniques like Design of Experiments (DoE). Due to limited resources not all desired parameters (such as damage extent, loading conditions, etc.) could have been varied to the extent required by, for example, the full factorial design of experiments hence the test matrix (i.e., selection of design variables) had been designed based mainly on past experience and critical reasoning on the outcome of the previous research with only minor amendments introduced during the course of tests whereas the DoE methodology was primarily used to derive response surface models of HS crit as a function of design/damage attributes.
The initial step involved investigation of the present SOLAS s-factor in order to conclude whether the
GZmax and
Range are sufficient to predict accurately the critical significant sea-state for the generated sample. In order to verify this, the H
S crit was calculated with use of the underlying SOLAS model (as given by Equation (7)) and with full quadratic response surface model (denoted in the following as
DoE) and given as
where,
are the regression coefficients and
stand for
GZmax and
Range, respectively.
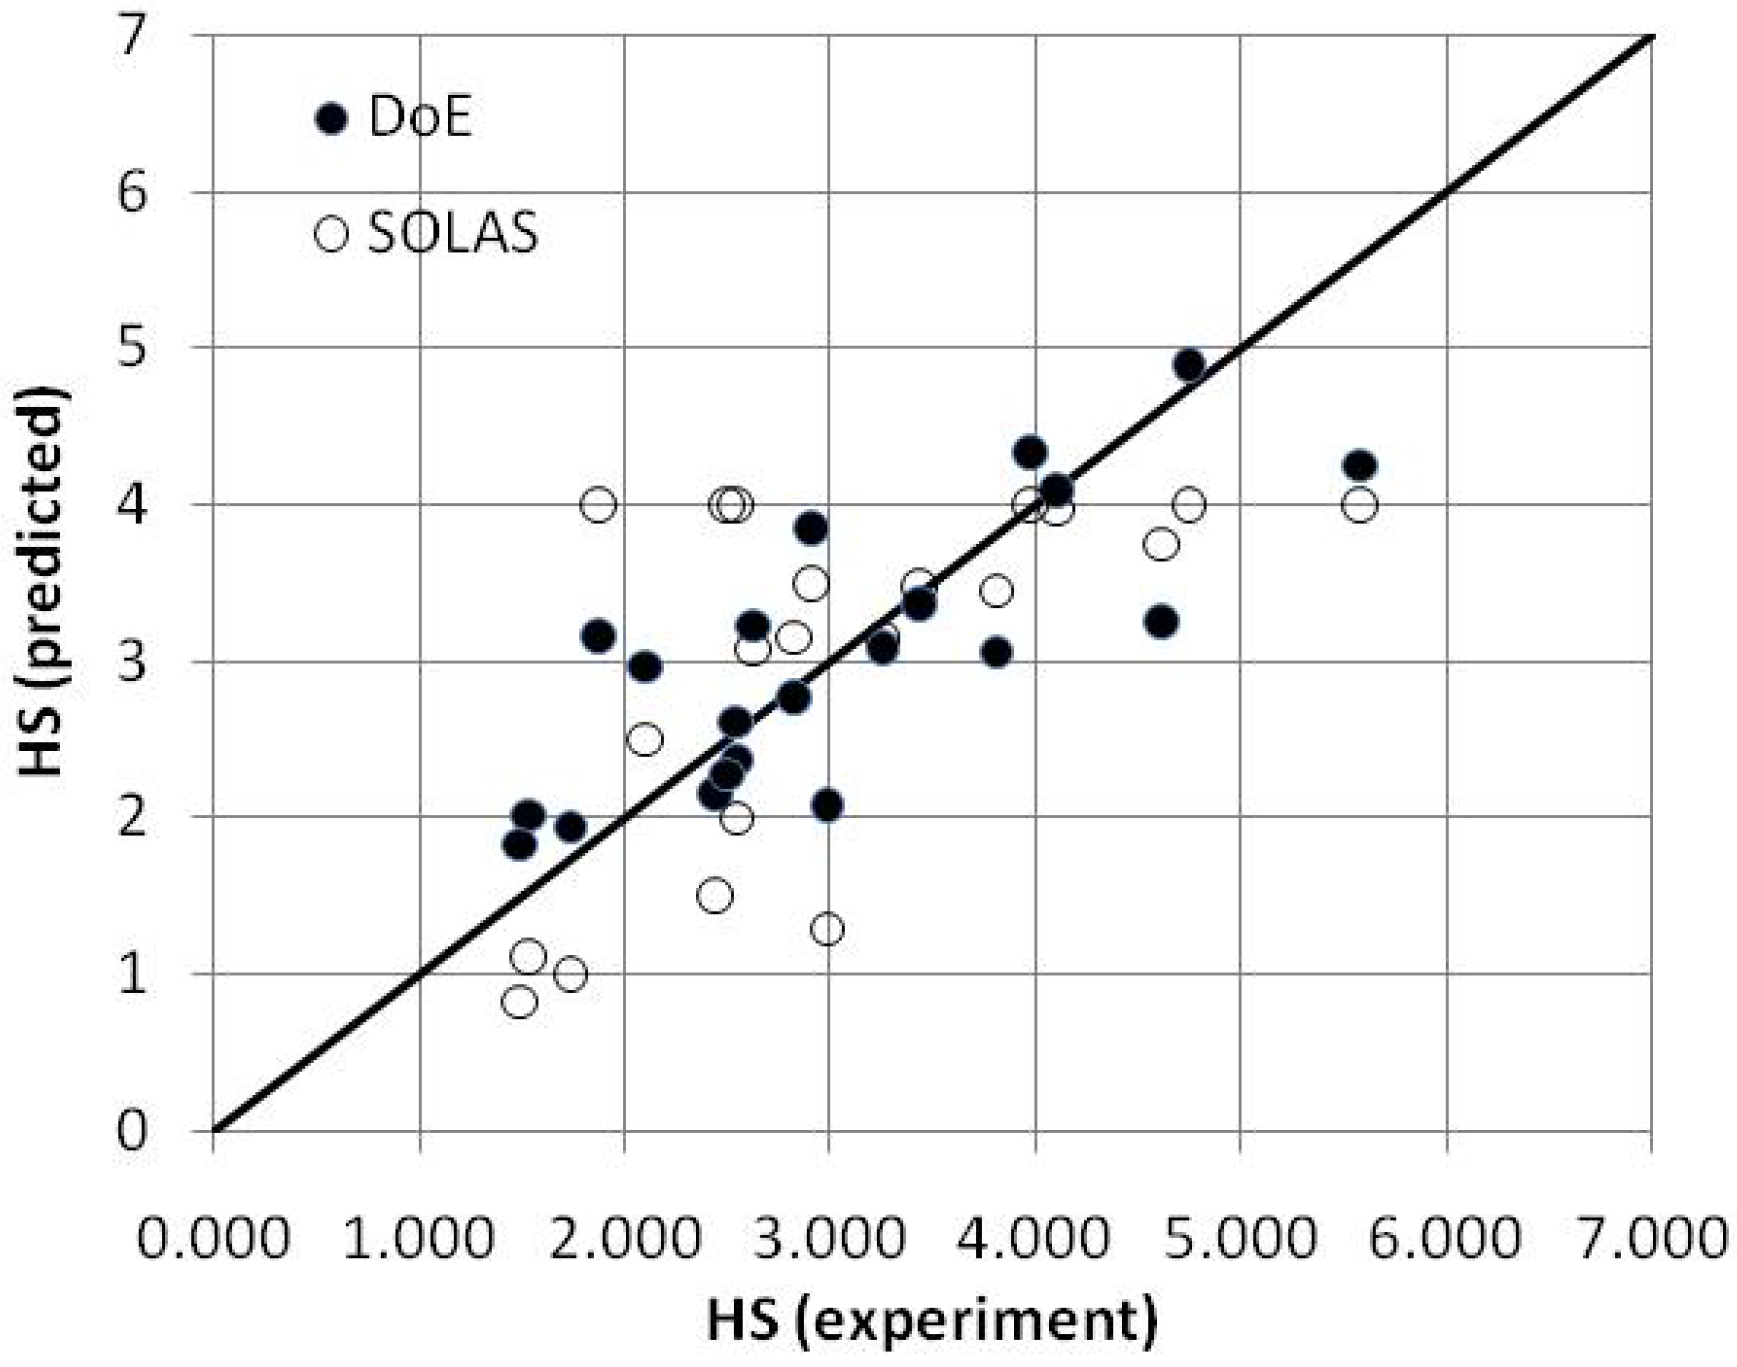
The results (see
Figure 4) showed that both SOLAS and DoE methods failed to accurately predict the
HScrit. The use of a relatively complex model slightly improved the quality of fit (the correlation coefficient increased from the initial value of 0.64 to 0.79) but the exercise only proved that
GZmax and
Range alone are insufficient to estimate the critical sea state.
3.4. Effect of Scale
The analysis of results pertaining to small and large vessels (from the GOALDS sample), revealed that the significant scatter in results can be attributed to the effect of scale (
i.e., dimensions of the actual ships). Indeed, one of the major concerns related to the SOLAS’s s-factor was that it does not account for the ship’s size, which was thought toresult in inaccuracies in predicting survivability of vessels deviating significantly in size from the PRR01, used as a basis (68% of HARDER data points [
9]) for its derivation.
In addition to this, the SOLAS 2009 s-factor formulation (based solely on characteristics of the residual GZ curve) is limited to relatively small range and maximum GZ values and therefore it tfails to account for the contribution from watertight volume distributed high enough to be “unseen” by the formulation. This deviates from the good Naval Architecture practice previously expressed through the explicit demand for provision of the residual freeboard.
In order to take the size into consideration the next step of the development involved adding to the initial set of parameters a factor that can best be described as a measure of centroid of the residual volume given, as follows:
where,
VCB T and
VCB D, are vertical centres of buoyancy of the intact and damaged compartments (intact and residual watertight envelopes), respectively, and
T stands for draught in intact condition. Based on this, the experimental data was approximated by the following regression formulae:
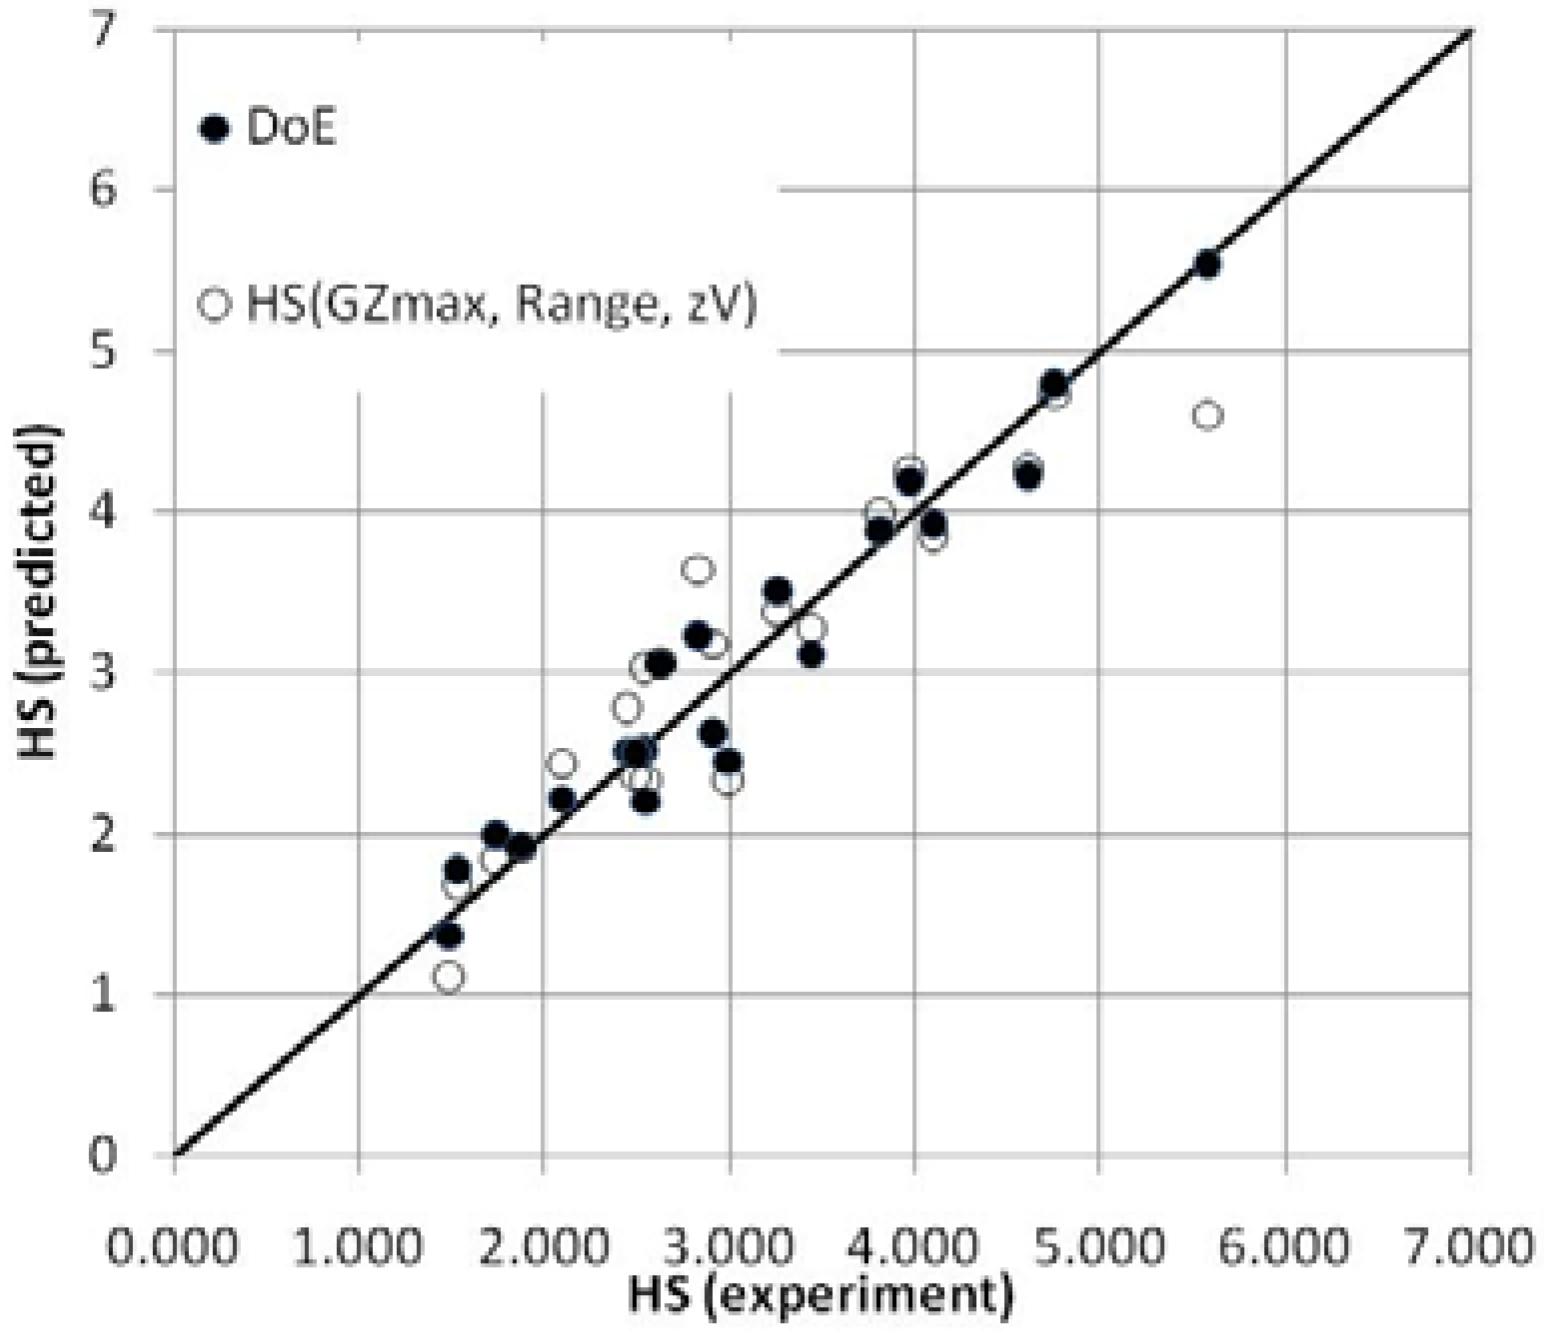
As a result the formula offered very accurate prediction with 0.93 correlation with the experimental data. Furthermore, applying DoE to the new parameter set led to a correlation coefficient of 0.97—a good indication that the size of the ship was indeed the missing parameter (see
Figure 5).
The major concern of using a regression-based formulation is the possibility of over-reliance on the particular dataset used for its derivation and possible unreliability while applying it for a completely different sample (e.g., the innovative ships of the future).
On the other hand, the formula proved that GZ curve related parameters complemented by the geometrical characteristics of a damage (residual volume in some form) are sufficient for predicting the survival sea-state. Furthermore, during the analysis of the experimental and numerical data it had been found that one of the parameters to which the HS crit is particularly sensitive is the residual metacentric height, GMf (GM of the flooded ship). Hence in the final stage an attempt was made to bring stability characteristic (GZ curve properties) and size of the ship into a formula of possible physical significance.
3.5. Final Formulation
Summarising the foregoing, all investigations led to the conclusion that the parameters to be included in the s-factor formulation should include as minimum the GZmax, Range, some measure of the residual volume (VR) and GMf. Moreover, the ensuing formulation, i.e., should have some degree of physical significance in order to minimise overreliance on a specific data set. On this basis, an analytical expression was sought using a combination of the above parameters, as presented in the following.
In order to simplify the modelling process it was assumed that a GZ curve can be, within the range of positive stability, approximated by an isosceles triangle of basis equal to
Range and height equal to
GZmax. In such a representation the following relations would hold:
On this basis the following expression was tested as a first step, deriving from simple dimensional analysis:
As this expression produced slightly conservative results, the additional parameters were introduced through various algebraic manipulations and tested against the experimental results. Firstly, multiplying the numerator and denominator of the Equation (12) by half-Range, as shown in the Equation (13) resolved the issue of biased (conservative) prediction, which was due to approximating the GZ curve with an isosceles triangle. Furthermore, it was observed that the numerator of the Equation (13) is nothing else as an area of a triangle of basis equal to
Range and height equal to
GZmax. Hence, in the final expression, the Equation (14), it was replaced by the explicit reference to the GZ area and introducing Range and A
GZ, respectively, led to significantly improved accuracy.
Deriving from the above, the survival factor, s, is given by the following expression:
4. Validation and Additional Considerations
4.1. Physical Significance
The following figure shows a graphical interpretation of a ship’s step-response to some external moment, represented on the GZ curve as the heeling lever, . The underlying assumption is that the ship is floating in calm water (i.e., impact of waves on restoring moment is not considered) and that the external moment is given as . Furthermore, it is that , , and , and stand for water density, gravity acceleration and displacement (volumetric) of the ship.
The angles shown in the
Figure 6 below are respectively
- −
Angle of static equilibrium,
- −
Angle of heel due to static action of the external moment(stable dynamic equilibrium),
- −
Angle of dynamic heel,
- −
Angle of unstable equilibrium (angle of capsize),
- −
Angle of vanishing stability,
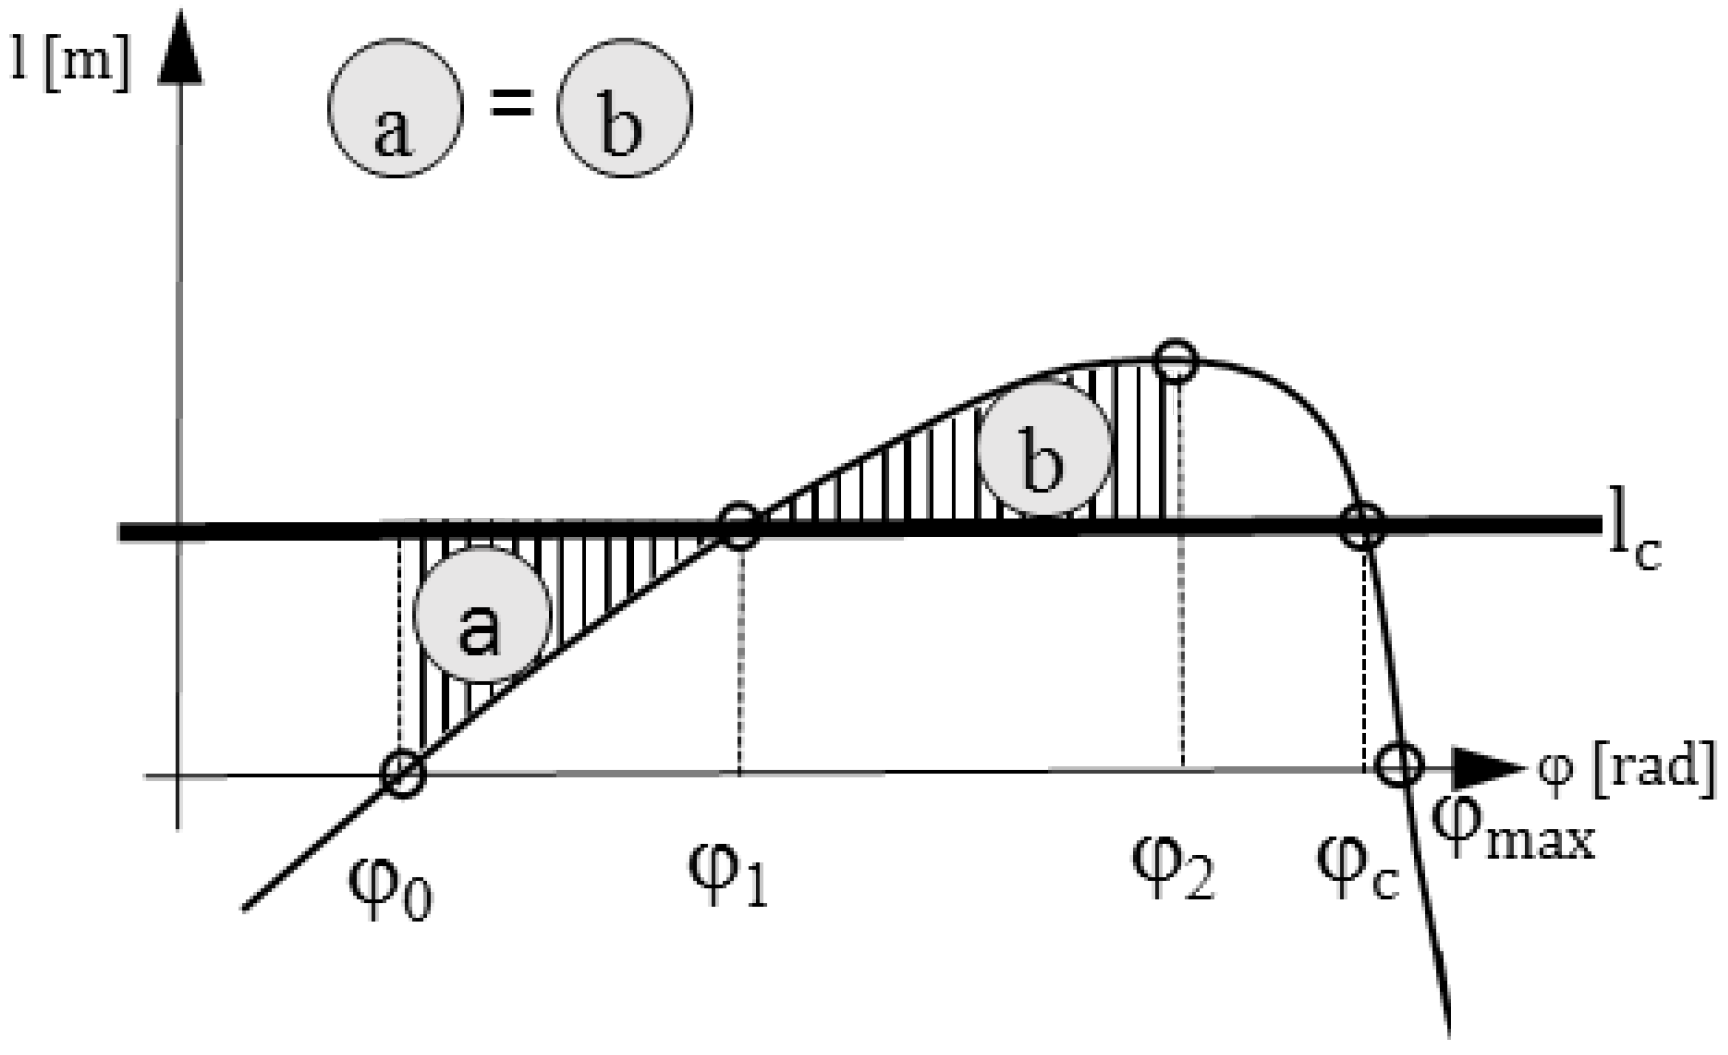
The condition “a” = “b” indicates equilibrium condition in which work of the heeling moment is equal to the change of ship’s potential energy.
From the above it follows that the heeling lever
corresponds to the mean value of the righting lever
within the interval
,
i.e.,:
Furthermore, the definition of GM implies that:
Therefore, combining Equations (17) and (18) yields
The above equation shows that the angle of dynamic equilibrium can be approximately given as a ratio of mean righting lever within the
range and the residual metacentric height,
. In GOALDS formulation the RHS of the above equation is calculated with upper limit corresponding to the point of vanishing stability (point of no return),
i.e.,
. In such a case the heeling lever
equals the mean value of the righting lever within the interval
, that is
and the Equation (19) becomes:
The above implies that the GOALDS’
is proportional to work done by the external heeling moment over the interval
,
i.e.,
:
where
can be calculated as
Finally, in order to satisfy the condition that for the specific
the resultant angle of dynamic heel
must not exceed the angle of unstable equilibrium,
(angle of capsize),
i.e., it must be that
and therefore:
After rearranging the condition,
can be written as
That is, the average value of the righting lever over the interval
,
must not exceed the average value of the righting lever within the range
. This implies that if the condition is not met the critical significant wave height,
, could be calculated as follows:
4.2. Accounting for the Presence of Openings
In case of present unprotected openings (e.g., semi-watertight doors, down-flooding points
etc.) within the range of the residual GZ curve, the critical significant wave height should be derived from the following expression:
where
AGZ E is an effective area under the GZ curve taken up to the heel angle,
corresponding to the submersion of the opening in question.
4.3. Transient Capsize
As already mentioned, the evidence collected during the initial stages of the development suggested clearly that both modes of the gradual loss,
i.e., capsize and sinking, can be handled with the use of the same formulation but in case of a rapid capsize resulting from sudden floodwater ingress, a different formulation is warranted [
16]. In this respect, it is proposed to assess vulnerability to transient capsize with the use of the following expression, based on well-known energy balance:
where,
Eϕ is a dynamic righting lever (integral of the residual GZ curve) up to the heel angle of submersion of the unprotected opening,
D is displacement of intact ship, and
mfi and
yfi are mass and transverse centre of mass of floodwater respectively. The vulnerability check should be performed for all the flooding stages, and the final
k is simply a product of
ki. This results in the following expression:
The binary nature of k is dictated mainly by the need to highlight those damage cases that require special attention and unless a detailed investigation is performed they should not contribute to the A-Index summation.
4.4. Time to Capsize
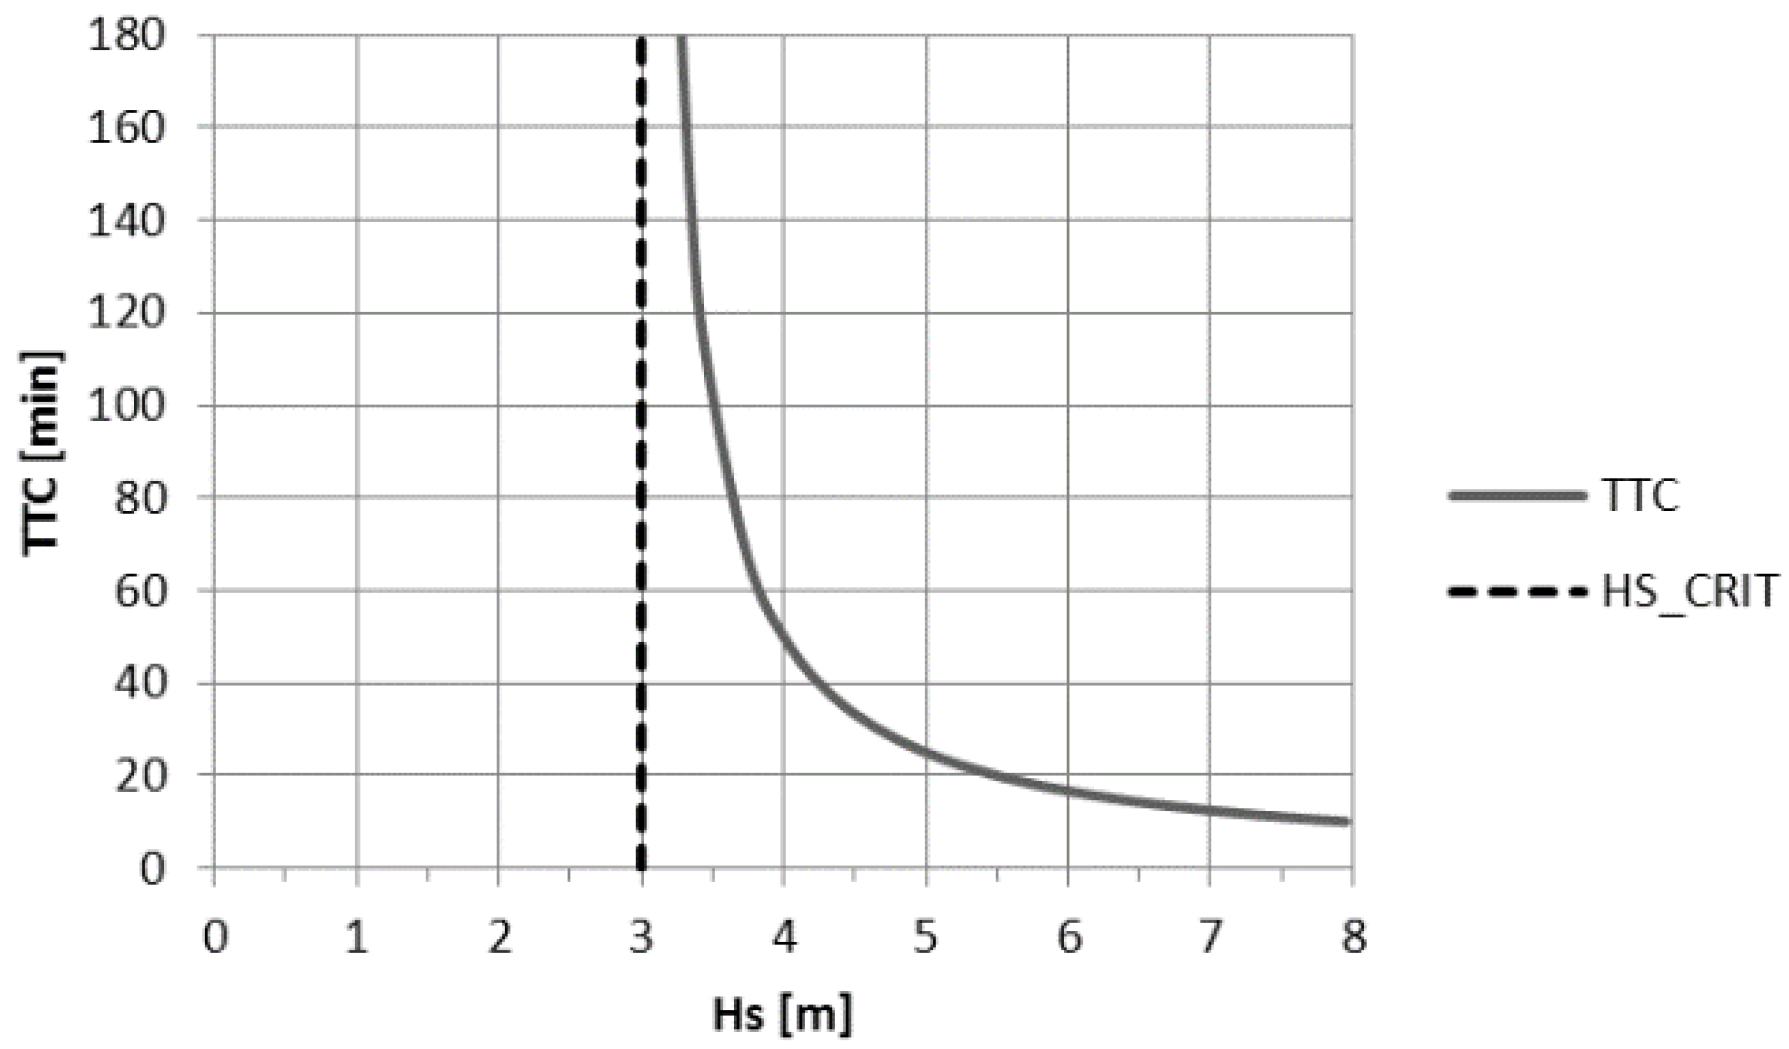
In sea states exceeding the critical significant wave height, the probability of survival and time to capsize decrease, the first following a sigmoid pattern [
13,
17], the latter according to a hyperbolic manner as graphically explained in
Figure 7 [
17].
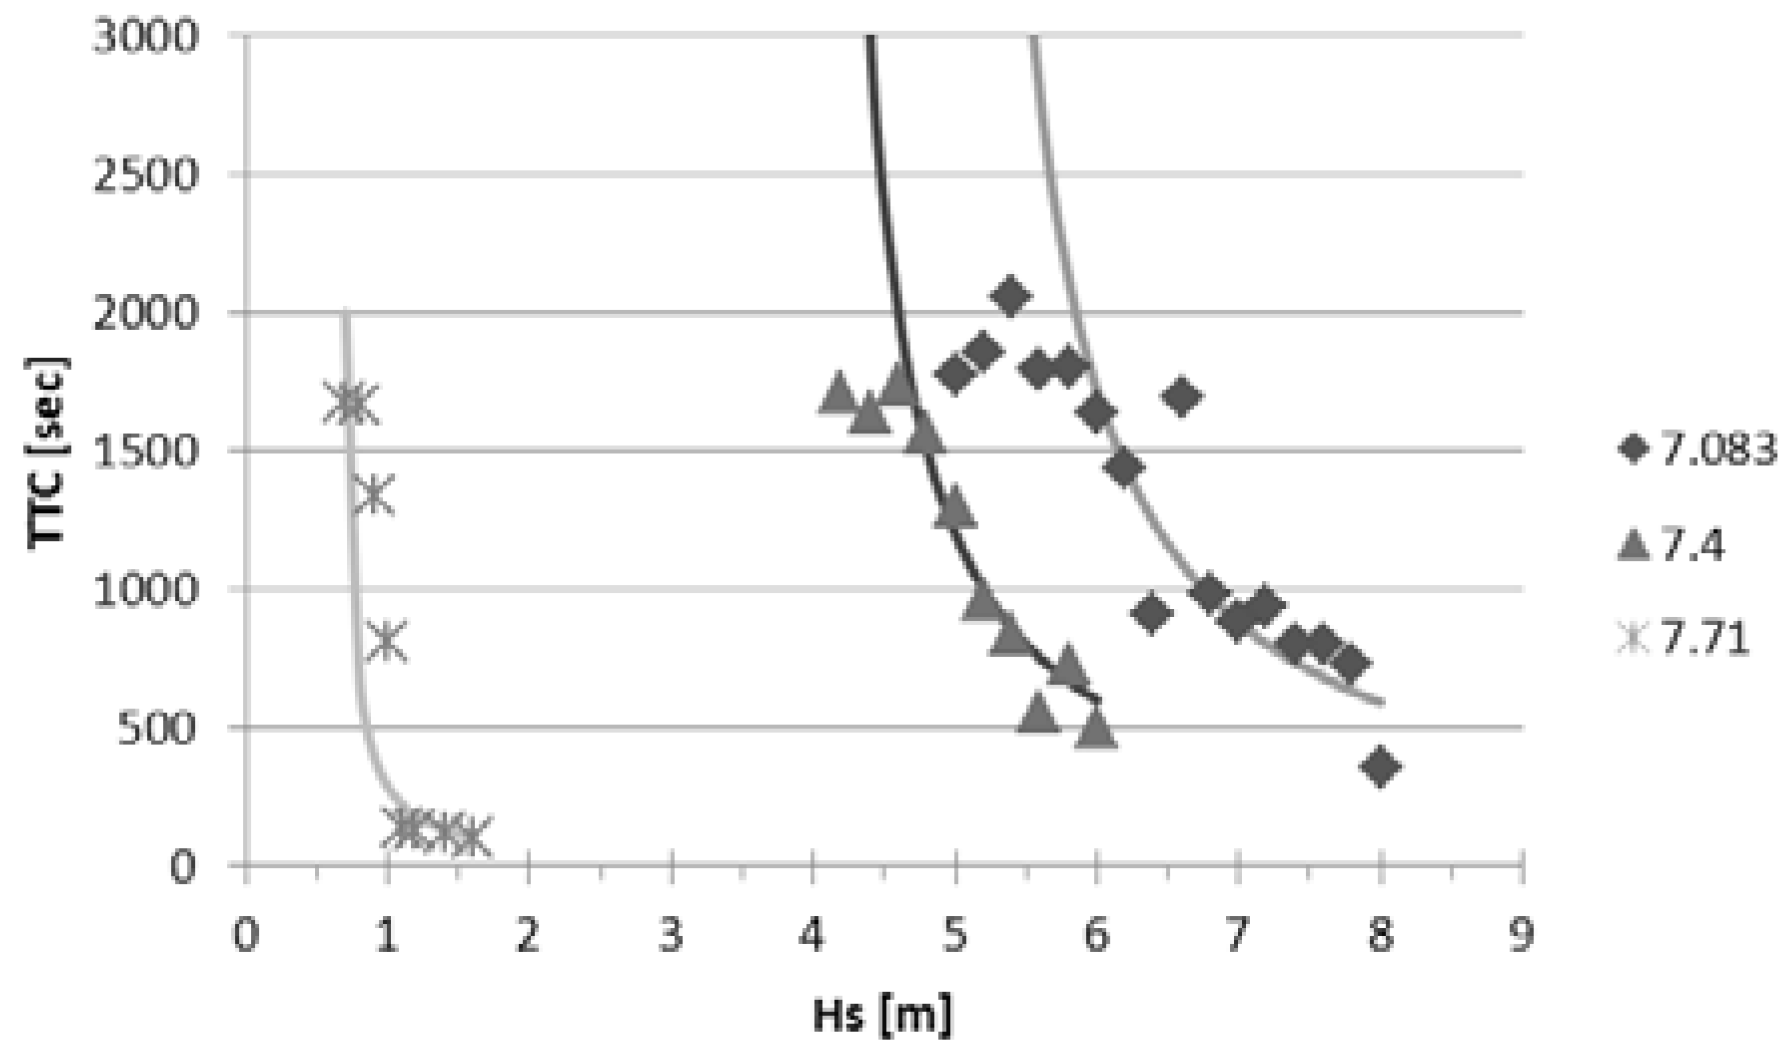
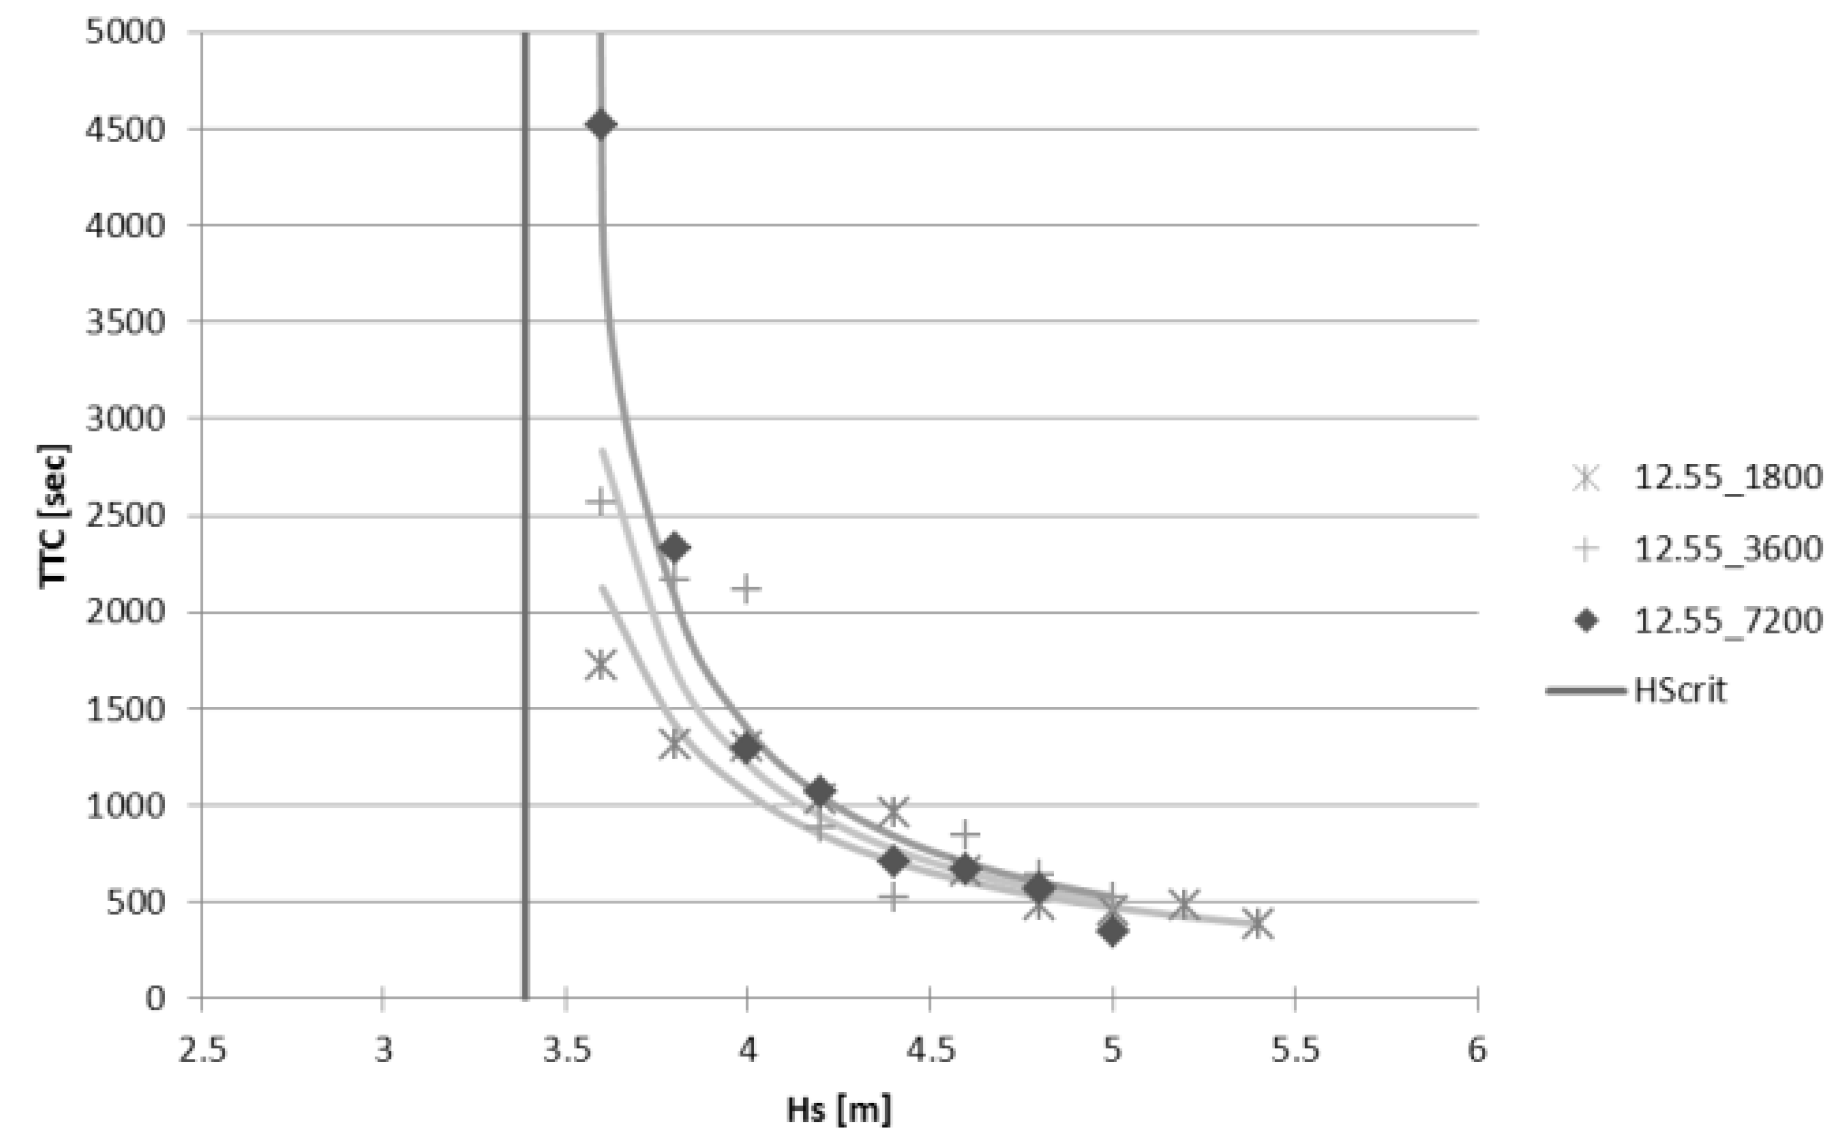
The hyperbolic behaviour of the TTC can be captured by the following formulae.
Following a systematic investigation of the acquired data, the observation was made that parameter “a” appearing in formulation (29) can also be linked with Hs
CRIT as shown in
Figure 8, where curves for various ships and damages have been plotted together (each point in the
Figure 8 corresponds to the average TTC of at least 10 realisations of each sea-state).
Figure 9 depicts this relation for various experimental data, derived by means of numerical simulations. The continuous line is the regression model which can be found in the Equation (30).
Figure 10 below shows impact of observation time on the behaviour of the model (single damage case).
4.5. Validation of the Proposed S-Factor
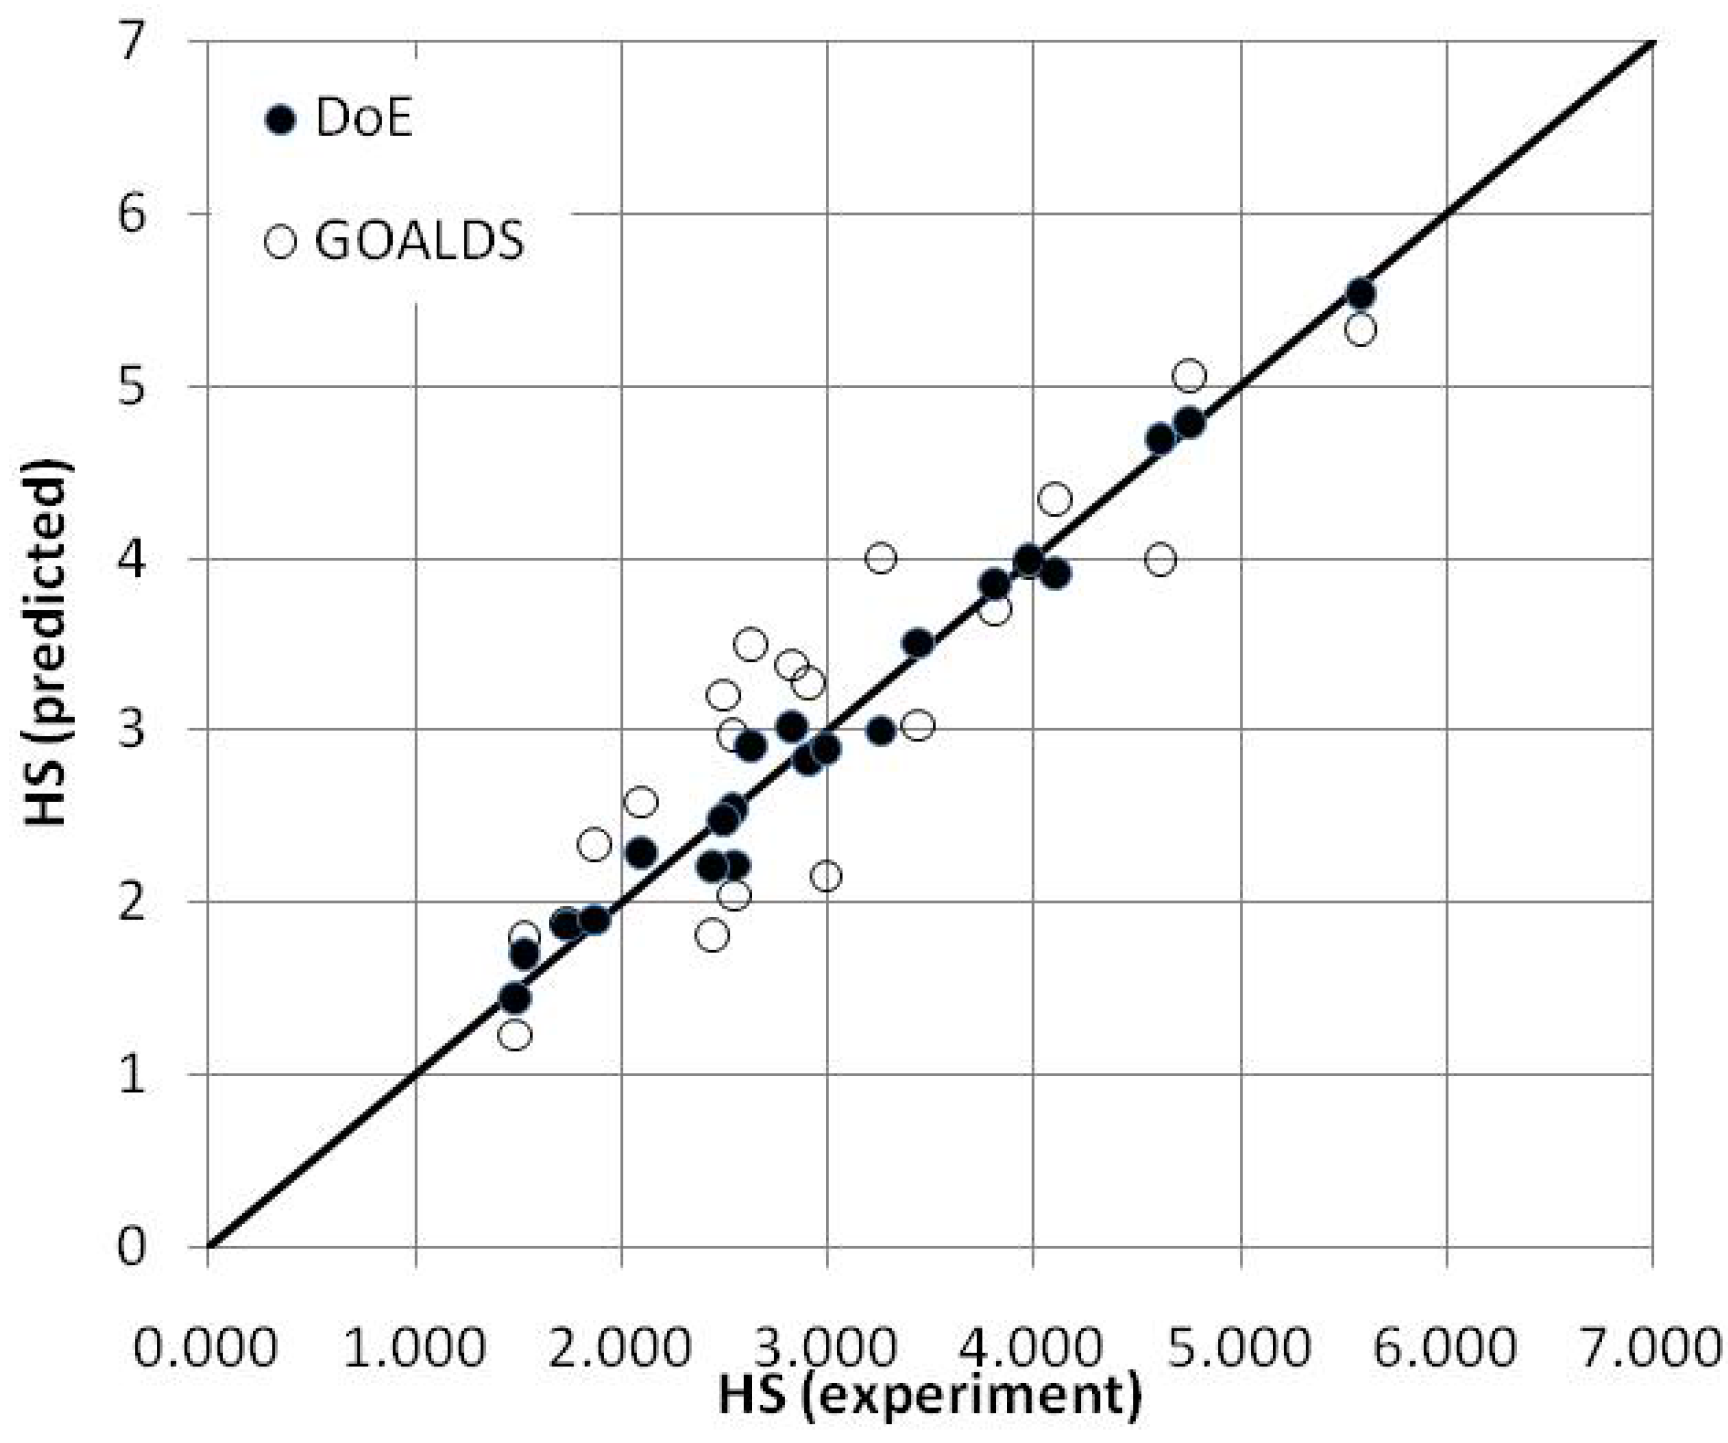
The first stage of validation aimed at verifying whether the chosen parameter set is sufficient for exhaustive description of the dataset. This was done by applying design of experiments (DoE) to the experimental data. The outcome from fully quadratic model constructed accounting for
,
and
resulted in 0.99 correlation with the experimental data, which was considered a satisfactory test concerning completeness of the parameter set (the correlation coefficient calculated for the GOALDS prediction was about 0.90, see
Figure 11).
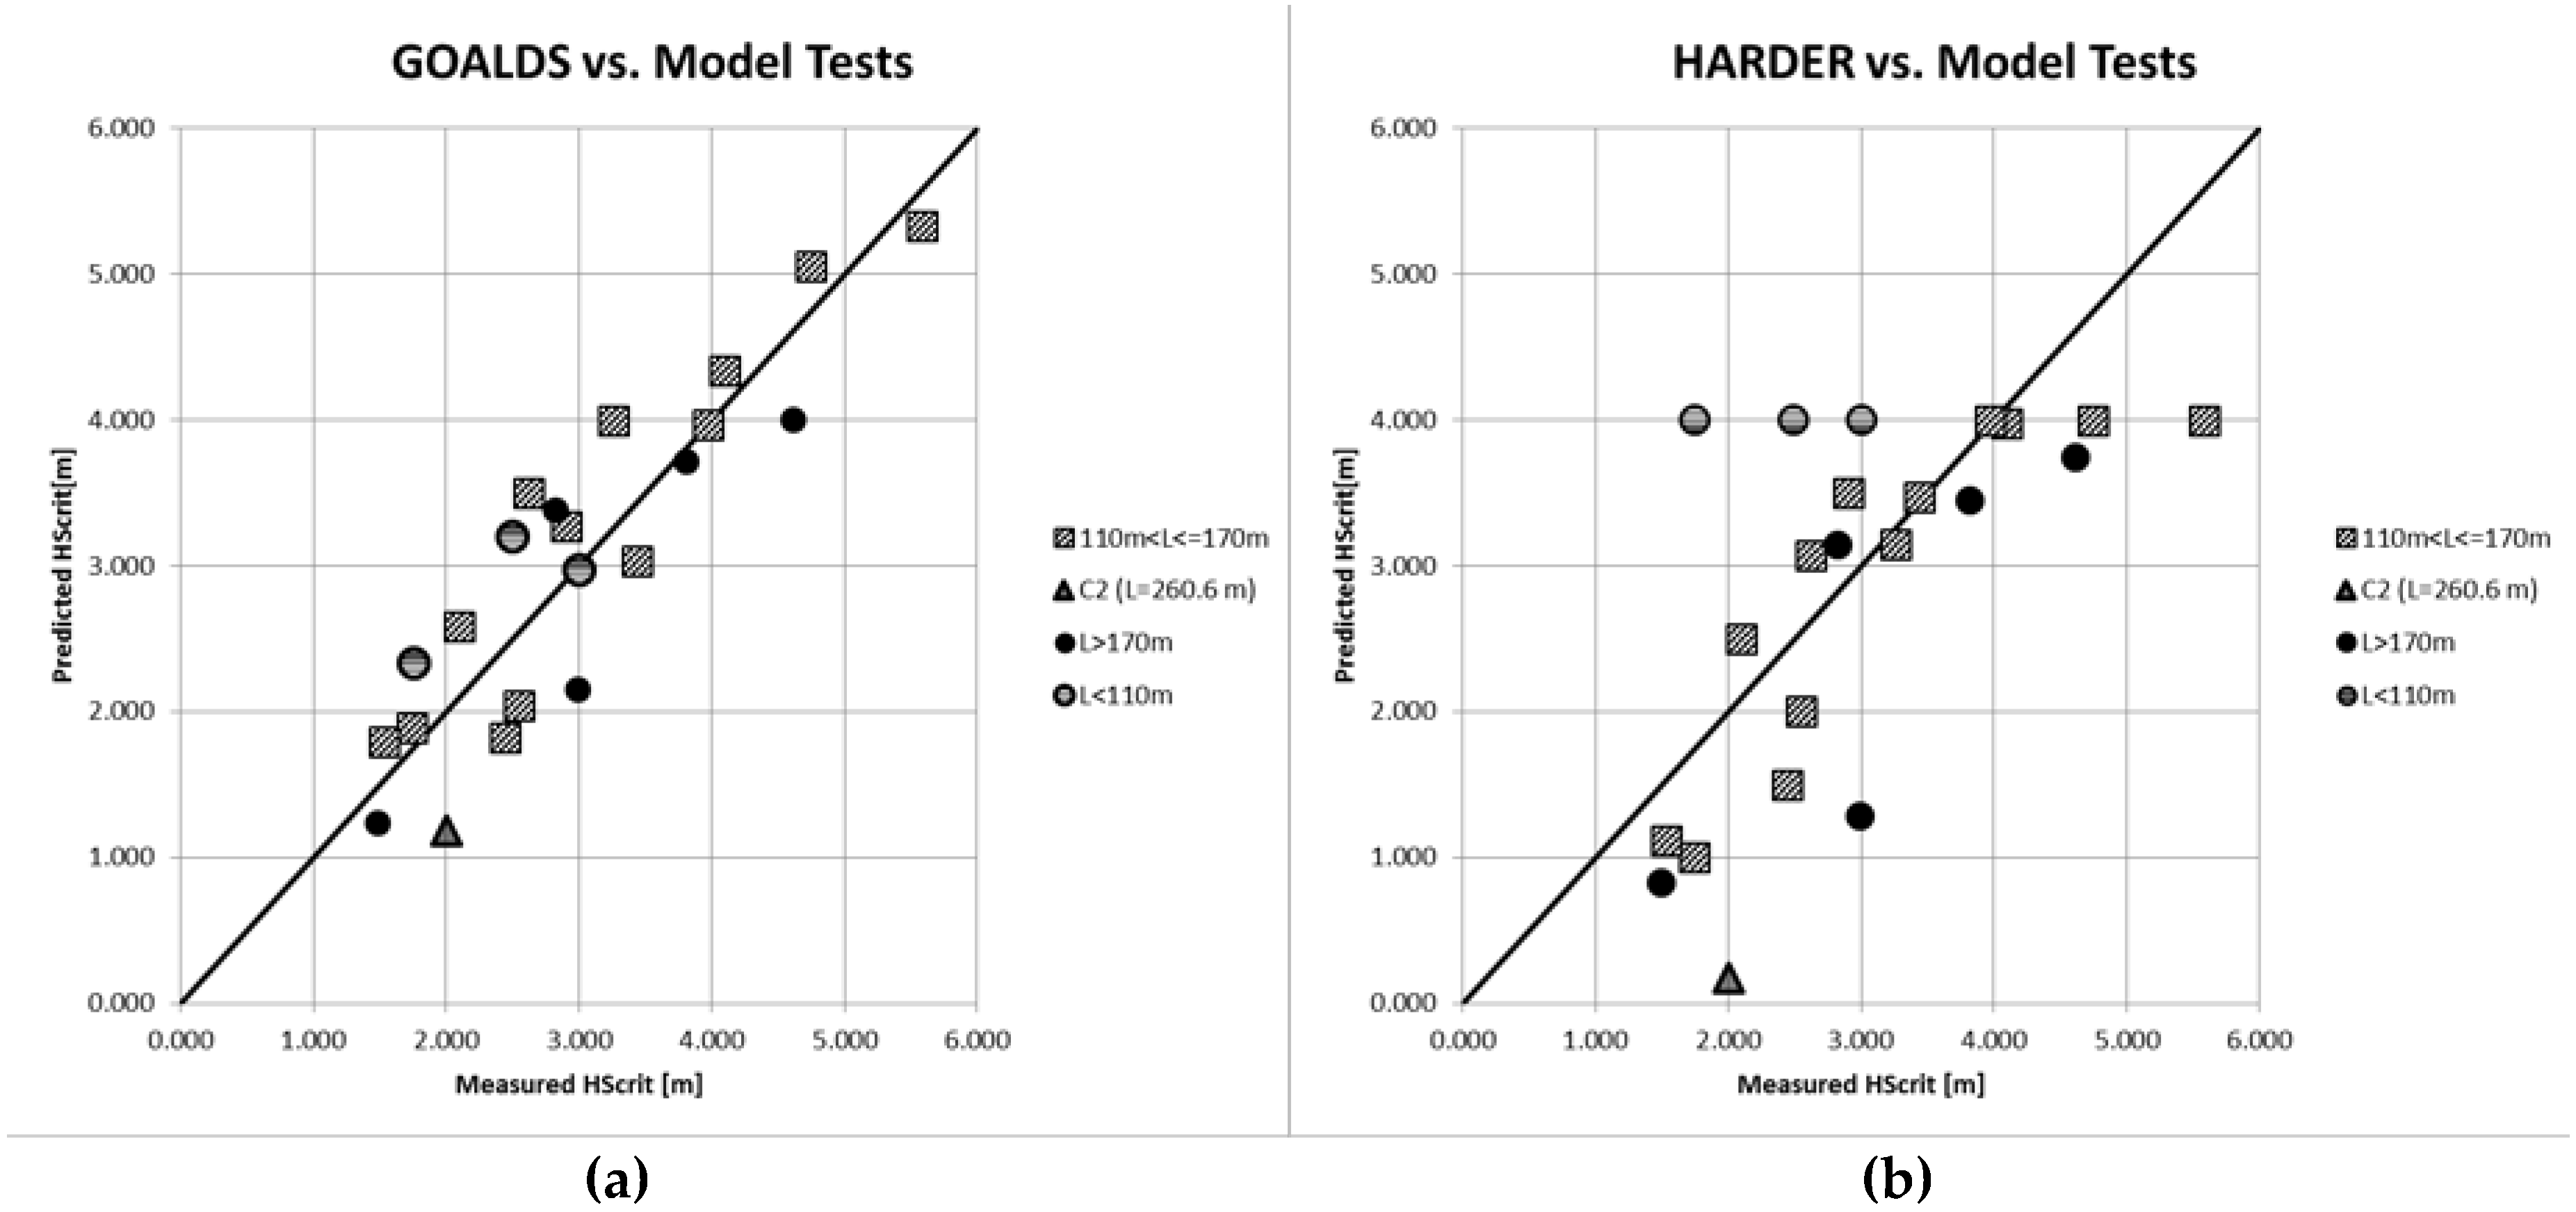
Another important aspect of the verification process concerned impact of ship’s size on accuracy of the prediction and as the
Figure 12 shows clearly, GOALDS formula accounts well for size of the ship with the prediction errors of similar magnitudes across all categories. On the other hand, the HARDER formula demonstrates significant variations in prediction errors depending on ship size. In case of GOALDS prediction, 100% of sample points fell within ±1.0 m from the measured
compared with much broader interval for harder data (−2.0/+2.5). The response surface model resulted in all the sample points falling within the ±0.5 m interval
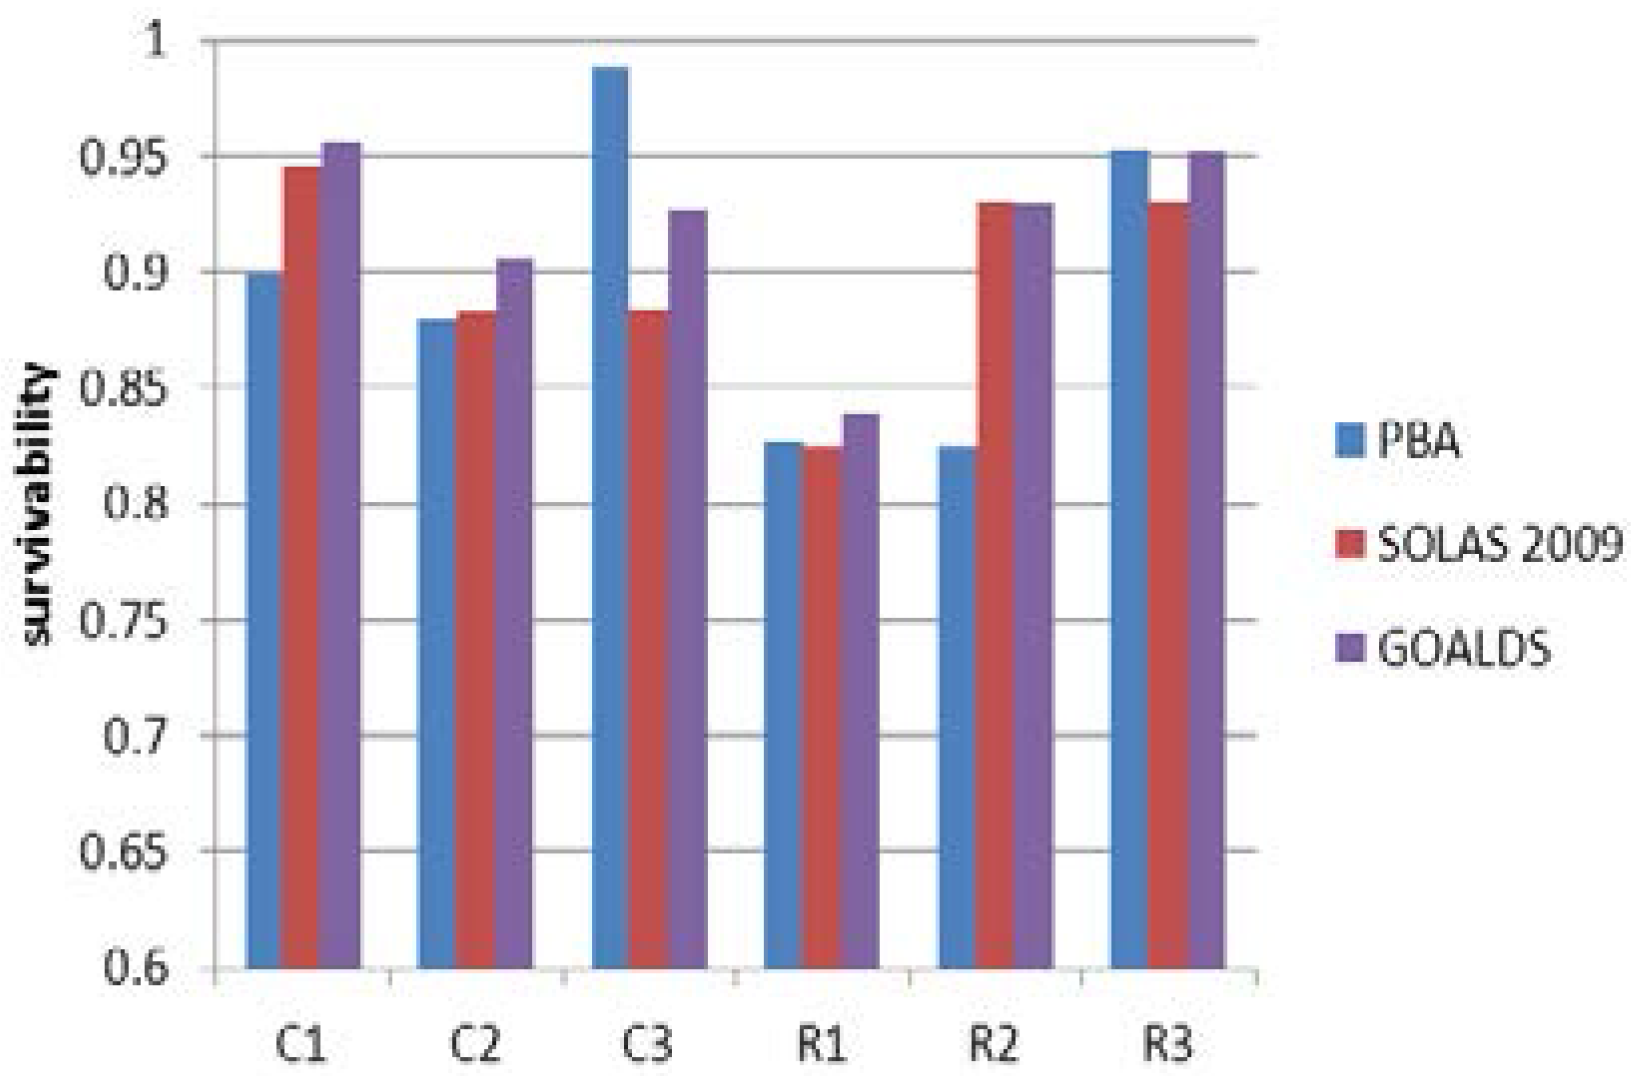
In the further stage, A-Index calculated by means of SOLAS and GOALDS survival factors have been compared against each other and against numerical simulations using Monte Carlo sampling (hereafter referred to as performance based assessment, PBA). These results are shown in the figure below:
The impact of the s-factor formulations on the A-index (
i.e., average of the probability of survival) was expected to be small due to the limited (in terms of probability) share of the marginal cases of s = (0;1). As it can be seen from the above figure,
Figure 13, the discrepancies are general within a few percent, with the new s-factor giving generally higher (than SOLAS) values for all but the small RoPax (R2). The highest difference between current and new s-factors is shown in the case of the very large cruise vessel (C3) for which PBA predicts an average survivability of about 98%. It should be borne in mind, however, that in spite of the small discrepancies between SOLAS 2009 and GOALDS predictions, the results are not conclusive and should be approached with caution. Specifically, it has been demonstrated in the foregoing that the SOLAS s-factor exhibits much lower accuracy than its GOALDS counterpart, which as shown for the tested RoPax vessels resulted in 4.5 m confidence interval for
i.e., larger than the entire band of sea states relevant in the s-factor calculations (sea states of
0–4 m, as determined by the probability of specific sea state in the event of collision).
The PBA results are generally within a few percentage points from the A-index calculations with the larger discrepancies in the two extreme cases of small RoPax (R2) and the largest cruise ship (C3). Once again, given the inherent uncertainty of the PBA (due to mathematical modelling, duration and number of performed tests) these results cannot be used to draw conclusions on the impact of the s-factor on the overall survivability as measured by the A-index.
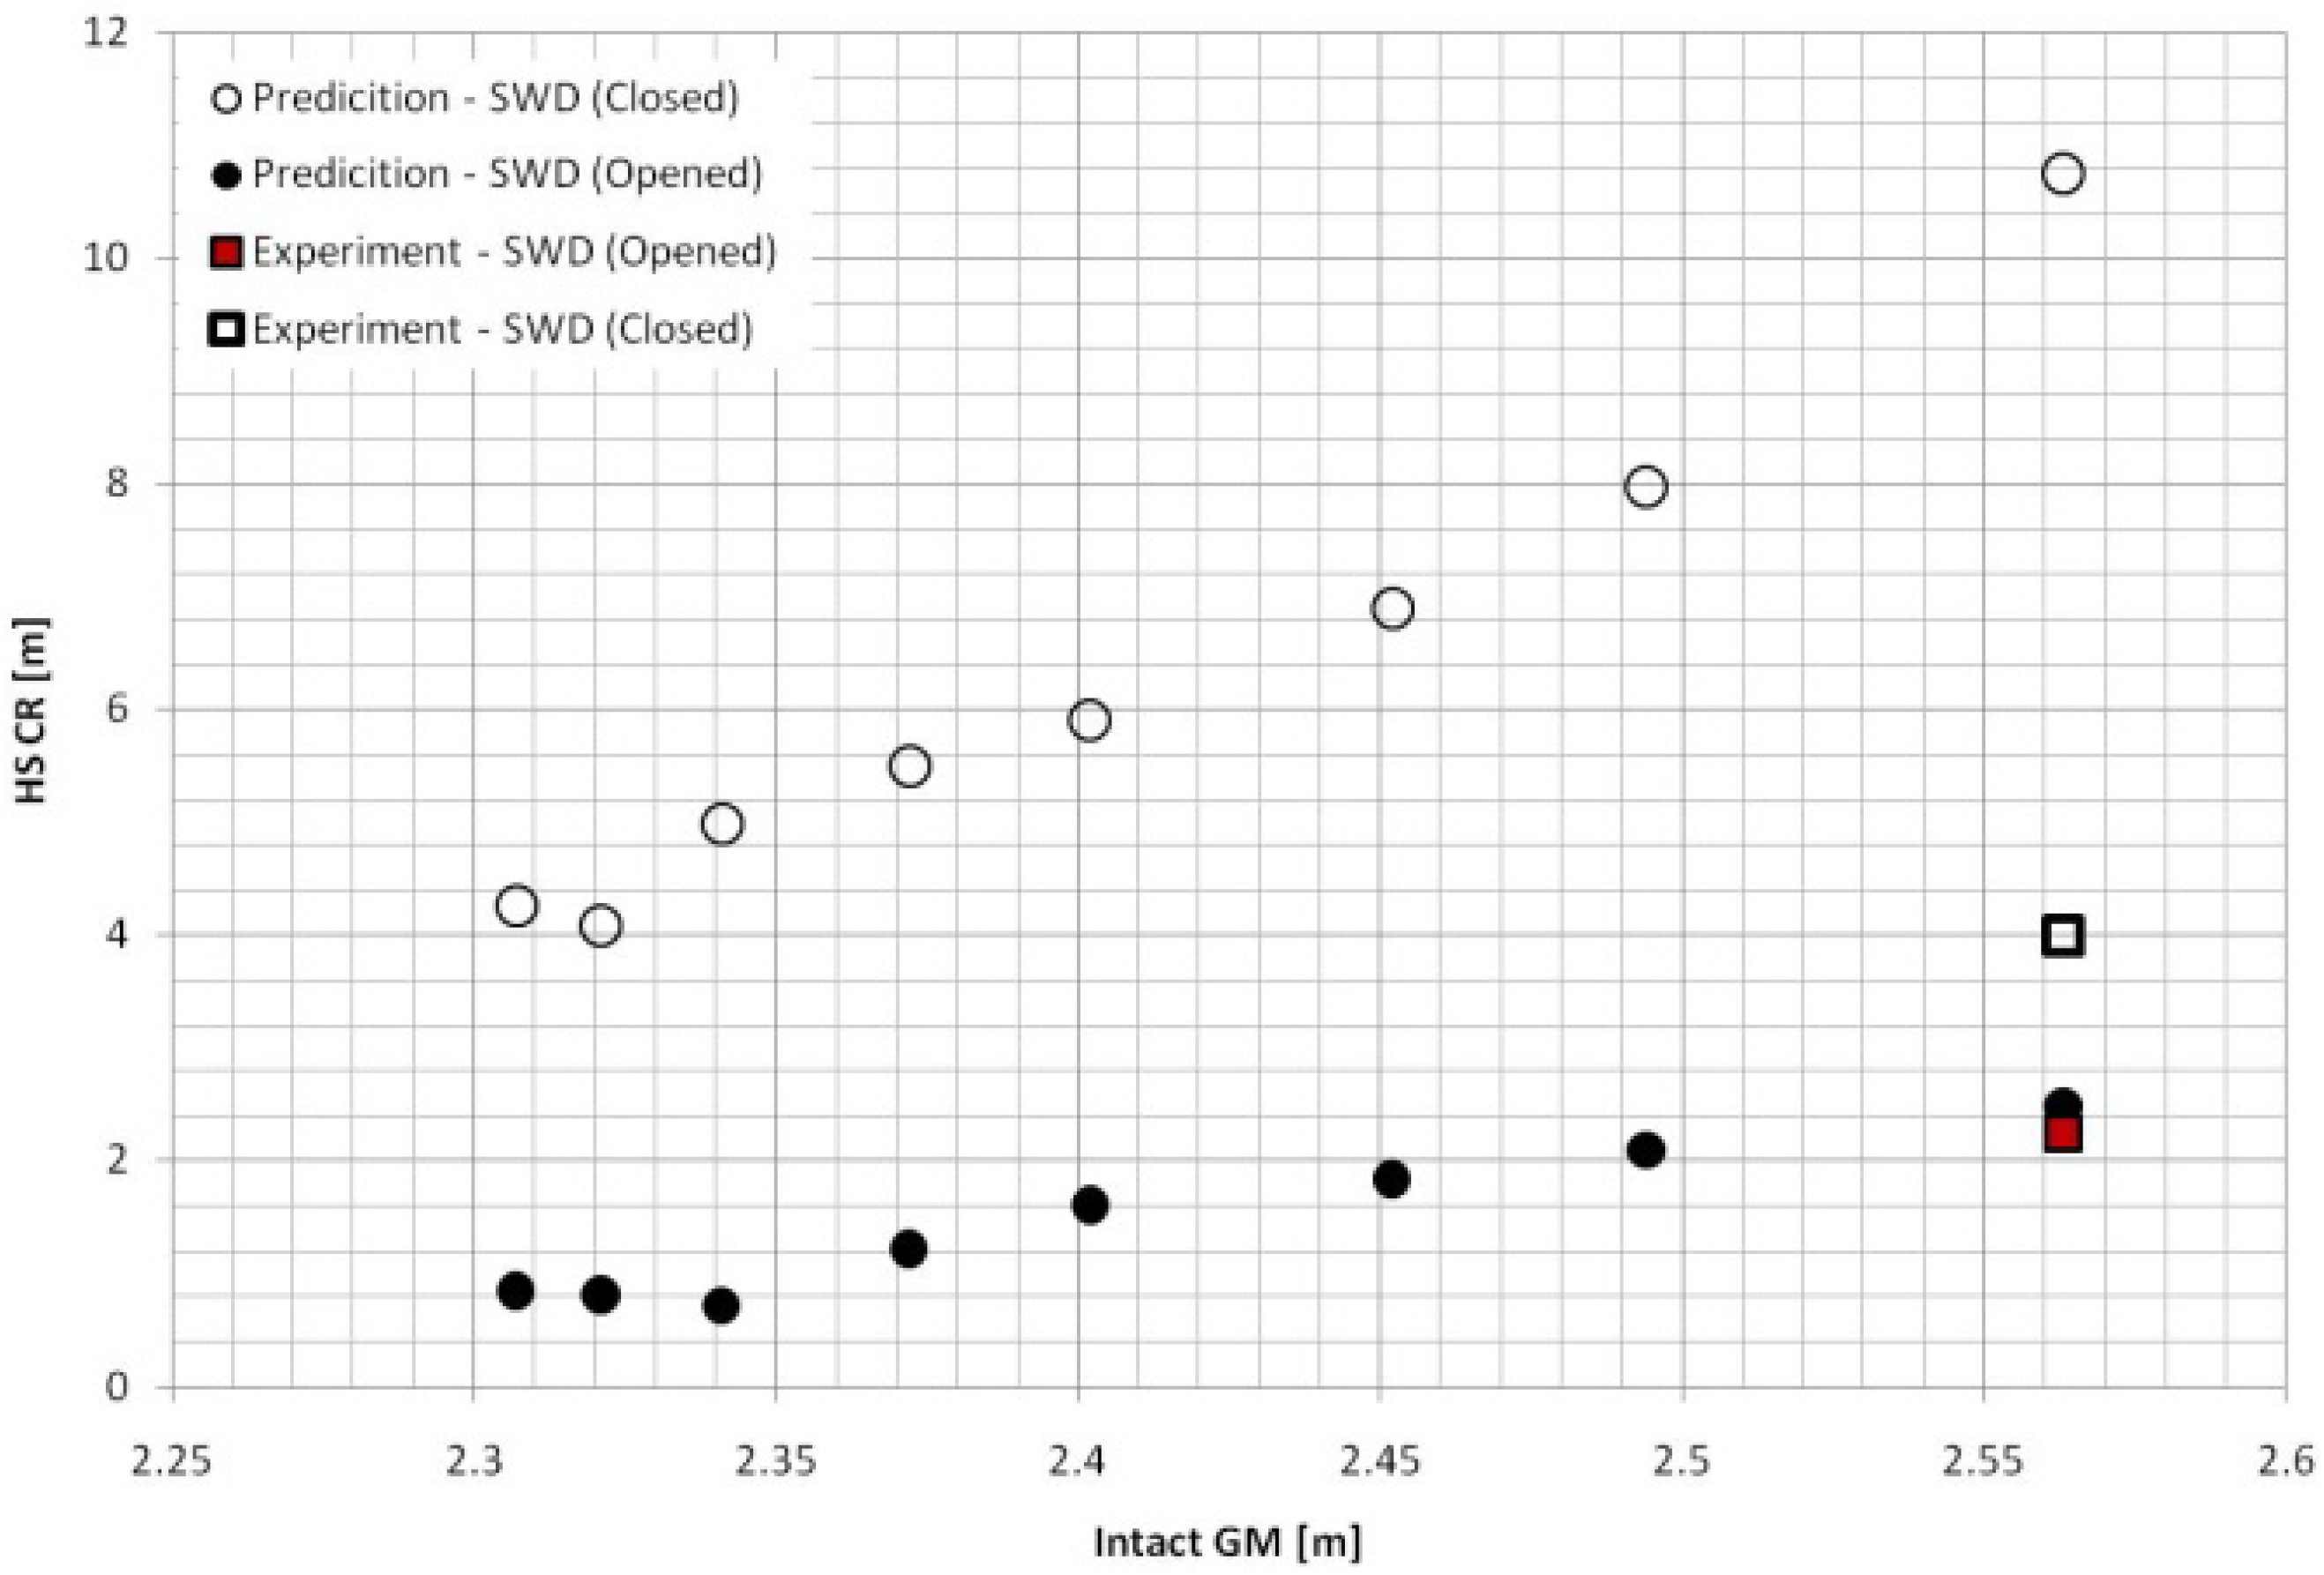
Finally, neither the SOLAS nor GOALDS formulation could be sufficiently verified against experimental data for cruise ship models. Due to the complexity of the physical model tests of survivability, the GOALDS data appropriate for comparison are very limited and consist of only two valid experimental points for C1. These points comprise two runs with semi-watertight doors open and closed performed in waves, starting from the damage equilibrium position. These are presented in the
Figure 14 below.


