
Analysis of Severe Injuries in Crashes Involving Large Trucks Using K-Prototypes Clustering-Based GBDT Model


Department of Maritime Economics and Management, Dalian Maritime University, Linghai Road, Dalian 116026, China
*
Author to whom correspondence should be addressed.
Safety 2021, 7(2), 32; https://0-doi-org.brum.beds.ac.uk/10.3390/safety7020032
Submission received: 29 January 2021
/
Revised: 1 April 2021
/
Accepted: 26 April 2021
/
Published: 29 April 2021
Abstract
:The unobserved heterogeneity in traffic crash data hides certain relationships between the contributory factors and injury severity. The literature has been limited in exploring different types of clustering methods for the analysis of the injury severity in crashes involving large trucks. Additionally, the variability of data type in traffic crash data has rarely been addressed. This study explored the application of the k-prototypes clustering method to countermeasure the unobserved heterogeneity in large truck-involved crashes that had occurred in the United States between the period of 2016 to 2019. The study segmented the entire dataset (EDS) into three homogeneous clusters. Four gradient boosted decision trees (GBDT) models were developed on the EDS and individual clusters to predict the injury severity in crashes involving large trucks. The list of input features included crash characteristics, truck characteristics, roadway attributes, time and location of the crash, and environmental factors. Each cluster-based GBDT model was compared with the EDS-based model. Two of the three cluster-based models showed significant improvement in their predicting performances. Additionally, feature analysis using the SHAP (Shapley additive explanations) method identified few new important features in each cluster and showed that some features have a different degree of effects on severe injuries in the individual clusters. The current study concluded that the k-prototypes clustering-based GBDT model is a promising approach to reveal hidden insights, which can be used to improve safety measures, roadway conditions and policies for the prevention of severe injuries in crashes involving large trucks.
Keywords:
large trucks; severe injuries; heterogeneity; k-prototypes; clustering; GBDT; machine learning1. Introduction
Large trucks play an indispensable role in freight logistics and the economic development of a country. According to a commodity flow survey of 2017, trucks alone moved 8.8 billion tons of goods. However, large trucks are also responsible for increasing the chances of severe injuries and fatalities in traffic crashes. Severe injuries and fatalities in crashes cause substantial social and economic loss for human society. From 2016 to 2018, the total fatalities in large truck-involved traffic crashes increased by almost 6 percent in the United States (US) [1]. Besides, the unique characteristics of large trucks such as long vehicle length, heavy vehicle weight and poor deceleration system may play key roles in increasing the probability of severe injuries [2,3]. The statistics and claims of past studies clearly signify the importance of researching the injury severity in crashes involving large trucks. Previous studies have explored different types of contributory factors (e.g., crash, location, roadway, weather, light and truck, etc.) that affect the injury outcomes of crashes involving large trucks [4,5,6,7,8,9,10,11,12]. However, the heterogeneous nature of traffic crash data significantly obscures the effects of contributory factors on injury outcomes. Several studies have recognized the unobserved heterogeneity as a major barrier for the analysis of traffic crash data [10,13,14].
Unobserved heterogeneity refers to the correlation between the unobserved factors and the observed variables. Leaving the issue of heterogeneity unaddressed might leave crucial insights hidden [13,15]. Besides, a subset of factors may have inconsistent effects on the severity of injury under different traffic crash scenarios [16,17]. For example, the severity of injury in crashes involving large trucks and under dark unlighted conditions may differ because of changes in the posted speed limit. To account for unobserved heterogeneity, it is possible to separate a certain type of crash based on domain knowledge and build an injury severity model for that type of crash only. Some past studies have analyzed the injury severity in certain types of truck-involved crashes based on the crash type [18,19], location [2,12,20], environmental factors [21], temporal characteristics [22], and truck characteristics [11]. However, such an approach will generate a large number of subgroups, and consequently, it would be infeasible to build a model for each subgroup. Additionally, some subgroups may include an insufficient number of observations to build a viable injury severity model. Segmenting the crash data according to domain knowledge or studying specific crash types may account for heterogeneity to a certain extent, but it does not guarantee homogeneity in the subgroups [13].
In the field of road safety, a lot of studies have successfully employed cluster analysis, which is an unsupervised data mining method, to account for unobserved heterogeneity in different types of crash data (e.g., all road users, pedestrians, bicycles, motorcycles, and trucks) [23,24,25,26,27,28,29,30,31]. The objective of cluster analysis is to identify the latent homogeneous clusters in the data. Previous studies have reported that certain relationships between the contributory factors and injury severity cannot be uncovered without segmenting the aggregated crash data into homogeneous clusters. Additionally, some contributory factors have different magnitudes of effects under different crash scenarios [13,23,24,30]. It is a well-established fact that different crash scenarios require different types of preventive measures. Therefore, it is crucial for road safety authorities and traffic engineers to obtain comprehensive and accurate insights about the effects of contributory factors on injury outcomes. Such insights can be used to improve traffic laws, policies, road infrastructures, and road user’s awareness for the reduction in severe injuries in crashes involving large trucks. Fewer severe injuries and fatalities will substantially reduce the social and economic costs caused by traffic crashes. Consequently, it will lead to a more sustainable transportation system.
A review of the past studies has revealed that the literature on the analysis of the injury severity in crashes involving large trucks has been limited in exploring an appropriate clustering approach, which can account for the heterogeneous nature and variability of data type in crash data. The current study has explored the application of k-prototypes clustering-based machine learning models for the analysis of severe injuries in crashes involving large trucks. To the best of the author’s knowledge, none of the previous studies have applied both of the approaches together. A feature analysis with the help of the SHAP method was conducted to demonstrate the effectiveness of the application of k-prototypes cluster analysis. The rest of the study is organized with a literature review, methodology and materials, results, discussion and conclusion, and limitations and future research opportunities.
2. Related Work
In recent times, a wide variety of research efforts have been conducted for the analysis of the severity of injury in different types of crashes involving large trucks [5,8,10,18,28,29]. However, this study aims to explore the application of the k-prototypes clustering-based ensemble learning method for the analysis of severe injuries in crashes involving large trucks. Therefore, the current study has discussed the commonly applied methods that have been used to mitigate unobserved heterogeneity and investigate the factors influencing the injury outcomes of crashes involving large trucks.
2.1. Unobserved Heterogeneity in Crash Data
The random parameters logit model (mixed logit) and latent class clustering (LCC) have been the two commonly used approaches to account for the heterogeneous nature of different types of traffic crash data. A large number of studies have used the random parameter logit model for the analysis of large truck-involved crash injury severity [3,5,10,32]. Behnood and Mannering [10] used the random parameters logit model to explore the effects of time of day variations and temporal instability on the injury severity in large truck crashes. Rahimi et al. [32] investigated the injury severity of single vehicle truck crashes using the random parameter logit model. The random parameter logit model allows the parameters to vary across observations, as opposed to a single parameter representing all observations. However, cluster analysis is a better approach for the mitigation of unobserved heterogeneity because it identifies the latent homogeneous clusters within the crash data. Additionally, the characterization of those homogeneous clusters gives a clearer interpretation of the crash scenarios. Developing the injury severity model on the homogeneous clusters gives more accurate estimations about the effects of the contributory factors on injury outcomes. Several studies have demonstrated the benefits of cluster analysis for the mitigation of unobserved heterogeneity in traffic crash data [23,24,25,33].
Ona et al. [23] used LCC for the analysis of the injury severity in crashes on rural highways. The study showed that certain contributory factors are important only in the individual clusters. Sasidharan et al. [26] combined LCC with the binary logit model for the analysis of pedestrians crash injury, and reported that certain relationships between the injury outcome and exploratory factors would have remained hidden without cluster analysis. LCC is a statistical model-based clustering approach, and the final class solution depends on the user [34]. If the model is user-specified, then the results of the model may not be reproducible.
Another type of clustering is the similarity-based approach, which maximizes the similarity between the observations within the clusters and dissimilarity between the inter-clusters based on some distance measure. The k-means, k-modes, and hierarchical clustering are similarity-based approaches. One of the advantages of using the k-means clustering method is its efficiency and simplicity for processing large datasets [35]. Sohn and Lee [36], and Iranitalab and Khattak [37] developed k-means clustering-based models for the prediction of injury outcomes. Nandurge and Dharwadkar [38] used the k-means clustering method as the primary tool for the segmentation of traffic crash data in homogenous subgroups. However, the k-means is appropriate for datasets that include only numerical features, and road accident datasets rarely include only numerical features. The k-modes clustering method is more appropriate for datasets that include only categorical features and uses the mismatches between the observations as a dissimilarity measure. Kumar et al. [39] have used the k-modes clustering method to improve classification performances. The hierarchical clustering method segments the data by building a tree of clusters [34]. Taamneh et al. [25] used hierarchical clustering before performing the classification of traffic crashes. This method is not user-defined, but it is inherently incapable of handling categorical features, and the memory space and time required by it is infeasible for large datasets.
There are some advantages of these clustering methods, and in some cases, they can produce satisfactory results. However, traffic crash datasets are often large and include both numerical and categorical features. For example, the total number of vehicles is a numerical feature, and the manner of collision is a categorical feature with five or six unique values (e.g., front-to-front, rear-end and sideswipe). Most of the clustering methods convert the unique values of the categorical features into dummy features (where the presence of a unique value in the observations is denoted by 1 and the absence as 0). This technique loses the information inherited by the categorical feature. Additionally, converting categorical features into dummy variables increases the total number of features, which will require more memory and time for processing the data.
2.2. Severity Modeling
Several research efforts on the severity of injury in truck-involved traffic crash applied logit-based or ordered probability type statistical models [2,21,40,41]. The non-linear relationships between injury outcome and contributory factors make such types of model inappropriate. Moreover, statistical models have model-specific assumptions and predefined underlying relationships between dependent and input features. The violation of those assumptions may lead to erroneous results [24,42]. A lot of studies have shown that machine learning models are better at predicting the injury outcomes [37,43,44,45]. A few studies on truck-involved crashes also have shown promising results using machine learning methods. Chang and Chien [42], and Eustace et al. [46] applied the classification and regression trees (CART) to identify the important factors that influence the severity of truck-involved crashes. Zheng et al. [47] used the GBDT machine learning model for the analysis of commercial truck crash injury severity.
A limited number of studies have used the clustering approach for analysis of the injury severity in crashes involving large trucks. Rahimi et al. [28] used the block clustering method to identify patterns, and the conditions contributing to the patterns in large truck-involved traffic crashes. The study was limited to cluster analysis only. Another study combined LCC with the partial proportional odds model for the exploration of heterogeneities in truck-involved severities only at cross and T-intersections [29].
The current study has identified a few limitations in the existing literature. Firstly, a very limited number of studies have used the clustering approach for the mitigation of unobserved heterogeneity in crashes involving large trucks. Secondly, the variability of data type has rarely been addressed. Lastly, none of the previous studies have employed a clustering-based machine learning model for the analysis of severe injuries in crashes involving large trucks. In light of these gaps in the literature, the current study has proposed the k-prototypes clustering-based GBDT machine learning model for the analysis of severe injuries in crashes involving large trucks. The k-prototypes clustering method was proposed by Huang [35]. The method is capable of clustering datasets with both numerical and categorical type features. Further, the study has developed cluster-based GBDT machine learning models for predicting the injury outcomes of crashes involving large trucks. The GBDT model has shown significant success in the prediction of injury outcomes in traffic crashes [43,47]. Another distinguishable feature of the study is the application of the SHAP method to estimate the varying effects of the contributory factors on severe injuries across the EDS and each cluster. The SHAP method was proposed by Lundberg and Lee [48] for the interpretation of machine learning models.
3. Methodologies and Materials
This section of the study includes a description of the k-prototypes clustering method, and the GBDT ensemble learning method. It also includes descriptions of the data used for this study, the evaluation metrices of predicting performance, and the details of the SHAP method.
3.1. The K-Prototypes Clustering Method
Here, we show the distance measure used by the k-prototypes clustering method. The k-prototypes uses the squared Euclidian distances for the numeric features and a simple matching coefficient for the categorical features. We have summarized the cost function in Equation (1) according to [35]. The distance between the observations and the assigned prototype is represented by the cost function.
where the objective of the algorithm is to minimize E (cost function), and divide the dataset X into k number of clusters and is center of prototype l, is the dummy variable that equals to 0 when data object i is assigned to prototype l, and is the dissimilarity measure for both the numerical and the categorical attributes; Equation (2) describes the function in more detail.
where the first term is the squared numerical distance of attribute j of data object i from the center for attribute j of prototype l, and the in the second term is the weight for categorical features for cluster l. The second term is the dissimilarity measure of attribute j of data object i from the center for attribute j of prototype l. In Equation (2), superscript r represents the numeric features and c represents the categorical features. Then, the complete cost function for prototype l is computed by the following equation.
where the term is explained in Equation (4). In the following equation is the set of all discrete values of the categorical attribute j, and ) is the probability of the discrete value from being in prototype l.
3.2. Gradient Boosted Decision Trees
The GBDT is a type of ensemble learning method that combines many weak decision trees (base learners) to produce more robust and accurate models. It integrates the gradient boosting technique to extend and improve the weak-decision trees [49]. In the field of machine learning, boosting means training multiple weak learners in a sequential manner, where each learning algorithm is adjusted based on the error of its predecessors. The reason we have selected GBDT is because traffic crash data usually come in a tabular form, and often GBDT is the state-of-the-art model for tabular data [50]. The GBDT algorithm follows the steps below to reach the final model.
- Initialize the model with a constant value ; here, is the observed values, L is the loss function and γ is the prediction of the model, which minimizes the loss function. In a classification task, γ is the value of the log (odds).
- For m = 1,2,3… to M:
- (a)
- Calculate the pseudo residuals, , for i = 1, 2, 3……, n.
- (b)
- Fit a decision tree to the pseudo-residuals and create the terminal regions. Each leaf of the tree represented by for j = 1, 2, 3..., .
- (c)
- For j = 1, 2, 3…, m, calculate .
- (d)
- Update the .
- Output .
There are two major hyperparameters of GBDT: one is the number of sequential weak decision trees, and another is the learning rate, which determines the magnitude of the contribution of each tree in the right direction of prediction. In the training process, the algorithm keeps adding weak decision trees in a forward-stage-wise manner until it reaches the best fit. The optimal combination of the number of weak decision trees and learning rate can avoid over-fitting and increase the performance of the model.
3.3. Data Description
For this study, the data were collected from the Crash Report Sampling System (CRSS) of the National Highway Traffic Safety Administration (NHTSA). CRSS is a sample of police reported crashes involving all types of motor vehicles, pedestrians, and cyclists. A crash record in CRSS includes information about the crash characteristics, location of the crash, roadway characteristics, involved vehicles, drivers, occupants, pedestrians and cyclists, and environmental factors. Our data include only large truck-involved traffic crashes that occurred in the United States from 2016 to 2019. Any medium or heavy truck excluding buses and motorhomes, with a gross vehicle weight rating (GVWR) over 10,000 (10 k) lb, is considered a large truck. The descriptions and codes for large trucks are given in Table 1. At first, we filtered the traffic crashes involving large trucks based on the vehicle body type and GVWR from the vehicle data file. Then, we merged the traffic crashes from the vehicle data file with the crash data file by the case number data element. Redundant features, duplicated crash records, and crash records involving values such as “reported as unknown” or “unknown” were removed from the data. The end data included 9534 traffic crashes involving large trucks, where the injured persons were drivers, occupants, pedestrians, and pedal cyclists.
For traffic crashes with multiple injuries, the severity of the injury is determined by the most injured person. In the CRSS crash data, the severity of injuries follows the KABCO scale. This study has placed no injury (O), possible injury (C), suspected minor injury (B) into one category as “Non-severe injuries”; and suspected serious injury (A) and fatal injury or killed (K) into another category as “severe injuries”. Table 2 describes the definitions and the distributions of severity of injury.
The current study has selected 22 input features, and Table 3 describes the names, unique values, and distribution of the input features. The readers can follow the CRSS analytical user’s manual of 2016–2019 for more details [51]. It should be noted that for this study, the contributory factors and input features hold similar meaning.
3.4. SHAP Method for Feature Analysis
Lundberg and Lee [48] proposed the SHAP (Shapley additive explanations) method for the interpretation of the complex models/machine learning models. The concept of SHAP is based on the game theory by Štrumbelj and Kononenko [52] and the local explanations by Ribeiro et al. [53]. Initially, the SHAP method builds a model with all the features, and then builds another model without the feature of interest to see how the model performs without the feature of interest. The SHAP value of a feature is the marginal contribution of the feature for the prediction of the desired outcomes. The SHAP value of a feature is calculated using the following equation:
In the above equation, is the contribution of a feature as the SHAP value, S is the subset of all features, F represents the set of all features and represents the values of the input features in the set S. To determine the effects of the feature of interest, a model is trained with the feature interest, and another model is trained without the feature of the interest. Then, predictions from the two models are compared with the current output denoted as . The effect of the feature of interest also depends on the other features in the model. Therefore, the preceding differences are computed for all possible subsets [48].
3.5. Predicting Performance Evaluation Metrices
The predicting performances of the models were evaluated based on accuracy, precision, sensitivity or recall, specificity, and precision-recall area under curve (PR-AUC) score. These indicators derive from the components of the confusion matrix, and the components are presented in Table 4. According to Saito and Rehmsmeier [54], the PR-curve can be more informative than the traditionally used ROC (receiver operating characteristics) curve to evaluate a model trained on an imbalanced dataset, and where the desired outcome is dichotomous. The PR-curve is a graphical representation of the precision (on the y-axis) and the recall (on the x-axis) at different probability thresholds. The PR-AUC score summarizes the curve with a range of threshold values as a single score. The PR-AUC score is obtained by the trapezoidal interpolation of the precision. The PR-AUC score ranges from 0 to 1, where a score of 1 indicates a model with perfect skill.
4. Results
The current study has demonstrated that the k-protypes clustering is a useful method for the identification of homogeneous clusters within the EDS (entire dataset) of crashes involving large trucks. Four GBDT models were developed: one before cluster analysis on the EDS (entire dataset without clustering) and three on each cluster using the 22 input features presented in Table 3. The dependent feature of the model includes two injury severity outcomes (severe and non-severe). After cluster analysis, a GBDT model was developed on each of the identified clusters using the same input features as the EDS-based model to predict injury severity outcomes. To demonstrate the benefits of developing cluster-based models, the predicting performances of the EDS-based model were compared with the predicting performances of each cluster-based model. Subsequently, we used the SHAP method to estimate and compare the varying effects of the contributory factors on the severity of injury in the EDS and individual cluster-based model.
4.1. ClusterAnalysis
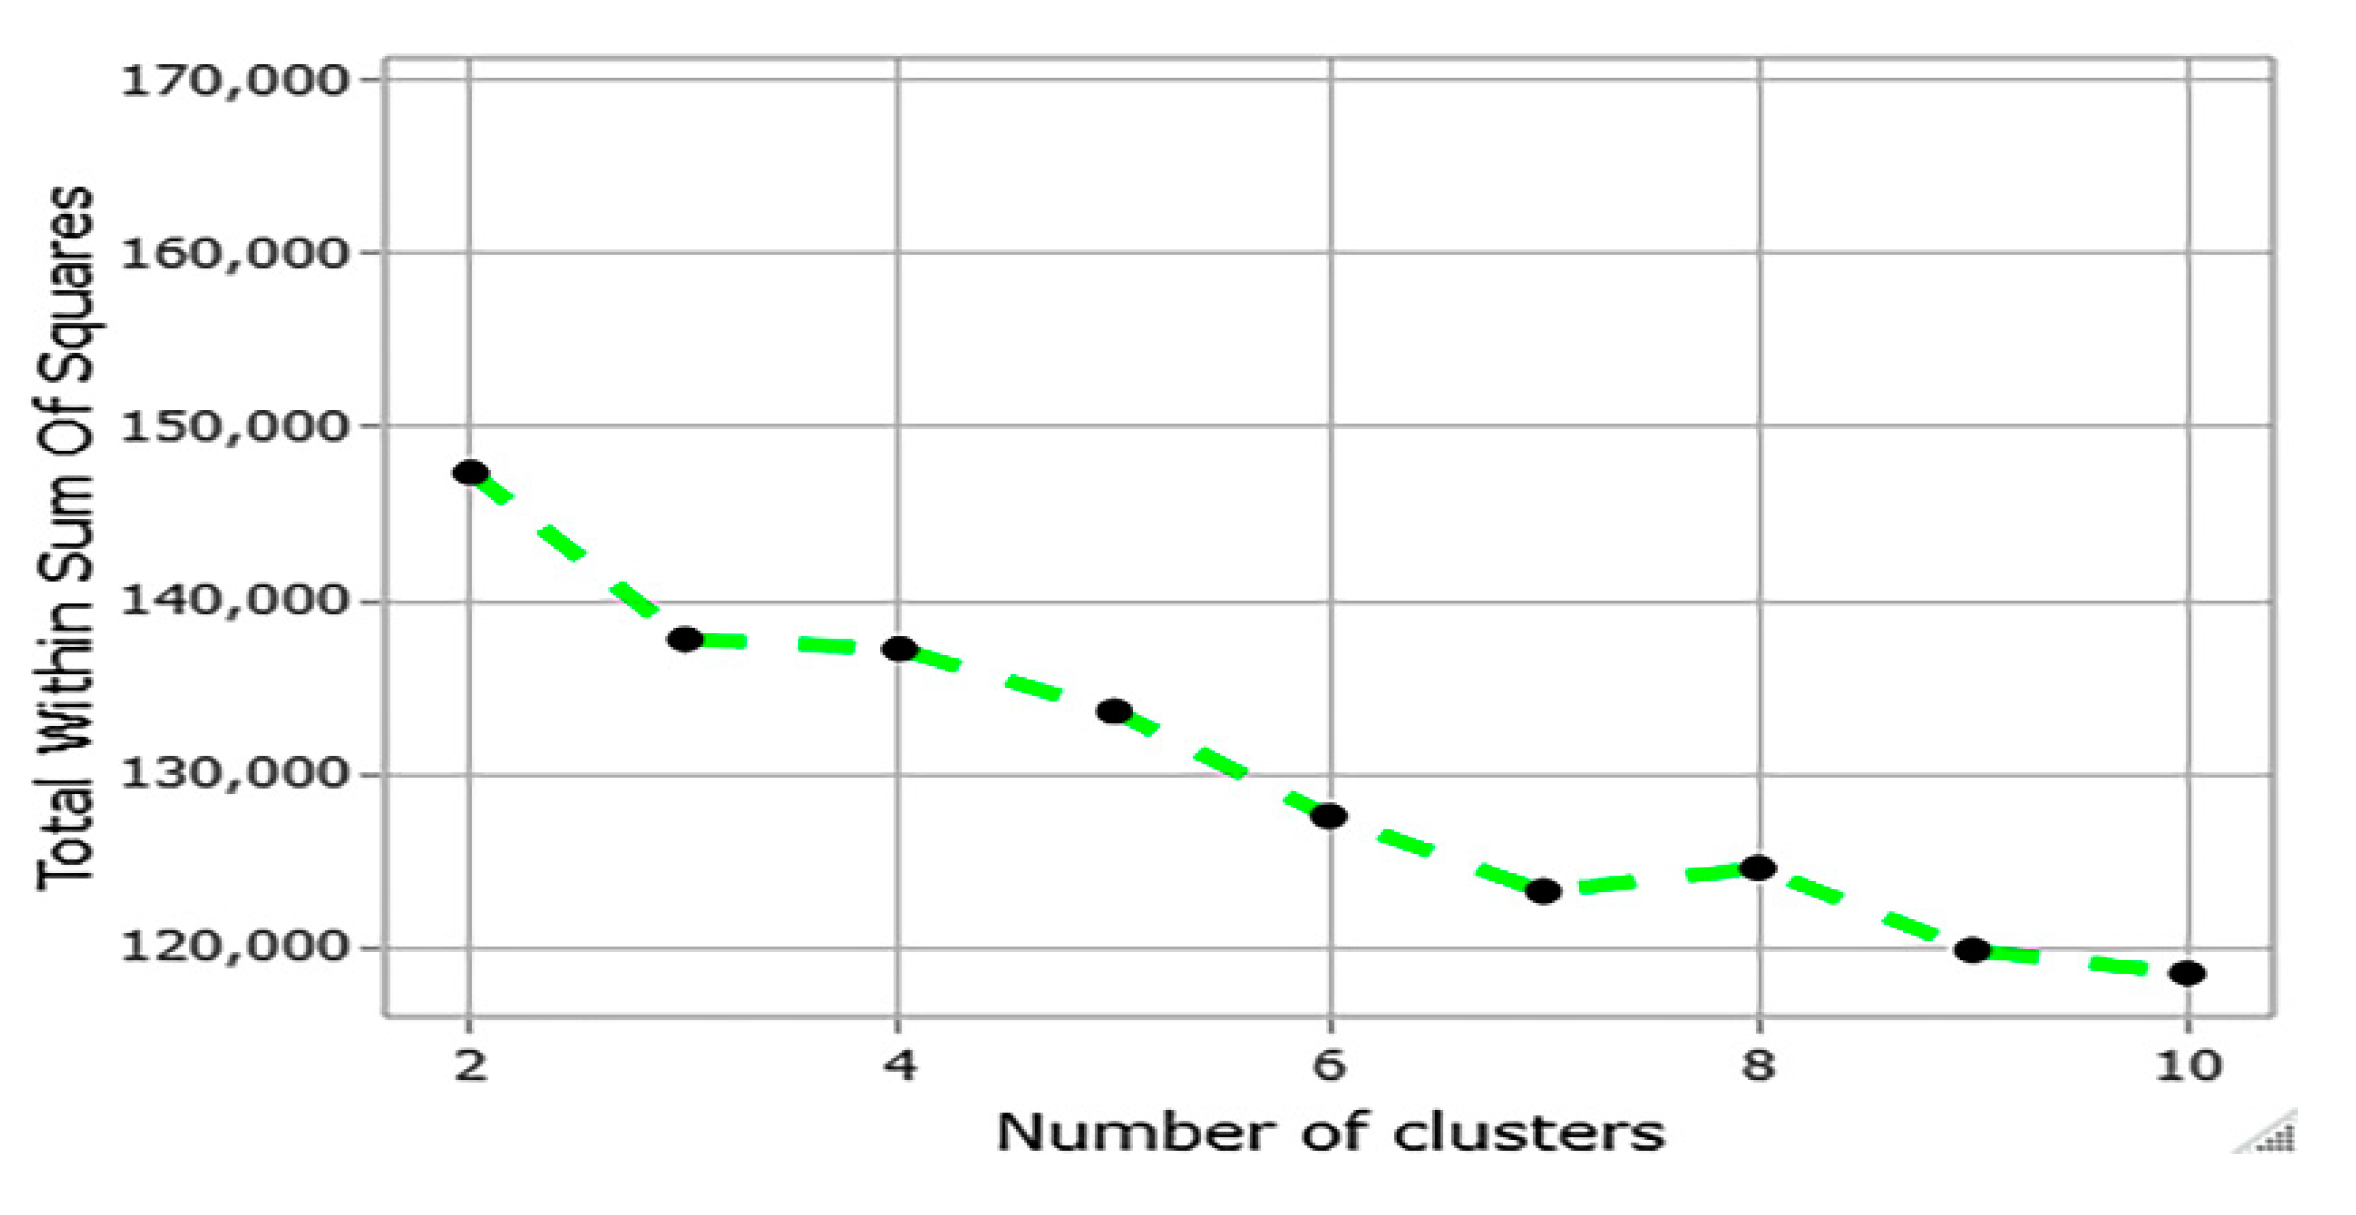
For k-prototypes clustering, the optimal number of clusters (k-value) needs to be determined before applying the algorithm. In this study, the optimal number of clusters was determined by visualizing the within-cluster sum of squares (WSS) in a plot. This method is known as the elbow method. The idea of the elbow method is to run the clustering method on the dataset for a range of values (1 to k values). Subsequently, the WSS for each value of k is plotted in a line chart. If the line in the plot looks like an arm, then the k value that corresponds to the “elbow” of the arm is the optimal number for clustering. Generally, an elbow occurs when adding more clusters does not reduce the WSS significantly. Figure 1 indicates a sharp elbow for three clusters. This means that clustering the dataset into more than three clusters does not reduce the WSS significantly. Therefore, we selected three as the optimal number of clusters.
The study identified three clusters within the EDS using the k-prototypes clustering and explored the cluster prototypes to characterize the clusters. The distribution of cluster prototypes presented in Table 5 indicates that the identified individual clusters are more homogeneous than the EDS. For example, almost 99 percent of the crashes in CL2 occurred on non-interstate highways. On the other hand, almost 76 percent of the crashes in the EDS occurred on interstate highways. Therefore, analysis of the EDS alone would have given fewer compelling estimations about the crashes that occurred on the non-interstate highways. Similarly, the distribution of the trafficway types in the EDS indicates less homogeneity. In CL1, almost 78 percent and 75 percent of the crashes occurred on two-ways divided with positive median barrier and in high-speed (over 60 mph) limit zones, respectively. Thus, analysis of CL1 can reveal clearer insights about the crashes in those types of locations. Besides, more than 93 percent of crashes in CL3 involved large trucks without trailing units. In contrast, only close to 48 percent of the crashes in EDS included such characteristics. The skewed distribution of these features in the individual clusters indicates better homogeneity than the EDS. Based on the distribution of the cluster prototypes, this study characterized the individual clusters in the following manner:
- CL1: “crashes on two-way divided with positive median barrier and in high posted speed limit zone”;
- CL2: “non-interstate highway crashes involving large trucks weighing over 26,000 (lb)”;
- CL3: “non-interstate highway crashes involving large trucks without trailing unit”.
4.2. Model Performance Evaluation
This study intended to show that the k-prototypes cluster-based models are better than the EDS-based model at predicting the severity of injury in crashes involving large trucks. All of the GBDT models were trained and tested on 70 and 30 percent of the sample data, respectively. Then, the EDS-based model was compared with the k-prototypes clustering-based models in terms of accuracy, precision, sensitivity, specificity, and PR-AUC score. Table 6 shows the predicting performances of all the models.
Table 6 shows that accuracy for both the CL2 and CL3-based models increased slightly during validation on both the training set and test set compared to the accuracy of the EDS-based model. On the other hand, the accuracy of the CL1-based model decreased for validation across both the training set and test set if compared to the accuracy of the EDS-based model. Determining the predicting performance of a model that was trained on an imbalanced dataset based on the accuracy alone would be misleading. However, the differences in accuracy between the training set and test set can show whether or not the model is overfitting. The difference between the accuracies indicated that all the models have satisfactory generalization ability.
The precision, sensitivity, and PR-AUC score are better indicators of the predicting performance of a model when it is critical to predicting the minority class accurately, and there is a skewness between the classes of the dependent feature. In this study, severe injuries are the minority class, and their social and economic effects are more damaging than other types of crash severity. The prediction results indicated that the CL1 and CL2-based models obtained better precision, sensitivity, and PR-AUC score than the EDS-based model during validation on both the training set and test set. The performances of the CL3-based model were lower than the EDS-based model in terms of the sensitivity, and PR-AUC score during validation on the test set. This may have been caused because of the lower proportion of severe injuries in CL3. When compared to the EDS-based model, the specificity of the CL1 and CL3-based models increased during validation across the test set, but the increases were not noteworthy. Based on these results, it is fair to conclude that segmenting the EDS using the k-prototypes clustering method increased the predicting performances of the cluster-based models.
4.3. Feature Analysis
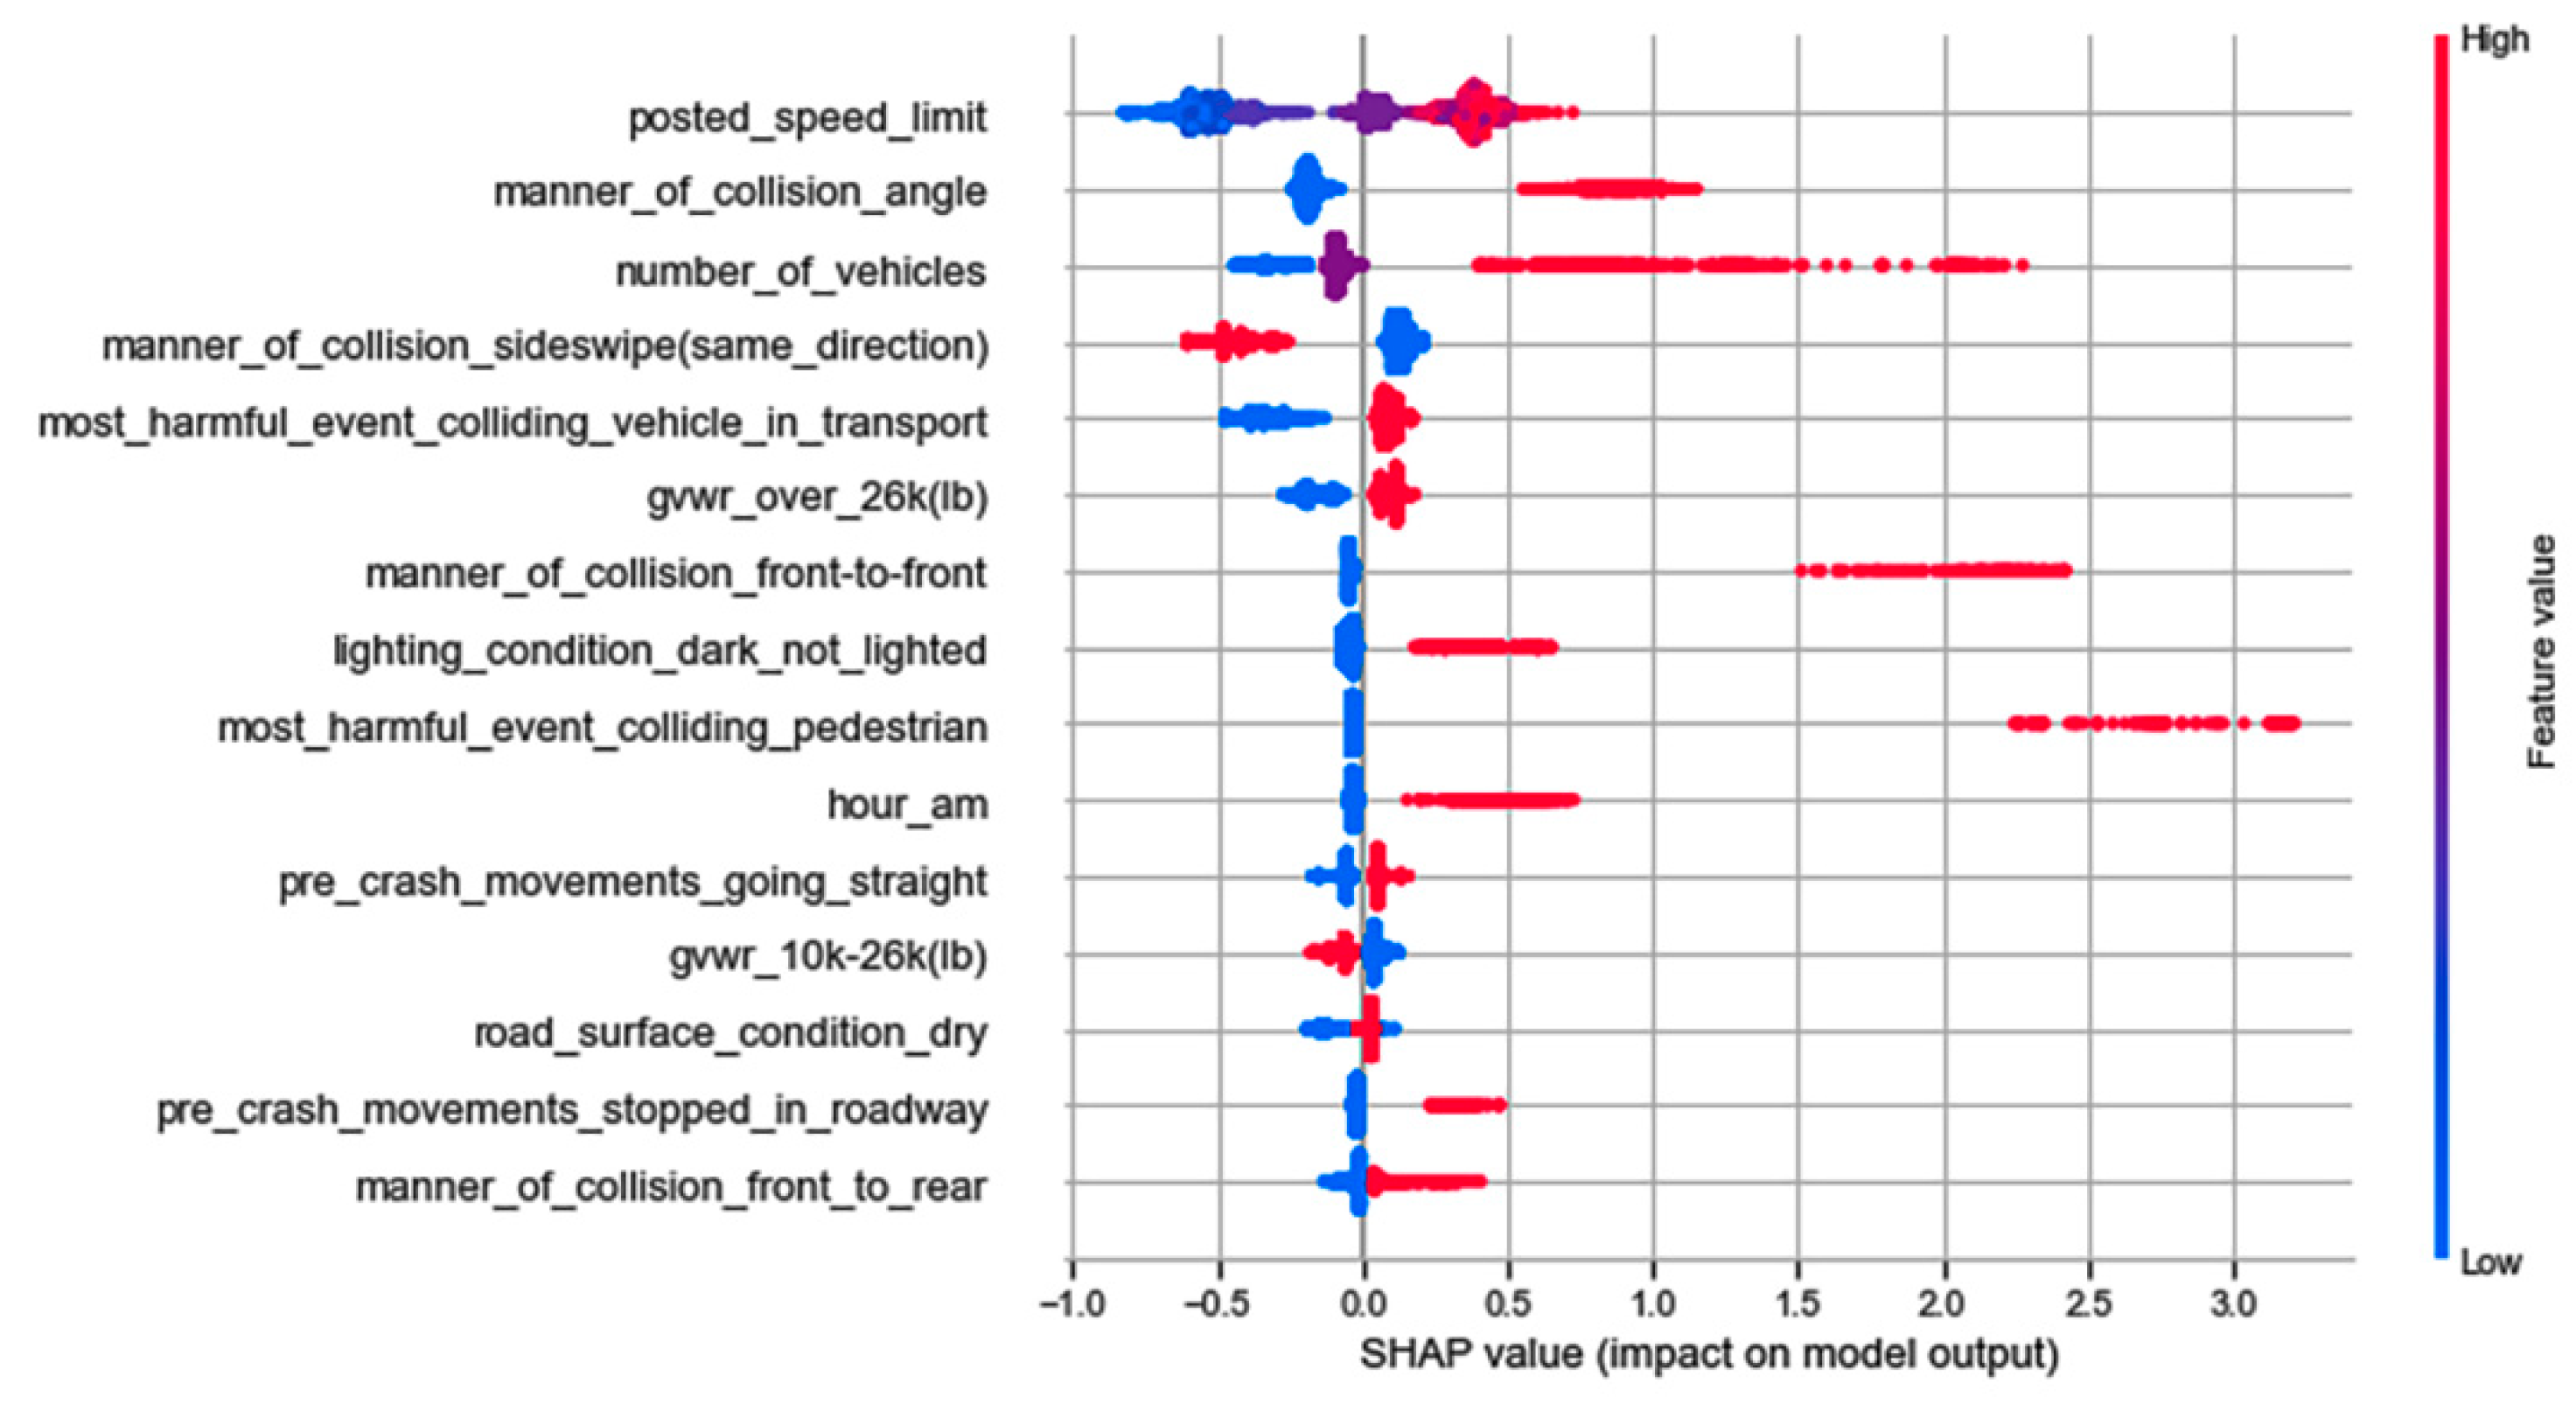
Feature analysis using the SHAP method demonstrated that the application of k-prototypes cluster analysis is an effective step for capturing latent features, and their varying effects on the severity of injury under different crash scenarios. Figure 2, Figure 3, Figure 4 and Figure 5 show the summary plot for the 15 most important features that influence severe injuries in the EDS, CL1, CL2 and CL3-based model, respectively. The suffixes added to the label of each feature represent the unique values of that feature. The x-axis of the figure displays the effects of a feature on the model output, and the y-axis on the right side indicates the value of the feature being low (blue) vs. high (red). Each dot in the figure represents an instance from the test set, and the cluster of dots indicates overlapping instances for a particular SHAP value. Moreover, a feature increases the likelihood of severe injuries when a certain value of that feature results in higher SHAP values. On the contrary, a feature reduces the probability of severe injuries when a certain value of that feature results in lower SHAP values.
Figure 2, Figure 3, Figure 4 and Figure 5 show that features such as the number of vehicles, high posted speed limit, a.m. (0–5 a.m.) hours, angle collisions, and pre-crash movements such as stopping in the roadway increase the chances of severe injuries in crashes involving large trucks across all the models. The direction of effects by these features is intuitively reasonable. It is possible to assume that an increase in the total number of vehicles enhances the cumulative effects of the crash, which can lead to severe injuries. Additionally, large trucks are more likely to travel at higher speed in high-speed limit zones, and higher speed has more chances of leading to severe injuries. On the other hand, sideswipe (same direction) collisions reduce the probability of severe injuries across all the models.
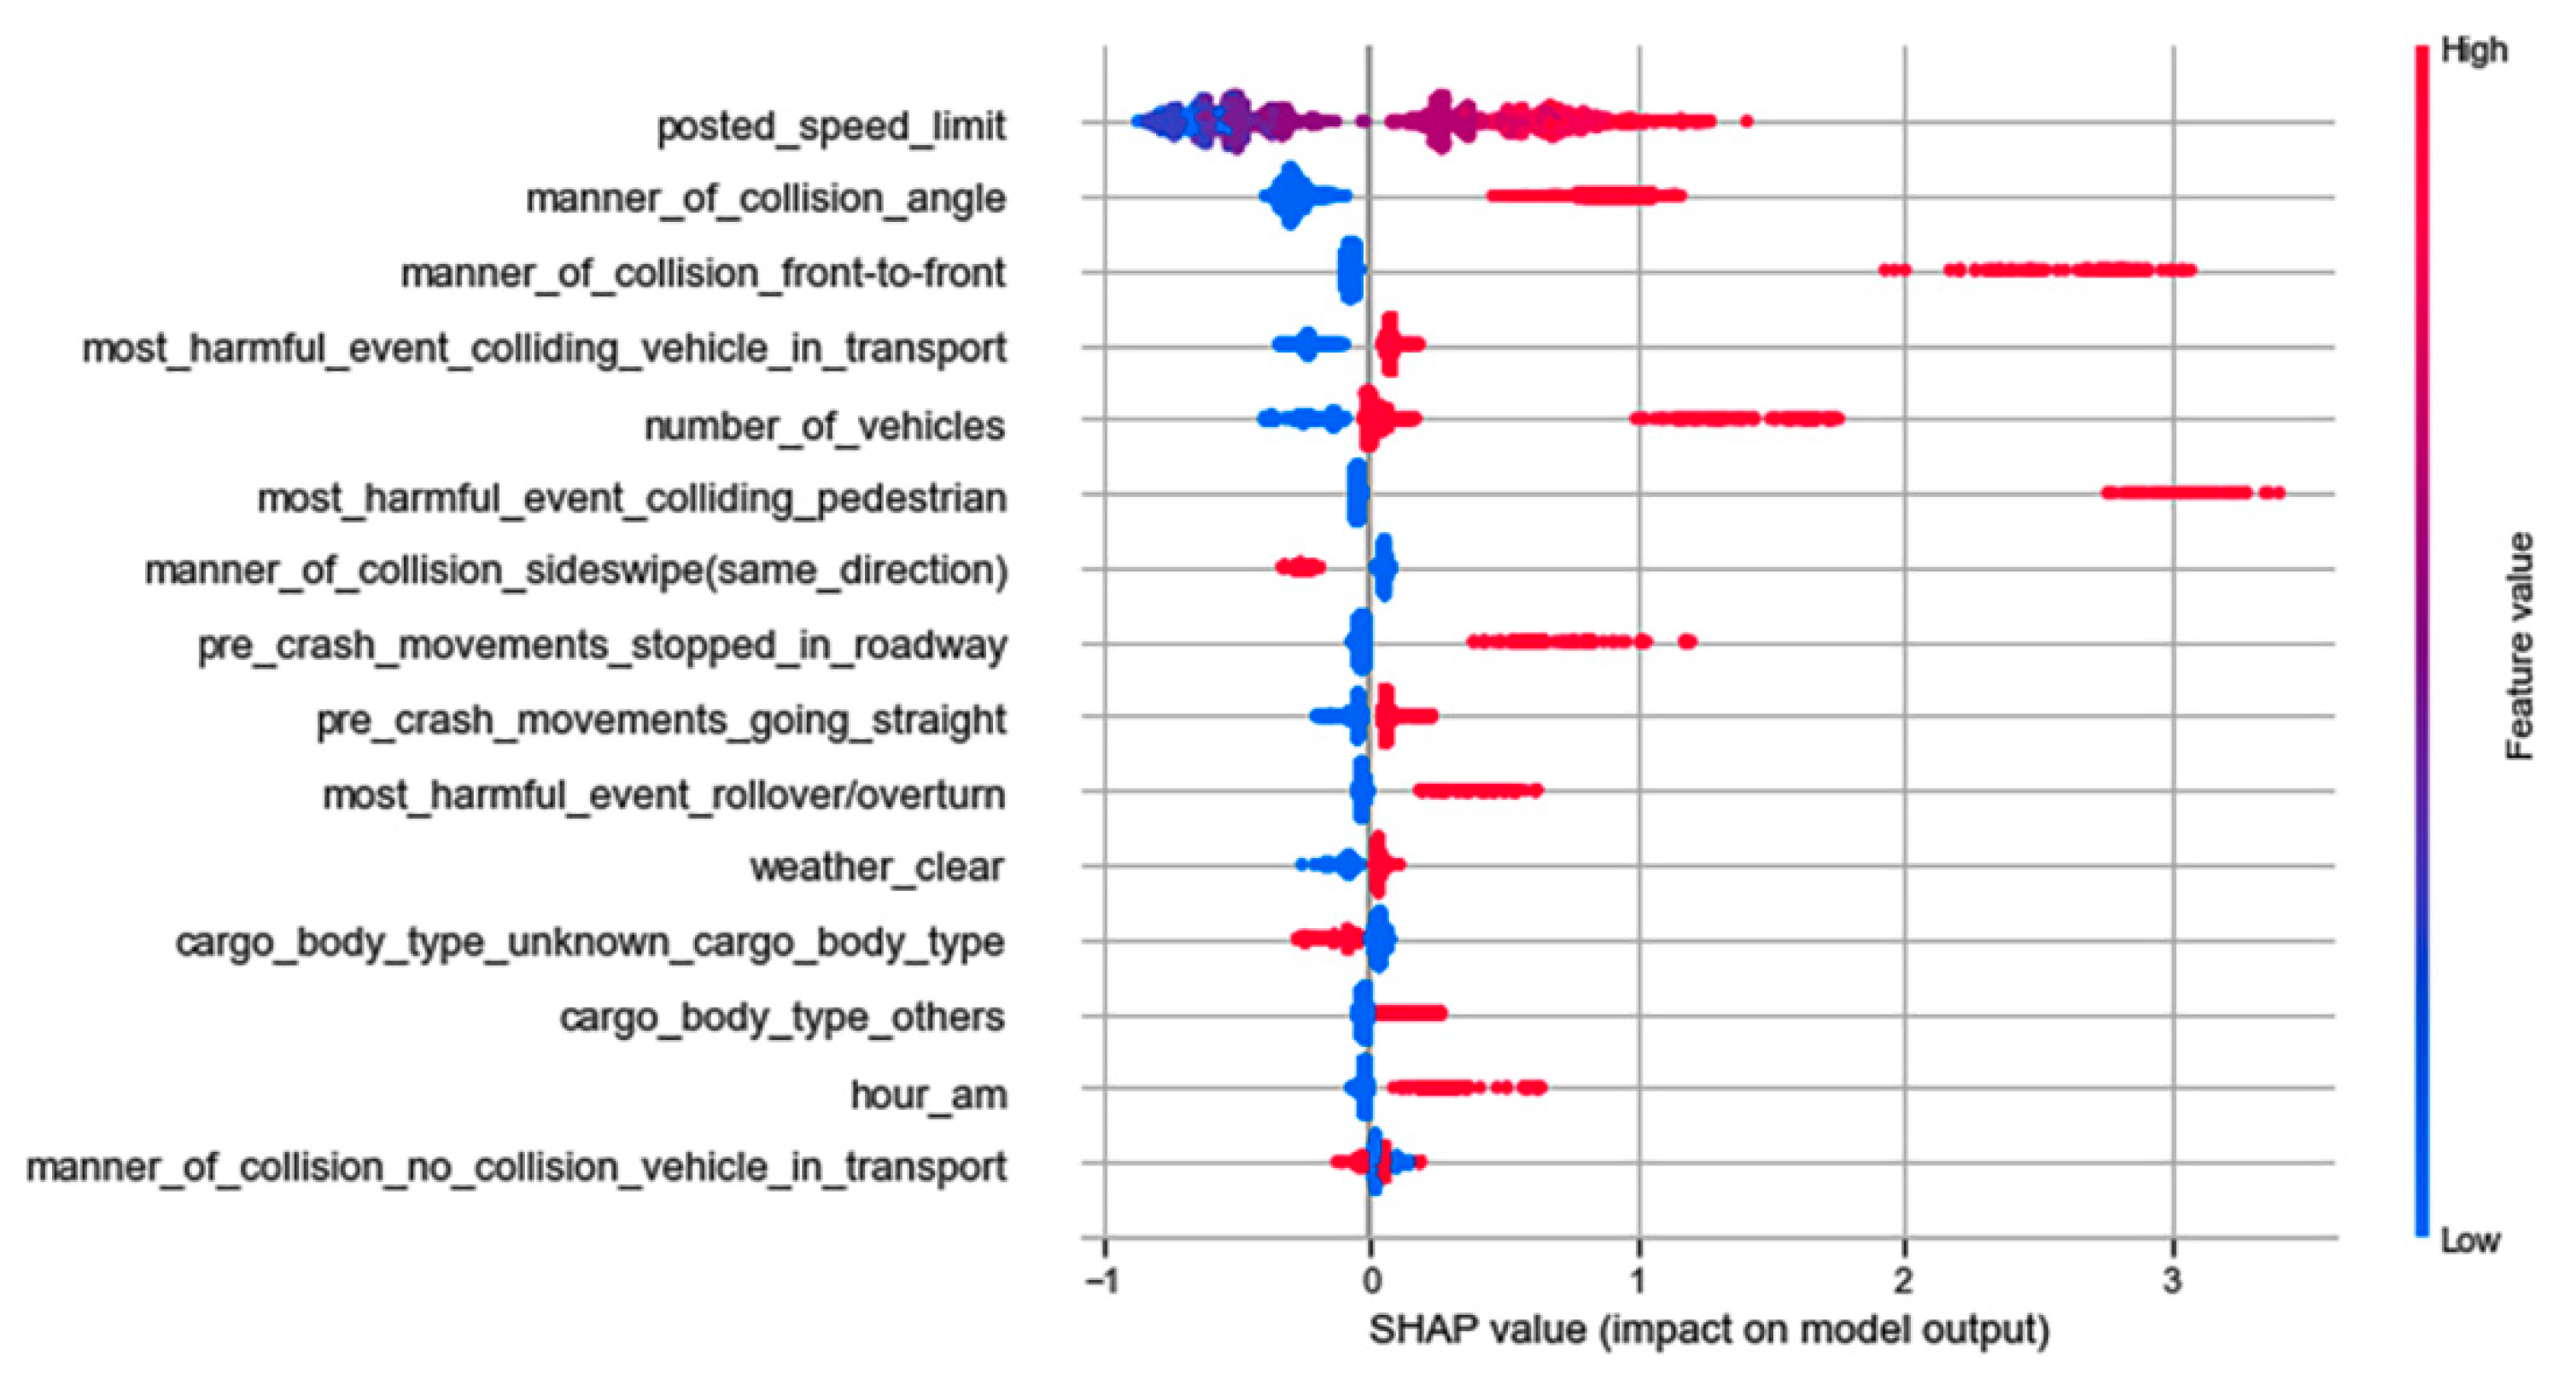
The figures indicate that though the direction of effects for some features is similar across all the models, their order of importance and magnitude of effects is not similar. For example, the SHAP value for the number of vehicles is more than or close to 2 in the EDS, CL1, and CL3-based models, but it is less than 2 in the CL2-based model. Similarly, angle collisions have a lower SHAP value in the CL1-based model if compared to other models.
In Table 7, we have summarized the common important relationships across all the combinations of models (including EDS) and the relationships that were important only in the individual cluster-based models. Table 7 shows that front-to-rear collisions and dark not lighted conditions increase the probability of severe injuries in the crash scenarios of EDS and CL1. Seventy percent of the crashes in CL1 occurred on high-speed limit zones, which explains the increase in the severity of injury for CL1 crashes. Except for CL1 crashes, front-to-front collisions and large trucks colliding with pedestrians significantly increase the chances of severe injuries across the crashes of EDS, CL2, and CL3. Close to 57 and 50 percent of the crashes in CL2 and CL3 occurred on two-way not divided traffic ways. It is intuitively reasonable to assume that due to the lack of a barrier between vehicles coming from opposite directions, front-to-front collisions are more likely to occur on two-way not divided traffic ways. Additionally, the majority of the crashes in CL2 and CL3 occurred on non-interstate highways, where pedestrians are more likely to be present. Large trucks colliding with pedestrians certainly will lead to severe injuries because pedestrians are the most vulnerable road users without any protection. Large trucks colliding with a vehicle in transport was a common important feature across EDS, CL1, and CL2-based models. Daylight conditions reduce the likelihood of severe injuries in the crash scenarios of CL1 and CL3.
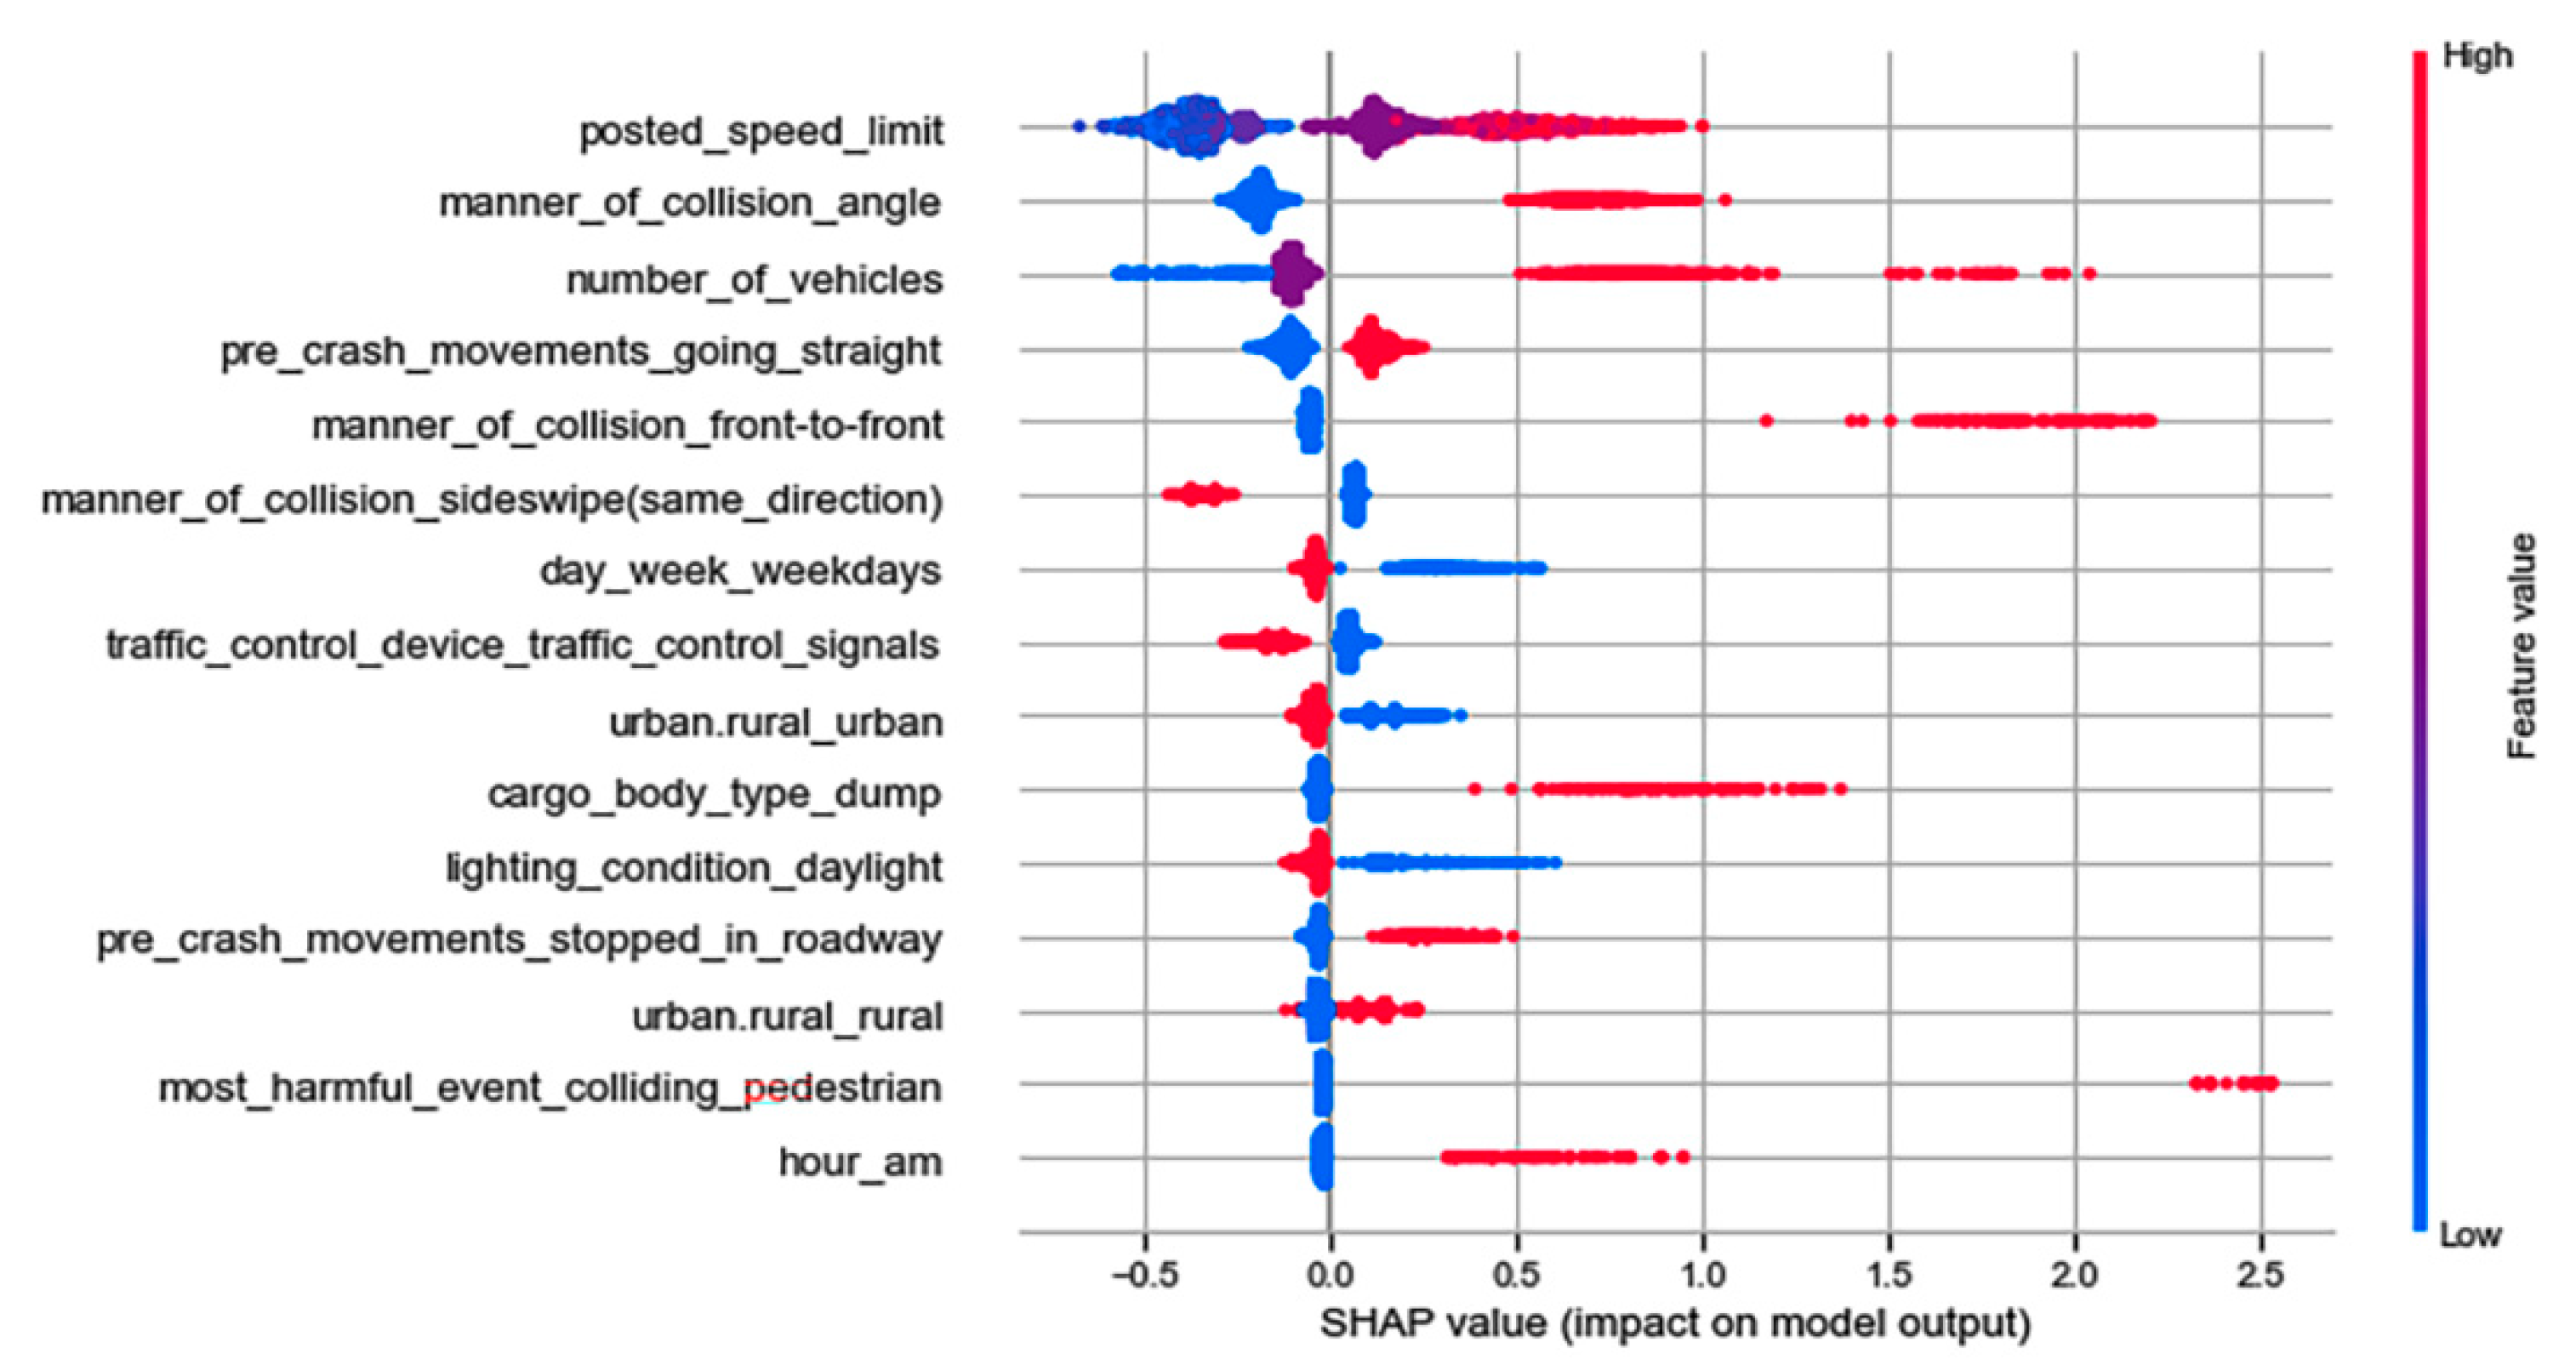
From Table 7, we can also observe that some features were important only in certain individual clusters. Roadway alignment curve left, van/enclosed box cargo body, and two-ways divided with unprotected median increase the chances of severe injuries only in the crashes of CL1. In contrast, pm peak hours and roadway grade unknown slope reduce the likelihood of severe injuries. The rollover/overturn of large trucks enhances the probability of severe injuries only in the crashes of CL2. The remaining exclusive important features in the CL2-based model include cargo body type (i.e., others, unknown), clear weather, and no collision with vehicle in transport. Features such as dump cargo body, urban and rural roadways, traffic control signals, and weekdays were important predictors of injury outcomes only in the CL3-based model. The results indicated that unless the EDS is segmented, the varying effects of some features under different crash scenarios cannot be captured. Additionally, the importance of some features remained hidden during the analysis of the EDS alone.
5. Discussion and Conclusions
Severe injuries and fatalities in crashes involving large trucks have serious impacts on human lives, the local economy, and trucking companies. Moreover, the characteristics of a large truck make the crashes more complex. The complex interactions of contributory factors obscure their effects on injury outcomes and create heterogeneity in crash data. The literature on the analysis of injury severity in crashes involving large trucks is limited in exploring novel methods for the mitigation of unobserved heterogeneity in crash data. Additionally, the variability of data types in crash data has not been addressed often.
This study has proposed the k-prototypes cluster analysis for the mitigation of unobserved heterogeneity in crash data of large trucks. The data used for this study include traffic crashes involving large trucks that occurred in the US from 2016 to 2019. Three homogeneous clusters were identified in the EDS using the k-prototypes cluster analysis. The distribution of the cluster prototypes indicated that the identified clusters were more homogeneous than the EDS. Homogeneous clusters can provide clearer interpretations for different types of crash scenarios involving large trucks. For example, almost 99 percent of the crashes in CL2 occurred on non-interstate highways. In contrast, only around 24 percent of the crashes in the EDS were non-interstate highway crashes. Therefore, the analysis of CL2 can reveal more accurate estimations about the effects of contributory factors on the injury outcome of large truck crashes that occurred on non-interstate highways. Road safety authorities can gain crucial insights by comparing the crashes on the interstate and non-interstate highways.
Further, the study developed four GBDT models on the EDS and three clusters to predict the injury outcome of crashes involving large trucks. The EDS-based model was compared to each cluster-based model in terms of their predicting performances to demonstrate the superiority of the cluster-based models. The comparison of the predicting performances showed that the CL1 and CL2-based GBDT models were better at predicting the injury severity in crashes involving large trucks. The results indicated that developing an injury severity model on the homogeneous clusters improves the model’s overall performance. Similar conclusions were reported in a few previous studies that had developed cluster-based models as well [23,25,33,55].
Additionally, the SHAP method was used to estimate and compare the varying effects of the contributory factors on severe injuries in the EDS and individual clusters. The results showed that some features such as the number of vehicles, posted speed limit, angle collisions, a.m. hours (0–5 a.m.), pre-crash movements (i.e., stopped in roadway), and manner of collision (i.e., sideswipe same direction) had the similar direction of effects in all the models. These estimations are also consistent with some previous studies. Zheng et al. [47] and Islam and Hernandez [6] reported similar effects for the increase in the number of vehicles in large truck-involved crashes. Uddin and Huynh [9], and Islam and Hernandez [56] also reported that crashes occurring in high-speed limit zones and between midnight to 6 a.m. increase the probability of severe injuries in crashes involving large trucks, respectively. A few studies also found that sideswipe collisions are more likely to be associated with non-severe injuries [10,21]. The magnitude of the effects by few features was different in the cluster-based models if compared to the EDS-based model. Further, some relationships between the contributory factors and injury outcomes were important only in certain individual clusters. For example, large trucks rollover/overturn was an important predictor of severe injuries only for the crash scenarios of CL2.
Based on the results of the study, it is fair to conclude that the application of the k-prototypes clustering-based GBDT model is an effective approach for the analysis of severe injuries in crashes involving large trucks. The insights uncovered by the k-prototypes clustering-based model have substantial value from the road safety perspective. Road safety authorities can put signs and change traffic signals on the segments of non-interstate highways, where large truck rollover/overturn are more likely to happen. Traffic engineers may improve the road geometry to reduce the impacts of large truck rollover/overturn. Such preventive measures can reduce severe injuries and fatalities caused by crashes involving large trucks. A reduction in severe injuries and fatalities will lessen the social and economic loss, improve road safety and contribute to sustainable transportation.
Limitations and Future Study
In general, the proportion of severe injuries is fairly low compared to minor injury or property damage only in traffic crash data. As a result, models tend to become biased towards the minor injury or property damage only crashes. This biasness can reduce the accuracy of estimation about effects of the factors that influence severe injuries. The issue of imbalance in injury outcomes can be addressed by over-sampling or under-sampling methods. Future researchers can apply over-sampling or under-sampling measures on the clusters to overcome the issue of class imbalance. Additionally, the study observed that there is a lack of data about the truck driver’s attributes (e.g., level of fatigue prior to the crash, driving experiences). The inclusion of such human factors in the data can produce a better understanding about the causes of crashes involving large trucks. The k-prototypes cluster analysis can be applied to other types of crash data as well, since most of the time, crash data have mixed types of features. Further, a comparative study between the k-prototypes clustering and other types of clustering method can be conducted to identify the superior clustering method.
Author Contributions
Conceptualization, S.A.-S.T. and C.Y.; methodology, S.A.-S.T.; formal analysis, S.A.-S.T.; validation, S.A.-S.T. and C.Y.; writing—original draft preparation, S.A.-S.T.; writing—review and editing, S.A.-S.T. and C.Y.; supervision, C.Y. All authors have read and agreed to the published version of the manuscript.
Funding
This study received no external funding.
Institutional Review Board Statement
Not applicable.
Informed Consent Statement
Not applicable.
Data Availability Statement
The data used for this study are publicly available. The data were collected from Crash Report Sampling System (CRSS) of National Highway Traffic Safety Association (NHTSA) of United States.
Acknowledgments
The authors of the study are grateful to the National Highway Traffic Safety Association of US for making the traffic crash data available for research purposes.
Conflicts of Interest
The authors declare no conflict of interest.
References
- Large Truck and Bus Crash Facts 2018 [Internet]. Federal Motor Carrier Safety Administration Analysis Division. 2020; p. 2012. Available online: https://www.fmcsa.dot.gov/sites/fmcsa.dot.gov/files/2020-09/LTBCF2018-v5_FINAL-09-15-2020.pdf (accessed on 5 January 2021).
- Ahmed, M.M.; Franke, R.; Ksaibati, K.; Shinstine, D.S. Effects of truck traffic on crash injury severity on rural highways in Wyoming using Bayesian binary logit models. Accid. Anal. Prev. 2018, 117, 106–113. [Google Scholar] [CrossRef]
- Azimi, G.; Rahimi, A.; Asgari, H.; Jin, X. Severity analysis for large truck rollover crashes using a random parameter ordered logit model. Accid. Anal. Prev. 2020, 135, 105355. [Google Scholar] [CrossRef] [PubMed]
- Zhu, X.; Srinivasan, S. A comprehensive analysis of factors influencing the injury severity of large-truck crashes. Accid. Anal. Prev. 2011, 43, 49–57. [Google Scholar] [CrossRef] [PubMed]
- Al-bdairi, N.S.S.; Hernandez, S.; Anderson, J. Contributing Factors to Run-Off-Road Crashes Involving Large Trucks under Lighted and Dark Conditions. J. Transp. Eng. Part A Syst. 2018, 144, 04017066. [Google Scholar] [CrossRef]
- Islam, M.B.; Hernandez, S. An Empirical Analysis of Fatality Rates for Large Truck Involved Crashes on Interstate Highways. In Proceedings of the 3rd International Conference on Road Safety and Simulation, Indianapolis, IN, USA, 14–16 September 2011; pp. 1–19. [Google Scholar]
- Osman, M.; Paleti, R.; Mishra, S.; Golias, M.M. Analysis of injury severity of large truck crashes in work zones. Accid. Anal. Prev. 2016, 97, 261–273. [Google Scholar] [CrossRef]
- Naik, B.; Tung, L.W.; Zhao, S.; Khattak, A.J. Weather impacts on single-vehicle truck crash injury severity. J. Saf. Res. 2016, 58, 57–65. [Google Scholar] [CrossRef] [PubMed]
- Uddin, M.; Huynh, N. Injury severity analysis of truck-involved crashes under different weather conditions. Accid. Anal. Prev. 2020, 141, 105529. [Google Scholar] [CrossRef]
- Behnood, A.; Mannering, F. Time-of-day variations and temporal instability of factors affecting injury severities in large-truck crashes. Anal. Methods Accid. Res. 2019, 23, 100102. [Google Scholar] [CrossRef]
- Uddin, M.; Huynh, N. Factors influencing injury severity of crashes involving HAZMAT trucks. Int. J. Transp. Sci. Technol. 2018, 7, 1–9. [Google Scholar] [CrossRef]
- Islam, S.; Jones, S.L.; Dye, D. Comprehensive analysis of single- and multi-vehicle large truck at-fault crashes on rural and urban roadways in Alabama. Accid. Anal. Prev. 2014, 67, 148–158. [Google Scholar] [CrossRef]
- Depaire, B.; Wets, G.; Vanhoof, K. Traffic accident segmentation by means of latent class clustering. Accid. Anal. Prev. 2008, 40, 1257–1266. [Google Scholar] [CrossRef] [Green Version]
- Mannering, F.L.; Bhat, C.R. Analytic Methods in Accident Research Analytic methods in accident research: Methodological frontier and future directions. Anal. Methods Accid. Res. 2014, 1, 1–22. [Google Scholar] [CrossRef]
- Yau, K.K.W. Risk factors affecting the severity of single vehicle traffic accidents in Hong Kong. Accid. Anal. Prev. 2004, 36, 333–340. [Google Scholar] [CrossRef]
- Ulfarsson, G.F.; Mannering, F.L. Differences in male and female injury severities in sport-utility vehicle, minivan, pickup and passenger car accidents. Accid. Anal. Prev. 2004, 36, 135–147. [Google Scholar] [CrossRef]
- Islam, S.; Mannering, F. Driver aging and its effect on male and female single-vehicle accident injuries: Some additional evidence. J. Saf. Res. 2006, 37, 267–276. [Google Scholar] [CrossRef]
- Al-Bdairi, N.S.S.; Hernandez, S. An empirical analysis of run-off-road injury severity crashes involving large trucks. Accid. Anal. Prev. 2017, 102, 93–100. [Google Scholar] [CrossRef] [PubMed]
- Yuan, Q.; Lu, M.; Theo, A.; Li, Y. Investigation on occupant injury severity in rear-end crashes involving trucks as the front vehicle in Beijing area, China. Chin. J. Traumatol. 2017, 20, 20–26. [Google Scholar] [CrossRef]
- Balakrishnan, S.; Moridpour, S.; Tay, R. Differences in single heavy vehicle crashes at intersections and midblocks. J. Adv. Transp. 2016, 50, 2150–2159. [Google Scholar] [CrossRef]
- Uddin, M.; Huynh, N. Truck-involved crashes injury severity analysis for different lighting conditions on rural and urban roadways. Accid. Anal. Prev. 2017, 108, 44–55. [Google Scholar] [CrossRef]
- Anderson, J.C.; Dong, S. Heavy-vehicle Driver Injury Severity Analysis by Time of Week. Inst. Transp. Eng. ITE J. 2017, 87, 41–50. [Google Scholar]
- De Ona, J.; López, G.; Mujalli, R.; Calvo, F.J. Analysis of traffic accidents on rural highways using Latent Class Clustering and Bayesian Networks. Accid. Anal. Prev. 2013, 51, 1–10. [Google Scholar] [CrossRef] [PubMed] [Green Version]
- Kumar, S.; Toshniwal, D. A data mining framework to analyze road accident data. J Big Data. 2015, 2, 26. [Google Scholar] [CrossRef] [Green Version]
- Taamneh, M.; Taamneh, S.; Alkheder, S. Clustering-based classification of road traffic accidents using hierarchical clustering and. Int. J. Inj. Control Saf. Promot. 2016, 24, 388–395. [Google Scholar] [CrossRef] [PubMed]
- Sasidharan, L.; Wu, K.F.; Menendez, M. Exploring the application of latent class cluster analysis for investigating pedestrian crash injury severities in Switzerland. Accid. Anal. Prev. 2015, 85, 219–228. [Google Scholar] [CrossRef] [PubMed]
- Sun, M.; Sun, X.; Shan, D. Pedestrian crash analysis with latent class clustering method. Accid. Anal. Prev. 2019, 124, 50–57. [Google Scholar] [CrossRef]
- Rahimi, A.; Azimi, G.; Asgari, H.; Jin, X. Clustering Approach toward Large Truck Crash Analysis. Transp. Res. Rec. J. Transp. Res. Board 2019, 2673, 73–85. [Google Scholar] [CrossRef]
- Song, L.; Fan, W. Combined latent class and partial proportional odds model approach to exploring the heterogeneities in truck-involved severities at cross and T-intersections. Accid. Anal. Prev. 2020, 144, 105638. [Google Scholar] [CrossRef]
- Lin, Z.; David, W. Exploring bicyclist injury severity in bicycle-vehicle crashes using latent class clustering analysis and partial proportional odds models. J. Saf. Res. 2021, 76, 101–117. [Google Scholar] [CrossRef]
- Chang, F.; Xu, P.; Zhou, H.; Chan, A.H.S.; Huang, H. Investigating injury severities of motorcycle riders: A two-step method integrating latent class cluster analysis and random parameters logit model. Accid. Anal. Prev. 2019, 131, 316–326. [Google Scholar] [CrossRef]
- Rahimi, E.; Shamshiripour, A.; Samimi, A.; Kouros, A. Investigating the injury severity of single-vehicle truck crashes in a developing country. Accid. Anal. Prev. 2020, 137, 105444. [Google Scholar] [CrossRef]
- Assi, K.; Rahman, S.M.; Mansoor, U.; Ratrout, N. Predicting Crash Injury Severity with Machine Learning Algorithm Synergized with Clustering Technique: A Promising Protocol. Int. J. Environ. Res. Public Heal. 2020, 17, 5497. [Google Scholar] [CrossRef] [PubMed]
- Berkhin, P. Survey of Clustering Data Mining Techniques. In Grouping Multidimensional Data; Spinger: Berlin/Heidelberg, Germany, 2006; pp. 1–56. [Google Scholar]
- Huang, Z. Extensions to the k-Means Algorithm for Clustering Large Data Sets with Categorical Values. Data Min. Knowl. Discov. 1998, 2, 283–304. [Google Scholar] [CrossRef]
- Sohn, S.Y.; Lee, S.H. Data fusion, ensemble and clustering to improve the classification accuracy for the severity of road traffic accidents in Korea. Saf. Sci. 2003, 41, 1–14. [Google Scholar] [CrossRef]
- Iranitalab, A.; Khattak, A. Comparison of four statistical and machine learning methods for crash severity prediction. Accid. Anal. Prev. 2017, 108, 27–36. [Google Scholar] [CrossRef]
- Nandurge, P.A.; Dharwadkar, N.V. Analyzing road accident data using machine learning paradigms. In Proceedings of the 2017 International Conference on I-SMAC (IoT in Social, Mobile, Analytics and Cloud) (I-SMAC 2017), Palladam, India, 10–11 February 2017; pp. 604–610. [Google Scholar]
- Kumar, S.; Semwal, V.B.; Solanki, V.K.; Tiwari, P.; Kalitin, D. A Conjoint Analysis of Road Accident Data using K-modes Clustering and Bayesian Networks (Road Accident Analysis using clustering and classification). In Proceedings of the Second International Conference on Research in Intelligent and Computing in Engineering, Gopeshwar, India, 24–26 March 2017; Volume 10, pp. 53–56. [Google Scholar]
- Khorashadi, A.; Niemeier, D.; Shankar, V.; Mannering, F. Differences in rural and urban driver-injury severities in accidents involving large-trucks: An exploratory analysis. Accid. Anal. Prev. 2005, 37, 910–921. [Google Scholar] [CrossRef]
- Islam, M.; Hernandez, S. Large truck-involved crashes: Exploratory injury severity analysis. J. Transp. Eng. 2013, 139, 596–604. [Google Scholar] [CrossRef] [Green Version]
- Chang, L.Y.; Chien, J.T. Analysis of driver injury severity in truck-involved accidents using a non-parametric classification tree model. Saf. Sci. 2013, 51, 17–22. [Google Scholar] [CrossRef]
- Zhang, J.; Li, Z.; Pu, Z.; Xu, C. Comparing prediction performance for crash injury severity among various machine learning and statistical methods. IEEE Access 2018, 6, 60079–60087. [Google Scholar] [CrossRef]
- Chen, M.M.; Chen, M.C. Modeling road accident severity with comparisons of logistic regression, decision tree and random forest. Information 2020, 11, 270. [Google Scholar] [CrossRef]
- Ghandour, A.J.; Hammoud, H.; Al-hajj, S. Analyzing Factors Associated with Fatal Road Crashes: A Machine Learning Approach. Int. J. Environ. Res. Public Health 2020, 17, 4111. [Google Scholar] [CrossRef] [PubMed]
- Eustace, D.; Alqahtani, T.; Hovey, P.W. Classification Tree Modelling of Factors Impacting Severity of Truck-Related Crashes in Ohio. In Transportation Research Board 97th Annual Meeting. 2018. Available online: https://trid.trb.org/view/1497050 (accessed on 23 December 2020).
- Zheng, Z.; Lu, P.; Lantz, B. Commercial truck crash injury severity analysis using gradient boosting data mining model. J. Saf. Res. 2018, 65, 115–124. [Google Scholar] [CrossRef] [PubMed]
- Lundberg, S.M.; Lee, S.I. A unified approach to interpreting model predictions. In Proceedings of the 31st Conference on Neural Information Processing Systems (NIPS 2017), Long Beach, CA, USA, 4–9 December 2017; pp. 4766–4775. [Google Scholar]
- Friedman, J.H. Greedy function approximation: A gradient boosting machine. Ann. Stat. 2001, 29, 1189–1232. [Google Scholar] [CrossRef]
- Popov, S.; Morozov, S.; Babenko, A. Neural oblivious decision ensembles for deep learning on tabular data. arXiv 2019, arXiv:1909.06312. [Google Scholar]
- National Center for Analysis and Statistics, Crash Report Sampling System. Available online: https://www.nhtsa.gov/crash-data-systems/crash-report-sampling-system (accessed on 13 October 2020).
- Štrumbelj, E.; Kononenko, I. Explaining prediction models and individual predictions with feature contributions. Knowl. Inf. Syst. 2013, 41, 647–665. [Google Scholar] [CrossRef]
- Ribeiro, M.T.; Singh, S.; Guestrin, C. “Why should i trust you?” Explaining the predictions of any classifier. In Proceedings of the 22nd ACM SIGKDD International Conference on Knowledge Discovery and Data Mining, San Francisco, CA, USA, 13–17 August 2016; pp. 1135–1144. [Google Scholar]
- Saito, T.; Rehmsmeier, M. The precision-recall plot is more informative than the ROC plot when evaluating binary classifiers on imbalanced datasets. PLoS ONE 2015, 10, e0118432. [Google Scholar] [CrossRef] [Green Version]
- Alikhani, M.; Nedaie, A.; Ahmadvand, A. Presentation of clustering-classification heuristic method for improvement accuracy in classification of severity of road accidents in Iran. Saf. Sci. 2013, 60, 142–150. [Google Scholar] [CrossRef]
- Bin Islam, M.; Hernández, S. Modeling Injury Outcomes of Crashes Involving Heavy Vehicles on Texas Highways. Transp. Res. Rec. J. Transp. Res. Board 2013, 2388, 28–36. [Google Scholar] [CrossRef] [Green Version]
Figure 1.
Optimal number of clusters.

Figure 2.
Summary plot for top 15 important features in EDS-based model.

Figure 3.
Summary plot for top 15 important features in CL1-based model.

Figure 4.
Summary plot for top 15 important features in CL2-based model.

Figure 5.
Summary plot for top 15 important features in CL3-based model.


Table 1.
Descriptions and codes for large trucks.
| Codes | Descriptions |
|---|---|
| 60 | Step van (GVWR > 10,000 lb) |
| 61 | Single-Unit Straight Truck or Cab-Chassis (10,000 lb < GVWR < 19,501 lb) |
| 62 | Single-Unit Straight Truck or Cab-Chassis (19,501 lb < GVWR < 26,000 lb) |
| 63 | Single-Unit Straight Truck or Cab-Chassis (GVWR > 26,000 lb) |
| 64 | Single Unit Straight Truck or Cab-Chassis (GVWR unknown) |
| 66 | Truck-Tractor (cab only or with any number of trailing units) |
| 67 | Medium/Heavy Pickup (GVWR > 4536 kg) |
| 71 | Unknown if Single-Unit or Combination-Unit Medium Truck (10,000 lb < GVWR < 26,000 lb) |
| 72 | Unknown if Single-Unit or Combination-Unit Heavy Truck (GVWR > 26,000 lb) |
| 78 | Unknown Medium/Heavy Truck Type |
| 79 | Unknown Truck Type (Light/Medium/Heavy) |
Table 2.
Definitions and distributions of injury severity (dependent variable).
| Level of Injury | Frequency (%) |
|---|---|
| K = Fatal injury or killed: any injury that results in death of a living person immediately after the crash or within 30 days of a motor vehicle crash. | 323 (3.39%) |
| A = Suspected serious injury: any injury (except fatal injury) that prevents the injured person from continuing his/her usual activities like before the crash (e.g., lacerations, broken or distorted limbs, skull or chest injuries). | 865 (9.07%) |
| Severe injuries (K + A) | 1188 (12.46%) |
| B = Suspected minor injury: any injury that is evident to the observers at the scene (e.g., lump on the head, abrasions, bruises, minor lacerations). | 964 (10.12%) |
| C = Possible injury: any injury that was claimed or complained about but was not evident as fatal, serious injury, or minor injury (e.g., momentary unconsciousness, claim of injury but not evident). | 1298 (13.61%) |
| O = No injury: No person was injured, and only properties were damaged. | 6084 (63.81%) |
| Non-severe injuries (B + C + O) | 8346 (87.54%) |
Table 3.
Description of input features.
| Feature Names | Frequency (%) | Feature Names | Frequency (%) |
|---|---|---|---|
| Vehicle Characteristics | Crash Characteristics | ||
| 1. Cargo body type (cargo_bt) | 15. Pre-crash movement | ||
| Van/enclosed box | 3041 (31.90%) | Going straight | 4846 (50.83%) |
| Other types | 2459 (25.79%) | Turning left | 765 (8.02%) |
| Unknown | 1859 (19.50 %) | Negotiating a curve | 697 (7.31%) |
| Flatbed | 864 (9.06%) | Stopped in roadway | 690 (7.24%) |
| Dump | 535 (5.61%) | Changing lanes | 660 (6.92%) |
| No cargo body | 435 (4.56 %) | Turning right | 580 (6.08%) |
| Cargo tank | 341 (3.58%) | Backing up | 438 (4.59%) |
| 2. Gross vehicle weight (gvwr) | Others (e.g., starting in road, entering parking position, merging, etc.) | 383 (4.02%) | |
| GVWR > 26,000 (26 k) (lb) | 6024 (63.18%) | Decelerating in road | 377 (3.95%) |
| 10 k (lb) < GVWR < 26 k (lb) | 3510 (36.82%) | Passing or overtaking another vehicle | 98 (1.03%) |
| 3. Trailing unit | 16. Manner of collision | ||
| Yes | 4962 (52.05%) | Front to rear | 2753 (28.88%) |
| No | 4572 (47.95%) | Sideswipe, same direction | 2306 (24.19%) |
| 4. Hazardous material involvement | No collision with motor vehicle in transport | 1926 (20.20%) | |
| No | 9421 (98.81%) | Angle | 1696 (17.79%) |
| Yes | 113 (1.19%) | Others | 332 (3.48%) |
| 5. Speed related | Sideswipe, opposite direction | 302 (3.17%) | |
| No | 9156 (96.04%) | Front-to-front | 219 (2.30%) |
| Yes | 378 (3.96%) | 17. Most harmful event | |
| 6. Number of vehicles in crash | Mean = 2, Std = 0.63 | Colliding vehicle in transport | 7529 (78.97%) |
| 7. Number of occupants | Mean = 1.18, Std = 0.53 | Colliding fixed object | 754 (7.91%) |
| Roadway Characteristics | Rollover/overturn | 347 (3.64%) | |
| 8. Trafficway type | Colliding parked motor vehicle | 261 (2.74%) | |
| Two-way, not divided | 3687 (38.67%) | Colliding vehicle outside trafficway | 169 (1.77%) |
| Two-way divided with positive median barrier | 3026 (31.74%) | Others | 127 (1.33%) |
| Two-way, divided, unprotected median | 1603 (16.81%) | Colliding pedestrian | 107 (1.12%) |
| Two-way, not divided with continuous left-turn lane | 419 (4.39%) | Colliding live animal | 101 (1.06%) |
| One-way | 280 (2.94%) | Hitting guardrail/face | 97 (1.02%) |
| Non-trafficway or driveway access | 267 (2.80%) | Colliding pedal cyclists | 42 (0.44%) |
| Entrance/exit ramp | 252 (2.64%) | Temporal Attributes | |
| 9. Roadway alignment | 18. Day of week | ||
| Straight | 8300 (87.06%) | Weekdays | 8338 (87.46%) |
| Curve left | 433(4.54%) | Weekends | 1196 (12.54%) |
| Others | 406(4.26%) | 19. Time of the day (hour) | |
| Curve right | 395(4.14%) | Non-peak (10 a.m.–16 p.m.) | 4238 (44.45%) |
| 10. Roadway grade | AM peak (5 a.m.–10 a.m.) | 2782 (29.18%) | |
| Level | 7573 (79.43%) | Pm Peak (16 p.m.–19 p.m.) | 1162 (12.19%) |
| Grade unknown slope | 885 (9.28%) | AM (0 a.m.–5 a.m.) | 732 (7.68%) |
| Downhill | 361 (3.79%) | Night (19 p.m.–23:59 p.m.) | 620 (6.50%) |
| Uphill | 284 (2.98%) | Environmental Characteristics | |
| Non trafficway/driveway access | 267 (2.80%) | 20. Road surface condition | |
| Others | 164 (1.72%) | Dry | 7662 (80.37%) |
| 11. Traffic control device | Wet | 1278 (13.40%) | |
| No controls | 7090(74.37%) | Others | 594 (6.23%) |
| Traffic control signals | 1601 (16.79%) | 21. Lighting condition | |
| Stop sign | 428 (4.49%) | Daylight | 7470 (78.35%) |
| Other sign signals | 415 (4.35%) | Dark-not lighted | 1007 (10.56%) |
| 12. Posted speed limit | Mean = 47.32, Std = 16.68 | Dark-lighted | 734 (7.70%) |
| 13. Interstate highway | Dark unknown light and others | 323 (3.39%) | |
| No | 7242 (75.96%) | 22. Weather condition | |
| Yes | 2292 (24.04%) | Clear | 6696 (70.23%) |
| 14. Location | Cloudy | 1667 (17.48%) | |
| Urban | 6583(69.05%) | Rain | 860 (9.02%) |
| Rural | 2951 (30.95%) | Snow | 182 (1.91%) |
| Others | 129 (1.35%) | ||
Table 4.
Confusion matrix.
| Classes | Positive Prediction | Negative Prediction |
|---|---|---|
| Positive class | True Positive (TP) | False Negative (FN) |
| Negative class | False Positive (FP) | True Negative (TN) |
Table 5.
Description of cluster prototypes.
| Cluster Prototypes | EDS 9534 (100%) | CL1 2680 (28.11%) | CL2 3460 (36.29%) | CL3 3394 (35.6%) | |
|---|---|---|---|---|---|
| Trailing Unit | No | 47.95% | 19.25% | 25.75% | 93.25% |
| Yes | 52.05% | 80.75% | 74.25% | 6.75% | |
| GVWR | Over 26 k (lb) | 63.18% | 87.05% | 87.83% | 19.21% |
| 10 k–26 k (lb) | 36.82% | 12.95% | 12.17% | 80.79% | |
| Traffic way | Two-way, not divided | 38.67 % | 1.83% | 56.62% | 49.47% |
| Two-way divided with positive median barrier | 31.74% | 77.76% | 8.82% | 18.77% | |
| Two-way, divided, unprotected median | 16.81% | 15.49% | 18.01% | 16.65% | |
| Two-way, not divided with continuous left-turn lane | 4.39% | 0.37% | 5.49% | 6.45% | |
| One-way trafficway | 2.94% | 1.38% | 3.73% | 3.36% | |
| Non-trafficway or driveway access | 2.80% | 0% | 4.80% | 2.98% | |
| Entrance/exit ramp | 2.64% | 3.17% | 2.54% | 2.33% | |
| Posted speed limit | 25th percentile | 35 (mph) | 60 (mph) | 35 (mph) | 35 (mph) |
| 50th percentile | 45 (mph) | 65 (mph) | 40 (mph) | 45 (mph) | |
| 75th percentile | 55 (mph) | 70 (mph) | 55 (mph) | 55 (mph) | |
| Interstate highway | Yes | 75.96% | 76.42% | 1.45% | 5.72% |
| No | 24.04% | 23.58% | 98.55% | 94.28% | |
| Injury Severity | Non-severe | 87.54% | 85.11% | 87.2% | 89.81% |
| Severe | 12.46% | 14.89% | 12.8% | 10.19% | |
Table 6.
Predicting performance evaluation.
| Dataset | Validation | Accuracy | Precision | Sensitivity | Specificity | PR-AUC Score |
|---|---|---|---|---|---|---|
| EDS | Train | 88.73% | 70% | 16.83% | 98.97% | 49.53% |
| Test | 87.63% | 51.06% | 13.48% | 98.16% | 40.12% | |
| CL1 | Train | 87.69% | 78.57% | 23.66% | 98.87% | 58.40% |
| Test | 87.19% | 74.29% | 21.67% | 98.68% | 45.82% | |
| CL2 | Train | 89.68% | 78.3% | 26.77% | 98.91% | 61.88% |
| Test | 88.34% | 62% | 23.31% | 97.90% | 45.40% | |
| CL3 | Train | 91.03% | 78.43% | 16.53% | 99.48% | 52.60% |
| Test | 90.09% | 56.52% | 12.50% | 98.91% | 34.23% |
Table 7.
Important common and unique features in the EDS and clusters.
| Injury Outcome | Input Feature Names | EDS | CL1 | CL2 | CL3 |
|---|---|---|---|---|---|
| Severe injuries | Number of vehicles | √ | √ | √ | √ |
| Posted speed limit | √ | √ | √ | √ | |
| Manner of collision: angle | √ | √ | √ | √ | |
| Manner of collision: front-to-rear | √ | √ | |||
| Manner of collision: front-to-front | √ | √ | √ | ||
| Hour: am | √ | √ | √ | √ | |
| Pre-crash movements: stopped in roadway | √ | √ | √ | √ | |
| Pre-crash movements: going straight | √ | √ | √ | ||
| Most harmful event: colliding pedestrian | √ | √ | √ | ||
| Most harmful event: colliding vehicle in transport | √ | √ | √ | ||
| Most harmful event: rollover/overturn | √ | ||||
| Weather: clear | √ | ||||
| Trafficway type: two-way divided unprotected median | √ | ||||
| Cargo body type: van/enclosed | √ | ||||
| Cargo body type: others | √ | ||||
| Cargo body type: dump | √ | ||||
| Roadway alignment: curve left | √ | ||||
| Lighting condition: dark not lighted | √ | √ | |||
| Road surface condition: dry | √ | ||||
| GVWR: over 26 k (lb) | √ | ||||
| Urban/rural: rural | √ | ||||
| Non-severe injuries | Manner of collision: sideswipe same direction | √ | √ | √ | √ |
| Manner of collision: no collision with vehicle in transport | √ | ||||
| Urban/rural: urban | √ | ||||
| Day of week: weekdays | √ | ||||
| Cargo body type: unknown | √ | ||||
| Lighting condition: daylight | √ | √ | |||
| Traffic control device: traffic control signals | √ | ||||
| GVWR: 10 k–26 k (lb) | √ | ||||
| Hour: pm peak | √ | ||||
| Roadway grade: unknown slope | √ |
Publisher’s Note: MDPI stays neutral with regard to jurisdictional claims in published maps and institutional affiliations. |
© 2021 by the authors. Licensee MDPI, Basel, Switzerland. This article is an open access article distributed under the terms and conditions of the Creative Commons Attribution (CC BY) license (https://creativecommons.org/licenses/by/4.0/).
Share and Cite
MDPI and ACS Style
Tahfim, S.A.-S.; Yan, C. Analysis of Severe Injuries in Crashes Involving Large Trucks Using K-Prototypes Clustering-Based GBDT Model. Safety 2021, 7, 32. https://0-doi-org.brum.beds.ac.uk/10.3390/safety7020032
AMA Style
Tahfim SA-S, Yan C. Analysis of Severe Injuries in Crashes Involving Large Trucks Using K-Prototypes Clustering-Based GBDT Model. Safety. 2021; 7(2):32. https://0-doi-org.brum.beds.ac.uk/10.3390/safety7020032
Chicago/Turabian StyleTahfim, Syed As-Sadeq, and Chen Yan. 2021. "Analysis of Severe Injuries in Crashes Involving Large Trucks Using K-Prototypes Clustering-Based GBDT Model" Safety 7, no. 2: 32. https://0-doi-org.brum.beds.ac.uk/10.3390/safety7020032
Note that from the first issue of 2016, this journal uses article numbers instead of page numbers. See further details here.