
Quantification and Analysis of Risk Exposure in the Maritime Industry: Averted Incident Costs Due to Inspections and the Effect of SARS-Cov-2 (COVID-19)


Econometric Institute, Erasmus University, Burgemeester Oudlaan 50, 3062 PA Rotterdam, The Netherlands
Safety 2021, 7(2), 43; https://0-doi-org.brum.beds.ac.uk/10.3390/safety7020043
Submission received: 28 January 2021
/
Revised: 18 April 2021
/
Accepted: 25 May 2021
/
Published: 2 June 2021
Abstract
:Shipping provides essential services even during global pandemics such as SARS-CoV-2 (COVID-19). The present approach estimates the monetary value at risk (MVR) at the global and regional level for the world fleet and quantifies the amount of averted incident costs due to inspections. It also provides an indication of the effect of COVID-19 on both. This information can help maritime stakeholders to better understand their risk exposure and improve mitigation strategies. The analysis is based on the global fleet, using a comprehensive combination of data. The analysis confirms the importance to estimate all components at ship level, as safety qualities differ, and each vessel benefits differently from an inspection. Estimates of MVR were slightly higher than global insurance premiums with USD 13.7 to 17.8 billion. Over half of the MVR was due to other marine liabilities and hull and machinery, with cruise vessels leading to loss of life and injuries and oil tankers leading to pollution. The top 25 flags accounted for 87.9% of MVR with open registries in the lead. In terms of value of MVR per GRT, traditional flags, Non-IACS flags and owners located in low to upper middle-income countries, showed the highest values. Total MVR decreased by 4.18% due to the effects of the pandemic, but pollution risk exposure increased by 6% in 2020 as compared to 2019. Averted yearly incident costs were estimated to be 25% to 40% of global MVR, which highlights the importance of port state control inspection programs, but as inspection coverage decreased, this translated into a reduction of 6 to 11% of averted incident costs.
1. Introduction
Shipping facilitates global trade even in times of economic downturns, and the pandemic has demonstrated the essential part of the maritime industry. According to UNCTAD [1], the crisis has also brought a variety of trends and shifts such as “increased risk management and resilience building becoming the new policy and business mantras”. Incident costs can be extremely high, and substandard shipping can distort competition. For a coastal state, in particular, or a maritime administration maintaining inspection programs to mitigate risk exposure in its Exclusive Economic Zone (EEZ), it is important to understand the magnitude of risk exposure that should be mitigated, since mitigation options should be proportionate to the risk exposure. The present approach presents and a applies a methodology that can help coastal states and maritime administrations and other maritime stakeholders to estimate risk exposure, to understand how changes such as the pandemic have affected it and to assess the value of their inspection programs using quantitative methods. The value of the inspection programs is translated here into averted incident costs due to inspections and estimated for the global and regional level, using data on the world fleet covering all ship types.
Shipping is regulated by a complex legislative framework of over fifty conventions of the International Maritime Organization (IMO), and enforcement is the duty of sovereign flag states. Since the legislative framework is not enforced equally across all flag states, Port State Control (PSC) acts as second line of defense to combat substandard shipping. PSC is a right of a coastal state and not an obligation, but it forms an important risk mitigation option for coastal states, among others (e.g., Vessel Traffic Services, pilotages, under keel clearance, aids to navigation and navigational aids, emergency towing vessels and emergency pollution response equipment). At the global level, there are ten port state control regimes or Memoranda of Understanding (MoU) covering almost all ports. For a detailed description of PSC, refer to Knapp [2] who analysed and compared the effectiveness of PSC in detail, using quantitative methods.
Given the increased importance of risk mitigation and understanding of risk exposure to enhance risk mitigation options and to ensure that they are proportional to the risk exposure, this report consists of three areas, as follows.
First, it presents the methodology and components used to quantify global risk exposure, expressed as the monetary value at risk (MVR). It compares results with global insurance premiums, building on research from Knapp and Heij [3] but extending the legislative framework and applying it to a longer time period (2017 to 2020). The methodology is applied to the global fleet and regional application is presented by exploring two options to estimate MVR at the regional level, such as (1) by means of nautical miles travelled or (2) days spent in the EEZ, calculated at the ship level. All components of MVR are estimated at the ship level since vessels have different safety qualities. MVR in general allows coastal states to better understand the magnitude of their risk exposure and how to best invest in mitigation strategies, It forms the basis to estimate the effect of the pandemic due to changes in trade and risk profiles, as well as the effect of port-state control inspections in decreasing risk exposure.
Second, the effect of port state control inspections is measured (Knapp et al. [4]) by quantifying the amount of averted or mitigated incident costs, due to inspections. This allows maritime administrations to assess the value of their inspection programs and justify them, as well as allocate resources more effectively across various ports within a country or region.
Third, making comparisons between the time periods 2017 to 2019 and 2020, the effect of the SARS-CoV-2 (COVID-19) pandemic on risk exposure and averted incident costs is quantified. This allows coastal states and maritime administration to better understand the change of risk exposure due to changes in trade and ship traffic as well as ship risk profiles, and how it affects their respective area of interest as compared to the global situation.
Risk exposure is quantified as the monetary value at risk (MVR) and can be interpreted as a proxy to incident costs, based on the concept first developed by Knapp and Heij [3]. MVR is defined as the weighted average of potential incident type costs where the following damage types are considered: cargo damage, damage to hull and machinery, loss of life and injuries, pollution (oil and HNS), total loss of vessel for wreck removals and other marine liabilities covered by the legislative framework.
Estimation scenarios were run for the years 2017 to 2020, using relevant input data feeds of the global fleet from various sources. This resulted in millions of computations as risk components which were estimated at the individual ship level at a specific time. A software program called SOMRS was created in PHP. SOMRS can estimate probabilities and calculate MVR and the inspection effect at the ship level, which formed the basis of the analysis presented here.
2. Data and Methodology Used in This Analysis
The analysis was based on comprehensive combination of data covering the global fleet (ship particulars, inspections, incidents, cargo values, secondhand prices of vessels, special drawing right limits from IMO conventions, arrival data, AIS data, etc.). Table 1 provides on overview of the data combinations used. Type A data was used to estimate risk formulae and the effect of an inspection. Risk formulae to estimate probabilities were estimated based on matrices from 2014 to 2019 (with lagged data to account for histories going back to 2011). The underlying data matrix for incident type models was 721,767 observations (27,809 incidents) and for conditional damage type probabilities, the subset of incidents (27,809 observations) was used. Type B data was used by SOMRS and was mainly from the timeframe 2017 to 2020, resulting in 489,435 observations or 133,799 unique IMO. Type C data was used for comparisons. Ship types were grouped into major ship types as follows—general cargo, dry bulk, container, tanker (oil, chemical, product, other), passenger (cruise, other), tugs, fishing vessels, pleasure craft (with IMO, which are large yachts) and all other ship types.
All vessel related data were linked at the ship level (using IMO, which provides the unique identifier for a vessel), except for Secondhand Prices of Vessels and Cargo Values where average values by unit/ship type were used and were calculated at the ship level. For regional applications, data from two coastal states were received (arrival data and nautical miles travelled derived from AIS positions). For data received from AIS positions, MMSI was used as a unique identifier (which can change with flag change and is time dependent); MMSI was converted to IMO to link the respective data source to a vessel. Two different regional applications were tested to convert the global MVR value to the regional level.
Global incident data were combined from various sources (IMO, USCG, LLIS, IHSM) and duplicate data were eliminated prior to further processing the data. The remaining incidents were reclassified according to IMO definitions [5]—the categories were very serious (including total loss), serious, and less serious. When possible, the first event of the chain of events was identified to determine the dependent variable needed to estimate the models used for conditional damage type probabilities (e.g., loss of life, hull-related failures, cargo-related failures, etc.). Note that in estimation of the risk formulae, less serious incidents were not included as otherwise the data would be biased, since there is a great degree of underreporting with less serious incidents and near misses. Less serious incidents and near misses are all other incident types that are not covered by very serious and serious incidents, as per the IMO definitions [5].
Appendix A provides a high-level overview of the global fleet from 2017 to 2020, with the respective status codes based on data from IHSM, which were available for the analysis. Note that data on pleasure crafts, which are large yachts with IMO numbers, were not available for the years 2017 and 2018 but were more complete for 2019 and 2020. Overall, the fleet increased modestly with a modest increase in laid-up vessels as of December 2020, as compared to the previous year. The various other data sources listed in Table 1 were linked to the global fleet, using IMO as the unique vessel identifier.
2.1. Methodology to Estimate Monetary Value at Risk (MVR) and the PSC Inspection Effect
The methodology used for estimating MVR is based on Knapp and Heij [3] but was extended to include all relevant IMO conventions. The current approach was also based on data from the world fleet and more refined data with respect to the total insurable values as well as a longer time-period (2017 to 2020). The methodology for estimating and quantifying the effect of a PSC inspection was based on the methodology used by Knapp et al. [4], as applied to the world fleet subject to port-state control inspections. MVR and the inspection effect were calculated for total loss, very serious and serious incidents (TLVSS), and all incidents (ALL). Note that estimates of TLVSS were more accurate, as compared to ALL, since there was underreporting with less serious incidents. Three main components were needed to estimate MVR and to quantify the inspection effect—(1) the total insurable value (TIV), (2) ship-specific probabilities and conditional damage type probabilities, and (3) the inspection effect of a PSC inspection. For regional application, a regional adjustment needed to be made to the global-risk exposure and two approaches were used—one based on nautical miles travelled and the second one based on days spent in the EEZ. Each of these components are described in separate sections.
Risk exposure expressed as MVR was defined as the weighted average of potential damages where the following damage types were considered—cargo damages, damages to hull and machinery, loss of life and injuries, pollution (oil and HNS), total loss of vessel for wreck removals, and other marine liabilities covered by the legislative framework. The basis to determine various forms of damages for each incident type was based on the total insurable values (TIV values), such as cargo values, secondhand prices of vessels, and special drawing rights of international conventions that determine the maximum of insurable values. The TIV values could be very high and since incidents normally have several forms of damage types or consequences for each individual incident, the distribution of damage types across all damages associated with an incident was estimated by the conditional probability for each damage type, which adjusts the individual TIV values (denoted TIVadjusted).
Following Knapp and Heij [3], let the damage categories be denoted by j (j = 1, …, 7) and let Vj be the total insurable value for value type j. Then, the total insurable value (TIV) is the sum of individual V values for all damage-type categories. In addition, let Pinc be the yearly probability of an incident (TLVSS or ALL) and let Pj be the conditional probability of damage category j (TLVSS or ALL), then the monetary value at risk (MVR) of a vessel is defined as:
To estimate and quantify the effect of inspection, Knapp et al. (2011) used survival analysis to quantify the reduction in incident costs towards total loss (TL) by ship-type. In the present approach, the methodology was adapted but instead of using the probability of survival (TL), the probability of incident (TLVSS and ALL) was modelled by means of the logit model. The estimated inspection effect as the reduction in the probability of incident IEprob at the ship level becomes IEprob = Pnotinspected − Pinspected, where Pnotinspected is the probability of incident (TLVSS, ALL) without the effect of inspections and Pinspected is the probability of incident with inspection at the ship level. In this study, the inspections were merged up, with a maximum of 360 days prior to the incident date representing at least 1 inspection within 365 days prior to the incident (for model results, please refer to Appendix C).
The inspection effect was then translated into a monetary value, which could be interpreted as averted incident costs due to an inspection. To quantify the inspection effect into dollar amounts, Knapp et al. [4] used two boundaries, the upper boundary was IEprob multiplied by the TIV value and the lower boundary was IEprob multiplied by the TIV value adjusted by the conditional damage-type probabilities (denoted TIVadjusted). The upper boundary assumed 100% damages for all damage types and was the maximum effect (more a hypothetical figure that gave an indication of the range), while the lower boundary was the one most relevant for this analysis, as it corrected the TIV values with the conditional damage-type probabilities and adjusted the damage types by their relevant spread. Incidents rarely have 100% loss or damage for an incident, but are rather a combination of damage types with a spread across it (e.g., 10% loss of life, 5% cargo, 40% hull and machinery, etc.). TIVadjusted rather than MVR was used because MVR accounts for the inherent probability of incident, which partly accounted for inspections effects and other risk control options, since it was estimated based on observed incident data.
2.2. Total Insurable Value (TIV)
The total insurable value (TIV) was calculated for each of the damage types mentioned earlier at the individual ship level. The value of hull and machinery was based on average second-hand prices from Clarkson’s Shipping Intelligence Network (SIN). Cargo values were complex, and the estimates were used based on a study by ABPmer and Vivid Economics [6] and varied significantly across ship types. The unit values for cargo values were transferred into DWT unit prices and were calculated at the ship level. The TIV limits for pollution, property damages, wreck removal, loss of life, and injuries were based on the Special drawing rights (SDR) and limits of the IMO conventions or respective Protocols, and depended mostly on the size of the vessels, such as GRT or number of passengers:
- (1)
- International Convention on Civil Liability for Oil Pollution Damage (CLC), 1969 and the 1992 Protocol to the International Convention on the Establishment of an International Fund for Compensation for Oil Pollution Damage (FUND 1992).
- (2)
- Athens Convention relating to the Carriage of Passengers and their Luggage by Sea (PAL), 1974.
- (3)
- Convention on Limitation of Liability for Maritime Claims (LLMC), 1976.
- (4)
- International Convention on Liability and Compensation for Damage in Connection with the Carriage of Hazardous and Noxious Substances by Sea (HNS), 1996 (and its 2010 Protocol).
- (5)
- International Convention on Civil Liability for Bunker Oil Pollution Damage, 2001.
- (6)
- Nairobi International Convention on the Removal of Wrecks, 2007.
The HNS Convention is not yet in force but the SDR limits were used to account for various damage types related to pollution of HNS. For this reason, only the pollution part was applied, as once the HNS convention was in force, there would be some overlaps with other conventions.
TIV values were large and varied considerably by ship type and did not change considerably from year to year, since the majority was based on the special drawing right limits of international conventions. For the years 2017 to 2020, the average yearly TIV value of the world fleet was estimated to be USD 20.71 trillion, of which 56.82% was allocated to Pollution, 22.25% for loss of life and injuries, 7.16% for cargo damage, 3.32% for hull and machinery, and 10.45% for other marine liabilities, such as damage to property, as by the LLMC convention. When adjusted by the conditional damage type probabilities for each damage type to account for the combination of damages that occur, and given an incident occurs, TIVadjusted becomes USD 1.42 (ALL) to 1.12 (TLVSS) trillion. Not surprisingly, the highest values were found among passenger vessels for loss of life, among oil tankers for pollution, and among container ships for cargo values (refer to Appendix B). Highest variability was associated with cruise vessels due to some large vessels (6000+ passengers). This study did not further analyze the TIV values, which were adjusted at the ship level with the ship level conditional damage-type probabilities.
2.3. Incident and Damage-Type Probabilities Estimated at the Ship Level
Two types of probabilities estimated at the ship level were used in this analysis. The underlying matrix to estimate the formulae to estimate probabilities was based on world fleet, incident data, and inspection data for the years 2014 to 2019 (see Appendix C for model statistics). The formulae were then implemented in SOMRS, which then estimated probabilities, given the input data feeds at a specific point for the years 2017 to 2020. As mentioned in the previous section, the unconditional probability of incident (TLVSS or ALL) denoted by Pinc, and the conditional damage-type probability given an incident (TLVSS or ALL) occurred denoted by Pj were estimated. A total of 16 models were estimated and used, where type A was unconditional and quantified the inherent risk profile of the vessel and type B were conditional damage-type probabilities, given an incident occurred (TLVSS and ALL):
- (1)
- Type A: Probability of very serious and serious incident (TLVSS and ALL).
- (2)
- Type B: Conditional probability of hull and machinery damages (TLVSS and ALL).
- (3)
- Type B: Conditional probability of cargo damages (TLVSS and ALL).
- (4)
- Type B: Conditional probability of loss of life and injuries (TLVSS and ALL).
- (5)
- Type B: Conditional probability of oil pollution (TLVSS and ALL).
- (6)
- Type B: Conditional probability of chemical pollution (TLVSS and ALL) as proxy to HNS (hazardous and noxious substances).
- (7)
- Type B: Conditional probability of total loss (TLVSS and ALL) used for wreck removals.
- (8)
- Type B: Conditional probability of other marine liabilities (TLVSS and ALL).
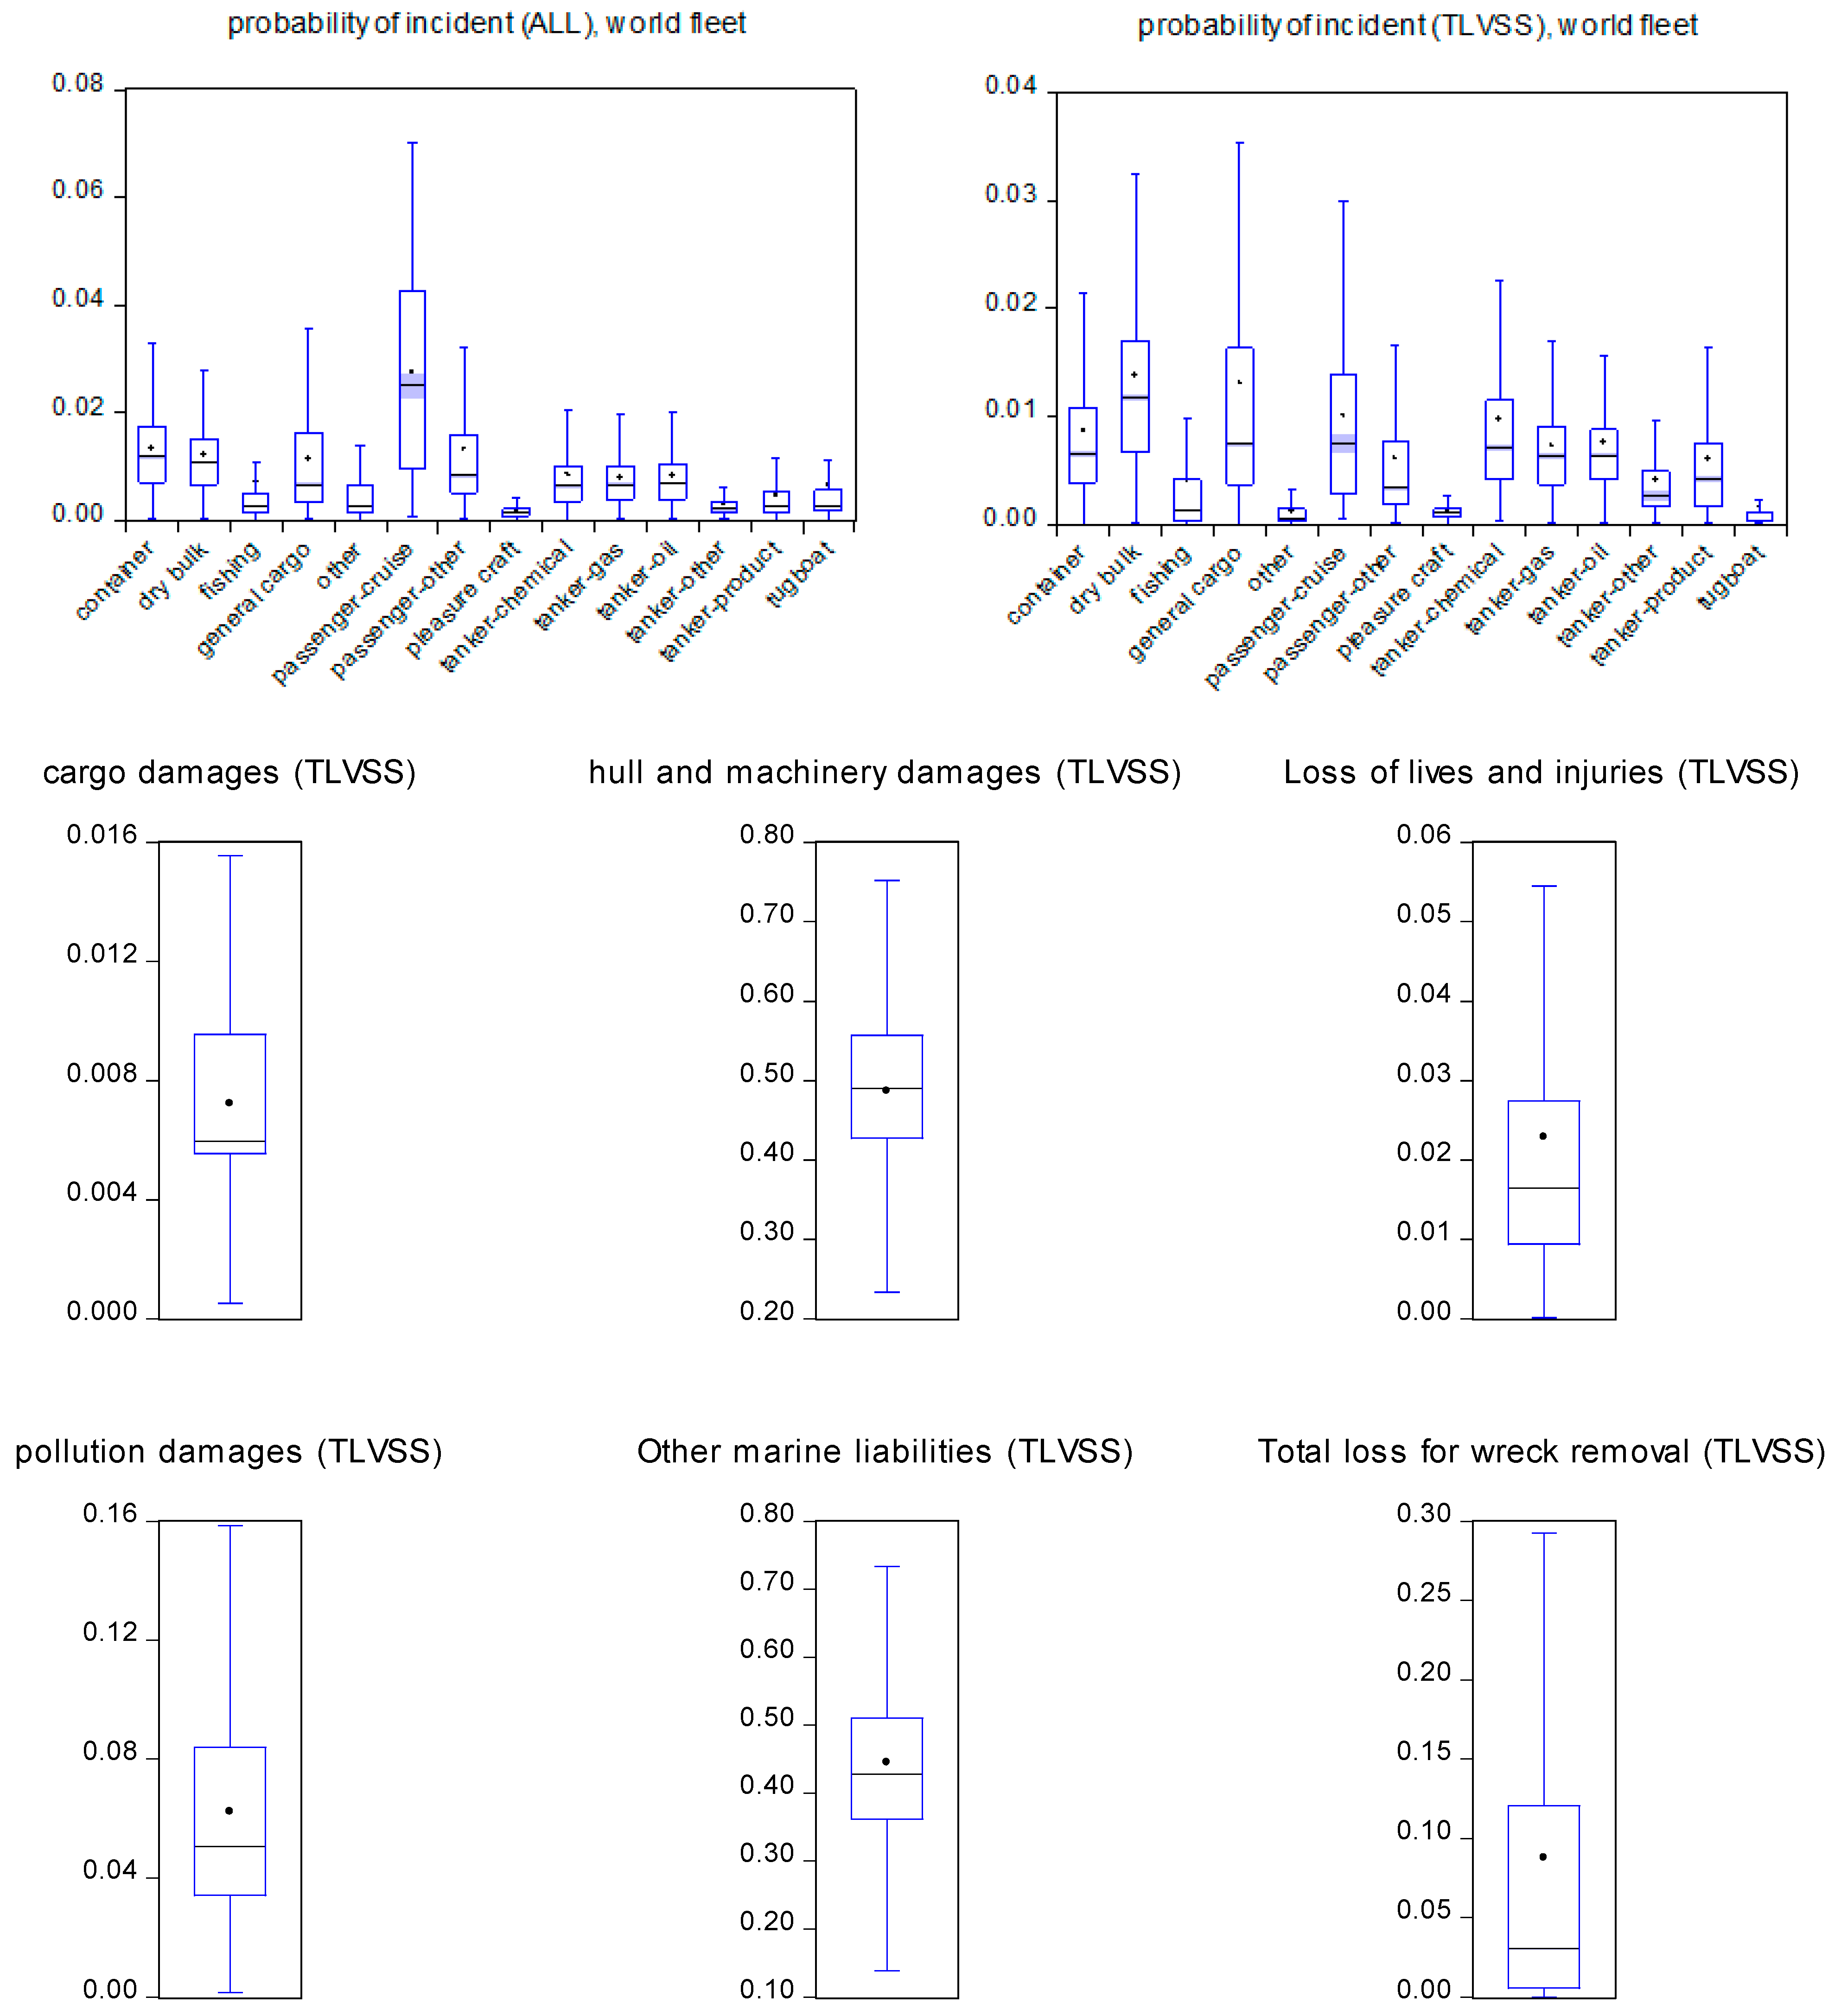
Note that the models for HNS were based on small sample sizes, and are to be interpreted with caution. Conditional damage-type probabilities were estimated on a subset of the type A models, namely on all incident data only. Appendix D provides boxplots of the probabilities at the ship level and clearly demonstrate the differences in the risk profiles at the individual ship level. While individual probabilities change over time, they did not change significantly across the time frame provided here. The selection of variables—explanatory variables to estimate the formulae—was based on Knapp [2], Heij and Knapp [7], Knapp and Heij [8]. These were as follows:
- (1)
- Age, GRT.
- (2)
- Classification society and flag.
- (3)
- Shipyard country of built and interaction effects with age.
- (4)
- The ‘presence of maritime expertise’ expressed as concentration of ownership companies, DoC companies, main engine builders, main engine designers in a particular country.
- (5)
- Years of existence of beneficial ownership and DoC company.
- (6)
- Main engine designer (individual company).
- (7)
- Main engine builder (individual country of location).
- (8)
- Previous inspection and incident history of a vessel (30 to 360 days prior).
- (9)
- Changes of particular over time and within a 3 year period.
- (10)
- Beneficial Owner and DoC company location.
The base model to estimate the probability of detention or the probability of incident is a binary logistic regression model. The dependent variable (y) of interest was binary and could either be 1 (incident) or 0 (no incident). For type A, this related directly to incidents, while for model type B, this related to damage types (e.g., hull and machinery, loss of life, pollution). Let xi be the explanatory factors mentioned above (e.g., age, size, flag, classification society, owner, etc.), then the logit model postulates that P (yi = 1|xi) = F (xiβ), where the weights β consist of a vector of unknown parameters and F is a cumulative distribution function (CDF). A frequent choice is the CDF of the logistic distribution, which gives the well-known logit model. This model states that P (yi = 1|xi) = exp(xiβ)/(1 + exp(xiβ) where xiβ is a weighted average of all explanatory factors plus the intercept. The probabilities are estimated at the individual ship level (i). For further details on logit models, refer to Heij et al. [9] or Verbeek [10]. Quasi-maximum likelihood (QML) was used to estimate the coefficients (Greene [11]), in order to give some allowance for a possible misspecification of the assumed underlying distribution function.
2.4. Estimating the Effect of PSC Inspections
Appendix C provides the results of the regressions to obtain the inspection effect based on the logit models. The effect was mostly negative, meaning an increase in inspections reduced the probability of incident, with earlier time frames either being positive or not significant for both (ALL and TLVSS). The effect could range from 0.07% (large yachts) to a maximum effect of 17% for some ship types (fishing vessels). For this reason, it is important to calculate this effect at the ship level, which has been accomplished in the present study, since vessels have different safety qualities and benefit differently from an inspection. A riskier vessel will have more benefit and show a higher reduction in reducing the incident type probability than a well-managed, less riskier vessels. This study took these differences into account.
Using SOMRS, the formulae were implemented and the effect was estimated for the world fleet and aggregated for the inspected vessels, since not all vessels were inspected. To translate the inspection effect into averted incident costs due to inspections using MVR, the yearly effect was taken, which was the effect up to a maximum of 365 days. It was interpreted as the effect of having at least one inspection prior to the incident, where the probability of incident is a yearly probability.
2.5. Adjusting MVR and the Inspection Effect to the Regional Level
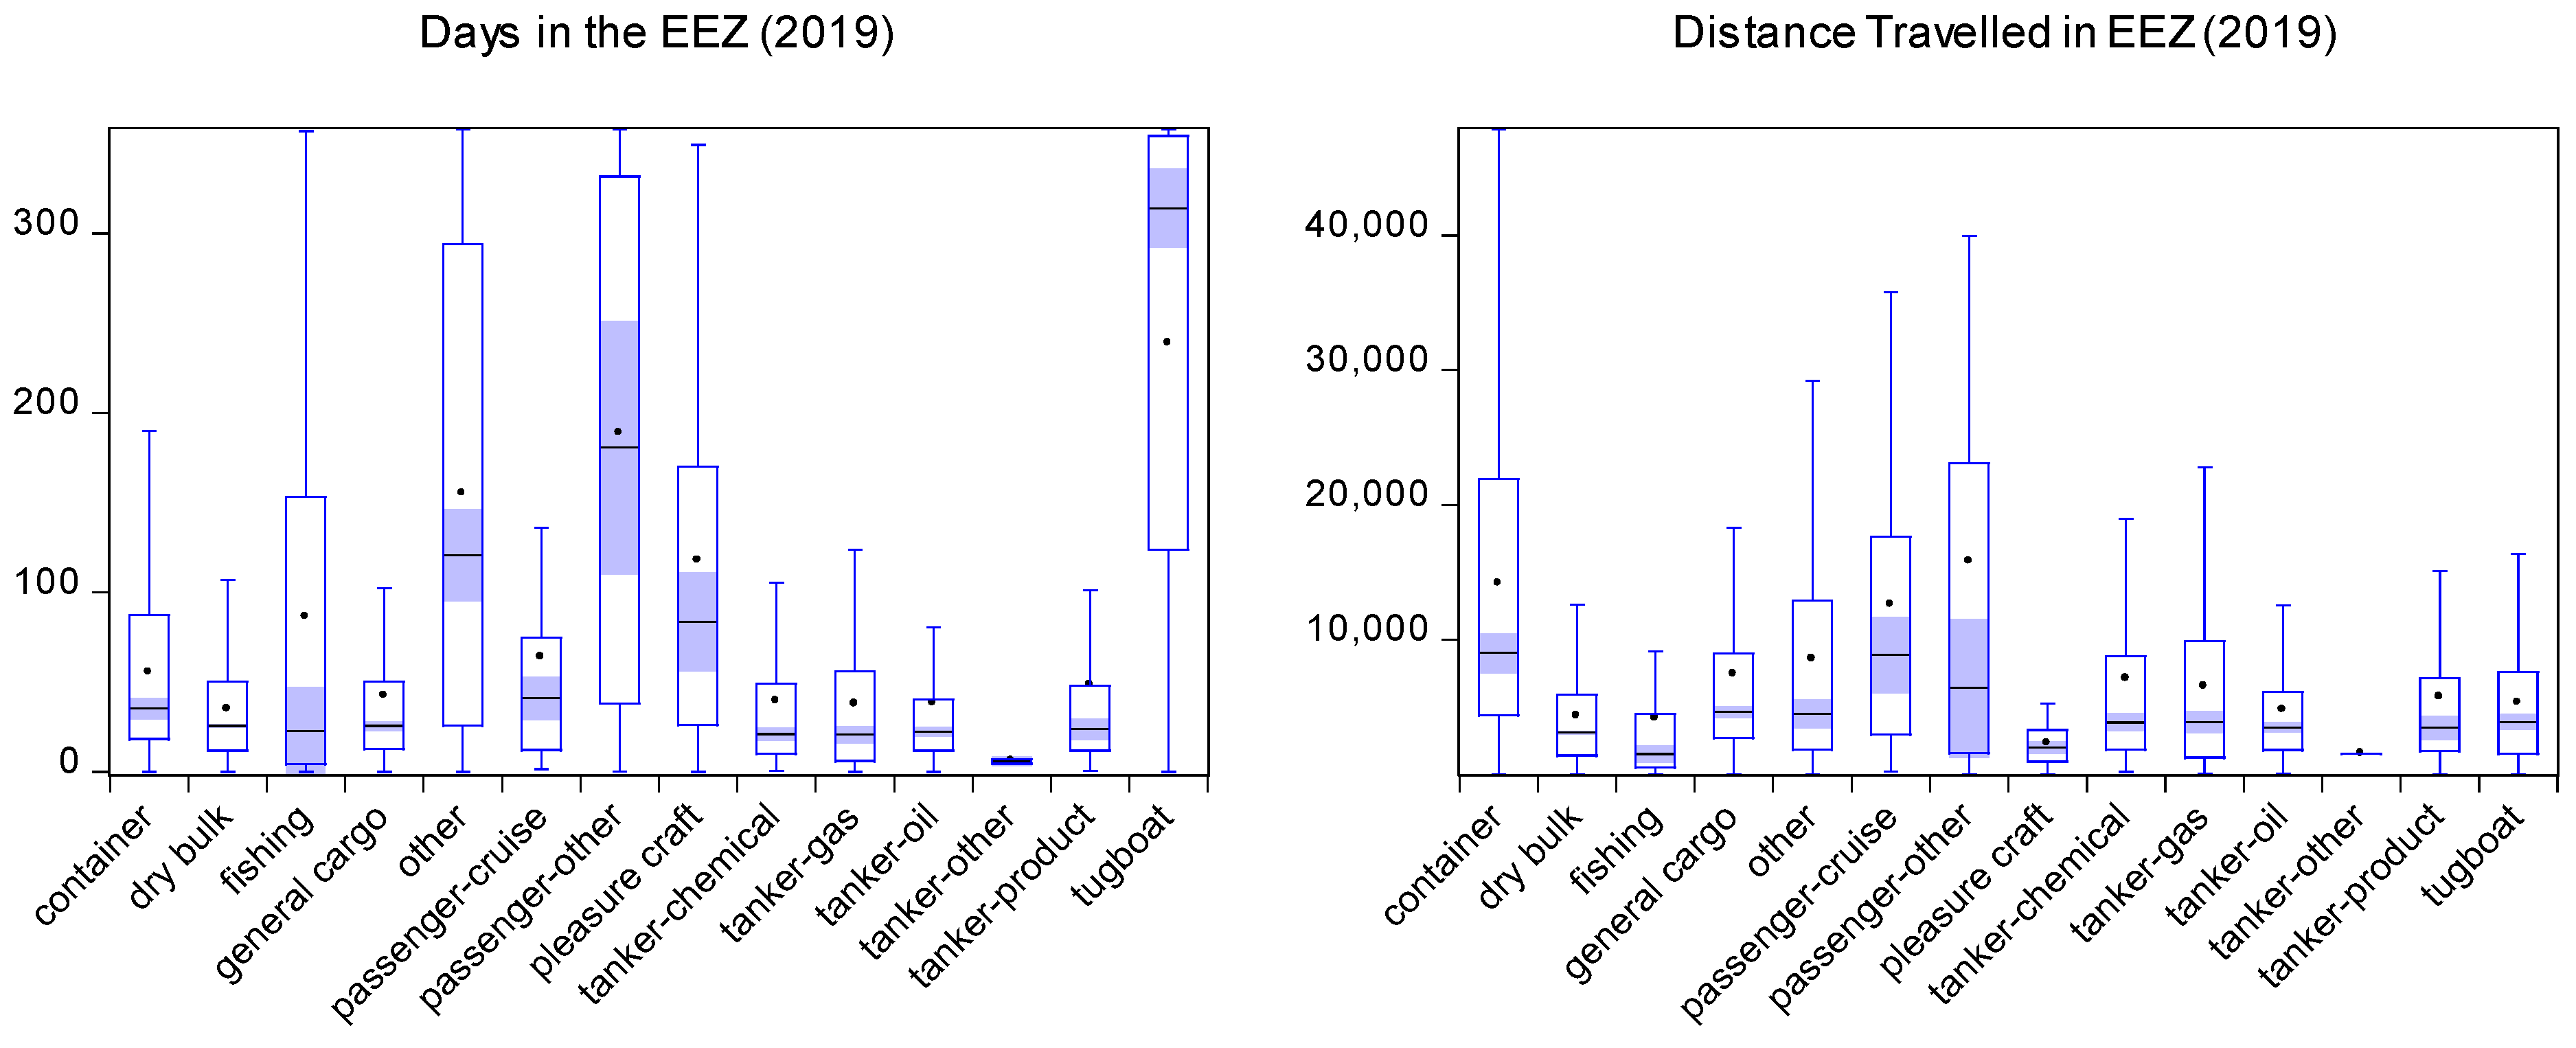
Since MVR is a yearly and global estimate, it can be adjusted to the regional level, such as the Exclusive Economic Zone (EEZ) of a state. Two metrics were tested based on data from two different coastal states and both metrics were calculated at the individual ship level. Daily nautical miles within the EEZ of one coastal state were calculated using AIS position data and the daily total at the MMSI level was provided for this study from the coastal state. MMSI was then converted to IMO given the time frame on hand (since MMSI can change with change of flag), and the respective yearly total of nautical miles travelled in the EEZ was calculated and used as input for this study. Days in the EEZ was based on the LRIT position records linked to arrival data (all at the ship level from another coastal state) and provided as input into the study.
The EEZ adjustment factor calculated the adjustment based on the relationship of total nautical miles travelled or time spent in the EEZ divided by global averages by ship type, as by Vander Hoorn and Knapp [12,13]. An example calculation would be a container ship with an observed distance travelled within the EEZ of a coastal state of 10,000 nautical miles, while a container ship at the global level, travel an average 60,000 nautical miles. The resulting calibration factors becomes 10,000/60,000 or 0.1667. For the metric using time, 365 days were used and for domestic vessels, an adjustment of 0.85 was made, as vessels were not in operation all year round. Global traffic metrics are derived from the Fourth IMO GHG report [14]. Appendix D provides the boxplots of both metrics by ship type and clearly shows the importance of calculating this metric at the individual ship level.
3. Risk Exposure and Inspection Effect Results
Based on the respective input data feeds for the years 2017 to 2020, monetary value at risk (MVR) was estimated for each year. The average global insurance premiums for the years 2017 to 2019 was at USD 29.84 billion and USD 12.62 billion, without the cargo portion. For the comparison with global insurance premiums, the category of cargo could not be compared, since the insurance premiums for cargo include the whole logistics, while the estimate here was only based on the ship part. In addition, IUMI premiums were combined with premiums from the from the International Group of P&I Clubs, since they cover most third-party liability (general average, pollution, personnel, third-party property damages) but exclude claims of cargo interest. The premiums normally do not include the deductible, which is the portion of the claim carried by the ship owner. MVR (TLVSS) estimated by the routine was USD 14.13 billion, hence, it was slightly higher than the global one with a ratio of 1.12.
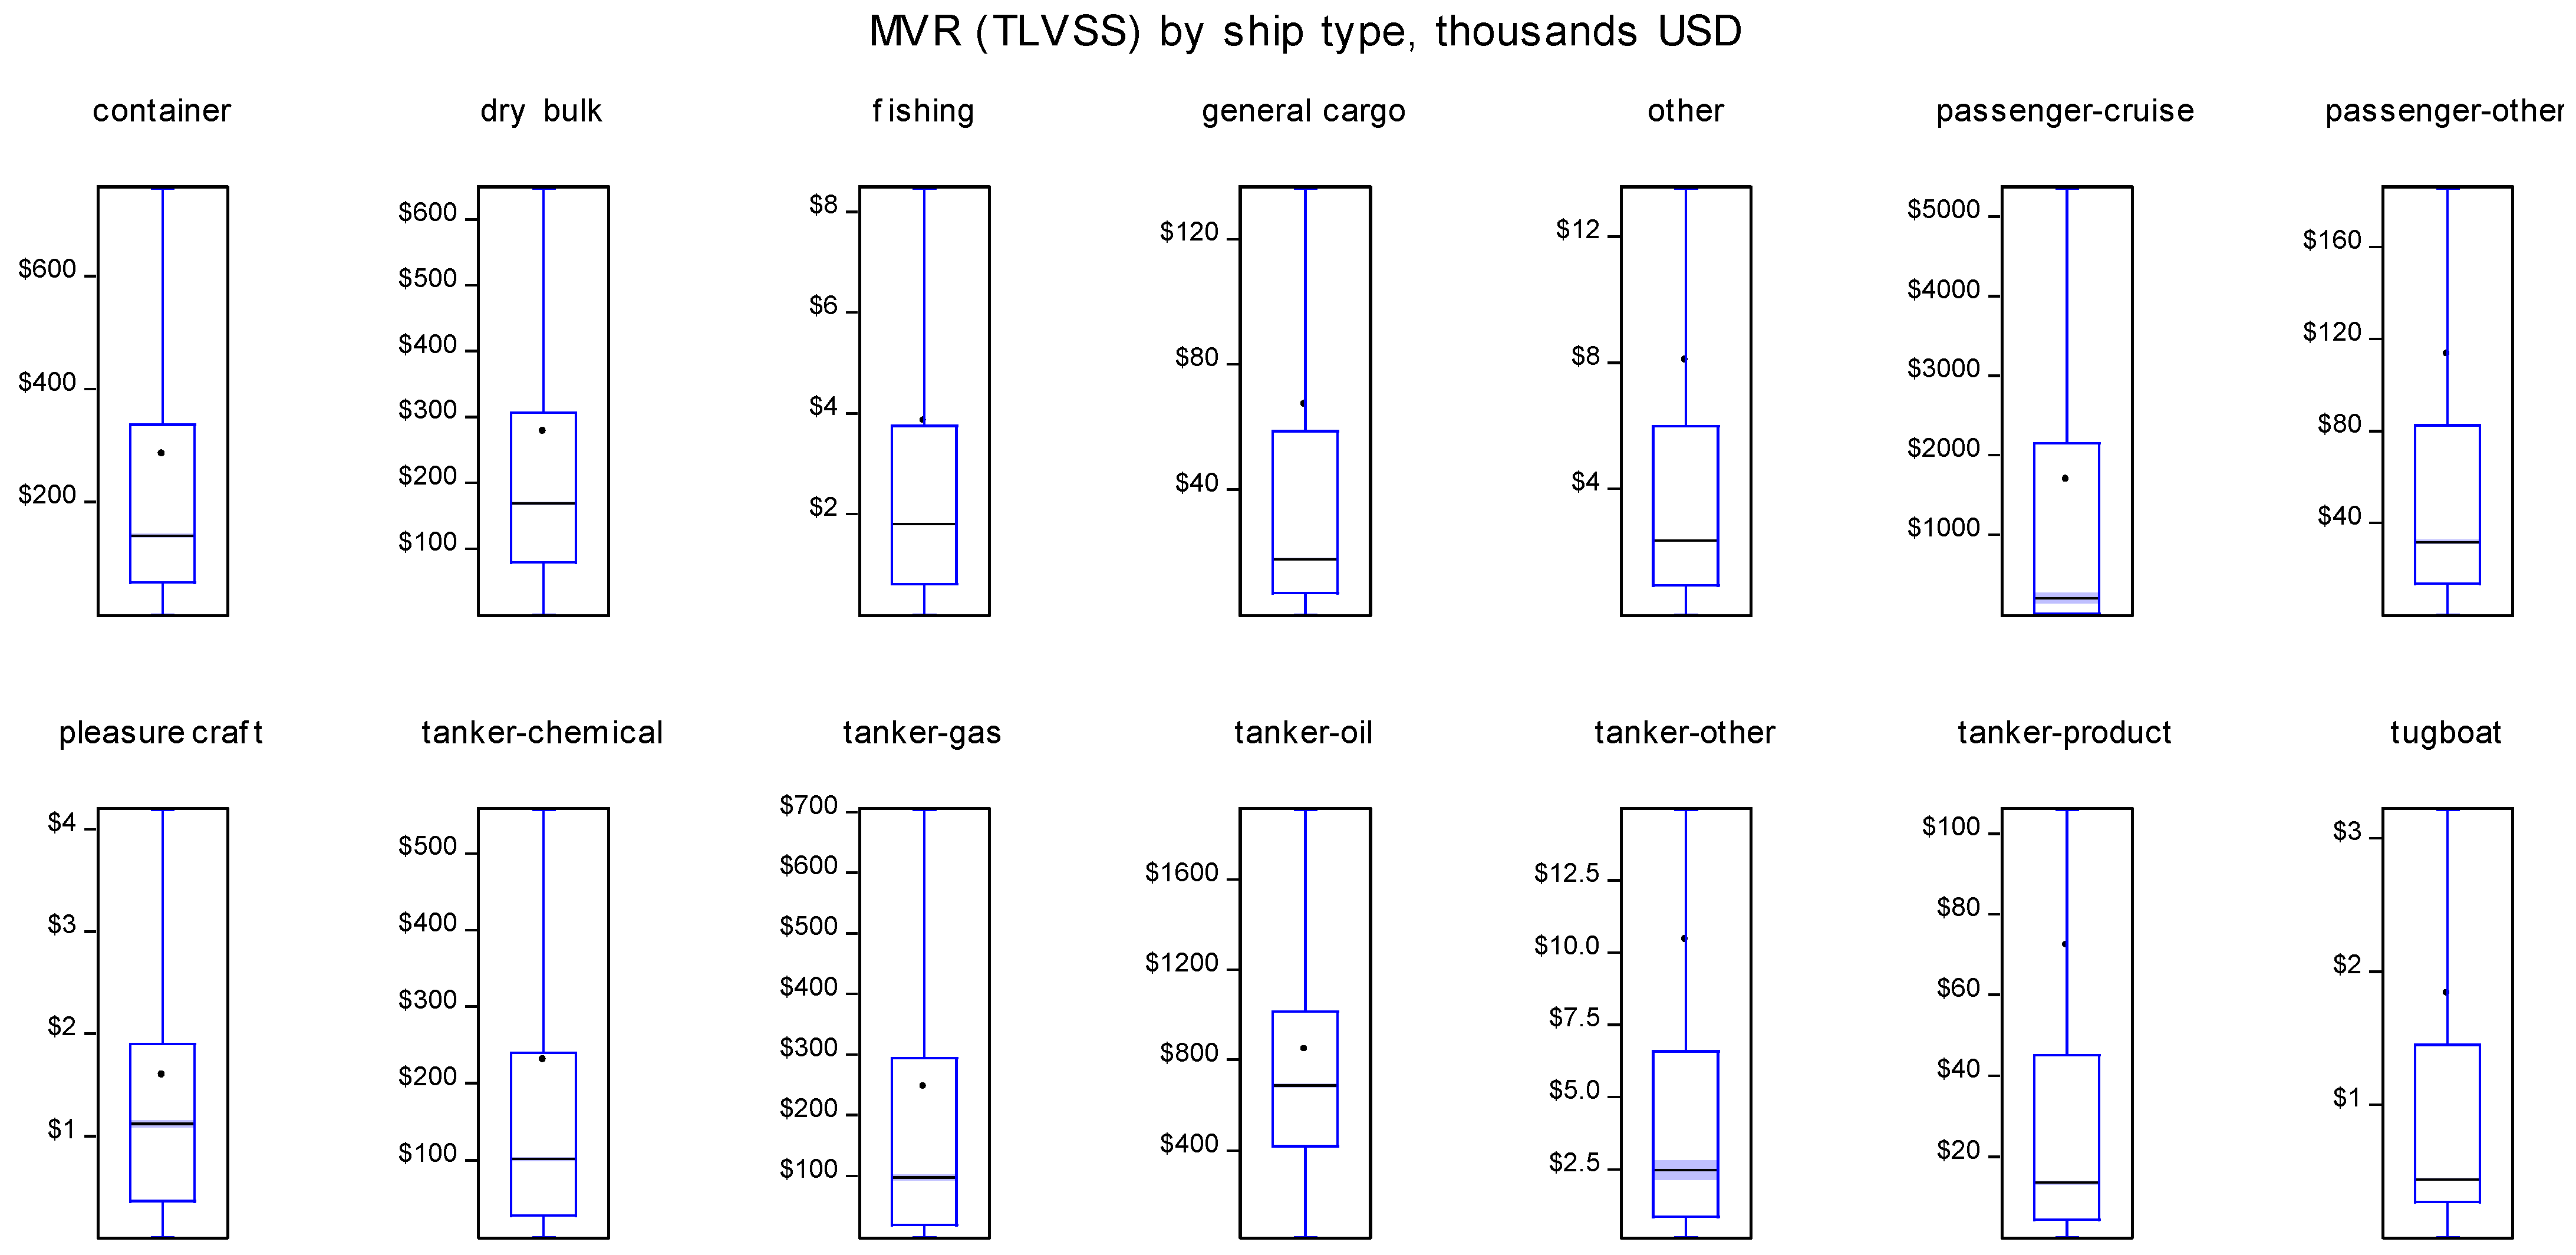
Table 2 provides an overview of MVR for the years 2017 to 2020, and the percentage of regional MVR for the two coastal states to global MVR up to the year 2019. The MVR stands at USD 17,832 (ALL) to 13,735 (TLVSS) million, based on the yearly average for 2017 to 2020. For MVR (TLVSS), the largest portion of risk exposure was associated with other marine liabilities (42.66%) followed by hull and machinery (26.158%), pollution (21.31%), and loss of life and injuries (9.89%). MVR of coastal state 1 was derived by using nautical miles travelled as EEZ factor, while MVR of coastal state 2 was derived by using time spent as the EEZ factor. The EEZ of the coastal state 1 was about 70% of coastal state 2 and both were above 8 million square kilometres. The regional level is not explored further here but the regional comparisons could be made using this methodology. Appendix E provides boxplots of MVR (TLVSS) at the ship level and demonstrates variability across ship types. Table 3 provides the split up by ship type and damage type, for MVR (TLVSS).
Not surprisingly, tankers dominate pollution (81%) with chemical tankers dominating the category; Hull and Cruise vessels dominate loss of lives and injuries (42.9%) due to the large risk exposure related to passengers, with some vessels having a capacity of over 6000 passengers. For other marine liabilities, dry bulk leads with 38.6%, followed by tankers (20.5%) and container vessels (17.9%). Tanker and dry bulk carriers can carry large quantities of cargo, while containers vessels can carry high-value cargo with some vessels having over 23k TEU carrying capacity.
The top 25 flags accounting for 87.9% of MVR (TLVSS) correspond to 58.5% of the total number of vessels and 87.5% of global GRT. The top five flags in terms of MVR (TLVSS) were Panama (12.5%), the Marshall Islands (11.7%), Liberia (10.5%), Hong Kong (7.5%), and the Bahamas (7.3%), reflecting the high exposure related to cruise vessels and tankers. The top 25 classification societies accounting for 95.5% of MVR (TLVSS) corresponded to 56.4% of the total number of vessels and 96.4% of global GRT. The top five classification societies were DNV-GL (25.12%), Lloyd’s Register (17.2%), ABS (13.6%), NKK (12.6%) and BV (9.34%).
Besides quantifying MVR (TLVSS) as total, another metric was calculated to make categories more comparable in terms of risk exposure, which was MVR/GRT or per total passenger capacity for passenger vessels. First MVR per GRT or passenger capacity was calculated at the ship level and the mean was then calculated for each flag, class society, and country of location of the beneficial owner (classified by World Bank classifications). The results for the top 10 for each category are given in Appendix F and is based on a minimum 100 vessels for the years 2017 to 2019. One can easily see that the total magnitude of exposure was not high with respect to the global exposure (below 5%), with the exception for passenger vessels where the top 10 account for 8% of global MVR, with Bahamas and Bermuda in the lead. Table 4 provides a summary of this type of analysis by main categories. Traditional flags show the highest MVR/GRT value with USD 13, followed by unknown or false flags with USD 11, and open registries with USD 9. For class societies, Non-IACS flags were in the lead with USD 16 and the owners who were located in the low or upper-middle income country, lead with USD 11/GRT.
Based on combined incident data from the various sources used in this study, overall, the empirical incident rates for TLVSS decreased since 2011 and in 2020, it stood at 1.29% (1.68% in 2019). Due to the economic situation in 2020, substandard and smaller companies and their vessels, were forced out of the market and there was an adjustment of tonnage and risk exposure. Table 5 provides the quantification of the effect of the pandemic by comparing the previous years with 2020. Note that foreign exchange rates also have an effect, albeit the average yearly exchange rates did not change that much for the time-periods on hand, with the exception for 2017. For this reason, the 2017 to 2019 yearly average was also considered, besides changes from 2020 to 2019.
In 2020, MVR (TLVSS) decreased by 4.18%, as compared to 2019 and by 9.25% as compared to the average of 2017 to 2019. Pollution exposure (TLVSS) increased by 6% in 2020 as compared to 2019, but increased only slightly as compared to the average of 2017 to 2019 (0.48%). Hull and Machinery showed the highest decrease of –10.38%, as compared to 2019, followed by loss of lives and injuries (−8.92%), and other marine liabilities (−4.27%). The decrease in loss of life was associated with the reduction of active cruise vessels. Cruise ships in particular have been affected by the pandemic. From Appendix A, one can see that the fleet continued to grow for 2020, with a slight decrease of vessels under service as of December 2020 (−0.14%), and a higher percentage of vessels that were laid up (+0.25%) as compared to the 2017 to 2019 average.
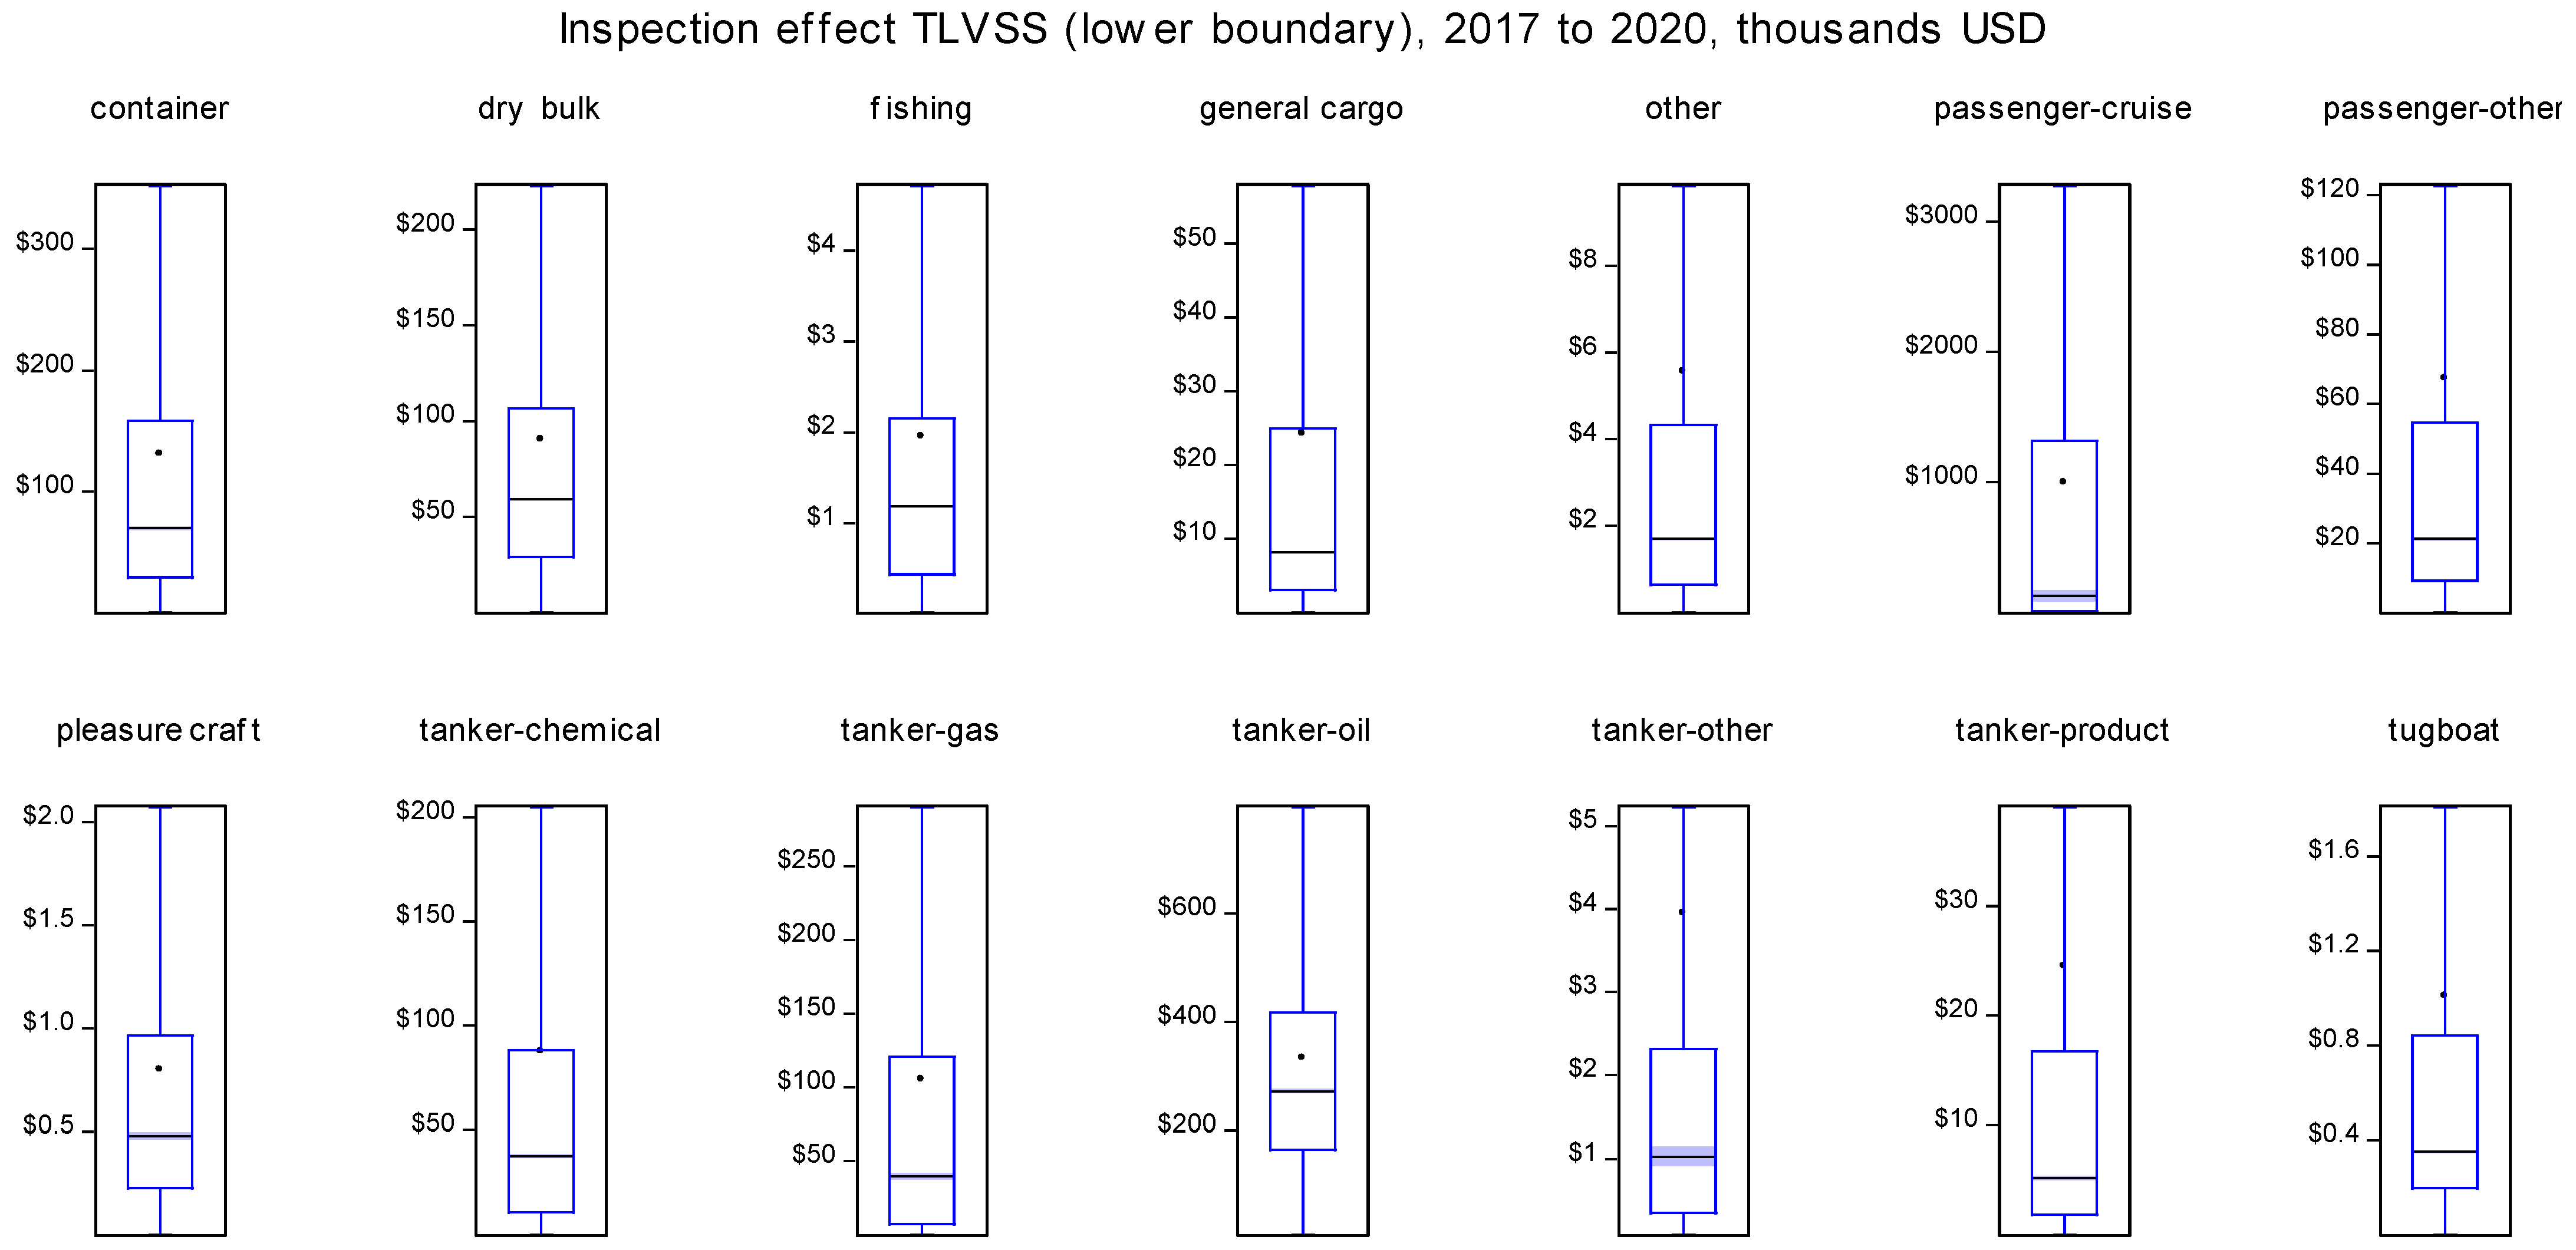
The last part of this study quantifies the inspection effect, as averted incident costs due to inspections. Using the methodology described earlier, the inspection effect was translated into a monetary value using MVR and the lower boundary was calculated at the ship level. Appendix E visualizes variability at the ship level and across ship-types for both—the inspection effect and averted incident costs, as vessels have different safety qualities and benefit differently from inspections.
The effect was calculated for the world fleet but could only be aggregated or accounted for by the inspected vessels, since not all vessels were inspected (Table 6 provides the total number of vessels in the routine as well as the total number of inspected vessels based on the global inspection data available for this study). Unfortunately, the Paris MoU inspection data except detentions was not available for the years 2019 and 2020, since the Paris MoU discontinued to make data available. Hence, a separation across the various MoU’s was not made here but only the effect was calculated based on actual inspections performed during 2017 to 2020; the results are presented in Table 6 in relation to total MVR. The average for the years 2017 to 2018 where all inspection data were available, was compared with 2019 and 2020. The main change of interest was from 2019 to 2020, as for both years, the Paris MoU data were not available.
Based on the average of 2017 to 2018, averted incident costs due to inspections were estimated to be USD 7152 (ALL) to 3923 (TLVSS) million USD per year and as percentage to total MVR. The effect was between 25% (TLVSS) to 40% (ALL), assuming that 80,000 inspections covered most global inspections performed. Comparing the year 2019 with 2020, one can see a decrease of inspections due to the pandemic and inspection coverage by 4%. A total of 21.3% of unique vessels were inspected in 2019 but only 17.3% were inspected in 2020, excluding the Paris MoU inspections. The reduction translated into a reduction of 11.6% (ALL) and 6% (TLVSS) of the inspection effect.
With reference to mean or median values of TIV values, MVR values or averted incident costs, a similar pattern was found throughout, i.e., cruise ships and oil tankers have the highest exposure and benefit most from an inspection, due to the high potential incident costs associated with these two ship types.
4. Conclusions and Future Research
MVR is defined as the weighted average of potential incident consequences covering various damage types of interest, MVR (TLVSS) was more accurate, as less serious incidents included in MVR (ALL) showed a high degree of under-reporting. The analysis demonstrated the importance to estimate all components of MVR at the ship level. For regional adjustment of the global MVR, the use of nautical miles travelled derived from AIS data is recommended, since it provides a more accurate proxy to estimate exposure of a vessel within an area and time zone.
The average yearly TIV values (2017 to 2020) of the world fleet were estimated to be USD 20.71 trillion, which demonstrated the importance of global trade and the value of assets involved. The yearly average of MVR (TLVSS), excluding cargo, was estimated to be USD 14.13 billion, hence, it was slightly higher by a ratio of 1.12 than the global insurance premiums of USD 12.62, excluding the cargo portion. This could indicate that the premiums might be too low to cover risk exposure and that identification of risky vessels and companies was important to safeguard assets.
Based on the years 2017 to 2020, global MVR stands at 13,735 (ALL) to 13,735 (TLVSS) million USD and the largest portion of risk exposure was associated with other marine liabilities, followed by hull and machinery, pollution, and loss of life and injuries. According to ship types, tankers dominate pollution risk exposure, and cruise vessels dominate loss of life and injury risks. High-risk exposure associated with hull and machinery was also found for chemical tankers and cargo-related damaged for container vessels. The top 25 flags accounted for 87.9% of MVR (TLVSS) and the top 25 classification societies accounted for 95.5% of MVR (TLVSS). Total exposure split up across the fleet reflected the global composition of the global fleet. In terms of MVR (TLVSS) per GRT value, traditional flags, Non-IACS class or owners from lower or upper middle-income countries showed higher MVR/GRT values.
The world fleet continued to grow for 2020, with a slight decrease of vessels under service as of December 2020 (−0.14%), and a higher percentage of vessels were laid-up (+0.25%) as compared to the 2017 to 2019 average. While the empirical incident rates for TLVSS decreased over time and stands at 1.29% (1.68% in 2019), MVR (TLVSS) also decreased by 4.18%, as compared to 2019, but pollution risk exposure (TLVSS) increased by 6% in 2020 as compared to 2019. Hull and Machinery showed the highest decrease with −10.38% as compared to 2019, followed by loss of lives and injuries (−8.92%) and other marine liabilities (−4.27), reflecting the effect of the pandemic on cruise vessels. The results also demonstrated that some substandard vessels are forced out of the market and there is an adjustment of tonnage.
Inspection effects varied at the ship level as the vessels have different safety qualities and each vessel benefits differently from an inspection. Averted incident costs due to inspections were estimated to be USD 7152 (ALL) to 3923 (TLVSS) million USD per year, or 25% (TLVSS) to 40% (ALL) of global risk exposure, which demonstrated the importance of PSC inspections to mitigate risk exposure. For 2020, one can see decrease of inspection coverage due to the pandemic, and the reduction translated into a reduction of 11.6% (ALL) and 6% (TLVSS) of the inspection effect.
Besides coastal states and maritime administrations, the use of MVR could be extended to other stakeholders in the maritime industry such as insurance companies, as MVR (TLVSS) estimated at the ship level could be used to enhance the determination of insurance premiums (as demonstrated in this approach). Ship owners could establish total risk exposure of their fleet and benchmark it with other ship owners. The benchmarking can be done using percentile ranks rather than probabilities or MVR as a monetary value.
Future research in this area could look at improving the estimated damage type probabilities for HNS and improving the access to maritime claim information to help validate some models at the individual ship level, as well as the distinction between cargo damage at the ship level from the whole logistics chain. Other research areas could focus on the integration of the ship-specific part with port-related areas or parts of the logistic chain, or extend the use of MVR to domain awareness applications and link it with real-time vessel traffic data (AIS).
Funding
This research received no external funding.
Institutional Review Board Statement
Not applicable.
Informed Consent Statement
Not applicable.
Acknowledgments
I thank the data providers for allowing me to use their data including IMO, LLIS, IHS Markit, the USCG, AMSA, and Clarksons.
Conflicts of Interest
The authors declare no conflict of interest.
Appendix A

Table A1.
Counts by ship type and vessel status, as % to total fleet (2017 to 2019).
| As at Dec of Each Year | 2017 | 2018 | 2019 | 2020 | 2019–2020 |
|---|---|---|---|---|---|
| Ship Type | Count | Count | Count | Count | Difference |
| general cargo | 17,842 | 17,991 | 18,151 | 18,182 | 31 |
| dry bulk | 11,695 | 11,906 | 12,331 | 12,629 | 298 |
| container | 5168 | 5289 | 5334 | 5387 | 53 |
| tanker | 16,339 | 16,996 | 17,640 | 18,182 | 542 |
| passenger vessels | 7082 | 7421 | 7696 | 7862 | 166 |
| other ship types | 17,270 | 17,722 | 18,853 | 20,699 | 1846 |
| fishing vessels | 22,168 | 23,131 | 23,775 | 23,827 | 52 |
| tugs | 18,155 | 18,765 | 19,098 | 19,535 | 437 |
| pleasure crafts | 0 | 0 | 2617 | 2697 | 80 |
| Total fleet | 115,719 | 119,221 | 125,495 | 129,000 | 3505 |
| % in service | 97.04% | 97.19% | 97.27% | 97.03% | −0.238% |
| % laid up | 1.14% | 1.30% | 1.39% | 1.53% | 0.144% |
| % in casualty/repair | 0.56% | 0.44% | 0.35% | 0.34% | −0.004% |
Appendix B
Table A2.
Mean TIV values by major ship type, USD (millions), 2017 to 2020.
| Total TIV | Cargo | Hull & Machinery | Lives & Injuries | Pollution | Other Liabilities | |
|---|---|---|---|---|---|---|
| container | 455.3 | 194.5 | 14.8 | 64.0 | 117.9 | 64.0 |
| dry bulk | 243.5 | 7.2 | 11.3 | 58.6 | 107.9 | 58.5 |
| fishing | 8.2 | 0.0 | 0.1 | 4.3 | 2.2 | 1.7 |
| general cargo | 60.9 | 2.5 | 1.9 | 12.2 | 32.5 | 11.7 |
| other | 17.0 | 0.2 | 1.2 | 6.7 | 3.3 | 5.5 |
| passenger-cruise | 860.3 | 2.1 | 32.5 | 746.3 | 26.7 | 52.7 |
| passenger-other | 308.0 | 2.1 | 2.4 | 276.4 | 21.1 | 6.1 |
| pleasure craft | 10.0 | 0.0 | 0.6 | 4.5 | 2.2 | 2.7 |
| tanker-chemical | 444.2 | 13.7 | 27.1 | 23.2 | 357.0 | 23.1 |
| tanker-gas | 527.2 | 7.6 | 29.4 | 55.6 | 378.9 | 55.6 |
| tanker-oil | 1348.7 | 46.7 | 23.5 | 89.0 | 1100.6 | 88.8 |
| tanker-other | 17.6 | 1.1 | 1.4 | 6.7 | 3.4 | 5.0 |
| tanker-product | 366.2 | 4.2 | 12.5 | 11.8 | 326.4 | 11.2 |
| tugboat | 7.6 | 0.0 | 0.1 | 4.3 | 2.1 | 1.2 |
Notes: Pollution includes oil and HNS, other liabilities include wreck removal and other property damages covered by the LLMC.
Appendix C
Table A3.
Summary statistics of probability and inspection effect models (2014 to 2019) sample data.
Table A3.
Summary statistics of probability and inspection effect models (2014 to 2019) sample data.
| McFad | Schwarz | HR% | HR% | HL | ||||
|---|---|---|---|---|---|---|---|---|
| Model Types | Total | Incident | Rate | R-Sqrd | Criteria | TPR | Overall | Prob |
| Incident type models | ||||||||
| Incidents (ALL) | 721,767 | 27,809 | 0.03853 | 0.2248 | 0.2543 | 81.8 | 72.2 | 0.0000 |
| Incidents (TLVSS) | 721,767 | 10,443 | 0.01447 | 0.1555 | 0.1305 | 74.6 | 73.6 | 0.0000 |
| Conditional damage type models | ||||||||
| TIV Hull & Mach (ALL) | 27,809 | 11,700 | 0.42073 | 0.0424 | 1.3142 | 52.4 | 60.5 | 0.1359 |
| TIV Cargo (ALL) | 27,809 | 204 | 0.00734 | 0.0262 | 0.0878 | 57.8 | 60.3 | 0.9235 |
| TIV TP (ALL) | 27,809 | 8723 | 0.31368 | 0.0478 | 1.2140 | 57.7 | 62.2 | 0.0000 |
| TIV Life (ALL) | 27,809 | 2149 | 0.07728 | 0.1421 | 0.4881 | 69.0 | 68.0 | 0.0001 |
| TIV total loss (ALL) | 27,809 | 731 | 0.02629 | 0.3418 | 0.1877 | 86.7 | 81.5 | 0.0770 |
| TIV Pollution oil (ALL) | 27,809 | 2032 | 0.07307 | 0.1468 | 0.4642 | 69.6 | 72.9 | 0.0135 |
| TIV Pollution HNS (ALL) | 33,588 | 42 | 0.00125 | 0.1803 | 0.0182 | 71.4 | 85.4 | 0.3249 |
| TIV Hull &Mach (TLVSS) | 27,809 | 5118 | 0.18404 | 0.1397 | 0.8505 | 68.8 | 69.8 | 0.0000 |
| TIV Cargo (TLVSS) | 27,809 | 101 | 0.00363 | 0.0292 | 0.0496 | 75.3 | 43.5 | 0.9363 |
| TIV TP (TLVSS) | 27,810 | 4368 | 0.15707 | 0.0870 | 0.8263 | 64.6 | 66.5 | 0.0000 |
| TIV Life (TLVSS) | 27,809 | 904 | 0.03251 | 0.0959 | 0.2772 | 65.5 | 68.6 | 0.0295 |
| TIV total loss (TLVSS) | 10,443 | 731 | 0.07000 | 0.2719 | 0.3809 | 81.9 | 76.1 | 0.0053 |
| TIV Pollution (TLVSS) | 27,809 | 572 | 0.02057 | 0.0491 | 0.1980 | 57.2 | 65.4 | 0.0217 |
| TIV Pollution HNS (TLVSS) | 33,588 | 18 | 0.00054 | 0.1881 | 0.0210 | 61.1 | 79.4 | 0.0784 |
| ALL, total 1 = 18,421 | TLVSS, total 1 = 6158 | |||||||
| Inspection effect models | McFad | McFad | ||||||
| Days prior to incident | R-sqrd | ALL | R-sqrd | TLVSS | ||||
| ALL MOU up to 365 days | 0.113 | −1.15449 | * | 0.093 | −0.79397 | * | ||
| ALL MOU 31 to 60 days | 0.108 | 0.03468 | *** | 0.092 | −0.00940 | ns | ||
| ALL MOU 61 to 90 days | 0.00692 | ns | −0.07318 | ** | ||||
| ALL MOU 91 to 180 days | −0.08731 | * | −0.08009 | * | ||||
| ALL MOU 181 to 270 days | −0.22578 | * | −0.18378 | * | ||||
| ALL MOU 271 to 365 days | −0.33428 | * | −0.23430 | * | ||||
Note: The HNS models are based on very small samples and are to be interpreted with caution. ALL = all incident types, TLVSS = total loss, very serious and serious. Note: * significant at 1% level, ** significant at 5% level, *** significant at 10% level, ns = not significant
Appendix D
Figure A1.
Boxplots of MVR components (incident probabilities, damage type probabilities, and EEZ factors).
Figure A1.
Boxplots of MVR components (incident probabilities, damage type probabilities, and EEZ factors).


Appendix E
Figure A2.
Boxplots of MVR (TLVSS) and inspection effect (averted incident costs).


Appendix F
Table A4.
MVR by GRT—top 10 by MVR/GRT or Pax (2017 to 2020).
| % To Total Fleet | MVR (TLVSS) | |||||
|---|---|---|---|---|---|---|
| Group | Category | Nr | Pax | Mill USD | % To Total | $ MVR/Pax |
| Flag-pax | Bahamas | 0.12% | 6.47% | 525.1 | 3.82% | 1797.60 |
| Bermuda | 0.03% | 1.73% | 155.5 | 1.13% | 1777.65 | |
| Malta | 0.07% | 2.92% | 111.9 | 0.81% | 1004.27 | |
| France | 0.08% | 1.63% | 65.8 | 0.48% | 893.89 | |
| Cyprus | 0.05% | 1.41% | 26.0 | 0.19% | 697.70 | |
| Panama | 0.11% | 4.07% | 119.5 | 0.87% | 550.20 | |
| United Kingdom | 0.10% | 1.97% | 68.9 | 0.50% | 539.67 | |
| Denmark (DIS) | 0.02% | 0.71% | 16.2 | 0.12% | 525.63 | |
| Canada | 0.14% | 2.10% | 42.7 | 0.31% | 461.47 | |
| Russia | 0.07% | 0.53% | 5.6 | 0.04% | 461.14 | |
| Group | Category | Nr | GRT | Mill USD | % To Total | $ MVR/GRT |
| Flag-non pax | Kenya | 0.03% | 0.00% | 1.8 | 0.01% | 128.26 |
| Mauritius | 0.03% | 0.01% | 2.5 | 0.02% | 113.19 | |
| Russia | 3.14% | 0.73% | 301.5 | 2.20% | 76.92 | |
| Gibraltar | 0.20% | 0.15% | 55.6 | 0.40% | 55.69 | |
| Mongolia | 0.13% | 0.03% | 11.3 | 0.08% | 54.33 | |
| Norway | 0.88% | 0.15% | 41.0 | 0.30% | 53.75 | |
| Maldives Islands | 0.05% | 0.00% | 1.0 | 0.01% | 50.56 | |
| Cape Verde | 0.02% | 0.00% | 0.9 | 0.01% | 49.50 | |
| Germany | 0.46% | 0.58% | 75.0 | 0.55% | 49.09 | |
| Canada | 0.69% | 0.18% | 155.8 | 1.13% | 45.25 | |
| Class Society | Russian River Register | 0.18% | 0.05% | 19.2 | 0.14% | 143.29 |
| Maritime Bureau of Shipping | 0.02% | 0.00% | 1.8 | 0.01% | 130.88 | |
| Columbus American Register | 0.03% | 0.00% | 3.3 | 0.02% | 123.37 | |
| Ships Classification Malaysia | 0.07% | 0.00% | 2.1 | 0.02% | 107.09 | |
| Hellenic Register of Shipping | 0.05% | 0.00% | 3.4 | 0.02% | 99.69 | |
| International Naval Surveys | 0.18% | 0.04% | 13.5 | 0.10% | 71.37 | |
| Russian Maritime Register | 2.80% | 0.85% | 296.2 | 2.16% | 69.99 | |
| Turk Loydu | 0.37% | 0.06% | 27.6 | 0.20% | 53.59 | |
| Panama Maritime Documentation | 0.06% | 0.03% | 8.2 | 0.06% | 51.50 | |
| Korea Ship Safety Technology | 0.02% | 0.00% | 1.6 | 0.01% | 49.29 | |
| Beneficial | Kenya | 0.05% | 0.00% | 2.1 | 0.02% | 107.32 |
| Owner | Turkmenistan | 0.04% | 0.01% | 4.7 | 0.03% | 67.961 |
| Country of | Portugal | 0.15% | 0.05% | 9.4 | 0.07% | 67.802 |
| Location | Fiji | 0.03% | 0.00% | 2.6 | 0.02% | 57.454 |
| Bahrain | 0.08% | 0.01% | 1.7 | 0.01% | 54.607 | |
| Syria | 0.02% | 0.01% | 1.3 | 0.01% | 48.836 | |
| Malta | 0.11% | 0.10% | 26.2 | 0.19% | 48.541 | |
| Maldives Islands | 0.05% | 0.00% | 1.2 | 0.01% | 48.387 | |
| Russia | 2.81% | 1.20% | 349.6 | 2.55% | 44.103 | |
| Estonia | 0.17% | 0.07% | 25.6 | 0.19% | 41.127 | |
| Total for flags—passenger vessels | 0.81% | 23.54% | 1137.2 | 8.28% | - | |
| Total for flags—other ship types | 5.63% | 1.83% | 646.4 | 4.71% | - | |
| Total classification societies | 3.78% | 1.05% | 377.0 | 2.74% | - | |
| Total owner location | 3.50% | 1.44% | 424.4 | 3.09% | - | |
Note: For flags, owners, and class societies with at least 100 vessels; owner is beneficial owner.
References
- UNCTAD. Review of Maritime Transport; UNCTAD: Geneva, Switzerland, 2020. [Google Scholar]
- Knapp, S. The Econometrics of Maritime Safety—Recommendations to Enhance Safety at Sea. Ph.D. Thesis, Erasmus University Rotterdam, Rotterdam, The Netherlands, 2006. Available online: http://hdl.handle.net/1765/7913 (accessed on 28 December 2020).
- Knapp, S.; Heij, C. Evaluation of total risk exposure and insurance premiums in the maritime industry. Transp. Res. Part D Transp. Environ. 2017, 54, 321–334. [Google Scholar] [CrossRef] [Green Version]
- Knapp, S.; Bijwaard, G.; Heij, C. Estimated incident cost savings in shipping due to inspections. Accid. Anal. Prev. 2011, 43, 1532–1539. [Google Scholar] [CrossRef] [PubMed] [Green Version]
- IMO. MSC/Circ. 953, MEPC/Circ. 372, Reports on Marine Casualties and Incidents, Revised Harmonized Reporting Procedures, Adopted 14th December 2000; IMO: London, UK, 2000. [Google Scholar]
- ABPmer; VividEconomics. MMO1158, Mapping Shipping Cargo Value; Technical Report for European Maritime and Fisheries Fund: London, UK, 2019. [Google Scholar]
- Heij, C.; Knapp, S. Evaluation of safety and environmental risk at individual ship and company level. Transp. Res. Part D 2012, 2012 17, 228–236. [Google Scholar] [CrossRef]
- Knapp, S.; Heij, C. Improved strategies for the maritime industry to target vessels for inspections and to select inspection priority areas. Safety 2020, 6, 18. [Google Scholar] [CrossRef] [Green Version]
- Heij, C.; de Boer, P.; Franses, P.H.; Kloek, T.; van Dijk, H. Econometric Methods with Applications in Business and Economics; Oxford University Press: Oxford, UK, 2004. [Google Scholar]
- Verbeek, M. A Guide to Modern Econometrics, 3rd ed.; John Wiley and Sons Ltd.: Chichester, UK, 2008. [Google Scholar]
- Greene, H.W. Econometric Analysis, 4th ed.; Prentice Hall: New Jersey, NJ, USA, 2000. [Google Scholar]
- Vander Hoorn, S.; Knapp, S. A multi-layered risk exposure assessment approach for the shipping industry. Transp. Res. Part A Policy Pract. 2015, 78, 21–33. [Google Scholar] [CrossRef] [Green Version]
- Vander Hoorn, S.; Knapp, S. Predicting traffic and risk exposure in the maritime industry. Safety 2019, 5, 42. [Google Scholar] [CrossRef] [Green Version]
- IMO. Reduction of GHG Emissions from Ships, Fourth IMO GHG Study 2020; Report MEPC 75/7/15 for IMO; IMO: London, UK, 2020. [Google Scholar]
Table 1.
Combination of data used.
| Type of Data | Purpose | Data Sources | Time Frames |
|---|---|---|---|
| World fleet data—Ship particulars | Type A&B | IHS Maritime | 2011 to 2020 |
| Global PSC data (all MoU’s) | Type A&B | IHS Maritime | 2011 to 2020 |
| Global Incident data | Type A&B | IHS Maritime, LLIS, IMO, USCG | 2011 to 2020 |
| Regional arrival data | Type B | From 1 coastal state | 17 January to 20 December |
| Nautical miles travelled and days at sea at IMO level from AIS data | Type B | From 1 coastal state | 17 January to 20 July |
| MMSI to IMO database | Type B | To convert MMSI to IMO | 2017 to 2020 |
| Exchange rates | Type B | IMF | 2017 to 2020 |
| Secondhand Prices of Vessels | Type B | Clarksons SIN | 2017 to 2020 |
| Cargo Values | Type B | ABPmer, Vivid Economics | |
| Special Draw Rights limits | Type B | IMO Conventions | |
| Insurance premiums | Type C | IUMI, P&I Clubs | 2017 to 2019 |
Notes: SIN = Clarkson’s Ship Intelligence Network, IMF = International Monetary Fund.
Table 2.
MVR at global and regional level (MVR in million USD).
| MVR at Global Level | 2017 | 2018 | 2019 | 2017–2019 | 2020 | 2017–2020 |
|---|---|---|---|---|---|---|
| Nr of Unique IMO in routine | 115,719 | 119,221 | 125,495 | 120,145 | 129,000 | 122,359 |
| MVR (ALL) global | 18,795 | 18,679 | 17,288 | 18,254 | 16,565 | 17,832 |
| MVR (TLVSS) global | 15,763 | 14,976 | 12,350 | 14,363 | 11,851 | 13,735 |
| Nr of Unique IMO in routine—state 1 | 6546 | 6795 | 6978 | 6773 | ||
| % to global (ALL) | 2.37% | 1.97% | 1.81% | 2.05% | ||
| % to global (TLVSS) | 1.82% | 1.91% | 1.72% | 1.82% | ||
| Nr of Unique IMO in routine—state 2 | 16,325 | 16,347 | 16,155 | 16,276 | ||
| % to global (ALL) | 12.08% | 12.08% | 13.11% | 12.42% | ||
| % to global (TLVSS) | 5.51% | 5.76% | 5.67% | 5.65% | ||
Table 3.
MVR (TLVSS) by ship-type and damage-type category (2017–2020 yearly mean), in million USD.
| Ship Type | Total | % To Total | HM Total | % To Total | POLL Total | % To Total | LIVE Total | % To Total | OTHER Total | % To Total |
|---|---|---|---|---|---|---|---|---|---|---|
| container | 1508.7 | 10.98 | 341.3 | 9.50 | 58.0 | 1.98 | 57.1 | 4.20 | 1052.3 | 17.96 |
| dry bulk | 3376.3 | 24.58 | 854.5 | 23.80 | 135.5 | 4.63 | 125.2 | 9.22 | 2261.1 | 38.59 |
| fishing | 89.4 | 0.65 | 7.7 | 0.22 | 12.9 | 0.44 | 25.0 | 1.84 | 43.8 | 0.75 |
| general cargo | 1212.6 | 8.83 | 289.1 | 8.05 | 61.7 | 2.11 | 49.9 | 3.67 | 812.0 | 13.86 |
| other | 150.4 | 1.10 | 43.2 | 1.20 | 13.7 | 0.47 | 10.6 | 0.78 | 82.9 | 1.41 |
| passenger-cruise | 1026.2 | 7.47 | 230.2 | 6.41 | 8.4 | 0.29 | 582.9 | 42.92 | 204.7 | 3.49 |
| passenger-other | 783.3 | 5.70 | 177.0 | 4.93 | 10.4 | 0.35 | 416.4 | 30.6 | 179.5 | 3.06 |
| pleasure craft | 2.1 | 0.02 | 0.6 | 0.02 | 0.2 | 0.01 | 0.2 | 0.01 | 1.1 | 0.02 |
| tanker-chemical | 1289.8 | 9.39 | 838.5 | 23.35 | 148.0 | 5.06 | 15.6 | 1.15 | 287.7 | 4.91 |
| tanker-gas | 523.0 | 3.81 | 233.2 | 6.49 | 60.5 | 2.07 | 17.3 | 1.27 | 212.1 | 3.62 |
| tanker-oil | 3342.7 | 24.34 | 328.8 | 9.16 | 2,371.3 | 81.01 | 45.2 | 3.33 | 597.4 | 10.20 |
| tanker-other | 1.8 | 0.01 | 0.6 | 0.02 | 0.2 | 0.01 | 0.1 | 0.00 | 0.9 | 0.02 |
| tanker-product | 394.0 | 2.87 | 244.8 | 6.82 | 42.2 | 1.44 | 6.6 | 0.49 | 100.4 | 1.71 |
| tugboat | 34.6 | 0.25 | 1.6 | 0.04 | 4.1 | 0.14 | 6.1 | 0.45 | 22.9 | 0.39 |
| Total | 13,735.1 | 3591.1 | 2927.1 | 1358.1 | 5858.8 |
Notes: HM = Hull and Machinery, POLL = oil and chemical pollution, LIVE = loss of life and injuries, and OTHER = all other marine liabilities (e.g., damage to property, cargo, wreck removal) as by the LLMC.
Table 4.
MVR (TLVSS) by flag, classification society, and owner group (2017–2020 yearly mean).
| % To Total Fleet | MVR TLVSS | ||||||
|---|---|---|---|---|---|---|---|
| Group | Category | Nr | GRT | Mill USD | % To Total | Mean | $ MVR/GRT |
| Flag | Emerging Flags | 32.77% | 11.87% | 1341.1 | 9.76% | 33,449 | 8.10 |
| Open Registries | 29.88% | 73.93% | 9799.1 | 71.34% | 268,030 | 9.51 | |
| Traditional Flags | 27.14% | 13.20% | 2441.5 | 17.78% | 73,531 | 13.27 | |
| Unknown Flags | 10.22% | 1.00% | 153.3 | 1.12% | 12,262 | 11.03 | |
| Class | IACS | 47.56% | 94.89% | 12,760.0 | 92.90% | 219,254 | 9.64 |
| Not IACS | 11.86% | 2.01% | 451.6 | 3.29% | 31,131 | 16.13 | |
| Unknown Class | 40.58% | 3.10% | 523.4 | 3.81% | 10,541 | 12.11 | |
| Owner | high | 40.90% | 72.42% | 9957.2 | 72.49% | 198,984 | 9.86 |
| income | upper middle | 0.31% | 0.08% | 12.2 | 0.09% | 120,713 | 11.16 |
| lower middle | 9.77% | 3.38% | 519.0 | 3.78% | 43,426 | 11.03 | |
| low | 34.18% | 7.00% | 1052.9 | 7.67% | 32,578 | 10.79 | |
| unknown | 14.85% | 17.13% | 2193.7 | 15.97% | 25,178 | 9.19 | |
Table 5.
Difference in MVR due to pandemic, in million USD.
| Diff 2017–2019 to 2020 | Diff 2019 to 2020 | ||||||
|---|---|---|---|---|---|---|---|
| 2017–2019 | 2019 | 2020 | $ | % | $ | % | |
| MVR total (ALL) | 18,253.8 | 17,287.6 | 16,565.1 | −1688.7 | −9.25% | −722.5 | −4.18% |
| MVR total (TLVSS) | 14,363.0 | 12,349.7 | 11,851.3 | −2511.7 | −17.49% | −498.4 | −4.04% |
| Hull and Machinery | 3848.7 | 3145.2 | 2818.6 | −1030.1 | −26.76% | −326.6 | −10.38% |
| Pollution | 2923.6 | 2770.0 | 2937.5 | 13.9 | 0.48% | 167.5 | 6.05% |
| Loss of Lives and Injuries | 1391.6 | 1380.6 | 1257.4 | −134.2 | −9.64% | −123.2 | −8.92% |
| Other Marine Liabilities | 6199.1 | 5053.8 | 4837.8 | −1361.4 | −21.96% | −216.0 | −4.27% |
Notes: Other marine liabilities = damage to property, cargo, wreck removal as by the LLMC.
Table 6.
Averted incident costs due to inspections (million USD).
| In Million for USD | 2017 | 2018 | Mean 2017–2018 | 2019 | 2020 | Difference 2019–2020 | |
|---|---|---|---|---|---|---|---|
| Total inspections | 85,356 | 86,051 | 80,229 | 69,280 | 47,718 | −21,562 | |
| Unique IMO in routine | Nr | 115,719 | 119,221 | 117,470 | 125,495 | 129,000 | 3505 |
| Unique IMO inspected | Nr | 31,565 | 31,803 | 31,684 | 26,844 | 22,354 | −4490 |
| % inspected | % | 27.28% | 26.68% | 26.97% | 21.39% | 17.33% | −4.06% |
| MVR (ALL) total | USD | 18,795.2 | 18,678.6 | 18,736.9 | 17,287.6 | 16,565.1 | −722.5 |
| Inspection effect (ALL) | USD | 7608.3 | 7627.2 | 7617.8 | 7152.3 | 4931.1 | −2221.2 |
| % to total MVR ALL | % | 40.48% | 40.83% | 40.66% | 41.37% | 29.77% | −11.6% |
| MVR (TLVSS) total | USD | 15,763.1 | 14,976.2 | 15,369.6 | 12,349.7 | 11,851.3 | −498.4 |
| Inspection effect (TLVSS) | USD | 3885.0 | 3961.2 | 3923.1 | 3716.1 | 2807.8 | −908.2 |
| % to total MVR TLVSS | % | 24.65% | 26.45% | 25.53% | 30.09% | 23.69% | −6.4% |
Publisher’s Note: MDPI stays neutral with regard to jurisdictional claims in published maps and institutional affiliations. |
© 2021 by the author. Licensee MDPI, Basel, Switzerland. This article is an open access article distributed under the terms and conditions of the Creative Commons Attribution (CC BY) license (https://creativecommons.org/licenses/by/4.0/).
Share and Cite
MDPI and ACS Style
Knapp, S. Quantification and Analysis of Risk Exposure in the Maritime Industry: Averted Incident Costs Due to Inspections and the Effect of SARS-Cov-2 (COVID-19). Safety 2021, 7, 43. https://0-doi-org.brum.beds.ac.uk/10.3390/safety7020043
AMA Style
Knapp S. Quantification and Analysis of Risk Exposure in the Maritime Industry: Averted Incident Costs Due to Inspections and the Effect of SARS-Cov-2 (COVID-19). Safety. 2021; 7(2):43. https://0-doi-org.brum.beds.ac.uk/10.3390/safety7020043
Chicago/Turabian StyleKnapp, Sabine. 2021. "Quantification and Analysis of Risk Exposure in the Maritime Industry: Averted Incident Costs Due to Inspections and the Effect of SARS-Cov-2 (COVID-19)" Safety 7, no. 2: 43. https://0-doi-org.brum.beds.ac.uk/10.3390/safety7020043
Note that from the first issue of 2016, this journal uses article numbers instead of page numbers. See further details here.