
State of the Art and Challenges for Occupational Health and Safety Performance Evaluation Tools


1
Industrial Engineering Department, School of Engineering, Université du Québec à Trois-Rivières, Trois-Rivières, QC G9A 5H7, Canada
2
Laboratoire de Mécanique, Matériaux et Procédés LR99ES05, École Nationale Supérieure d’Ingénieurs de Tunis, Université de Tunis, 5 Avenue Taha Hussein, Montfleury, Tunis 1008, Tunisia
*
Author to whom correspondence should be addressed.
Safety 2021, 7(3), 64; https://0-doi-org.brum.beds.ac.uk/10.3390/safety7030064
Submission received: 2 June 2021
/
Revised: 6 September 2021
/
Accepted: 10 September 2021
/
Published: 15 September 2021
(This article belongs to the Collection Occupational Health and Safety in A Changing World: Realities, Challenges and Perspectives)
Abstract
:In industrialized nations, occupational health and safety (OHS) has been a growing concern in many businesses for at least two decades. Legislation, regulation, and standards have been developed in order to provide organizations with a framework for practicing accident and illness prevention and placing worker well-being at the center of production system design. However, the occurrence of several accidents continues to show that OHS performance evaluation is subject to interpretation. In this review of the literature, we outline the scope of current research on OHS status and performance evaluation and comment on the suitability of the instruments being proposed for field use. This study is based on a keyword-based bibliographical search in the largest scientific databases and OHS-related websites, which allowed us to identify 15 OHS performance evaluation tools. Our principal conclusion is that researchers in the field have shown little interest in generalizing the instruments of OHS performance evaluation and that none of the 15 tools examined is properly applicable to any real organization outside of the sector of activity, economic scale, and jurisdiction for which it was designed.
1. Introduction
In developed nations, interest in workplace health and safety grew quickly over the past 20 years, especially in industrial settings, and the prevention of occupational risks has become a top priority in many organizations. In spite of the new legislative frameworks and standards implemented, occupational health and safety (OHS) status and performance remain subject to a wide range of interpretations, which is sometimes unhelpful. Based on the literature in this field, a consensus on how OHS performance should be defined has been slow to materialize [1]. Some authors focus on the maintenance of injury-free status over long periods of time or on an aptness to prevent occupational injuries or illness [2,3]. Others presume that OHS management must be effective if the organization can claim quantitative reductions of workplace injuries in the short to medium term [1,4,5].
The conventional wisdom was that OHS performance is properly embedded in continuous quality improvement or total quality as accident prevention and health and safety management systems [6,7]. These systems were intended to provide a method of evaluating improvements achieved through effective management of workplace hazards, the approach being based on the principle of planning, developing, monitoring, and adjusting (PDMA) or the Deming wheel. The advantages to be gained from implementing an OHS management system are multiple, since its application often leads to the improvement of communication channels as well as policies and procedures [6].
A performance evaluation process is necessary in order to be able to estimate how much progress is attributable to systemic improvement and how much is attributable to the effectiveness of the preventive measures implemented. Evaluation is in any case an essential component of OHS management [1], informing about implementation, development, and follow-up of the results [4]. Follow-up plays a supporting role in prevention by making it easier to identify weaknesses and plan corrective measures [5]. Performance measurement provides support for decision making and reveals progress achieved relative to an initial condition or performance level [8]. Actual measurement can be based on several indicators, which collectively characterize the current status and the evolution of OHS within a company [9]. Article L4121-1 of the Québec labor code specifies that the employer must implement the measures necessary to ensure safety and protect the physical and mental health of workers [10], which places indicators at the heart of performance monitoring and follow-up [11]. Indicators suitable for this purpose may be quantitative, that is, numerical and objective, or qualitative, allowing characterization of perceptions (which may be quantized as levels), opinions, attitudes or behaviors [9,11]. The literature divides indicators into two main categories: (1) reactive, or results used as measurements of losses, and (2) proactive or leading, which suggest corrective actions to be implemented [9,11,12]. However, one of the most difficult tasks for managers is to identify indicators that provide proper measurement of progress achieved [13].
Numerous workplace accidents continue to remind us that OHS performance remains below expectations and represents a huge challenge for organizations, especially in the private sector. In Québec, 103,406 work-related injuries were recorded in 2018, which is an increase of 7271 compared to the previous year [14]. Although several OHS performance evaluation tools have been described in the literature, none of these are regarded as generalizable in practice [1,7,15,16].
The aim of this study is to describe the strengths and limitations of the tools currently proposed for evaluating OHS performance. Our research methodology is described in Section 2, which is followed by the results of the bibliographic search in Section 3, a discussion of the results and the limitations of the study in Section 4, and a conclusion in Section 5.
2. Research Methodology
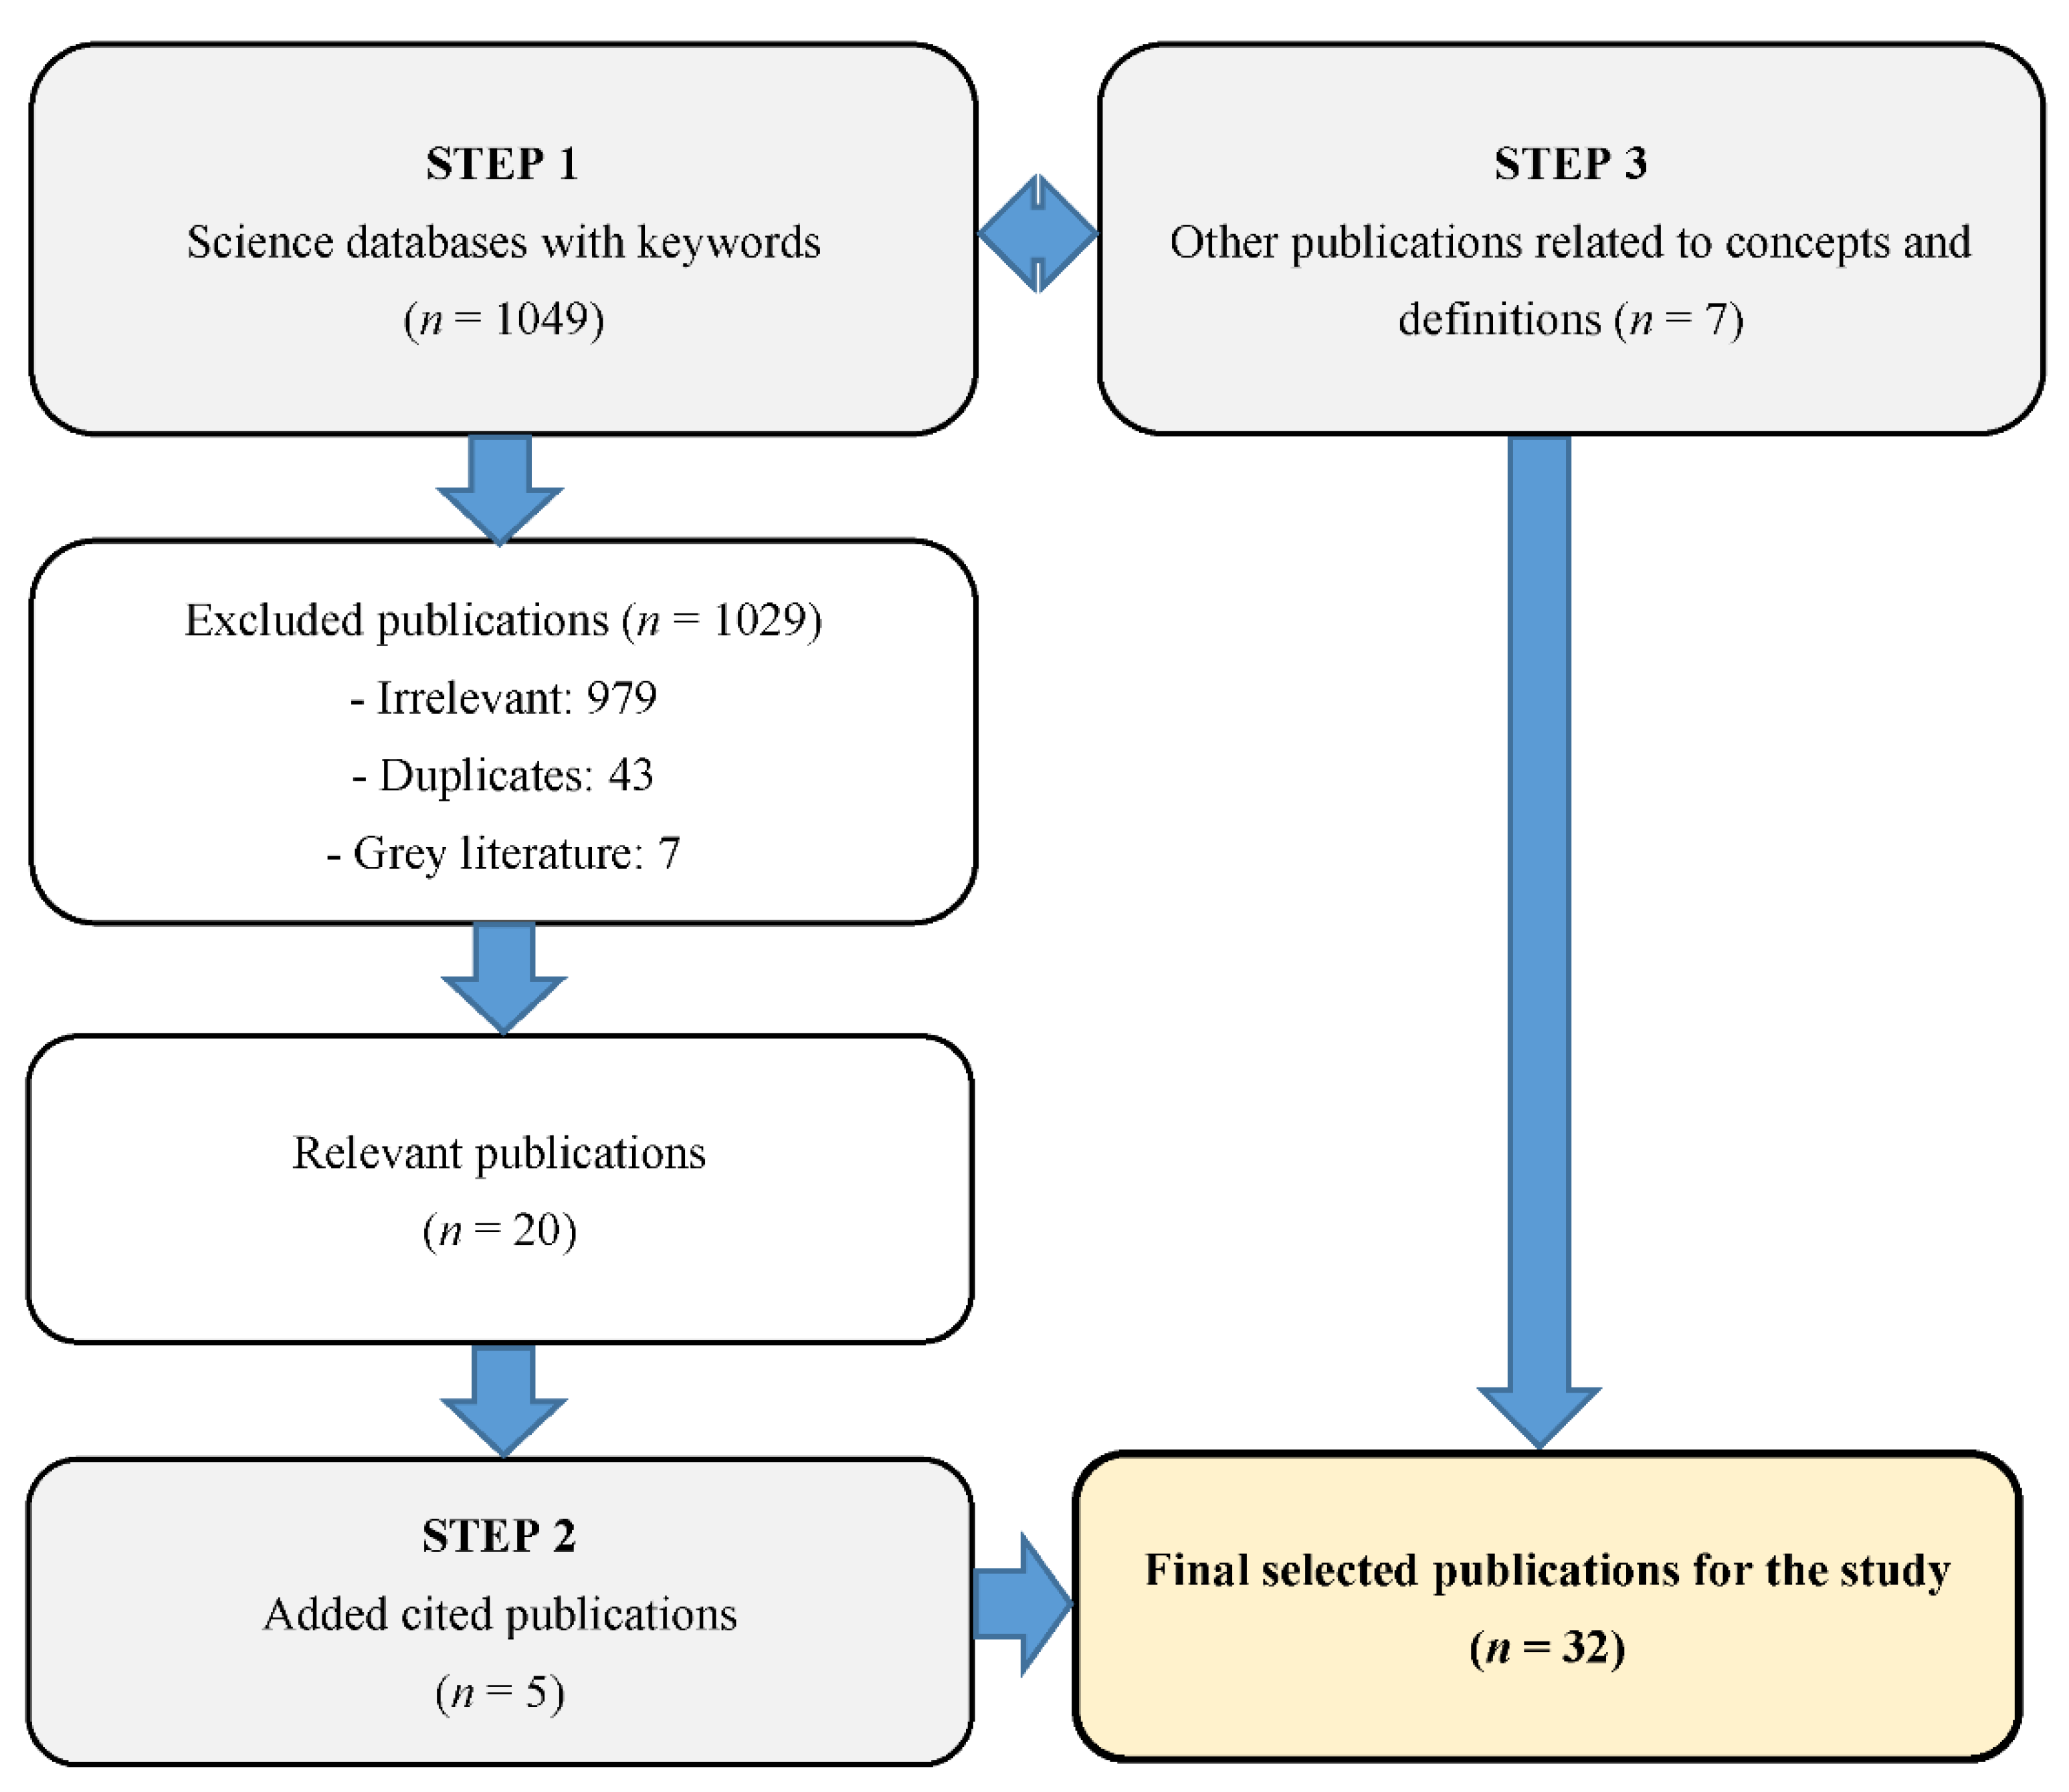
It is necessary to mention that this bibliographic research methodology is a hybrid and not entirely systematic. Indeed, the word hybrid means “composed of elements of different natures”. The hybrid or mixed methodology is a combination of research methodologies, allowing the researcher to mobilize the advantages of each methodology used. It helps to master the subject studied in all its dimensions. The publications reviewed in this paper are obtained in three steps. Figure 1 provides an overview of the proposed research methodology of this article.
First, a list of readings was identified following a systematic search by keywords. This study began with a literature search and selection of relevant publications. Keywords were used to query the science database Scopus and for searches of Google, as well as specialized databases at websites such as Institut de recherche Robert-Sauvé en santé et en sécurité du travail (IRSST, Québec), Institut national de recherche et de sécurité (INRS, France), and the International Labor Organisation (ILO). The searches were conducted in French and English with keywords grouped using the operators “and” or “or”. The keywords included “occupational health and safety”, “performance”, “evaluation”, “evaluation tools”, “indicators”, “performance measurement”, and “performance indicators”.
In order to enrich the review, we included all documents judged relevant to our study: scientific journal or conference articles, theses, reports, standards, and regulations. Gray literature and articles more than 12 years old were excluded. The choice of relevant evaluation instruments or “tools” was based on the apparent quality and credibility of the sources. We analyzed article titles, keywords, and abstracts. Publications published in international journals mainly from 2008 and 2019 were analyzed and evaluated on the basis of methodological quality and the clarity of the research objectives.
Second, several publications from the first selected list directed us to further reading that was cited more than 2 times. These were added to the literature review because of their relevance.
Third, we have added to the bibliography other relevant publications in order to help readers better understand the different concepts and definitions related to this study such as OHS performance, performance measurement and performance indicators.
3. Results
For the purposes of this study, a definition of OHS performance proposed previously [5] was used, which is based on the following specific criteria:
- -
- Performance is adequate if the organization practices effective management of OHS;
- -
- OHS management is effective if it reduces or eliminates work-related injuries or illnesses in the organization.
OHS evaluation tools are often based on reactive indicators [12]. These are based on standardized formulas (Table 1) for calculating a performance average over a given period of time [4,9]. Reactive or lagging indicators help the organization learn from its errors and focus its preventive measures [9]. Their use is simple and quick, and the numbers are easy to gather, interpret, and understand [8,17]. However, they have their limitations, the main one being that they show only what events have occurred and do not suggest anything about future performance [9]. In addition, they may be unreliable and imprecise because of under-reporting of occupational injuries and illness [8,9].
As a result of the above-mentioned inadequacies of reactive indicators, researchers turned their attention to proactive or leading indicators, which are also called predictors. These indicators shed light on insidious causes of occupational injury or illness and thus can be more helpful in guiding preventive measures [8]. Two main categories of parameter may be recognized: uptake and actualization [9]. Indicators of uptake reflect the extent to which OHS is integrated into the priorities of an organization and must be based on a managerial referential chosen by the organization. Indicators of actualization (or follow-up) reveal the extent to which preventive measures implemented to eliminate, reduce, or control risks identified previously have become workplace reality. However, proactive indicators also are not entirely adequate. To begin with, the information they provide is very specific [19]. An evaluation is no more valid than the initial choice of indicators, and an incomplete choice can lead to underestimation or overestimation of the real impact of a preventive measure and give a distorted view of a situation [9]. Proactive indicators can also be difficult to quantify, and their evaluation can be time-consuming and subjective [9].
No single type of indicator gives a reliable measurement of OHS performance. Ideally, both types should be used simultaneously in order to cover the inadequacies of each [5,7,17].
Our search of the literature published over the years 2008–2019 readily revealed 15 OHS performance evaluation tools. This of course does not include in-house instruments developed for commercial use in private companies. In our analysis of the applicability of each of these tools, we referred to the following four criteria:
- -
- The design method, which differs from one tool to the next in accordance with the vision of the creators. The majority of the tools identified are based on published studies; others are based on specific data or expert opinion [7,15,16,17,20,21,22,23]. This criterion provides an overall idea of tool capability, effectiveness, and generalizability.
- -
- -
- Sector of application, which suggests how flexible the tool might be. An evaluation tool is potentially generalizable if it appears to be applicable in all sectors or better yet in any country. The majority of the tools found in the literature were designed for specific sectors [1,7,15,16,17,20,21,22,23,26,27,28,29,30].
- -
- Reliability, meaning that the tool is apt to give similar results from one evaluator to the next [5]. This essential criterion is not always met [5,31]. We seek a tool that is reliable by virtue of being designed with indicators that are relevant to OHS performance evaluation in a company of any size in any sector. This criterion is met only if the other three are.
3.1. Tool 1—OHS Self-Diagnostic Tool (2008)
This tool was developed in the course of a study funded by the IRSST (Institut de recherche Robert-Sauvé en santé et sécurité du travail) for the purpose of evaluating OHS performance in Québec manufacturing businesses [26]. It is a questionnaire for workers that is composed of proactive indicators drawn from the literature and scored on a 10-point Likert scale. Table 2 lists a few examples of the workplace compliance indicators used in the tool.
Simple and user-friendly, this diagnostic tool addresses only the perspective of individual workers, and its effectiveness is limited compared to the considerable time and effort needed to obtain and process the data. The scores may be influenced by transient irritants in worker relations with management. Furthermore, it was designed specifically for the printing sector, and adaptations would be necessary to make it suitable for other industries.
3.2. Tool 2—Safety and Health Assessment System Standard in Construction (SHASSIC, 2010)
This OHS evaluation system was introduced in Malaysia by the Construction Industry Development Board [20]. The SHASSIC is composed of 14 proactive indicators drawn from various strategies of the Malaysian Building Construction Master Plan. The questionnaire is divided into three sections: documentation, workplace inspection, and interviews with employees. Table 3 lists examples of the indicators included.
In spite of the relevance of the indicators to OHS performance measurement, the tool does not appear to be readily applicable outside of the Malaysian Building Construction Master Plan context. In addition, the indicators are not standard and may vary from one study to the next, suggesting that time-consuming adjustments are necessary before each use.
3.3. Tool 3—Organizational Performance Metric (OPM, 2011)
The Institute for Work and Health (IWH, Toronto) measurement of organizational performance [32] was designed as a short questionnaire comprising eight proactive indicators (Table 4) drawn from a literature review and selected with help from experts in OHS. It uses a 5-point Likert scale and is applicable to Canadian companies regardless of size and industrial sector.
The OPM is a simple tool and appears to be generalizable, but its limited number of indicators does not provide a complete and practical view of company OHS performance or allow any identification of effective corrective measures. The results obtained could depend on how the data are gathered (in person, over the phone, in a meeting), and there is much room for subjectivity in the evaluation of indicators expressed as these are.
3.4. Tool 4—Project Safety Index (PSI, 2011)
This tool was created to allow the detection and correction of OHS problems before they manifest themselves as injuries and illnesses [17]. The number of indicators is limited to four reactive and seven proactive plus worker opinion of the use of such tools in general. Tool design and selection of indicators was aided by managers and clients of a large Australian construction company. Table 5 summarizes the indicators as well as complementary elements of inquiry addressed to laborers.
This tool again is easy to use, and data from different periods are easily compared [17]. However, its design is based on a single case study in a single company and would not be generalizable without adjustments. The reactive indicators would stretch the resources of small companies. Short of subjecting the entire staff repeatedly to time-consuming surveys, it would be difficult to monitor OHS performance using this tool.
3.5. Tool 5—System of Performance Indicators in Ergonomics for Building Construction (SIDECE, 2012)
SIDECE is the Portuguese acronym for this system. The tool was developed for evaluation of ergonomic aspects of working in large and small construction companies in Brazil [21]. It comprises 33 proactive and 29 reactive indicators drawn from a literature review, which is distributed in nine categories and scored on a 5-point Likert scale. The approach was based on Brazilian ergonomic standard NR-17 and civil construction regulation NR-18. Table 6 shows examples of indicators.
The strength of this tool lies in the combination of reactive and proactive indicators, making it broadly applicable to building construction companies. However, only the ergonomic aspect of OHS is evaluated. The authors mention also that the effectiveness of the tool depends on worker participation and collaboration, without which no real change occurs in the workplace. Obtaining clear and accurate information is an additional challenge.
3.6. Tool 6—Measures Suitable for Proactive Indicators of OHS Status (2012)
Agumba and Haupt [15] identified a set of proactive indicators suitable for helping small construction companies in South Africa to monitor and improve their OHS status. The Delphi method was used to evaluate the distribution of the 64 indicators (drawn from published studies) in 10 families. After several iterations and with help from OHS experts, the list was reduced to 62. Examples are shown in Table 7.
Among the limitations of this study, we again find the difficulty of generalizing the tool to other sectors. Though drawn from a literature search, most of the indicators would have been obvious to any reasonable person taking OHS seriously. The Delphi method imposes limitations on the experts, who can choose only among preselected indicators and thereby shorten but not lengthen or improve the list.
3.7. Tool 7—Total Safety Performance (TSP, 2014)
Total Safety Performance was designed for evaluating overall OHS performance in Taiwanese companies [1]. TSP is a questionnaire comprising 25 proactive indicators drawn from the literature and distributed over three dimensions: technical, organizational, and human (Table 8). They are scored on a 5-point Likert scale. Again, OHS experts were involved in the development of the questionnaire. The tool was validated using three case studies in Taiwanese electronics factories.
The three dimensions of company non-productive activities covered by the wide variety of indicators provide a broader view of OHS performance. However, as was the case for the Organizational Performance Metric (tool 3), it is unclear what preventive actions could be implemented to improve scores for some of the indicators. Nor is it clear what the real difference would be between a score of 3 by one evaluator and a score of 1 or 5 by another. A tool is not made more generalizable by making the indicators more indefinite.
3.8. Tool 8—Fuzzy Comprehensive Performance Evaluation (HSE, 2015)
Fuzzy logic has been tested in an attempt to take into consideration several expert evaluations simultaneously [16]. The HSE tool comprises 29 proactive indicators (Table 9) selected using an in-house procedure at a large petrochemical company and scored on a 5-point Likert scale.
The HSE tool is flexible, since different evaluations carried out by multiple users can be managed. In addition, calculation is automatic, and the software generates the report, saving considerable time. However, some of the indicators do not express clearly what is to be evaluated. They might be understood within the company that formulated them, but how generalizable they are in practice is uncertain. What the data would identify as preventive actions to be implemented is unclear, as is how similar evaluations by different parties would be at different times.
3.9. Tool 9—Monash University Organizational Performance Metric (OPM-MU, 2016)
The organizational performance measurement tool proposed at Monash University [29] is an updated version of tool 3, based on an inquiry conducted in 66 workplace settings in medium-sized to large Australian companies. Its development took place in several steps, starting with the selection of OHS proactive indicators described in published articles (Table 10). Then, OHS performance tools were identified in the literature. Evaluation results showed that the original OPM tool developed by IWH is simpler and easier to use.
The principal modifications of the OPM-MU tool relative to the OPM [32] tool are as follows:
- -
- Replacing the percentage scale with a 5-point Likert scale;
- -
- Including questions about perception to evaluate how OPM was associated with various elements of OHS;
- -
- Inviting participants in the survey to declare the number of incidents in which they were involved personally;
- -
- Collecting the measurements used in the workplace in each organization;
- -
- Inclusion of reactive indicators.
The OPM-MU is a simplified measuring instrument that can be used as an initial inquiry on OHS status in a variety of industrial sectors. It can provide information on the quality of OHS management systems but with notable limitations, including not providing complete or deep understanding of OHS within a company and not being suitable for small companies. Its creators hope to improve it to the point where it will be useful for comparative analyses of OHS status [29].
3.10. Tool 10—CORESafety Health and Safety Management System (2016)
This OHS management tool was designed under the auspices of the National Mining Association for use in American mining companies. Based largely on an inquiry, it includes 133 practices distributed among 20 groups of five to nine each. After comparative analysis of the coded content associated with each practice, a list of over 1200 performance indicators was reduced to 22 and grouped into three categories: interventions, organizational performance, and employee performance [27]. A partial list of the performance indicators used in this tool is shown in Table 11.
These categories collectively provide an overview of OHS performance. Users may easily choose and examine the indicators that correspond to their current stage of the OHS management process, which were selected on the basis of the Plan–Do–Check–Act cycle. However, the sample of participants in the inquiry was appropriate for mining, and the resulting tool cannot be generalized beyond this sector [27]. Since the tool was used to develop the practices specified a priori in the inquiry, even in mining, it would suitable only for companies adopting an OHS management strategy aligned with these practices. Finally, 22 is a small number of OHS indicators for an operation as complex as a mine.
3.11. Tool 11—Diagnosis of the Commitment to OHS (2016)
Developed in a civil service context (CNESST, Québec), this tool is intended for use by agents in charge of implanting OHS culture in an organization. It consists of about 50 multiple-choice questions distributed in five categories [22]:
- -
- Commitment and support by upper management;
- -
- Employee (labour) participation;
- -
- Responsibilities of managers and labourers;
- -
- Organization of prevention;
- -
- Evaluation of overall OHS performance.
The answers to all questions are compiled, and an overall score is obtained by adding the totals for each of the five categories. The strength of this tool lies in its simplicity and ease of application. It is intended for the entire staff of an organization and requires no special training in OHS. However, its effectiveness depends on obtaining answers to all of the questions [22]. A realistic diagnosis requires the collaboration of all of the OHS agents in the organization. No software support for this tool is available.
3.12. Tool 12—OHS Profile (2018)
The Québec forestry, pulp, and paper sector commissioned the development of an OHS performance evaluation tool called “Profil SST” based on several tools described in the literature and designed specifically for small to medium-sized companies [7]. Performance is divided into four dimensions (organization, technical, behavioral, and continued improvement) and various thematic subdivisions containing several proactive indicators. The structure of “Profil SST” is summarized in Table 12 and Table 13.
The scoring of the indicators is binary (0 or 1). An overall score is obtained by attributing a weighting factor to the dimensions and themes using the analytical hierarchy process. Having completed the evaluation, the practitioner must fill out a questionnaire and participate in a semi-directed interview. This questionnaire consists of 37 questions scored on a 9-point Likert scale [7].
Although apparently valid evaluations have been obtained using this tool, it was designed for and tested in small-to-medium-sized companies in a single sector. A different selection of indicators would be necessary in order to use it in another industrial sector. Although the authors suggested using a combination of reactive and proactive indicators, the design was constrained by the industrial partner’s previous use of reactive indicators (workplace accident costs and other statistics) to structure OHS interventions in specific settings.
3.13. Tool 13—Risk Management Maturity Measurement: A Preliminary Model (2018)
A measurement of risk management maturity based on a small number of indicators found in the literature has been proposed [28]. The indicators were first grouped into four families, namely risk management processes, organization and management, individuals, and finally tasks and resources. Then, the families were used with published models in order to devise a preliminary model better adapted to small and medium-sized businesses. Examples of indicators suitable for the risk management process family are listed in Table 14.
Risk management maturity is measured on a 5-level scale ranging from immature (naïve) to mature (improving) with reactive, standard, and proactive stages in between. Percentage intervals assigned to each level, and notes for each element of the corresponding family add to the practicality of the tool [28].
One of the first to focus on small and medium-sized businesses, this model suffers from covering relatively few measures of risk management maturity and offering no means of weighting or quantifying the indicators identified.
3.14. Tool 14—Measurable Proactive Indicators of Risk Management Maturity (2019)
Proactive indicators suitable for use in a small to medium-sized chemical company in China were collected from the literature and divided into four families, namely operations, management, individuals, and resources and technologies [30]. Other indicators known to vary with risk were added. Based on the work accident records for the preceding 24 months, 16 participating companies were divided into two groups for evaluation of the measurability of the indicators proposed. The operations-based indicators are shown in Table 15.
Using measurable proactive indicators, managers may gain basic understanding of the risk management maturity of their company. The findings of the study confirmed that companies that were diligent in proactive risk management activities were able to decrease their number of workplace accidents. It remains uncertain how many of the indicators proposed could be generalized, since they were designed to reflect the risk management maturity of Chinese chemical companies in the small to medium-sized category. Such companies tend to be large by Canadian standards.
3.15. Tool 15—Evaluation of OHS Management (2019)
The food industry in Taiwan was the setting for an OHS performance evaluation based on the review of the literature used to design tool 7 above [23]. With expert opinion solicited using the Delphi method, six indicators were eliminated (emergency interventions, purchasing policy, management of change, safety communication, preventive management, and safety behavior) and 25 OHS management problems not previously addressed were identified. Scored on a 5-point Likert scale, the 28 key indicators, 25 of which were used for tool 7, were distributed among three OHS factor categories: technical, organizational, and human. The three additional indicators are listed in Table 16.
Although this tool appears to be usable in other industries, it is based entirely on self-diagnosis by employees, similarly to tool 1. Six of the 28 indicators were not properly implemented and need to be improved. No software support was available.
3.16. Characteristics, Strengths, and Weaknesses of All Identified Tools
The characteristics, strengths, and weaknesses of the 15 tools described above, plus others suggested by the methodology that we applied here and in our previous work (Tremblay and Badri, 2018), are summarized in Table 17.
4. Discussion and Limitation of This Study
As mentioned above, a company is considered to be competent in OHS if it practices effective management of OHS. Performance evaluation is an essential component of OHS management that is indispensable for measuring improvements and assessing the effectiveness of implemented measures [1]. Therefore, the instruments used for such evaluation must be reliable and not a burden that causes evaluation to become irregular.
The scientific literature contains descriptions of a wide variety of evaluation tools based on reactive or proactive indicators or occasionally combinations thereof. In recent years, proactive indicators have become more popular among researchers. Of the 15 tools examined in the present study, only two combine both types, namely tools 4 and 5, which were published within a year of each other [17,21]. This combination may be thought to provide a broader view and a possibly more complete assessment of OHS performance, and hence to guide the implementation of more effective measures [5,7,17]. The advantages and drawbacks of both types of indicator are summarized in Table 18 [4,5,7,9,12,17,19,24,25,26].
What is readily observed by comparing the 15 published OHS performance evaluation tools is that the same method was applied in most cases, that is, relying on the scientific literature as a source of indicators and often having OHS experts review them, as was the case for tools 1, 3, 6, 7, 12, and 15 [1,7,15,23,26,32]. This method usually led to an adequate evaluation content. However, other tools relied heavily on specific indicators, which were drawn for example from a building construction master plan [20] or from the in-house procedures of a petrochemical company [16]. In one case (tool 4), the collaboration of clients of the company involved in the study was solicited for selection of the indicators [17]. Tools obtained using such case-specific methods later have to be adapted for application to other economic sectors if they can be used at all outside of the setting for which they were originally designed.
Among these 15 tools, three appear to be generalizable, having been designed with this intention, two of which are applicable in Canada, namely tools 3 [32] and 13 [28] and one in Australia, namely tool 9 [29]. The others would not be applicable outside of their specific sectors unless they were adapted, and this might be necessary on a case-by-case basis.
The aptness of an evaluation tool for OHS status and performance does not depend solely on the validity of its content or on a superior design method. The ideal tool would be both reliable and generalizable to work environments in different economic sectors. However, none of the tools examined met this criterion. As effective as some of them might be in the setting for which they were designed, all bets appear to be off when the size of the organization, the country, or the type of production activity is changed. In fact, the analysis of the tools identified allowed us to conclude that the generalization of OHS performance evaluation tools has not received the attention of researchers in the field of OHS. The generalizability of a tool depends on its design method. The tools that are considered non-generalizable have been based on indicators for specific sectors that were chosen in collaboration with managers, the company’s customers, or derived from an internal company procedure.
The development of an instrument based on indicators that are better adapted to all employers or at least to all primary production or to all manufacturing companies, providing a universal tool equally effective in all of these work environments, would be a huge advancement in the field of occupational health and safety.
5. Conclusions
Over the years, many instruments have been developed for the purpose of evaluating the occupational health and safety status and performance of organizations both public and private, wherever employees are exposed to the risk of work-related injury or illness. Such tools ought to be capable also of guiding the choice of preventive actions implemented by such organizations and of measuring the effectiveness of these choices. In this article, OHS evaluation tools described in scientific journals and government report published during the period 2008 through 2019 were reviewed. Other types of literature such as unpublished internal reports as well as patents were not taken into consideration. It cannot be ruled out that some effective approaches to the evaluation of OHS status and performance were neglected.
The 15 tools retrieved by the literature search were examined according to the following four criteria: the design method, the evaluation content, the sector of application, and reliability. The applicability of a tool to the evaluation of OHS in a particular work setting can be judged from the choice of indicators. In most cases, tools derived from indicators described in scientific publications and reviewed by experts in OHS appear to have at least adequate evaluation content. Reactive and proactive indicators both have their advantages and limitations, and a combination of these types may provide a broader and presumably more complete view of OHS status and performance applicable to a variety of settings.
Demographic shifts are changing the needs of populations all around the world with regard to occupational health and safety. As life expectancy and quality of life continue to improve, conditions that were tolerated only a generation earlier become totally unacceptable. In order to meet the challenge of providing a healthier and safer workplace, employers must devise increasingly sophisticated systems that monitor employee well-being, which is constantly being redefined. The increasingly migratory nature of workforces has been complicating the task. Although effective systems are now widespread, the occurrence of several accidents continue to remind us that OHS status and performance are still below expectations. Regulatory agencies will continue to struggle with this persistent problem unless standard reliable OHS performance evaluation tools applicable to businesses of all sizes in all sectors are developed.
Author Contributions
This paper is entirely based on the results of research conducted by H.J. as part of his doctoral thesis in industrial engineering under the direction of A.B. and N.B.F. The paper has been written in collaboration between H.J., A.B. and N.B.F. All authors have read and agreed to the published version of the manuscript.
Funding
The authors thank the Université du Québec à Trois-Rivières (UQTR) and Natural Sciences and Engineering Research Council of Canada (NSERC) for their financial support.
Institutional Review Board Statement
Not applicable.
Informed Consent Statement
Not applicable.
Data Availability Statement
Not applicable.
Conflicts of Interest
The authors declare no conflict of interest.
References
- Liu, Y.-J.; Chen, J.-L.; Cheng, S.-Y.; Hsu, M.-T.; Wang, C.-H. Evaluation of safety performance in process industries. Process. Saf. Prog. 2014, 33, 166–171. [Google Scholar] [CrossRef]
- Arezes, P.M.; Miguel, A.S. The role of safety culture in safety performance measurement. Meas. Bus. Excel. 2003, 7, 20–28. [Google Scholar] [CrossRef]
- Wu, T.-C.; Chen, C.-H.; Li, C.-C. A correlation among safety leadership, safety climate and safety performance. J. Loss Prev. Process. Ind. 2008, 21, 307–318. [Google Scholar] [CrossRef]
- Sgourou, E.; Katsakiori, P.; Goutsos, S.; Manatakis, E. Assessment of selected safety performance evaluation methods in regards to their conceptual, methodological and practical characteristics. Saf. Sci. 2010, 48, 1019–1025. [Google Scholar] [CrossRef]
- Tremblay, A.; Badri, A. Assessment of occupational health and safety performance evaluation tools: State of the art and challenges for small and medium-sized enterprises. Saf. Sci. 2018, 101, 260–267. [Google Scholar] [CrossRef]
- OIT. Système de Gestion de la SST: Un Outil Pour une Amélioration Continue; Organisation Internationale du Travail: Geneva, Switzerland, 2011. [Google Scholar]
- Tremblay, A.; Badri, A. A novel tool for evaluating occupational health and safety performance in small and medium-sized enterprises: The case of the Quebec forestry/pulp and paper industry. Saf. Sci. 2018, 101, 282–294. [Google Scholar] [CrossRef]
- Roy, M.; Bergeron, S.; Fortier, L. Développement D’instruments de Mesure de Performance en Santé et Sécurité du Travail à L’intention des Entreprises Manufacturières Organisées en Equipes Semi-Autonomes de Travail; Robert-Sauvé Research Institute in Occupational Health and Safety of Quebec: Montreal, QC, Canada, 2004. [Google Scholar]
- Bédard, S.; Bélanger, L.; Cormier, Y.; LeQuoc, S. Guide de Prévention: Indicateurs en Prévention SST; Association Paritaire Pour la Santé et la Sécurité du Travail du Secteur Affaires Sociales (ASSTSAS): Montréal, QC, Canada, 2018. [Google Scholar]
- INRS. Employeur, Institut National de la Recherche Scientifique (INRS). 2020. Available online: http://www.inrs.fr/demarche/employeur (accessed on 16 April 2020).
- Juglaret, F. Indicateurs et Tableaux de Bord Pour la Prévention des Risques en Santé-Sécurité au Travail. Ph.D. Thesis, École nationale supérieure des mines de Paris, Paris, France, 2012. [Google Scholar]
- Sinelnikov, S.; Inouye, J.; Kerper, S. Using leading indicators to measure occupational health and safety performance. Saf. Sci. 2015, 72, 240–248. [Google Scholar] [CrossRef]
- Ruiz, A. La Mesure de la Performance “Un Outil D’amélioration des Services en Acquisition”. In Journée des Acquisitions et Des TIC; Université LAVAL: Quebec City, QC, Canada, 2014. [Google Scholar]
- CNESST. Honorons la Mémoire des Personnes Décédées ou Blessées au Travail. 2019. Available online: https://www.cnesst.gouv.qc.ca/salle-de-presse/communiques/Pages/26-avril-2019-quebec.aspx (accessed on 15 February 2020).
- Agumba, J.N.; Haupt, T.C. Identification of health and safety performance improvement indicators for small and medium construction enterprises: A Delphi consensus study. Mediter. J. Soc. Sci. 2012, 3, 545. [Google Scholar]
- Weijun, L.; Liang, W.; Zhang, L.; Tang, Q. Performance assessment system of health, safety and environment based on experts’ weights and fuzzy comprehensive evaluation. J. Loss Prev. Process. Ind. 2015, 35, 95–103. [Google Scholar]
- Lingard, H.; Wakefield, R.; Cashin, P. The development and testing of a hierarchical measure of project OHS performance. Eng. Constr. Arch. Manag. 2011, 18, 30–49. [Google Scholar] [CrossRef] [Green Version]
- Duguay, P.; Busque, M.-A.; Boucher, A. Indicateurs Annuels de Santé et de Sécurité du Travail Pour le Québec: Étude de Faisabilité (Version Révisée); Robert-Sauvé Research Institute in Occupational Health and Safety of Quebec: Montreal, QC, Canada, 2012. [Google Scholar]
- Reiman, T.; Pietikäinen, E. Leading indicators of system safety–monitoring and driving the organizational safety potential. Saf. Sci. 2012, 50, 1993–2000. [Google Scholar] [CrossRef]
- Misnan, M.S.; Mohamad, S.F.; Yusof, Z.M.; Bakri, A. Improving Construction Industry Safety Standard through Audit: SHASSIC Assessment Tools for Safety. In Proceedings of the CRIOCM 2010 15th International Symposium, Johor Bahru, Malaysia, 6–7 August 2010. [Google Scholar]
- Bezerra, I.X.B.; de Carvalho, R.J.M. Construction and application of an indicator system to assess the ergonomic performance of large and medium-sized construction companies. Work 2012, 41 (Suppl. 1), 3798–3805. [Google Scholar] [CrossRef] [PubMed] [Green Version]
- Bourque, G.; Chabot, L.-F. Outil Diagnostic: Prise en Charge de la Santé et de la Sécurité du Travail. In Commission des Normes, de L’équité, de la Santé et de la Sécurité du Travail (CNESST); Commission des Normes, de L’équité, de la Santé et de la Sécurité du travail: Québec, QC, Canada, 2016. [Google Scholar]
- Cheng, S.-Y.; Lin, K.-P.; Liou, Y.-W.; Hsiao, C.-H.; Liu, Y.-J. Constructing an active health and safety performance questionnaire in the food manufacturing industry. Int. J. Occup. Saf. Ergon. 2019, 27, 1–7. [Google Scholar] [CrossRef] [PubMed]
- Cadieux, J.; Roy, M.; Desmarais, L. A preliminary validation of a new measure of occupational health and safety. J. Saf. Res. 2006, 37, 413–419. [Google Scholar] [CrossRef] [PubMed]
- Hinze, J.; Thurman, S.; Wehle, A. Leading indicators of construction safety performance. Saf. Sci. 2013, 51, 23–28. [Google Scholar] [CrossRef]
- Roy, M.; Cadieux, J.; Fortier, L.; Leclerc, L. Validation D’un Outil D’autodiagnostic et D’un Modèle de Progression de la Mesure en Santé et Sécurité du Travail; Robert-Sauvé Research Institute in Occupational Health and Safety of Quebec: Montréal, QC, Canada, 2008; p. 36. [Google Scholar]
- Haas, E.J.; Yorio, P. Exploring the state of health and safety management system performance measurement in mining organizations. Saf. Sci. 2016, 83, 48–58. [Google Scholar] [CrossRef] [PubMed] [Green Version]
- Kaassis, B.; Badri, A. Development of a preliminary model for evaluating occupational health and safety risk management maturity in small and medium-sized enterprises. Safety 2018, 4, 5. [Google Scholar] [CrossRef] [Green Version]
- Shea, T.; De Cieri, H.; Donohue, R.; Cooper, B.; Sheehan, C. Leading indicators of occupational health and safety: An employee and workplace level validation study. Saf. Sci. 2016, 85, 293–304. [Google Scholar] [CrossRef]
- Sun, J.; Liu, C.; Yuan, H. Evaluation of Risk Management Maturity: Measurable Proactive Indicators Suitable for Chinese Small and Medium-Sized Chemical Enterprises. In IOP Conference Series: Earth and Environmental Science; IOP Publishing: Xi’an, China, 2019. [Google Scholar]
- Robson, L.S.; Bigelow, P.L. Measurement properties of occupational health and safety management audits: A systematic literature search and traditional literature synthesis. Can. J. Public Health 2010, 101, S34–S40. [Google Scholar] [CrossRef] [PubMed]
- Amick, B.; Farquhar, A.; Grant, K.; Hunt, S.; Kapoor, K.; Keown, K.; Lawrie, C.; McKean, C.; Miller, S.; Murphy, C.; et al. Benchmarking Organisational Leading Indicators for the Prevention and Management of Injuries and Illnesses: Final Report; Institute for Work & Health: Toronto, ON, Canada, 2011; p. 14. [Google Scholar]
Figure 1.
Research methodology.


Table 1.
Reactive indicators described in the scientific literature.
| Authors | Category | Formula |
|---|---|---|
| IRSST report R-357 [8] | Rate (R) | |
| Frequency (F) | ||
| Severity (S) | ||
| Severity index (I) | ||
| IRSST report R-725 [18] | Frequency (F) | |
| Rate (R) | ||
| Severity (S) | ||
| Prevalence | ||
| 1 CSST burden (B) | ||
| Payout per lesion (avg.) | ||
| [11] | Severity index (S) | |
| Severity (S) | ||
| Rate (R) | ||
| Frequency (F) | ||
| ASSTSAS GP75 guide to prevention [9] | Frequency (F) of absence per 100 2 FTE workers | |
| Rate of lesions causing absence per 200,000 h worked (R) | ||
| Severity per 100 FTE workers | ||
| Severity (SS) scaled to 200,000 h worked | ||
| Severity index (SI) |
1 CSST = Québec labour safety commission; 2 FTE = full-time or equivalent.
Table 2.
Indicators used in the IRSST tool (translated from [26]).
Table 2.
Indicators used in the IRSST tool (translated from [26]).
| N° | Indicator |
|---|---|
| 1 | The required means of protection are installed on the equipment and machinery. |
| 2 | Preventative maintenance of the equipment is carried out. |
| 3 | The employer provides the personal protective devices required for the work. |
| 4 | The employer respects regulations regarding noise, air quality, and so on. |
| 5 | The workstations are adjustable to the characteristics of the employees. |
| 6 | The employer enforces safe work practices (e.g., lockout–tagout, enclosures, etc.) |
Table 3.
Indicators used in the SHASSIC tool [20].
Table 3.
Indicators used in the SHASSIC tool [20].
| N° | Indicator |
|---|---|
| 1 | Personal protective devices |
| 2 | Evaluation of risks and identification of hazards |
| 3 | Safety policy |
| 4 | Training and promotion (e.g., initial training, training prior to job performance review, handling of dangerous materials, etc.) |
| 5 | Management of machinery and equipment |
| 6 | Emergency safety procedures (e.g., evacuation route, location of first-aid kits, important phone numbers, persons in charge to contact, etc.) |
| 7 | System of accident reporting and inquiry |
Table 4.
Indicators used in the OPM tool [32].
Table 4.
Indicators used in the OPM tool [32].
| N° | Indicator |
|---|---|
| 1 | Formal safety audits at regular intervals are an integral part of our activities. |
| 2 | All personnel promote continuous improvement of OHS performance. |
| 3 | The company considers OHS to be as important as production and quality. |
| 4 | Laborers and supervisors all have the information they need in order to work safely. |
| 5 | Laborers always participate in decisions involving health and safety. |
| 6 | Staff in charge of OHS have the power to bring about changes deemed necessary. |
| 7 | Employees who practice safe methods of working are recognized and encouraged. |
| 8 | All personnel are provided with the protective devices necessary for working safely. |
Table 5.
Indicators used in the PSI tool [17].
Table 5.
Indicators used in the PSI tool [17].
| Type | Indicator |
|---|---|
| Reactive | Number of employees injured |
| Number of injuries requiring medical treatment | |
| Number of injuries not requiring first aid | |
| Number of injuries causing lost hours of work | |
| Proactive | Number of close-call mishaps declared |
| Number of informal inspections | |
| Number of problems noted during informal inspections | |
| Number of official inspections | |
| Number of problems noted during official inspections | |
| Number of analyses of risk | |
| Number of problems noted during risk analysis | |
| Complementary elements of inquiry | I have received proper training in OHS. |
| OHS concerns can be discussed openly. | |
| My supervisor recognizes and supports safe behavior. | |
| My supervisor is open to ideas for improving OHS. | |
| My coworkers participate in OHS activities. | |
| My coworkers are mindful of my health and safety. | |
| Management promotes OHS in a true sense. |
Table 6.
Indicators used in the SIDECE system [21].
Table 6.
Indicators used in the SIDECE system [21].
| Type | Indicator |
|---|---|
| Reactive | Production error rate |
| Lost labor attributed to ergonomically inappropriate furniture | |
| Company net income | |
| Medical care provided to workers (cost, number of interventions) | |
| Seriousness of accidents | |
| Absenteeism | |
| Cost of repairing and replacing equipment and materials | |
| Proactive | External pressure on company |
| Good logistical and construction site set-up practices | |
| NR-17 compliance with construction site environmental conditions | |
| NR-17 compliance with site machinery, equipment, and tools | |
| NR-17 compliance with task organization | |
| Improvement of work processes and technologies | |
| Employee trust of employer index | |
| PCMAT compliance with worker health and safety | |
| OHSAS 18,001 compliance with workplace satisfaction | |
| NR-18 compliance with material loading, transport, and unloading |
Table 7.
Construction project indicators proposed by [15].
Table 7.
Construction project indicators proposed by [15].
| N° | Indicator |
|---|---|
| 1 | For each project, employ at least one worker with OHS training. |
| 2 | For each project, employ at least one OHS representative. |
| 3 | Provide written information on OHS procedures. |
| 4 | Inform the workers about preventive and risk-reducing measures with pamphlets. |
| 5 | Provide verbal instructions on OHS that are understandable by all employees. |
| 6 | Organize regular meetings to inform workers verbally about OHS measures. |
| 7 | Provide personal protective devices. |
| 8 | Provide the right tools, equipment, and installations for the job. |
| 9 | Set up the project site with OHS in mind. |
| 10 | Use proper procedures for risk evaluation. |
| 11 | Have hazards identified by at least one employee trained in OHS. |
| 12 | Carry out OHS inspections on a daily basis at least. |
| 13 | Give employees OHS training regularly. |
| 14 | Encourage and support OHS training of employees. |
| 15 | Communicate regularly with employees on OHS matters. |
| 16 | Implement the OHS management system properly. |
| 17 | Have an OHS policy. |
| 18 | Participate in OHS inspections. |
| 19 | Participate in the production of the OHS policy. |
Table 8.
Indicators included in the TSP tool [1].
Table 8.
Indicators included in the TSP tool [1].
| Dimension | Indicator |
|---|---|
| Technical | Self-inspection |
| Emergency plan | |
| Personal protective devices | |
| Handling of dangerous materials | |
| Safety protection (including risk control) | |
| Risk analysis | |
| Organizational | Legislation and regulation |
| Accident statistics and inquiry | |
| Commitment of management | |
| Organization and responsibility | |
| Education and training | |
| Management of subcontractors | |
| Management of purchases | |
| Management of change | |
| Licenses, work permits | |
| Communication | |
| Monitoring the work environment | |
| Health examinations | |
| Safety audit | |
| Planning review | |
| Progress review | |
| Follow-up review | |
| Human | Employee participation |
| Safe behavior | |
| Safety-oriented attitude |
Table 9.
The 29 indicators in the HSE tool [16].
Table 9.
The 29 indicators in the HSE tool [16].
| N° | Indicator | N° | Indicator |
|---|---|---|---|
| 1 | Leadership and commitment | 16 | Community and public relations |
| 2 | Health, safety, and environmental mission | 17 | Licenses, work permits |
| 3 | Hazard identification, risk evaluation, and critical control point determination | 18 | Health in the workplace |
| 4 | Legal and other obligations | 19 | Production per se |
| 5 | Objectives and goals | 20 | Operational control |
| 6 | Programs | 21 | Management of change |
| 7 | Organizational approach, obligations, resources, and documents | 22 | Emergency preparations and intervention |
| 8 | Resources | 23 | Output measurement and monitoring |
| 9 | Skills, training, and sensitization | 24 | Evaluation of compliance |
| 10 | Communication, participation, and consultation | 25 | Aberrations, corrective and preventive actions |
| 11 | Documentation | 26 | Incident/accident management |
| 12 | Monitoring of documents | 27 | Monitoring of recordings |
| 13 | Installation structural integrity | 28 | Internal OHS audit |
| 14 | HSE management of subcontractors and suppliers | 29 | Managerial review |
| 15 | Clients and products |
Table 10.
Proactive indicators drawn from published studies [29].
Table 10.
Proactive indicators drawn from published studies [29].
| N° | Indicator | N° | Indicator |
|---|---|---|---|
| 1 | Responsibility for OHS | 6 | OHS hierarchical structure |
| 2 | Consultation and communication about OHS | 7 | Risk management |
| 3 | Autonomizing and involvement of employees in OHS decisions | 8 | OHS systems (policies, procedures, practice) |
| 4 | Commitment and leadership of management | 9 | Training, interventions, information, OHS tools and resources |
| 5 | Recognition of and positive feedback for OHS efforts | 10 | OHS inspections and audits in the workplace |
Table 11.
Indicators used in the CORESafety OHS management tool [27].
Table 11.
Indicators used in the CORESafety OHS management tool [27].
| Indicator Category | Performance Indicator |
|---|---|
| Interventions | Number of communications and meetings |
| Number of inquiries and examinations | |
| Number of corrective actions carried out | |
| Number of hazard alerts or suggestions | |
| Number of behavioral observations | |
| Information on employee participation (percent, number) | |
| Number of inquiries focused on OHS | |
| Organizational performance | Number and type of citations; percent compliance |
| Number and type of near accidents (close calls) | |
| Behavioral observation results | |
| Performance evaluation results | |
| Results of risk management studies (hazard inspections and audits) | |
| Inquiries into performance | |
| Employee performance | Numbers and type of injuries and illnesses |
| Results of analyses of principal causes of injuries and illnesses | |
| Medical monitoring or drug testing results | |
| Results of evaluations of employee knowledge of OHS | |
| Job performance reviews and interviews |
Table 12.
Structure of the “Profil SST” tool [7].
Table 12.
Structure of the “Profil SST” tool [7].
| Dimension | Organizational | Technical | Behavioral | Continued Improvement |
|---|---|---|---|---|
| Themes |
|
|
| Continued improvement |
Table 13.
Indicators of the “organizational” dimension [7].
Table 13.
Indicators of the “organizational” dimension [7].
| Theme | Indicator |
|---|---|
| Commitment of company directors | Managers have defined and written OHS roles and responsibilities (e.g., description of tasks, mandates). |
| Directors follow up to ensure that managers are fulfilling their OHS duties. | |
| Mechanisms of employee participation in OHS are in place (e.g., health and safety committee, designated representatives, OHS meetings). | |
| OHS is promoted by means other than posters. | |
| Identification and control of risks | Rescue and first-aid registries are in place. |
| The registry is used for preventive purposes (e.g., identifying recurrences, training employees, etc.). | |
| Inquiries and analyses are conducted after accidents and documented. | |
| OHS inspections are conducted periodically. | |
| Prevention program | The prevention program is up to date. |
| Written proof that every employee understands the program is on file. | |
| Employees who have no emergency duties know the evacuation plan. | |
| Employees who have emergency duties know the procedures. | |
| Training | New employees are trained for their tasks at their station (e.g., paired with an experienced partner). |
| A formal written training plan is in place. | |
| The employer files systematically written proof of training dispensed. | |
| Oversight of subcontractors | Subcontractors are apprised of the prevention program, the risks inherent in the company’s operations, and so on. |
| The subcontractor’s prevention program is requested and archived. | |
| All subcontractors sign when they have been apprised. |
Table 14.
Risk management process maturity indicators [28].
Table 14.
Risk management process maturity indicators [28].
| Indicator Category | Measurement |
|---|---|
| Identification of OHS risks | Number of hazards identified |
| Number of incident reports filed | |
| Number of inspections conducted | |
| Number of persons trained to identify hazards | |
| OHS risk estimation and evaluation | Number of estimations and evaluations conducted and validated |
| Number of risks identified per risk level | |
| Preventive and corrective actions | Number of preventive and corrective actions recommended |
| Number of effective preventives and corrective actions (verified and validated) | |
| Number of preventive actions per type of hazard (e.g., cramped spaces, heights, etc.) | |
| Number of actions correctives prioritized, per type of hazard (e.g., high or low severity) | |
| New number of hazards reported after implementation of preventive and corrective measures | |
| Characterization of risks | Correlation between proactive and reactive indicators |
| Number of potential hazards (of low or high severity, etc.) | |
| Number of hazards per specific category (e.g., cramped spaces, heights, etc.) | |
| Monitoring and review | Number of new evaluations of OHS risks |
| Effectiveness of corrective actions implemented |
Table 15.
Operations-based OHS indicators usable in small to medium-sized chemical companies [30].
Table 15.
Operations-based OHS indicators usable in small to medium-sized chemical companies [30].
| Code | Indicator Category | Examples of Measurements |
|---|---|---|
| O1 | Hazard identification | Number of hazards identified |
| Number of inspections focused on the safety of chemicals | ||
| Number of inspections focused on work-related risks | ||
| Number of persons trained to identify hazards | ||
| O2 | Risk estimation and evaluation | Number of estimations and re-evaluations performed |
| Risks identified per level or category | ||
| O3 | Preventive and corrective actions | Number of preventive and corrective actions recommended |
| Number of preventive/corrective actions judged effective | ||
| Number of preventive measures per type of hazard (e.g., closed spaces, sparks, etc.) | ||
| New number of hazards reported after implementing preventive and corrective measures | ||
| O4 | Characterization of risks | Correlation proactive and reactive indicators |
| Number of potential hazards ranked by severity | ||
| Number of hazards by specific category (e.g., closed spaces, heights, etc.) | ||
| O5 | Follow-up and examination | Number of new evaluations of risk |
| Effectiveness and efficiency of corrective actions implemented |
Table 16.
Additional key indicators of OHS performance [23].
Table 16.
Additional key indicators of OHS performance [23].
| OHS Factor | Key Indicator of Performance |
|---|---|
| Organizational | Preventive management practices |
| Protective measures for employees | |
| Human | Safety improvement program |
Table 17.
Comparison of OHS evaluation tools proposed during the period 2008–2019.
| Tool | Cited in [5] | Design Method | Content | Sector and Country | Intended User | Strengths | Weaknesses | |
|---|---|---|---|---|---|---|---|---|
| 1 | OHS self-diagnostic tool [26] | Yes | Indicators seen in the literature; reviewed by OHS experts; iterative process | Proactive indicators; 10-point Likert scale | Printing (Canada) | Managers | Simple and user-friendly | Vagueness and ambiguity; Needs to be adapted to each new milieu |
| 2 | Safety and health assessment system standard in construction [20] | No | Indicators taken from building construction master plan | 14 proactive indicators, scored with 1 to 5 stars | Construction (Malaysia) | Unspecified construction site personnel | Measures OHS performance; Guides improvement | Not generalizable; Elements vary from one study to the next |
| 3 | Organizational performance metric [32] | Yes | Indicators seen in the literature; Reviewed by OHS experts | 8 proactive indicators; 5-point Likert scale | All (Canada) | Entire staff | Simple and general | Limited reliability;Corrective measures difficult to identify |
| 4 | Project safety index [17] | Yes | Indicators chosen by managers and clients of the company | 11 indicators: 7 proactive, 4 reactive; 14 questions intended for employees | Construction (Australia) | Managers | Ease of application; Combination of reactive and proactive indicators | Needs to be adapted for use in other economic sectors |
| 5 | SIDECE ergonomics in building construction [21] | No | Indicators seen in the literature or based on ergonomic standards | 62 indicators: 33 proactive, 29 reactive, scored 1 to 5 | Building construction (Brazil) | Managers | Combination of indicators; Integration of ergonomic indicators | Vagueness and ambiguity; Focus on ergonomics |
| 6 | Proactive OHS indicator measures [15] | No | Indicators seen in the literature; reviewed by OHS experts | 62 proactive indicators chosen using Delphi | Construction (South Africa) | Entire staff | Precise use of proactive indicators | Needs to be adapted to each economic sector |
| 7 | Total safety performance [1] | Yes | Indicators seen in the literature; reviewed by OHS experts | 25 proactive indicators scored 1 to 5 | Electronics (Taiwan) | Not specified | Variety of indicators; Broad vision of OHS performance | Choice of indicators affects recommendations |
| 8 | HSE fuzzy comprehensive performance evaluation [16] | Yes | Indicator choice based on company In-house procedure | 29 proactive indicators scored 1 to 5; Data processed by software | Petrochemical (China) | Managers; OHS practitioners | Effective and practical for comparative studies | Difficult to generalize; Not all indicators express clearly what is being evaluated |
| 9 | Organizational performance metric [29] | No | Indicators seen in the literature; adaptation of the OPM model (tool 3) | 10 proactive indicators scored 1 to 5 | All (Australia) | Entire staff | Simplified measure used as an initial inquiry into OHS status | Not generalizable without adaptation |
| 10 | CORESafety HSMS [27] | No | Indicator selection aided by inquiry and review by OHS experts | 22 indicators; encoding; qualitative content analysis | Mining (USA) | Managers; OHS professionals | Broad vision of OHS performance | Designed for a single sector; too few indicators to evaluate OHS management |
| 11 | OHS commitment diagnostic tool [22] | No | Created by OHS experts at the CNESST | Questionnaire | All but construction (Québec, Canada) | OHS professionals | Simple, no specific OHS training required | Effectiveness depends on answers; no software support |
| 12 | “Profil SST” [7] | No | Indicators seen in the literature; reviewed by OHS experts | 94 proactive indicators scored 0 or 1 | Forestry, pulp, and paper (Québec, Canada) | Prevention practitioners | Simple and user-friendly | Not applicable outside the sector |
| 13 | Preliminary model of risk management maturity evaluation [28] | No | Indicators seen in the literature | 23 proactive indicators scored 1 to 5 | All (Canada) | Managers | Not limited to any specific sector of activity | No mode of indicator weighting or quantifying is provided |
| 14 | Measurable proactive indicators of OHS risk [30] | No | Indicators seen in the literature | 23 indicators (50 examples) case study | Chemical (China) | Managers | Proactive focus | For small and medium-sized chemical companies only |
| 15 | OHS management performance evaluation [23] | No | Indicators seen in the literature; reviewed by OHS experts | 28 proactive indicators scored 1 to 5 | Food industry (Taiwan) | Not specified | Complete model | Effectiveness unclear; some poor choices of indicator |
Table 18.
Advantages and drawbacks of proactive and reactive indicators of OHS status.
| Type | Advantages | Drawbacks |
|---|---|---|
| Reactive |
|
|
| Proactive |
|
|
Publisher’s Note: MDPI stays neutral with regard to jurisdictional claims in published maps and institutional affiliations. |
© 2021 by the authors. Licensee MDPI, Basel, Switzerland. This article is an open access article distributed under the terms and conditions of the Creative Commons Attribution (CC BY) license (https://creativecommons.org/licenses/by/4.0/).
Share and Cite
MDPI and ACS Style
Jemai, H.; Badri, A.; Ben Fredj, N. State of the Art and Challenges for Occupational Health and Safety Performance Evaluation Tools. Safety 2021, 7, 64. https://0-doi-org.brum.beds.ac.uk/10.3390/safety7030064
AMA Style
Jemai H, Badri A, Ben Fredj N. State of the Art and Challenges for Occupational Health and Safety Performance Evaluation Tools. Safety. 2021; 7(3):64. https://0-doi-org.brum.beds.ac.uk/10.3390/safety7030064
Chicago/Turabian StyleJemai, Hajer, Adel Badri, and Nabil Ben Fredj. 2021. "State of the Art and Challenges for Occupational Health and Safety Performance Evaluation Tools" Safety 7, no. 3: 64. https://0-doi-org.brum.beds.ac.uk/10.3390/safety7030064
Note that from the first issue of 2016, this journal uses article numbers instead of page numbers. See further details here.