The Impact of Diversified Farming Practices on Terrestrial Biodiversity Outcomes and Agricultural Yield Worldwide: A Systematic Review Protocol


Abstract
:1. Introduction
Aim
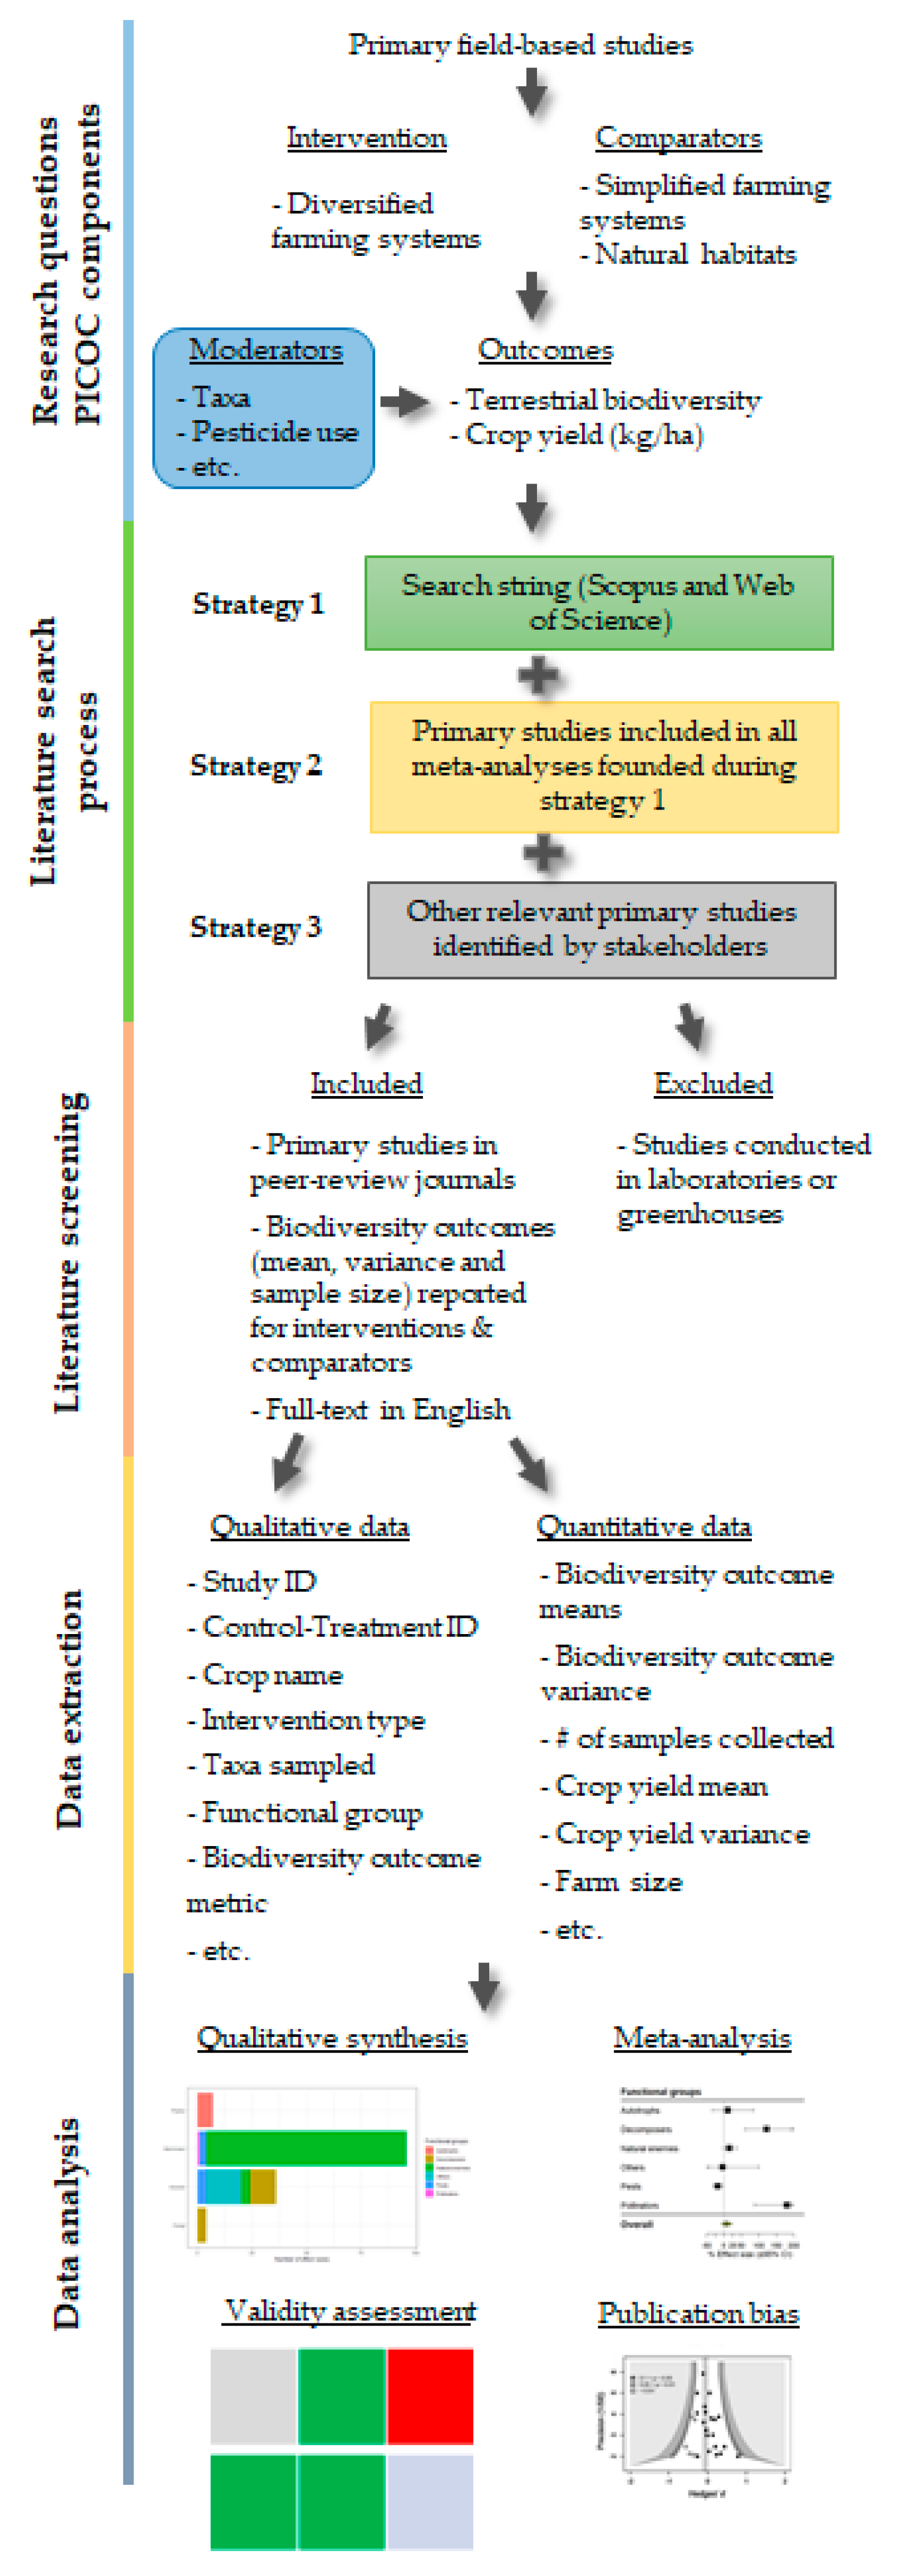
2. Protocol Design
3. Stakeholder Involvement
4. Step 1: Research Questions
4.1. Primary Question
Components of the Primary Question
- Population: terrestrial biodiversity in diversified and simplified farming systems and/or natural habitats worldwide, such as bacteria, animals, fungi, plants, etc.;
- Intervention: diversified farming practices (e.g., agroforestry, crop rotation, intercropping);
- Comparator: simplified farming practices (e.g., monoculture), and/or natural habitats (e.g., natural grasslands, primary or secondary forest);
- Outcomes: biodiversity outcome metrics (e.g., abundance, species richness, Shannon’s diversity index, percentage fungi colonization, etc.) and crop yield (i.e., kg/ha);
- Context: primary field-based studies with experimental and observational designs conducted anywhere in the world in agricultural fields, with or without comparable studies conducted in natural habitats.
4.2. Secondary Questions
- What is the state of evidence of diversified farming practices on biodiversity outcomes and trade-offs or synergies with yield, in terms of number of studies, geographic coverage, intervention types, population types (taxa group, functional group), outcome metrics, crop types, intervention practices?
- Do the effects of diversified farming on biodiversity outcomes and crop yield vary across different:
- taxonomic groups (e.g., bacteria, fungi, mammals),
- functional groups (e.g., pest, pollinators, decomposers),
- outcome metrics (e.g., abundance, species richness, Shannon’s diversity index),
- crop type (e.g., nuts, vegetables, fruits, etc.),
- management practices (i.e., fertilizer application, pesticide application, soil management),
- diversified farming practice (e.g., agroforestry, crop rotation, intercropping).
5. Step 2: Searching for Relevant Articles
6. Step 3: Selection of Articles
6.1. Screening Process
6.2. Eligibility Criteria
- Eligible Populations: any non-domesticated terrestrial micro or macro-organisms. This includes any surveyed organisms or group of organisms that can be classified to taxonomic phylum level, order or below (i.e., family, species level). Any life stage will be considered.
- Eligible Interventions: the articles must provide a clear description of the diversified agricultural systems. Diversified farming systems are represented by the association of different plant species (e.g., two crops; a crop and a beneficial non-crop), or different varieties/cultivars/accessions of crops (e.g., two crop genotypes) at multiple temporal and/or spatial scales, or the integration of livestock and fish production with crop production. We will distinguish six types of diversified farming systems as described in Table 2.
- Eligible Comparators: articles must provide enough information to differentiate the intervention systems to the comparators. We will classify the simplified farming systems assessed into monoculture and simplified others, and natural habitats into two types of habitats natural habitats, and abandoned farmland (see Table 2). We will not include outcomes from tree plantations for timber or any other commercial purposes.
- Eligible Outcomes: articles must report a quantitative assessment of the effect of interventions and comparators on outcomes for non-domesticated terrestrial biodiversity. Outcomes may include metrics such as: abundance, species richness, activity-density, Chao1 index, colonization percent, Fisher alpha, Jaccard similarity index, Jack-knife species richness, Margalef Index, number of orders, Pielou index, rarefied species richness, Shannon–Wiener index, Shannon evenness index, Shannon index, Simpson index, Simpson’s reciprocal index, Simpson index, species evenness, reproductive success. Included articles must report location data (e.g., geographic coordinates, country), outcome means (or medians), sample sizes, and variance measures (e.g., standard deviation, standard error, interquartile ranges, confidence intervals) for interventions and comparators assessed. The biodiversity outcomes at intervention and control sites must be comparable, i.e., data collected at the same or very similar points in time, using the same or very similar sampling methods.
- Context: we will include only data from primary field-based studies with experimental and observational designs conducted in natural habitats, agricultural fields on farms or outdoor experimental research sites. We will exclude primary studies carried out in laboratories or greenhouses.
7. Step 4: Data Extraction and Coding Strategy
8. Step 5: Observations Validity Assessment
9. Step 6: Identification of Potential Effect Modifiers/Reasons for Heterogeneity
- Crop type
- Population taxonomic group
- Functional group
- Type of intervention practice (i.e., type of diversified system)
- Biodiversity outcome metric
- Fertilizer application
- Pesticide application
- Soil management
- Landscape context (i.e., composition, structure)
10. Step 7: Data Synthesis and Presentation
Author Contributions
Funding
Data Availability Statement
Acknowledgments
Conflicts of Interest
Appendix A

| Section/Sub-Section | Topic | Description | Further Explanation | Checklist/ Meta-Data | Author Response |
|---|---|---|---|---|---|
| Title | Title | The title must indicate that it is a systematic review protocol, and must indicate if it is an update/amendment: e.g., “A systematic review update protocol...”. | The title should normally be the same or very similar to the review question. | Meta-data | The impact of diversified farming practices on terrestrial biodiversity outcomes and agricultural yield worldwide: a systematic review protocol |
| Type of review | Type of review | Select one of the following types of review: systematic review, systematic review update, systematic review amendment, systematic review from a systematic map. | See Collaboration for Environmental Evidence (CEE) Guidance on amendments and updates. | Meta-data | Systematic review |
| Authors contacts | Authors contacts | The full names, institutional addresses, and email addresses for all authors must be provided. | Checklist | Yes | |
| Abstract | Structured summary | Abstract must include the context and purpose of the review, including the review question; methods, how the review will be conducted and the outputs that are expected (specifically mention search strategy, inclusion criteria, critical appraisal, data extraction and synthesis). | Checklist | Yes | |
| Background | Background | Describe the rationale for the review in the context of what is already known. Protocol must indicate why this study was necessary and what it aims to contribute to the field. | A theory of change and/or conceptual model can be presented that links the intervention or exposure to the outcome. | Checklist | Yes |
| Stakeholder engagement | Stakeholder engagement | The planned/actual role of stakeholders throughout the review process (e.g., in the formulation of the question) must be described and explained (using a broad definition of ‘stakeholder’, including e.g., researchers, funders and other decision-makers) | Checklist | Yes | |
| Objective of the review | Objective | Describe the primary question and secondary questions (when applicable). | The primary question is the main question of the review. Secondary questions are usually linked to sources of heterogeneity (effect modifiers). | Checklist | Yes |
| Definitions of the question components | Break down and summarise question key elements e.g., population, intervention(s)/exposure(s), comparator(s), and outcome(s). | Meta-data | Population: Terrestrial biodiversity in agricultural fields worldwide such as Bacteria, Animals, Fungi, Plants, etc. Intervention: Diversified farming practices at temporal and/or spatial scales (e.g., agroforestry, crop rotation, intercropping) Comparator: Simplified farming practices (e.g., monoculture), and/or natural habitats (e.g., natural grasslands, primary or secondary forest) Outcomes: Biodiversity outcome metrics (e.g., Abundance, Species Richness, Shannon’s diversity index, Percentage Fungi Colonisation, etc.) and Agricultural yield (i.e., crop yield in kg/ha). | ||
| Methods | |||||
| Searches | Search strategy | Detail the planned search strategy to be used, including: database names accessed, institutional subscriptions (or date ranges subscribed for each database), search options (e.g., ‘topic words’ or ‘full text’ search facility), efforts to source grey literature, other sources of evidence (e.g., hand searching, calls for evidence/submission of evidence by stakeholders). | Details regarding search strategy testing should be provided. | Checklist | Yes |
| Search string | Provide Boolean-style full search string and state the platform for which the string is formatted (e.g., Web of Science format). | Meta-data | See Table 1 | ||
| Languages—bibliographic databases | List languages to be used in bibliographic database searches. | Meta-data | English | ||
| Languages—grey literature | List languages to be used in organizational websites searches and web-based search engines. | Meta-data | n/a | ||
| Bibliographic databases | Provide the number of bibliographic databases to be searched. | Meta-data | 2 | ||
| Web—based search engines | Provide the number of web—based search engines to be searched. | Meta-data | 0 | ||
| Organisational websites | Provide the number of organisational websites to be searched. | Meta-data | 0 | ||
| Estimating the comprehensiveness of the search | Describe the process by which the comprehensiveness of the search strategy was assessed (i.e., list of benchmark articles). | Checklist | Yes | ||
| Search update | Describe any plans to update the searches during the conduct of the review. | Optional. A search update is good practice if original searches were performed more than two years prior to review completion. | Checklist | Yes | |
| Article screening and study inclusion criteria | Screening strategy | Describe the methodology for screening articles/studies for relevance/eligibility. | Checklist | Yes | |
| Consistency checking | Describe clearly the process for checking consistency of decisions including the levels at which consistency checking will be undertaken and estimated proportion of articles/studies that will be screened and checked for consistency by two or more reviewers (e.g., Titles (10%), abstracts (10%), full text (10%)). | Checklist | Yes | ||
| Inclusion criteria | Describe the inclusion criteria used to assess relevance of identified articles/studies. These must be broken down into the question key elements (e.g., relevant subject(s), intervention(s)/exposure(s), comparator(s), outcomes, study design(s)) and any other restrictions (e.g., date ranges or languages). | Checklist | Yes | ||
| Reasons for exclusion | State that you will provide a list of articles excluded at full text with reasons for exclusion. | Checklist | Yes | ||
| Critical appraisal | Critical appraisal strategy | Describe here the method you propose for critical appraisal of study validity (including assessment of individual studies and the evidence base as a whole). | Checklist | Yes | |
| Critical appraisal used in synthesis | Describe how the information from critical appraisal will be used in synthesis. | Checklist | Yes | ||
| Consistency checking | Describe how repeatability of critical appraisal of study validity will be tested. | Checklist | Yes | ||
| Data extraction | Meta-data extraction and coding strategy | Describe the method for meta-data extraction and coding for studies (potentially providing forms/data sheets (ideally piloted), list if variables to be extracted as meta-data and those that will be coded). | Checklist | Yes | |
| Data extraction strategy | Describe the method for extraction of qualitative and/or quantitative study findings (potentially providing forms/data sheets (ideally piloted)). | Checklist | Yes | ||
| Approaches to missing data | Describe any processes for obtaining and confirming missing or unclear information or data from authors. | Checklist | Yes | ||
| Consistency checking | Describe how repeatability of the meta-data/data extraction process will be tested. | Checklist | Yes | ||
| Potential effect modifiers/reasons for heterogeneity | Potential effect modifiers/reasons for heterogeneity | Provide a list of and justification for the effect modifiers /reasons for heterogeneity that will be considered in the review. Also provide details of how the list was compiled (including consultation of external experts). | The list should not be exhaustive but a short list of those variables thought to be most important and amenable to analysis. | Checklist | Yes |
| Data synthesis and presentation | Type of synthesis | State the type of synthesis conducted as part of the systematic review (narrative only, narrative and quantitative, narrative and qualitative, narrative, qualitative and quantitative, narrative and mixed-methods). | Meta-data | Narrative and quantitative | |
| Narrative synthesis strategy | Describe methods to be used for narratively synthesising the evidence base in the form of descriptive statistics, tables (including any map databases) and figures. | Vote-counting (tallying of studies based on the direction or significance of their findings) must be avoided. Must include a summary of the outputs of critical appraisal of the evidence base as a whole. | Checklist | Yes | |
| Quantitative synthesis strategy | If data are appropriate for quantitative synthesis, describe planned methods for calculating effect sizes, methods for handling complex data, statistical methods for combining data from individual studies, and any planned exploration of heterogeneity (e.g., sensitivity analysis, subgroup analysis and meta-regression). If all studies may not be selected for synthesis explain criteria for selection (e.g., incomplete or missing information). | Compulsory if appropriate for data | Checklist | Yes | |
| Qualitative synthesis strategy | Describe methods to be used for synthesising qualitative data and justify your methodological choice. Describe if and how you plan to analyse subgroups/subsets of data. If all studies may not be selected for synthesis explain criteria for selection (e.g., incomplete or missing information). | Compulsory if appropriate for data | Checklist | Yes | |
| Other synthesis strategies | Describe any other approaches to be used for synthesising data or combining qualitative and quantitative synthesis (e.g., mixed-methods) and justify your methodological choice. | Compulsory if appropriate for data | Checklist | N/A | |
| Assessment of risk of publication bias | Describe planned methods for examining the possible influence of publication bias on the synthesis. | For quantitative syntheses this may be done using diagnostic plots or statistical tests | Checklist | Yes | |
| Knowledge gap identification strategy | Describe the methods to be used to identify and/or prioritise key knowledge gaps (unrepresented or underrepresented subtopics that warrant further primary research). | Optional | Checklist | No | |
| Demonstrating procedural independence | Describe the role of systematic reviewers (who have also authored articles to be considered within the review) in decisions regarding inclusion or critical appraisal of their own work. | Reviewers who have authored articles to be considered within the review should be prevented from unduly influencing inclusion decisions, for example by delegating tasks appropriately. | Checklist | N/A | |
| Declarations | Competing interests | Describe any financial or non-financial competing interests that the review authors may have. | Checklist | N/A |
Appendix B. Search String Development Process
Search Strings Trialled during the Methodology Development Process
- String 1: TITLE-ABS-KEY ((agriculture AND biodiversity AND (Agrobiodiversity OR Agro-biodiversity OR Agroforestry OR Cover crop OR Crop diversity OR Diversification OR Ecological diversity OR Fish diversity OR Intercropping OR Land use and cover diversity OR Landscape complexity OR Livestock diversity OR Mixed cropping OR Mixed farming systems OR Multifunctional agriculture OR Multifunctional farm OR Multifunctional landscape OR Pollinator diversity OR Pollinator richness OR Polyculture OR Seed diversity OR Set-aside OR Soil biodiversity OR Varietal diversity) AND (biodiversity loss OR biodiversity erosion OR species extinction OR species loss OR habitat loss OR decrease in biodiversity OR wild biodiversity OR increase in biodiversity OR biodiversity conservation OR loss of biodiversity OR conservation of biodiversity OR erosion of biodiversity loss of species OR loss of habitat OR conservation of habitat OR conservation of species OR change in biodiversity OR species conservation OR habitat conservation))).
- String 2: TITLE-ABS-KEY (“agricultur*” AND “biodiversity”) AND TITLE-ABS-KEY (“agrobiodivers*” OR “agro-biodivers*” OR “agroforestry” OR “border plant*” OR “cover crop*” OR “crop rotation” OR “crop divers*” OR “fallow” OR “field margin*” OR “grass* strip*” OR “*flower strip*” OR “insectary strip” OR “intercrop*” OR “mixed crop*” OR “plant divers*” OR “polyculture” OR “tree divers*” OR “riparian buffer” OR “woodlot”) AND TITLE-ABS-KEY (“species richness” OR “species abundance” OR “species diversity” OR “functional diversity” OR “index”) AND TITLE-ABS-KEY (“crop yield” OR “crop production”) AND (LIMIT-TO (LANGUAGE, “English”)).
Appendix C. Draft Extraction Sheet
| Data | Code | Description |
|---|---|---|
| Study_ID | ID | Take from the meta-analysis list of articles retrieved spreadsheet. |
| Comparison_ID | Comparison_ID | If a study reports outcomes for multiple intervention (e.g., agroforestry and intercropping), or comparator systems (e.g., simplified agricultural systems and natural), data from all interventions and comparators will be extracted and coded separately. For example, for multiple controls, put C1, C2 … giving a unique number to each unique control. For the intervention practices, put T1, T2, …. using same logic. This will be used to correctly link comparators and intervention combinations within a single study, for analysis. Notes: If the taxa group, biodiversity measure and experiment stage are the same, then use the same C value and T values. Change C and T values if other parameters like location, pesticide use, etc. change. |
| Crop type (main species common to all treatments—common name) OR natural land type | Crop | For cropped land, put main crop species common to all treatments. Use COMMON name. For non-cropped land, put vegetation type e.g., grassland, forest, hedgerow. |
| Crop type (main species common to all treatments—scientific name) | Crop_scientific | For cropped land, put main crop species common to all intervention systems. Use SCIENTIFIC name. |
| All crops common name (separate with comma) | crops_all_common | List all crops in the intervention systems by common name, with crops separated by a comma. |
| All crops scientific name (separate with comma) | crops_all_scientific | List all crops in the intervention systems by scientific name, with crops separated by a comma. |
| Crop scientific name taxonomic level | crops_all_scientific_level | List the taxonomic level of classification separated by a coma. E.g., Species OR Genus; Species OR Genus. |
| Wild taxa common name (separate with comma) | taxa_common | List all (wild) species assessed by common name, with names separated by a comma. |
| Wild’ taxa assessed scientific name at SPECIES level ideally (separate with comma) | taxa_scientific | List all (wild) species assessed as per column by scientific name, separated by a comma. |
| Wild taxa taxonomic level | taxa_scientific_level | List the taxonomic level of classification separated by a coma. E.g., Species OR Genus; Species OR Genus. |
| Cropping system | System_raw | Find match within definitions of terms in drop down list on the KEY tab (a tab providing lists of terms and their definition to help standardise data entry). Use authors’ classification if there’s no perfect fit into one of the options on the dropdown list (and then add to the ‘KEY’ tab any new terms). |
| Cropping system OR natural land description | System_details | Provide the name of the treatment as written in the paper, including abbreviation, and (for cropland) a list of crop and tree species cropped in combination with main crops. Include also an explanation of the cropping or natural system, if helpful for understanding context. |
| Crop species richness | Crop_species_richness | Number of crop species in the cropping system. |
| Crop variety richness | Crop_variety_richness | Number of crop varieties in the cropping system (minimum). |
| Management system | Management_system_raw | Summary term to describe agricultural inputs. |
| Taxa assessed | Taxa | Common or scientific name, order, family, genus of the organisms sampled. |
| Taxa Details | Taxa_details | Life stage, scientific name or any other important detail. |
| Taxa class | Taxa_Class | Taxonomic Class of the assessed biodiversity. |
| Functional group | Functional_group | Functional group classification considering the information provided by the study. See definitions in the “KEY”. |
| Crop name standardised for analysis | Crop_clean | Automatic classification see “Crop name standardised for analysis” column in “KEY”. |
| Cropping system reclassification for analysis | System | Automatic classification see “Reclassification for analysis (detailed—analysis of monoculture versus other)” column in “KEY”. |
| Management system reclassification for analysis | Management_system | Automatic classification see “Management system reclassification for analysis” column in “KEY”. |
| Comparison class for analysis | Comparison_class | Specifies whether it is simplified agriculture (i.e., monocrop or similar), diversified agriculture, or natural land (grassland, forest, marsh), for use in data analysis stage. Automatic classification, see “Reclassification for analysis (detailed—analysis of monoculture versus other)” column in “KEY”. |
| Simplified taxa for analysis | Taxa_group | Automatic classification, see “Simplified taxa for analysis” column in “KEY”. |
| Biodiversity measure | B_measure | Biodiversity outcome. See options in “KEY”. |
| Biodiversity measure # | B_value | Use mean values. If only median is given, enter data setting “median, IQR” in column B_error_measure. |
| Biodiversity variance measure | B_error_measure | Specify the error measure (Median, Interquartile range, standard error, standard deviation, confidence intervals). |
| Biodiversity variance # | B_error_value | Median and/or other variance values. |
| Biodiversity variance IQR lower OR CI lower | B_error_range_l | Put lower Interquartile range or Confidence interval. |
| Biodiversity variance IQR upper or CI upper | B_error_range_u | Put upper Interquartile range or Confidence interval. |
| Biodiversity SD | B_SD | Standard deviation value calculated using the formulas describe in “KEY”. |
| Relation to ground | B_ground | See options in “KEY”. |
| Yield | Yield | Yield or mean yield corresponding to the season(s) for which biodiversity outcome data are recorded. |
| Yield metric | Yield_metric | Kg/ha where possible, otherwise insert the metric used, e.g., g/plant. |
| Yield SD | Yield_SD | Record standard deviation in yield, where provided. If standard errors or other variance values are provided, convert these to standard deviation before entry. |
| Farm size (ha) | Farm_size | |
| Farming context | Farm_context | Any important detail e.g., experimental, commercial. |
| Fertiliser use | Fertiliser | yes/no. |
| Chemical fertiliser use | Fertiliser_chem | yes/no. |
| Pesticide / herbicide use | Pesticide | yes/no. |
| Pesticide quantity (kg/ha) | Pesticide_quantity | |
| Soil management | Soil_management | See options in “KEY”. |
| Time land has been in this state (years, minimum) | Time_state | |
| Length of study (days) | Study_length | |
| Landscape Context | Landscape_context | Any important detail (e.g., % agricultural land use). |
| Sampling unit | Sampling_unit | Sampling details (e.g., leaf, 10x10m quadrant, field). |
| Number of samples | N_samples | Number of distinct sampling units where biodiversity was sampled, e.g., ants on 4 leaves on 5 trees at each of 10 fields means sample size = 4 × 5 × 10 = 200. |
| Location | Location | Place, City. |
| Country | Country | |
| Lat | Lat | If there is multiple Lat/Longs for the same intervention, comparator, taxa, functional group or biodiversity measure, and these points are in the same region, then we will take the middle point. |
| Long | Long | If there is multiple Lat/Longs for the same intervention, comparator, taxa, functional group or biodiversity measure, and these points are in the same region, then we will take the middle point. |
| Notes | Notes | “Raw Data”: copy pasted values from paper “Estimated”: calculated from graph Put which table/ figure the data is taken from. |
| Stage of measurement | Experiment_stage | Use to record a unique ID for each comparator-intervention pairing that needs to be maintained in analysis. For example: when biodiversity outcomes are reported for multiple taxa groups (e.g., ants, birds, and bees), functional groups (e.g., pests and decomposers), sample methods (e.g., vacuums and pitfall traps), and/or locations, we will enter each one separately in the database, and code with the same number the intervention and comparator outcomes of the same taxa group (e.g., intervention ants = code: 1; comparator ants = code: 1; intervention birds = code: 2; comparator birds = code:2; intervention bees = code: 3; comparator bees = code:3), functional group (e.g., intervention pest = code: 1; comparator pest = code: 1; intervention decomposers = code: 2; comparator decomposers = code: 2), sample methods (e.g., intervention vacuums = code: 1; comparator vacuums = code: 1; intervention pitfall traps = code: 2; comparator pitfall traps = code: 2); and/or location (e.g., intervention in location A = code: 1; comparator in location A = code: 1; intervention in location B = code: 2; comparator in location A = code: 1). |
| Data entry person | Data_entry | Reviewer who recorded the data. |
| Data validation person | Data_validation | Reviewer who checked the data. |
| Ecological process? | Process | Usually taken from abstract and/or discussion that summarizes main results & ecological explanation behind. |
| Crop FAO group | Crop_FAO | |
| Crop duration type | Crop_ann_pen | annual/perennial. |
| Crop woodiness | Crop_woodiness | |
| simplified location | Location_simplified |
References
- Ramankutty, N.; Evan, A.T.; Monfreda, C.; Foley, J.A. Farming the planet: 1. Geographic distribution of global agricultural lands in the year 2000. Glob. Biogeochem. Cycles 2008, 22, 1–19. [Google Scholar] [CrossRef]
- Altieri, M. The ecological role of biodiversity in agroecosystems. Agric. Ecosyst. Environ. 1999, 74, 19–31. [Google Scholar] [CrossRef] [Green Version]
- Tscharntke, T.; Klein, A.; Kruess, A.; Steffan-Dewenter, I.; Thies, C. Landscape perspectives on agricultural intensification and biodiversity—Ecosystem service management. Ecol. Lett. 2005, 8, 857–874. [Google Scholar] [CrossRef]
- Alexandratos, N.; Bruinsma, J. World Agriculture towards 2030/2050: The 2012 Revision; FAO: Rome, Italy, 2012; p. 154. [Google Scholar]
- Maxwell, S.; Fuller, R.; Brooks, T.; Watson, J. Biodiversity: The ravages of guns, nets and bulldozers. Nature 2016, 536, 143–145. [Google Scholar] [CrossRef]
- Díaz, S.; Settele, J.; Brondízio, E.S.; Ngo, H.T.; Agard, J.; Arneth, A.; Balvanera, P.; Brauman, K.A.; Butchart, S.H.M.; Chan, K.M.A.; et al. Pervasive human-driven decline of life on Earth points to the need for transformative change. Science (80) 2019, 366, eaax3100. [Google Scholar] [CrossRef] [PubMed] [Green Version]
- Tilman, D.; Balzer, C.; Hill, J.; Befort, B.L. Global food demand and the sustainable intensification of agriculture. Proc. Natl. Acad. Sci. USA 2011, 108, 20260–20264. [Google Scholar] [CrossRef] [Green Version]
- Kehoe, L.; Romero-muñoz, A.; Polaina, E.; Estes, L.; Kreft, H.; Kuemmerle, T. Biodiversity at risk under future cropland expansion and intensification. Nat. Ecol. Evol. 2017, 1, 1129–1135. [Google Scholar] [CrossRef] [PubMed]
- FAO; IFAD; UNICEF; WFP; WHO. The State of Food Security and Nutrition in the World 2019. Safeguarding against Economic Slowdowns and Downturns; FAO: Rome, Italy, 2019; p. 239. [Google Scholar]
- Maggio, G.; Sitko, N.; Ignaciuk, A. Cropping System Diversification in Eastern and Southern Africa: Identifying Policy Options to Enhance Productivity and Build Resilience; FAO Agricultural Development Economics Working Paper 18-05; FAO: Rome, Italy, 2018; ISBN 9789251309810. [Google Scholar]
- Kremen, C.; Miles, A. Ecosystem services in biologically diversified versus conventional farming systems: Benefits, externalities, and trade-offs. Ecol. Soc. 2012, 17, 40. [Google Scholar] [CrossRef]
- Kremen, C.; Williams, N.; Thorp, R. Crop pollination from native bees at risk from agricultural intensification. Proc. Natl. Acad. Sci. USA 2002, 99, 16812–16816. [Google Scholar] [CrossRef] [Green Version]
- Kremen, C.; Iles, A.; Bacon, C. Diversified farming systems: An agroecological, systems-based alternative to modern industrial agriculture. Ecol. Soc. 2012, 17, 44. [Google Scholar] [CrossRef]
- Rosa-Schleich, J.; Loos, J.; Mußhoff, O.; Tscharntke, T. Ecological-economic trade-offs of Diversified Farming Systems—A review. Ecol. Econ. 2019, 160, 251–263. [Google Scholar] [CrossRef]
- Bagayoko, M.; Buerkert, A.; Lung, G.; Bationo, A.; Römheld, V. Cereal/legume rotation effects on cereal growth in Sudano-Sahelian West Africa: Soil mineral nitrogen, mycorrhizae and nematodes. Plant Soil 2000, 218, 103–116. [Google Scholar] [CrossRef] [Green Version]
- Woźniaka, A.; Kawecka-Radomska, M. Crop management effect on chemical and biological properties of soil. Int. J. Plant Prod. 2016, 10, 1735–8043. [Google Scholar]
- Barrios, E.; Valencia, V.; Jonsson, M.; Brauman, A.; Hairiah, K.; Mortimer, P.; Okubo, S. Contribution of trees to the conservation of biodiversity and ecosystem services in agricultural landscapes. Int. J. Biodivers. Sci. Ecosyst. Serv. Manag. 2018, 14, 1–16. [Google Scholar] [CrossRef] [Green Version]
- Gontijo, L. Engineering natural enemy shelters to enhance conservation biological control in field crops. Biol. Control 2019, 130, 155–163. [Google Scholar] [CrossRef]
- Snyder, W. Give predators a complement: Conserving natural enemy biodiversity to improve biocontrol. Biol. Control 2019, 135, 73–82. [Google Scholar] [CrossRef]
- Karp, D.; Mendenhall, C.; Sandí, R.; Chaumont, N.; Ehrlich, P.; Hadly, E.; Daily, G. Forest bolsters bird abundance, pest control and coffee yield. Ecol. Lett. 2013, 16, 1339–1347. [Google Scholar] [CrossRef]
- Kennedy, C.; Lonsdorf, E.; Neel, M.; Williams, N.; Ricketts, T.; Winfree, R.; Bommarco, R.; Brittain, C.; Burley, A.; Cariveau, D.; et al. A global quantitative synthesis of local and landscape effects on wild bee pollinators in agroecosystems. Ecol. Lett. 2013, 16, 584–599. [Google Scholar] [CrossRef]
- Burel, F.; Butet, A.; Delettre, Y.R.; De La Peña, N.M. Differential response of selected taxa to landscape context and agricultural intensification. Landsc. Urban Plan. 2004, 67, 195–204. [Google Scholar] [CrossRef]
- Degani, E.; Leigh, S.G.; Barber, H.M.; Jones, H.E.; Lukac, M.; Sutton, P.; Potts, S.G. Crop rotations in a climate change scenario: Short-term effects of crop diversity on resilience and ecosystem service provision under drought. Agric. Ecosyst. Environ. 2019, 285, 106625. [Google Scholar] [CrossRef]
- Stomph, T.J.; Dordas, C.; Baranger, A.; de Rijk, J.; Dong, B.; Evers, J.; Gu, C.; Li, L.; Simon, J.; Jensen, E.S.; et al. Designing Intercrops for High Yield, Yield Stability and Efficient Use of Resources: Are There Principles? 1st ed.; Elsevier Inc.: Amsterdam, The Netherlands, 2020; Volume 160, ISBN 9780128207635. [Google Scholar]
- Himmelstein, J.; Ares, A.; Gallagher, D.; Myers, J. A meta-analysis of intercropping in Africa: Impacts on crop yield, farmer income, and integrated pest management effects. Int. J. Agric. Sustain. 2017, 15, 1–10. [Google Scholar] [CrossRef]
- Lichtenberg, E.; Kennedy, C.; Kremen, C.; Batáry, P.; Berendse, F.; Bommarco, R.; Bosque-Pérez, N.; Carvalheiro, L.; Snyder, W.; Williams, N.; et al. A global synthesis of the effects of diversified farming systems on arthropod diversity within fields and across agricultural landscapes. Glob. Chang. Biol. 2017, 23, 4946–4957. [Google Scholar] [CrossRef] [PubMed] [Green Version]
- Beillouin, D.; Ben-Ari, T.; Makowski, D. A dataset of meta-analyses on crop diversification at the global scale. Data Br. 2019, 24, 103898. [Google Scholar] [CrossRef] [PubMed]
- Beillouin, D.; Ben-Ari, T.; Makowski, D. Evidence map of crop diversification strategies at the global scale. Environ. Res. Lett. 2019, 14, 123001. [Google Scholar] [CrossRef]
- Venter, Z.S.; Jacobs, K.; Hawkins, H.J. The impact of crop rotation on soil microbial diversity: A meta-analysis. Pedobiologia (Jena) 2016, 59, 215–223. [Google Scholar] [CrossRef]
- Letourneau, D.; Armbrecht, I.; Rivera, B.; Lerma, J.; Carmona, E.; Daza, M.; Escobar, S.; Galindo, V.; GutiéRrez, C.; López, S.; et al. Does plant diversity benefit agroecosystems? A synthetic review. Ecol. Appl. 2011, 21, 9–21. [Google Scholar] [CrossRef] [PubMed]
- Shackelford, G.; Steward, P.; Benton, T.; Kunin, W.; Potts, S.; Biesmeijer, J.; Sait, S. Comparison of pollinators and natural enemies: A meta-analysis of landscape and local effects on abundance and richness in crops. Biol. Rev. 2013, 88, 1002–1021. [Google Scholar] [CrossRef]
- Barral, M.P.; Rey Benayas, J.M.; Meli, P.; Maceira, N.O. Quantifying the impacts of ecological restoration on biodiversity and ecosystem services in agroecosystems: A global meta-analysis. Agric. Ecosyst. Environ. 2015, 202, 223–231. [Google Scholar] [CrossRef] [Green Version]
- Blaser, W.J.; Oppong, J.; Hart, S.P.; Landolt, J.; Yeboah, E.; Six, J. Climate-smart sustainable agriculture in low-to-intermediate shade agroforests. Nat. Sustain. 2018, 1, 234–239. [Google Scholar] [CrossRef]
- Ponisio, L.C.; M’gonigle, L.K.; Mace, K.C.; Palomino, J.; De Valpine, P.; Kremen, C. Diversification practices reduce organic to conventional yield gap. Proc. R. Soc. B Biol. Sci. 2015, 282. [Google Scholar] [CrossRef] [Green Version]
- Dainese, M.; Martin, E.A.; Aizen, M.A.; Albrecht, M.; Bartomeus, I.; Bommarco, R.; Carvalheiro, L.G.; Chaplin-kramer, R.; Gagic, V.; Garibaldi, L.A.; et al. A global synthesis reveals biodiversity-mediated benefits for crop production. Sci. Adv. 2019, 5, eaax0121. [Google Scholar] [CrossRef] [Green Version]
- Tamburini, G.; Bommarco, R.; Wanger, T.C.; Kremen, C.; van der Heijden, M.G.A.; Liebman, M.; Hallin, S. Agricultural diversification promotes multiple ecosystem services without compromising yield. Sci. Adv. 2020, 6, 1–8. [Google Scholar] [CrossRef] [PubMed]
- Gonthier, D.; Ennis, K.; Farinas, S.; Hsieh, H.; Iverson, A.; Batáry, P.; Rudolphi, J.; Tscharntke, T.; Cardinale, B.; Perfecto, I. Biodiversity conservation in agriculture requires a multi-scale approach. Proc. R. Soc. B Biol. Sci. 2014, 281, 9–14. [Google Scholar] [CrossRef] [PubMed] [Green Version]
- Tuck, S.; Winqvist, C.; Mota, F.; Ahnström, J.; Turnbull, L.; Bengtsson, J. Land-use intensity and the effects of organic farming on biodiversity: A hierarchical meta-analysis. J. Appl. Ecol. 2014, 51, 746–755. [Google Scholar] [CrossRef] [PubMed]
- Haddaway, N.R.; Macura, B.; Whaley, P.; Pullin, A. ROSES for Systematic Review Protocols. Version 1.0. 2017. Available online: https://www.roses-reporting.com/systematic-review-protocols (accessed on 11 January 2021).
- Higgins, R.; Douglas, A.; Hahmann, A.; Berbery, E.; Gutzler, D.; Shuttleworth, J.; Stensrud, D.; Amador, J.; Carbone, R.; Cortez, M.; et al. Cochrane Handbook for Systematic Reviews of Interventions Version 6.1 (Updated September 2020); Cochrane: London, UK, 2020. [Google Scholar]
- Mengist, W.; Soromessa, T.; Legese, G. Method for conducting systematic literature review and meta-analysis for environmental science research. MethodsX 2020, 7, 100777. [Google Scholar] [CrossRef] [PubMed]
- R Core Team. R: A Language and Environment for Statistical Computing; R Foundation for Statistical Computing: Vienna, Austria, 2020. [Google Scholar]
- Viechtbauer, W. Conducting meta-analyses in R with the metafor. J. Stat. Softw. 2010, 36, 1–48. [Google Scholar] [CrossRef] [Green Version]
- Borenstein, M.; Hedges, L.; Higgins, J.; Rothstein, H. Introduction to Meta-Analysis; John Wiley & Sons, Ltd.: Hoboken, NJ, USA, 2009; p. 452. [Google Scholar]
- Nakagawa, S.; Santos, E. Methodological issues and advances in biological meta-analysis. Evol. Ecol. 2012, 26, 1253–1274. [Google Scholar] [CrossRef]
- Aguinis, H.; Gottfredson, R.K.; Joo, H. Best-Practice Recommendations for Defining, Identifying, and Handling Outliers. Organ. Res. Methods 2013, 16, 270–301. [Google Scholar] [CrossRef]

| Repository | Search String |
|---|---|
| Scopus | TITLE-ABS-KEY (“agricultur*” AND “biodiversity”) AND TITLE-ABS-KEY (“agro?ecology” OR “agro?biodivers*” OR “agroforestry” OR “border plant*” OR “riparian buffer” OR “woodlot” OR “hedgerow” OR “cover crop*” OR “crop rotation” OR “crop divers*” OR “inter?crop*” OR “mixed crop*” OR “cultivar mixture” OR “plant divers*” OR “polyculture” OR “tree divers*” OR “variet* diversity” OR “fallow” OR “field margin*” OR “grass strip*” OR “*flower strip*” OR “insect* strip” OR “conservation strip” OR “vegetation strip” OR “catch crop” OR “inter?crop*” OR “crop variety” OR “crop sequenc*” OR “mixed farming” OR “land sparing” OR “landscape heterogeneity” OR “heterogeneous landscape” OR “landscape diversi*” OR “divers* landscape” OR “homogeneous landscape” OR “landscape homogeneity” OR “landscape complexity” OR “simplif* landscape” OR “complex landscape” OR “multi?function* landscape” OR “integrated crop-livestock” OR “integrated crop-forest” OR “land sharing”) AND TITLE-ABS-KEY (“ richness” OR “ abundance” OR “species diversity” OR “functional diversity” OR “index”) AND TITLE-ABS-KEY (“crop yield” OR “crop production”) AND (LIMIT-TO (LANGUAGE, “English”)). |
| Web of Science | Web of Science search string: (TS= (“agricultur*” AND “biodiversity”) AND TS= (“agro?ecology” OR “agro?biodivers*” OR “agroforestry” OR “border plant*” OR “riparian buffer” OR “woodlot” OR “hedgerow” OR “cover crop*” OR “crop rotation” OR “crop divers*” OR “inter?crop*” OR “mixed crop*” OR “cultivar mixture” OR “plant divers*” OR “polyculture” OR “tree divers*” OR “variet* diversity” OR “fallow” OR “field margin*” OR “grass strip*” OR “*flower strip*” OR “insect* strip” OR “conservation strip” OR “vegetation strip” OR “catch crop” OR “inter?crop*”OR “crop variety” OR “crop sequenc*” OR “mixed farming” OR “land sparing” OR “landscape heterogeneity” OR “heterogeneous landscape” OR “landscape diversi*” OR “divers* landscape” OR “homogeneous landscape” OR “landscape homogeneity” OR “landscape complexity” OR “simplif* landscape” OR “complex landscape” OR “multi?function* landscape” OR “integrated crop-livestock” OR “integrated crop-forest” OR “land sharing”) AND TS= (“richness” OR “abundance” OR “species diversity” OR “functional diversity” OR “index”) AND TS= (“crop yield” OR “crop production”)) AND LANGUAGE: (English) |
| System | Description | Type |
|---|---|---|
| Agroforestry | Following Beillouin et al. [27], agroforestry satisfies three conditions: (i) at least two plant species interact biologically, (ii) at least one of the plant species is a woody perennial, and (iii) at least one of the plant species is managed for forage, annual or perennial crop production. Includes alley cropping with trees, shade monoculture, silvo-pasture. | Intervention |
| Cover crops | Following Beillouin et al. [27], plant grown in addition to the main crop for agronomic purposes, e.g., to manage soil erosion, pests, soil fertility or soil quality. The associated plant could be harvested or not, perennial or not. | Intervention |
| Crop rotation | Following Beillouin et al. [27], recurrent succession of a set of selected crops grown on a particular agricultural land each season or each year according to a definite plan. | Intervention |
| Diversified other | Diversity-based practices not included in other categories. Includes combinations of single practices, such as crop rotation and cover crops used in unison, and integrated crop-livestock systems. | Intervention |
| Embedded natural | Land on-farm not used for farming and where non-crop plants are sown or regenerated naturally to benefit biodiversity or for other environmental purposes. Includes fallow (regular, >6 months), field margins, hedgerows, riparian buffers, set aside, vegetation strips, flower strips. | Intervention |
| Intercropping | Adapted from Beillouin et al. [27], the simultaneous cultivation in the same field of two or more crop species, varieties, or cultivars, for all or part of their growth cycle. All crops are harvested. | Intervention |
| Monoculture | The cultivation of a single crop species or variety in the same plot at the same time or continually in different seasons. | Control |
| Simplified other | Relatively low diversity (usually only 2 species) agroforestry, cover crop, crop rotation or intercropping, for studies comparing these against the same cropping system planted with relatively high diversity (usually 3 or more species). Also used for cropped areas with no embedded natural features (e.g., hedgerows, vegetation strips) when compared against cropped areas with these embedded natural natures. | Control |
| Abandoned farmland | Abandoned cropland left to rewild. | Control |
| Natural | Forests, shrubland or grassland that is not commercially harvested and which, if managed, is managed for conservation purposes. Can include primary or secondary vegetation growth. Includes fynbos, natural or semi-natural grassland, remnant vegetation, secondary successional habitat. | Control |
| Assessment Criteria | Low Risk of Bias | High Risk of Bias | Unclear Risk of Bias | Type of Bias Addressed |
|---|---|---|---|---|
| 1. Intervention and comparator sample size | Total sample size >= 5 | Total sample size < 5 | - | Selection bias |
| 2. Are the interventions and comparators matching at the same site (i.e., same climate conditions, weather events, soil type) | Yes | No | Insufficient data to permit assessment of ‘Low risk’ or ‘High risk’ bias | Selection bias |
| 3. Time the interventions and comparators plots have been in this state | >=1 year | <1 year | Insufficient data to permit assessment of ‘Low risk’ or ‘High risk’ bias | Selection bias |
| 4. Can the intervention clearly be classified? | Yes. The intervention can be classified as one of the diversified systems specified in Table 2 | No. The intervention was described by the article as “polyculture”. | - | Selection reporting, performance bias, |
Publisher’s Note: MDPI stays neutral with regard to jurisdictional claims in published maps and institutional affiliations. |
© 2021 by the authors. Licensee MDPI, Basel, Switzerland. This article is an open access article distributed under the terms and conditions of the Creative Commons Attribution (CC BY) license (http://creativecommons.org/licenses/by/4.0/).
Share and Cite
Sánchez, A.C.; Estrada-Carmona, N.; Juventia, S.D.; Jones, S.K. The Impact of Diversified Farming Practices on Terrestrial Biodiversity Outcomes and Agricultural Yield Worldwide: A Systematic Review Protocol. Methods Protoc. 2021, 4, 8. https://0-doi-org.brum.beds.ac.uk/10.3390/mps4010008
Sánchez AC, Estrada-Carmona N, Juventia SD, Jones SK. The Impact of Diversified Farming Practices on Terrestrial Biodiversity Outcomes and Agricultural Yield Worldwide: A Systematic Review Protocol. Methods and Protocols. 2021; 4(1):8. https://0-doi-org.brum.beds.ac.uk/10.3390/mps4010008
Chicago/Turabian StyleSánchez, Andrea C., Natalia Estrada-Carmona, Stella D. Juventia, and Sarah K. Jones. 2021. "The Impact of Diversified Farming Practices on Terrestrial Biodiversity Outcomes and Agricultural Yield Worldwide: A Systematic Review Protocol" Methods and Protocols 4, no. 1: 8. https://0-doi-org.brum.beds.ac.uk/10.3390/mps4010008