Article

Chestnut Shell Extract Modulates Immune Parameters in the Rainbow Trout Oncorhynchus mykiss

1
Department of Sciences and Technologies, University of Sannio, Via Port’Arsa, 11, 82100 Benevento, Italy
2
Institute of Food Sciences—National Research Council (ISA-CNR), Via Roma 64, 83100 Avellino, Italy
3
Faculty of Fisheries, Department of Aquaculture, Cukurova University, Adana 01330, Turkey
*
Author to whom correspondence should be addressed.
Submission received: 25 January 2019 / Revised: 6 March 2019 / Accepted: 6 March 2019 / Published: 12 March 2019

Abstract

:
In this study, chestnut (Castanea sativa) shell was extracted with different solvents, and immunomodulatory activity was investigated in an in vitro model system using blood and intestinal leukocytes of Oncorhynchus mykiss. Gallic acid (GA) was used as a standard. Chestnut shell extract (CSE) and GA readily entered both blood and intestinal leukocytes. Superoxide anion production and phagocytosis were decreased by low doses of CSE and increased with high doses. CSE and GA differently regulated cytokine expression in blood and intestinal leukocytes. High doses of CSE upregulated IL-1β, TNF-α, and IL-10 in intestinal leukocytes and IL-10 in blood leukocytes. Low doses of CSE upregulated IL-1β and TNF-α in blood leukocytes. GA appeared to be effective only in blood leukocytes. The effects of CSE on pro- and anti-inflammatory cytokines seemed to suggest an alert effect of the immune defense system against a possible infectious agent. The less evident effect of GA in comparison to CSE could have been attributable to the synergistic and/or additive effects of polyphenols in the latter. The immune-stimulating activity of CSE reported here could be useful for future practical applications in fish health.

1. Introduction

Nowadays there is a growing interest in the use of plant extracts due to the limitation of chemical products in aquaculture [1]. The European Commission, at the beginning of 2006, regulated the use of antibiotics in feed for farmed animals by prohibiting their use or limiting their quantities [2]. This has stimulated the interest of research toward alternative solutions, such as bioactive molecules of plant origin, to be used as feed additives. Feed additives as health promoters are an important component of any strategy to prevent diseases in aquaculture. Although aquaculture is a highly productive sector, with an average annual growth of 6.2% [3], it presents a high business risk, which puts global production at risk. Among the obvious causes are numerous infectious diseases due to the intensive practices necessary to meet increasing market demand. The high density of fish required by these intensive practices negatively affects the state of health of the species, and the control of potentially lethal diseases can be difficult [4]. An effective way to avoid such drawbacks is to resort to vaccination, although vaccines are expensive and effective only against specific pathogens [5]. The development of fish vaccines has been strongly limited by poor knowledge of fish immunology, unlicensed vaccines, and stressful and not cost-effective administration: In fact, fish need a larger antigen dose compared to terrestrial animals [6]. Thus, strengthening the defense mechanism of fish through the preventive administration of immunostimulants is considered a promising alternative to chemotherapy and vaccines due to the broad spectrum activity, cost-effectiveness, and eco-friendliness of such disease preventive measures [7]. The use of natural plant compounds, such as polyphenols, as potential alternatives to improve the health state of farmed animals is certainly an idea of great public and private interest, but it is limited by a high variability in composition due to the difficulty of obtaining a standardized final product and the cost of raw materials and/or processes of production. A financially convenient and ecologically interesting solution is represented by the byproducts of the agro-food chain. Italy produces, on average, 50,000 tons/year of chestnuts (Castanea sativa), which makes it the leading producer country in Europe [8]. Chestnut processing produces a quite abundant amount of waste, mainly represented by hedgehogs and shells. Chestnut shells are lignocellulosic biomasses mainly composed of cellulose, hemicelluloses, and lignin, along with a certain amount of phenolic compounds with antioxidant properties [9,10]. The extraction of phenolic antioxidant compounds from plant materials is habitually carried out with organic solvents, among which water has been lately largely employed due to its ecofriendly nature and low cost [11]. The extractable material is composed of tannins and phenolic compounds, with small amount of sugars [9]. Among simple phenolics, gallic and ellagic acid are the most represented and are reported at high concentrations [12]. Several studies have shown that, thanks to antioxidant action, phenolic compounds in the chestnut act positively on health, leading to a decrease in the risk of cardiovascular diseases and cancer and showing anti-inflammatory properties and immune stimulation activity [13]. Moreover, tissues of the chestnut have been found to contain compounds with inhibitory effects on bacteria [14,15]. In recent decades, interest in the evaluation of the therapeutic effects of natural extracts has increased significantly due to the antimicrobial, antiviral, antifungal, and antioxidant properties that make them a good alternative to conventional antimicrobial agents not only for the treatment of major human diseases, but also for the prevention and treatment of diseases affecting aquatic species that represent a serious scourge between animals and invertebrates [16,17,18]. The health-promoting effects of natural extracts seem to be related to complementary and overlapping effects of the mixture of bioactive molecules, more efficacious than single components [19]. The extraction and exploitation of bioactive molecules would reduce the environmental impact of byproducts generated along the production chain, with consequent economic benefits. Among the possible uses of extracts obtained from the byproducts of chestnut processing, it is worth mentioning supplements in animal nutrition [20]. The use of plant extracts, however, has some limitations related to their different chemical nature and consequent different cell uptake capability and intracellular effects [21]. Moreover, the vast array of bioactive molecules present in nature that can find a useful application in aquaculture makes testing trials uneconomical due to the necessity of employing a large number of animals. Thus, the use of in vitro tests may overcome these drawbacks, keeping the number of animals employed low.
In this study, chestnut shell was extracted with different solvents and characterized by high-performance liquid chromatography (HPLC) and attenuated total reflectance-Fourier transform infrared spectroscopy (ATR-FTIR). An in vitro system using non-adherent leukocytes of the rainbow trout Oncorhynchus mykiss was employed. The polyphenol content of non-adherent leukocytes was evaluated, and the possible effects on free radical production, phagocytosis, and cytokine IL-1β and TNF-α (proinflammatory) and IL-10 (anti-inflammatory) expression were evaluated.

2. Results

2.1. Antioxidant Activity, Total Polyphenol Content, and Composition of Chestnut Shell Extracts

Both composition and concentration of phenolic compounds, determined by HPLC in the chestnut shell extracts, are reported in Table 1. The highest concentration of phenolic compounds was attributed to gallic and ellagic acids. Low concentrations of syringic acid, rutin, and quercetin were detected. A typical HPLC profile of chestnut shell polyphenols has already been reported in Sorice et al. [22].
The antioxidant activity of the chestnut shell extracts (CSEs) was determined by the 2,2-diphenyl-1-picrylhydrazyl (DPPH) spectrophotometric method and then compared to gallic acid (GA). The total contents of polyphenols expressed in g/kg of the extract and the antioxidant activity (% inhibition of DPPH) of the four extracts obtained with different extraction procedures, with GA used as a reference, are reported in Table 2.
A possible correlation between antioxidant activity and total polyphenol content was investigated. A linear regression (data not shown) with a correlation coefficient of R2 = 0.9629 showed good proportionality between total polyphenol content and antioxidant activity. The most similar extracts were ethanol 100% at 90 °C, ethanol 100% at room temperature (RT), and ethanol 70% - water 30% at RT. The extract with the lowest total polyphenols and antioxidant activity was water 100% at 75 °C.

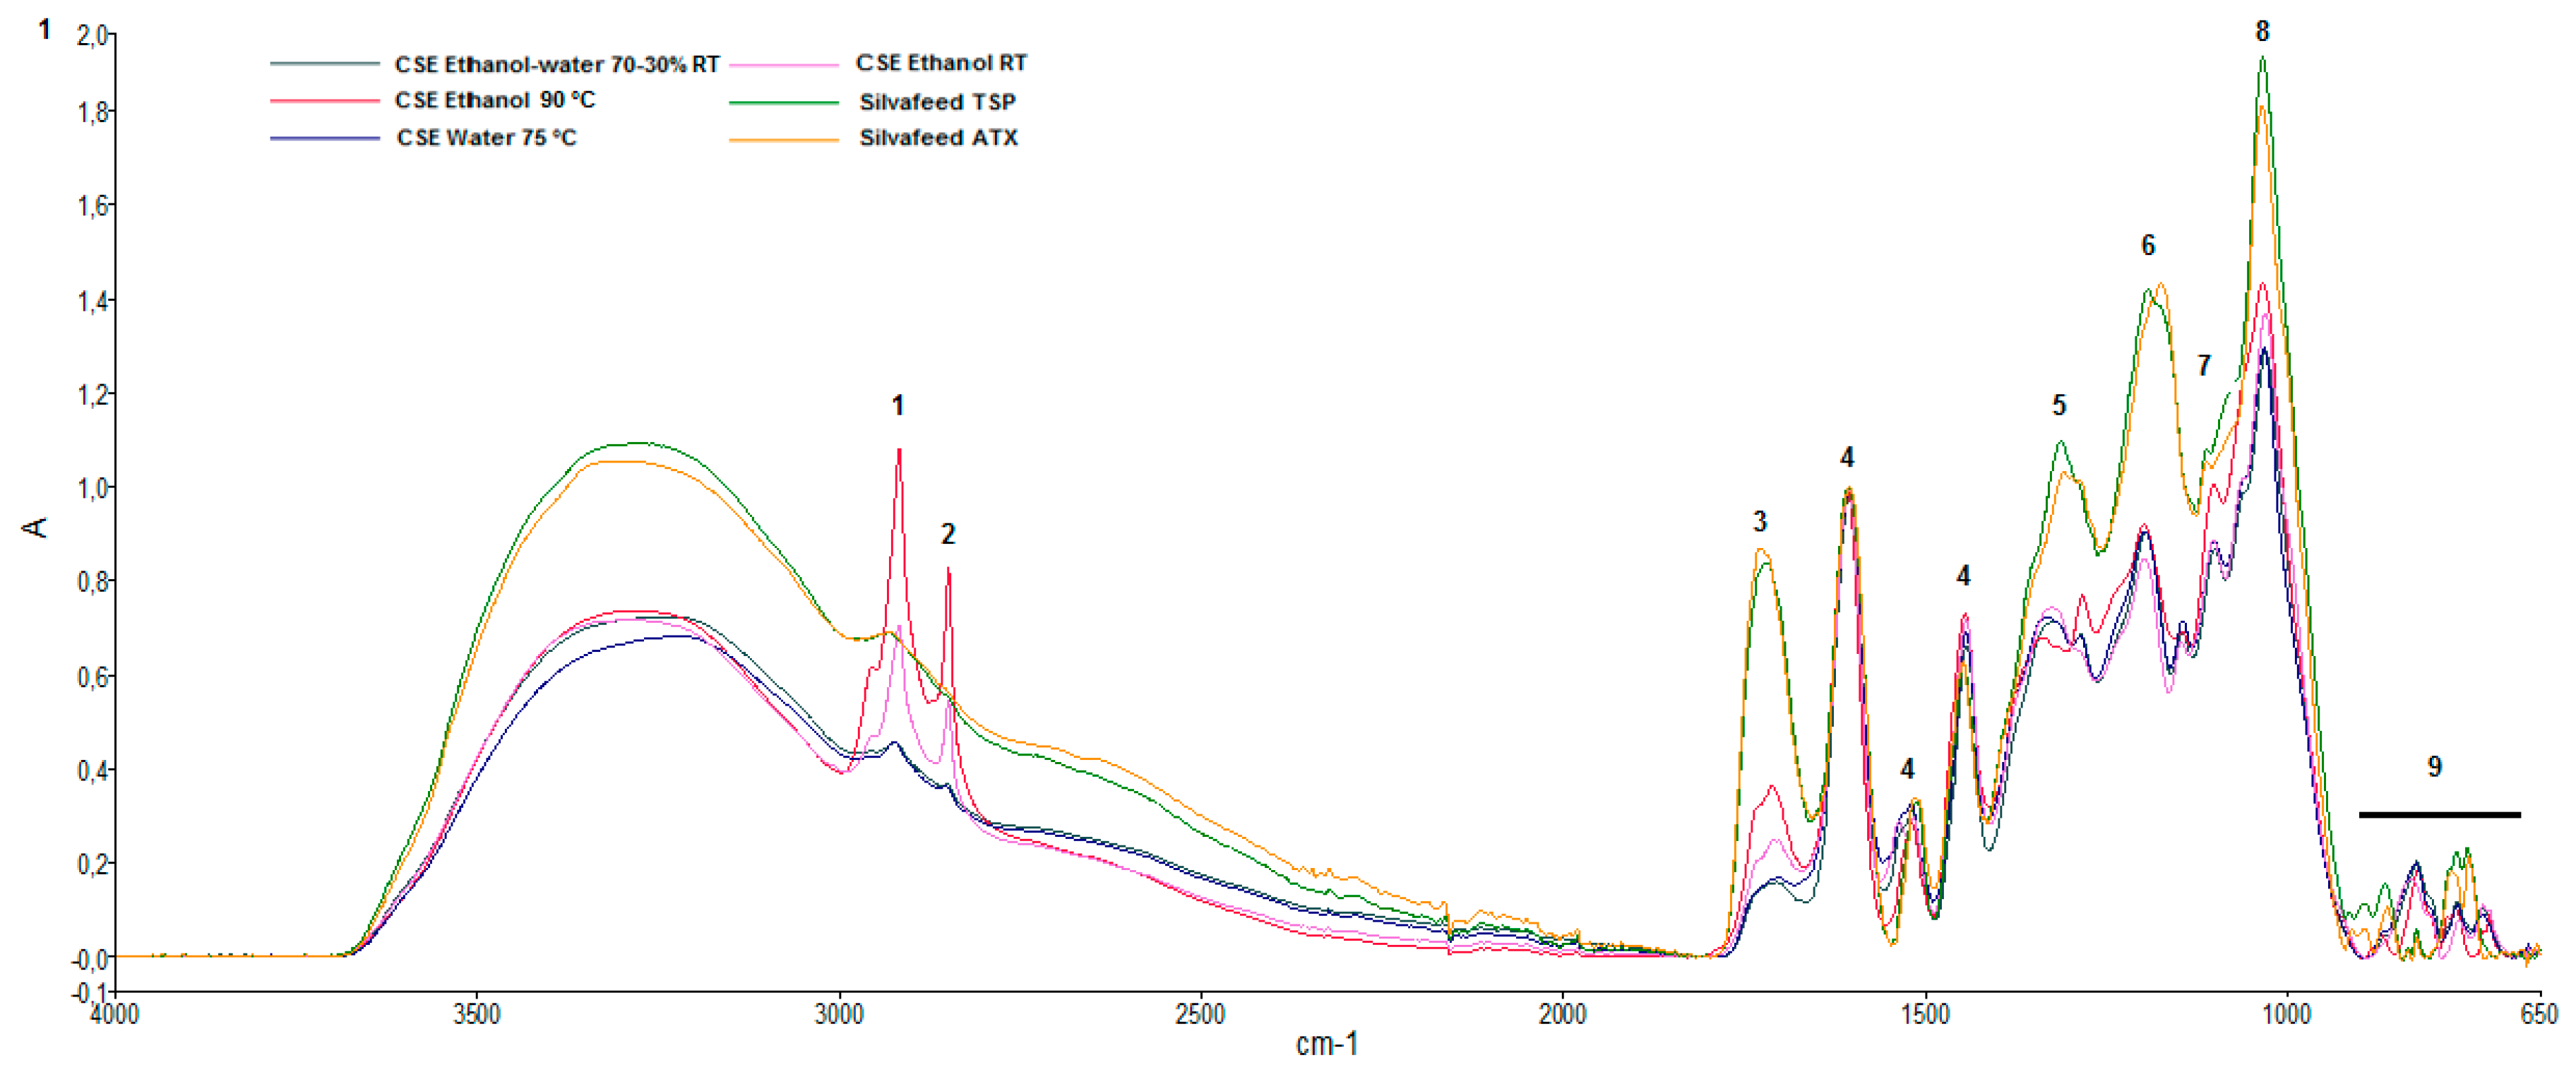
2.2. Attenuated Total Reflectance-Fourier Transform Infrared (ATR-FTIR) Characterization of Chestnut Extracts

Figure 1 shows the ATR-FTIR spectra obtained from CSEs and two commercial samples of chestnut wood (Silvafeed® TSP and ATX). Table 3 shows the frequency assignments of the functional groups. Peaks identification and their assignment were based on literature data [23,24,25]. The broad spectrum of absorption at 3300–2500 cm−1 was due to the OH groups of the carboxylic acids. The peaks at 2918 and 2850 cm−1 were due to CH2 stretching of the aliphatic hydrocarbons. In the region between 1727 and 1700 cm−1, the C–O stretching of esters of hydrolyzable tannins, especially derivatives of gallic acid, can be seen. The intense band at 1604–1607 cm−1, and the less intense bands at 1550–1520 and 1443–1447 cm−1, were due to the stretching of the bond of C=C of the aromatic rings. The stretching of the C–O bond is visible at 1342–1308 cm−1. Aliphatic C=O stretching can be seen in the regions 1174–1198 cm−1 and 1029–1035 cm−1. From 913 to 666 cm−1, there is a region of C–H deformation out of the plane, predominantly with signals of low intensities.

2.3. Isolation of Non-Adherent Leukocytes from Blood and Intestine
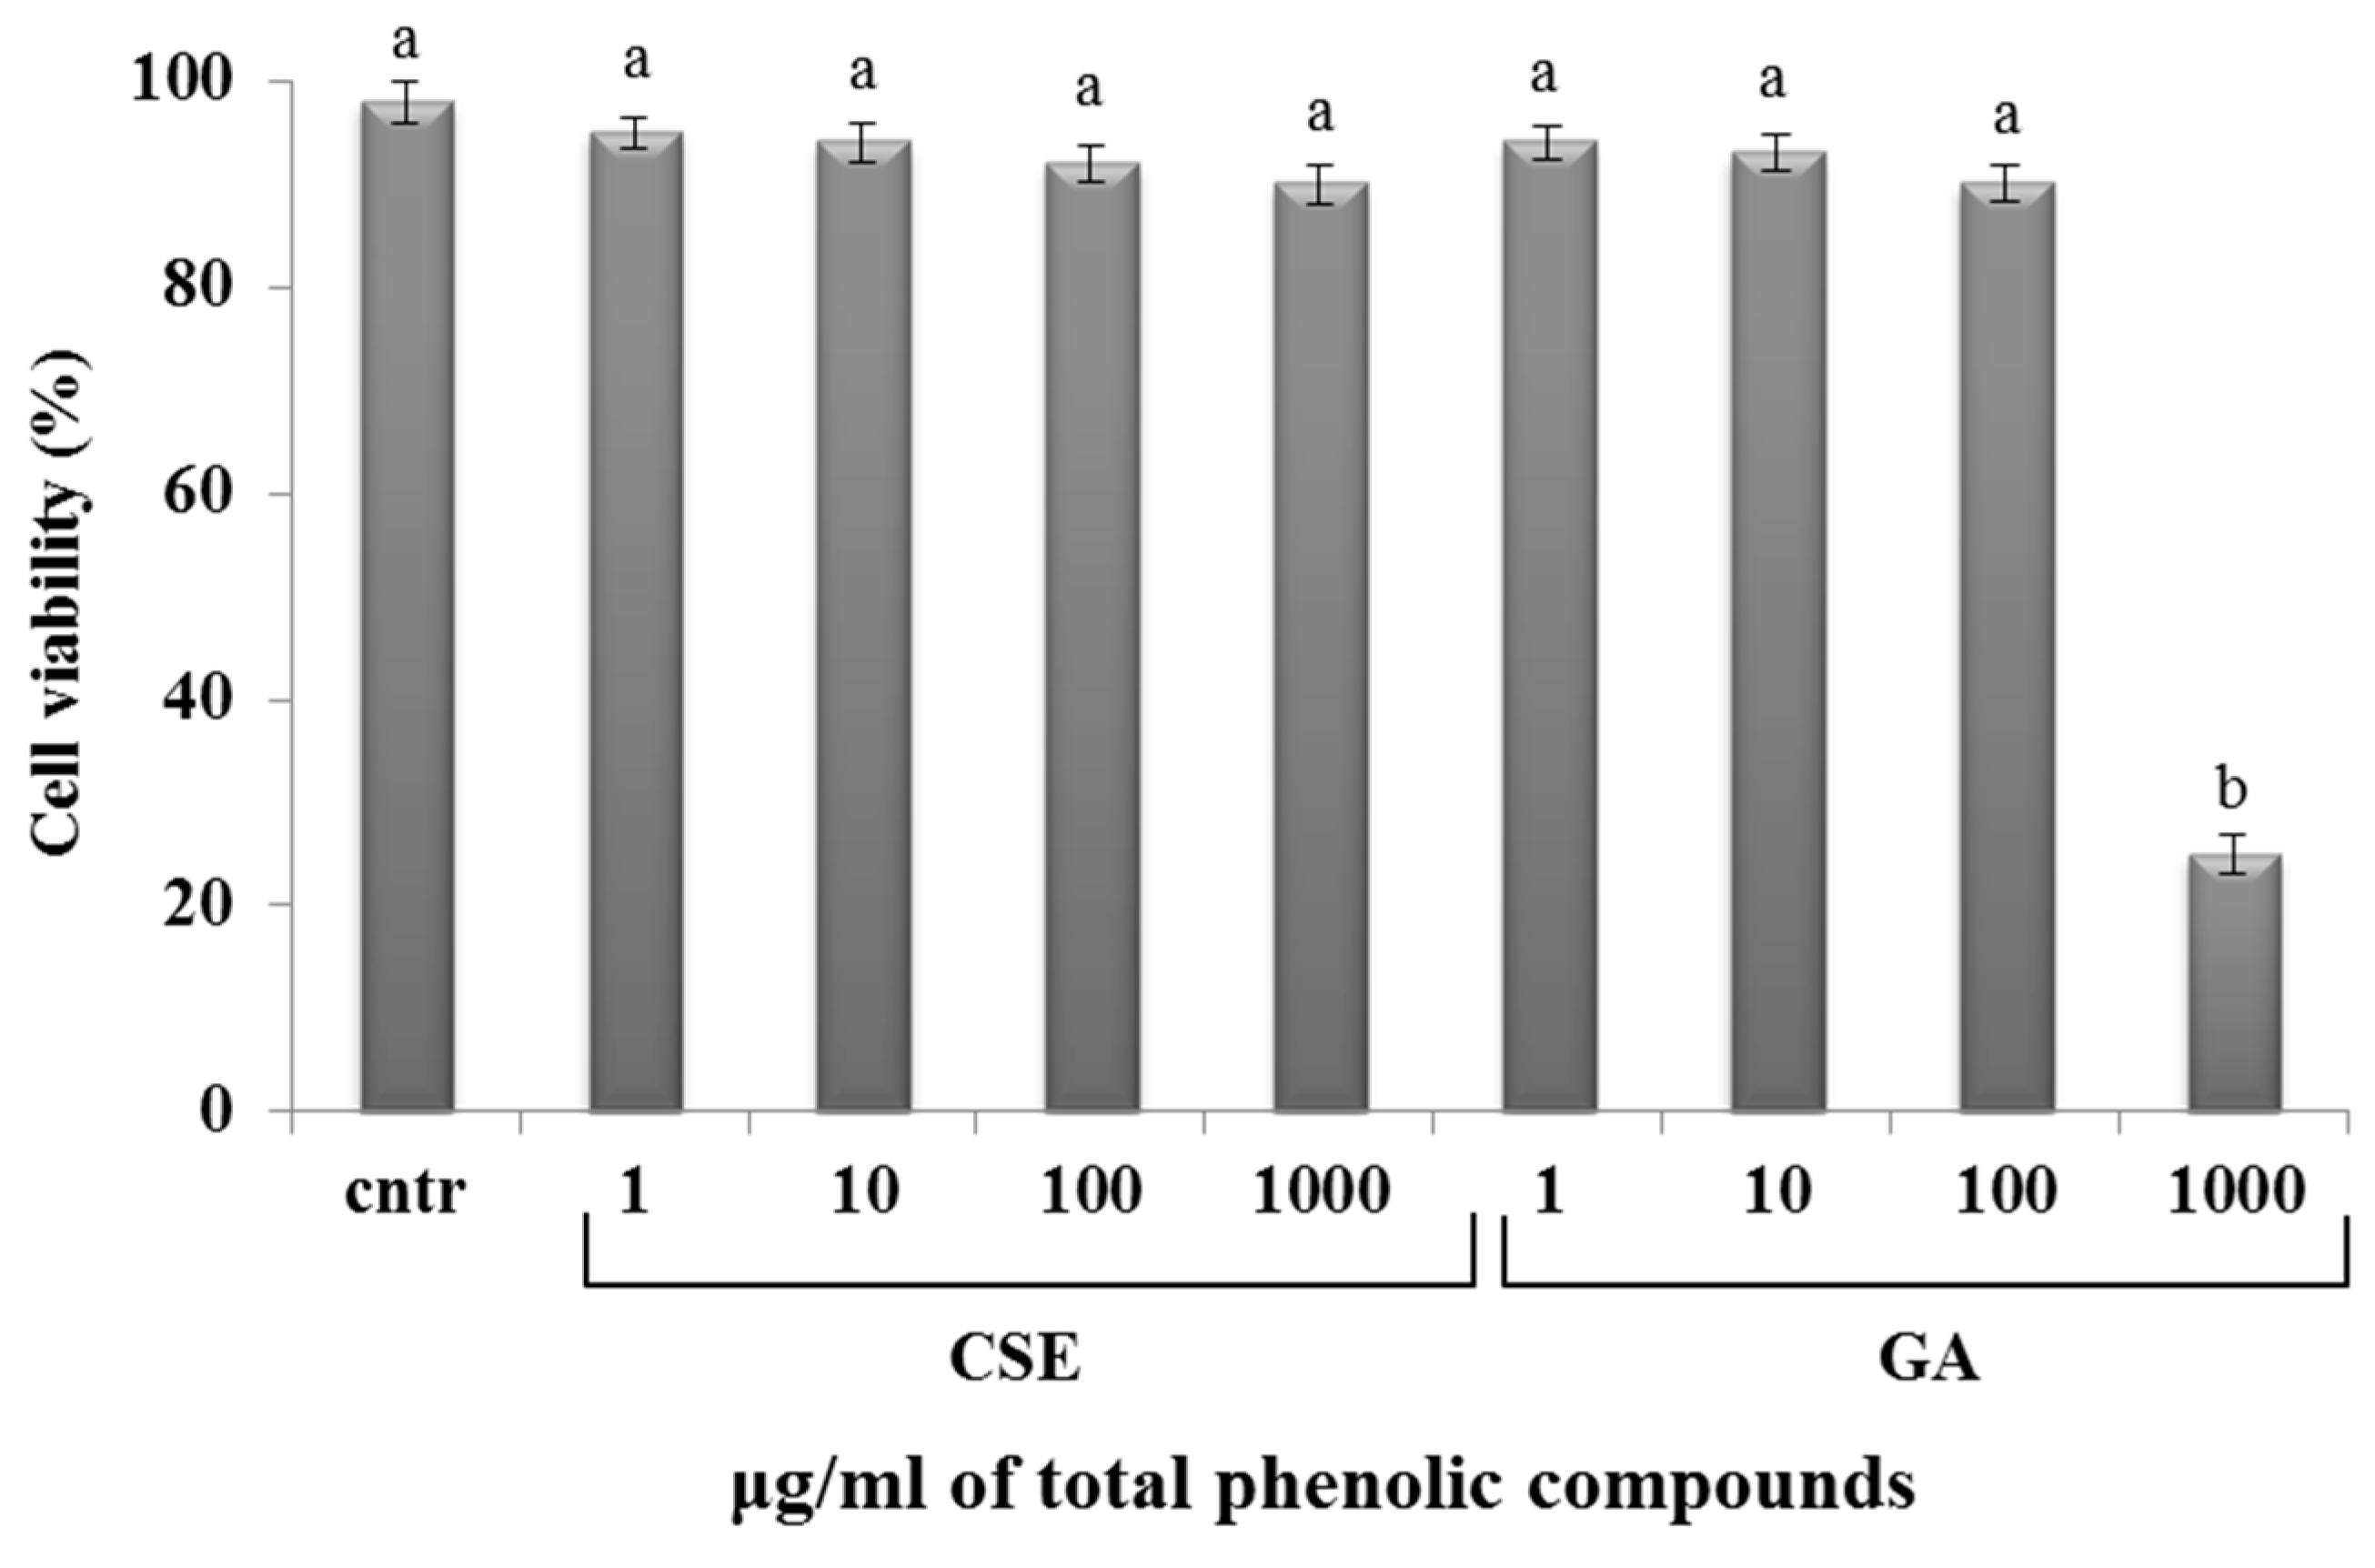
Leukocytes isolated from blood were cultured in vitro overnight in order to separate non-adherent leukocytes consisting of small and large lymphocytes, thrombocytes, granulocytes, and monocytes. The non-adherent fraction of leukocytes was employed for the following experiments. Intestinal intraepithelial non-adherent leukocytes consisted of small-sized lymphocyte populations.

2.4. Cytotoxicity

The MTT (3-(4,5-dimethylthiazolyl-2)-2,5-diphenyltetrazolium bromide) method was used to quantify the effects of different concentrations of CSE and GA on trout non-adherent leukocyte viability. CSE was found to be nontoxic at all tested concentrations, showing a cellular survival of 88%–95%: GA was nontoxic at 1,10,100 µg/mL, while it was toxic at a concentration of 1000 µg/mL (Figure 2).

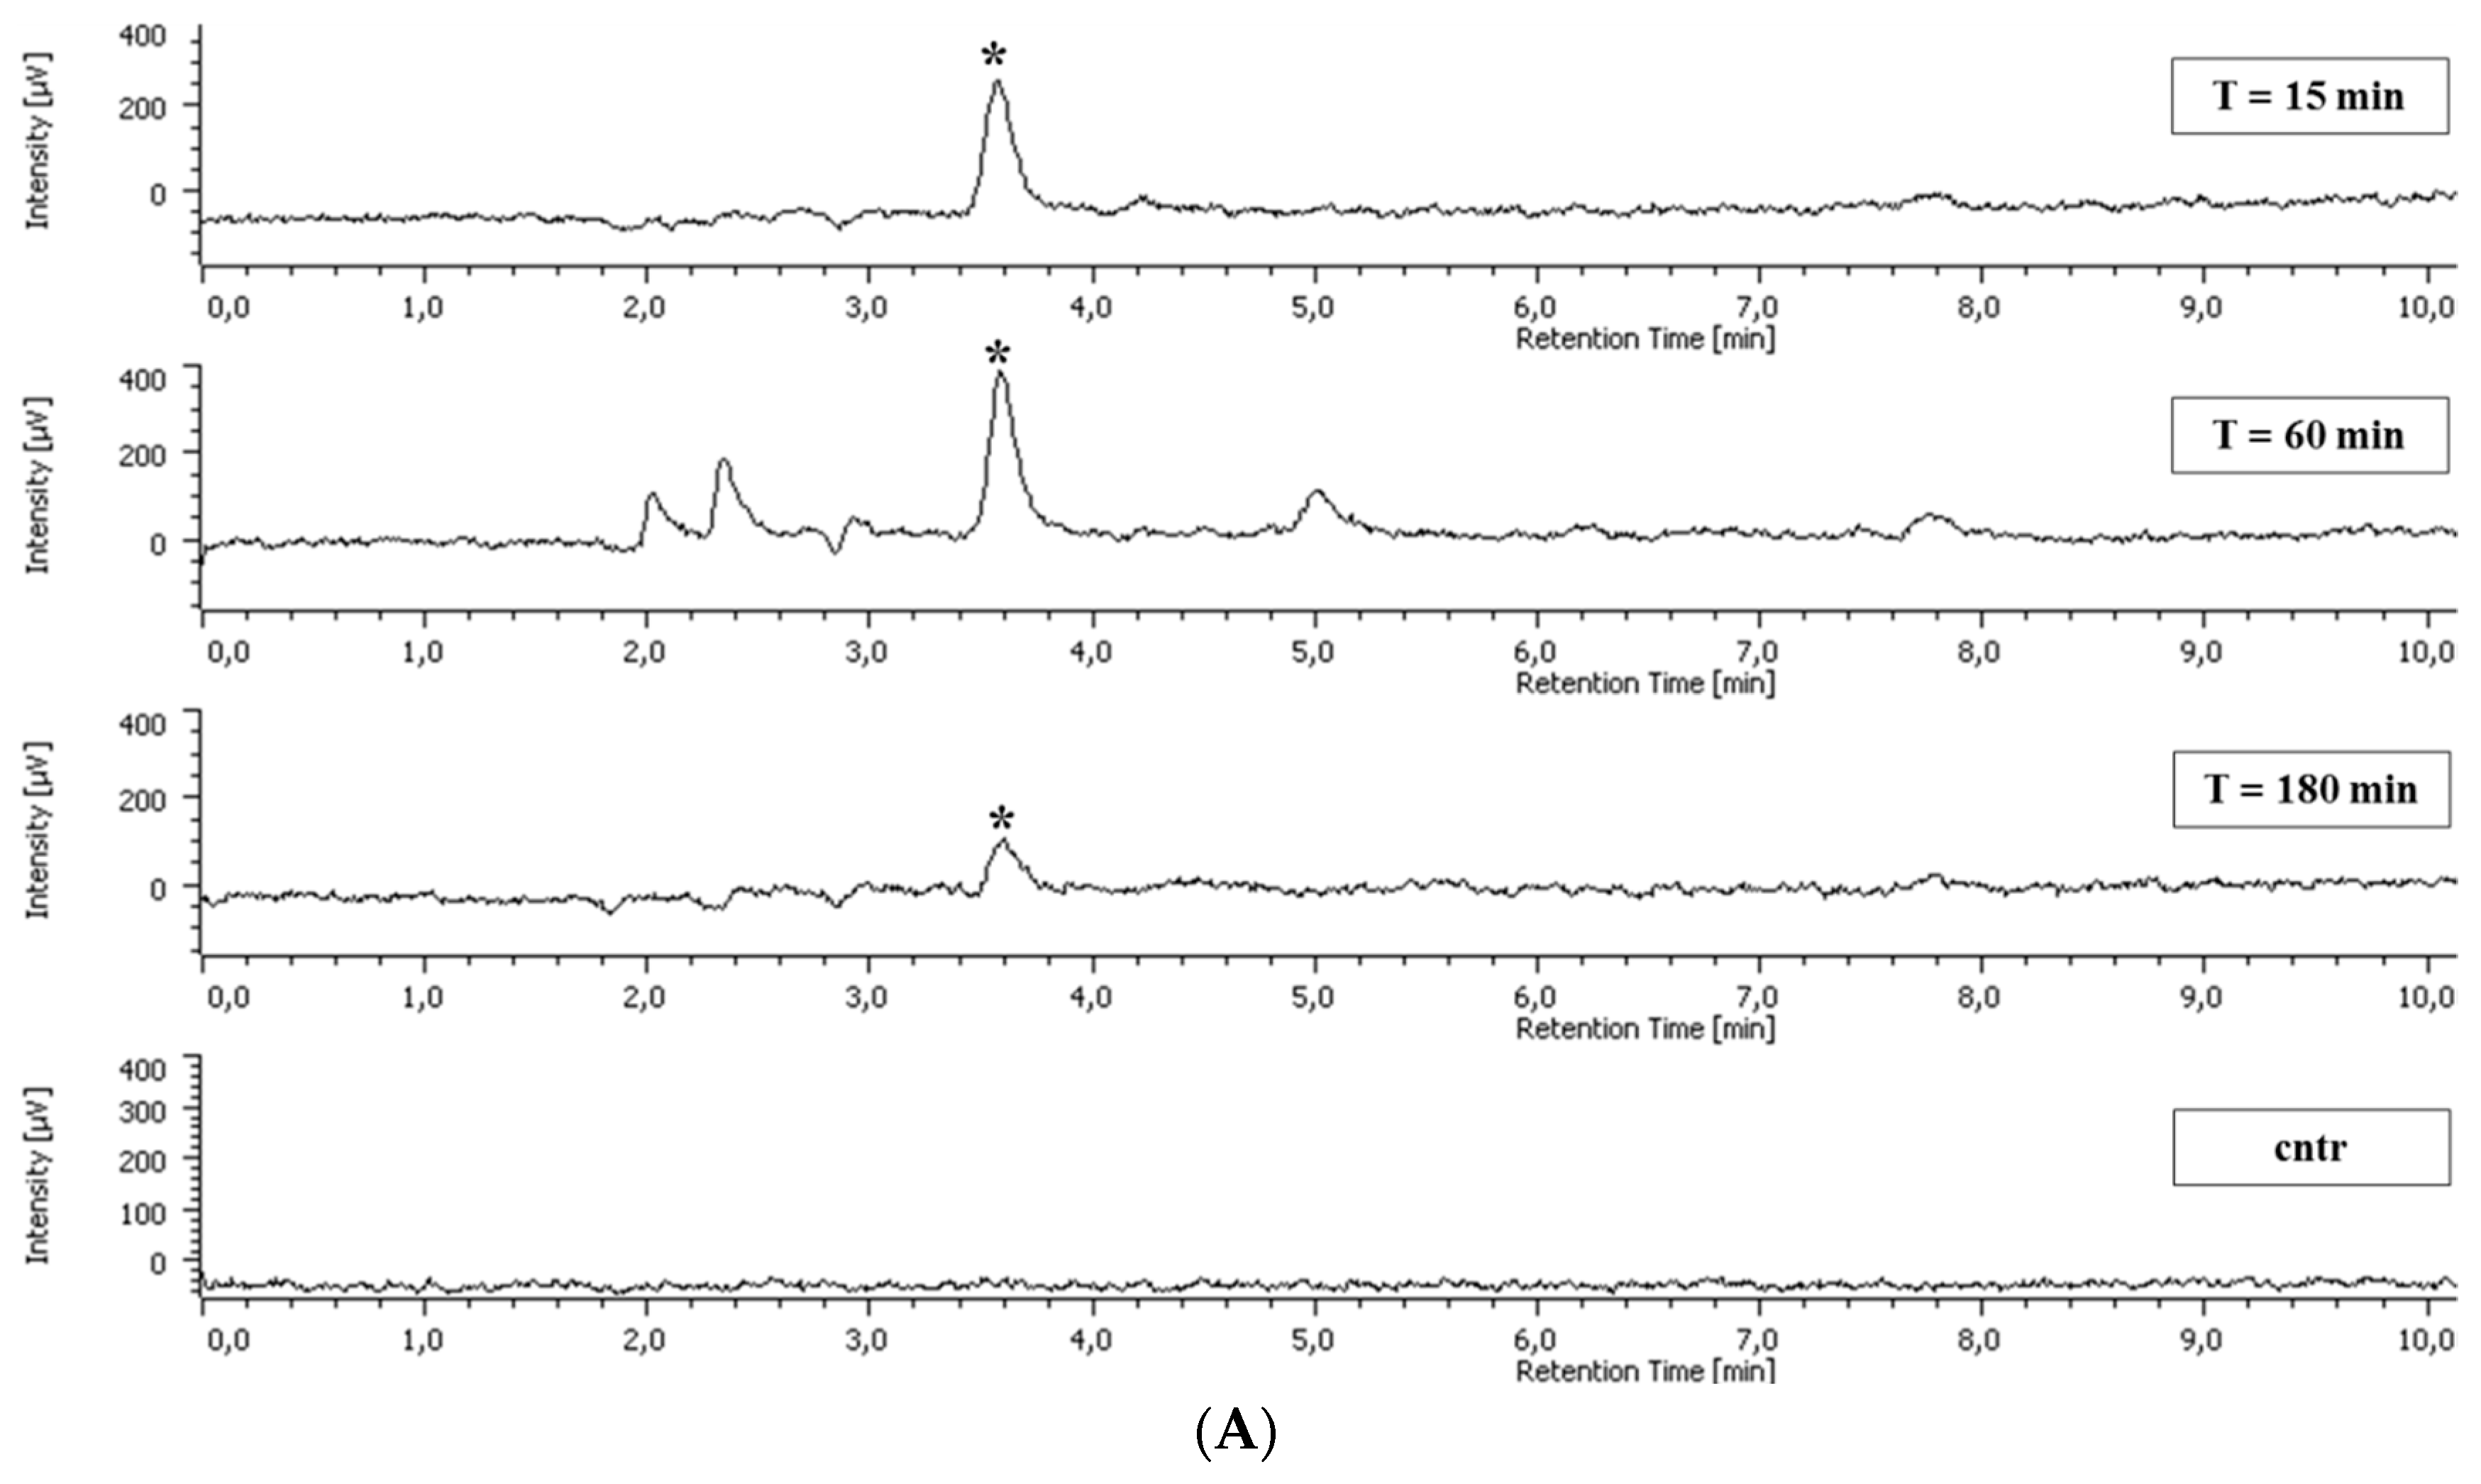
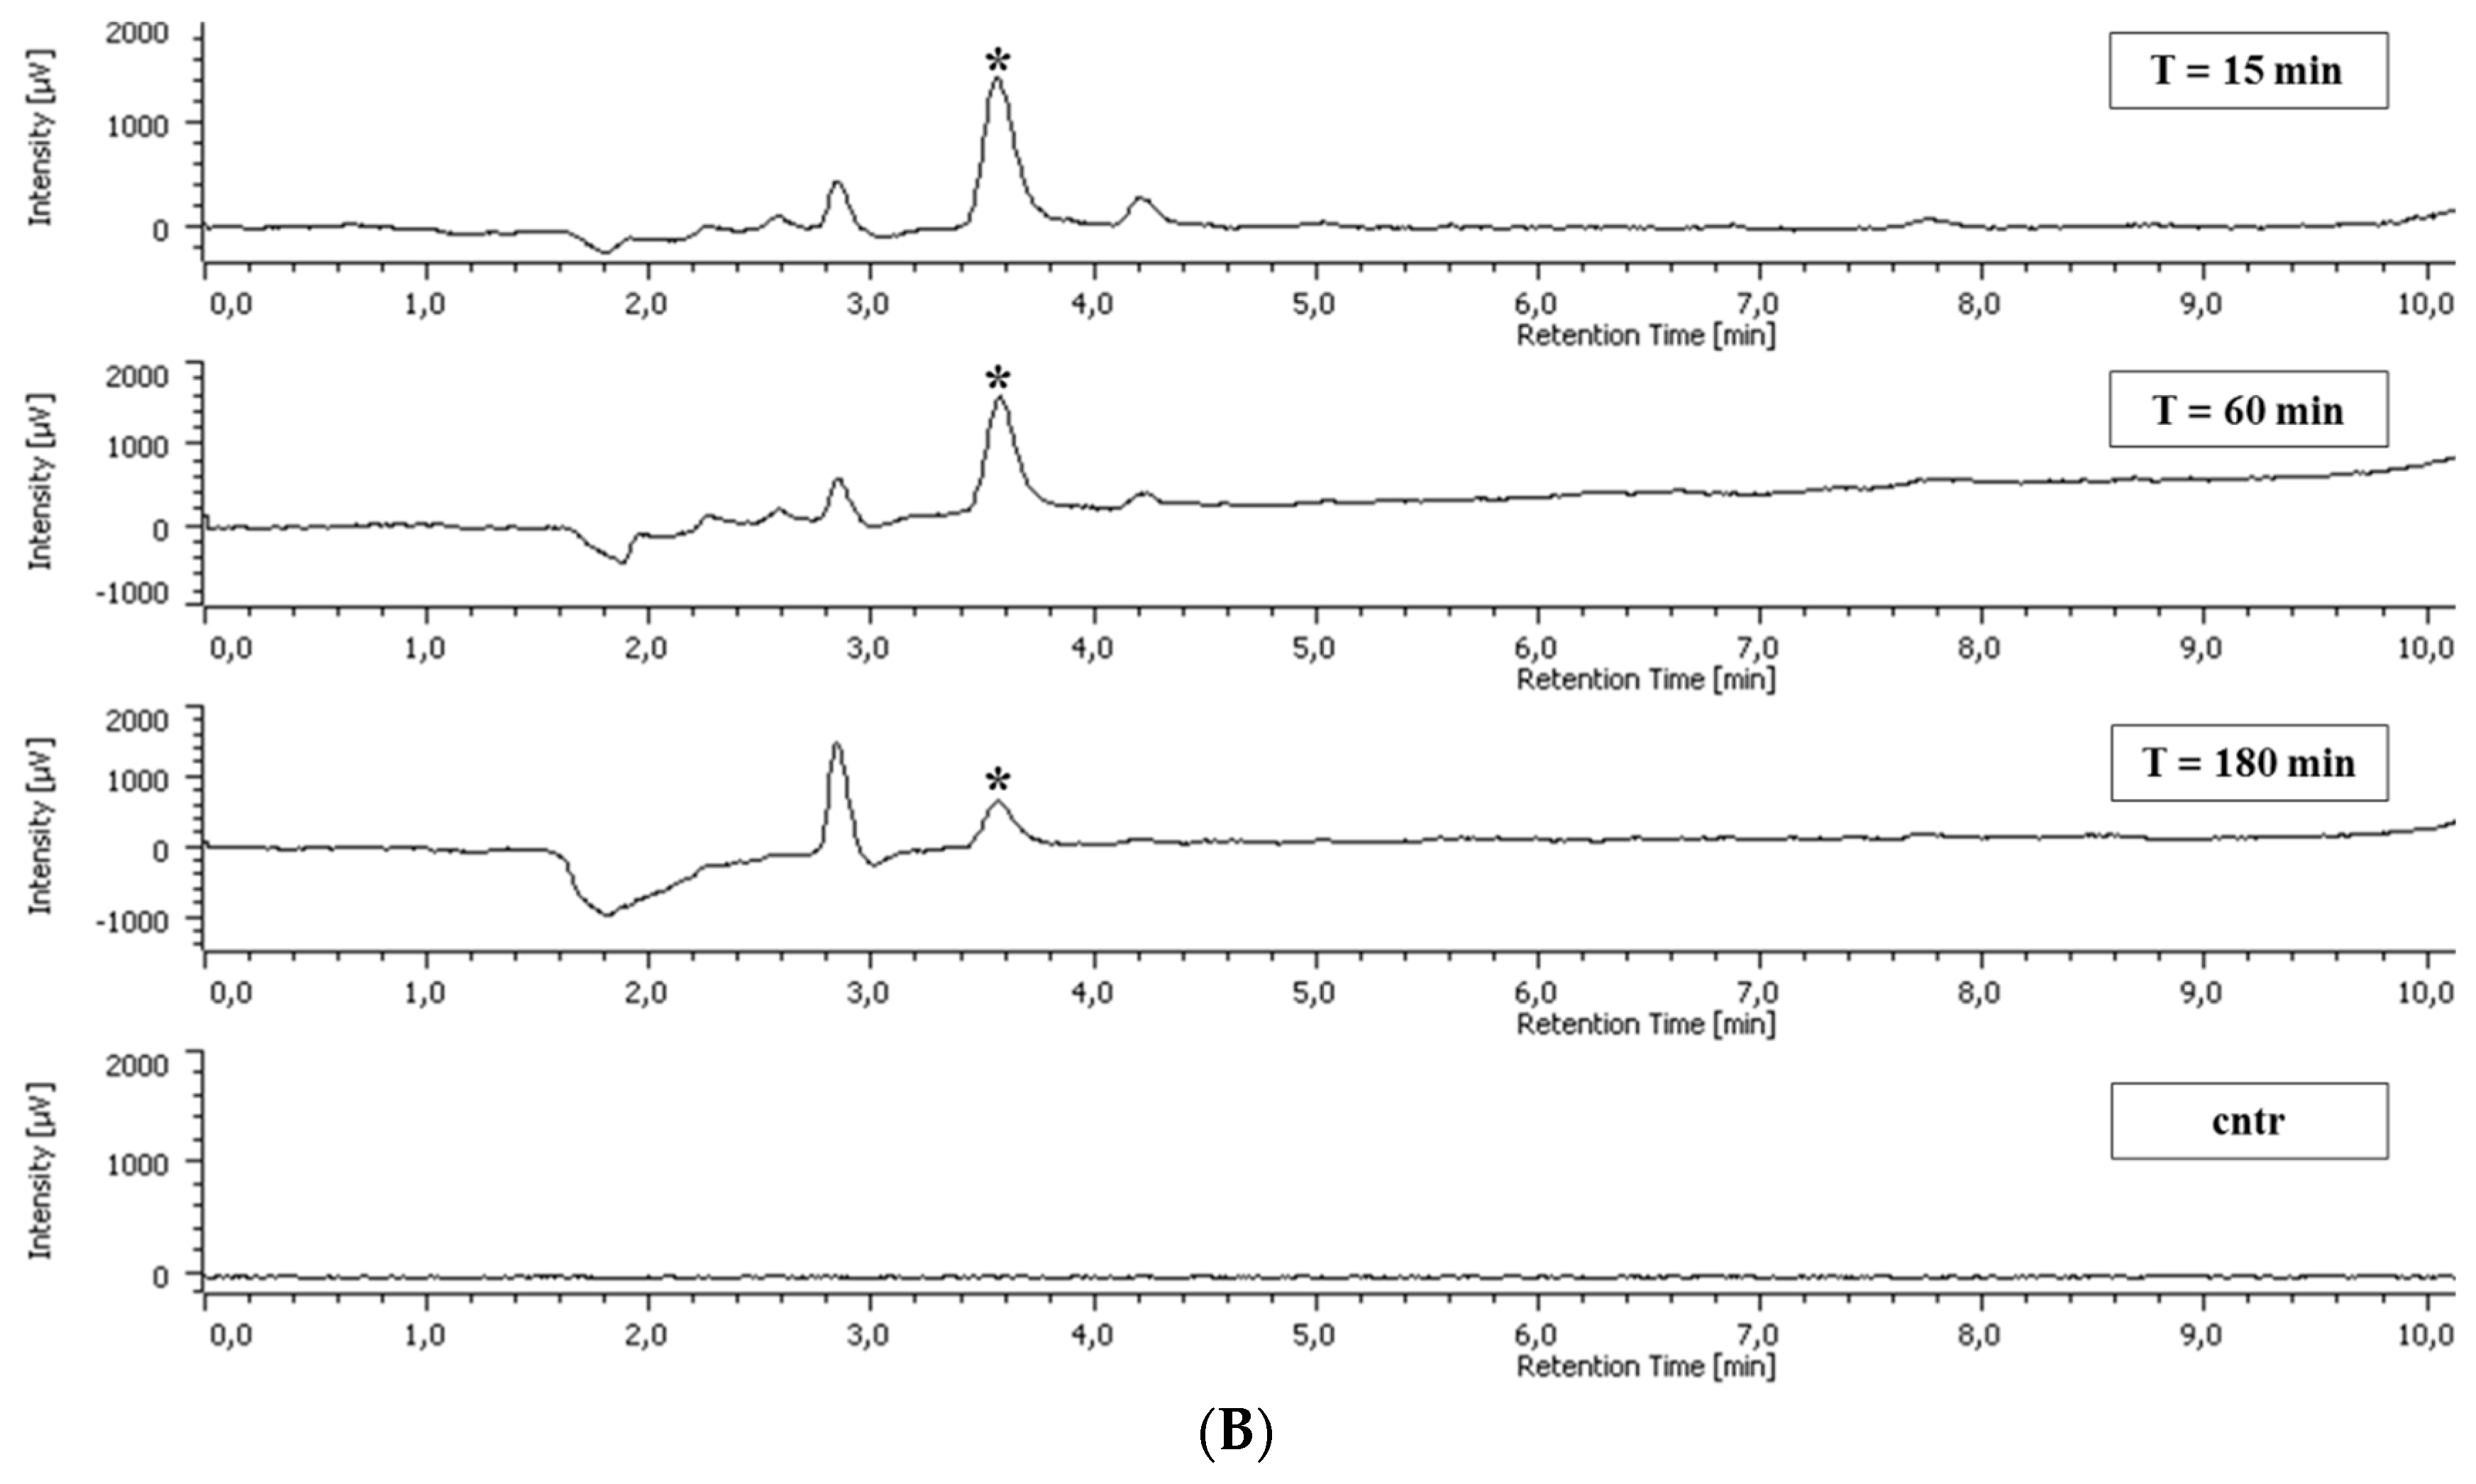
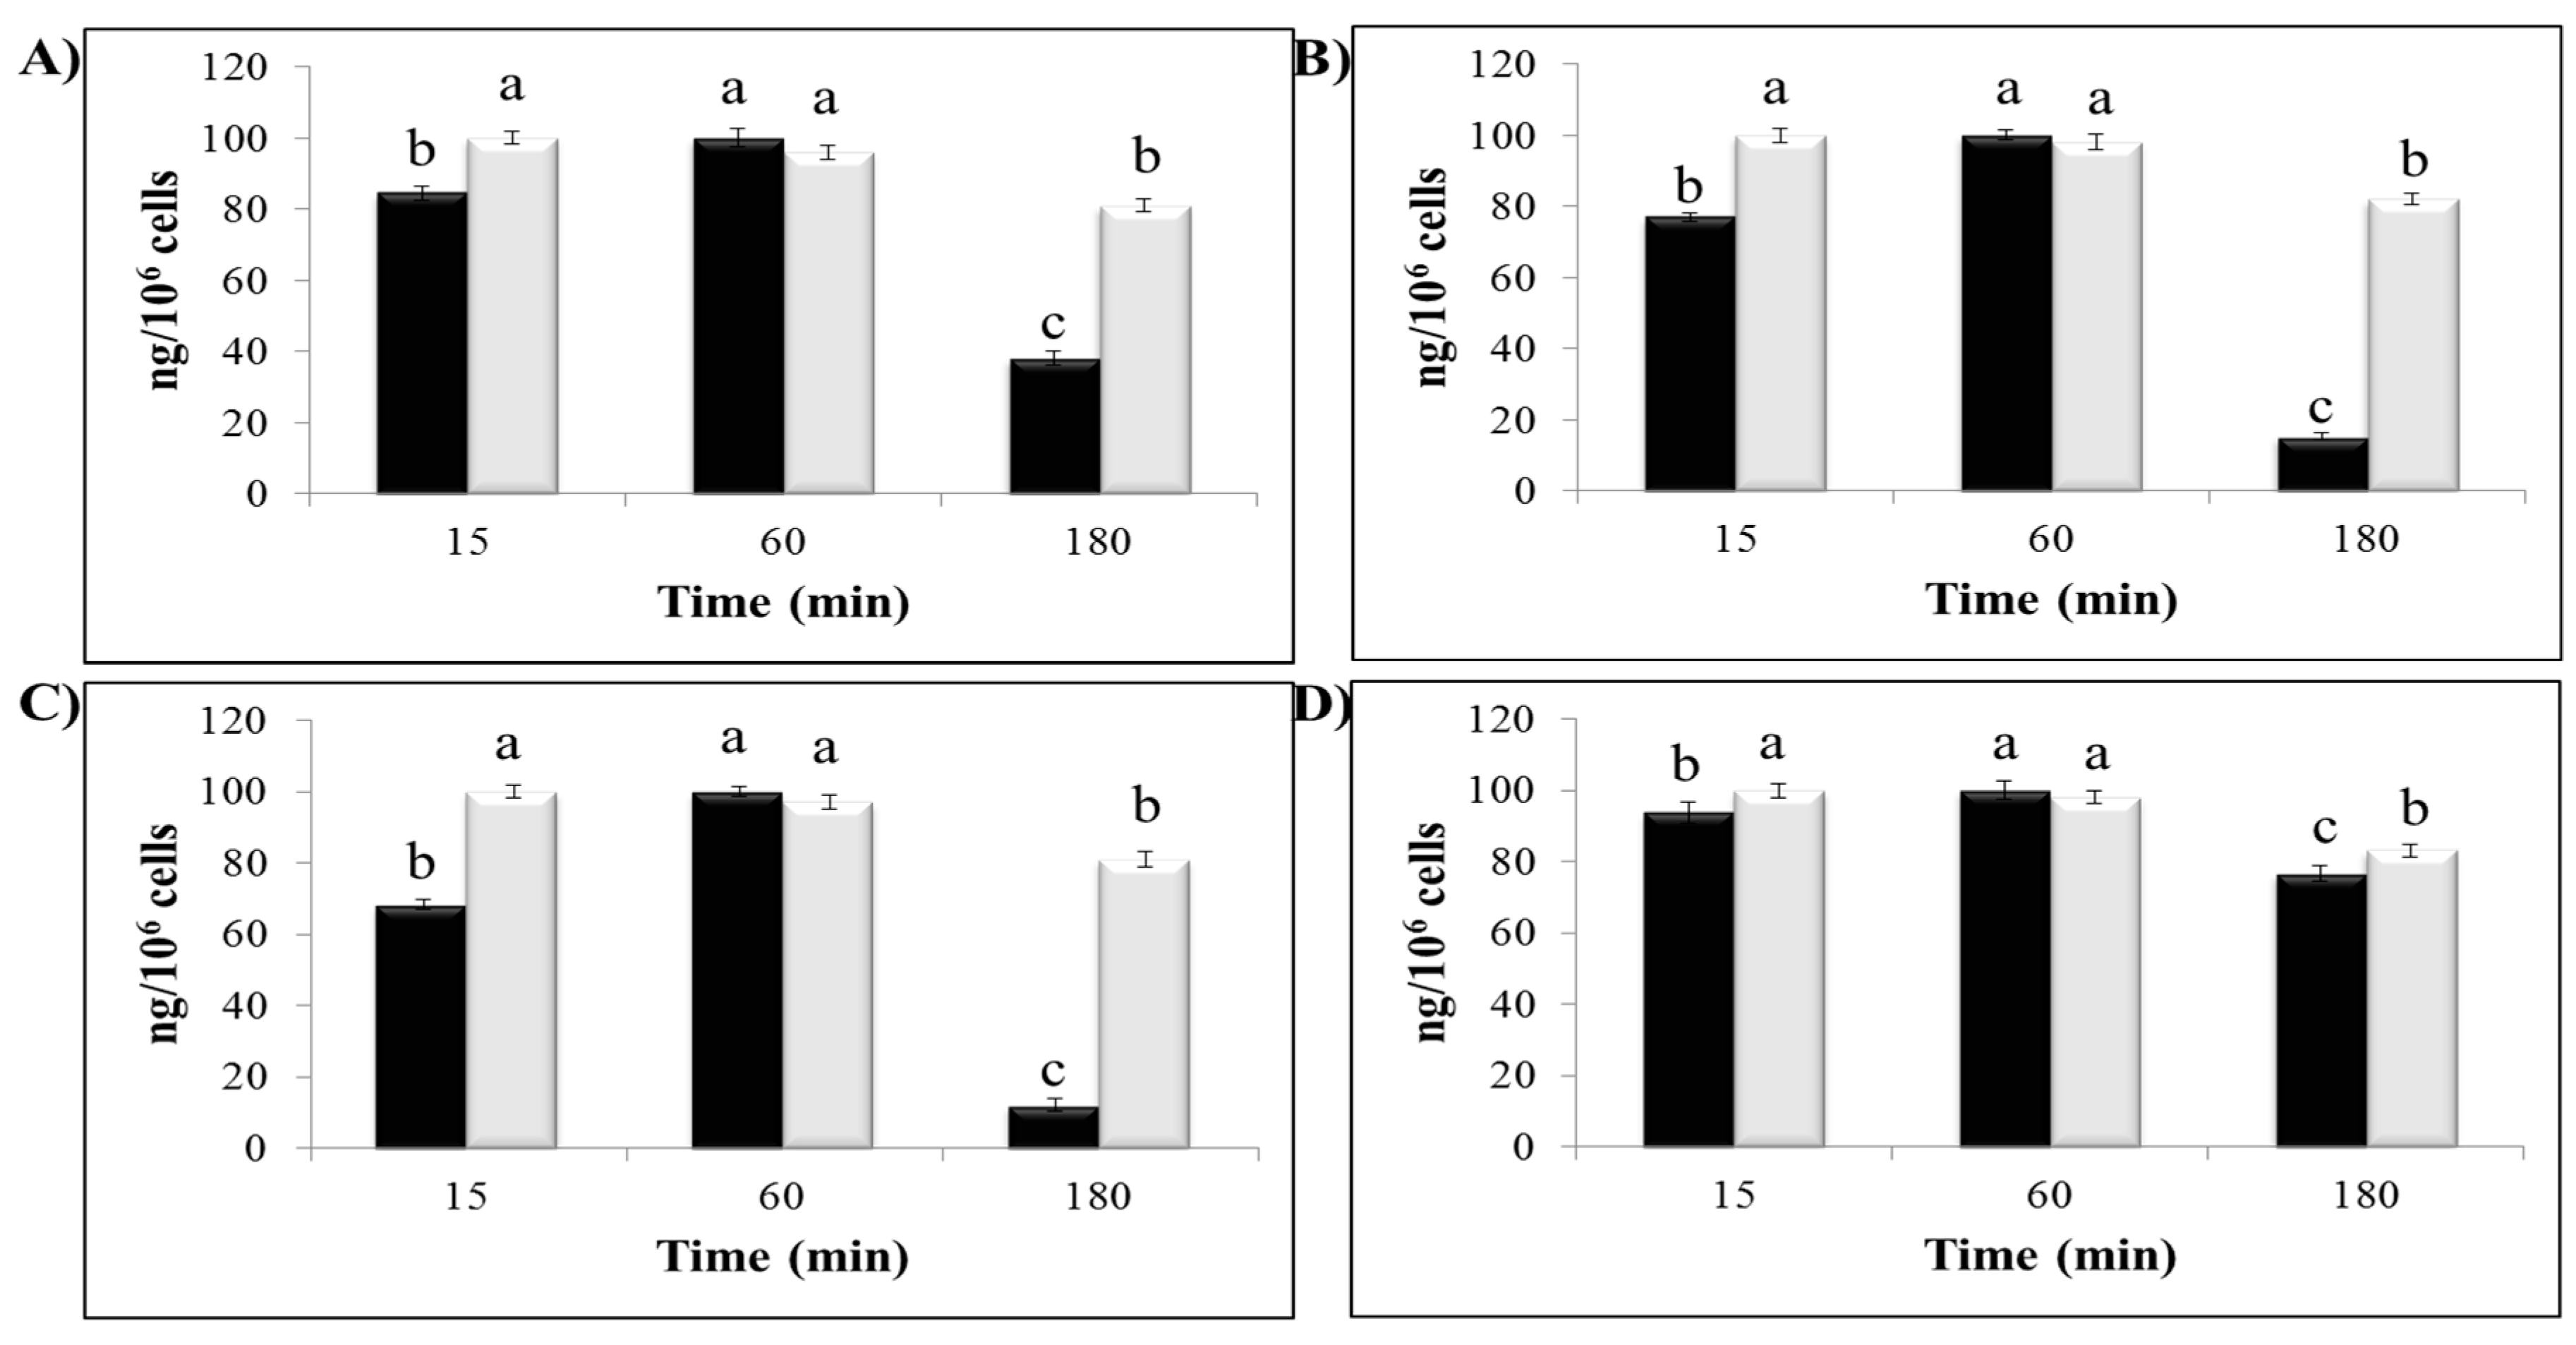
2.5. Polyphenol Cellular Content

Standard chromatograms showing the resolution of the methanol extract of non-adherent leukocytes incubated with CSE and GA are presented in Figure 3.
A peak at 3.59 min of elution corresponding to GA was present in both blood non-adherent leukocytes and intestinal intraepithelial non-adherent leukocytes incubated with CSE and GA. The concentration of such a peak in the non-adherent leukocytes was calculated using a standard curve with known concentrations of GA. The area of the peaks was compared to the area of the GA in the standard curve using the ChromNAV software program.
Figure 4A shows the evaluation of CSE content in intestinal non-adherent leukocytes after 15, 60, and 180 min of incubation and the CSE profile in the medium at the corresponding times. A CSE content evaluation in blood non-adherent leukocytes gave similar results (Figure 4C). Figure 4B shows a GA content evaluation in intestinal intraepithelial non-adherent leukocytes after 15, 60, and 180 min of incubation and a GA profile in the medium at the corresponding times. A GA content evaluation in blood non-adherent leukocytes gave similar results (Figure 4D). The GA concentration in the medium kept being stable for up to three hours (data not shown).

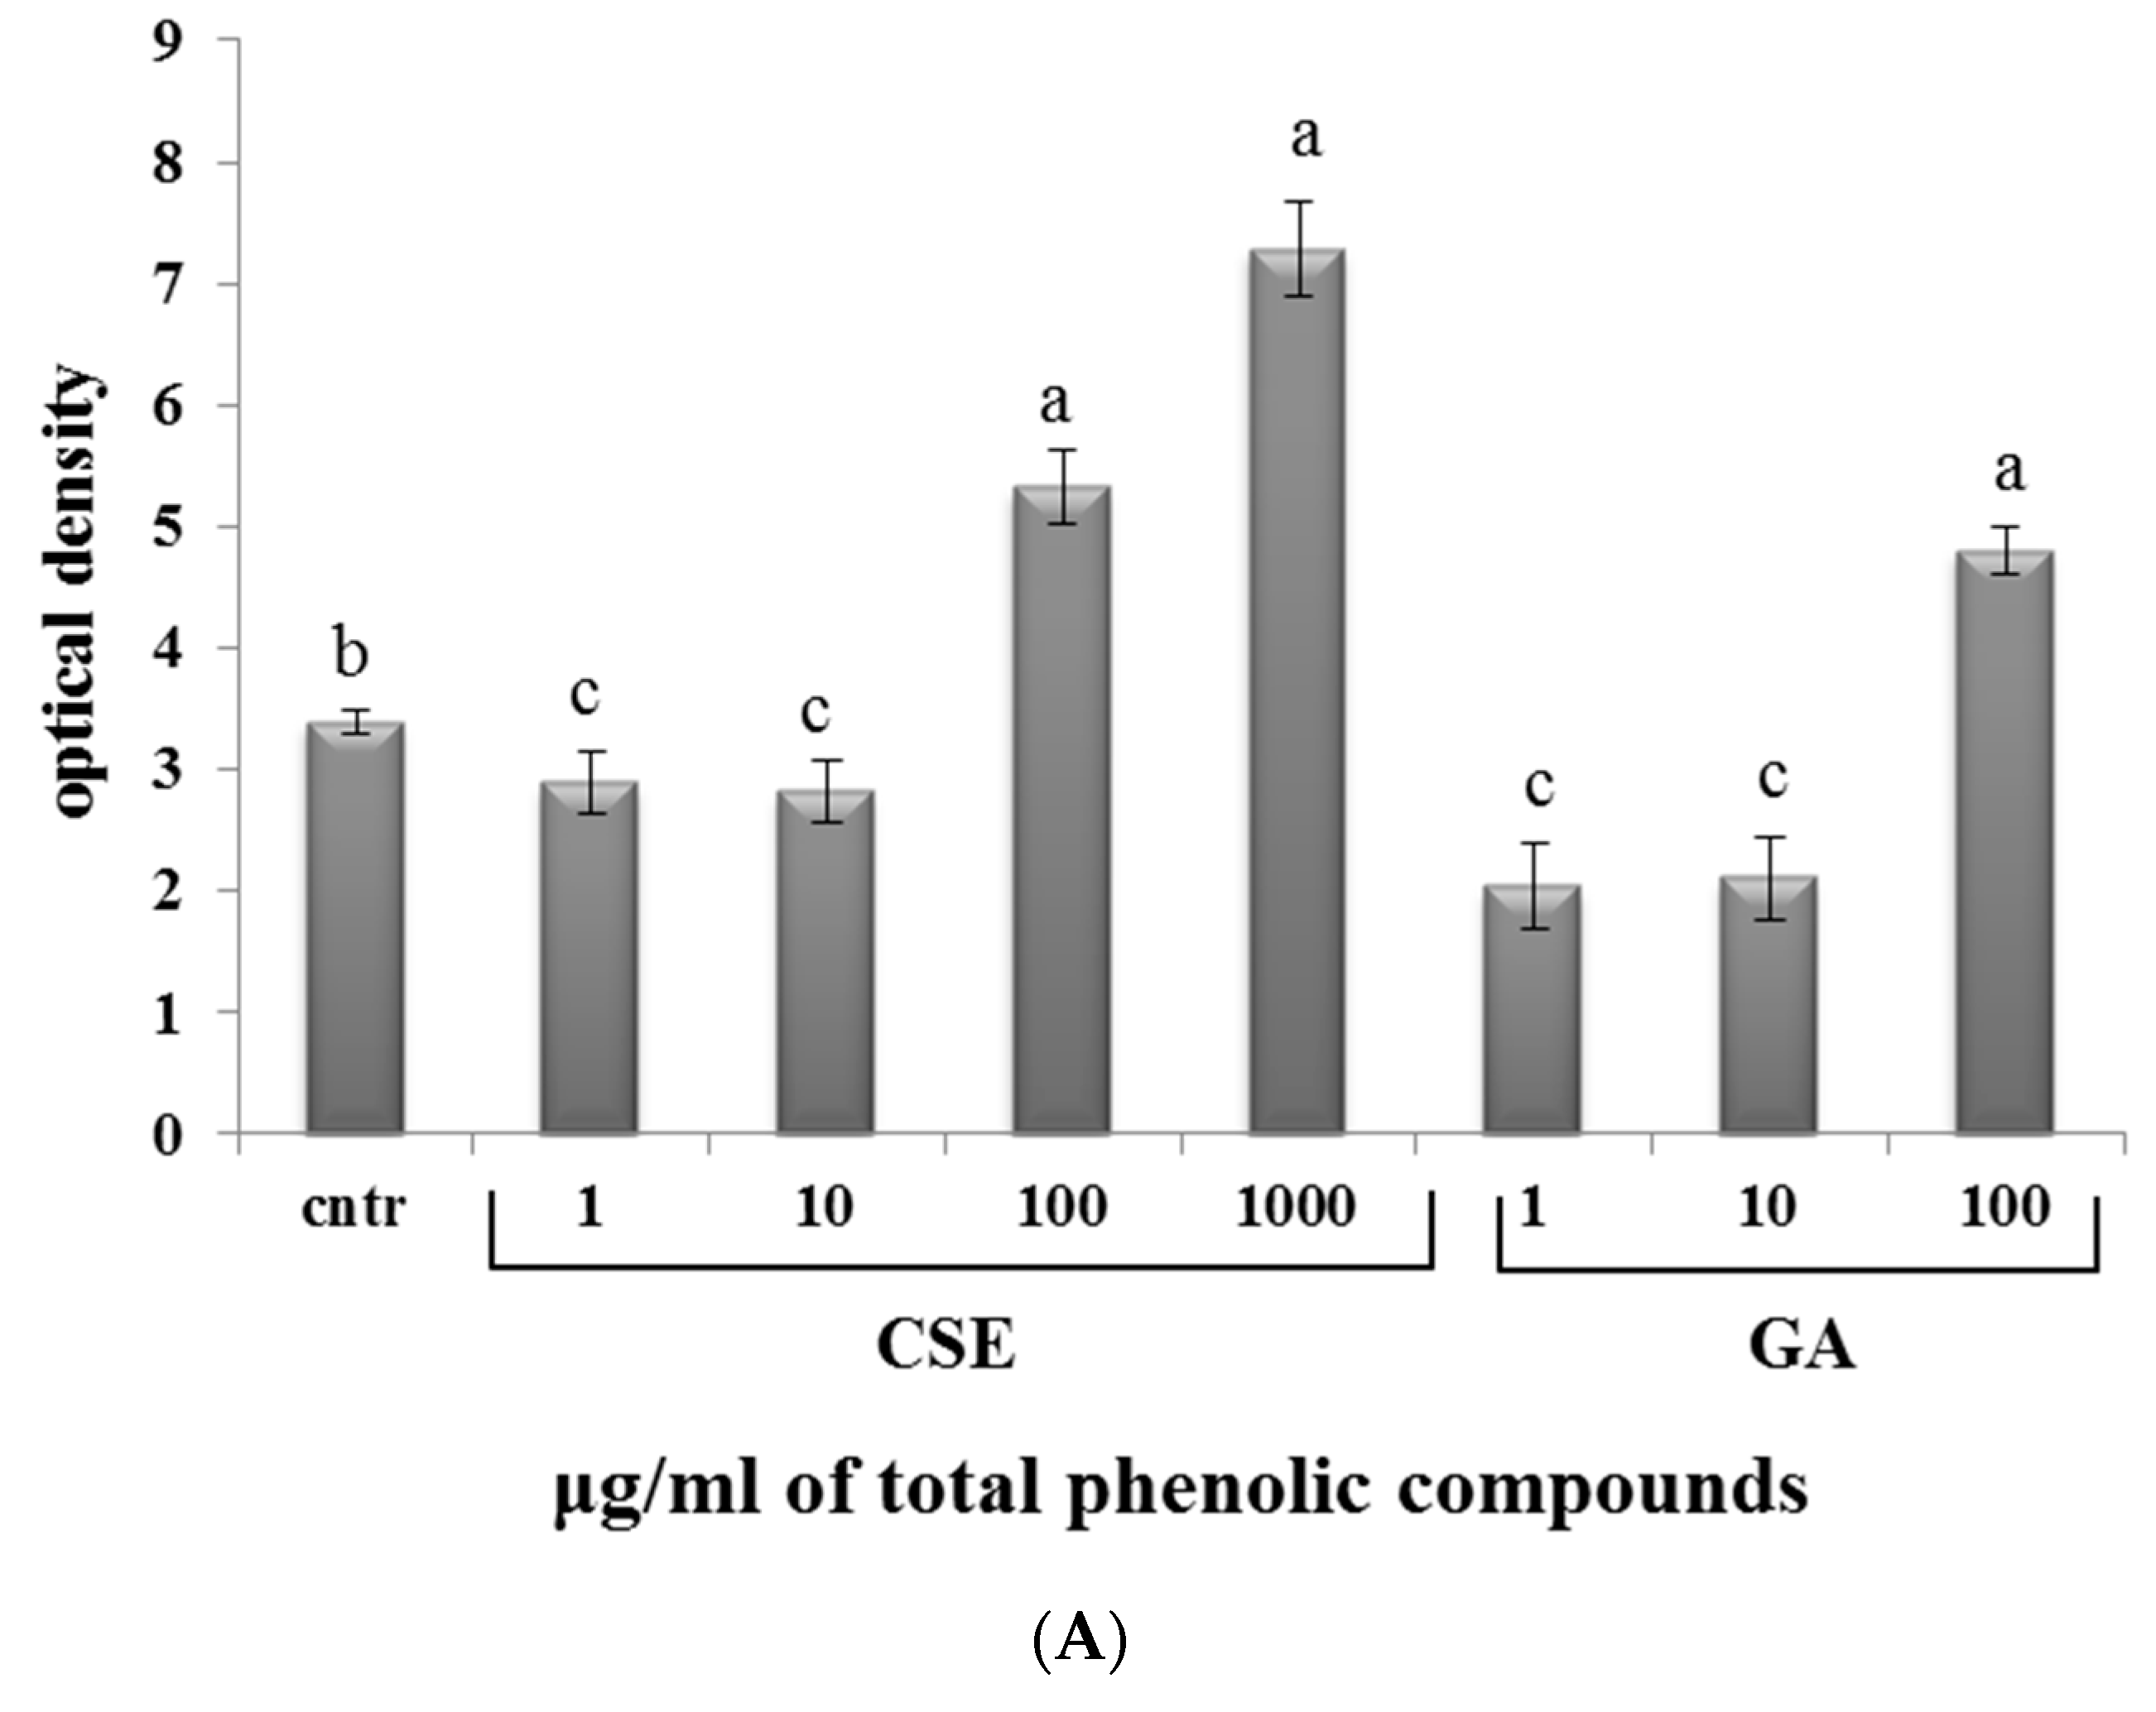
2.6. Effect of CSE on Superoxide Anion Production

In both blood and intestinal non-adherent leukocytes, low doses of CSE (1 and 10 µg/mL) and GA (1 and 10 µg/mL) decreased the production of superoxide anion compared to the control. At high doses of CSE (100 and 1000 µg/mL) and GA (100 µg/mL), the production of superoxide anion increased (Figure 5).

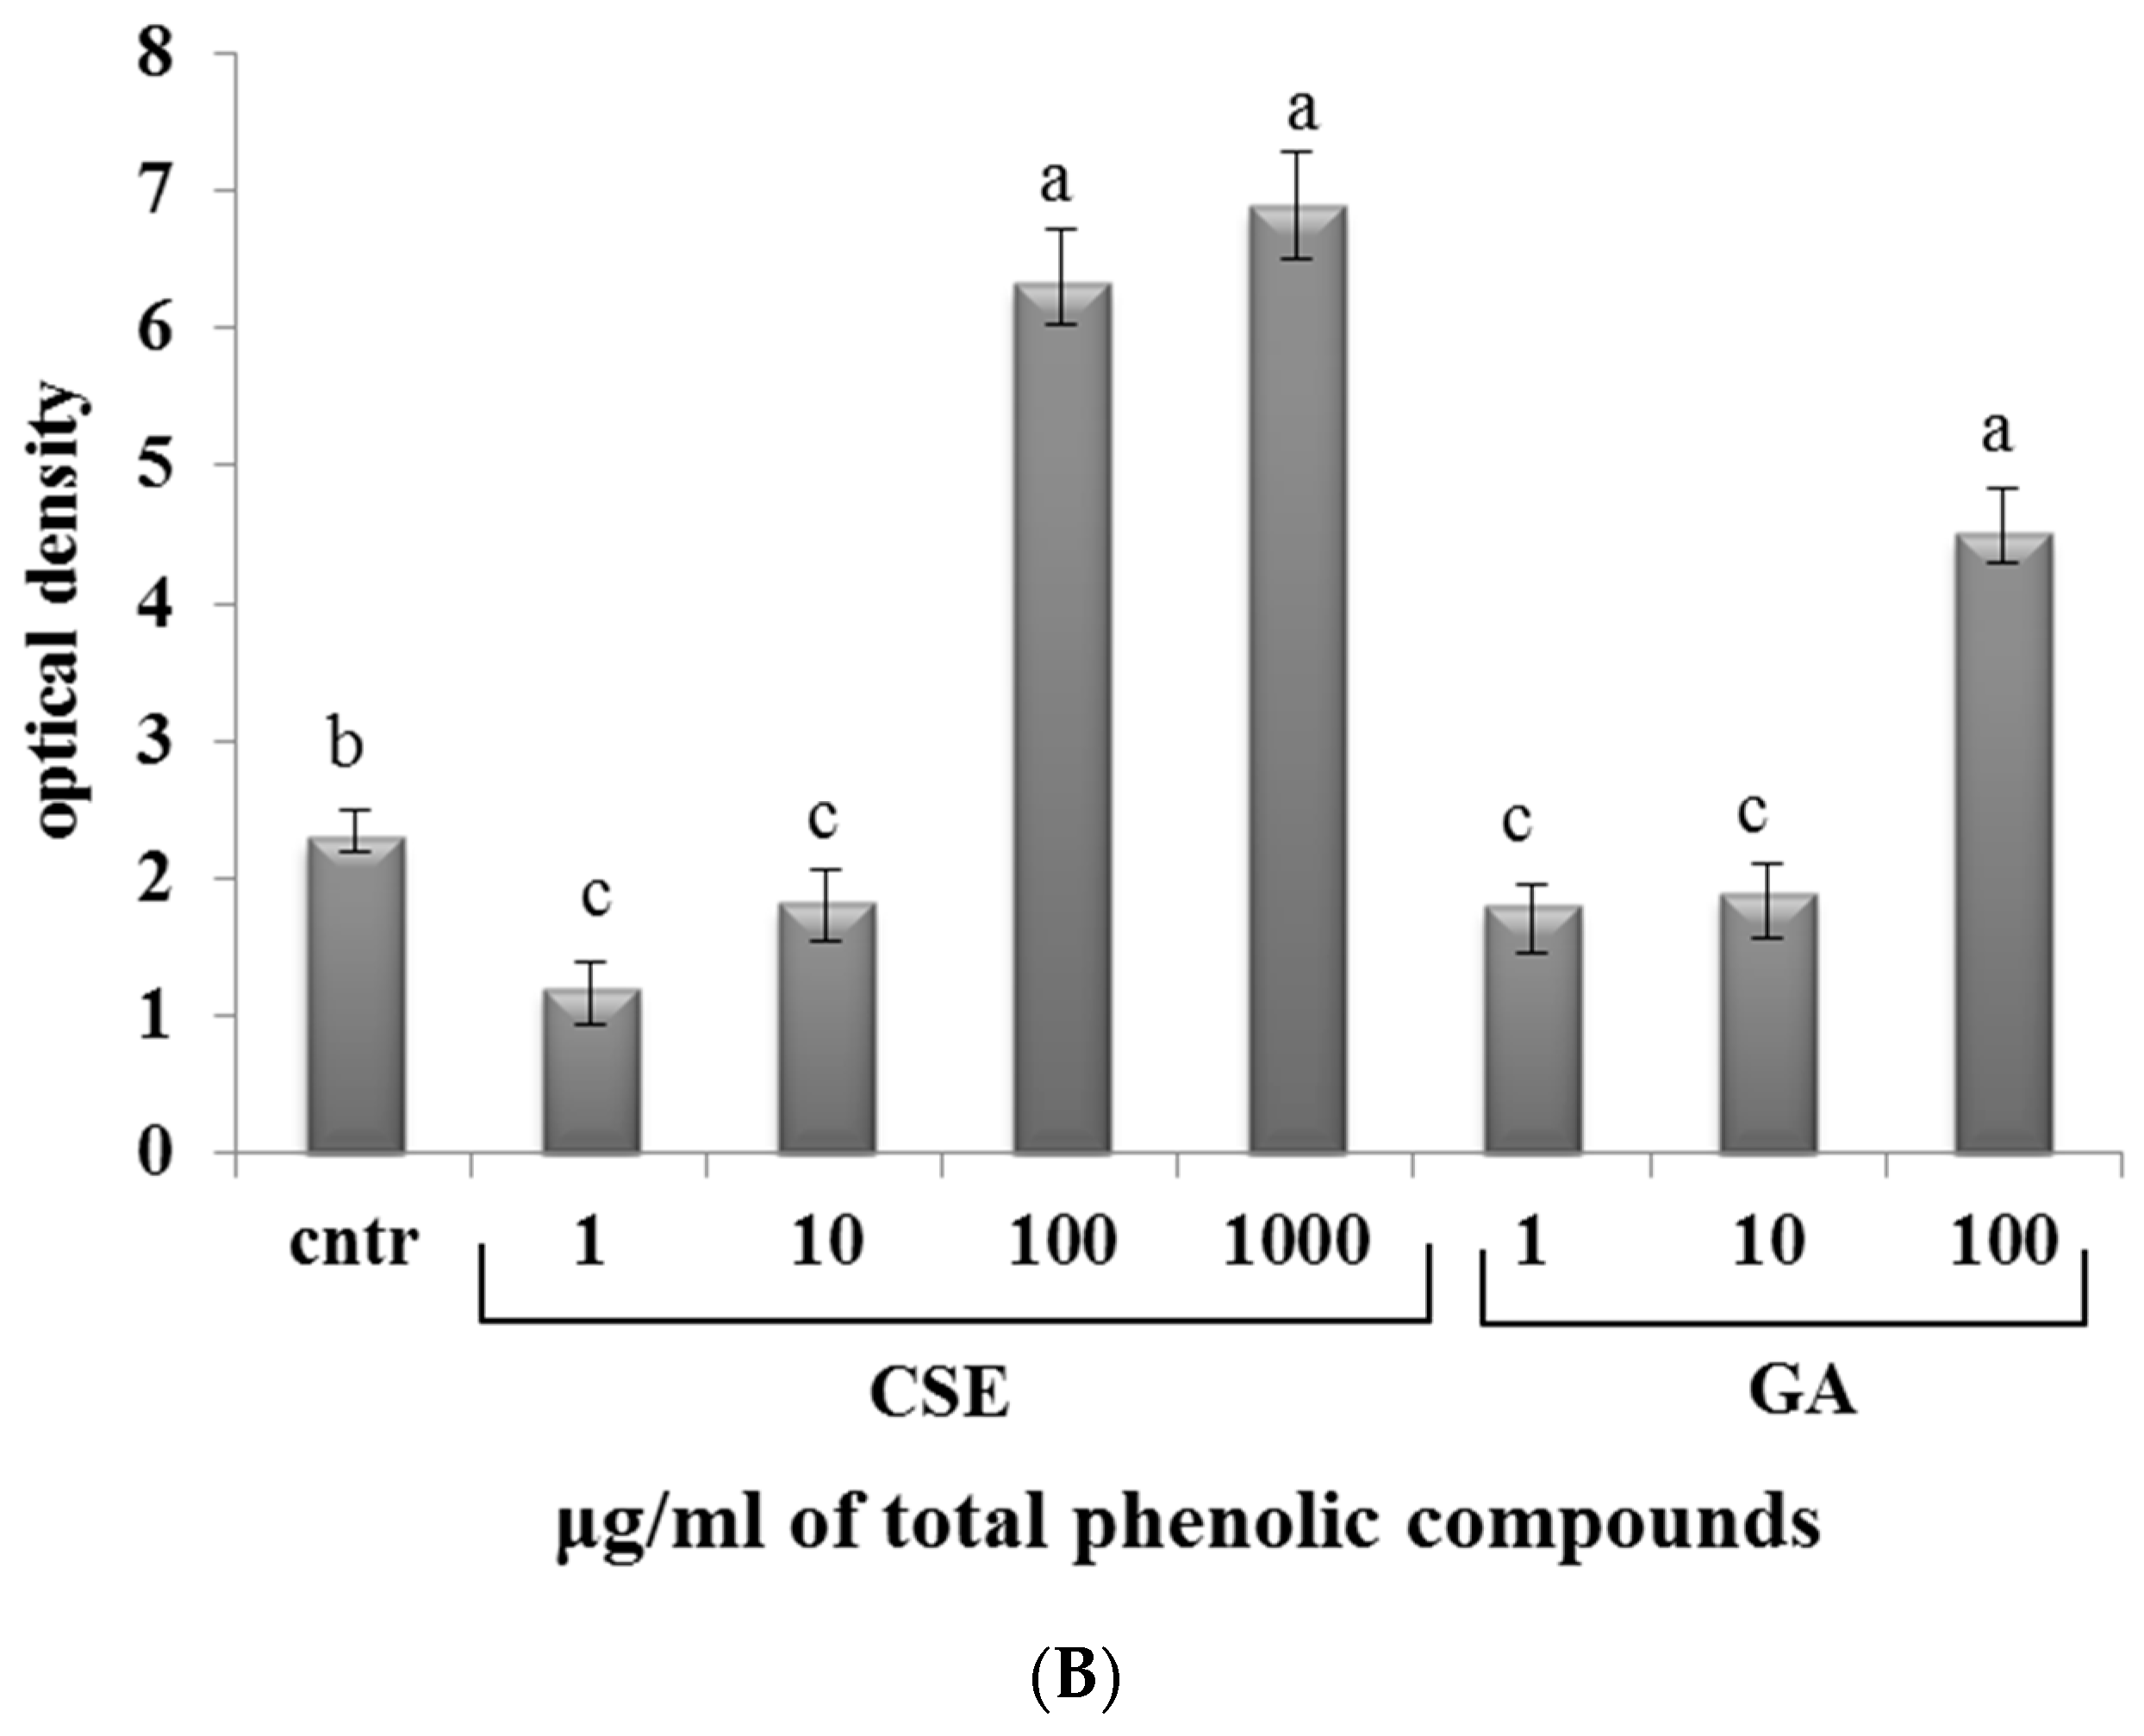
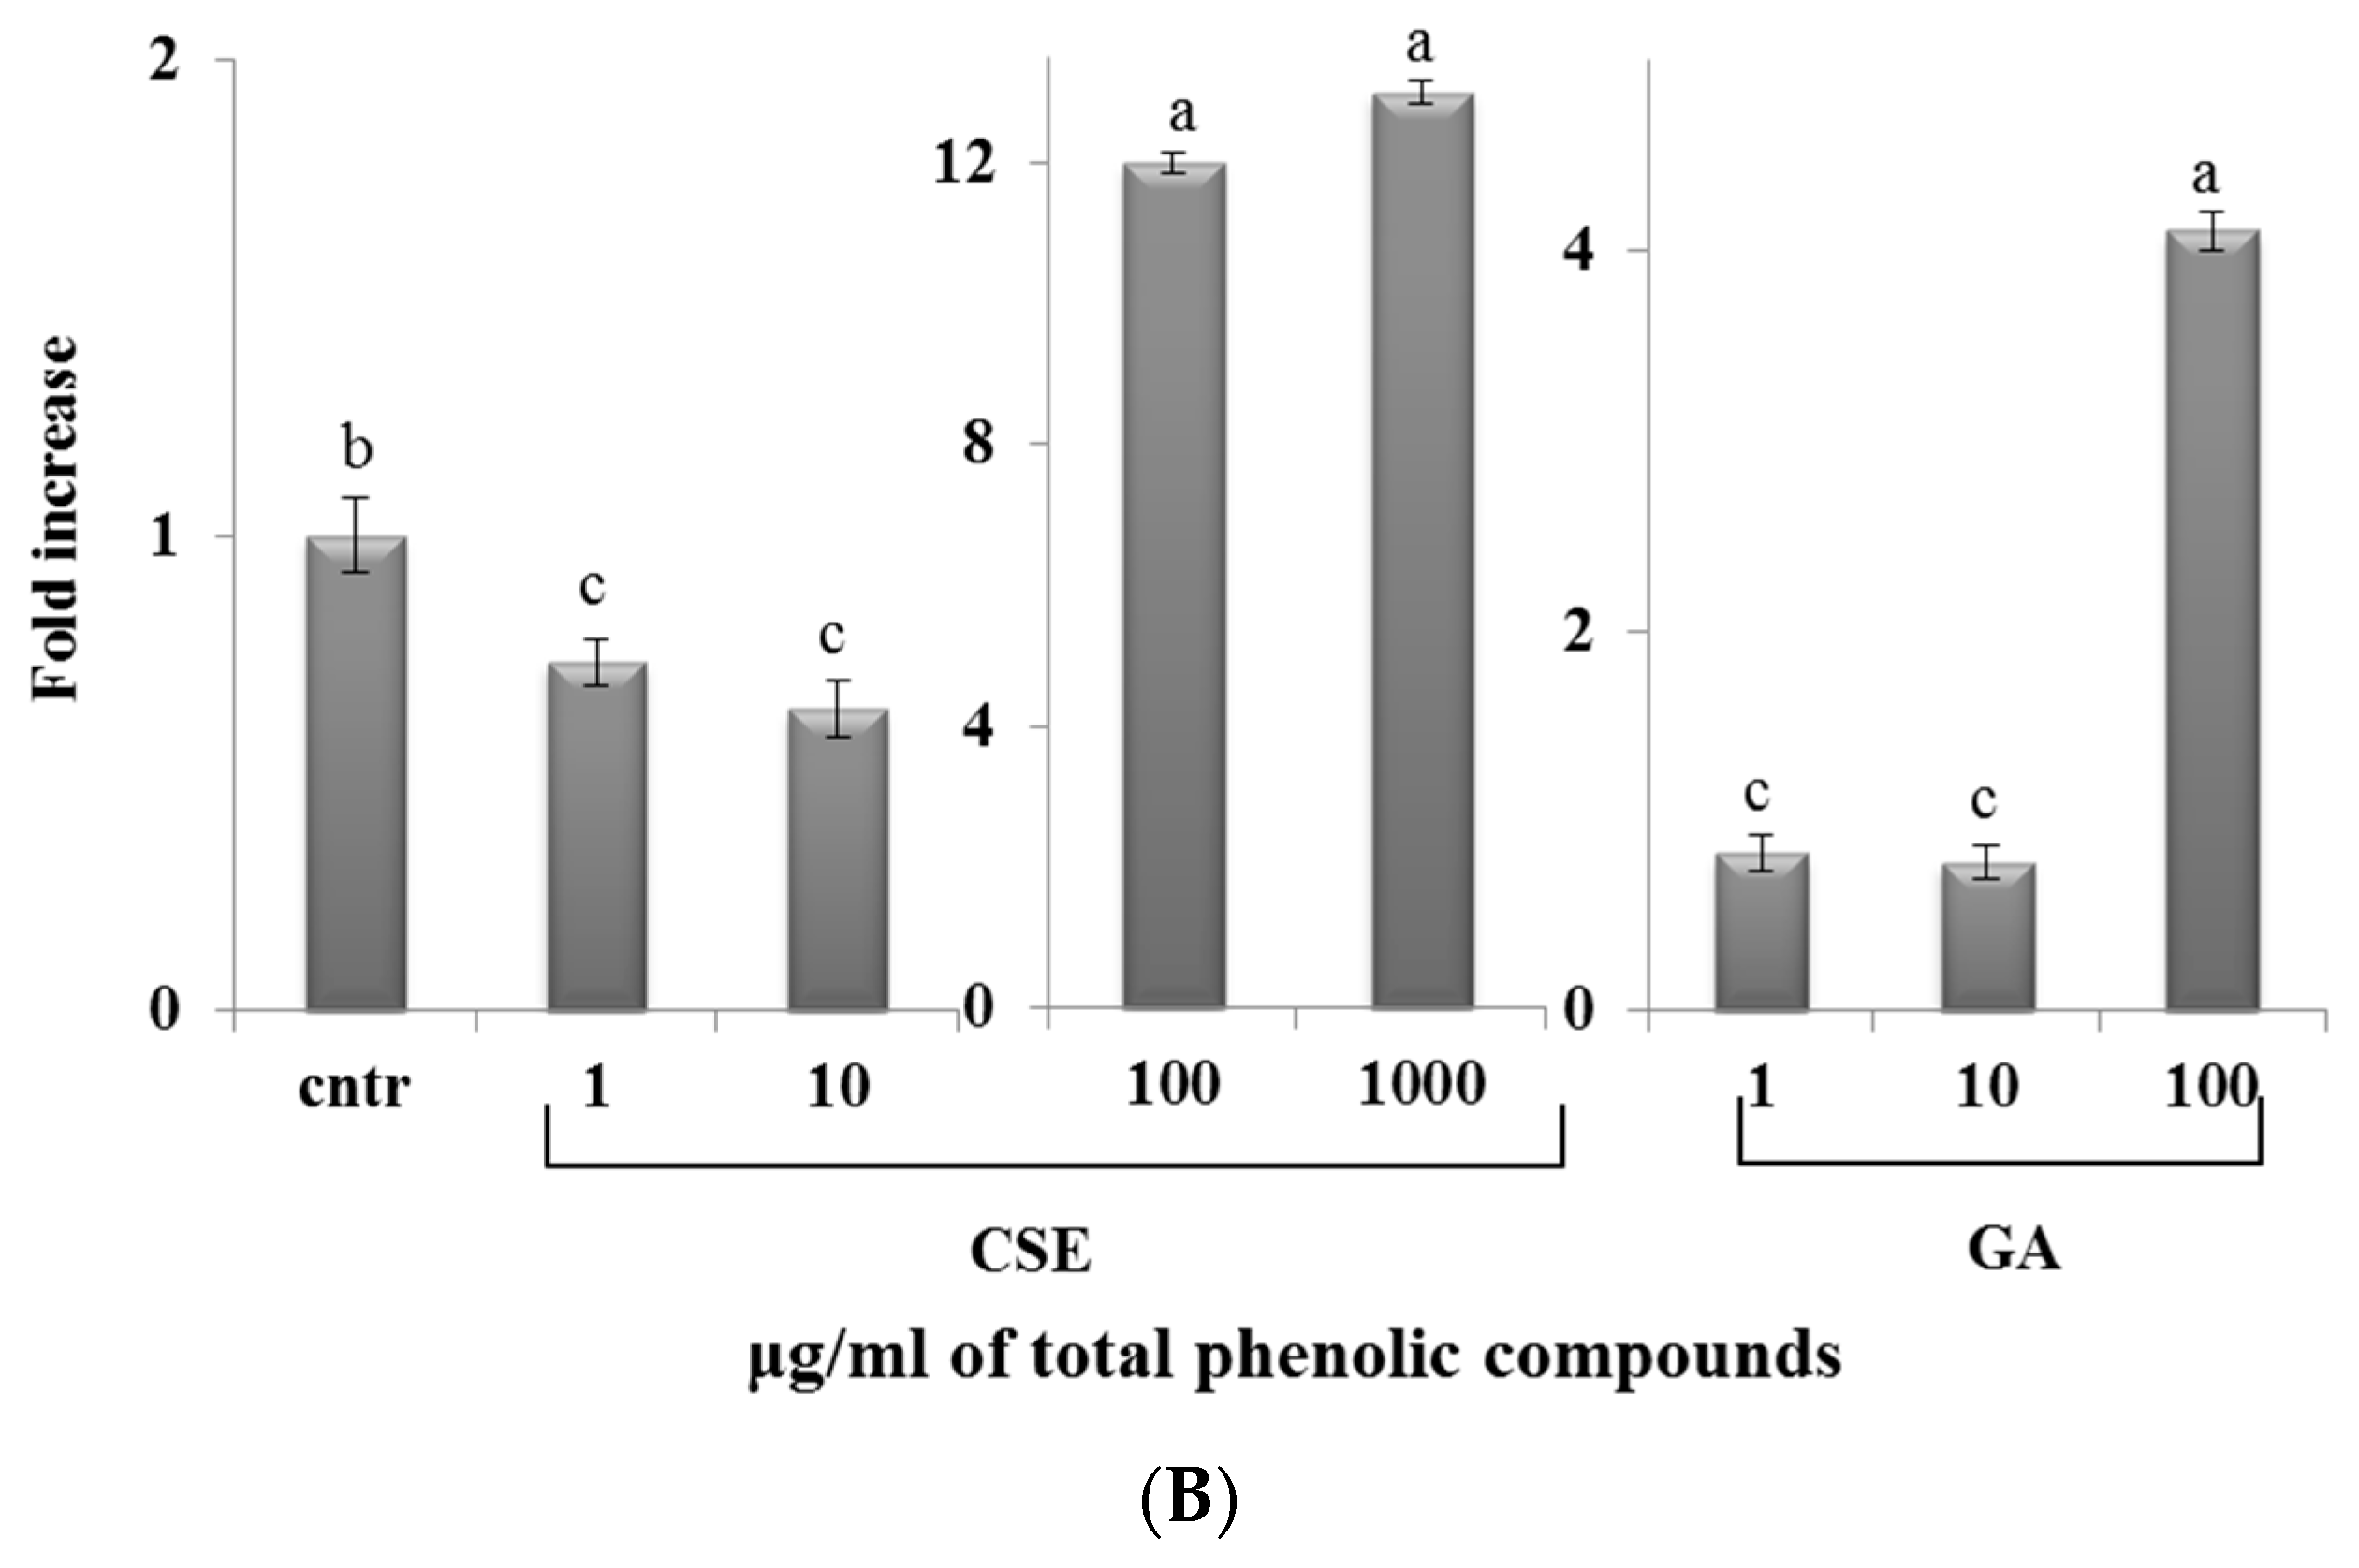
2.7. Effect of CSE on Phagocytosis

The phagocytosis assay (Figure 6) showed that, in both blood and intestinal non-adherent leukocytes, low doses of CSE (1 and 10 µg/mL) and GA (1 and 10 µg/mL) decreased phagocytic activity compared to the control. High doses of CSE (100 and 1000 µg/mL) and GA (100 µg/mL) increased phagocytic activity with respect to the control. The increase of phagocytosis induced by CSE at 100 µg/mL was three times higher with respect to GA at the same concentration.

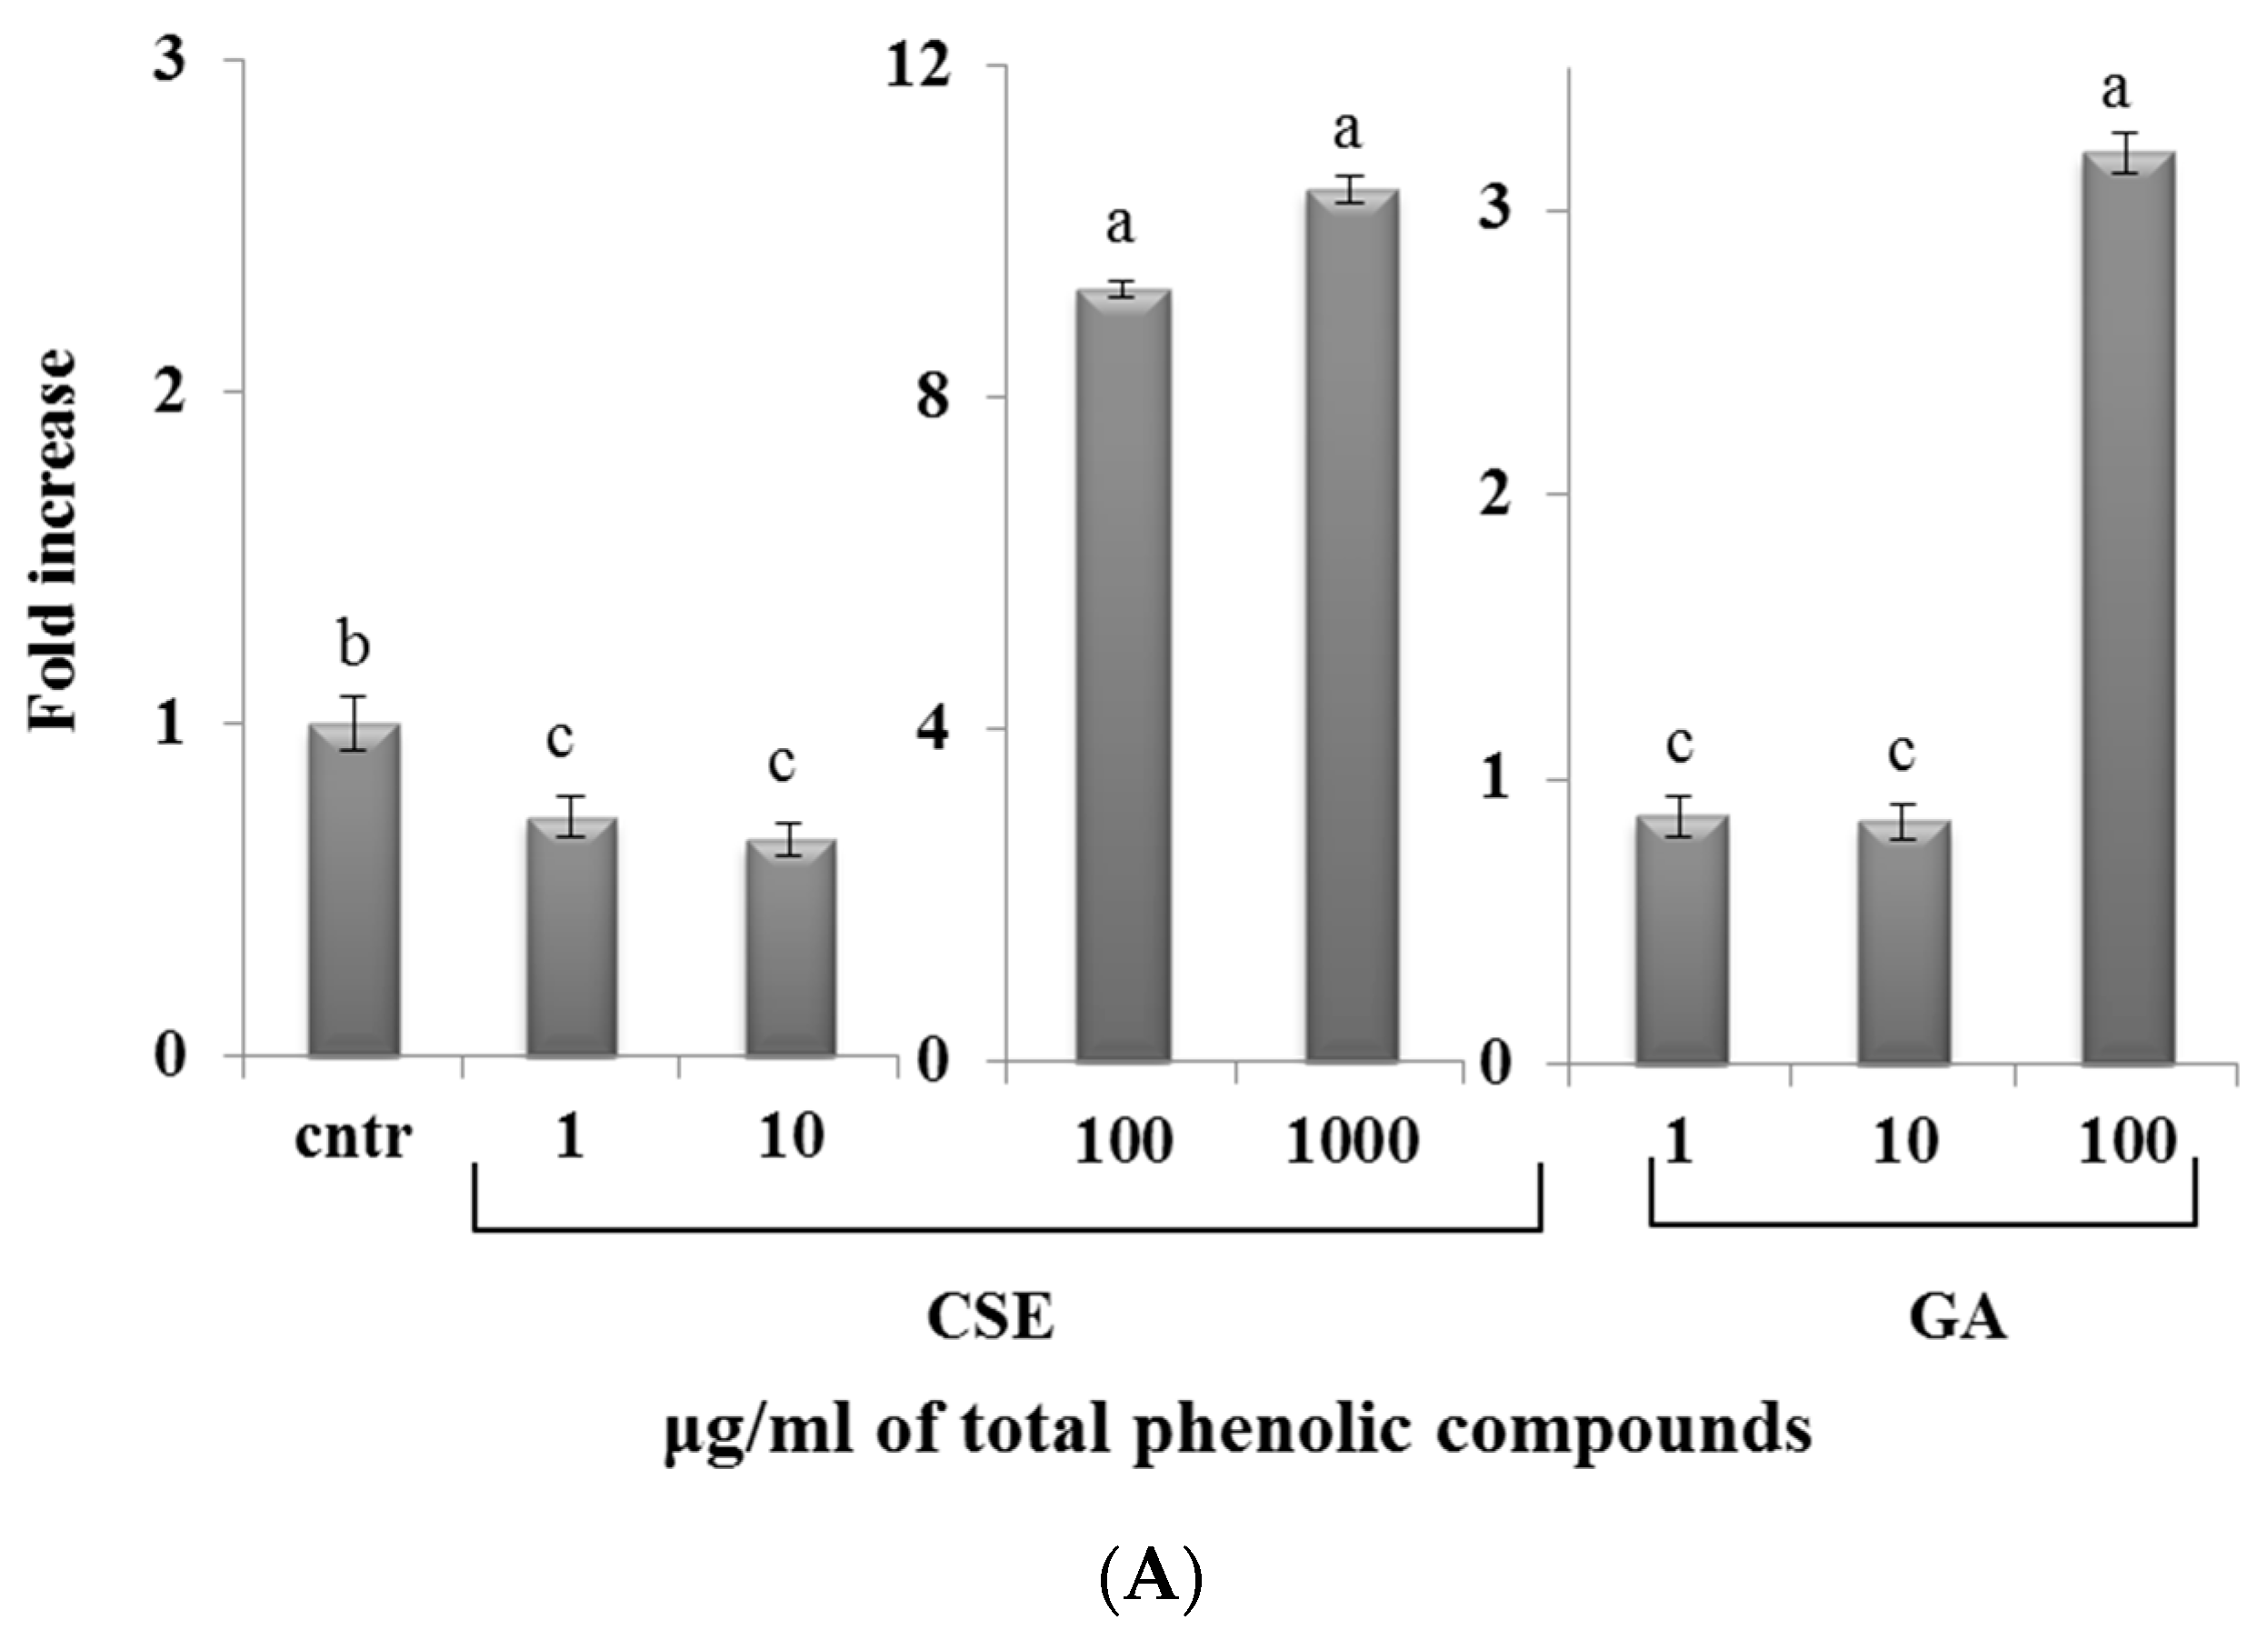
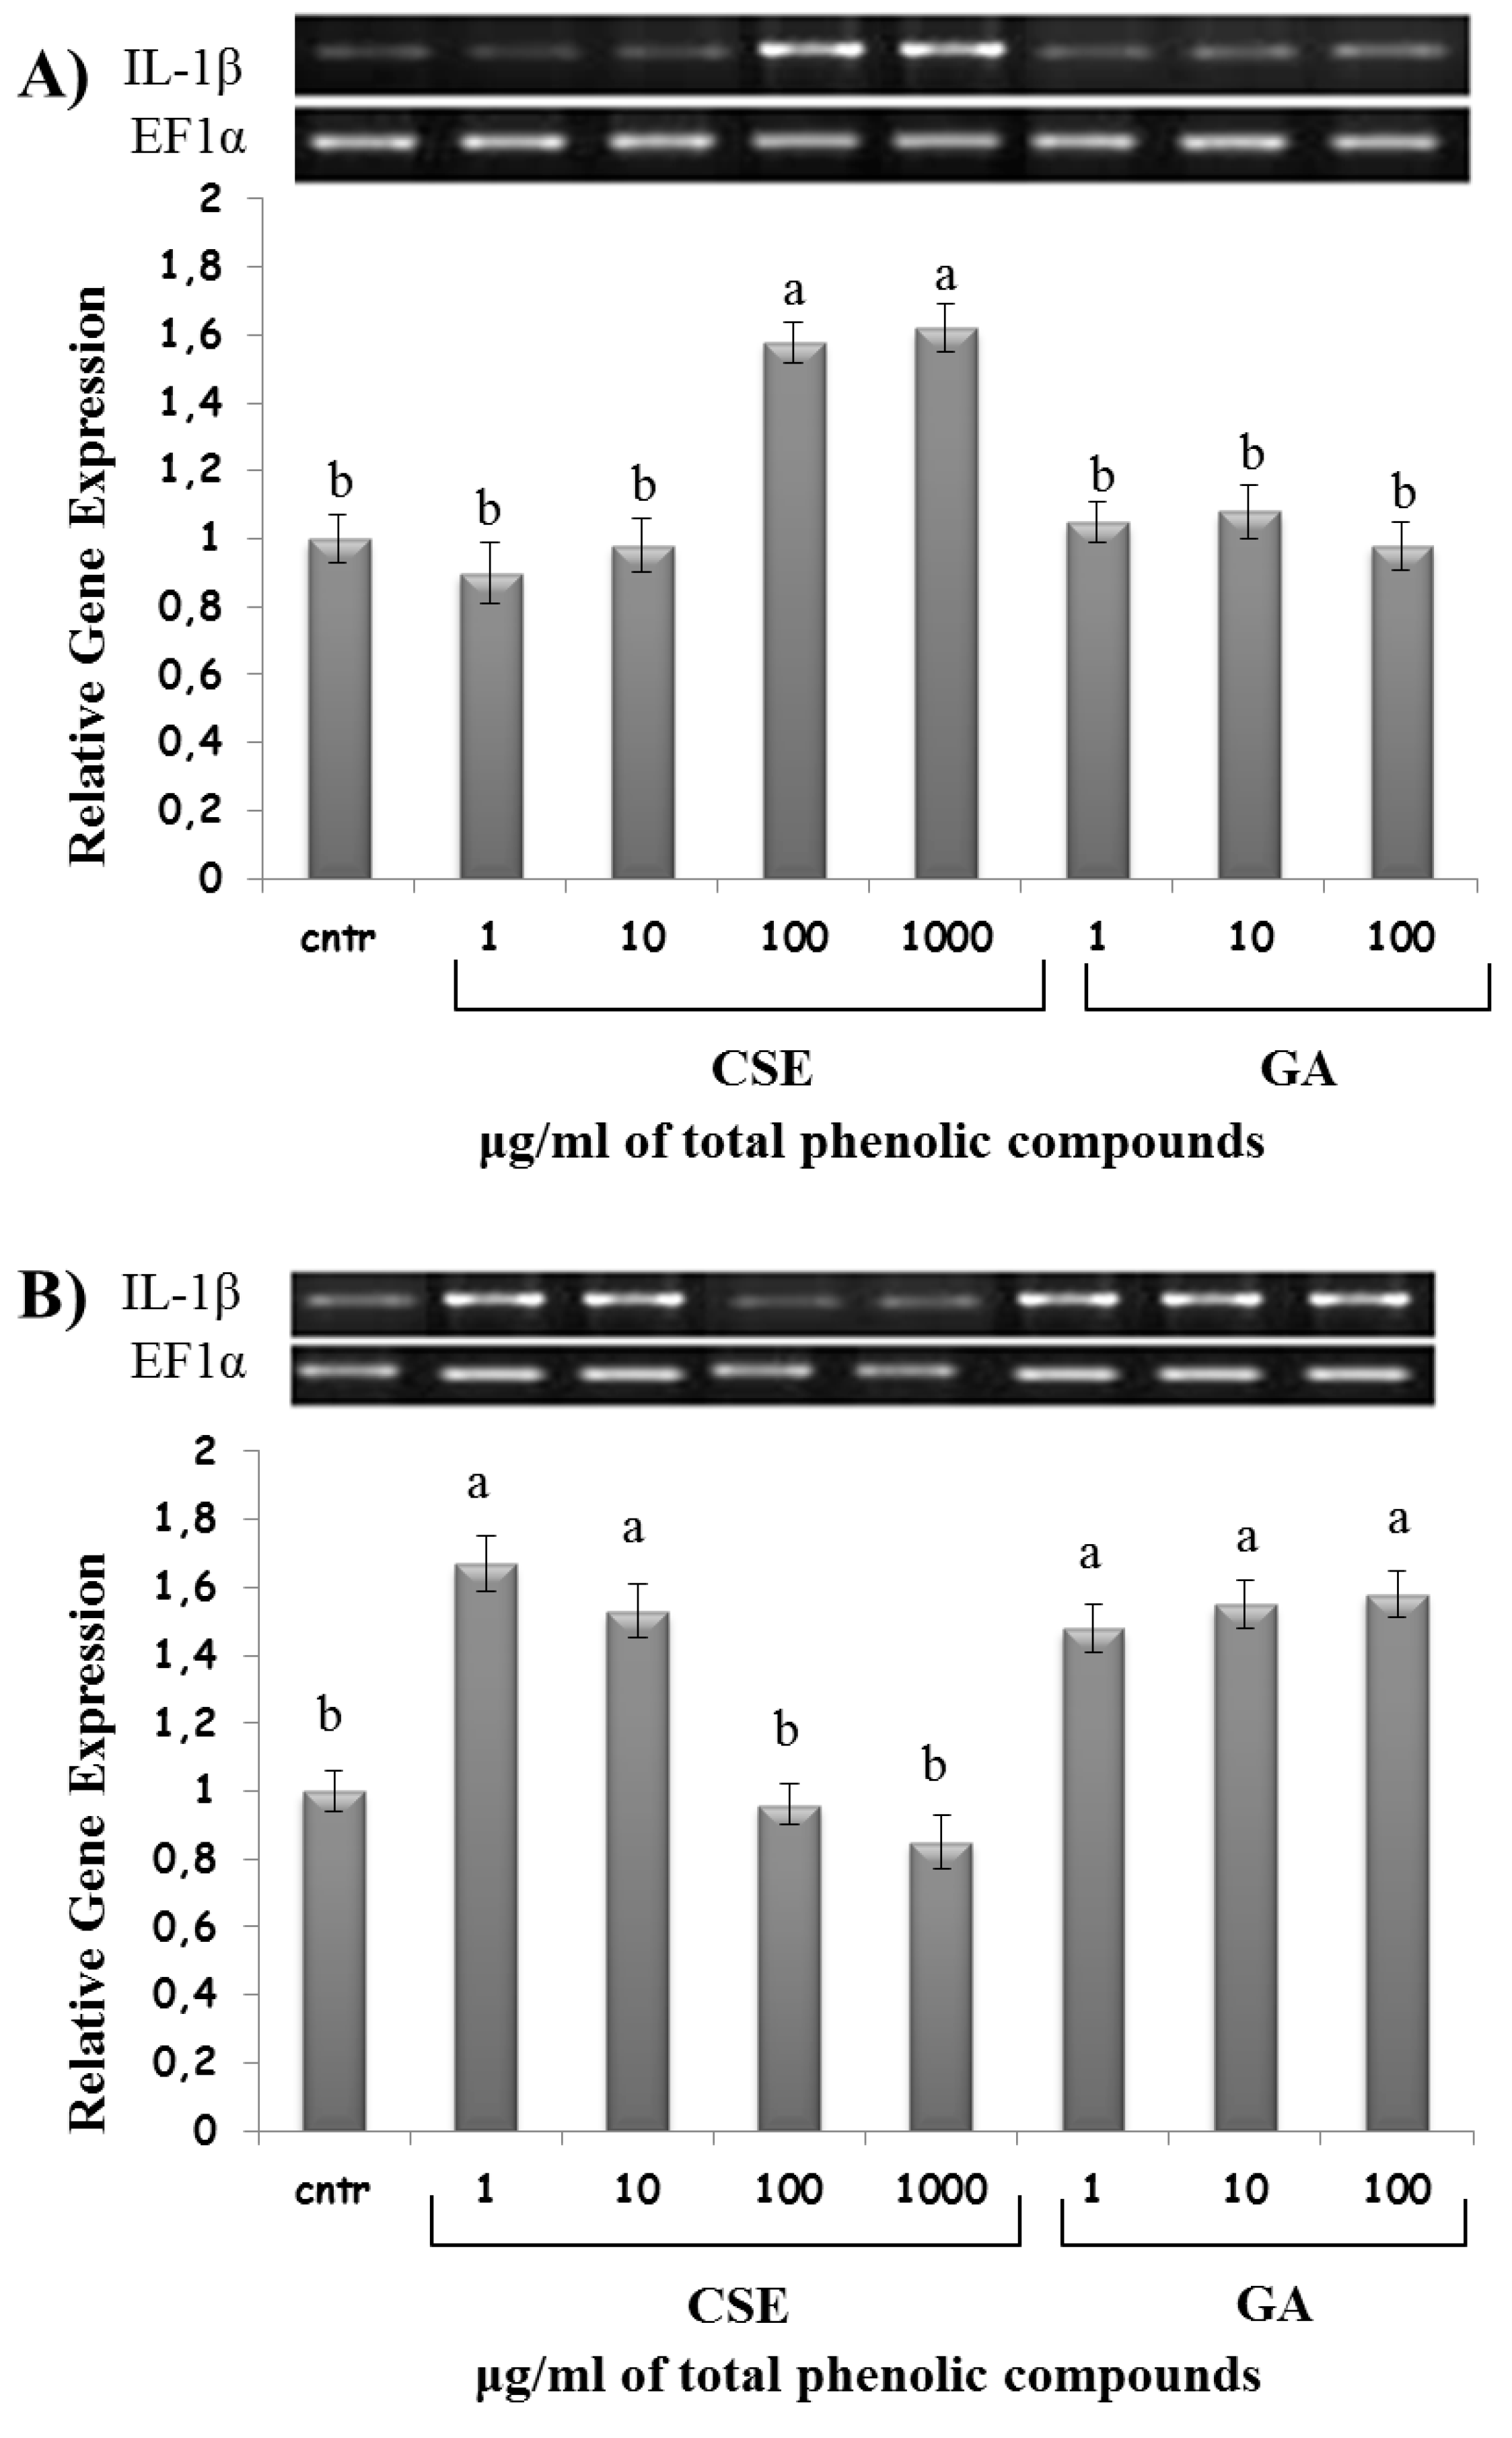
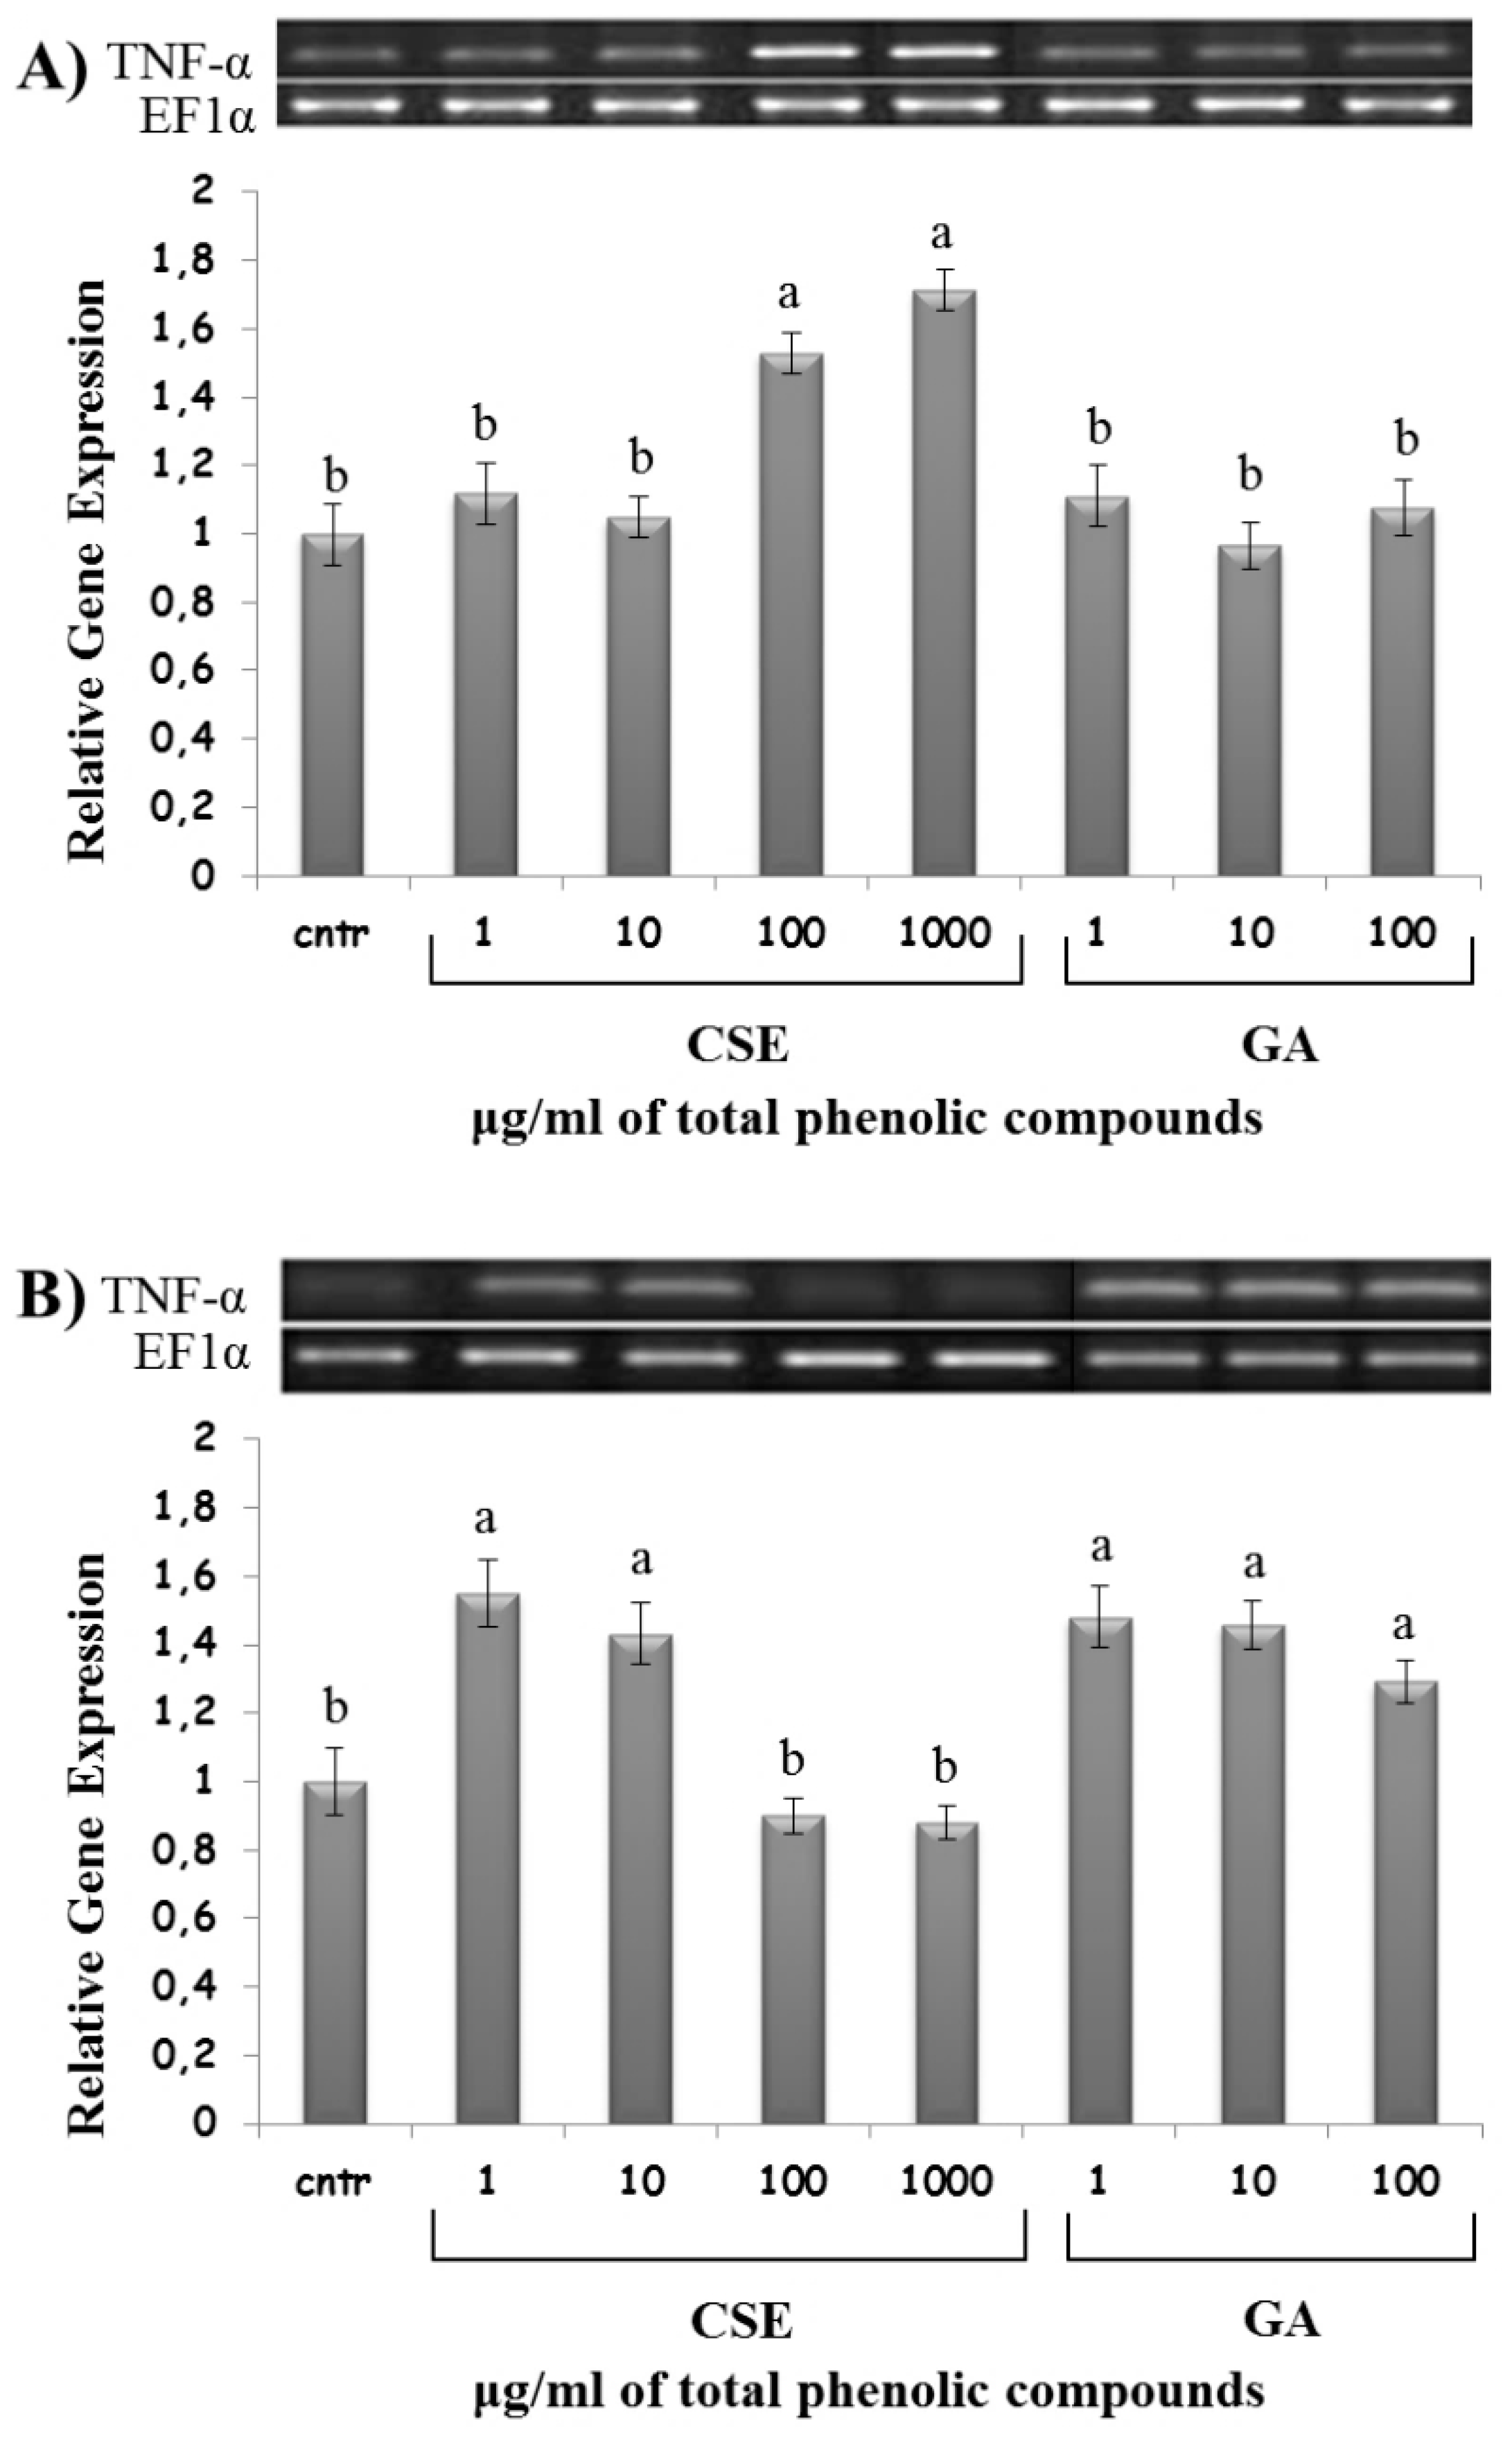
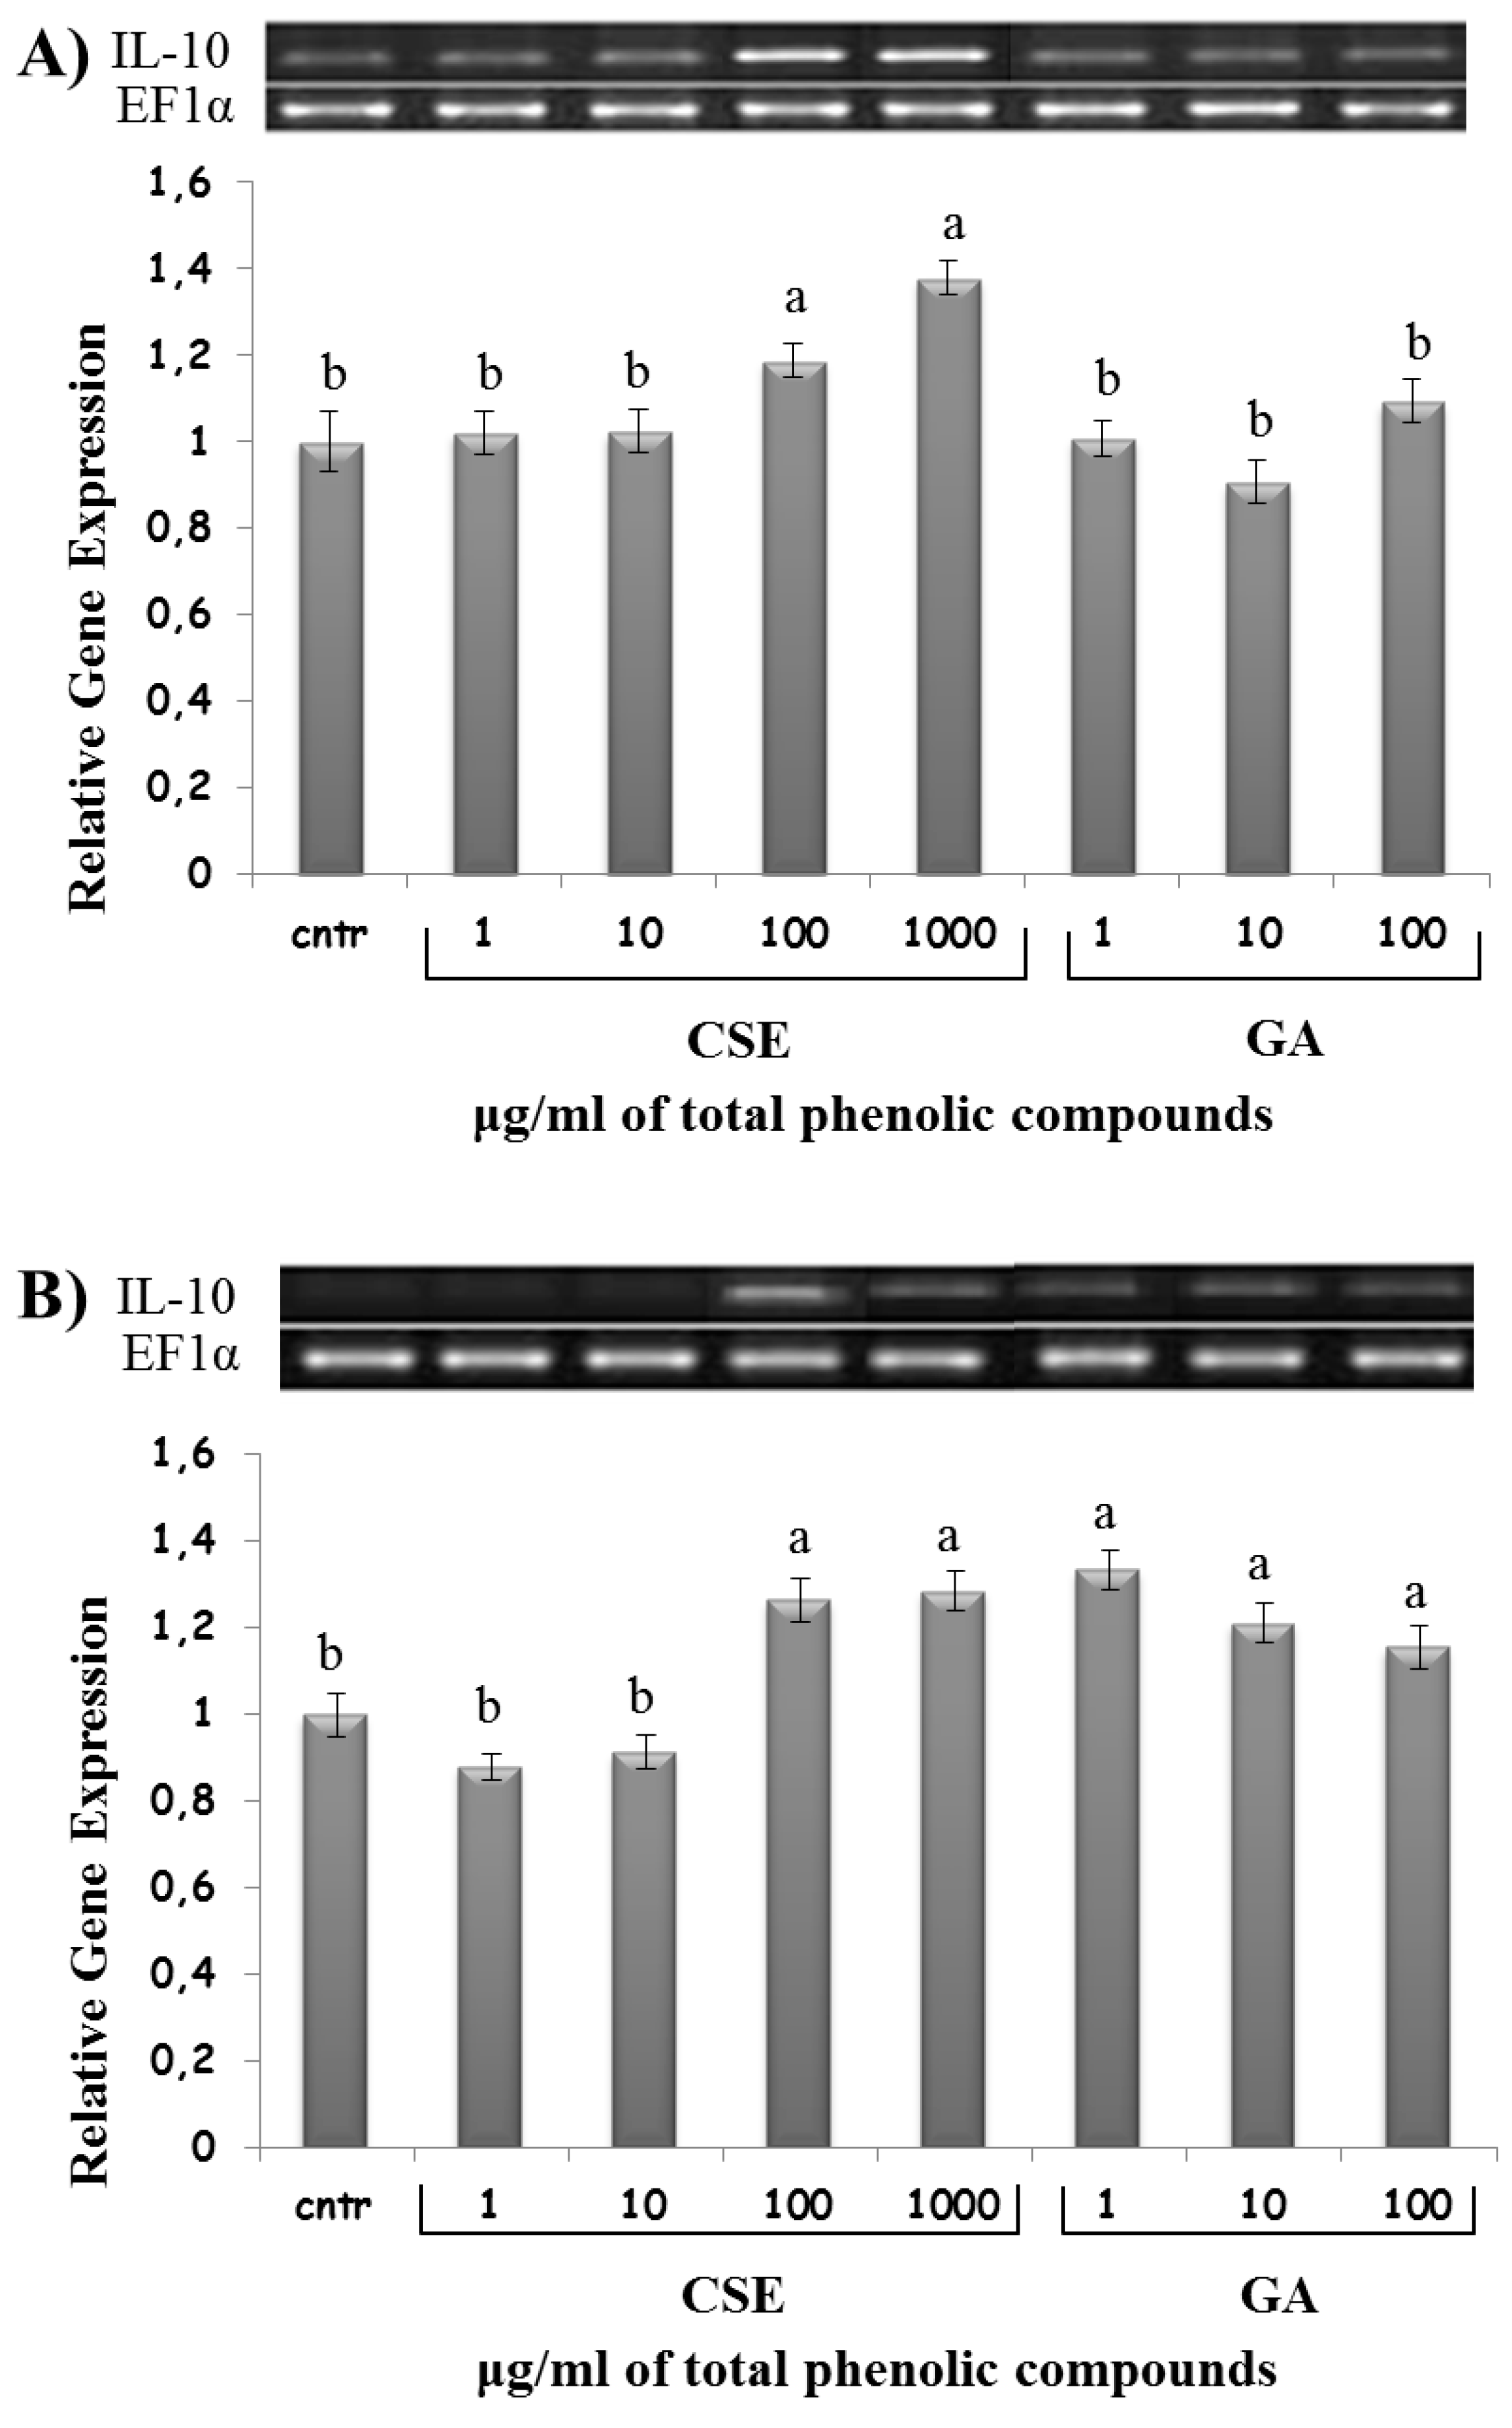
2.8. Effect of CSE on Cytokine Expression

High doses of CSE (100 and 1000 µg/mL) upregulated IL-1β and TNF-α expression in the intestinal intraepithelial non-adherent leukocytes, but not in the blood non-adherent leukocytes. On the contrary, low doses of CSE (1 and 10 µg/mL) upregulated IL-1β and TNF-α expression in blood non-adherent leukocytes, but not in the intestinal intraepithelial non-adherent leukocytes (Figure 7 and Figure 8). GA was ineffective on IL-1β and TNF-α expression in intestinal intraepithelial non-adherent leukocytes, but upregulated IL-1β and TNF-α expression in blood non-adherent leukocytes at all doses (Figure 7 and Figure 8).
High doses of CSE (100 and 1000 µg/mL) upregulated IL-10 expression in both intestinal and blood non-adherent leukocytes. GA was ineffective on IL-10 expression in intestinal intraepithelial non-adherent leukocytes, but upregulated IL-10 expression in blood non-adherent leukocytes at all doses (Figure 9).

3. Discussion

In this study, chestnut shell was extracted by different methods and tested for potential immune activity in the rainbow trout leukocytes. Several studies have highlighted the presence of bioactive molecules with antioxidant properties in chestnut byproducts that can be used in the manufacturing of health boosting-related products [26]. Thus, the recovery of bioactive molecules, mainly polyphenols, is an object of interest of the industries in the food, cosmetics, and energy sectors and more recently in the feed industry [20]. Under our extraction conditions, the recovery of the polyphenols ranged between 487.9 and 635.3 g/kg, a value comparable to Vázquez et al. [10] but higher than the one reported by Noh et al. [27]. One of the main drawbacks in the employment of polyphenols from sustainable sources, such as agro-food byproducts, is their variable concentration in extracts due to the variability in the raw material [28]. Moreover, the nature of the extraction solvent may significantly affect the amount of polyphenols extracted from a matrix, giving rise to different antioxidant activities [29]. Indeed, the polarity of the solvent used affects the solubility of polyphenols, with water and ethanol, among others, being suitable agents for the extraction of polyphenols from chestnut byproducts [30]. In this study, the choice fell to water and ethanol, since water is a biorenewable nontoxic solvent and ethanol is safe for human consumption [31]. The highest polyphenol content of the CSE was obtained with ethanol at room temperature for 3 h, in agreement with the literature reporting that many phenolic compounds are subjected to degradation or oxidation when exposed to high temperatures and long extraction periods [32].
As we reported in a previous study, high-performance liquid chromatography (HPLC) and gas chromatography-mass spectrometry (GC-MS) showed that in CSE the most abundant phenolic compounds were gallic and ellagic acids, as well as condensed oligomers containing catechin/epicatechin, epigallocatechin, and epicatechin gallate as monomeric units [22]. Since phenolic compounds are not the only components of the extracts, we employed attenuated total reflectance-Fourier transform infrared spectroscopy (ATR-FTIR), a classic and consolidated technique, to determine the matter composition of the CSEs. ATR-FTIR is a rapid, easy-to-use, and economical instrument. It provides information on the main vibrational bands, which are related to chemical composition and structure, and the samples do not require reagents and laborious pretreatments. ATR-FTIR spectra showed a substantial homogeneity of composition among CSEs, indicating that the extracts had equivalent chemical compositions and therefore similar properties. CSE is mainly composed of hydrolysable tannins, especially derivatives of gallic acid, as could be seen by the C-O stretching in the region between 1727 and 1700 cm−1 [23,24] and the absorption in other typical regions of the chestnut wood tannins (present data) [25]. Furthermore, the CSEs, but not the chestnut wood tannins, absorbed in a region (1283–1285 cm−1) in which the hydrolysable tannins do not absorb [33]. The stretching was due to the C–O of pyran, typical of flavonoid C-rings [25], and could be explained by the presence of the flavonoids in CSEs. CSEs also absorbed in the region 1144–1146 cm−1, typical of catechins present in chestnut shell extracts as monomers [34]. The peaks at 2918 and 2850 cm−1, typical of aliphatic hydrocarbons, were present in CSEs extracted with organic solvents, but not with water, and were probably due to residues of the organic solvent employed for the extraction. Similarly, the peaks were not present in the commercial samples of chestnut wood that were extracted with a patent-covered, water-based technology.
In this study, we first detected the content of CSE and GA in the rainbow trout non-adherent leukocytes, since this is an important starting point not only for carrying out in vitro experiments at appropriate conditions, but also when attempting to extrapolate from the in vitro to the in vivo situation. Both blood non-adherent leukocytes and intestinal intraepithelial non-adherent leukocytes were used. Blood leukocytes were purified and cultured in order to obtain non-adherent leukocytes. According to the morphological characteristics, the non-adherent leukocytes showed the general form of lymphocytes reported in the literature [35,36]. Intestinal intraepithelial leukocytes purified from rainbow trout intestinal epithelium constituted a rather homogeneous population of small round cells with typical lymphocyte morphology, in agreement with Bernard et al. [37].
Both CSE and GA were detectable in blood and intestinal non-adherent leukocytes after 15 min of incubation. A similar behavior has been shown by normal hepatic cells incubated with resveratrol, a natural polyphenol with potent protective properties [38].
This outcome is also in agreement with a study by Salucci et al. [39] showing that the time course of GA uptake in caco-2 cells was very rapid, with a peak within 10 min from the start of incubation. The same authors reported that GA was quickly metabolized in the cells, but did not exclude that less GA may have entered the cells due to its degradation in the medium. In this study, to exclude that the decrease of GA in the non-adherent leukocytes was not a consequence of GA degradation in the medium, we monitored GA concentration in the medium and found it to be stable for up to three hours of incubation, corroborating the hypothesis that GA could be readily metabolized. Thus, the GA presence in the non-adherent leukocytes after three hours of incubation may have reflected an ongoing uptake compatible with a theory of carrier-mediated transport along with passive diffusion for polyphenol uptake [38,39,40]. Thus, it is important to note that the mechanism of polyphenol transport through the cell membrane is under study. Among polyphenols, flavonoids have been shown to move across the cell membrane through multiple transporters, compatible with their hydrophilic nature, which makes passage through the lipid bilayer of the cell by diffusion rather uncertain [41]. However, the purpose of this study was not to investigate the mechanism of transport of CSE and GA, and thus further experiments will be necessary to confirm this aspect.
In both blood and intestinal non-adherent leukocytes, CSE and GA displayed ROS (reactive oxygen species) scavenger activities at low concentrations (1 and 10 µg/mL) and pro-oxidant effects at high concentrations (100 and 1000 µg/mL for CSE; 100 µg/mL for GA). In a cell, ROS or free radicals are natural byproducts of chemical processes, such as metabolism. The effective and efficient control and elimination of ROS is essential to ensure the right functioning and survival of cells and organisms. This task is performed by an antioxidant defense system represented by two components, both present in the cell: antioxidant enzymes and low-molecular-weight molecules. Antioxidant enzymes include catalase, superoxide dismutase, and glutathione reductase, among others, while the most common low-molecular-weight antioxidants are vitamins C and E (ascorbic acid and tocopherol, respectively), glutathione, carotenoids (Vitamin A or retinol), quinines, and some polyphenols [41,42]. However, polyphenols can also exert pro-oxidant activities, depending on their concentration and the nature of neighboring molecules [42,43]. Studies showing both beneficial and detrimental effects of antioxidants have alimented a controversy far from being settled. The conflicting results have depended on variability in the experimental conditions, such as in plant species, harvesting season, the type of solvents used for the extraction, and processes. Some authors have postulated that pro-oxidant effects have beneficial properties, since a mild degree of oxidative stress may bring about an increase in antioxidant defenses and xenobiotic-metabolizing enzymes, leading to cytoprotection effects, including the mitigation of certain types of cancer [43,44,45,46,47]. Therefore, it seems that it is not important for the cell to remove all the ROS, but to keep their levels under control, so as to optimize useful functions while reducing oxidative damage [45,46]. In this frame, the increase in ROS reported here should not be seen as negative, but on the contrary, it could be linked to the increase in phagocytosis. Phagocytic leukocytes, when appropriately stimulated, consume oxygen and produce toxic molecules, including ROS such as superoxide anions, in a process referred to as the respiratory burst, with the aim of killing the invading pathogens [47,48]. Respiratory burst and phagocytosis seem to be differently modulated by polyphenols depending upon their structure, concentration, way of administration, cellular localization, and concentration [48,49]. Phagocytosis in vertebrates has been recognized as a critical component of innate and adaptive immune responses to pathogens. Specialized phagocytes in teleosts are monocyte/macrophages and granulocytes, and recently phagocytic properties have also been attributed to teleost dendritic cells, lymphocytes, and thrombocytes [49,50]. In peripheral human blood lymphocytes, GA and ellagic acid have been found to have a strong antiradical activity, probably due to the presence in their structure of adjacent hydroxyl groups, three in GA and five in ellagic acid, thereby showing the structure –function correlation [50,51]. Chestnut shell extracts are largely composed of gallic and ellagic acid and hydrolyzable tannins, which may explain the higher activity shown in comparison to GA alone. Indeed, it has been demonstrated that extracts present better properties than pure molecules due to the additive and/or synergistic effects possessed by the components when they are present in a mixture [51,52,53].
The modulation of cytokines by polyphenols has been reported in the literature [53,54,55]. It has been observed that polyphenols are able to modulate the expression of different cytokines/chemokines in many cell types, such as mouse macrophages, human peripheral blood mononuclear cells [55,56,57], human mast cell line HMC-1 [57,58], and human monocyte cell line THP-1 [58,59]. These studies strongly support the idea that polyphenols have the capacity to modulate the immune response and have potential anti-inflammatory activity [53,54]. In our investigation, we examined the expression of two pro-inflammatory (IL-1β and TNF-α) and one anti-inflammatory (IL-10) cytokine in non-adherent leukocytes from blood and intestine.
We reported significant variations in the expression of these genes, although such changes were small, suggesting a limited potential for either an anti-inflammatory or pro-inflammatory effect of the biomolecules tested in this study. TNF-α is a proinflammatory cytokine expressed at an early stage of infection in fish, playing a key role in the regulation of inflammation: The cytokine IL-1β has functions that widely overlap with those of TNF-α [59,60]. TNF-α is also involved in many other processes, including the defense against microbial infections [60,61]. TNF-α stimulation results in the activation of NF-kB transcription factor, which in turn regulates a large number of immune, growth, and inflammation genes [61,62]. IL-10 is considered to have regulatory roles in immune responses. It is a cytokine with potent anti-inflammatory properties that play a central role in limiting the damage to a host induced by an excessive response, inhibiting the effect of pro-inflammatory cytokines, and inhibiting the activation of macrophages/monocytes, through which it controls cytokine synthesis [62,63]. The increase in IL-1β and TNF-α, respiratory activity, and phagocytosis in intestinal non-adherent leukocytes incubated with high concentrations of CSE was in agreement with the reported effects of such cytokines in the rainbow trout, turbot (Scophthalmus maximus), sea bream (Sparus aurata), goldfish (Carassius auratus), and catfish (Clarias gariepinus), where IL-1β and TNF-α increase respiratory activity, phagocytosis, and nitric oxide production through the activation of macrophages [63,64].
Upregulation of both pro-inflammatory and anti-inflammatory cytokines have been reported in a study carried out on the rainbow trout [64,65], where expression was related to the resolution of inflammation. It has been suggested that the release of pro-inflammatory cytokines is necessary to activate leukocytes to clear the phagocytized bacterial structures, while the production of anti-inflammatory cytokines turns off the inflammation process [65,66,67]. The contemporary effect of CSE on both pro-inflammatory and anti-inflammatory cytokines, although limited, seems to suggest an alert effect of the immune defense system against a possible infectious agent. Furthermore, it is worth noticing that the effect of CSE on the intestinal intraepithelial non-adherent leukocytes was evident only at high concentrations (100 and 1000 µg/mL), with the 100 µg/mL concentration corresponding to an in vivo dose of about 5–6 mg of polyphenols per day, compatible with dietary supplements used in aquaculture. Finally, GA did not seem to exert any effect on cytokine regulation in the intestinal non-adherent leukocytes, but only on blood non-adherent leukocytes, which also seemed to be more sensitive to low concentrations of CSE. It is difficult to find an explanation for this behavior that, although hypothetically, could have been related to the fact that the metabolites of polyphenols absorbed by the intestine are found in the blood (especially GA), where they exert their action on blood leukocytes coherently with an anti-inflammatory role for GA, as suggested by the increase in IL-10 [67,68]. Again, the less evident effect of GA in comparison to CSE could have been attributable to the additive and/or synergistic effects of polyphenols in the latter [51,52]. However, it is important to note that the definition of pro- and anti-inflammatory cytokines is based on a dichotomy that has been revealed to be too simplistic, in light of the numerous studies that have been conducted on man and animal models. In fact, a certain cytokine can show both pro- and anti-inflammatory activities. The variability in the properties of the cytokines produced may depend on numerous factors, such as the quantity and nature of the cytokines produced and their reciprocal relationships, the sequence in the synthesis, the type of target cell, the immunological situation, and the animal [68]. As an example, pro-inflammatory cytokines seem to be the most necessary in inducing an anti-infective response, even if their excessive production could be deleterious [69,70]. On the other hand, anti-inflammatory cytokines are essential in controlling the cascade of pro-inflammatory mediators, but their excessive production can be associated with severe immune depression [70,71]. Further studies will be necessary to clarify these aspects in trout.

4. Materials and Methods

4.1. Chemicals

Ethanol, methanol, water chromasolv® plus, histopaque, nitroblue tetrazolium (NBT), zymosan A from Saccharomyces cerevisiae, zymosan A Saccharomyces cerevisiae BioParticles® fluorescein conjugate, potassium hydroxide (KOH), dimethylsulfoxide (DMSO), ethylenediaminetetraacetic acid (EDTA), 1,4-dithiothreitol (DTT), methylthiazolyldiphenyl-tetrazolium (MTT), 2,2-diphenyl-1-picrylhydrazyl (DPPH), Folin & Ciocalteu’s phenol reagent, DNAse, penicillin, streptomycin, formic acid, paraformaldehyde (PFA), and gallic acid (GA) were purchased from Sigma-Aldrich (St. Louis, MO, USA). Commercial tannins obtained by a natural extraction process from chestnut wood (Silvafeed® TSP) were from SILVATEAM (Mondovì, CN, Italy). SuperScript® III Reverse Transcriptase, Express SYBR®GreenERTMqPCRSuperMix with Premixed ROX, and phosphate buffered saline (PBS) without calcium and magnesium were purchased from Thermo Fisher Scientific Inc. (Monza, Italy). Both RPMI and PBS were purchased from Lonza, MS-222 was purchased from MP Biomedicals (Aurora, OH, USA).

4.2. Chestnut Shell Extract (CSE) Preparation

Chestnut shells were provided by a local company (Petretta Maria srl—Volturara Irpina, Avellino, Italy), and 50 mL of solvent were added to 5 g of samples finely powdered. Preliminary experiments using four different extraction methods with two extracting solvents (ethanol and water) were carried out: (1) ethanol (100%) for 5 h at 90 °C (in a Soxhlet apparatus); (2) ethanol 100% for 3 h at room temperature (RT); (3) ethanol 70%-water 30% for 3 h at RT; (4) water 100% for 3 h at 75 °C. The extracted material was recovered by vacuum filtration, and the solvent was evaporated in a rotary evaporator (Mod. Hei VAP Value; Heidolph, Schwabach, Germany). The residue was placed in a dryer and weighed up to a constant value, and the extraction yield was calculated as the percentage weight loss of the starting material. The possible presence of bacteria and fungi in the extracts was checked by using agar media with negative results.

4.3. Total Polyphenol Content and Antioxidant Activity of CSE

Total polyphenol content was determined by the Folin–Ciocalteu method [72,73]. Folin–Ciocalteu reagent (2.5 mL) previously diluted with water (1:10, v/v) and 2 mL of a 75-g/L aqueous solution of sodium carbonate were added to 0.5 mL of an aqueous solution of the CSE. The mixture was kept for 5 min at 50 °C and, after cooling, the absorbance at 760 nm was measured. Total polyphenol content was calculated as the GA equivalent (GAE) from the calibration curve of GA standard solutions (2–40 g/mL) and was expressed as GAE/mg of extract (on a dry basis). The analyses were done in triplicate, and the mean value was calculated.
The antioxidant activity of CSE was evaluated as antiradical activity by using the DPPH method, as reported in Sorice et al. [22]: 100 mg of each extract was added to 2.4 mL of 0.0004% DPPH in methanol, and the absorbance was measured at 517 nm until the reaction reached a plateau. Antiradical activity was expressed as a percentage of inhibition (% I) of the sample (As) compared to the initial concentration of DPPH (Ac) according to the equation % I = [(Ac − As)/Ac] × 100. The analyses were done in triplicate, and the mean value was calculated. Total polyphenols and antioxidant activity are reported in Table 1.

4.4. High-Performance Liquid Chromatography (HPLC) of CSE

A ThermoFisher mod. A surveyor HPLC system equipped with a pump, a degasser, a thermostatic autosampler, and a photodiode array detector (DAD) was used for the qualitative and quantitative analysis of CSE, as reported in Sorice et al. [22]. Briefly, the separation was carried out in an Ultra Phenyl (150 × 4.6 mm, 5-µm pore size: 100 Å) Resteck column. The binary mobile phase consisted of acetonitrile (solvent A) and water containing 2% acetic acid (solvent B). The system was run with a gradient program: 95% B for 10 min, 95% to 60% B in 35 min, 60% B to 45% B in 10 min, and 45% B to 95% B in 10 min. The flow rate was 1.0 mL/min, and the total run time was 65 min.

4.5. Attenuated Total Reflectance-Fourier Transform Infrared (ATR-FTIR) Analysis of CSE

ATR-FTIR analysis was performed using a Spectrum 400 spectrophotometer (PerkinElmer, Waltham, MA USA) equipped with a deuterated tri-glycine sulphate (DTGS) detector. Powdered dried samples of CSE (ethanol 100% for 5 h at 90 °C; ethanol 100% for 3 h at RT; ethanol 70%-water 30% for 3 h at RT; water 100% for 3 h at 75 °C) and chestnut wood tannins (SILVATEAM) were analyzed without any previous treatment and placed directly on the germanium piece of the infrared spectrometer, with a constant pressure of 70 ± 2 psi applied. The FTIR spectra were recorded in the mid-IR region (4000–650 cm−1) at resolutions of 4 cm−1 with 32 scans. The air background spectrum was recorded before each sample, and all samples were analyzed at least three times. Prior to data analysis, each spectrum was baseline-corrected, and the absorbance was normalized so that peak absorbance of the most intense band was set to unity.

4.6. Experimental Fish

Adult rainbow trout weighing 500–600 g were used for this study. The fish were obtained from a local dealer (Di Mella, Santacroce del Sannio, Benevento, Italy) and allowed to acclimate in a recirculating water system tank at 12 °C for 24 h before sacrifice. Fish were euthanized by immersion in MS-222 80 mg/L (LC50 > 200 mg/L). The fish used in this study were treated in accordance with European Commission recommendations 2007/526/EC and 2010/63/UE on the revised guidelines for the accommodation and care of animals used for experimentation and other scientific purposes. This study was carried out in strict accordance with the recommendations in the “Guide for the Care and Use of Laboratory Animals of the Biogem Consortium, Ariano Irpino, Italy”. The protocol was approved by the Committee on the Ethics of Animal Experiments of the same consortium. Water parameters and environmental conditions were as stated in the European Commission recommendations 2007/526/EC and 2010/63/UE. All efforts were made to minimize fish suffering.

4.7. Cell Culture

Leukocytes from blood were isolated according to Mariano et al. [73,74]. Briefly, blood was withdrawn from the caudal vein using a syringe previously rinsed with heparin. Blood was diluted 1:5 with RPMI and centrifuged at 200 × g for 10 min at 4 °C. The pellet was diluted 1:50 with RPMI and layered onto histopaque (1.077 g/L) and then centrifuged at 300 × g for 25 min at 4 °C. Leukocytes were harvested from the interface and washed with RPMI by centrifugation at 300 × g for 10 min at 4 °C. Isolated leukocytes were cultured with L-15 (Liebovits Medium, Sigma-Aldrich (St. Louis, MO, USA).) supplemented with 10% fetal bovine serum (FBS, Gibco, Germany), 2 mM l-glutamine, 100 µU/mL penicillin, and 100 µg/mL streptomycin (Invitrogen, Carlsband, CA, USA), and were incubated at 18–20 °C overnight. The following day, non-adherent leukocytes (mainly lymphocytes) were collected and washed with PBS 1×, while adherent leukocytes (mainly macrophages) were discarded. Only non-adherent leukocytes were used in the following experiments. The extraction of intestinal intraepithelial leukocytes was carried out according to McMillan and Secombes [74,75], with few modifications. Briefly, postcecal intestine was withdrawn, cut longitudinally, and washed with PBS (without calcium and magnesium) containing 200 U/mL penicillin and 200 µg/mL streptomycin. The intestine was scraped on the ice and cut into small pieces; it was incubated with a modified Hank’s-balanced salt solution lacking Ca2+ and Mg2+ (at pH 7.2) and containing 1 mM 1,4-dithiothreitol and 1 mM EDTA (at pH 7.4);.and finally placed onto a shaker at 120 rpm for 1 h at 20 °C. The supernatant was collected and filtered with a 100-µm nylon filter (millipore) and centrifuged at 400× g for 10 min at 4 °C. Leukocytes were purified by Nylon Wool Fiber Columns (Polysciences Europe GmbH, Hirschberg an der Bergstrasse, Germany) according to Komatsu et al. [75,76]. Non-adherent leukocytes from both blood and intestine were suspended in PBS and counted by cell counter (Casy® Cell Counter and Analyser System Model TT, Roche Innovatis AG, Bielefeld, Germany). Leukocyte purity was checked after smearing and staining with MGG-Quick (04—090805, Bio-Optica, Milan, Italy).

4.8. Cytotoxicity Assay

The effect of CSE on trout non-adherent leukocytes was determined by the MTT test, as described in Reference [76]. In all experiments, GA was employed as a reference standard. After exposure to 1, 10, 100, and 1000 µg/mL of CSE (the concentration refers to the total polyphenols contained in the chestnut shell extract) (all CSE extracts were used in the in vitro experiments with consistent results, and therefore we refer to them in this manuscript as CSE) and 1, 10, 100, and 1000 µg/mL of GA for 24 h at 20 °C, non-adherent leukocytes were added with 5 mg/mL of MTT for 4 h at 27 °C. Subsequently, the medium was removed, and dimethyl sulfoxide was used to dissolve the violet crystals. A microplate reader (Model 680 Biorad) was used to measure the absorbance at a wavelength of 570 nm. Since GA was found to be toxic at 1000 µg/mL, this concentration was omitted in the following experiments.

4.9. Cellular Content of Polyphenols

To assess if polyphenols enter the cell, non-adherent leukocytes from blood and intestine (106 cells/well) were incubated with 10 µg/mL of CSE and 10 µg/mL of GA dissolved in DMSO for 15, 60, and 180 min. A negative control was carried out simultaneously with the DMSO. The final concentration of DMSO in the incubation medium was 0.0001% v/v both for treated and control samples. After treatment, non-adherent leukocytes were washed in PBS. The cell suspension was washed three times with PBS or until the supernatant was devoid of GA (as verified by HPLC analysis), and was subsequently lysed by sonication. Non-adherent leukocytes were then extracted twice with 1 mL of methanol and centrifugation at 14,000 x g for 2 min. The organic phase was evaporated under a stream of nitrogen and suspended in HPLC mobile phase. The experiment was performed in triplicate and repeated three times. Polyphenol analysis was performed by LC-4000 Series Integrated HPLC Systems (JASCO Corporation 2967-5 Ishikawamachi Hachioji-shi Tokyo Japan) consisting of a column oven (model CO-2060 plus) set at 30 °C, a UV/Vis Photodiode Array Detector (model MD-2018 plus), an Intelligent Fluorescence Detector (model PF-2020 plus), a liquid chromatography pump (model PU-2089 plus), an Autosampler (AS-2059 plus), and the ChromNAV software program (JASCO Corporation 2967-5 Ishikawamachi Hachioji-shi Tokyo Japan). A C18 Luna column with a 5-µm particle size and a 25 cm × 3.00-mm I.D. (Phenomenex, Torrance, CA, USA) was used, with a guard cartridge of the same material. All solvents were filtered through a 0.45-µm filter disk (Millipore Co., Bedford, MA, USA). The mobile phase was composed of water–formic acid (99.80:0.20, v/v) (solvent A) and methanol (solvent B). The specific elution conditions were 0–6 min, 35% B; 6–9 min, 35%–60% B; 9–14 min, 60%–80% B. Each run was followed by 5 min of washing with 100% B. The system was equilibrated between runs for 10 min using the starting mobile phase composition. Each sample was analyzed at least twice. The flow rate was 0.8 mL/min. The injection volumes were 20 µL. The fluorescence detector was designed to provide high selectivity and sensitivity for GA. It was set at a wavelength of 278 absorbance and 366 emission. GA concentration in the cells and in the medium was extrapolated by constructing a standard curve of serial dilutions of GA.

4.10. Superoxide Anion Production Assay

Superoxide production was determined as the reduction of NBT according to Mariano et al. [73,74], with some modifications. Briefly, non-adherent leukocytes from blood and intestine (at a density of 400,000 cells/well) were cultured with 1, 10, 100, and 1000 µg/mL of CSE and 1, 10, and 100 µg/mL of GA incubated at 20 °C for 3 h. A negative control was carried out simultaneously with the DMSO. Both the non-adherent leukocytes pretreated with the extracts and the control leukocytes were then incubated with PBS containing NBT (1 mg/mL) and zymosan A (2000 µg/mL) for 90 min. Following incubation, non-adherent leukocytes were washed and centrifuged at 500 x g for 10 min at 4 °C in PBS twice. The intracellular formazan was dissolved in 120 µl of 2-M KOH and 140 µl of DMSO, and the resulting color reaction was measured with a microplate reader (Model 680 Microplate Reader, Biorad, Segrate MI, Italy) at a wavelength of 620 nm.

4.11. Phagocytosis Assay

The phagocytosis of zymosan A fluorescein conjugate by rainbow trout non-adherent leukocytes was measured by flow cytometry according to Reyes-Becerril et al. [77,78], with some modifications. Briefly, cells (106 cells/well) were cultured in a 96-well microplate and treated with 1, 10, 100, and 1000 µg/mL of CSE and 1, 10, and 100 µg/mL of GA for 3 h. A negative control was carried out simultaneously with the DMSO. To stimulate phagocytosis, cells were incubated for 30 min with particles of zymosan A fluorescein conjugate at a cell/zymosan ratio of 1:10 at 20 °C. Thereafter, the samples were placed on ice, and 400 µl of ice-cold PBS was added to each sample to stop phagocytosis. The fluorescence of the extracellular zymosan particles was quenched by adding 40 µl of ice-cold trypan blue (0.4% in PBS). All samples were mixed gently and studied in a flow cytometer to analyze the phagocytic cells. All flow cytometry results were analyzed with FACSuite Software v.1.0.5.3841 (BD Biosciences). Four replicates were prepared and were each assayed in triplicate. The results were expressed as phagocytic activity, considered to be the percentage of cells with internalized particles of zymosan A fluorescein conjugate within the phagocytic cell population. The relative number of ingested zymosan particles per cell (phagocytic capacity) was assessed in arbitrary units from the mean fluorescence intensity of the phagocytic cells.

4.12. qPCR

Cells (106 cells/well) were cultured in a 96-well microplate and treated with 1, 10, 100, and 1000 µg/mL of CSE and 1, 10, and 100 µg/mL of GA for 3 h. A negative control was carried out simultaneously with the DMSO. Afterwards, to stimulate inflammation, the cells were incubated with PBS containing zymosan A (2000 µg/mL) for 30 min [78,79,80]. Non-adherent leukocytes were then washed and centrifuged twice at 500 x g for 10 min at 4 °C in PBS. Total RNA from non-adherent leukocytes of blood and intestine was isolated and quantified with a Nanodrop 1000 Spectrophotometer (Thermo Fisher Scientific, Waltham, Massachusetts, USA) using an SV Total RNA Isolation System (Promega Corporation, Madison, WI, USA). Reverse transcription was performed using 1 µg of total RNA (previously treated with DNAse), oligo dT primers, and SuperScript® III Reverse Transcriptase. In addition, cDNA preparations of non-adherent leukocytes from blood and intestine were used in PCR amplifications. Gene-specific primers for IL-1β (AJ223954.1), TNF-α (AJ278085.1), IL-10 (AB118099.1), and EF1α (AF498320.1) were designed according to the data reported in the literature [80,81,82] as follows: IL-1β F-5′ GCTGGAGAGTGCTGTGGAAGAACATATAG 3′ and R-5′ CCTGGAGCATCATGGCGTG 3′; TNF-α F-5′ CAAGAGTTTGAACCTCATTCAG 3′ and R-5′ GCTGCTGCCGCACATAAAG 3′; IL-10 F-5′ CGACTTTAAATCTCCCATCGAC 3′ and R-5′ GCATTGGACGATCTCTTTCTT 3′; EF1α F-5′ CATTGACAAGAGAACCATTGA 3′ and R-5′ CCTTCAGCTTGTCCAGCAC 3′. PCR amplification was carried out in a Helix Thermal Cycler (Diatech Pharmacogenetics S.R.L., Jesi AN, Italy). PCR conditions consisted of denaturation at 95 °C for 5 min, followed by 35 cycles of denaturation at 95 °C for 30 s; annealing at 60 °C for 30 s; and extension at 72 °C for 30 s. A final elongation step was performed at 72 °C for 10 min. The PCR product was separated by 2% agarose gel electrophoresis with ethidium bromide and visualized with a Chemidoc UV transilluminator. The quantification of PCR products was performed by densitometric analysis using Quantity-One software (Biorad, Segrate MI, Italy). All samples were normalized to the housekeeping gene, EF1α. Real-time reactions were carried out on a 7900HT Real-Time PCR System (Applied Biosystem, Foster City, CA, USA) using Express SYBR®GreenERTMqPCRSuperMix with Premixed ROX as a reference dye in a total volume of 20 µL per reaction. The primers were the same as those used in the semiquantitative PCR. Each reaction contained 10 µL of SYBR Green mix, 0.4 µL each of forward and reverse primer (10 µM), and 4 µL of 10× diluted cDNA. The thermal program included 2 min at 95 °C and 40 cycles of 95 °C for 15 sec and 60 °C for 1 min. Each reaction was run in duplicate. A no-template control and dissociation curve were performed to confirm the specificity of the assays. A dilution series was prepared to ensure the efficiency of the reactions. All samples were normalized to the housekeeping gene, EF1α. Data were analyzed using the 2ΔΔCt method to calculate relative expression levels.

4.13. Statistical Analysis

Data were analyzed by one-way analysis of variance (ANOVA) at a significance level of 0.05, following confirmation of normality and homogeneity of variance. Where significant differences were detected by ANOVA, data were subjected to Duncan’s multiple range test. All values were reported as mean ± SD, and all analyses were carried out with the statistical software Statistica version 7.0 (Statsoft Inc., Tulsa, OK, USA).

5. Conclusions

In conclusion, the findings of this study demonstrate that CSE was able to modulate immunological parameters in the blood and intestinal non-adherent leukocytes of rainbow trout and sustain the anti-inflammatory role exercised by bioactive molecules, among which were polyphenols, in fish [71,83]. Certainly, part of the biological activity could be ascribed to the presence in CSE of GA and derivatives, whose anti-inflammatory, antioxidant, antiviral, and anticancer properties are known [72,83,84]. Nevertheless, our results indicate that CSE brought about a more significant effect with respect to GA alone on the immune parameters considered here. Such an outcome was probably due to an additive and/or synergistic effect of the mixture of bioactive molecules, among which were polyphenols. The evidence that polyphenols readily enter non-adherent leukocytes can also be of some utility in designing functional diets and feeding schedules for farmed fish.

Author Contributions

M.P. and O.T.E. conceived of and designed the experiments; E.C., F.S., M.G.V., and E.V. performed the experiments and analyzed the data; M.P. wrote the paper.

Funding

This research received no external funding.

Acknowledgments

This research was supported in part by the FRA (Fondi Ricerca di Ateneo) 2014–2015, University of Sannio.

Conflicts of Interest

The authors declare no conflict of interest.

References

  1. Reverter, M.; Bontemps, N.; Lecchini, D.; Banaigs, B.; Sasal, P. Use of plant extracts in fish aquaculture as an alternative to chemotherapy: Current status and future perspectives. Aquaculture 2014, 433, 50–61. [Google Scholar] [CrossRef]
  2. Landers, T.F.; Cohen, B.; Wittum, T.E.; Larson, E.L. Review of Antibiotic Use in Food Animals: Perspective, Policy, and Potential. Public Health Rep. 2012, 127, 4–22. [Google Scholar] [CrossRef] [PubMed]
  3. FAO Report. 2018. Available online: http://www.fao.org/documents/card/en/c/I9540EN/ (accessed on 10 June 2018).
  4. Murray, A.G.; Peeler, E.J. A framework for understanding the potential for emerging diseases in aquaculture. Prev. Vet. Med. 2005, 67, 223–235. [Google Scholar] [CrossRef] [PubMed]
  5. Dhar, A.K.; Manna, S.K.; Thomas Allnutt, F.C. Viral vaccines for farmed finfish. Virus Dis. 2014, 25, 1–17. [Google Scholar] [CrossRef] [PubMed]
  6. Muktar, Y.; Tesfaye, S.; Tesfaye, B. Present status and future prospects of fish vaccination: A review. J. Vet. Sci. Technol. 2016, 7, 2. [Google Scholar] [CrossRef]
  7. Harikrishnan, R.; Balasundaram, C.; Heo, M.-S. Impact of plant products on innate and adaptive immune system of cultured finfish and shellfish. Aquaculture 2011, 317, 1–15. [Google Scholar] [CrossRef]
  8. FAOSTAT Food and Agriculture Organization of the United States. 2017. Available online: http://www.fao.org/faostat/en/#data/QC (accessed on 15 May 2017).
  9. Vazquez, G.; Fontenla, E.; Santos, J.; Freire, M.S.; Gonzalez-Alvarez, J.; Antorrena, G. Antioxidant activity and phenolic content of chestnut (Castanea sativa) shell and eucalyptus (Eucalyptus globulus) bark extracts. Ind. Crops Prod. 2008, 28, 279–285. [Google Scholar] [CrossRef]
  10. Vázquez, G.; González-Alvarez, J.; Santos, J.; Freire, M.S.; Antorrena, G. Evaluation of potential applications for chestnut (Castanea sativa) shell and eucalyptus (Eucalyptus globulus) bark Extracts. Ind. Crops Prod. 2009, 29, 364–370. [Google Scholar] [CrossRef]
  11. Pokorny, J.; Korczak, J. Preparation of natural antioxidants. In Antioxidants in Food. Practical Applications; Pokorny, J., Yanishlieva, N., Gordon, M., Eds.; CRC Press: Boca Raton, FL, USA, 2001; pp. 311–330. [Google Scholar]
  12. Aires, A.; Carvalho, R.; Saavedra, M.J. Valorization of solid wastes from chestnut industry processing: Extraction and optimization of polyphenols, tannins and ellagitannins and its potential for adhesives, cosmetic and pharmaceutical industry. Waste Manag. 2016, 48, 457–464. [Google Scholar] [CrossRef]
  13. De Vasconcelos, M.C.; Bennett, R.N.; Rosa, E.A.; Ferrera-Cardoso, J.V. Composition of European chestnut (Castanea sativa Mill.) and association with health effects: Fresh and processed products. J. Sci. Food Agric. 2010, 90, 1578–1589. [Google Scholar] [CrossRef]
  14. Hao, J.J.; Liu, H.; Donis-Gonzalez, I.R.; Lu, X.H.; Jones, A.D.; Fulbright, D.W. Antimicrobial activity of chestnut extracts for poten-tial use in managing soilborne plant pathogens. Plant Dis. 2012, 96, 354–360. [Google Scholar] [CrossRef]
  15. Lee, N.K.; Jung, B.S.; Na, D.S.; Yua, H.H.; Kim, J.S.; Paik, H.D. The impact of antimicrobial effect of chestnut inner shell extracts against Campylobacter jejuni in chicken meat. LWT—Food Sci. Technol. 2016, 65, 746–750. [Google Scholar] [CrossRef]
  16. Ramudu, K.R.; Dash, G. A Review on Herbal Drugs Against Harmfull Pathogens in Aquaculture. Am. J. Drug Discovery Dev. 2013, 3, 209–219. [Google Scholar] [CrossRef]
  17. Pagliarulo, C.; Sateriale, D.; Scioscia, E.; De Tommasi, N.; Colicchio, R.; Pagliuca, C.; Scaglione, E.; Jussila, J.; Makkonen, J.; Salvatore, P.; et al. Growth, Survival and Spore Formation of the Pathogenic Aquatic Oomycete Aphanomyces astaci and Fungus Fusarium avenaceum Are Inhibited by Zanthoxylum rhoifolium Bark Extracts In Vitro. Fishes 2018, 3, 12. [Google Scholar] [CrossRef]
  18. Sateriale, D.; Scioscia, E.; Colicchio, R.; Pagliuca, C.; Salvatore, P.; Varricchio, E.; Volpe, M.G.; Paolucci, M.; Pagliarulo, C. Italian acacia honey exhibits lytic effects against the crayfish pathogens Aphanomyces astaci and Fusarium avenaceum. Lett. Appl. Microbiol. 2018. [Google Scholar] [CrossRef]
  19. Niedzwiecki, A.; Roomi, M.W.; Kalinovsky, T.; Rath, M. Anticancer Efficacy of Polyphenols and Their Combinations. Nutrients 2016, 8, 552. [Google Scholar] [CrossRef]
  20. Mirabella, N.; Castellani, V.; Sala, S. Beyond the throwaway society: A life cycle-based assessment of the environmental benefit of reuse. Integr. Environ. Assess. Manag. 2015, 11, 373–382. [Google Scholar]
  21. Yang, C.S.; Sang, S.; Lambert, J.D.; Lee, M.-J. Bioavailability issues in studying the health effects of plant polyphenolic compounds. Mol. Nutr. Food Res. 2008, 52, S139–S151. [Google Scholar] [CrossRef]
  22. Sorice, A.; Siano, F.; Capone, F.; Guerriero, E.; Picariello, G.; Budillon, A.; Ciliberto, G.; Paolucci, M.; Costantini, S.; Volpe, M.G. Potential anticancer effects of polyphenols from chestnut shell extracts: Modulation of cell growth, and cytokinomic and metabolomic profiles. Molecules 2016, 21, 1411. [Google Scholar] [CrossRef]
  23. Ricci, A.; Olejar, K.J.; Parpinello, G.P.; Kilmartin, P.A.; Versari, A. Application of Fourier transform infrared (FTIR) spectroscopy in the characterization of tannins. Appl. Spectrosc. Rev. 2015, 50, 407–442. [Google Scholar] [CrossRef]
  24. Ricci, A.; Lagel, M.-C.; Parpinello, G.P.; Pizzi, A.; Kilmartin, P.A.; Versari, A. Spectroscopy analysis of phenolic and sugar patterns in a food grade chestnut tannin. Food Chem. 2016, 203, 425–429. [Google Scholar] [CrossRef]
  25. Dos Santos Grasel, F.; Flôres Ferrão, M.; Wolf, C.R. Development of methodology for identification the nature of the polyphenolic extracts by FTIR associated with multivariate analysis. Spectrochim. Acta A. Mol. Biomol. Spectrosc. 2016, 153, 94–101. [Google Scholar] [CrossRef]
  26. Sun-Waterhouse, D. The development of fruit-based functional foods targeting the health and wellness market: A review. Int. J. Food Sci. Technol. 2011, 46, 899–920. [Google Scholar] [CrossRef]
  27. Noh, J.-R.; Gang, G.-T.; Kim, Y.-H.; Yang, K.-J.; Hwang, J.-H.; Lee, H.-S.; Oh, W.-K.; Song, K.-S.; Lee, C.-H. Antioxidant effects of the chestnut (Castanea crenata) inner shell extract in t-BHP-treated HepG2 cells, and CCl4- and high-fat diet-treated mice. Food Chem. Toxicol. 2010, 48, 3177–3183. [Google Scholar] [CrossRef]
  28. Danneh, D.; Josuttis, M. Cultivar and Production Effects on Bioactive Polyphenols. In Plants Isolation, Purification and Extract Preparation; Watson, R.R., Ed.; Academic Press: New York, NY, USA, 2014; pp. 3–13. [Google Scholar]
  29. Turkmen, N.; Sari, F.; Velioglu, Y.S. Effects of extraction solvents on concentration and antioxidant activity of black and black mate tea polyphenols determined by ferrous tartrate and Folin–Ciocalteu methods. Food Chem. 2006, 99, 835–841. [Google Scholar] [CrossRef]
  30. Vella, F.M.; Laratta, B.; La Cara, F.; Morana, A. Recovery of bioactive molecules from chestnut (Castanea sativa Mill.) by-products through extraction by different solvents. Nat. Prod. Res. 2018, 32, 1022–1032. [Google Scholar] [CrossRef]
  31. Shi, J.; Nawaz, H.; Pohorly, J.; Mittal, G.; Kakuda, Y.; Jiang, Y. Extraction of polyphenolics from plant material for functional foods—Engineering and technology. Food Rev. Int. 2005, 21, 139–166. [Google Scholar] [CrossRef]
  32. Biesaga, M. Influence of extraction methods on stability of flavonoids. J. Chromatogr. 2011, 1218, 2505–2512. [Google Scholar] [CrossRef]
  33. Laghi, L.; Parpinello, G.P.; Del Rio, D.; Calani, L.; Mattioli, A.U.; Versari, A. Fingerprint of enological tannins by multiple techniques approach. Food Chem. 2010, 121, 783–788. [Google Scholar] [CrossRef]
  34. Vázquez, G.; Pizzi, A.; Freire, M.S.; Santos, J.; Antorrena, G.; González-Alvarez, J. MALDI-TOF, HPLC-ESI-TOF and 13C-NMR characterization of chestnut (Castanea sativa) shell tannins for wood adhesives. Wood Sci. Technol. 2013, 47, 523–535. [Google Scholar] [CrossRef]
  35. Vàzquez, G.R.; Guerrero, G.A. Characterization of blood cells and hematological parameters in Cichlasoma dimerus (Teleostei, Perciformes). Tissue Cell. 2017, 39, 151–160. [Google Scholar] [CrossRef]
  36. Chernyavskikh, S.D.; Kuet, D.H.; Trikula, L.N.; Buslovskaya, L.K.; Kovtunenko, A.Y.; Makarova, Y.A. Hematologic profile for Cyprinus carpio. Indo Am. J. Pharm. Sci. 2017, 4, 3155–3161. [Google Scholar]
  37. Bernard, D.; Six, A.; Rigottier-Gois, L.; Messiaen, S.; Chilmonczyk, S.; Quillet, E.; Boudinot, P.; Benmansour, A. Phenotypic and Functional Similarity of Gut Intraepithelial and Systemic T Cells in a Teleost Fish. J. Immunol. 2006, 176, 3942–3949. [Google Scholar] [CrossRef]
  38. Lançon, A.; Delma, D.; Osman, H.; Thénot, J.-P.; Latruffe, B.J.N.; Latruffe, N. Human hepatic cell uptake of resveratrol: Involvement of both passive diffusion and carrier-mediated process. Biochem. Biophys. Res. Commun. 2004, 316, 1132–1137. [Google Scholar] [CrossRef]
  39. Salucci, M.; Stivala, L.A.; Maiani, G.; Bugianesi, R.; Vannini, V. Flavonoids uptake and their effect on cell cycle of human colon adenocarcinoma cells (Caco2). Br. J. Cancer 2002, 86, 1645–1651. [Google Scholar] [CrossRef]
  40. Jannin, B.; Menzel, M.; Berlot, J.-P.; Delmas, D.; Lançon, A.; Latruffe, N. Transport of resveratrol, a cancer chemopreventive agent, to cellular targets: Plasmatic protein binding and cell uptake. Biochem. Pharmacol. 2004, 68, 1113–1118. [Google Scholar] [CrossRef]
  41. Cvorovi, J.; Ziberna, L.; Fornasaro, S.; Tramer, F.; Passamonti, S. Bioavailability of Flavonoids: The Role of Cell Membrane Transporters. In Polyphenols: Mechanisms of Action in Human Health and Disease, 2nd ed.; Watson, R.R., Preedy, V.R., Zibadi, S., Eds.; Elsevier, Inc.: London, UK, 2018; pp. 295–320. [Google Scholar]
  42. Carocho, M.; Ferreira, I.C.F.R. A review on antioxidants, prooxidants and related controversy: Natural and synthetic compounds, screening and analysis methodologies and future perspectives. Food Chem. Toxicol. 2013, 51, 15–25. [Google Scholar] [CrossRef]
  43. Villanueva, C.; Kross, R.D. Antioxidant-induced stress. Int. J. Mol. Sci. 2012, 13, 2091–2109. [Google Scholar] [CrossRef]
  44. Gomes, C.A.; Cruz, T.G.; Andrade, J.L.; Milhazes, N.; Borges, F.; Marques, M.P.M. Anticancer activity of phenolic acids of natural or synthetic origin: A structure–activity study. J. Med. Chem. 2003, 46, 5395–5401. [Google Scholar] [CrossRef]
  45. Galati, G.; O’Brien, P.J. Potential toxicity of flavonoids and other dietary phenolics: Significance for their chemopreventive and anticancer properties. Free Radic. Biol. Med. 2004, 37, 287–303. [Google Scholar] [CrossRef]
  46. Halliwell, B. Are polyphenols antioxidants or pro-oxidants? What do we learn from cell culture and in vivo studies? Arch. Biochem. Biophys. 2008, 476, 107–112. [Google Scholar] [CrossRef] [PubMed]
  47. Procházková, D.; Boušová, I.; Wilhelmová, N. Antioxidant and prooxidant properties of flavonoids. Fitoterapia 2011, 82, 513–523. [Google Scholar] [CrossRef] [PubMed]
  48. Valko, M.; Leibfritz, D.; Moncol, J.; Cronin, M.T.D.; Mazur, M.; Telser, J. Free radicals and antioxidants in normal physiological functions and human disease. Int. J. Biochem. Cell Biol. 2007, 39, 44–84. [Google Scholar] [CrossRef] [PubMed]
  49. Yordi, E.G.; Pérez, E.M.; Matos, M.J.; Villares, E.U. Structural alerts for predicting clastogenic activity of pro-oxidant flavonoid compounds. J. Biomol. Screen. 2012, 17, 216–224. [Google Scholar] [CrossRef]
  50. Esteban, M.; Cuesta, A.; Chaves-Pozo, E.; Meseguer, J. Phagocytosis in Teleosts. Implications of the new cells involved. Biology 2015, 4, 907–922. [Google Scholar] [CrossRef] [PubMed]
  51. Sohi, K.K.; Mittal, N.; Hundal, M.K.; Khanduja, K.L. Gallic acid, an antioxidant, exhibits antiapoptotic potential in normal human lymphocytes: A Bcl-2 independent mechanism. J. Nutr. Sci. Vitaminol. 2003, 49, 221–227. [Google Scholar] [CrossRef] [PubMed]
  52. Tallarida, R.J. Drug synergism: Its detection and applications. J. Pharmacol. Exp. Ther. 2001, 298, 865–872. [Google Scholar] [PubMed]
  53. Liu, R.H. Health benefits of fruit and vegetables are from additive and synergistic combinations of phytochemicals. Am. J. Clin. Nutr. 2003, 78, 517S–520S. [Google Scholar] [CrossRef]
  54. Santangelo, C.; Varì, R.; Scazzocchio, B.; Di Benedetto, R.; Filesi, C.; Masella, R. Polyphenols, intracellular signalling and inflammation. Ann. Ist. Super. Sanita 2007, 43, 394–405. [Google Scholar]
  55. Leyva-López, N.; Gutierrez-Grijalva, E.; Ambriz-Perez, D.; Heredia, J. Flavonoids as cytokine modulators: A possible therapy for inflammation-related diseases. Int. J. Mol. Sci. 2016, 17, 921. [Google Scholar] [CrossRef]
  56. Blonska, M.; Czuba, Z.P.; Krol, W. Effect of flavone derivatives on interleukin-1beta (IL-1beta) mRNA expression and IL-1beta protein synthesis in stimulated RAW 264.7 macrophages. Scand. J. Immunol. 2003, 57, 162–166. [Google Scholar] [CrossRef] [PubMed]
  57. Comalada, M.; Ballester, I.; Bailón, E.; Sierra, S.; Xaus, J.; Gálvez, J.; de Medina, F.S.; Zarzuelo, A. Inhibition of pro-inflammatory markers in primary bone marrow-derived mouse macrophages by naturally occurring flavonoids: Analysis of the structure–activity relationship. Biochem. Pharmacol. 2006, 72, 1010–1021. [Google Scholar] [CrossRef] [PubMed]
  58. Min, Y.-D.; Choi, C.-H.; Bark, H.; Son, H.-Y.; Park, H.-H.; Lee, S.; Park, J.-W.; Park, E.-K.; Shin, H.-I.; Kim, S.-H. Quercetin inhibits expression of inflammatory cytokines through attenuation of NF-κB and p38 MAPK in HMC-1 human mast cell line. Inflamm. Res. 2007, 56, 210–215. [Google Scholar] [CrossRef] [PubMed]
  59. Wheeler, D.S.; Catravas, J.D.; Odoms, K.; Denenberg, A.; Malhotra, V.; Wong, H.R. Epigallocatechin-3-gallate, a green tea-derived polyphenol, inhibits IL-1 beta-dependent proinflammatory signal transduction in cultured respiratory epithelial cells. J. Nutr. 2004, 134, 1039–1044. [Google Scholar] [CrossRef] [PubMed]
  60. Zou, J.; Secombes, C.J. The function of fish cytokines. Biology 2016, 5, 23. [Google Scholar] [CrossRef] [PubMed]
  61. Hong, S.R.; Xu, Q.; Secombes, C.J.; Wang, T. Two types of TNF-α exist in teleost fish: Phylogeny, expression, and bioactivity analysis of type-II TNF-α- in rainbow trout Oncorhynchus mykiss. J. Immunol. 2013, 191, 5959–5972. [Google Scholar] [CrossRef]
  62. Zhang, A.; Chen, D.; Wei, H.; Du, L.; Zhao, T.; Wang, X.; Zhou, H. Functional characterization of TNF-α in grass carp head kidney leukocytes: Induction and involvement in the regulation of NF kB signaling. Fish Shellfish Immunol. 2012, 33, 1123–1132. [Google Scholar] [CrossRef]
  63. Raida, M.K.; Buchmann, K. Development of adaptive immunity in rainbow trout, Oncorhynchus mykiss (Walbaum) surviving an infection with Yersinia ruckeri. Fish Shellfish Immunol. 2008, 25, 533–541. [Google Scholar] [CrossRef]
  64. Uribe, C.; Folch, H.; Enriquez, R.; Moran, G. Innate and adaptive immunity in teleost fish: A review. Vet. Med. 2011, 56, 486–503. [Google Scholar] [CrossRef]
  65. Zhang, Z.; Swain, T.; Bøgwald, J.; Dalmo, R.A.; Kumari, J. Bath immunostimulation of rainbow trout (Oncorhynchus mykiss) fry induces enhancement of inflammatory cytokine transcripts, while repeated bath induce no changes. Fish Shellfish Immunol. 2009, 26, 677–684. [Google Scholar] [CrossRef]
  66. Bakhiet, M.; Al-Salloom, F.S.; Qareiballa, A.; Bindayna, K.; Farid, I.; Botta, G.A. Induction of α and β chemokines by intestinal epithelial cells stimulated with Campylobacter jejuni. J. Infect. 2004, 48, 236–244. [Google Scholar] [CrossRef] [PubMed]
  67. Forsberg, G.; Hernell, O.; Hammarstrom, S.; Hammarstrom, M.-L. Concomitant increase of IL-10 and pro-inflammatory cytokines in intraepithelial lymphocyte subsets in celiac disease. Int. Immunol. 2007, 19, 993–1001. [Google Scholar] [CrossRef]
  68. De Santis, S.; Cavalcanti, E.; Mastronardi, M.; Jirillo, E.; Chieppa, M. Nutritional keys for intestinal barrier modulation. Front. Immunol. 2015, 6, 612. [Google Scholar] [CrossRef]
  69. Dinarello, C.A. Historical Review of Cytokines. EUR. J. Immunol. 2007, 37, S34–S45. [Google Scholar] [CrossRef]
  70. Bradley, J.R. TNF-mediated inflammatory disease. J. Pathol. 2008, 214, 149–160. [Google Scholar] [CrossRef]
  71. Aziz, M.; Jacob, A.; Yang, W.L.; Matsuda, A.; Wang, P. Current trends in inflammatory and immunomodulatory mediators in sepsis. J. Leukoc. Biol. 2013, 93, 329–342. [Google Scholar] [CrossRef]
  72. Chuang, C.-C.; Martinez, K.; Xie, G.; Kennedy, A.; Bumrungpert, A.; Overman, A.; Jia, W.; McIntosh, M.K. Quercetin is equally or more effective than resveratrol in attenuating tumor necrosis factor-α mediated inflammation and insulin resistance in primary human adipocytes. Am. J. Clin. Nutr. 2010, 92, 1511–1521. [Google Scholar] [CrossRef]
  73. Singleton, V.L.; Rossi, J.A. Colourimetry of total phenolics with phosphomolybdic–phospholungistic acid reagents. Am. J. Enol. Viticult. 1965, 16, 144–158. [Google Scholar]
  74. Mariano, G.; Stilo, R.; Terrazzano, G.; Coccia, E.; Vito, P.; Varricchio, E.; Paolucci, M. Effects of recombinant trout leptin in superoxide production and NF-κB/MAPK phosphorylation in blood leukocytes. Peptides 2013, 48, 59–69. [Google Scholar] [CrossRef]
  75. McMillan, D.N.; Secombes, C.J. Isolation of rainbow trout (Oncorhynchus mykiss) intestinal intraepithelial lymphocytes (IEL) and measurement of their cytotoxic activity. Fish Shellfish Immunol. 1997, 7, 527–541. [Google Scholar] [CrossRef]
  76. Komatsu, K.; Tsutsui, S.; Hino, K.; Araki, K.; Yoshiura, Y.; Yamamoto, A.; Nakamura, O.; Watanabe, T. Expression profiles of cytokines released in intestinal epithelial cells of the rainbow trout, Oncorhynchus mykiss, in response to bacterial infection. Dev. Comp. Immunol. 2009, 33, 499–506. [Google Scholar] [CrossRef]
  77. Ferrari, M.; Fornasiero, M.C.; Isetta, A.M. MTT colorimetric assay for testing macrophage cytotoxic activity in vitro. J. Immunol. Methods 1990, 131, 165–172. [Google Scholar] [CrossRef]
  78. Reyes-Becerril, M.; Ascencio-Valle, F.; Tovar-Ramírez, D.; Meseguer, J.; Esteban, M.Á. Effects of polyamines on cellular innate immune response and the expression of immune-relevant genes in gilthead seabream leucocytes. Fish Shellfish Immunol. 2011, 30, 248–254. [Google Scholar] [CrossRef]
  79. Park, K.I.; Kang, S.R.; Park, H.S.; Lee, D.H.; Nagappan, A.; Kim, J.A.; Shin, S.C.; Kim, E.H.; Lee, W.S.; Chung, H.J.; et al. Regulation of Proinflammatory Mediators via NF-κB and p38 MAPK-Dependent Mechanisms in RAW 264.7 Macrophages by Polyphenol Components Isolated from Korea Lonicera japonica THUNB. Evid. Based Complement. Altern. Med. 2012, 828521. [Google Scholar] [CrossRef]
  80. Mazur-Bialy, A.I.; Pocheć, E. HMGB1 inhibition during zymosan-induced inflammation: The potential therapeutic action of riboflavin. Arch. Immunol. Ther. Exp. 2016, 64, 171–176. [Google Scholar] [CrossRef]
  81. Castro, R.; Zou, J.; Secombes, C.J.; Martin, S.A.M. Cortisol modulates the induction of inflammatory gene expression in a rainbow trout macrophage cell line. Fish Shellfish Immunol. 2011, 30, 215–223. [Google Scholar] [CrossRef]
  82. Morash, A.J.; Kajimura, M.; McClelland, G.B. Intertissue regulation of carnitine palmitoyl transferase I (CPTI): Mitochondrial membrane properties and gene expression in rainbow trout (Oncorhynchus mykiss). Biochim. Biophys. Acta 2008, 1778, 1382–1389. [Google Scholar] [CrossRef]
  83. Magrone, T.; Fontana, S.; Laforgia, F.; Dragone, T.; Jirillo, E.; Passantino, L. Administration of a Polyphenol-Enriched Feed to Farmed Sea Bass (Dicentrarchus labrax L.) Modulates Intestinal and Spleen Immune Responses. Oxid. Med. Cell. Longev. 2016, 2016, 2827567. [Google Scholar] [CrossRef]
  84. Kroes, B.; van den Berg, A.; Quarles van Ufford, H.; van Dijk, H.; Labadie, R. Anti-inflammatory activity of gallic acid. Planta Med. 1992, 58, 499–504. [Google Scholar] [CrossRef]
Figure 1. Attenuated total reflectance-Fourier transform infrared spectroscopy (ATR-FTIR) absorption spectra of chestnut shell extracts and chestnut wood in the wavelength 4000–650 cm−1. The spectra were baseline-corrected and normalized.
Fishes 04 00018 g001
Figure 2. Percentage of cell viability. The data represent the mean ± SD of triplicate cultures (n = 3). Different letters on the columns indicate statistically significant differences (cntr = control). The concentration reported on the x axis refers to the total phenolic compounds contained in the chestnut shell extract (CSE). The graph is representative of both blood and intestinal cell cultures.
Fishes 04 00018 g002
Figure 3. Representative chromatograms showing the resolution of the methanol extract of intestinal intraepithelial non-adherent leukocytes (A) incubated with chestnut shell extract (CSE) and blood non-adherent leukocytes (B) incubated with gallic acid (GA) for 15, 60, and 180 min. The control was the cellular sample incubated in the absence of CSE. Asterisks represent the GA peak (retention time = 3.59 min).
Fishes 04 00018 g003aFishes 04 00018 g003b
Figure 4. Cellular content of chestnut shell extract (CSE) (10 µg/mL) and GA (10 µg/mL) in blood non-adherent leukocytes and intestinal intraepithelial non-adherent leukocytes after 15, 60, and 180 min of incubation (black columns) and CSE and GA concentration in the medium after different incubation times (white columns). (A) and (B) CSE and GA content in intestinal intraepithelial non-adherent leukocytes, respectively; (C) and (D) CSE and GA content in blood non-adherent leukocytes, respectively. CSE concentration is expressed as ng/106 cells. The data represent mean ± SD. Different letters on the columns indicate statistically significant differences.
Fishes 04 00018 g004
Figure 5. Superoxide anion production in response to different doses of CSE and GA in in vitro incubations of intestinal intraepithelial non-adherent leukocytes (A) and blood non-adherent leukocytes (B) of rainbow trout. The data represent the mean ± SD of different fish samples (n = 9). Different letters on the columns indicate statistically significant differences (cntr = control). The concentration reported on the x axis refers to the total phenolic compounds contained in the chestnut shell extract (CSE).
Fishes 04 00018 g005aFishes 04 00018 g005b
Figure 6. Percentage of the phagocytosis of zymosan A fluorescein conjugate by intestinal intraepithelial non-adherent leukocytes (A) and blood non-adherent leukocytes (B) of rainbow trout in response to different doses of CSE and GA in in vitro incubations. The data represent the mean ± SD of different fish samples (n = 9). Different letters on the columns indicate statistically significant differences (cntr = control). The concentration reported on the x axis refers to the total phenolic compounds contained in the chestnut shell extract (CSE).
Fishes 04 00018 g006aFishes 04 00018 g006b
Figure 7. IL-1β mRNA expression in response to different doses of CSE and GA in in vitro incubations of intestinal intraepithelial non-adherent leukocytes (A) and blood non-adherent leukocytes (B) of rainbow trout. The data represent the mean ± SD of different fish samples (n = 9). Different letters on the columns indicate statistically significant differences (cntr = control). The housekeeping gene was EF1α. The concentration reported on the x axis refers to the total phenolic compounds contained in the chestnut shell extract (CSE).
Fishes 04 00018 g007
Figure 8. TNF-α mRNA expression in response to different doses of CSE and GA in in vitro incubations of intestinal intraepithelial non-adherent leukocytes (A) and blood non-adherent leukocytes (B) of rainbow trout. The data represent the mean ± SD of different fish samples (n = 9). Different letters on the columns indicate statistically significant differences (cntr = control). The housekeeping gene was EF1α. The concentration reported on the x axis refers to the total phenolic compounds contained in the chestnut shell extract (CSE).
Fishes 04 00018 g008
Figure 9. IL-10 mRNA expression in response to different doses of CSE and GA in in vitro incubations of intestinal intraepithelial non-adherent leukocytes (A) and blood non-adherent leukocytes (B) of rainbow trout. The data represent the mean ± SD of different fish samples (n = 9). Different letters on the columns indicate statistically significant differences (cntr = control). The housekeeping gene was EF1α. The concentration reported on the x axis refers to the total phenolic compounds contained in the chestnut shell extract (CSE).
Fishes 04 00018 g009
Table 1. Polyphenols in the chestnut shell extracts analyzed by HPLC/photodiode array detector (DAD) expressed as g/kg ± SD (n = 6) of extract. RT: room temperature.
ExtractsGallic AcidSyringic AcidEllagic AcidRutinQuercetinCatechin
Ethanol 100% (90 °C)3.39 ± 0.250.79 ± 0.051.91 ± 0.200.099 ± 0.0050.200 ± 0.0150.61 ± 0.05
Ethanol 100% RT1.82 ± 0.090.52 ± 0.090.75 ± 0.120.049 ± 0.0030.089 ± 0.0080.34 ± 0.08
Ethanol 70%/water 30% RT2.12 ± 0.150.50 ± 0.101.05 ± 0.180.059 ± 0.0070.081 ± 0.0100.40 ± 0.09
Water 100% (75 °C)3.74 ± 0.210.20 ± 0.081.65 ± 0.080.024 ± 0.0090.033 ± 0.0050.25 ± 0.05
Table 2. Antioxidant activity, expressed as % ± SD (n = 6) of 2,2-diphenyl-1-picrylhydrazyl (DDPH) inhibition, and the total content of polyphenols, expressed as g/Kg ± SD of chestnut shell extracts. The values are the mean of extractions carried out over a period of three years.
Extract% InhibitionTotal Polyphenols
Ethanol 100% (90 °C)78.9 ± 0.8610.7 ± 2.3
Ethanol 100% RT79.8 ± 1.2635.3 ± 1.5
Ethanol 70%/water 30% RT78.5 ± 1.1590.2 ± 1.7
Water 100% (75 °C)74.3 ± 1.0487.9 ± 1.4
Gallic acid82.6 ± 0.9-
Table 3. Functional groups and frequency assignments for polyphenolic extracts from ATR-FTIR. Assignments were according to the literature data [23,24,25].
Main Vibrational Bands of Chestnut Shell Extracts (Wavenumbers, cm−1, Intensity)
Ethanol 100% at 90 °CEthanol 100% at RTEthanol/Water 70%/30% at RTWater 100% at 75 °CSilvafeed® TSP and ATXPeak Number and Assignment
29182918
(1)
CH2 symmetric stretch
28502850
(2)
CH2 asymmetric stretch
17111708170517001727
(3)
Carbonyl C=O stretching
16071606160416051605
(4)
Aromatic ring C=C stretching
1536
15191516151915201515
14451444144314441447
13421323131913341308
(5)
C–O stretching
1283 12841285
1198119811951197
(6)
Aliphatic C=O stretching
1174
1145114611441144
11011101 11001112
(7)
Aromatic C–H in plane bend
10341030102910321035
(8)
Aliphatic C=O stretching
911
(9)
Aromatic C–H out-of-plane bend
892
869 861
834
819830820822820
766763765765773
749
719729728729719
703
666666666666676
654

