Environmental Salinity Affects Growth and Metabolism in Fingerling Meagre (Argyrosomus Regius)

 , , , and
Abstract
:1. Introduction
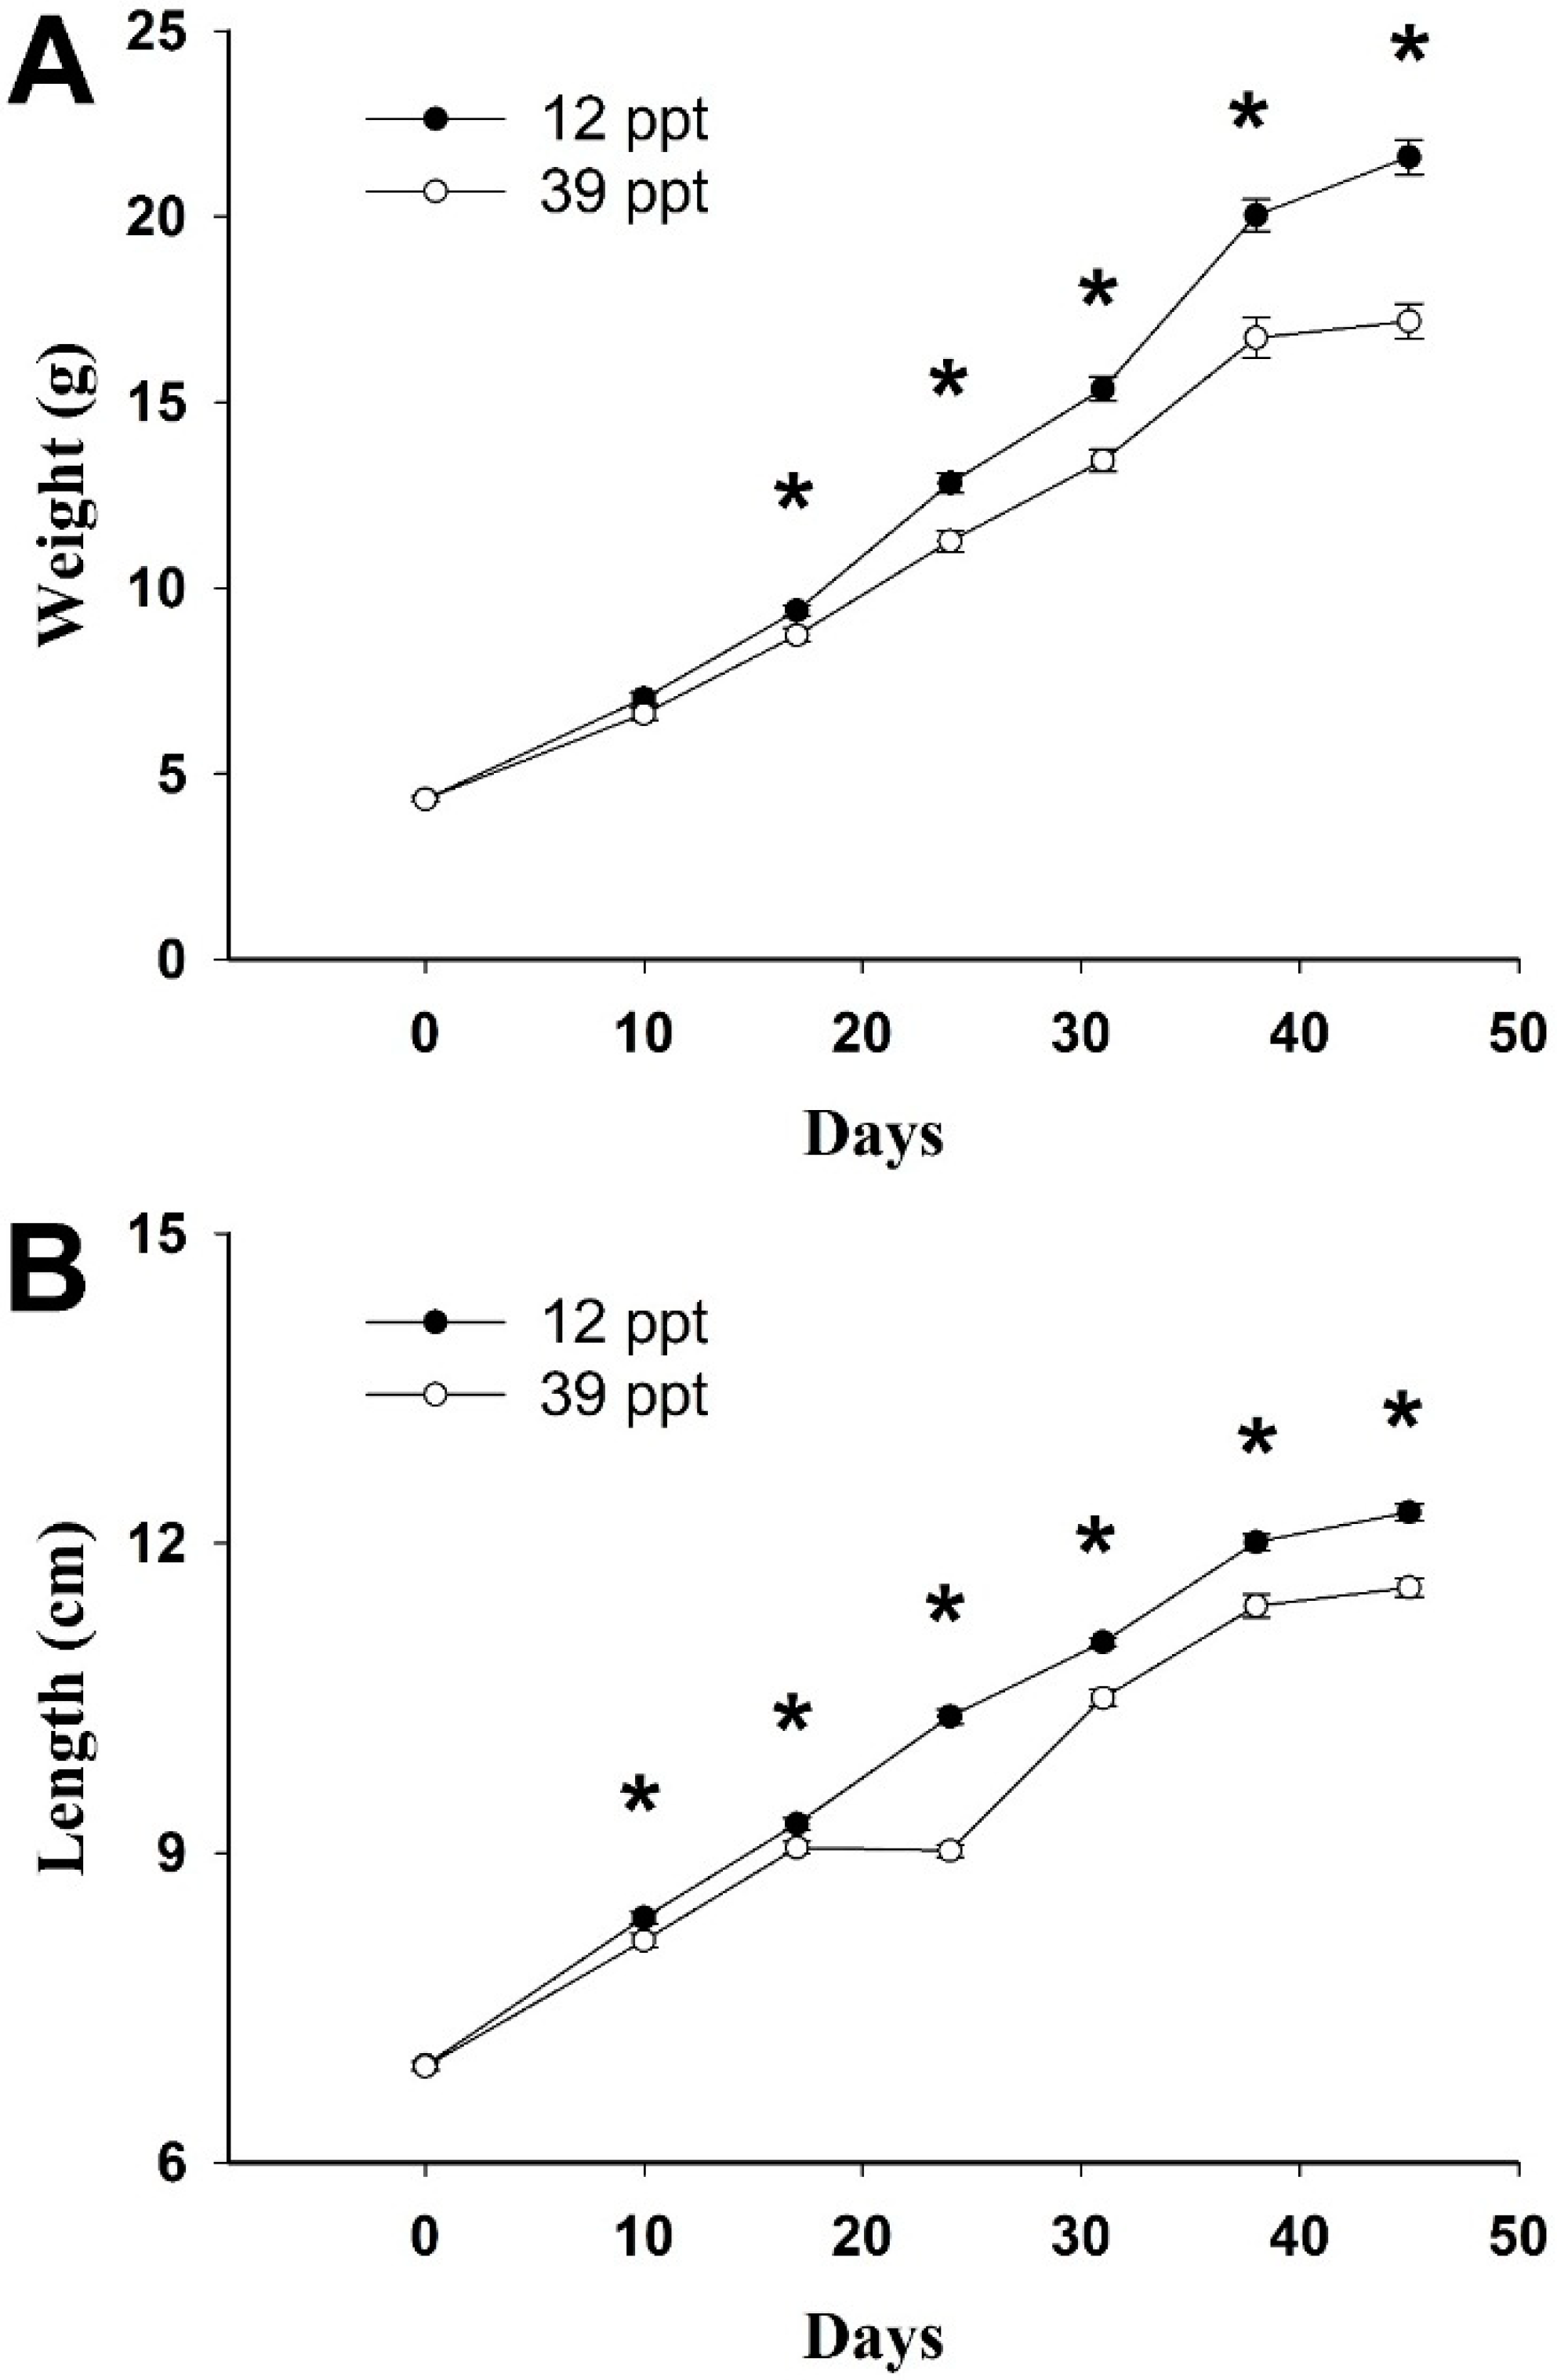
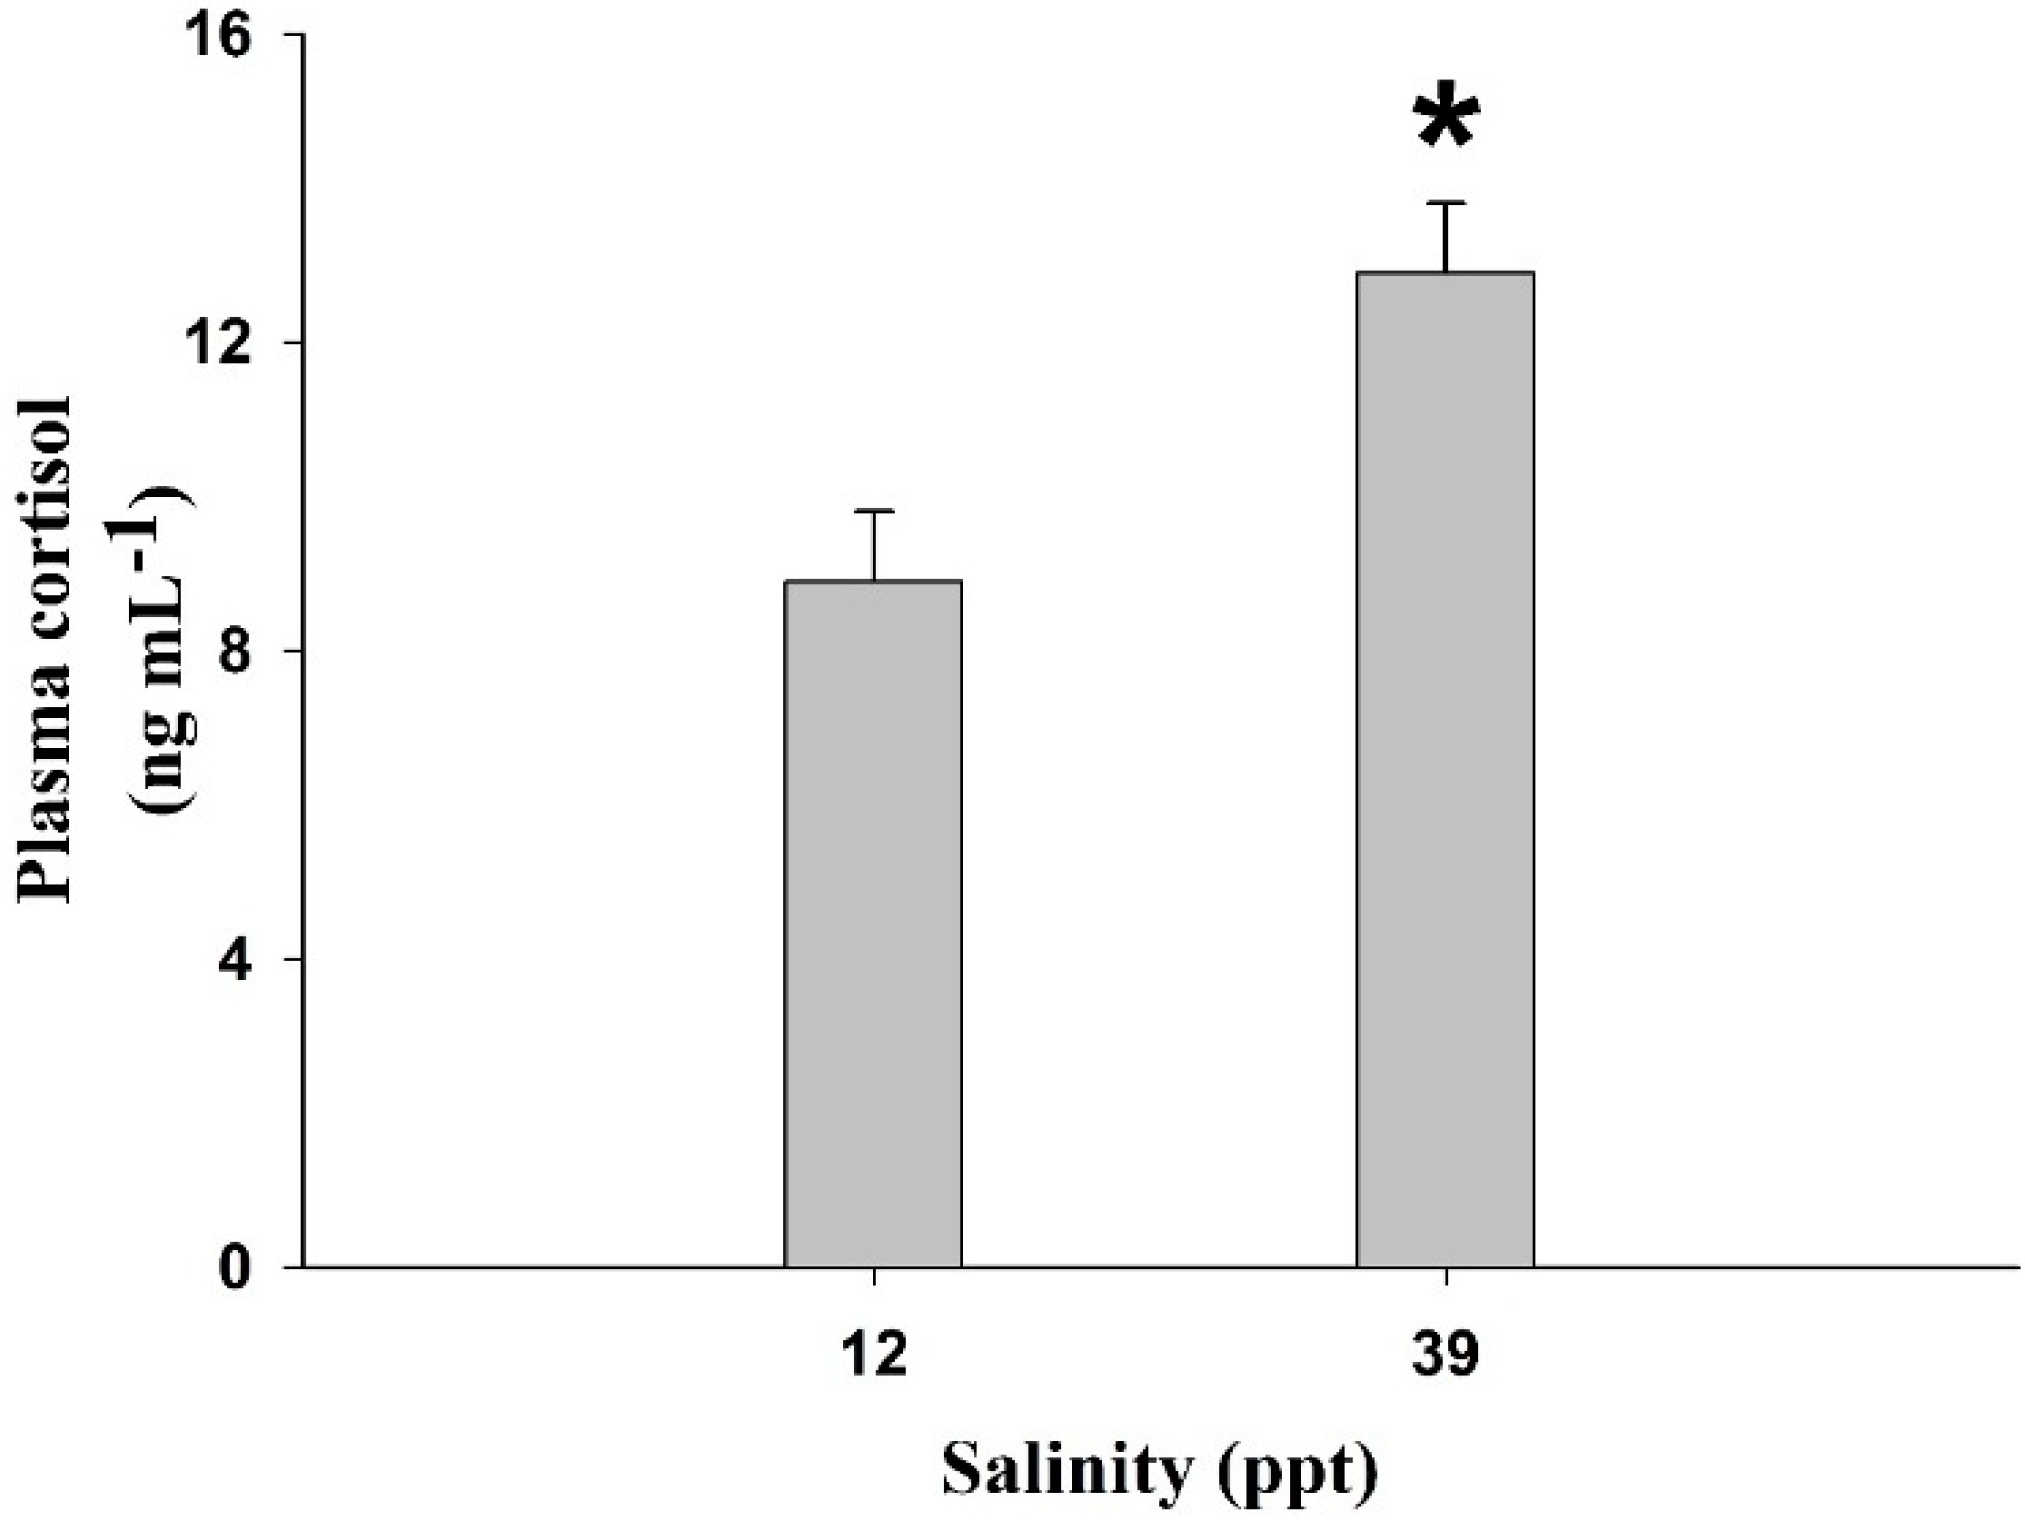
2. Results
3. Discussion
4. Materials and Methods
4.1. Animals
4.2. Experimental Design
4.3. Growth Parameters
4.4. Blood and Tissue Sampling
4.5. Plasma Measurements
4.6. Gill and Kidney Na+/K+-ATPase Activity
4.7. Liver Metabolite Levels
4.8. Statistics
5. Conclusions
Author Contributions
Funding
Acknowledgments
Conflicts of Interest
References
- Cardenas, S. Crianza de la Corvina (Argyrosomus regius); Fundacion Observatorio Español de Acuicultura: Madrid, Spain, 2010; Volume 3, p. 97. [Google Scholar]
- Millán-Cubillo, A.F.; Martos-Sitcha, J.A.; Ruiz-Jarabo, I.; Cárdenas, S.; Mancera, J.M. Low stocking density negatively affects growth, metabolism and stress pathways in juvenile specimens of meagre (Argyrosomus regius, Asso 1801). Aquaculture 2016, 451, 87–92. [Google Scholar] [CrossRef]
- Jimenez, M.T.; Pastor, E.; Grau, A.; Alconchel, J.I.; Sanchez, R.; Cardenas, S. Review of sciaenid culture around the world, with a special focus on the meagre Argyrosomus regius (Asso, 1801). Boletin Instituto Espanol de Oceanografia 2005, 21, 169–175. [Google Scholar]
- Poli, B.M.; Parisi, G.; Zampacavallo, G.; Iurzan, F.; Mecatti, M.; Lupi, P.; Bonelli, A. Preliminary results on quality and quality changes in reared meagre (Argyrosomus regius): Body and fillet traits and freshness changes in refrigerated commercial-size fish. Aquac. Int. 2003, 11, 301–311. [Google Scholar] [CrossRef]
- Liu, H.; He, J.; Chi, C.; Gu, Y. Identification and analysis of icCu/Zn-SOD, Mn-SOD and ecCu/Zn-SOD in superoxide dismutase multigene family of Pseudosciaena crocea. Fish Shellfish Immunol 2015, 43, 491–501. [Google Scholar] [CrossRef] [PubMed]
- Duncan, N.; Estévez, A.; Fernández-Palacios, H.; Gairin, I.; Hernandez-Cruz, C.M.; Roo, F.; Schuchardt, D.; Vallés, R. Aquaculture production of meagre (Argyrosomus regius): Hatchery techniques, ongrowing and market. In Advances in Aquaculture Hatchery Technology; Allan, G., Burnell, G., Eds.; Woodhead: Cambridge, UK, 2013; pp. 519–541. [Google Scholar]
- Office of Naval Research: Woods Hole. Sonic Fishes of the Pacific; Poland, M., Ed.; Office of Naval Research: Woods Hole, MA, USA, 1948; Volume 2, p. 144. [Google Scholar]
- Lagardere, J.P.; Mariani, A. Spawning sounds in meagre Argyrosomus regius recorded in the Gironde estuary, France. J. Fish Biol. 2006, 69, 1697–1708. [Google Scholar] [CrossRef]
- Chao, L.N. Sciaenidae; UNESCO: Paris, France, 1986; Volume 2. [Google Scholar]
- Morales-Nin, B.; Geffen, A.J.; Perez-Mayol, S.; Palmer, M.; Gonzalez-Quiros, R.; Grau, A. Seasonal and ontogenic migrations of meagre (Argyrosomus regius) determined by otolith geochemical signatures. Fish. Res. 2012, 127–128, 154–165. [Google Scholar] [CrossRef]
- Gray, C.A.; Mcdonall, V.C. Distribution and Growth of Juvenile Mulloway, Argyrosomus hololepidotus (Pisces, Sciaenidae), in the Hawkesbury River, South-Eastern Australia. Aust. J. Mar. Fresh Res. 1993, 44, 401–409. [Google Scholar] [CrossRef]
- Ferguson, G.J.; Ward, T.M.; Ivey, A.; Barnes, T. Life history of Argyrosomus japonicus, a large sciaenid at the southern part of its global distribution: Implications for fisheries management. Fish. Res. 2014, 151, 148–157. [Google Scholar] [CrossRef]
- Monaco, M.E.; Weisberg, S.B.; Lowery, T.A. Summer habitat affinities of estuarine fish in US mid-Atlantic coastal systems. Fish. Manag. Ecol. 1998, 5, 161–171. [Google Scholar] [CrossRef]
- Rowell, K.; Flessa, K.W.; Dettman, D.L.; Roman, M. The importance of Colorado River flow to nursery habitats of the Gulf corvina (Cynoscion othonopterus). Can. J. Fish. Aquat. Sci. 2005, 62, 2874–2885. [Google Scholar] [CrossRef]
- Boeuf, G.; Payan, P. How should salinity influence fish growth? Comp. Biochem. Phys. C 2001, 130, 411–423. [Google Scholar] [CrossRef]
- Laiz-Carrion, R.; Sangiao-Alvarellos, S.; Guzman, J.M.; Martin del Rio, M.P.; Soengas, J.L.; Mancera, J.M. Growth performance of gilthead sea bream Sparus aurata in different osmotic conditions: Implications for osmoregulation and energy metabolism. Aquaculture 2005, 250, 849–861. [Google Scholar] [CrossRef]
- Herrera, M.; Vargas-Chacoff, L.; Hachero, I.; Ruiz-Jarabo, I.; Rodiles, A.; Navas, J.I.; Mancera, J.M. Osmoregulatory changes in wedge sole (Dicologoglossa cuneata Moreau, 1881) after acclimation to different environmental salinities. Aquac. Res. 2009, 40, 762–771. [Google Scholar] [CrossRef]
- Vargas-Chacoff, L.; Calvo, A.; Ruiz-Jarabo, I.; Villarroel, F.; Munoz, J.L.; Tinoco, A.B.; Cardenas, S.; Mancera, J.M. Growth performance, osmoregulatory and metabolic modifications in red porgy fry, Pagrus pagrus, under different environmental salinities and stocking densities. Aquac. Res. 2011, 42, 1269–1278. [Google Scholar] [CrossRef]
- Ruiz-Jarabo, I.; Márquez, P.; Vargas-Chacoff, L.; Martos-Sitcha, J.A.; Cárdenas, S.; Mancera, J.M. Narrowing the range of environmental salinities where juvenile meagre (Argyrosomus regius) can be cultured based on an osmoregulatory pilot study. Fishes 2018, 3, 48. [Google Scholar] [CrossRef]
- Mohammed-Geba, K.; Gonzalez, A.A.; Suarez, R.A.; Galal-Khallaf, A.; Martos-Sitcha, J.A.; Ibrahim, H.M.; Martinez-Rodriguez, G.; Mancera, J.M. Molecular performance of Prl and Gh/Igf1 axis in the Mediterranean meager, Argyrosomus regius, acclimated to different rearing salinities. Fish Physiol. Biochem. 2017, 43, 203–216. [Google Scholar] [CrossRef] [PubMed]
- Gonzalez-Quiros, R.; del Arbol, J.; Garcia-Pacheco, M.D.; Silva-Garcia, A.J.; Naranjo, J.M.; Morales-Nin, B. Life-history of the meagre Argyrosomus regius in the Gulf of Cadiz (SW Iberian Peninsula). Fish. Res. 2011, 109, 140–149. [Google Scholar] [CrossRef]
- Bernatzeder, A.K.; Cowley, P.D.; Hecht, T. Do juveniles of the estuarine-dependent dusky kob, Argyrosomus japonicus, exhibit optimum growth indices at reduced salinities? Estuar. Coast. Shelf Sci. 2010, 90, 111–115. [Google Scholar] [CrossRef]
- Fielder, D.S.; Bardsley, W. A preliminary study on the effects of salinity on growth and survival of Mulloway Argyrosomus japonicus larvae and juveniles. J. World Aquac. Soc. 1999, 30, 380–387. [Google Scholar] [CrossRef]
- Ruiz-Jarabo, I.; Herrera, M.; Hachero-Cruzado, I.; Vargas-Chacoff, L.; Mancera, J.M.; Arjona, F.J. Environmental salinity and osmoregulatory processes in cultured flatfish. Aquac. Res. 2015, 46, 10–29. [Google Scholar] [CrossRef]
- El-Shebly, A.A.; El-Kady, M.A.H. Preliminary observations on the pond culture of meagre Argyrosomus regius (Asso, 1801) (Sciaenidae) in Egypt. J. Fish. Aquat. Sci. 2007, 2, 345–352. [Google Scholar]
- Vargas-Chacoff, L.; Ruiz-Jarabo, I.; Pascoa, I.; Goncalves, O.; Mancera, J.M. Yearly growth and metabolic changes in earthen pond-cultured meagre Argyrosomus regius. Sci. Mar. 2014, 78, 193–202. [Google Scholar] [CrossRef]
- Carvalho, M.; Peres, H.; Saleh, R.; Fontanillas, R.; Rosenlund, G.; Oliva-Teles, A.; Izquierdo, M. Dietary requirement for n-3 long-chain polyunsaturated fatty acids for fast growth of meagre (Argyrosomus regius, Asso 1801) fingerlings. Aquaculture 2018, 488, 105–113. [Google Scholar] [CrossRef]
- Wendelaar Bonga, S.E. The stress response in fish. Physiol. Rev. 1997, 77, 591–625. [Google Scholar] [CrossRef] [PubMed]
- Arjona, F.J.; Vargas-Chacoff, L.; Ruiz-Jarabo, I.; Gonçalves, O.; Pâscoa, I.; Martín del Río, M.P.; Mancera, J.M. Tertiary stress responses in Senegalese sole (Solea senegalensis Kaup, 1858) to osmotic challenge: Implications for osmoregulation, energy metabolism and growth. Aquaculture 2009, 287, 419–426. [Google Scholar] [CrossRef]
- Arjona, F.J.; Vargas-Chacoff, L.; Ruiz-Jarabo, I.; Martin del Rio, M.P.; Mancera, J.M. Osmoregulatory response of Senegalese sole (Solea senegalensis) to changes in environmental salinity. Comp. Biochem. Physiol. A Mol. Integr. Physiol. 2007, 148, 413–421. [Google Scholar] [CrossRef] [PubMed]
- McCormick, S.D.; Farrell, A.P.; Brauner, C.J. Euryhaline Fishes; Academic Press: Oxford, UK, 2013; Volume 32. [Google Scholar]
- Mommsen, T.P.; Vijayan, M.M.; Moon, T.W. Cortisol in teleosts: Dynamics, mechanisms of action, and metabolic regulation. Rev. Fish Biol. Fish. 1999, 9, 211–268. [Google Scholar] [CrossRef]
- Soengas, J.L.; Sangiao-Alvarellos, S.; Laiz-Carrion, R.; Mancera, J.M. Energy metabolism and osmotic acclimation in teleost fish. In Fish Osmoregulation; Baldiserotto, B., Mancera, J.M., Kapoor, B.G., Eds.; Science Publishers: Enfield, NH, USA, 2008; pp. 277–307. [Google Scholar]
- Tseng, Y.C.; Hwang, P.P. Some insights into energy metabolism for osmoregulation in fish. Comp. Biochem. Phys. C 2008, 148, 419–429. [Google Scholar] [CrossRef] [PubMed]
- Laiz-Carrion, R.; Guerreiro, P.M.; Fuentes, J.; Canario, A.V.M.; Martin Del Rio, M.P.; Mancera, J.M. Branchial osmoregulatory response to salinity in the gilthead sea bream, Sparus auratus. J. Exp. Zool. Part A Comp. Exp. Biol. 2005, 303A, 563–576. [Google Scholar] [CrossRef] [PubMed]
- Ruiz-Jarabo, I.; Barany-Ruiz, A.; Jerez-Cepa, I.; Mancera, J.M.; Fuentes, J. Intestinal response to salinity challenge in the Senegalese sole (Solea senegalensis). Comp. Biochem. Physiol. A 2017, 204, 57–64. [Google Scholar] [CrossRef] [PubMed]
- Ter Morshuizen, L.D.; Whitfield, A.K.; Paterson, A.W. Influence of freshwater flow regime on fish assemblages in the Great Fish River and Estuary. S. Afr. J. Aquat. Sci. 1996, 22, 52–61. [Google Scholar] [CrossRef]
- Ferreira, H.L.; Vine, N.G.; Griffiths, C.L.; Kaiser, H. Effect of salinity on growth of juvenile silver kob, Argyrosomus inodorus (Teleostei: Sciaenidae). Afr. J. Aquat. Sci. 2008, 33, 161–165. [Google Scholar] [CrossRef]
- Magnoni, L.J.; Salas-Leiton, E.; Peixoto, M.-J.; Pereira, L.; Silva-Brito, F.; Fontinha, F.; Gonçalves, J.F.M.; Wilson, J.M.; Schrama, J.W.; Ozório, R.O.A. Dietary electrolyte balance affects growth performance, amylase activity and metabolic response in the meagre (Argyrosomus regius). Comp. Biochem. Physiol. B 2017, 211, 8–15. [Google Scholar] [CrossRef] [PubMed]
- Wada, T.; Aritaki, M.; Yamashita, Y.; Tanaka, M. Comparison of low-salinity adaptability and morphological development during the early life history of five pleuronectid flatfishes, and implications for migration and recruitment to their nurseries. J. Sea Res. 2007, 58, 241–254. [Google Scholar] [CrossRef]
- Ruiz-Jarabo, I.; Klaren, P.H.M.; Louro, B.; Martos-Sitcha, J.A.; Pinto, P.I.S.; Vargas-Chacoff, L.; Flik, G.; Martínez-Rodríguez, G.; Power, D.M.; Mancera, J.M.; et al. Characterization of the peripheral thyroid system of gilthead seabream acclimated to different ambient salinities. Comp. Biochem. Physiol. A 2017, 203, 24–31. [Google Scholar] [CrossRef] [PubMed]
- Ruiz-Jarabo, I.; González-Wevar, C.A.; Oyarzún, R.; Fuentes, J.; Poulin, E.; Bertrán, C.; Vargas-Chacoff, L. Isolation driven divergence in osmoregulation in Galaxias maculatus (Jenyns, 1848) (Actinopterygii: Osmeriformes). PLoS ONE 2016, 11, e0154766. [Google Scholar] [CrossRef] [PubMed]
- McEwen, B.S.; Wingfield, J.C. The concept of allostasis in biology and biomedicine. Horm. Behav. 2003, 43, 2–15. [Google Scholar] [CrossRef]
- Jobling, M. Fish Bioenergetics; Chapman and Hall: London, UK, 1994. [Google Scholar]
- Chatzifotis, S.; Panagiotidou, M.; Papaioannou, N.; Pavlidis, M.; Nengas, I.; Mylonas, C.C. Effect of dietary lipid levels on growth, feed utilization, body composition and serum metabolites of meagre (Argyrosomus regius) juveniles. Aquaculture 2010, 307, 65–70. [Google Scholar] [CrossRef]
- Sampaio, L.A.; Bianchini, A. Salinity effects on osmoregulation and growth of the euryhaline flounder Paralichthys orbignyanus. J. Exp. Mar. Biol. Ecol. 2002, 269, 187–196. [Google Scholar] [CrossRef]
- Lawrence, M.J.; Jain-Schlaepfer, S.; Zolderdo, A.J.; Algera, D.A.; Gilour, K.M.; Gallagher, A.J.; Cooke, S.J. Are 3-minutes goof enough for obtaining baseline physiological samples from teleost fish? Can. J. Zool. 2018, 96, 774–786. [Google Scholar] [CrossRef]
- Moore, S. Amino acid analysis: Aqueous dimethyl sulfoxide as solvent for the ninhydrin reaction. J. Biol. Chem. 1968, 243, 6281–6283. [Google Scholar] [PubMed]
- Martos-Sitcha, J.A.; Wunderink, Y.S.; Straatjes, J.; Skrzynska, A.K.; Mancera, J.M.; Martinez-Rodriguez, G. Different stressors induce differential responses of the CRH-stress system in the gilthead sea bream (Sparus aurata). Comp. Biochem. Physiol. A Mol. Integr. Physiol. 2014, 177, 49–61. [Google Scholar] [CrossRef] [PubMed]
- McCormick, S.D. Methods for nonlethal gill biopsy and measurement of Na+, K+-ATPase activity. Can. J. Fish. Aquat. Sci. 1993, 50, 656–658. [Google Scholar] [CrossRef]
- Mancera, J.M.; Laiz Carrion, R.; Martín del Río, M.P. Osmoregulatory action of PRL, GH, and cortisol in the gilthead seabream (Sparus aurata L.). Gen. Comp. Endocrinol. 2002, 129, 95–103. [Google Scholar] [CrossRef]
- Keppler, D.; Decker, K. Glycogen determination with amyloglucosidase. In Methods of Enzymatic Analysis; Bergmeyer, H.U., Ed.; Academic Press: New York, NY, USA, 1974; Volume 3, pp. 1127–1131. [Google Scholar]


| Salinity | SGR (% day−1) | DGR (g day−1) | WG (%) | K |
|---|---|---|---|---|
| 12 ppt | 3.83 ± 0.04 | 0.41 ± 0.01 | 400.2 ± 8.6 | 1.20 ± 0.05 |
| 39 ppt | 3.30 ± 0.02 * | 0.31 ± 0.00 * | 300.3 ± 2.6 * | 1.18 ± 0.05 |
| Salinity | Glucose (mM) | Lactate (mM) | TAG (mM) | FFA (mM) | Proteins (g dL−1) | Amino Acids (mM) |
|---|---|---|---|---|---|---|
| 12 ppt | 5.6 ± 0.5 | 1.9 ± 0.2 | 8.6 ± 0.6 | 9.6 ± 0.5 | 32.3 ± 1.3 | 4.2 ± 0.3 |
| 39 ppt | 15.5 ± 0.8 * | 2.3 ± 0.2 * | 16.9 ± 1.6 * | 13.6 ± 1.5 * | 30.0 ± 1.1 | 4.2 ± 0.3 |
| Salinity | HSI (%) | Glycogen (mg Liver−1) | Glucose (mg Liver−1) | TAG (mg Liver−1) | Amino Acids (µmol Liver−1) |
|---|---|---|---|---|---|
| 12 ppt | 5.6 ± 0.6 | 32.7 ± 2.3 | 15.4 ± 1.3 | 5.5 ± 1.0 | 18.2 ± 1.7 |
| 39 ppt | 3.6 ± 0.1 * | 22.2 ± 1.4 * | 9.8 ± 0.6 * | 2.0 ± 0.4 * | 12.0 ± 0.9 * |
© 2019 by the authors. Licensee MDPI, Basel, Switzerland. This article is an open access article distributed under the terms and conditions of the Creative Commons Attribution (CC BY) license (http://creativecommons.org/licenses/by/4.0/).
Share and Cite
Ruiz-Jarabo, I.; Tinoco, A.B.; Vargas-Chacoff, L.; Martos-Sitcha, J.A.; Rodríguez-Rúa, A.; Cárdenas, S.; Mancera, J.M. Environmental Salinity Affects Growth and Metabolism in Fingerling Meagre (Argyrosomus Regius). Fishes 2019, 4, 6. https://0-doi-org.brum.beds.ac.uk/10.3390/fishes4010006
Ruiz-Jarabo I, Tinoco AB, Vargas-Chacoff L, Martos-Sitcha JA, Rodríguez-Rúa A, Cárdenas S, Mancera JM. Environmental Salinity Affects Growth and Metabolism in Fingerling Meagre (Argyrosomus Regius). Fishes. 2019; 4(1):6. https://0-doi-org.brum.beds.ac.uk/10.3390/fishes4010006
Chicago/Turabian StyleRuiz-Jarabo, Ignacio, Ana Belén Tinoco, Luis Vargas-Chacoff, Juan Antonio Martos-Sitcha, Ana Rodríguez-Rúa, Salvador Cárdenas, and Juan Miguel Mancera. 2019. "Environmental Salinity Affects Growth and Metabolism in Fingerling Meagre (Argyrosomus Regius)" Fishes 4, no. 1: 6. https://0-doi-org.brum.beds.ac.uk/10.3390/fishes4010006