Past and Current Trends of Coastal Predatory Fish in the Baltic Sea with a Focus on Perch, Pike, and Pikeperch

Swedish University of Agricultural Sciences, Department of Aquatic Resources, Institute of Coastal Research Skolgatan 6, 74242 Öregrund, Sweden
Fishes 2019, 4(1), 7; https://0-doi-org.brum.beds.ac.uk/10.3390/fishes4010007
Submission received: 9 January 2019
/
Revised: 31 January 2019
/
Accepted: 1 February 2019
/
Published: 6 February 2019
Abstract
:Coastal predatory fish are of key importance for the provisioning of ecosystem services in the Baltic Sea. Worldwide, however, there has been a general and sharp decline in predatory fish populations, in turn threatening the viability and function of marine ecosystems. On the basis of the literature, the past (data until the 2000s) and current (data until early and mid 2010s) trends in abundance of coastal predatory fish in the Baltic Sea are reviewed in this paper. Potentially important impacting factors behind the temporal development of the populations and measures to strengthen and restore them are also discussed. Available data from coastal fish monitoring programs suggest a stable or increasing abundance of coastal predatory fish as a functional group and for the species perch in the majority of areas assessed in the Baltic Sea. For pike and pikeperch, data to support assessments is scarce, but suggest substantial declines in the abundance of both species in most assessed areas. The impacting factors behind these patterns vary between species and areas, but include climate, habitat exploitation, fishing, and species-interactions in the coastal food web. Measures to restore and support coastal predatory fish communities should follow an ecosystem-based approach to management and include efforts to regulate fisheries sectors in combination with habitat protection and restoration.
1. Introduction
Predatory fish species are key elements in aquatic food-webs worldwide. In being at the top of the food-web, predatory fish, for example, influence ecosystem functioning via trophic cascades [1,2]. When populations of predatory fish are weak or in decline, top-down regulation is weakened, resulting in increased occurrence of mesopredatory fish and other mid-trophic level organisms [3,4,5,6,7]. Such trophic effects might also cascade down the food web, ultimately affecting lower trophic levels such as primary producers and consumers [6,8,9,10,11,12]. The knowledge on trophic cascades in food web functioning has hence been essential for the paradigm shift in moving from single-species fisheries management to a more holistic and ecosystem-based approach to management [13].
Besides providing important ecosystem services in aquatic food webs related to the support and regulation of the systems, predatory fish are also in focus for human consumption. Both small-scale coastal commercial and recreational fisheries sectors (both using passive gears as nets and cages or rods), as well as large-scale offshore fisheries (using mainly trawls), for example, have long since targeted fish species in the top of the food web. This has, in many cases, resulted in overexploitation of many predatory fish populations worldwide [1]. Despite intensive management actions including fisheries regulations, few populations have recovered, resulting in an overall poor status of predatory fish stocks [14,15]. Given the important ecological and socio-economical role of predatory fish and their role in international agreements and legislative acts focusing on the health of marine ecosystems [16,17], it is of outmost importance to sustainably manage and understand the underlying processes behind the change in populations.
The Baltic Sea is the worlds’ largest brackish water body with pronounced gradients from north to south in salinity, temperature, and nutrient concentration [18]. As such, the Baltic Sea harbors a mixture of organisms with a freshwater and marine origin [19]. The fish community in the offshore Baltic Sea is typically dominated by species of a marine origin as cod (Gadus morhua), sprat (Sprattus sprattus), and herring (Clupea harengus) in the western parts, with a gradual decrease of the species as the salinity drops east- and northwards. The more nearshore (typically depths shallower than 20 m) fish community, in contrast, is dominated by freshwater species such as perch (Perca fluviatilis), species from the carp family (Cyprinidae), sticklebacks (Gasterosteidae), and gobies (Gobiidae) [20]. In more south-western coastal areas, however, the segment of marine species such as cod, herring, and the two species of flounder (Platichthys flesus and Platichthys solemdali) is also more pronounced in coastal areas. Typical predatory fish in coastal areas in the Baltic Sea are perch, pikeperch (Sander lucioperca), pike (Esox lucius), cod, turbot (Psetta maxima), and burbot (Lota lota) [20]. As a result of the strong environmental gradients in the Baltic Sea, the species comprising the coastal predatory fish group differs among areas [21,22]. Perch is overall the most common and dominating predatory fish species occurring in most areas, whereas burbot are confined to more northern and less saline areas and cod and turbot to the south-western and more saline areas. Pikeperch are almost exclusively found in coastal areas with extensive archipelagoes and shallow and eutrophicated bays in the central parts of the Baltic Sea. Pike have a similar distribution and range as perch, but occur naturally in much lower densities in most areas. Populations of obligate coastal predatory species such as perch, pike, pikeperch, and burbot are rather local in their appearance and response to environmental variation and change [23,24,25,26,27]. In combination with the pronounced environmental gradients in the Baltic Sea, there is hence a challenge to provide a generic description of the status of coastal predatory fish in the system without using the local perspective.
In this paper, past and current trends of coastal predatory fish are reviewed based on the latest regional status assessments as undertaken by the Baltic Marine Environment Protection Commission (HELCOM) [22], recent scientific publications, and national status assessment reports. As such, the review includes both status assessments using defined threshold values and trends from time-series data. The review is based on published literature rather than new data analysis and is focused on the three most common and widely distributed resident coastal predatory fish species in the Baltic Sea for which monitoring data are available; namely, perch, pike, and pikeperch. Data for additional predatory species as cod, burbot, and turbot in coastal areas are scarcer, but are to some extent considered in the functional group of predatory fish included in this review (Table 1). In addition to current and past trends in the abundance of these species, this review includes paragraphs considering the data to support assessments, the key impacts for change in coastal predatory fish populations, and potential management measures for supporting and restoring the populations. The review is rounded off with a summary and perspectives paragraph.
Recent studies have addressed the past status (data until 2013) of predatory fish as a functional group [21], potential causes for change of perch populations and predatory fish as a functional group [25,28], and population structures for coastal fish in the Baltic Sea [26]. This review is novel in several aspects including, for example, the most recent status assessment of predatory fish (data until 2016/2017), the first Baltic wide assessment of the population trends for pike and pikeperch, as well as a review of the causes for population change in coastal predatory fish and possible measures for restoring and supporting coastal predatory fish populations and stocks in the Baltic Sea.
2. Monitoring and Data for Coastal Fish in the Baltic Sea
Monitoring of coastal fish in the Baltic Sea has a long history, in some areas dating back to the early 1970s [29]. To date, coastal fish monitoring exists in some form in all Baltic Sea countries except for Russia [22]. In Sweden, Finland, Estonia, Latvia, and Lithuania, monitoring was mainly established in the late 1980s/mid 1990s, whereas in Poland, Germany, and Denmark, monitoring has a shorter history, dating back to the mid 2000s and early 2010s. Coastal fish monitoring in the Baltic Sea typically targets near-shore (down to 20 m depth) locally resident fish communities [22], and generally covers shallow vegetated coastal bays with soft bottoms and varying degrees of underwater vegetation and exposure to the offshore Baltic Sea.
As a result of national traditions and specific environmental conditions that differ across coastal areas and regions, the monitoring has and is currently undertaken using different gears and methods [22,30] (Table 1, Table 2, Table 3 and Table 4). Typically, passive gears such as different types of multi-mesh gillnets and fyke nets are common, but in some areas, near-shore trawling is also used to monitoring coastal fish communities [reviewed in 30]. In most countries, monitoring is fisheries-independent and performed by national research institutes and universities, but in Finland, coastal fish status assessments are mainly based on data from the small-scaled commercial coastal fishery [22] and in Denmark, recreational fishermen are contracted on a voluntary basis to perform monitoring [31]. Monitoring using gillnets mainly targets perch and pikeperch, and less so the more sedentary species such as burbot and pike [22]. As monitoring is mainly undertaken during summer when water temperatures are high, marine species favoring lower water temperatures such as cod and turbot are not representatively sampled in most areas. As a result of these caveats, the best and spatially most extensive data for assessments are available for perch and, to some extent, also pikeperch, and mainly the occurrence of the species during summer. This review almost exclusively focuses on these two species together with pike, for which some data for assessments exist, and mainly cover central and northern coasts of the Baltic Sea and less so the coastal areas in Denmark and Poland (Figure 1, Figure 2, Figure 3, Figure 4 and Figure 5 and Table 1, Table 2, Table 3 and Table 4).
Given the range of gears used in monitoring, as well as differences in time-periods covered and in species composition among countries and regions, status assessment of coastal fish is challenging. Data are hence not directly comparable across areas, and common analysis is currently limited to track changes over time in the relative abundances of the species and community elements in each area, as done in this review. Because coastal fish communities also are local in their appearance and response to environmental conditions [23,24,25,26,27,32], generic thresholds for good status has to date not been established [22]. Moreover, with few exceptions, the data available do not allow for full analytical assessments models, as are traditionally used for fish stock assessments, but see [33]. As a result, the indicators developed to assess the current status of coastal predatory fish are based on estimates of relative abundance from coastal fish monitoring programs and locally derived threshold values for good status [22]. In short, the current assessment protocol as used within HELCOM either relies on a trend-based assessment when data cover less than 15 years, or an assessment based on a deviation from the baseline approach if data span over 15 years, see [22] for details. The latest assessments as presented in this review have also been used to report the status of coastal fish within the Baltic Sea Action Plan (BSAP) [16] and Marine Strategy Framework Directive (MSFD) [17], mainly for descriptor 1 [18], and have been developed and undertaken by the HELCOM expert group for coastal fish in the Baltic Sea (HELCOM FISH PRO II) [34].
In this review, the focus is on results from the most recent regional status assessment of coastal fish as undertaken by the HELCOM FISH PRO II expert group using data from Sweden, Finland, Estonia, Latvia, Lithuania, and to some extent also Germany [22] (Table 1, Table 2, Table 3 and Table 4). In Denmark, the current recreational fishermen data do not allow for an assessment of coastal predatory fish status, and in Poland, the data available cover too short a time-period for reliable assessments. In addition to the official status assessments as carried out by HELCOM [22], trends in the status of single predatory fish species as derived from other sources of peer-reviewed literature are also reviewed and presented. In Table 1, Table 2, Table 3 and Table 4, information on the species considered in the different areas, season, and time-period covered, as well as detailed information on the status/trend in each area and the literature source, are provided.
For a more comprehensive overview, the data are divided into past trends, including data until the 2000s, and current trends/status, including data until the early and mid 2010s (Table 1, Table 2, Table 3 and Table 4). The current status for predatory fish and perch as derived from HELCOM is evaluated for the abundances within the assessment period (2011–2016) in relation to the locally derived threshold value (for data sets covering more than 15 years), and on the direction of trends during the period 2008–2016 (for data sets covering less than 15 years). For pikeperch and pike, current trends are based on literature including data until 2015–2017. See Table 1, Table 2, Table 3 and Table 4 and the work of [22] for details. Despite that the data for coastal predatory fish as a group also include data for individual species as perch, pike, pikeperch, burbot, turbot, and cod, the abundance of all species except for perch is so low that sound statistical analyses are not possible [22]. The trend-assessment of pike and pikeperch as presented in this review is rather based on literature in which monitoring is focused on the species.
3. Past Trends of Coastal Predatory Fish
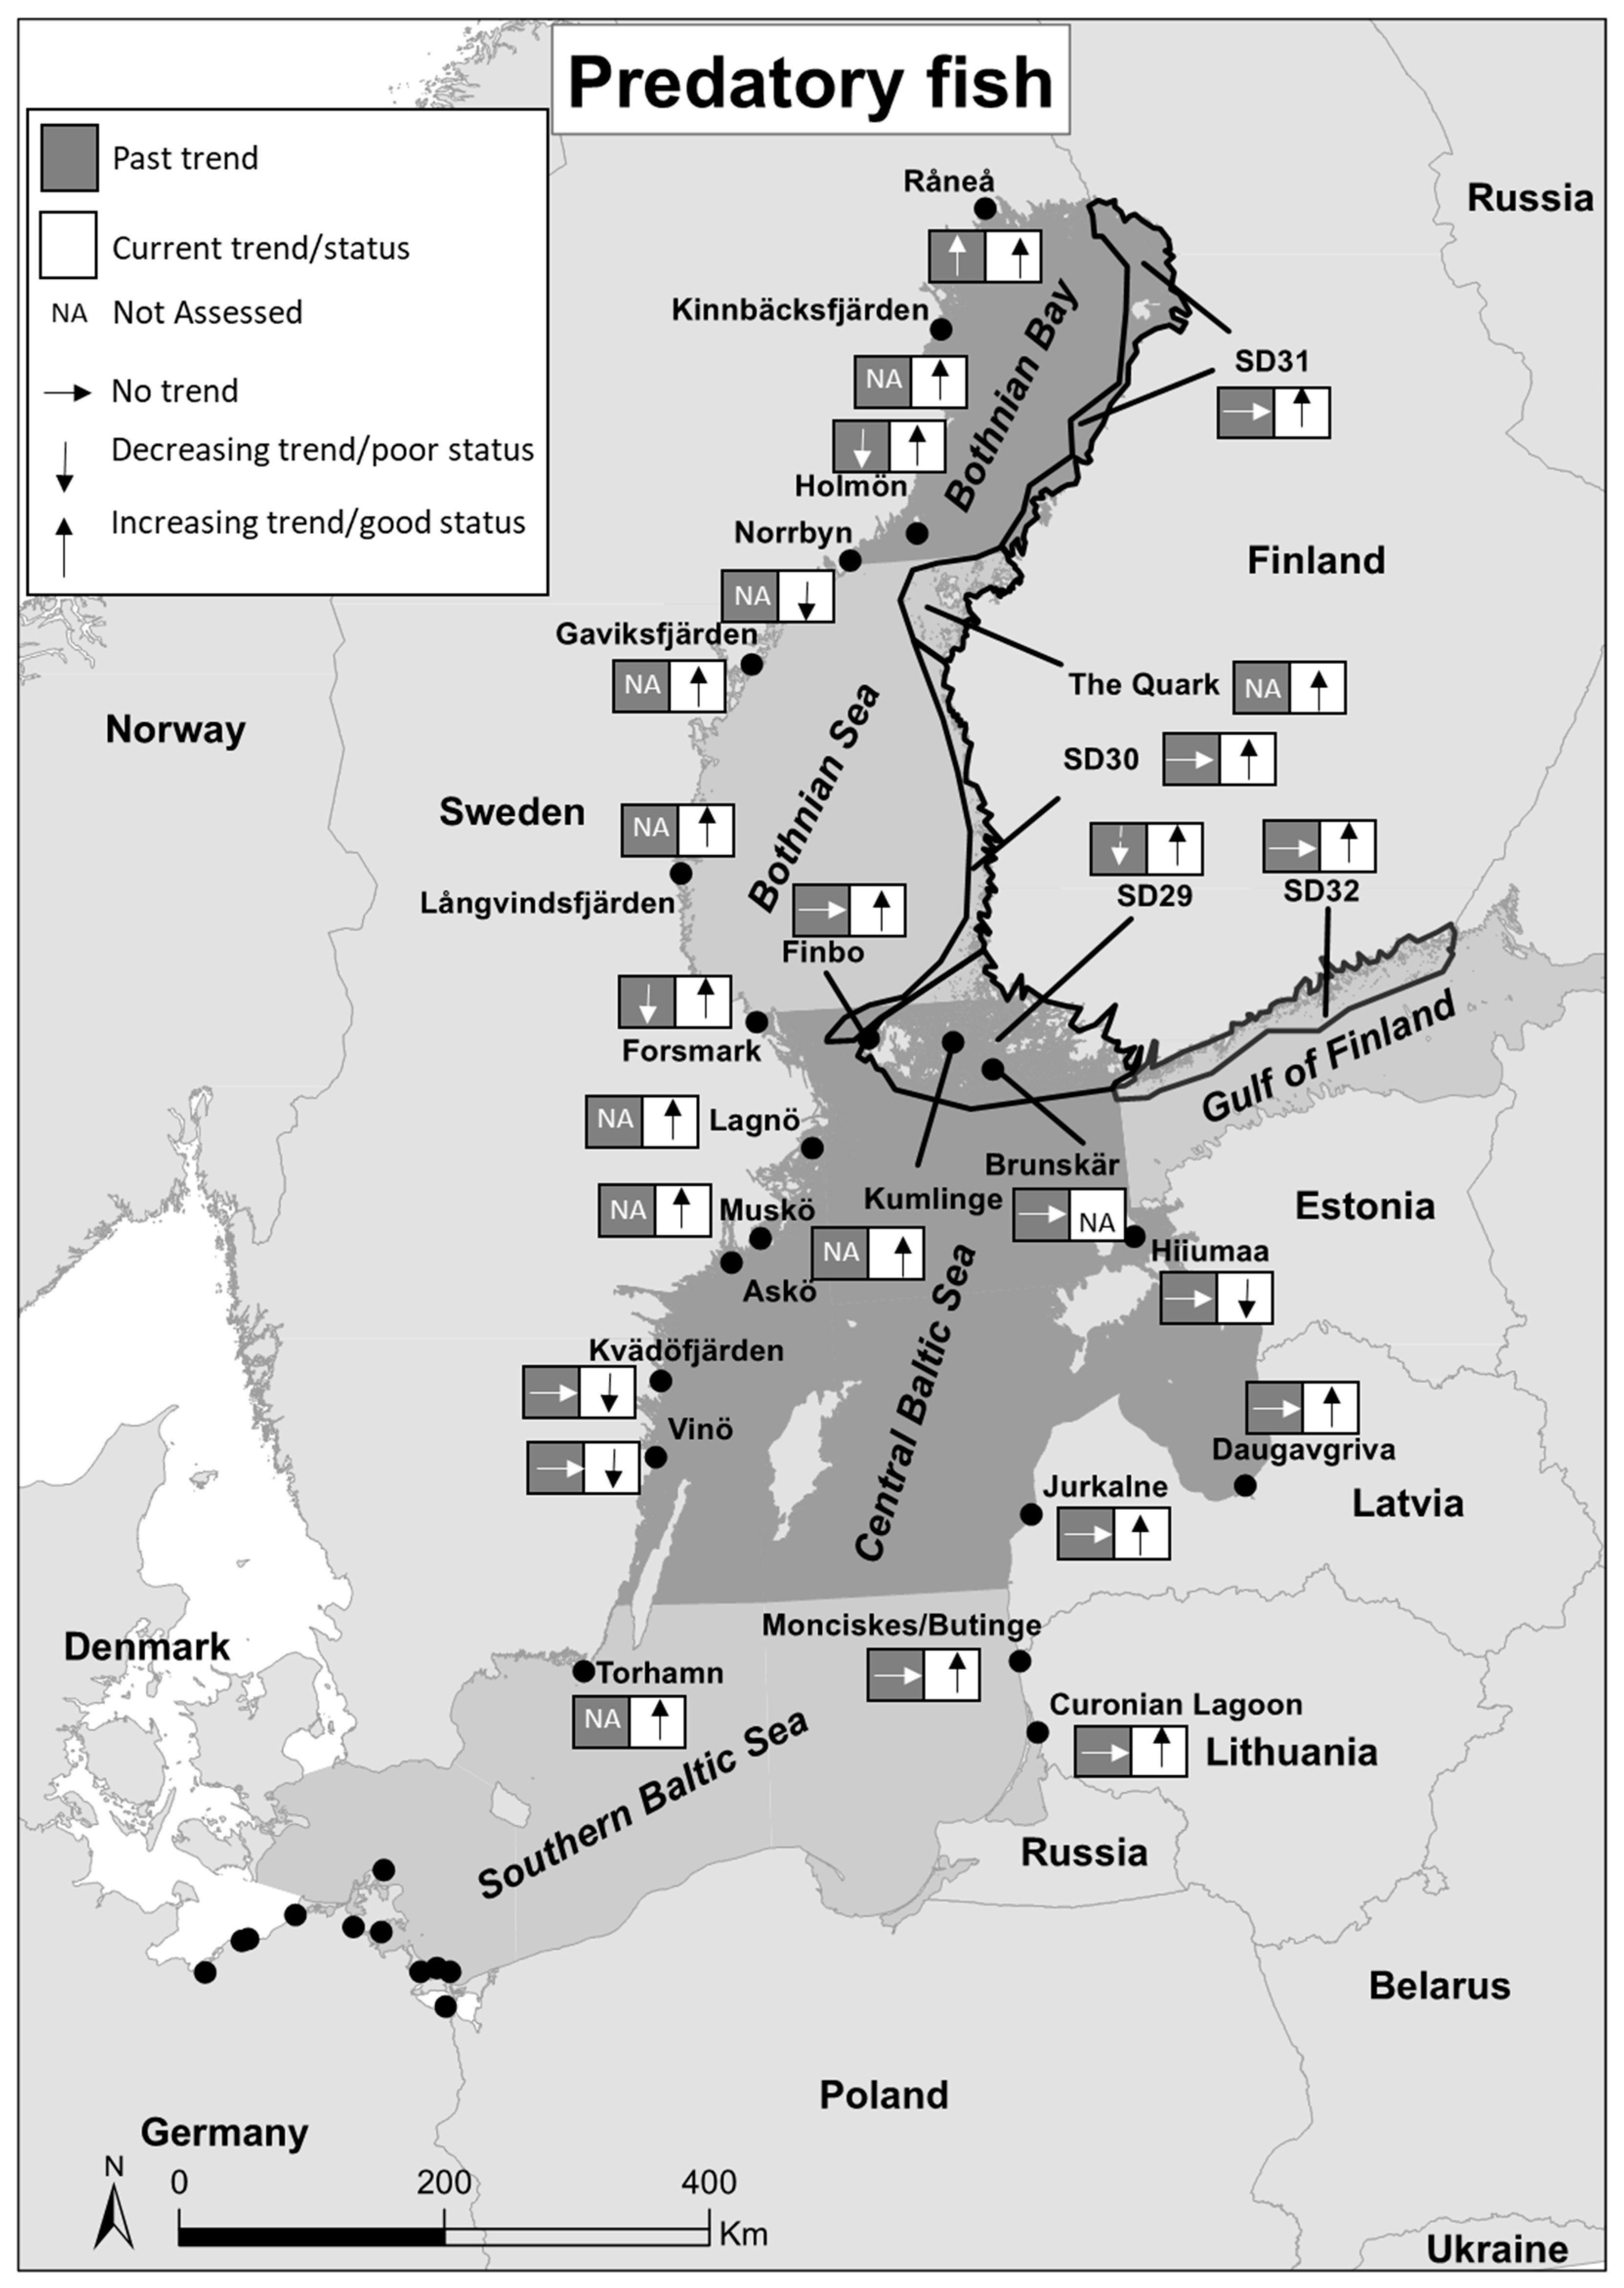
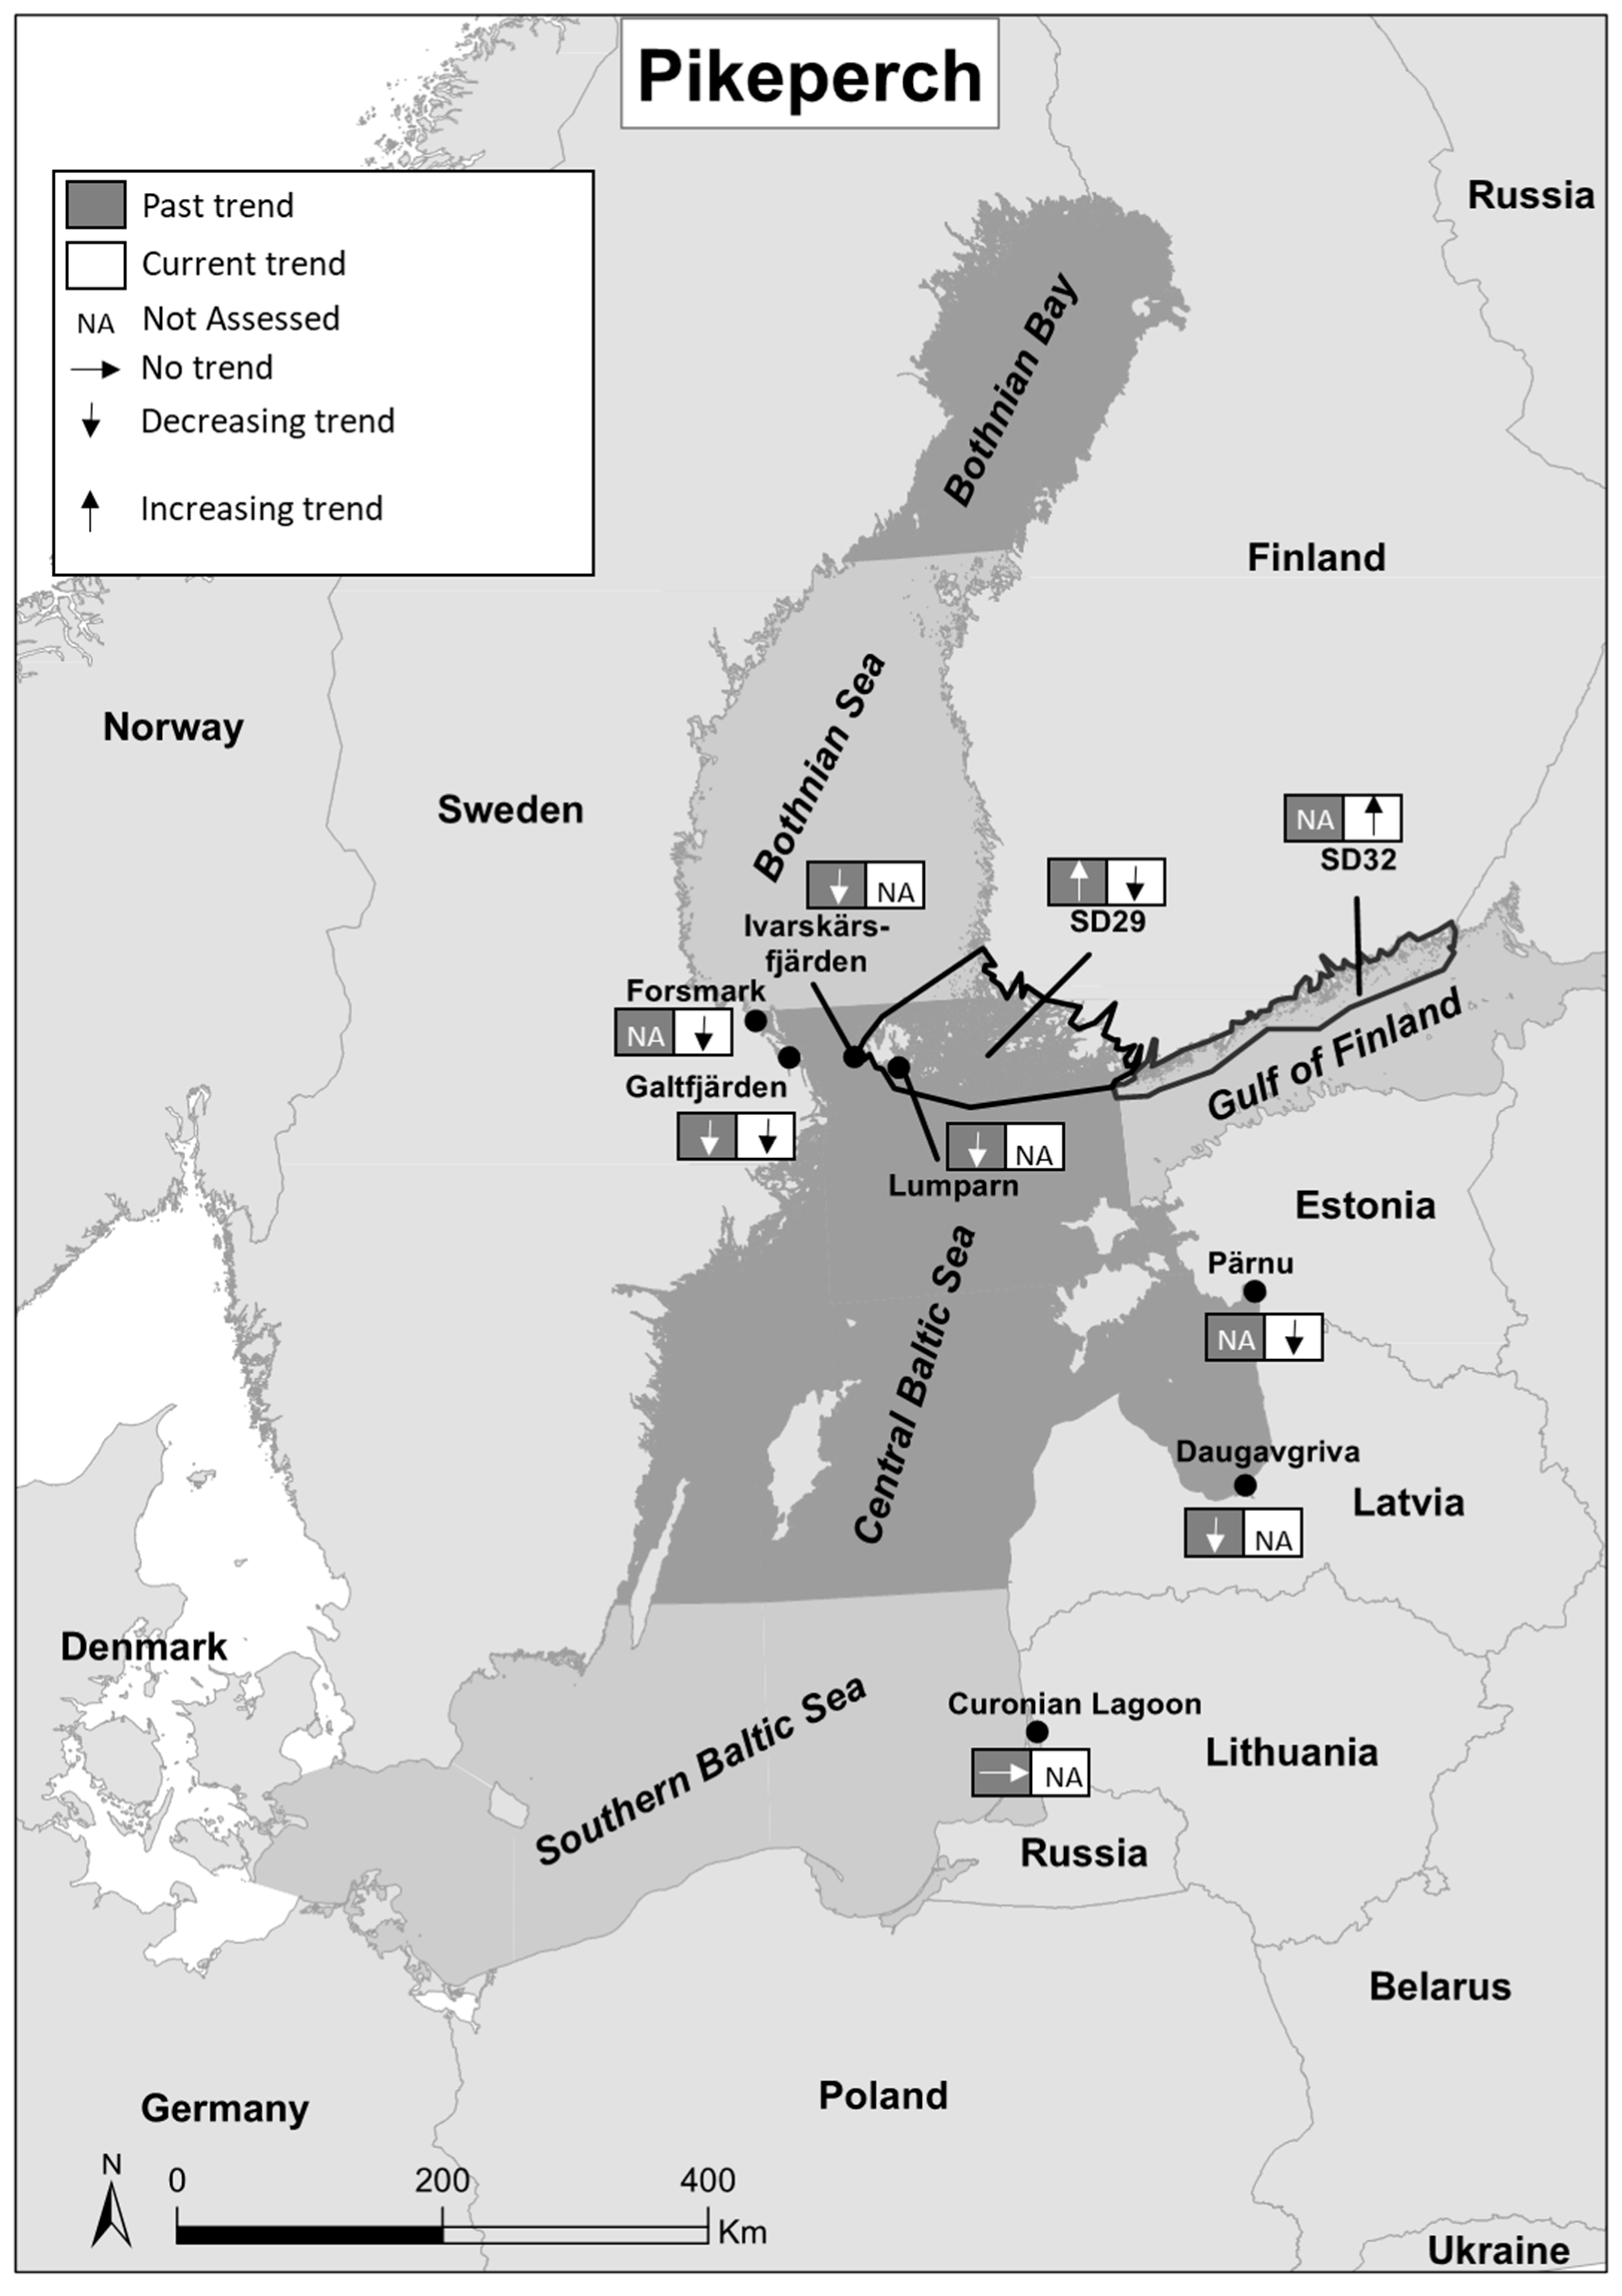
The status of coastal predatory fish as a functional group in the Baltic Sea has rather seldom been addressed outside the scope of the MSFD and BSAP. Recently, however, Bergström and colleagues assessed the trends of coastal predatory fish during the past three decades (1991–2013) using data from coastal fish monitoring programs [21]. The authors divided the time-period into windows of ten years and concluded that there has been an overall decreasing trend across each time-window in the status of coastal predatory fish during the three decades considered. During the last ten-year period assessed (until 2013), however, the authors found signs of improvement [21], and the years 2004–2013 appear to be the most stable in terms of time-trends over the period considered. In comparison, in the current review, I have defined past trends as data until the 2000s, which results in some areas having contradictory trends. When considering the time-period 1991–2009, the trend has generally been stable or positive, with decreasing trends only in the southern Swedish parts of the Bothnian Bay (Holmön), northern Swedish (Forsmark), and Finnish (SD 29) parts of the Central Baltic Sea (Figure 1 and Table 1). In the northern Swedish parts of Bothnian Bay (Råneå), there has been an increasing trend in abundance, and in the other 12 areas considered, the populations appear to have been stable with no temporal trends (Figure 1 and Table 1). No assessment of the past trends in Germany is available (Figure 2 and Table 1).
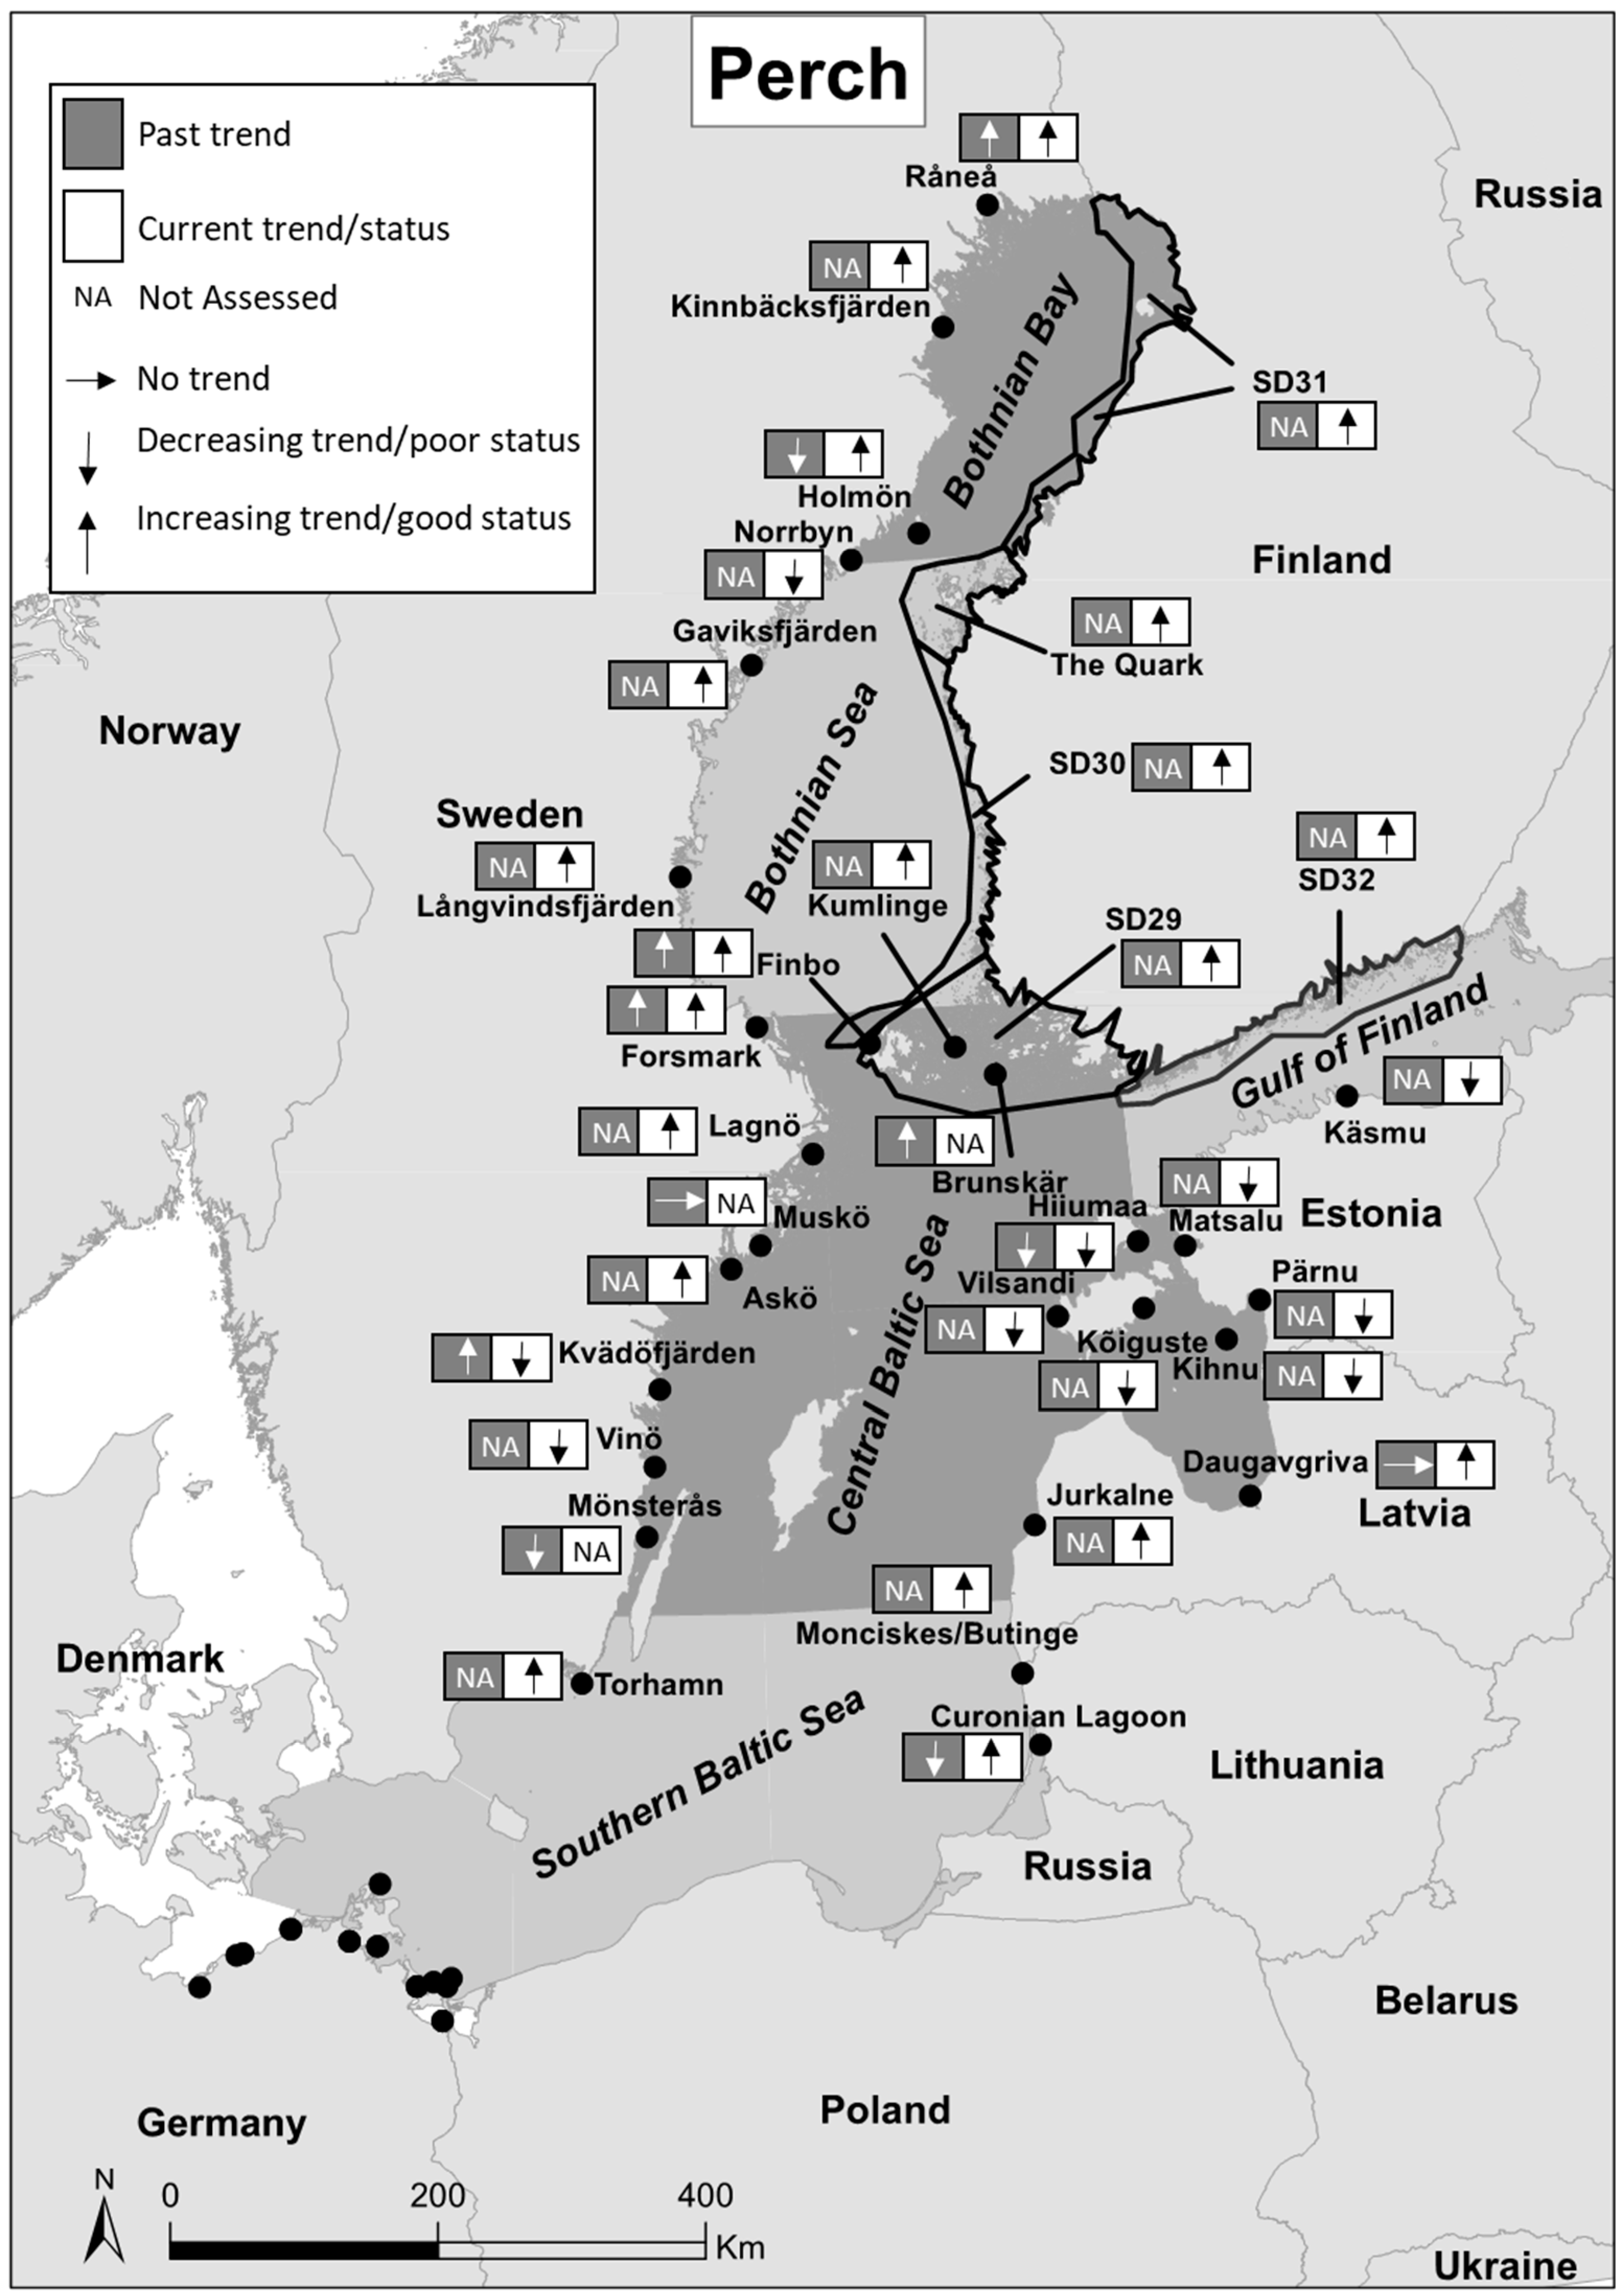
With respect to specific predatory fish species, the spatial coverage of monitoring data during the past decades is more limited, except for that of perch. The relative abundance of perch has increased markedly since the early 1970s in two coastal areas (Forsmark in southern Bothnian Sea and Kvädöfjärden, Central Baltic Sea) along the Swedish coast (Figure 3 and Table 2) [29]. In contrast, Eriksson and colleagues [7] demonstrated a decrease in the abundance of perch in an area in the southern parts of the Central Baltic Sea (Mönsterås) between the years 1970–2003 (Figure 3 and Table 2). Focusing on a shorter time perspective (typically from the early 1990s to early 2000s), Ådjers and colleagues [35] found contrasting trends in monitoring catches of perch in two Swedish areas in the Bothnian Bay (an increase in Råneå and a decrease in Holmön), increasing trends in the northern Central Baltic Sea (Forsmark, Sweden; Brunskär and Finbo, Finland), stable catches in one Swedish (Muskö) and one Latvian (Daugavgriva) area, and subsequent decreasing catches in one Estonian (Hiiumaa) and Lithuanian (Curonian Lagoon) area in Southern Baltic Sea (Figure 3 and Table 2).
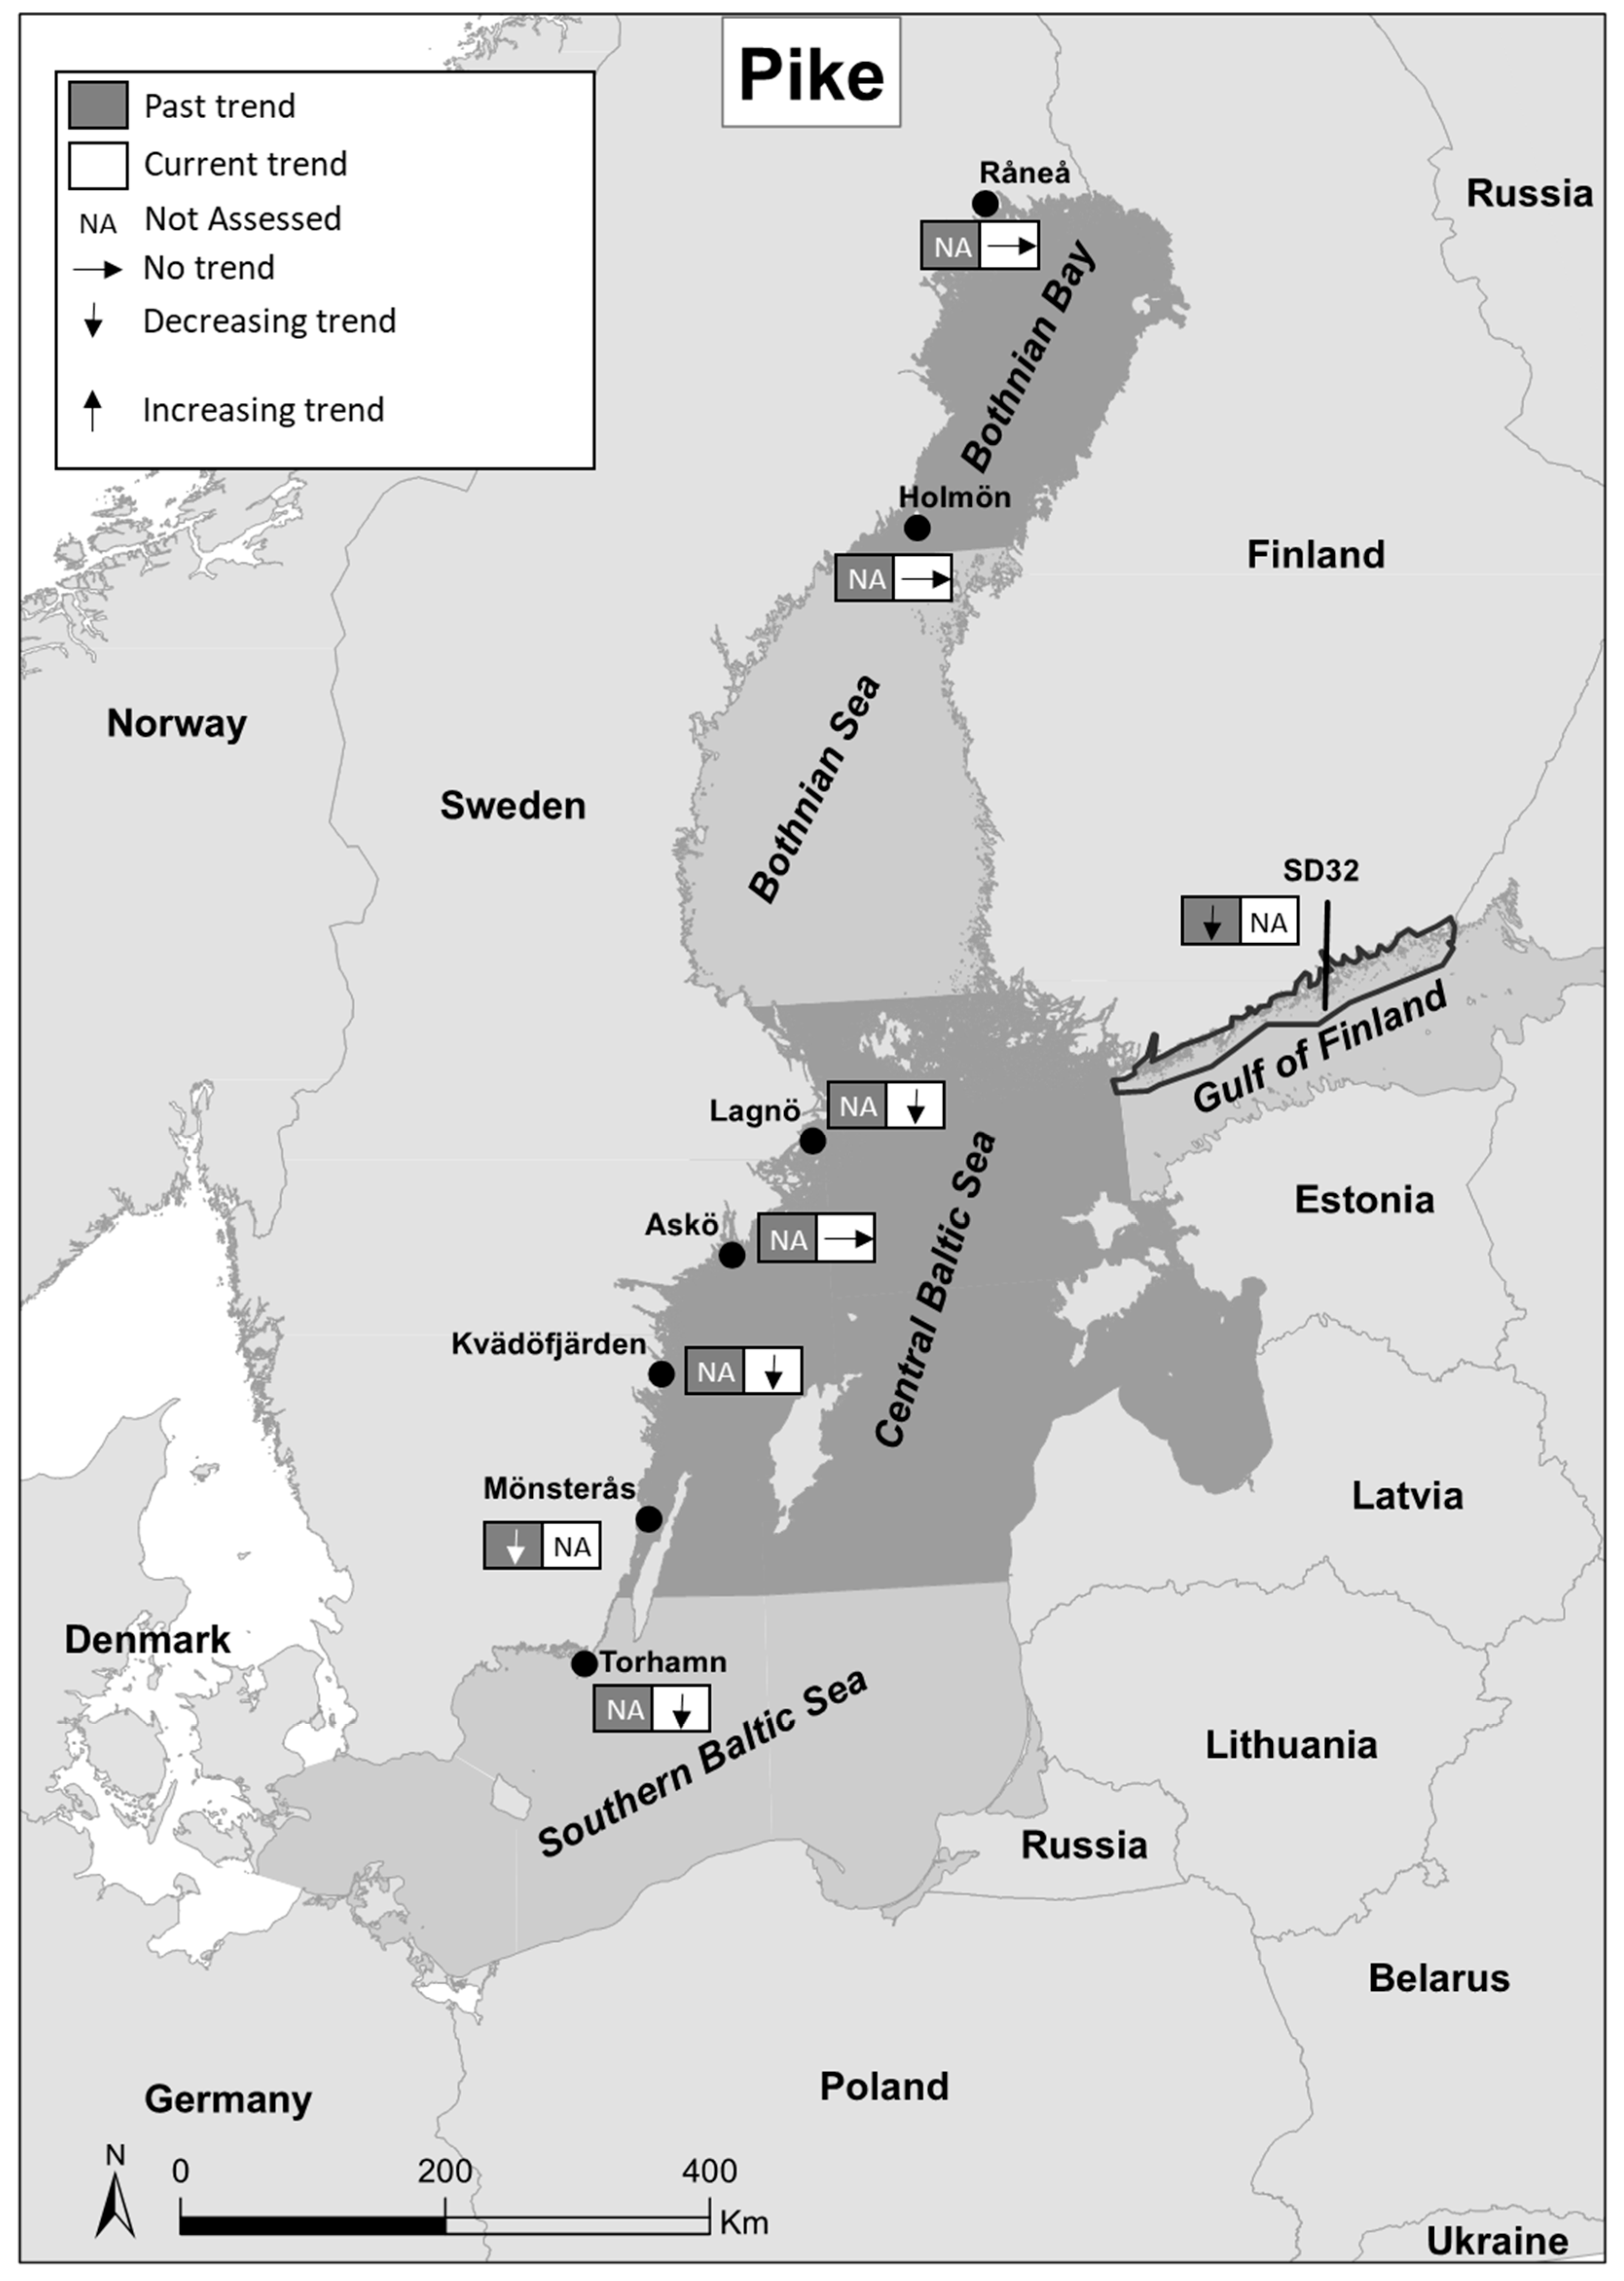
Data on pike spanning a longer time-perspective are even more scarce. To the best of my knowledge, there are only three studies addressing the past development of the species in coastal areas of the Baltic Sea, and all suggest a significant decrease in the abundance of the species. Lehtonen and colleagues [38] show a strong decline in pike catches in the rod fishery in the Western Gulf of Finland between 1939–2007, and a similar pattern is found in one Swedish area in the southern parts of Central Baltic Sea (Mönsterås) between the mid 1990s and mid 2000s [39], as well between 1970–2003 (Figure 4 and Table 3) [7].
For pikeperch, data are mainly available for the Central Baltic Sea, where the species is also most abundant. There are only a few studies addressing the past development of the species, showing declines in the catches in most areas over time (Daugava, Lithuania; Galtfjärden, Sweden; Lumparn and Ivarskärsfjärden, both Finland) [35,40] (Figure 5 and Table 4). In the Curonian Lagoon (Lithuania, Southern Baltic Sea), however, the catches were stable between the years 1992–2002, and in a stock-assessment model of pikeperch in the Finnish Archipelago Sea (SD 29; Central Baltic Sea), the spawning stock biomass was relatively higher during the period 1993–2004 compared with the years 1981–1992 (Figure 5 and Table 4) [33].
4. Current Status of Coastal Predatory Fish
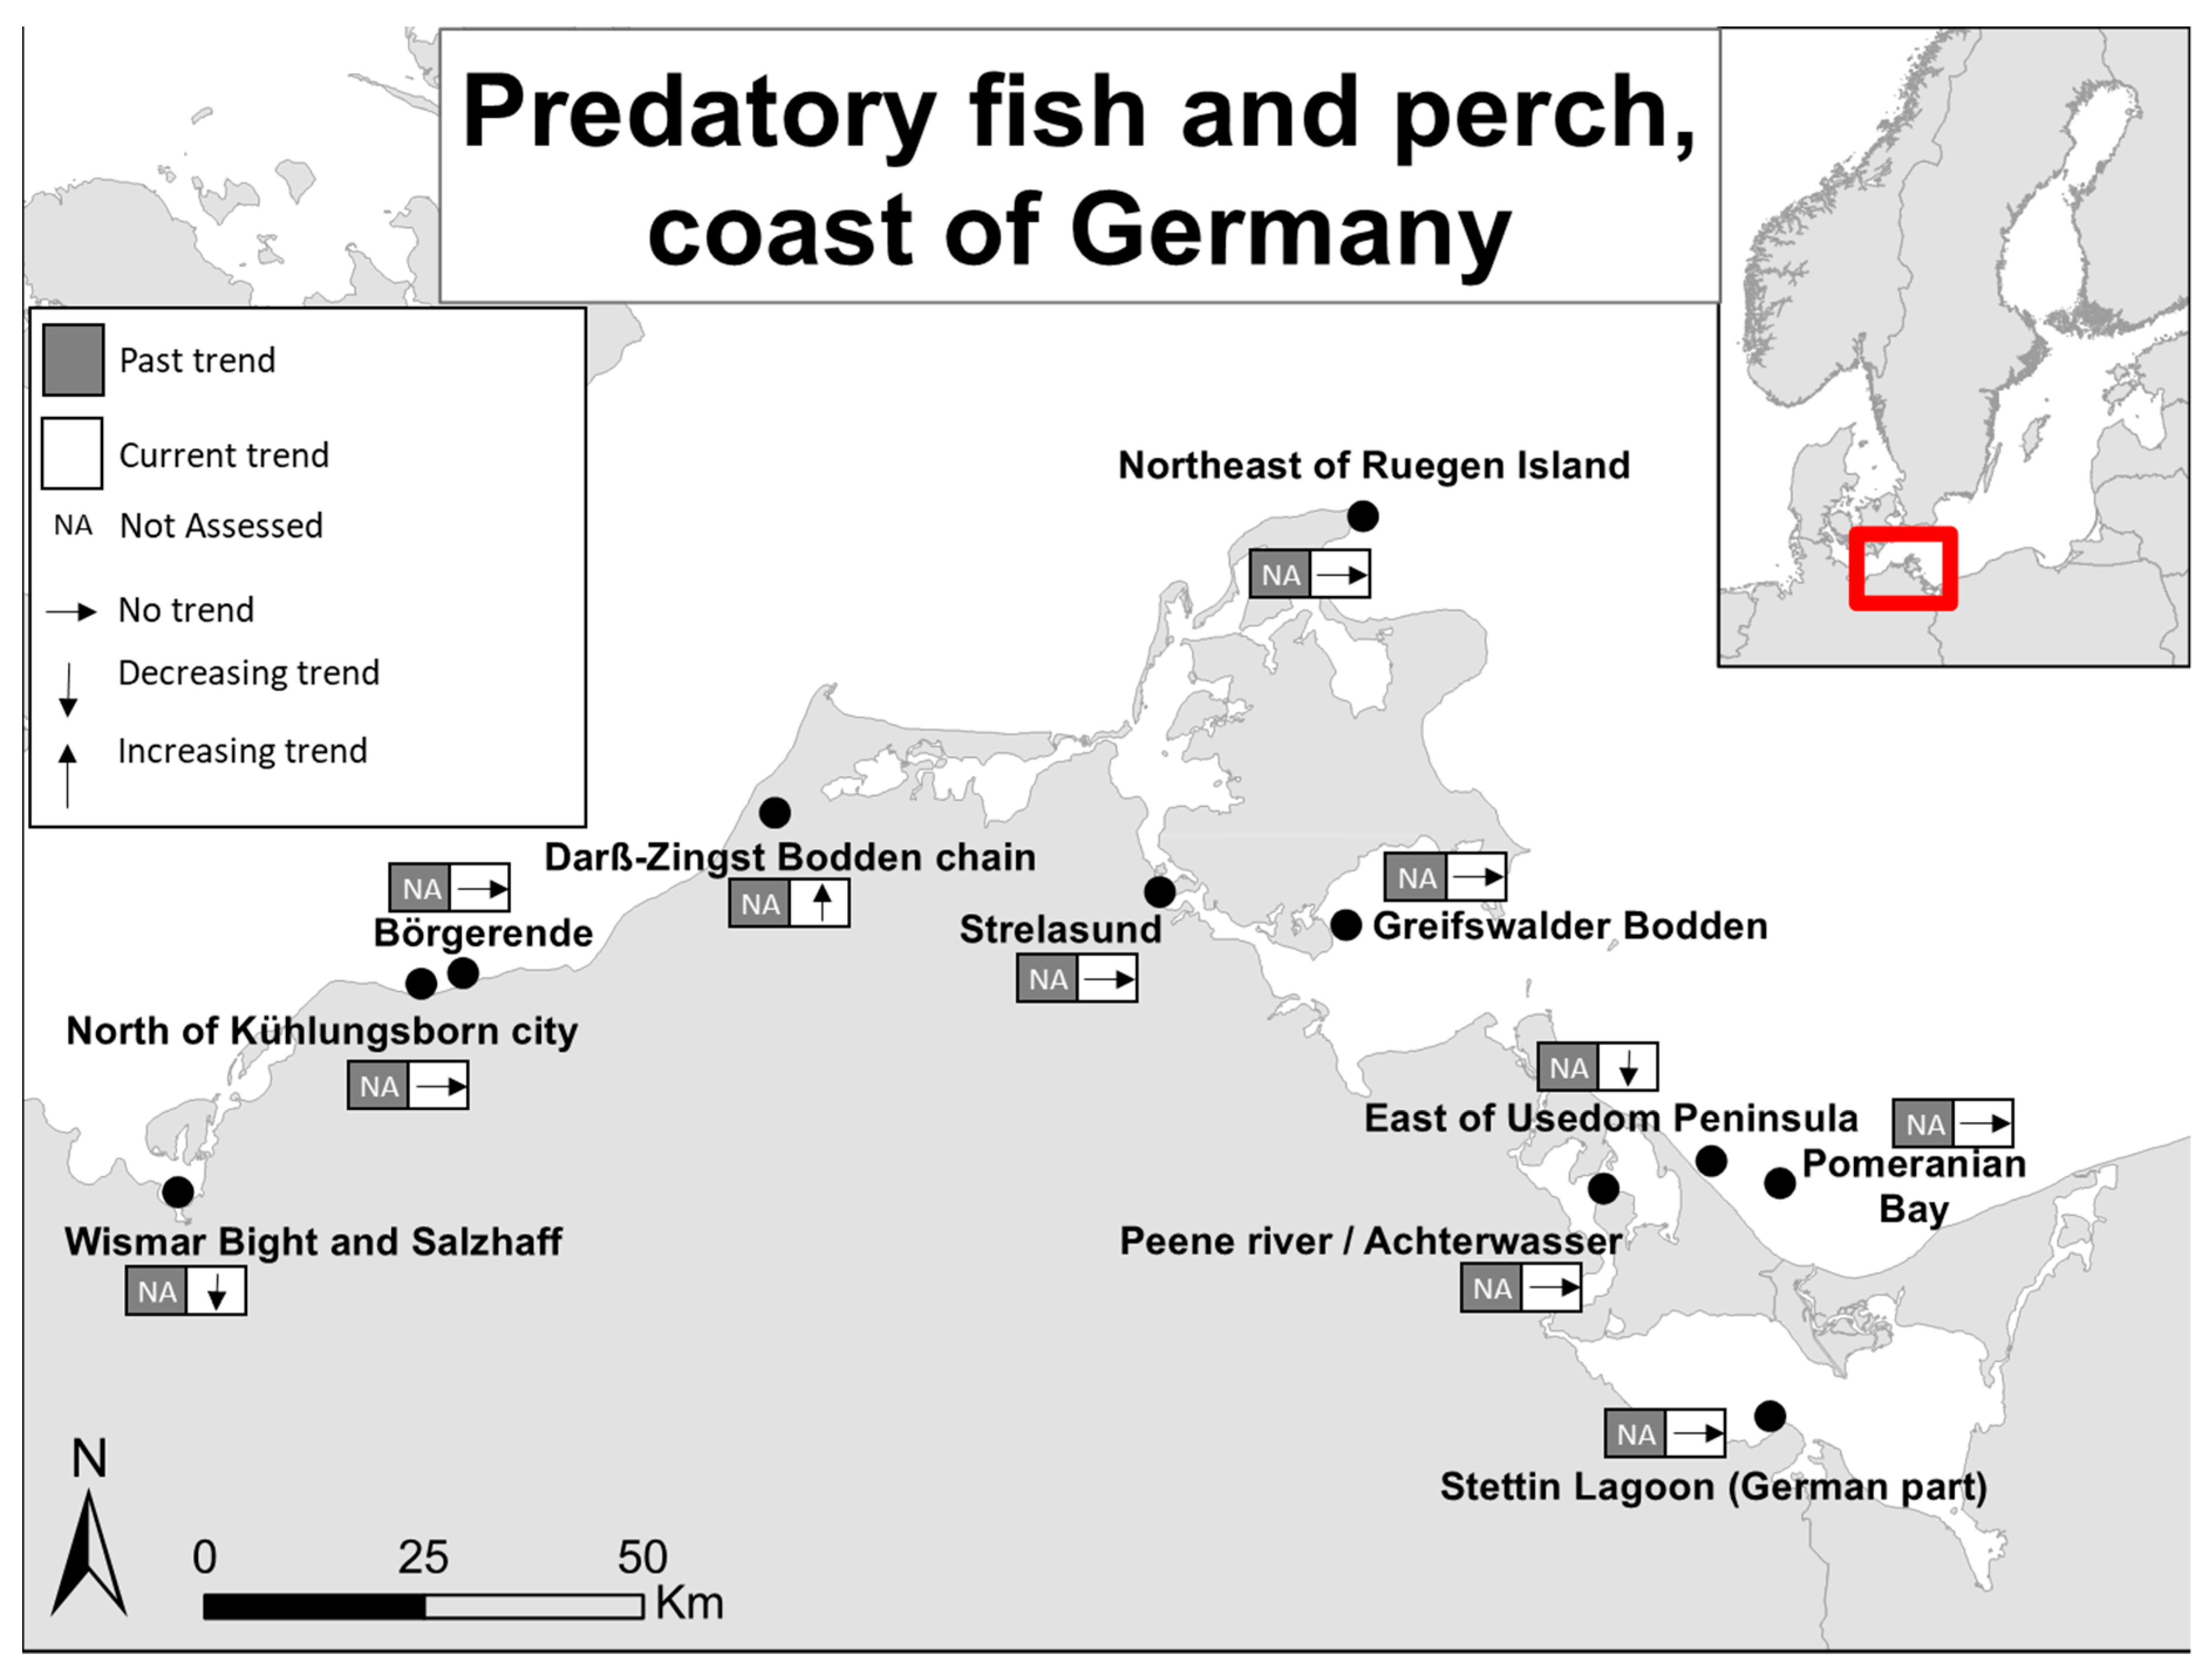
The latest official status assessment of coastal predatory fish [22] was published by HELCOM in 2018 as part of the State of the Baltic Sea (HOLAS II)-report [18], and covers the period between 2011–2016, and in some areas also 2008–2016 (Table 1). As for earlier assessments, the status does to some extent depart between coastal areas, but is assessed as being generally good [22]. According to the assessment protocol applied, decreasing or low abundances (i.e. indications of poor status) have only been observed in 4 out of a total of 25 areas assessed [22] (Figure 1 and Table 1). More specifically, the relative abundance of predatory fish in the monitoring programs has been stable or increasing in the majority of areas along the more northern basins of the Baltic Sea (Bothnian Bay, Bothnian Sea, and Gulf of Finland). Despite that there is no trend in the majority of areas in the Central and Southern Baltic Sea, there are poor statuses in three of the areas in the Central Baltic Sea (Figure 1 and Table 1). There are also declining abundances in one area along the Swedish coast of the southern Bothnian Bay (Norrbyn; Figure 1 and Table 1). Unpublished data from Germany (Southern Baltic Sea) suggest stable catches of predatory fish (mainly perch) in coastal trawl surveys undertaken between the years 2003–2014 (Pomeranian Bay; Helmut Winkler, unpublished data; Figure 2 and Table 1), and stable or increasing catches in eight out of ten additional areas monitored using gillnets between the years 2008–2013 (since 2003 in the area Börgerende; Norbert Schulz, unpublished data; Figure 2 and Table 1). It is only in the two areas of East of Usedom Peninsula and Wismar Bight and Salzhaff where the abundances have declined recently.
When considering only perch, an almost identical pattern as the one outlined for predatory fish above is seen [22] (Figure 3 and Table 2). The rationale for this is that perch constitutes the vast majority of the predatory fish individuals in the monitoring catches [22]. The national MSFD assessment in Finland concerning perch is identical to that undertaken by HELCOM, suggesting increasing or stable abundance in all areas assessed [42] (Figure 3 and Table 2). As a contrast, the national MSFD assessment in Estonia suggests a poor status of the abundance of perch in all seven areas assessed [36] (Figure 3 and Table 2). As for predatory fish as a functional group, there are additional and unpublished data for perch from coastal trawl surveys and gillnet monitoring in Germany in the Southern Baltic Sea, and the pattern is identical to that of predatory fish (Figure 2 and Table 2).
Data on pike from fisheries-independent surveys are, as mentioned above, very limited. It appears that there is only recent data from a few monitoring programs along the Swedish Baltic Sea coast, and no Baltic-wide assessment has been undertaken. The Swedish data indicate decreasing abundances in two areas in the Central Baltic Sea (Lagnö and Kvädöfjärden) and in one area in the Southern Baltic Sea (Torhamn) since the early 2000s [37] (Figure 4 and Table 3). There seems to be a spatial pattern where the abundance in the two areas in the northernmost parts of the coast (Råneå and Holmön, Bothnian Bay) has been stable, whereas in more southern areas (in the Central and Southern Baltic Sea), the abundances have generally decreased. The catches of pike in current monitoring programs are very low (usually only a few individuals per program) [37], and the reliability of data is hence uncertain. Despite that there is no regional status assessment of the species at present, the pattern along the Swedish coast with declining abundances foremost in the southernmost parts does support the general perception, as conveyed by fishermen and the public, of a decline in the abundance of pike in the Baltic Sea.
In comparison with pike, pikeperch is a species that is more abundant in existing monitoring programs. Despite this, data for assessments for pikeperch from more recent years are very limited. In two Swedish areas along the northern Central Baltic Sea coast (Galtfjärden and Forsmark), the abundances have declined substantially during the past 15–20 years [39,41] (Figure 5 and Table 4). Past trends are only published for Galtfjärden, where the trend until 2008 was negative [40] (Figure 5, Table 4), in turn suggesting a long-term decline of the population in the area. According to national MSFD reports in Finland and Estonia, the status of pikeperch is assessed as being poor in the Archipelago Sea (SD 29, Finland) and in Pärnu (Estonia), but good in the Gulf of Finland (SD 32, Finland) [36,42] (Figure 5 and Table 4). Interestingly, data from the Archipelago Sea (SD 29) suggest a negative development of the population during recent years, because the past trend (data until 2004) was positive [33] (Figure 5 and Table 4).
Not only the abundance, but also the size structure of populations is important for population viability and the ecological function of the system [12,43,44]. However, little is currently published concerning the size structure of coastal predatory fish in the Baltic Sea, and no coordinated assessment has hitherto been undertaken [22]. The information available does, however, describe an increase in the mean weight of pike between 1939–2007 in the western parts of the Gulf of Finland, concurrent with a sharp decline in the abundance of the species in the area [36]. For pikeperch, the abundance of individuals above the minimum landing size (40 cm) along the Swedish coast is very low [37], and along the Estonian coast the size structure is characterized as being in poor status in five out of the seven areas considered [36]. Lappalainen and colleagues [45] also showed that the length at maturity (TL50) of pikeperch in the Archipelago Sea and Helsinki regions (Finland) was substantially lower compared with that of the Pärnu region (Estonia). The authors linked the differences in length at maturity across areas to the intensity of fishing, where the highest fishing pressure is assumed in the Archipelago Sea. In Sweden, an indicator of the size structure of perch populations (L90, i.e., the length of the individual fish at the 90th percentile of the size distribution in the population) was developed for the Swedish national MSFD reporting in 2018 [46]. The assessment of the indicator suggests stable values during the most recent six years (2011–2016) in relation to a preceding reference period (2002–2010) in 7 out of 11 areas assessed [46]. In two of the areas (Kinnbäcksfjärden and Norrbyn in the Bothnian Bay, Figure 1), the value of the indicator during most recent years has been low compared with that of the reference period, and in another two areas (Lagnö and Askö in the Central Baltic Sea, Figure 1), the values of the indicator have declined during the past ten years.
5. Impacts on Coastal Predatory Fish Populations
The Baltic Sea is one of the most heavily impacted marine systems in the world [18], and coastal areas are hot-spots for anthropogenic impact [47,48]. In contrast to the offshore Baltic Sea, where the fish community is mainly impacted by commercial fishing, eutrophication, and climate [49], coastal fish communities are also increasingly impacted by habitat degradation, recreational fishing, boating, interactions in the food web, and hazardous substances [50,51,52,53,54,55]. To that end, as most coastal fish species have local population structures in combination with the strong environmental gradients in the Baltic Sea, the major impacting pressures influencing coastal predatory fish populations vary between areas and regions [28,29]. Some general patterns are, however, discernible.
A changing climate with increasing water temperatures and decreasing salinities in the Baltic Sea generally favours coastal predatory fish species such as perch, pike, and pikeperch [25,28,29,33,56,57]. The response to eutrophication, however, differs among coastal predatory fish species. Whereas pikeperch are favored by elevated eutrophication [58], perch and pike appear to be favored by moderate levels of nutrient concentrations [27,58].
Both recreational and small-scaled coastal commercial fishing targets coastal predatory fish species, but to a different extent among regions [22]. In many places, however, the outtake of perch, pike, and pikeperch from the recreational fisheries sector greatly outnumbers that of the commercial sector [59]. Despite that the impact from fishing on coastal predatory fish populations might be obvious, there are only few examples demonstrating this. Such examples include positive effects of no-take zones for pike and perch [43,60,61], differences in length at maturation of pikeperch in Finland and Estonia as a result of differences in fishing pressure [45], and the collapse of coastal fish stocks in Estonia due to a sharp increase in the number of fishermen and fishing effort as a result of the fall of the Soviet Union [62].
There is a general consensus among fisheries’ biologists that the availability and quality of essential habitats (for example, spawning and recruitment habitats) should set the limits for coastal fish production, reviewed in [63]. For coastal fish in the Baltic Sea, however, this has seldom been directly demonstrated [63]. Evidence for the role of essential habitats for coastal predatory fish production is accumulating, however, and Sundblad and colleagues [53] show a strong correlation between the availability of recruitment habitat and the abundance of adult perch and pikeperch along Swedish and Finnish coasts. The availability and quality of recruitment habitats for perch and pike are furthermore believed to exhibit a strong gradient with higher quality and availability in the innermost and central parts of archipelagoes to less favorable and functional habitats in the more outer and exposed parts of the archipelago [39]. In addition, predatory fish such as pike and perch utilize coastal tributaries and streams for spawning and recruitment along many coastal areas in the Baltic Sea [57,64,65]. However, both the quality and availability of essential habitats for predatory fish in coastal areas, tributaries, and streams have deteriorated during decades and centuries as a result of intense physical exploitation of [66,67], as well as boating in [55,68], the habitats.
Not only external factors such as climate, eutrophication, fishing, and habitat exploitation are structuring and impacting coastal predatory fish communities and populations in the Baltic Sea. Processes and interactions within the food web are also of key importance for the status of coastal predatory fish. Increasing populations of apex predators such as seals and cormorants are estimated to consume a significant amount of coastal fish species in the Baltic Sea [69,70,71,72,73,74,75]. Evidence for the resulting effects from this source of natural predation on coastal predatory fish populations is intensively debated and ambiguous, ranging from being likely significant in some areas to be of minimal importance in others [52,71,72,76]. Lower trophic-level mesopredatory fish such as three-spined sticklebacks (Gasterosteus aculeatus) and sprat have increased dramatically in numbers in the Baltic Sea during recent decades [6,7,37,73]. As for apex predators, the impact from these fish on coastal predatory fish populations varies among areas, species, and populations. In addition, correlative studies suggest negative impacts of stickleback abundances on early life stages of perch and pike in coastal areas of the Baltic Sea [73,74,75]. As mesopredatory fish migrate between offshore and coastal areas [73], spill-over effects from the offshore Baltic Sea might also impact the food-web structure and function in more coastal areas [7,77].
Hazardous substances are recognized as one of the key impacting pressures in the Baltic Sea ecosystem [18]. Despite indications of impaired health status of perch at the individual level along the Swedish coast as a result of exposure to harmful toxic substances [50,78], negative effects from hazardous substances on the population level of coastal predatory fish have not yet been demonstrated.
This review has so far focused on the potential single effects from impacting factors on recipient coastal predatory fish populations. In nature, however, effects of external factors on populations and communities commonly interact, potentially leading to additive and reinforcing effects [79]. A negative impact on a coastal predatory fish population from a changing climate might, for example, be reinforced by a concurrent increase in the fishing pressure. Despite that additive and reinforcing effects from multiple and interacting factors on coastal predatory fish have received little attention so far, such effects are likely perceivable.
Another issue worth considering is that the geographical scale at which impacting factors affect coastal predatory fish populations varies. Some factors such as climate, eutrophication, and species migrations might operate on a regional or Baltic-wide scale [7,28], whereas others such as habitat quality and availability, interactions in the food web, and fishing may only have local effects. As coastal predatory fish are local in their appearance, this warrants special consideration when managing the population and stocks. Often, the local perspective must be applied, but with respect to the impact of a warming climate, a more regional or even global perspective is needed.
6. Measures to Restore and Support Coastal Predatory Fish Populations
Measures to restore and protect coastal predatory fish populations should be developed with a local perspective as the populations are often local in their appearance and might respond differently to the strong environmental gradients and plethora of potentially impacting pressures in the Baltic Sea [25,28,32]. The set of measures applied hence might differ across regions, species, and populations. As in other marine and freshwater systems, measures directed to support coastal predatory fish populations have rarely been evaluated scientifically [22]. The few measures that have been evaluated with proven positive effects, however, include those aiming at reducing the fishing mortality and, to some extent, also those aiming at protecting and restoring essential habitats [22]. A successful example of measures aiming at reducing fishing mortality is the establishment of permanent no-take areas for perch, pike, and pikeperch in Sweden [43,60,61], and partially also for gear regulations for pikeperch in Finland [80]. In many countries in the Baltic Sea, there are regulations for coastal fisheries such as no-take areas, temporal fishing closures, catch regulations (bag-limits, minimum and maximum landing sizes), and gear restrictions (limits on the maximum number of fishing gears allowed per time unit and mesh size restrictions of the nets used) [59]. To date, however, the effects on targeted populations and stocks as a result of the implementation of these measures have seldom, if ever, been scientifically evaluated.
For measures aiming at strengthening the production of coastal predatory fish, actions related to habitat protection and restoration have scientific support for their effectiveness [22]. In the case of habitat protection, there is no direct evidence for the effects, but substantial indirect evidence [63]. The availability and quality of spawning and recruitment habitats have been shown to be positively related to the population size of adult perch and pikeperch [53], and human impacts such as the construction of piers and marinas and their associated boating traffic have proven to be negative for the quality of these essential habitats [56,68]. It should hence be more cost-effective to protect and minimize impacts on these habitats than to restore them once they are in a deteriorated state [63]. Scientific evaluation of measures related to habitat restoration mainly comes from restoration of coastal tributaries and wetlands that serve as spawning and recruitment areas for pike and, to some extent, also perch. Nilsson and colleagues [66] documented a sharp increase in the production of juvenile pike in a wetland along the southern Swedish Baltic Sea coast restored to create optimal spawning conditions for the species. Whether or not an increased production of juvenile pike also results in increased abundances of adult pike in the area is not yet well established, but see [81].
There is to date no scientific evidence for a positive effect on coastal predatory fish populations from measures related to stocking, nutrient abatement, reduction of hazardous substances, or biomanipulation (e.g., reduction of predators and competitors such as other fish species and apex predators). Given the little evidence that currently exists, a combination of measures targeting both fisheries sectors (both recreational and commercial) and the essential habitats for the fish in concert likely results in the highest effects [63].
7. Conclusions and Future Perspectives
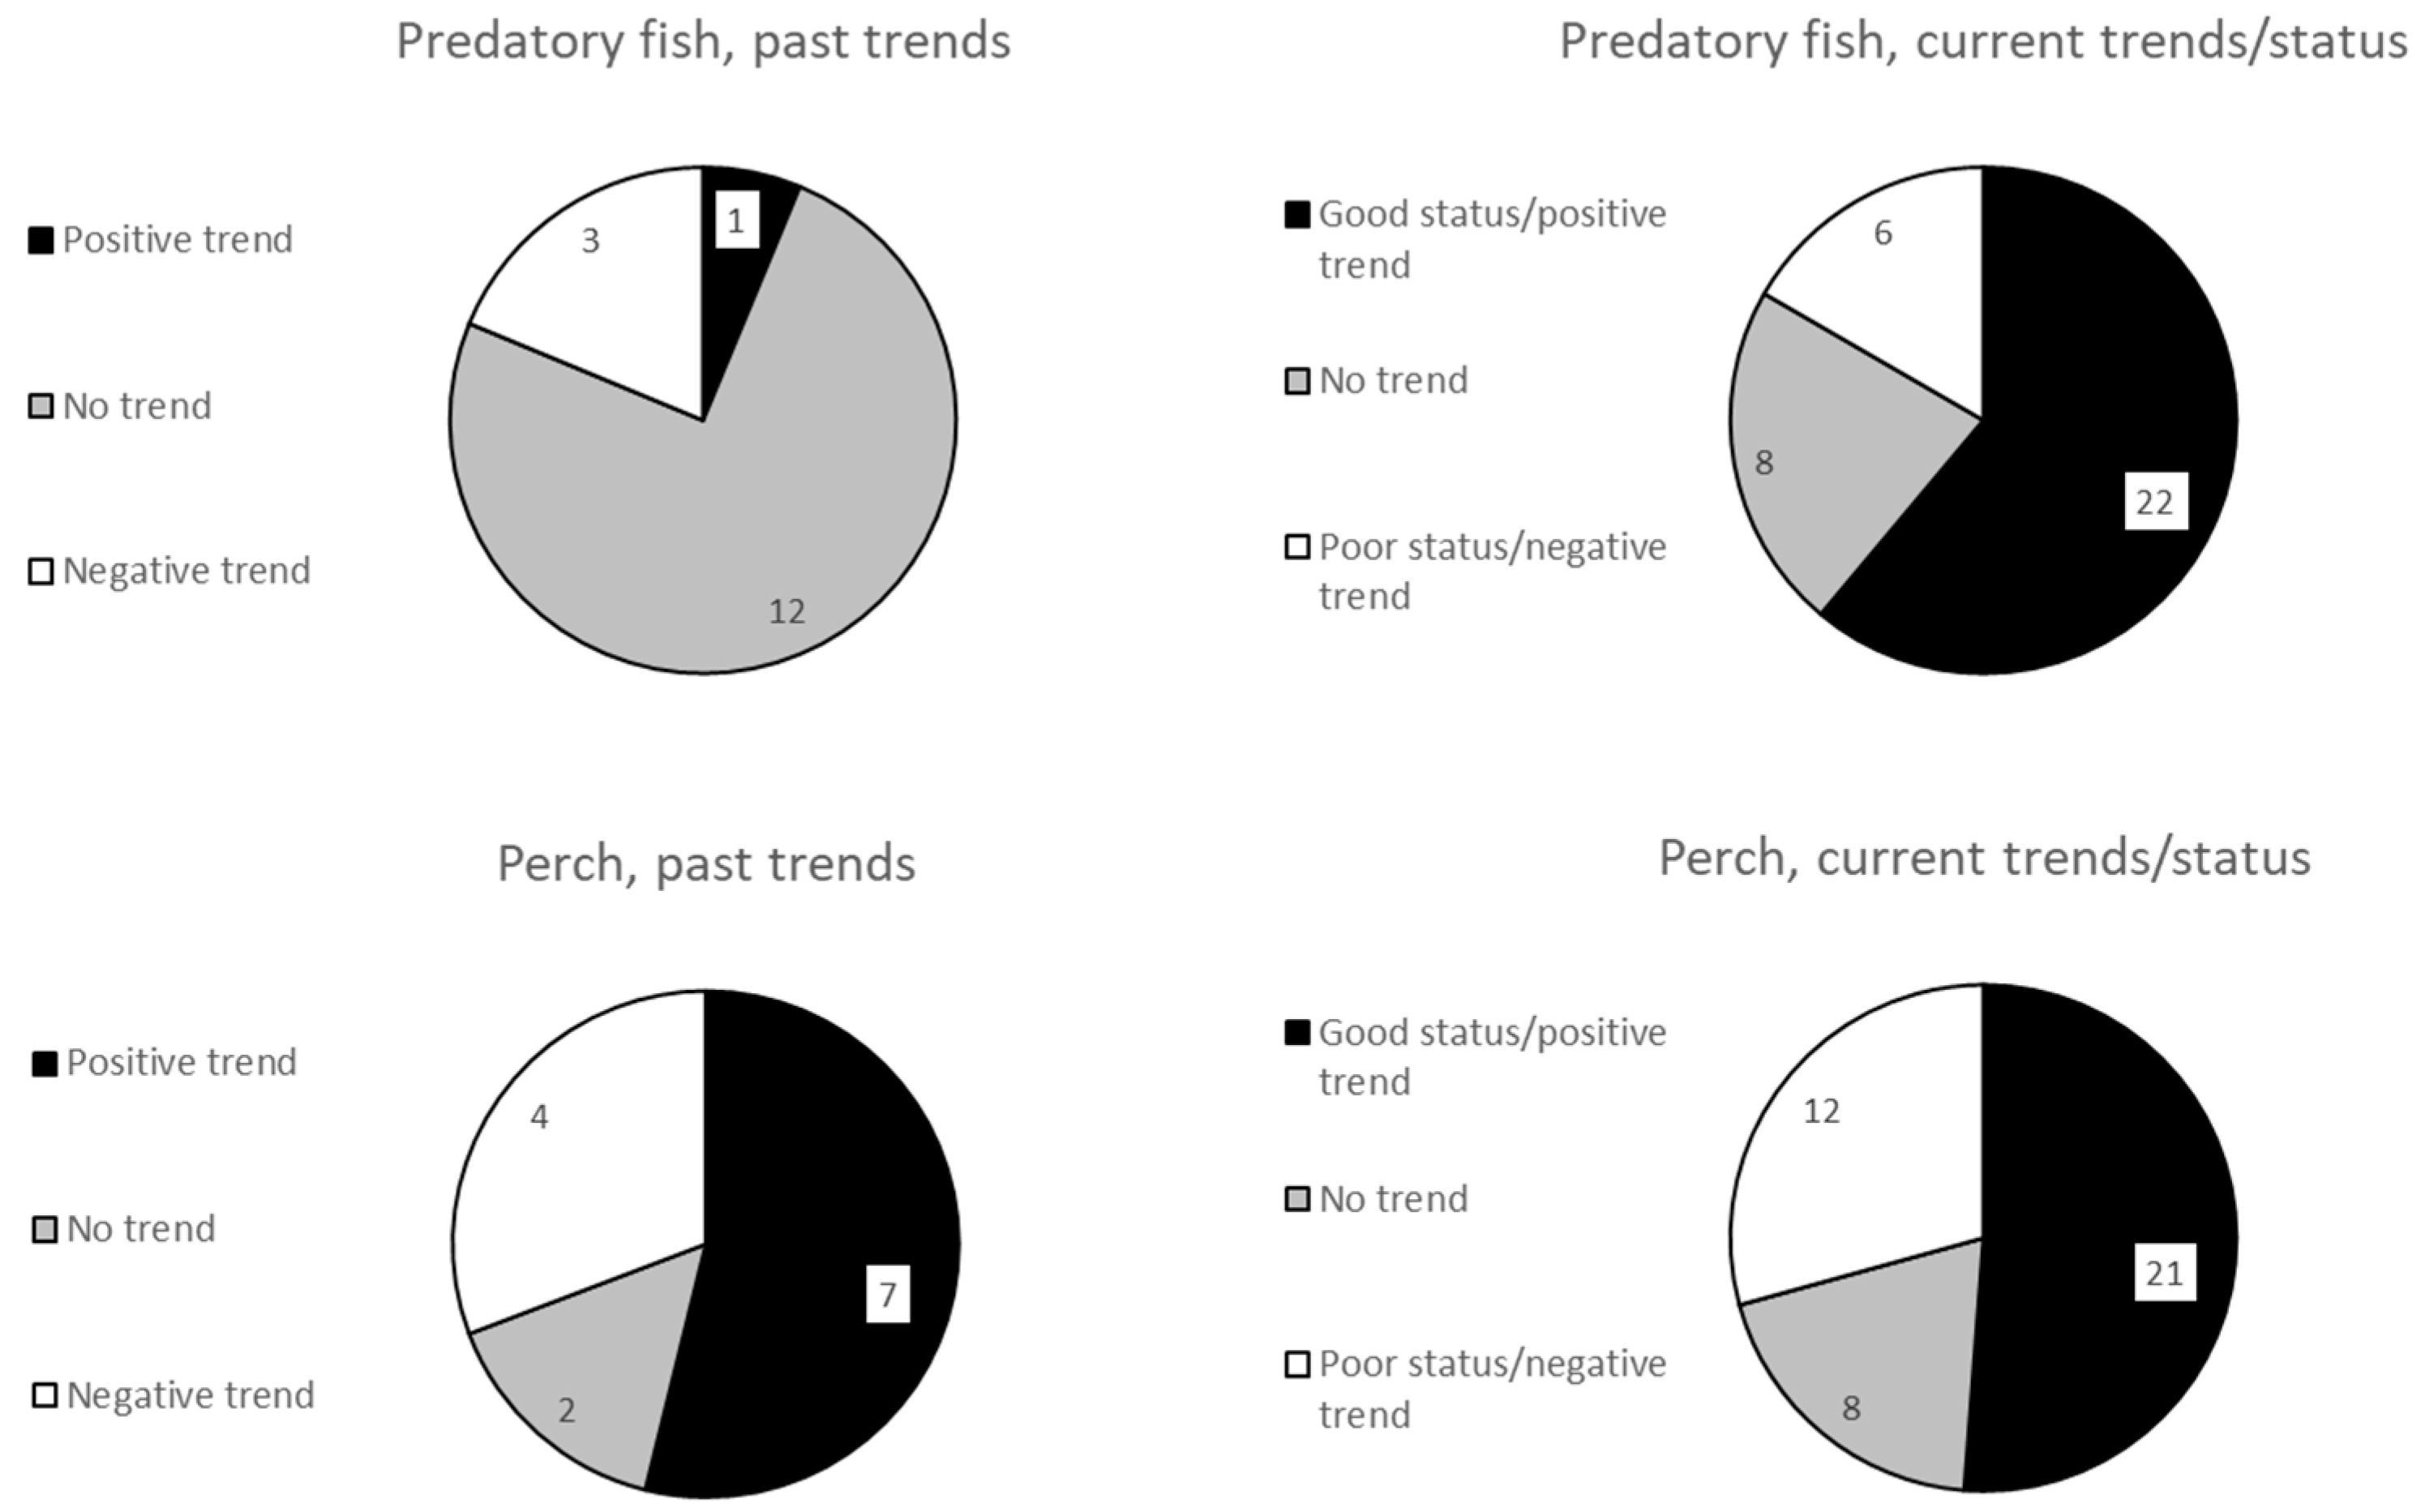
The standpoint of many fishermen, both recreational and commercial, as well as the general public, is a general, drastic, and sharp decline of coastal predatory fish populations in the Baltic Sea during recent decades. In this paper, the scientific basis for such a statement is reviewed. To date, data for assessments of the status of the coastal predatory fish are limited in both a temporal and spatial perspective, as well with respect to the species included. The available literature nevertheless suggests an overall good situation for coastal predatory fish as a functional group and for perch during recent decades in those few areas for which data are available (Figure 1, Figure 2 and Figure 3 and Table 1 and Table 2). Exceptions to this pattern are the southern parts of the Swedish Bothnian Bay coast and Central Baltic Sea coast, the Estonian part of the Central Baltic Sea coast, and in two areas along the German coast of the Southern Baltic Sea (Figure 1, Figure 2 and Figure 3). Because of differences in the areas considered over time (Table 1 and Table 2), it is difficult to address temporal changes in the status of perch and predatory fish as a functional group. When addressing this in dividing time-periods into data covering the years until the 2000s (past trends) and until the early and mid 2010s (current trends), there appears to be no major difference in the share of time-series exhibiting a negative trend and/or poor status (Figure 6). The share of time-series exhibiting a negative trend and/or poor status for predatory fish was 19% when considering past trends and 17% for current trends. For perch, the corresponding figures are 31% and 29%, respectively. What is obvious, however, is that the number of time-series has increased over time (from 16 (past) to 36 (present) for predatory fish, and from 13 (past) to 41 (present) for perch), as have the quality of the assessments (from only trend-based assessments before 2007 to mainly threshold-based assessments after 2008; Table 1 and Table 2). For pike and pikeperch, data are less extensive and suggest decreasing trends in abundance in the majority of areas for which data exist, in both a past and current time-perspective (Figure 4 and Figure 5 and Table 3 and Table 4). It is worth noting here that the potential of general status assessments across all coastal areas and all occurring predatory fish species today is limited as a result of data limitations and suboptimal monitoring. The results presented in this review should hence be considered in this context.
The key impacting factors behind the observed changes in abundance and status are not well established. It is difficult to single out one general and key impacting factor because a multitude of impacting pressures influence coastal fish communities and the typical coastal predatory fish species are local in their population structures and response to environmental variation and change. Plausible impacts for populations change do nevertheless include factors related to exploitation of essential habitats, fishing, interactions between species in the coastal food web, alternations in water temperatures and salinity levels, and potentially their interactive and additive effects. How changes in species abundances and potentially also in their distributional patterns affects the functionality of the system is, however, difficult to predict and warrants further studies. To that end, a continuous increase in the apex predators of the Baltic Sea, such as marine mammals and birds [82], would likely pose an even greater impact on coastal fish communities than today. With a well-developed coastal fish monitoring program, the impact of such changes in the trophic structure of the Baltic Sea ecosystem could likely be followed.
The toolbox for effective measures with proven positive effects on targeted coastal predatory fish populations is currently not well developed as a result of a general lack of scientific evaluations of the implemented measures. Existing knowledge does nevertheless strongly advocate an ecosystem-based approach to management with a combination of measures targeting both fisheries sectors (both commercially and recreational) and environmental management (habitat protection and restoration).
Coastal predatory fish are of great importance for the provisioning of ecosystem services in coastal food-webs in the Baltic Sea. This includes both their key roles in regulating the ecological dynamics in coastal food webs and the socio-economic importance for the small-scaled commercial and recreational fisheries sectors, as well as their cultural values for coastal communities. It is, therefore, of outmost importance to follow the status and development of coastal predatory fish populations in the Baltic Sea. For more thorough future assessments, as required by, for example, the MSFD, additional knowledge and data are needed. Besides safe-guarding current monitoring programs, the monitoring network should expand to cover existing spatial gaps in, for example, Denmark and Poland, and include data to support future status assessments for especially pike and pikeperch, and other coastal predators as burbot, turbot, and cod. For species with low capture rates in existing monitoring methods and low natural occurrence such as pike and burbot, there is an urgent need to develop methods and data collection programs (which could, for example, include citizen science) to increase the knowledge on the status and trends of the species. It is also of outmost importance to make the best use of already existing data and to also perform experiments in controlled settings, see for example [25,28,29,57], to establish links to key factors impacting the temporal development of the populations, to implement and evaluate functional and effective measures to ensure the long-term sustainable use of this valuable natural resource, and to further develop indicators to assess the size structure of coastal predatory fish populations. In order to be able to fully address this important aspect of the populations, however, more work is needed to develop fully operational and regionally applicable indicators with generic threshold values across regions. To meet all these needs, however, it is of key importance with regional cooperation in the work between the countries in the Baltic Sea region. To that end, there is a continuous need for pan Baltic assessments of the status of coastal fish, but unless the current level of cooperation and work is developed further, the potential for future assessments will be limited.
Funding
This work was partly funded by the Swedish Agency for Marine and Water Management via the project “28. HMD Indikatorutveckling (Dnr. 1121-208)” as lead by the Swedish University of Agricultural Sciences.
Acknowledgments
This work would not have been possible without the contribution and active support of the experts in the HELCOM FISH-PRO II group. I would specially like to acknowledge Outi Heikinheimo and Lauri Saks for providing information on the national MSFD assessment reports of Finland and Estonia, and Pontus Mattsson for creating the maps included in this paper.
Conflicts of Interest
The author declare no conflict of interest.
References
- Pauly, D.; Christensen, V.; Dalsgaard, J.; Froese, R.; Torres, F., Jr. Fishing down marine food webs. Science 1998, 279, 860–863. [Google Scholar] [CrossRef] [PubMed]
- Lotze, H.K.; Lenihan, H.S.; Bourque, B.J.; Bradbury, R.H.; Cooke, R.G.; Kay, M.C.; Kidwell, S.M.; Kirby, M.X.; Peterson, C.H.; Jackson, J.B.C. Depletion, degradation, and recovery potential of estuaries and coastal seas. Science 2006, 312, 1806–1809. [Google Scholar] [CrossRef]
- Daskalov, G.M. Overfishing drives atrophic cascade in the Black Sea. Mar. Ecol. Prog. Ser. 2002, 225, 53–63. [Google Scholar] [CrossRef]
- Frank, K.T.; Petrie, B.; Choi, J.S.; Leggett, W.C. Trophic cascades in a formerly cod-dominated ecosystem. Science 2005, 308, 1621–1623. [Google Scholar] [CrossRef]
- Worm, B.; Barbier, E.B.; Beaumont, N.; Duffy, J.E.; Folke, C.; Halpern, B.S.; Jackson, J.B.C.; Lotze, H.K.; Micheli, F.; Palumbi, S.R.; et al. Impacts of biodiversity loss on ocean ecosystem services. Science 2006, 314, 787–790. [Google Scholar] [CrossRef] [PubMed]
- Casini, M.; Lövgren, J.; Hjelm, J.; Cardinale, M.; Molinero, J.C.; Kornilovs, G. Multi-level trophic cascades in a heavily exploited open marine ecosystem. Proc. Roy. Soc. Lond. Ser. B 2008, 275, 1793–1801. [Google Scholar] [CrossRef] [PubMed]
- Eriksson, B.K.; Sieben, K.; Eklöf, J.; Ljunggren, L.; Olsson, J.; Casini, M.; Bergström, U. Effects of altered offshore food webs on coastal ecosystems emphasize the need for cross-ecosystem management. Ambio 2011, 40, 786–797. [Google Scholar] [CrossRef] [PubMed]
- Daskalov, G.M.; Grishin, A.N.; Rodionov, S.; Mihneva, V. Trophic cascades triggered by overfishing reveal possible mechanisms of ecosystem regime shifts. Proc. Natl. Acad. Sci. USA 2007, 104, 10518–10523. [Google Scholar] [CrossRef] [PubMed]
- Sieben, K.; Ljunggren, L.; Bergström, U.; Eriksson, B.K. A meso-predator release of stickleback promotes recruitment of macroalgae in the Baltic Sea. J. Exp. Mar. Biol. Ecol. 2011, 397, 79–84. [Google Scholar] [CrossRef]
- Baden, S.; Emanuelsson, A.; Pihl, L.; Svensson, C.-J.; Åberg, P. Shift in seagrass food web structure over decades is linked to overfishing. Mar. Ecol. Prog. Ser. 2012, 451, 61–73. [Google Scholar] [CrossRef]
- Östman, Ö.; Eklöf, J.; Eriksson, B.K.; Olsson, J.; Moksnes, P.-O. Top-down control as important as nutrient enrichment for eutrophication effects in North Atlantic coastal ecosystems. J. App. Ecol. 2016, 53, 1138–1147. [Google Scholar] [CrossRef]
- Donadi, S.; Austin, Å.N.; Bergström, U.; Eriksson, B.K.; Hansen, J.P.; Jacobson, P.; Sundblad, G.; van Regteren, M.; Eklöf, J.S. A cross-scale trophic cascade from large predatory fish to algae in coastal ecosystems. Proc. R. Soc. Lond. Ser. B 2017, 20170045. [Google Scholar] [CrossRef] [PubMed]
- Pikitch, E.K.; Santora, C.; Babcock, E.A.; Bakun, A.; Bonfil, R.; Conover, D.O.; Dayton, P.; Doukakis, P.; Fluharty, D.; Heneman, B.; et al. Ecosystem-Based Fishery Management. Science 2004, 305, 346–347. [Google Scholar] [CrossRef] [PubMed]
- Meyers, R.A.; Worm, B. Extinction, survival or recovery of large predatory fishes. Phil. Trans. R. Soc. B 2005, 360, 13–20. [Google Scholar] [CrossRef] [PubMed]
- Christensen, V.; Coll, M.; Piroddi, C.; Steenbeek, J.; Buszowski, J.; Pauly, D. A century of fish biomass decline in the ocean. Mar. Ecol. Prog. Ser. 2014, 512, 155–166. [Google Scholar] [CrossRef]
- HELCOM. Baltic Sea Action Plan. In Proceedings of the HELCOM Ministerial Meeting, Krakow, Poland, 15 November 2007; Available online: http://www.helcom.fi/Documents/Baltic%20sea%20action%20plan/BSAP_Final.pdf (accessed on 18 December 2018).
- European Commission. Directive 2008/56/EC of the European Parliament and of the Council of 17 June 2008 establishing a framework for community action in the field of marine environmental policy (Marine Strategy Framework Directive). Available online: https://eur-lex.europa.eu/LexUriServ/LexUriServ.do?uri=OJ:L:2008:164:0019:0040:EN:PDF (accessed on 18 December 2018).
- HELCOM. State of the Baltic Sea–Second HELCOM holistic assessment 2011-2016. Balt. Sea Env. Proc. 2018, 155. Available online: www.helcom.fi/baltic-sea-trends/holistic-assessments/state-of-the-baltic-sea-2018/reports-and-materials/ (accessed on 18 December 2018).
- Voipio, A. The Baltic Sea, 1st ed.; Elsevier Scientific Publishing Company: Amsterdam, The Netherlands, 1981; Volume 30, ISBN 9780080870687. [Google Scholar]
- HELCOM. Indicator based assessment of coastal fish community status in the Baltic Sea 2005–2009. Balt. Sea Env. Proc. 2012, 131. Available online: http://www.helcom.fi/Lists/Publications/BSEP131.pdf (accessed on 18 December 2018).
- Bergström, L.; Heikinheimo, O.; Svirgsden, R.; Kruze, E.; Ložys, L.; Lappalainen, A.; Minde, A.; Dainys, J.; Jakubavičiūtė, E.; Ådjers, K.; et al. Long term changes in the status of coastal fish in the Baltic Sea. Est. Coast. Shelf Sci. 2016, 169, 74–84. [Google Scholar] [CrossRef]
- HELCOM. Status of coastal fish in the Baltic Sea during 2011–2016. Balt. Sea Env. Proc. 2018, 160. Available online: https://portal.helcom.fi/meetings/FISH%208-2018-509/Documents/Thematic%20Assessment%20Coastal%20fish.pdf (accessed on 18 December 2018).
- Olsson, J.; Mo, K.; Florin, A.-B.; Aho, T.; Ryman, N. Genetic population structure of perch, Perca fluviatilis L, along the Swedish coast of the Baltic Sea. J. Fish Biol. 2011, 79, 122–137. [Google Scholar] [CrossRef]
- Wennerström, L.; Olsson, J.; Ryman, N.; Laikre, L. Temporally stable, weak genetic structuring in brackish water northern pike (Esox lucius) in the Baltic Sea indicates a contrasting divergence pattern relative to freshwater populations. Can, J. Fish. Aquat. Sci. 2017, 74, 562–571. [Google Scholar] [CrossRef]
- Bergström, L.; Bergström, U.; Olsson, J.; Carstensen, J. Coastal fish indicators response to natural and anthropogenic drivers-variability at temporal and different spatial scales Long term changes in the status of coastal fish in the Baltic Sea. Est. Coast. Shelf Sci. 2016, 183, 62–72. [Google Scholar] [CrossRef]
- Östman, Ö.; Olsson, J.; Dannewitz, J.; Palm, S.; Florin, A.-B. Inferring spatial structure from population genetics and spatial synchrony in population growth of Baltic Sea fishes: Implications for management. Fish Fish. 2017, 18, 324–339. [Google Scholar] [CrossRef]
- Bekkevold, D.; Jacobsen, L.; Hemmer-Hansen, J.; Berg, S.; Skov, C. From regionally predictable to locally complex population structure in a freshwater top predator: River systems are not always the unit of connectivity in Northern Pike Esox Lucius. Ecol. Fresh. Fish. 2015, 24, 305–316. [Google Scholar] [CrossRef]
- Östman, Ö.; Lingman, A.; Bergström, L.; Olsson, J. Temporal development and spatial scale of coastal fish indicators in reference sites in coastal ecosystems: Hydroclimate and anthropogenic drivers. J. App. Ecol. 2017, 54, 557–566. [Google Scholar] [CrossRef]
- Olsson, J.; Bergström, L.; Gårdmark, A. Abiotic drivers of coastal fish community change during four decades in the Baltic Sea. ICES J. Mar. Sci. 2012, 69, 961–970. [Google Scholar] [CrossRef]
- HELCOM. Guidelines for coastal fish monitoring sampling methods of HELCOM. 2015. Available online: http://www.helcom.fi/Documents/Action%20areas/Monitoring%20and%20assessment/Manuals%20and%20Guidelines/Guidelines%20for%20Coastal%20fish%20Monitoring%20of%20HELCOM.pdf (accessed on 18 December 2018).
- Stottrup, J.G.; Kokkalis, A.; Brown, E.J.; Olsen, J.; Anderssen, S.K.; Pedersen, E.M. Harvesting geo-spatial data on coastal fish assemblages through coordinated citizen science. Fish. Res. 2018, 208, 86–96. [Google Scholar] [CrossRef]
- Larsson, P.; Tibblin, P.; Koch-Schmidt, P.; Engstedt, O.; Nilsson, J.; Nordahl, O.; Forsman, A. Ecology, evolution and management strategies of northern pike popualtions in the Baltic Sea. Ambio 2015, 44 (Suppl. 3), S451–S461. [Google Scholar] [CrossRef]
- Heikinheimo, O.; Pekcan-Hekim, Z.; Raitaniemi, J. Spawning stock–recruitment relationship in pikeperch Sander lucioperca (L.) in the Baltic Sea, with temperature as an environmental effect. Fish. Res. 2014, 155, 1–9. [Google Scholar] [CrossRef]
- HELCOM FISH PRO II. Available online: http://www.helcom.fi/helcom-at-work/projects/fish-pro (accessed on 25 December 2018).
- Ådjers, K.; Appelberg, M.; Eschbaum, R.; Lappalainen, A.; Minde, A.; Repečka, R.; Thoresson, G. Trends in coastal fish stocks of the Baltic Sea. Bor. Env. Res. 2006, 11, 13–25. [Google Scholar]
- Saks, L.; Hommik, K.; Svirgsden, R. EL merestrateegia raamdirektiivi (2008/56/EÜ) kohane merekeskkonna seisundihinnang teemal kalastik ja kaubanduslikel eesmärkidel kasutatavad kalad (D1, D3, D4). 2018. Available online: https://www.envir.ee/sites/default/files/d1_d3_d4_kalad_0.pdf (accessed on 18 December 2018).
- Havs- och vattenmyndigheten. Fisk- och skaldjursbestånd i hav och sötvatten 2017. Resursöversikt. 273 s. Available online: https://www.slu.se/globalassets/ew/org/inst/aqua/externwebb/sidan-publikationer/resurs-och-miljo/fisk-och-skaldjursbestand-i-hav-och-sotvatten-2017-resursoversikt.pdf (accessed on 18 December 2018).
- Lehtonen, H.; Leskinen, E.; Selén, R. Potential reasons for the change in the abundance of pike, Esox Lucius, in the western Gulf of Finland, 1939-2007. Fish. Man. Ecol. 2009, 16, 484–491. [Google Scholar] [CrossRef]
- Ljunggren, L.; Sandstrom, A.; Bergström, U.; Mattila, J.; Lappalainen, A.; Johansson, G.; Sundblad, G.; Casini, M.; Kaljuste, O.; Eriksson, B.K. Recruitment failure of coastal predatory fish in the Baltic Sea coincident with an offshore ecosystem regime shift. ICES J. Mar. Sci. 2010, 67, 1587–1595. [Google Scholar] [CrossRef]
- Mustamäki, N.; Bergström, U.; Ådjers, K.; Sevastik, A.; Mattila, J. Pikeperch (Sander lucioperca (L.)) in Decline: High Mortality of Three Populations in the Northern Baltic Sea. Ambio 2014, 43, 325–336. [Google Scholar] [CrossRef] [PubMed]
- Mustamäki, N.; Tärnlund, S.; Holliland, P.B.; Blass, M.; Landfors, F.; Thunell, V.; SLU Aqua Faktablad–Resultat från övervakningen av kustfisk 2018:2. Galtfjärden (Egentliga Östersjön) 2002–2017. 2018. Available online: https://www.slu.se/globalassets/ew/org/inst/aqua/externwebb/k-lab/provfiske-vid-kusten/faktablad/2018/faktablad-galtfjarden-2018.2-002.pdf (accessed on 18 December 2018).
- Raitaniemi, J. Kalakantojen tila vuonna 2017sekä ennuste vuosille 2018 ja 2019. Luonnonvara- ja biotalouden tutkimus 36/2018. Helsinki. 99 s. 2018. Available online: http://jukuri.luke.fi/bitstream/handle/10024/542220/luke-luobio_36_2018.pdf?sequence=5&isAllowed=y (accessed on 18 December 2018).
- Bergström, L.; Karlsson, M.; Bergström, U.; Pihl, L.; Kraufvelin, P. Relative impacts of fishing and eutrophication on coastal fish assessed by comparing a no-take area with an environmental gradient. Ambio. (in press). [CrossRef]
- Shin, Y.-J.; Rochet, M.-J.; Jennings, S.; Field, J.G.; Gislason, H. Using size-based indicators to evaluate the ecosystem effects of fishing. ICES J. Mar. Sci. 2005, 62, 384–396. [Google Scholar] [CrossRef]
- Lappalainen, A.; Saks, L.; Sustar, M.; Heikinheimo, O.; Jürgens, K.; Kokkonen, E.; Kurkilahti, M.; Verliin, A.; Vetemaa, M. Length at maturity as a potential indicator of fishing pressure effects on coastal pikeperch (Sander lucioperca) stocks in the northern Baltic Sea. Fish. Res. 2016, 174, 47–57. [Google Scholar] [CrossRef]
- Olsson, J.; Ericsson, Y.; Östman, Ö. Storleksstruktur hos nyckelart av fisk i kustvatten–Faktablad Havsmiljödirektivets inledande bedömning. Havs- och vattenmyndigheten. 2018. Available online: https://www.havochvatten.se/download/18.1a05a1ba15fe9ddd6bcc0fd4/1512549687873/faktablad-D1C3-D4C3-kust-storleksstruktur-hos-nyckelart-fisk-i-kustvatten-samrad.pdf (accessed on 18 December 2018).
- Lindeboom, H. The Coastal Zone: An Ecosystem Under Pressure. In Oceans 2020: Science, Trends and the Challenge of Sustainability; Field, J.G., Hempel, G., Summerhayes, C.P., Eds.; Island Press: Washington, DC, USA, 2002; pp. 49–84. ISBN 1-55963-470-7. [Google Scholar]
- Airoldi, L.; Beck, M.W. Loss, Status and Trends for Coastal Marine Habitats of Europe. In Oceanography and Marine Biology: An Annual Review; Gibson, R.N., Atkinson, R.J.A., Gordon, J.D.M., Eds.; CRC Press: Boca Raton, FL, USA, 2007; Volume 45, pp. 345–405. ISBN 9781420050936. [Google Scholar]
- Möllmann, C.; Diekmann, R.; Müller-Karulis, B.; Kornilovs, G.; Plikshs, M.; Axe, P. Reorganization of a large marine ecosystem due to atmospheric and anthropogenic pressure: A discontinuous regime shift in the Central Baltic Sea. Glob. Change Biol. 2009, 15, 1377–1393. [Google Scholar] [CrossRef]
- Hanson, N.; Persson, S.; Larsson, Å. Analyses of perch (Perca fluviatilis) bile suggest increasing exposure to PAHs and other pollutants in a reference area on the Swedish Baltic coast. Environ. Tox. Chem. 2009, 28, 364–373. [Google Scholar] [CrossRef] [PubMed]
- Vetemaa, M.; Eschbaum, R.; Albert, A.; Saks, L.; Verliin, A.; Jürgens, K.; Kesler, M.; Hubel, K.; Hannesson, R.; Saat, T. Changes in fish stocks in an Estonian estuary: Overfishing by cormorants? ICES J. Mar. Sci. 2010, 67, 1972–1979. [Google Scholar] [CrossRef]
- Östman, Ö.; Bergenius, M.; Boström, M.K.; Lunneryd, S.-G. Do cormorant colonies affect local fish communities in the Baltic Sea? Can, J. Fish. Aquat. Sci. 2012, 69, 1047–1055. [Google Scholar] [CrossRef]
- Sundblad, G.; Bergström, U.; Sandström, A.; Eklöv, P. Nursery habitat availability limits adult stock sizes of predatory coastal fish. ICES J. Mar. Sci. 2014, 71, 672–680. [Google Scholar] [CrossRef]
- Hyder, K.; Weltersbach, M.S.; Armstrong, M.; Ferter, K.; Townhill, B.; Ahvonen, A.; Arlinghaus, R.; Baikov, A.; Bellanger, M.; Birzaks, J.; et al. Recreational sea fishing in Europe in a global context—Participation rates, fishing effort, expenditure, and implications for monitoring and assessment. Fish Fish. 2018, 19, 224–243. [Google Scholar] [CrossRef]
- Hansen, J.P.; Sundblad, G.; Bergström, U.; Austin, Å.N.; Donadi, S.; Eriksson, B.K.; Eklöf, J.S. Recreational boating degrades vegetation important for fish recruitment. Ambio 2018. [Google Scholar] [CrossRef] [PubMed]
- Sunde, J.; Tamario, C.; Tibblin, P.; Larsson, P.; Forsman, A. Variation in salinity tolerance between and within anadromous subpopulations of pike (Esox lucius). Sci. Rep. 2018, 8, 22. [Google Scholar] [CrossRef]
- Tibblin, P.; Koch-Schmidt, P.; Larsson, P.; Forsman, A. Effects of salinity on growth and mortality of migratory and resident forms of Eurasian perch in the Baltic Sea. Ecol. Fresh. Fish. 2012, 21, 200–206. [Google Scholar] [CrossRef]
- Bergström, U.; Sundblad, G.; Downie, A.-L.; Snickars, M.; Boström, C.; Lindegarth, M. Evaluating eutrophication management scenarios in the Baltic Sea using species distribution modelling. J. Appl. Ecol. 2013, 50, 680–690. [Google Scholar] [CrossRef]
- HELCOM. Recreational fisheries in the Baltic Sea and availability of data. 2017. Available online: https://portal.helcom.fi/meetings/FISH%206-2017-437/MeetingDocuments/3-1%20Information%20about%20Coastal%20recreational%20fisheries%20in%20the%20Baltic%20Sea%20countries.pdf (accessed on 18 December 2018).
- Edgren, J. Effects of a no-take reserve in the Baltic Sea on the top predator, northern pike. Master’s Thesis, Stockholm University, Stockholm, Sweden, 2005. Degree project. 23p. [Google Scholar]
- Bergström, U.; Sköld, M.; Wennhage, H.; Wikström, A. Ekologiska effekter av fiskefria områden i Sveriges kust- och havsområden. Aqua Rep. 2016, 20, 1–207. Available online: https://www.slu.se/globalassets/ew/org/inst/aqua/externwebb/sidan-publikationer/aqua-reports-xxxx_xx/aquareports-2016_20-fiskefria-omraden_20161214.pdf (accessed on 18 December 2018).
- Vetemaa, M.; Eschbaum, R.; Saat, T. The transition from Soviet system to market economy as a cause to instability in the Estonian coastal fisheries sector. Mar. Pol. 2006, 30, 635–640. [Google Scholar] [CrossRef]
- Kraufvelin, P.; Pekcan-Hekim, Z.; Bergström, U.; Florin, A.-B.; Lehikoinen, A.; Mattila, J.; Arula, T.; Briekmane, L.; Brown, E.J.; Celmer, Z.; et al. Essential coastal habitats for fish in the Baltic Sea. Est. Coast. Shelf Sci. 2018, 204, 14–30. [Google Scholar] [CrossRef]
- Engstedt, O.; Stenroth, P.; Larsson, P.; Ljunggren, L.; Elfman, M. Assessment of natal origin of pike (Esox lucius) in the Baltic Sea using Sr:Ca in otoliths. Env. Biol. Fish. 2010, 89, 547–555. [Google Scholar] [CrossRef]
- Rohtla, M.; Vetemaa, M.; Urtson, K.; Soesoo, A. Early life migration patterns of Baltic Sea pike Esox lucius. J. Fish Biol. 2012, 80, 886–893. [Google Scholar] [CrossRef] [PubMed]
- Nilsson, J.; Engstedt, O.; Larsson, P. Wetlands for northern pike (Esox lucius L.) recruitment in the Baltic Sea. Hydrobiologia 2014, 721, 145–154. [Google Scholar] [CrossRef]
- Sundblad, G.; Bergström, U. Shoreline development and degradation of coastal fish reproduction habitats. Ambio 2014, 43, 1020–1028. [Google Scholar] [CrossRef] [PubMed]
- Sandström, A.; Eriksson, B.K.; Karås, P.; Isæus, M.; Schreiber, H. Boating and navigation activities influence the recruitment of fish in a Baltic Sea archipelago area. Ambio 2005, 34, 125–130. [Google Scholar] [CrossRef] [PubMed]
- Östman, Ö.; Boström, M.K.; Bergström, U.; Andersson, J.; Lunneryd, S.-G. Estimating competition between wildlife and humans—A case of cormorants and coastal fisheries in the Baltic Sea. PLoS ONE 2013, 8, e83763. [Google Scholar] [CrossRef] [PubMed]
- Hansson, S.; Bergström, U.; Bonsdorff, E.; Härkönen, T.; Jepsen, N.; Kautsky, L.; Lundström, K.; Lunneryd, S.-G.; Ovegård, M.; Salmi, J.; et al. Competition for the fish—Fish extraction from the Baltic Sea by humans, aquatic mammals, and birds. ICES J. Mar. Sci. 2018, 75, 999–1008. [Google Scholar] [CrossRef]
- Lehikoinen, A.; Heikinheimo, O.; Lappalainen, A. Temporal changes in the diet of great cormorant (Phalacrocorax carbo sinensis) on the southern coast of Finland—Comparison with available fish data. Bor. Env. Res. 2011, 16, 61–70. [Google Scholar]
- Heikinheimo, O.; Rusanen, P.; Korhonen, K. Estimating the mortality caused by great cormorant predation on fish stocks: Pikeperch in the Archipelago Sea, northern Baltic Sea, as an example. Can. J. Fish. Aquat. Sci. 2016, 73, 84–93. [Google Scholar] [CrossRef]
- Bergström, U.; Olsson, J.; Casini, M.; Eriksson, B.K.; Fredriksson, R.; Wennhage, H.; Appelberg, M. Stickleback increase in the Baltic Sea—A thorny issue for coastal predatory fish. Est. Coast. Shelf Sci. 2015, 163, 134–142. [Google Scholar] [CrossRef]
- Nilsson, J. Predation of Northern Pike (Esox lucius L.) Eggs: A Possible Cause of Regionally Poor Recruitment in the Baltic Sea. Hydrobiologia 2006, 553, 161–169. [Google Scholar] [CrossRef]
- Byström, P.; Bergström, U.; Hjälten, A.; Ståhl, S.; Jonsson, D.; Olsson, J. Declining coastal piscivore populations in the Baltic Sea: Where and when do sticklebacks matter? Ambio 2015, 44, 462–471. [Google Scholar] [CrossRef] [PubMed]
- Heikinheimo, O.; Lehtonen, H.; Lehikoinen, A.; Hunsicker, M. Comment to Hansson, S. et al. “Competition for the fish—Fish extraction from the Baltic Sea by humans, aquatic mammals, and birds”, with special reference to cormorants, perch, and pikeperch. ICES J. Mar. Sci. 2018, 75, 1832–1836. [Google Scholar] [CrossRef]
- Casini, M.; Blenckner, T.; Mollmann, C.; Gardmark, A.; Lindegren, M.; Llope, M.; Kornilovs, G.; Maris Plikshs, M.; Stenseth, N.C. Predator transitory spillover induces trophic cascades in ecological sinks. Proc. Natl. Acad. Sci. USA 2012, 109, 8185–8189. [Google Scholar] [CrossRef] [PubMed]
- Hansson, N. Population level effects of reduced fecundity in the fish species perch (Perca fluviatilis) and the implications for environmental monitoring. Ecol. Mod. 2009, 220, 2051–2059. [Google Scholar] [CrossRef]
- Torres, M.A.; Casini, M.; Huss, M.; Otto, S.A.; Kadin, M.; Gårdmark, A. Food-web indicators accounting for species interactions respond to multiple pressures. Ecol. Ind. 2017, 77, 67–79. [Google Scholar] [CrossRef]
- Heikinheimo, O.; Setälä, J.; Saarni, K.; Raitaniemi, J. Impacts of mesh-size regulation of gillnets on the pikeperch fisheries in the Archipelago Sea, Finland. Can. J. Fish. Aquat. Sci. 2006, 77, 192–199. [Google Scholar] [CrossRef]
- Fredriksson, R.; Bergström, U.; Olsson, J. Riktlinjer för uppföljning av fiskevårdsåtgärder i kustmynnande våtmarker med fokus på gädda. Aqua Rep. 2013, 7, 1–52. [Google Scholar]
- Reusch, T.B.H.; Dierking, J.; Andersson, H.C.; Bonsdorff, E.; Carstensen, J.; Casini, M.; Czajkowski, M.; Hasler, B.; Hinsby, K.; Hyytiäinen, K.; et al. The Baltic Sea as a time machine for the future coastal ocean. Sci. Adv. 2018, 4, eaar8195. [Google Scholar] [CrossRef] [PubMed]
Figure 1.
Overview of the status/trends in abundance of coastal predatory fish as a functional group for the areas in the Baltic Sea for which information (publications, regional status assessments or unpublished data - in Germany only) are available. For the coast of Germany, see Figure 2. An up-ward pointing arrow denote good status or increasing trends in abundance, a horizontal arrow no trend in abundance, and a down-ward pointing arrow poor status or decreasing abundance. NA denotes that no assessment/data is available. For each area, past trends (before 2007) are shown in a grey box, and the current status (after 2008) are shown in a white box. For the source of information for each area see the main text and Table 1.

Figure 2.
The trends in abundance of coastal predatory fish as a functional group and perch for German areas are showed on this in-zoomed map. An up-ward pointing arrow denote increasing trends in abundance, a horizontal arrow no trend in abundance, and a down-ward pointing arrow a decreasing abundance. NA denotes that no assessment/data is available. For each area, past trends are shown in a grey box and current trends in a white box. Time-period considered in each area and box are outlined in the main text and in Table 1.

Figure 3.
Overview of the status/trends in abundance of perch for the areas in the Baltic Sea for which information (publications, regional status assessments or unpublished data - in Germany only) are available. For the coast of Germany, see Figure 2. An up-ward pointing arrow denote good status or increasing trends in abundance, a horizontal arrow no trend in abundance, and a down-ward pointing arrow poor status or decreasing abundance. NA denotes that no assessment/data is available. For each area, past trends (generally before mid 2000’s) are shown in a grey box, and the current status (after 2008) are shown in a white box. For the source of information for each area see the main text and Table 2.

Figure 4.
Overview of the trends in abundance of pike for the few areas in the Baltic Sea for which information (publications and national status assessments) are available. An up-ward pointing arrow denote increasing trends in abundance, a horizontal arrow no trend in abundance, and a down-ward pointing arrow a decreasing abundance. NA denotes that no assessment/data is available. For each area, past trends are shown in a grey box and current trends in a white box. Time-period considered in each area and box are outlined in the main text and in Table 3.

Figure 5.
Overview of the trends in abundance of pikeperch for the few areas in the Baltic Sea for which information (publications and national status assessments) are available. An up-ward pointing arrow denote increasing trends in abundance, a horizontal arrow no trend in abundance, and a down-ward pointing arrow a decreasing abundance. NA denotes that no assessment/data is available. For each area, past trends are shown in a grey box and current trends in a white box. Time-period considered in each area and box are outlined in the main text and in Table 4.

Figure 6.
Share of time-series for predatory fish (top panel) and perch (lower panel) exhibiting a positive trend/good status, no trend and a negative trend/poor status for data before 2007 (past, left column) and after 2008 (present, right column). Number within the pie charts represent the number of time-series that represent each category. For details see Table 1 and Table 2.


Table 1.
Overview of the data and time-series used to assess past (data until the 2000s, grey columns) and current (data until the 2010s white columns) trends and status for coastal predatory fish. For the column “Species included”, Pe = perch, Pi = pike, B = burbot, Pp = pikeperch, C = cod and T = turbot. The columns “Source” refers to reference number. * The predatory fish abundance was calculated as the summed average abundance of included species.
| Past Trends | Current Trends/Status | |||||||||||
|---|---|---|---|---|---|---|---|---|---|---|---|---|
| Area (Time-Series) | Country | Basin | Type of Monitoring | Time for Monitoring | Species Included * | Time Period | Trend | Source | Time Period | Trend | Status | Source |
| Råneå | Sweden | Bothnian Bay | Fisheries independent | Summer | Pe, Pi, B | 1991–2009 | + | [21] | 2008–2016 | Good | [22] | |
| Kinnbäcksfjärden | Sweden | Bothnian Bay | Fisheries independent | Summer | Pe, Pi, B | 2008–2016 | Good | [22] | ||||
| Holmön | Sweden | Bothnian Bay | Fisheries independent | Summer | Pe, Pi, B | 1991–2009 | - | [21] | 2008–2016 | Good | [22] | |
| Norrbyn | Sweden | Bothnian Bay | Fisheries independent | Summer | Pe, Pi, B | 2008–2016 | Poor | [22] | ||||
| SD 31 | Finland | Bothnian Bay | Fisheries dependent | Year around | Pe, Pi, Pp | 1991–2009 | 0 | [21] | 2008–2016 | Good | [22] | |
| The Quark | Finland | Bothnian Bay | Fisheries independent | Year around | Pe, Pi, Pp | 2011–2016 | Good | [22] | ||||
| Gaviksfjärden | Sweden | Bothnian Sea | Fisheries independent | Summer | Pe, Pi, B | 2008–2016 | Good | [22] | ||||
| Långvindsfjärden | Sweden | Bothnian Sea | Fisheries independent | Summer | Pe, Pi, B | 2008–2016 | Good | [22] | ||||
| SD 30 | Finland | Bothnian Sea | Fisheries dependent | Year around | Pe, Pi, Pp | 1991–2009 | 0 | [21] | 2008–2016 | Good | [22] | |
| Forsmark | Sweden | Central Baltic Sea | Fisheries independent | Summer | Pe, Pi, B, Pp | 1991–2009 | - | [21] | 2011–2016 | Good | [22] | |
| Finbo | Finland | Central Baltic Sea | Fisheries independent | Summer | Pe, Pi, B, Pp | 1991–2009 | 0 | [21] | 2008–2016 | Good | [22] | |
| Kumlinge | Finland | Central Baltic Sea | Fisheries independent | Summer | Pe, Pi, B, Pp | 2008–2016 | Good | [22] | ||||
| Brunskär | Finland | Central Baltic Sea | Fisheries independent | Summer | Pe, Pi, B, Pp | 1991–2004 | 0 | [21] | ||||
| SD 29 | Finland | Central Baltic Sea | Fisheries dependent | Year around | Pe, Pi, Pp | 1991–2009 | - | [21] | 2008–2016 | Good | [22] | |
| SD 32 | Finland | Gulf of Finland | Fisheries dependent | Year around | Pe, Pi, Pp | 1991–2009 | 0 | [21] | 2008–2016 | Good | [22] | |
| Lagnö | Sweden | Central Baltic Sea | Fisheries independent | Summer | Pe, Pi, B, Pp | 2008–2016 | Good | [22] | ||||
| Muskö | Sweden | Central Baltic Sea | Fisheries independent | Autumn | Pe, Pi, Pp, C | 2011–2016 | Good | [22] | ||||
| Askö | Sweden | Central Baltic Sea | Fisheries independent | Summer | Pe, Pi, B, Pp | 2008–2016 | Good | [22] | ||||
| Kvädöfjärden | Sweden | Central Baltic Sea | Fisheries independent | Summer & autumn | Pe, Pi, Pp, C, T | 1991–2009 | 0 | [21] | 2011–2016 | Poor | [22] | |
| Vinö | Sweden | Central Baltic Sea | Fisheries independent | Summer | Pe, Pi, Pp, C, T | 1991–2009 | 0 | [21] | 2011–2016 | Poor | [22] | |
| Hiiumaa | Estonia | Central Baltic Sea | Fisheries independent | Summer | Pe, Pi, Pp | 1991–2009 | 0 | [21] | 2011–2016 | Poor | [22] | |
| Daugavgriva | Latvia | Central Baltic Sea | Fisheries independent | Summer | Pe, Pi, Pp | 1991–2009 | 0 | [21] | 2008–2015 | Good | [22] | |
| Jurkalne | Latvia | Central Baltic Sea | Fisheries independent | Summer | Pe, Pi, Pp, C, T | 1991–2009 | 0 | [21] | 2011–2015 | Good | [22] | |
| Monciskes/Butinge | Lithuania | Southern Baltic Sea | Fisheries independent | Summer | Pe, Pi, Pp, C, T | 1991–2009 | 0 | [21] | 2008–2012 | Good | [22] | |
| Curonian Lagoon | Lithuania | Southern Baltic Sea | Fisheries independent | Summer | Pe, Pi, B, Pp | 1991–2009 | 0 | [21] | 2008–2012 | Good | [22] | |
| Torhamn | Sweden | Southern Baltic Sea | Fisheries independent | Summer | Pe, Pi, Pp, C, T | 2008–2016 | Good | [22] | ||||
| Pomeranian Bay, Outer | Germany | Southern Baltic Sea | Fisheries independent | Autumn | Pe, Pi, T | 2003–2014 | 0 | NA | Unpublished | |||
| Stettin Lagoon (German part) | Germany | Southern Baltic Sea | Fisheries independent | Year around | Pe | 2008-2013 | 0 | NA | Unpublished | |||
| Peene river/Achterwasser | Germany | Southern Baltic Sea | Fisheries independent | Year around | Pe | 2009-2013 | 0 | NA | Unpublished | |||
| East of Usedom Peninsula | Germany | Southern Baltic Sea | Fisheries independent | Year around | Pe | 2008–2013 | - | NA | Unpublished | |||
| Greifswalder Bodden | Germany | Southern Baltic Sea | Fisheries independent | Year around | Pe | 2008–2013 | 0 | NA | Unpublished | |||
| Strelasund | Germany | Southern Baltic Sea | Fisheries independent | Year around | Pe | 2008–2013 | 0 | NA | Unpublished | |||
| Darß-Zingst Bodden chain | Germany | Southern Baltic Sea | Fisheries independent | Year around | Pe | 2008–2013 | + | NA | Unpublished | |||
| Northeast of Ruegen Island | Germany | Southern Baltic Sea | Fisheries independent | Year around | Pe | 2008–2013 | 0 | NA | Unpublished | |||
| Börgerende | Germany | Southern Baltic Sea | Fisheries independent | Year around | Pe | 2003–2013 | 0 | NA | Unpublished | |||
| North of Kühlungsborn city | Germany | Southern Baltic Sea | Fisheries independent | Year around | Pe | 2008–2013 | 0 | NA | Unpublished | |||
| Wismar Bight and Salzhaff | Germany | Southern Baltic Sea | Fisheries independent | Year around | Pe | 2008–2012 | - | NA | Unpublished | |||
Table 2.
Overview of the data and time-series used to assess past (data until the 2000s, grey columns) and current (data until the 2010s white columns) trends and status for perch. The columns “Source” refers to reference number.
Table 2.
Overview of the data and time-series used to assess past (data until the 2000s, grey columns) and current (data until the 2010s white columns) trends and status for perch. The columns “Source” refers to reference number.
| Past Trends | Current Trends/Status | ||||||||||
|---|---|---|---|---|---|---|---|---|---|---|---|
| Area (Time-Series) | Country | Basin | Type of Monitoring | Time for Monitoring | Time Period | Trend | Source | Time Period | Trend | Status | Source |
| Råneå | Sweden | Bothnian Bay | Fisheries independent | Summer | 1994–2002 | + | [35] | 2008–2016 | Good | [22] | |
| Kinnbäcksfjärden | Sweden | Bothnian Bay | Fisheries independent | Summer | 2008–2016 | Good | [22] | ||||
| Holmön | Sweden | Bothnian Bay | Fisheries independent | Summer | 1989–2002 | - | [35] | 2008–2016 | Good | [22] | |
| Norrbyn | Sweden | Bothnian Bay | Fisheries independent | Summer | 2008–2016 | Poor | [22] | ||||
| SD 31 | Finland | Bothnian Bay | Fisheries dependent | Year around | 2011–2016 | Good | [22] | ||||
| The Quark | Finland | Bothnian Bay | Fisheries independent | Year around | 2008–2016 | Good | [22] | ||||
| Gaviksfjärden | Sweden | Bothnian Sea | Fisheries independent | Summer | 2008–2016 | Good | [22] | ||||
| Långvindsfjärden | Sweden | Bothnian Sea | Fisheries independent | Summer | 2008–2016 | Good | [22] | ||||
| SD 30 | Finland | Bothnian Sea | Fisheries dependent | Year around | 2011–2016 | Good | [22] | ||||
| Forsmark | Sweden | Central Baltic Sea | Fisheries independent | Summer | 1975–2008 | + | [29] | 2011–2016 | Good | [22] | |
| Forsmark | Sweden | Central Baltic Sea | Fisheries independent | Summer | 1983–2002 | + | [35] | ||||
| Finbo | Finland | Central Baltic Sea | Fisheries independent | Summer | 1987–2002 | + | [35] | 2008–2016 | Good | [22] | |
| Kumlinge | Finland | Central Baltic Sea | Fisheries independent | Summer | 2008–2016 | Good | [22] | ||||
| Brunskär | Finland | Central Baltic Sea | Fisheries independent | Summer | 1992–2002 | + | [35] | ||||
| Lagnö | Sweden | Central Baltic Sea | Fisheries independent | Summer | 2008–2016 | Good | [22] | ||||
| Muskö | Sweden | Central Baltic Sea | Fisheries independent | Autumn | 1991–2002 | 0 | [35] | ||||
| Askö | Sweden | Central Baltic Sea | Fisheries independent | Summer | 2008–2016 | Good | [22] | ||||
| SD 29 | Finland | Central Baltic Sea | Fisheries dependent | Year around | 2008–2016 | Good | [22] | ||||
| SD 32 | Finland | Gulf of Finland | Fisheries dependent | Year around | 2008–2016 | Good | [22] | ||||
| Käsmu | Estonia | Central Baltic Sea | Fisheries independent | Summer | 2011–2016 | Poor | [36] | ||||
| Matsalu | Estonia | Central Baltic Sea | Fisheries independent | Summer | 2011–2016 | Poor | [36] | ||||
| Hiiumaa | Estonia | Central Baltic Sea | Fisheries independent | Summer | 1992–2002 | - | [35] | 2011–2016 | Poor | [22] | |
| Pärnu | Estonia | Central Baltic Sea | Fisheries independent | Summer | 2011–2016 | Poor | [36] | ||||
| Kõiguste | Estonia | Central Baltic Sea | Fisheries independent | Summer | 2011–2016 | Poor | [36] | ||||
| Vilsandi | Estonia | Central Baltic Sea | Fisheries independent | Summer | 2011–2016 | Poor | [36] | ||||
| Kihnu | Estonia | Central Baltic Sea | Fisheries independent | Summer | 2011–2016 | Poor | [36] | ||||
| Kvädöfjärden | Sweden | Central Baltic Sea | Fisheries independent | Summer | 1971–2008 | + | [29] | 2011–2016 | Poor | [22] | |
| Kvädöfjärden | Sweden | Central Baltic Sea | Fisheries independent | Summer | 1987–2002 | + | [35] | ||||
| Vinö | Sweden | Central Baltic Sea | Fisheries independent | Summer | 2011–2016 | Poor | [22] | ||||
| Mönsterås | Sweden | Central Baltic Sea | Fisheries independent | Year around | 1970–2003 | - | [7] | ||||
| Daugavgriva | Latvia | Central Baltic Sea | Fisheries independent | Summer | 1993–2002 | 0 | [35] | 2008–2015 | Good | [22] | |
| Jurkalne | Latvia | Central Baltic Sea | Fisheries independent | Summer | 2011–2015 | Good | [22] | ||||
| Monciskes/Butinge | Lithuania | Southern Baltic Sea | Fisheries independent | Summer | 2008–2012 | Good | [22] | ||||
| Curonian Lagoon | Lithuania | Southern Baltic Sea | Fisheries independent | Summer | 1992–2002 | - | [35] | 2008–2012 | Good | [22] | |
| Torhamn | Sweden | Southern Baltic Sea | Fisheries independent | Summer | 2008–2016 | Good | [22] | ||||
| Pomeranian Bay, Outer | Germany | Southern Baltic Sea | Fisheries independent | Autumn | 2003–2014 | 0 | NA | Unpublished | |||
| Stettin Lagoon (German part) | Germany | Southern Baltic Sea | Fisheries independent | Year around | 2008–2013 | 0 | NA | Unpublished | |||
| Peene river/Achterwasser | Germany | Southern Baltic Sea | Fisheries independent | Year around | 2009–2013 | 0 | NA | Unpublished | |||
| East of Usedom Peninsula | Germany | Southern Baltic Sea | Fisheries independent | Year around | 2008–2013 | - | NA | Unpublished | |||
| Greifswalder Bodden | Germany | Southern Baltic Sea | Fisheries independent | Year around | 2008–2013 | 0 | NA | Unpublished | |||
| Strelasund | Germany | Southern Baltic Sea | Fisheries independent | Year around | 2008–2013 | 0 | NA | Unpublished | |||
| Darß-Zingst Bodden chain | Germany | Southern Baltic Sea | Fisheries independent | Year around | 2008–2013 | + | NA | Unpublished | |||
| Northeast of Ruegen Island | Germany | Southern Baltic Sea | Fisheries independent | Year around | 2008–2013 | 0 | NA | Unpublished | |||
| Börgerende | Germany | Southern Baltic Sea | Fisheries independent | Year around | 2003–2013 | 0 | NA | Unpublished | |||
| North of Kühlungsborn city | Germany | Southern Baltic Sea | Fisheries independent | Year around | 2008–2013 | 0 | NA | Unpublished | |||
| Wismar Bight and Salzhaff | Germany | Southern Baltic Sea | Fisheries independent | Year around | 2008–2012 | - | NA | Unpublished | |||
Table 3.
Overview of the data and time-series used to assess past (data until the 2000s, grey columns) and current (data until the 2010s white columns) trends and status for pike. The columns “Source” refers to reference number
Table 3.
Overview of the data and time-series used to assess past (data until the 2000s, grey columns) and current (data until the 2010s white columns) trends and status for pike. The columns “Source” refers to reference number
| Past Trends | Current Trends | ||||||||||
|---|---|---|---|---|---|---|---|---|---|---|---|
| Area (Time-Series) | Country | Basin | Type of Monitoring | Time for Monitoring | Time Period | Trend | Source | Time Period | Trend | Status | Source |
| Råneå | Sweden | Bothnian Bay | Fisheries independent | Summer | 2002–2016 | 0 | NA | [37] | |||
| Holmön | Sweden | Bothnian Bay | Fisheries independent | Summer | 2002–2016 | 0 | NA | [37] | |||
| Western Gulf of Finland | Finland | Gulf of Finlad | Recreational fisheries | Year around | 1939–2007 | - | [38] | ||||
| Lagnö | Sweden | Central Baltic Sea | Fisheries independent | Summer | 2002–2016 | - | NA | [37] | |||
| Askö | Sweden | Central Baltic Sea | Fisheries independent | Summer | 2002–2016 | 0 | NA | [37] | |||
| Kvädöfjärden | Sweden | Central Baltic Sea | Fisheries independent | Summer | 2002–2016 | - | NA | [37] | |||
| Mönsterås | Sweden | Central Baltic Sea | Fisheries independent | Year around | 1970–2003 | - | [7] | ||||
| Mönsterås | Sweden | Central Baltic Sea | Fisheries independent | August | 1994–2007 | - | [39] | ||||
| Torhamn | Sweden | Southern Baltic Sea | Fisheries independent | Summer | 2002–2016 | - | NA | [37] | |||
Table 4.
Overview of the data and time-series used to assess past (data until the 2000s, grey columns) and current (data until the 2010s white columns) trends and status for pikeperch. The columns “Source” refers to reference number.
Table 4.
Overview of the data and time-series used to assess past (data until the 2000s, grey columns) and current (data until the 2010s white columns) trends and status for pikeperch. The columns “Source” refers to reference number.
| Past Trends | Current Trends | ||||||||||
|---|---|---|---|---|---|---|---|---|---|---|---|
| Area (Time-Series) | Country | Basin | Type of Monitoring | Time for Monitoring | Time Period | Trend | Source | Time Period | Trend | Status | Source |
| Forsmark | Sweden | Central Baltic Sea | Fisheries independent | Summer | 2002–2016 | - | NA | [37] | |||
| Galtfjärden | Sweden | Central Baltic Sea | Fisheries independent | Autumn | 1995–2008 | - | [40] | 2002–2017 | - | NA | [41] |
| Ivarskärsfjärden | Finland | Central Baltic Sea | Fisheries independent | Summer | 2000–2009 | - | [40] | ||||
| Lumparn | Finland | Central Baltic Sea | Fisheries independent | August | 2000–2009 | - | [40] | ||||
| SD 29 | Finland | Central Baltic Sea | Fisheries independent | Year around | 1981–2004 | + | [33] | 1981–2015 | NA | Poor | [42] |
| SD 32 | Finland | Gulf of Finland | Fisheries independent | Year around | 1981–2015 | NA | Good | [42] | |||
| Pärnu | Estonia | Central Baltic Sea | Fisheries independent | Summer | 2011–2016 | NA | Poor | [36] | |||
| Daugavgriva | Latvia | Central Baltic Sea | Fisheries independent | Summer | 1992–2002 | - | [35] | ||||
| Curonian Lagoon | Lithuania | Southern Baltic Sea | Fisheries independent | Summer | 1992–2002 | 0 | [35] | ||||
© 2019 by the author. Licensee MDPI, Basel, Switzerland. This article is an open access article distributed under the terms and conditions of the Creative Commons Attribution (CC BY) license (http://creativecommons.org/licenses/by/4.0/).
Share and Cite
MDPI and ACS Style
Olsson, J. Past and Current Trends of Coastal Predatory Fish in the Baltic Sea with a Focus on Perch, Pike, and Pikeperch. Fishes 2019, 4, 7. https://0-doi-org.brum.beds.ac.uk/10.3390/fishes4010007
AMA Style
Olsson J. Past and Current Trends of Coastal Predatory Fish in the Baltic Sea with a Focus on Perch, Pike, and Pikeperch. Fishes. 2019; 4(1):7. https://0-doi-org.brum.beds.ac.uk/10.3390/fishes4010007
Chicago/Turabian StyleOlsson, Jens. 2019. "Past and Current Trends of Coastal Predatory Fish in the Baltic Sea with a Focus on Perch, Pike, and Pikeperch" Fishes 4, no. 1: 7. https://0-doi-org.brum.beds.ac.uk/10.3390/fishes4010007