Article

Accumulation of Geosmin and 2-methylisoborneol in European Whitefish Coregonus Lavaretus and Rainbow Trout Oncorhynchus Mykiss in RAS

1
Aquatic Production Systems, Natural Resources Institute Finland (Luke), FI-40500 Jyväskylä, Finland
2
Natural Resources, Natural Resources Institute Finland (Luke), FI-31600 Jokioinen, Finland
*
Author to whom correspondence should be addressed.
Submission received: 29 March 2020 / Revised: 30 April 2020 / Accepted: 7 May 2020 / Published: 11 May 2020

Abstract

:
Geosmin (GSM) and 2-methylisoborneol (MIB)-induced off-flavors can cause serious problems in a recirculating aquaculture system (RAS), such as delayed harvest and increased production costs, but also damage producers’ reputation. Traditionally, off-flavors have been removed by depuration before harvesting. Rainbow trout (Oncorhynchus mykiss) and European whitefish (Coregonus lavaretus) are commercially valuable species produced for consumers, both being suitable for rearing in RAS. In this study, European whitefish and rainbow trout were raised from juvenile up to 240 g (European whitefish) and 660 g (rainbow trout) to monitor the long-term accumulation of off-flavors. The concentrations in fillet of rainbow trout reached 3.6 ng·g−1 (MIB) and 5.6 ng∙g−11 (GSM) with lipid content of 22.5%, while for European whitefish up to 3.2 ng·g−1 (MIB) and 3.9 ng·g−1 (GSM) were found with 14.8% in lipid content. Concentrations up to 58 ng·L−1 (MIB) and 49 ng·L−1 (GSM) were found in the circulating water. Based on the results, the accumulation of MIB proceeds at similar pace for both species. In the case of GSM, the accumulation started similarly for both species but proceeded more quickly for rainbow trout after 140 days of the experiment, with a statistically significant difference (p < 0.05).

1. Introduction

Land-based intensive recirculating aquaculture systems (RAS)s allow stable rearing conditions, but also enable a reduction in water consumption and nutrient discharge per kg of produced fish [1]. Unfortunately, off-flavors are often formed in RAS, which has been widely reported in fish of different species reared in RAS [2,3,4], in ponds [5,6,7], and in wild fish [8].
Off-flavors are typically induced by two saturated bicyclic terpenoids, geosmin (GSM, trans-1,10-dimethyl-trans-9-decalol) and 2-methylisoborneol (MIB, (1-R-exo)-1,2,7,7-tetramethylbicyclo-[2.2.1]heptan-2-ol), which produce an earthy and musty odor and taste [9,10]. GSM and MIB are tertiary alcohols, each of which exist as (+) and (−) enantiomers. It has been proposed that (−) geosmin has a (× 11) lower sensation threshold than (+) isomer [11]. GSM and MIB are produced as metabolic by-products of several strains of bacteria, such as streptomyces, myxobacteria, actinomycetes, cyanobacteria, proteobacteria, and fungi [12,13,14] related to, for example, photosynthesis and pigment synthesis, but in RAS prone to grow in variety surfaces.
GSM and MIB are lipophilic compounds with octanol/water partition coefficients of 3.57 (GSM) and 3.31 (MIB) [15]. The distribution of lipophilic compounds in the tissues of an organism is influenced by the lipid content and perfusion of tissues [16,17]. GSM and MIB are exchanged between water and fish by passive diffusion [18], seeking equilibrium. GSM and MIB enter the bloodstream of fish mainly via the gills and accumulate as lipophilic compounds in the lipid tissue of fish. In addition to fish flesh, GSM and MIB have been found in the stomach, skin, and intestinal mucus layer of fish [19,20].
According to current knowledge, the off-flavor compounds passively find a balance between the concentration in water and the fat tissue of fish as described and modeled by [21]. Different concentrations of GSM and MIB have been found in different parts of fish [3,4], mostly due to their varying lipid content. However, Schram et al. [22] showed that GSM is distributed not only according to lipid content, but that the transformation of GSM into its products in the fish liver also plays a role.
The rate of uptake and elimination of off-flavors can vary among species in the same rearing system [23], but also according to the size and lipid content of the fish [18]. Additionally, accumulation of off-flavors can vary due to different feeding habits, when excluding other factors. For example, Gy. Papp et al. [23] reported that they found lower concentrations of GSM in fillet of carnivorous African catfish (Clarias gariepinus) and herbivorous grass carp (Ctenopharyngodon idella) than in the bottom- or plankton-feeding species of the same rearing system. They suggested that the off-flavor accumulation might have originated from the sediment of benthic algal or actinomycetes sources.
A wide variety of process solutions has been tested and applied to remove the off-flavor compounds from RAS circulating water, such as ozonation [24,25], methods based on adsorption [2], photocatalysis with modified TiO2 [26], and palladium-modified WO3 photocatalyst [27]. Recently, a method based on the adsorption and degradation of MIB into sludge has shown promising results [28]. However, depuration in clean water to remove the off-flavors still remains the only efficient and widely applied method to remove off-flavors in commercial large-scale applications. Depuration requires large amounts of clean water, which can be time-consuming and costly. Additionally, loss of fish weight during depuration (no feeding is usually practiced to reduce the growth of off-flavor-producing microbes) and death of some fish due to moving to new tanks induce additional costs. For example, some evaluations suggest that the removal of off-flavors cause annual additional costs of 10–60 million US dollars for catfish producers [5], while others have assessed an increase of 0.25 US dollars per kg of fish [29]. Therefore, decreased accumulation or an increased rate of depuration would certainly be economically valuable information for fish farmers.
European whitefish (Coregonus lavaretus) and rainbow trout (Oncorhynchus mykiss) are both salmonid fish valued by consumers. Rainbow trout is a commonly reared species in RAS, while European whitefish is still a relatively new species. Both farmed and wild European whitefish are commercially available in the Nordic countries (Denmark, Finland, Iceland, Norway, and Sweden). Large whitefish (> 800 g) actually have a higher market value than rainbow trout, making it an attractive species for producers. In this study, both species were chosen for a one-year study to follow their off-flavor accumulation in a typical experimental RAS. According to our knowledge, the differences between species in the accumulation of GSM and MIB have been the target of very few studies [23]. Therefore, this study aims to provide new knowledge regarding the differences between the two species. The hypothesis was to study the difference in off-flavor accumulation between the two species. This may also be valuable information for farmers choosing the raised species for an RAS.

2. Results

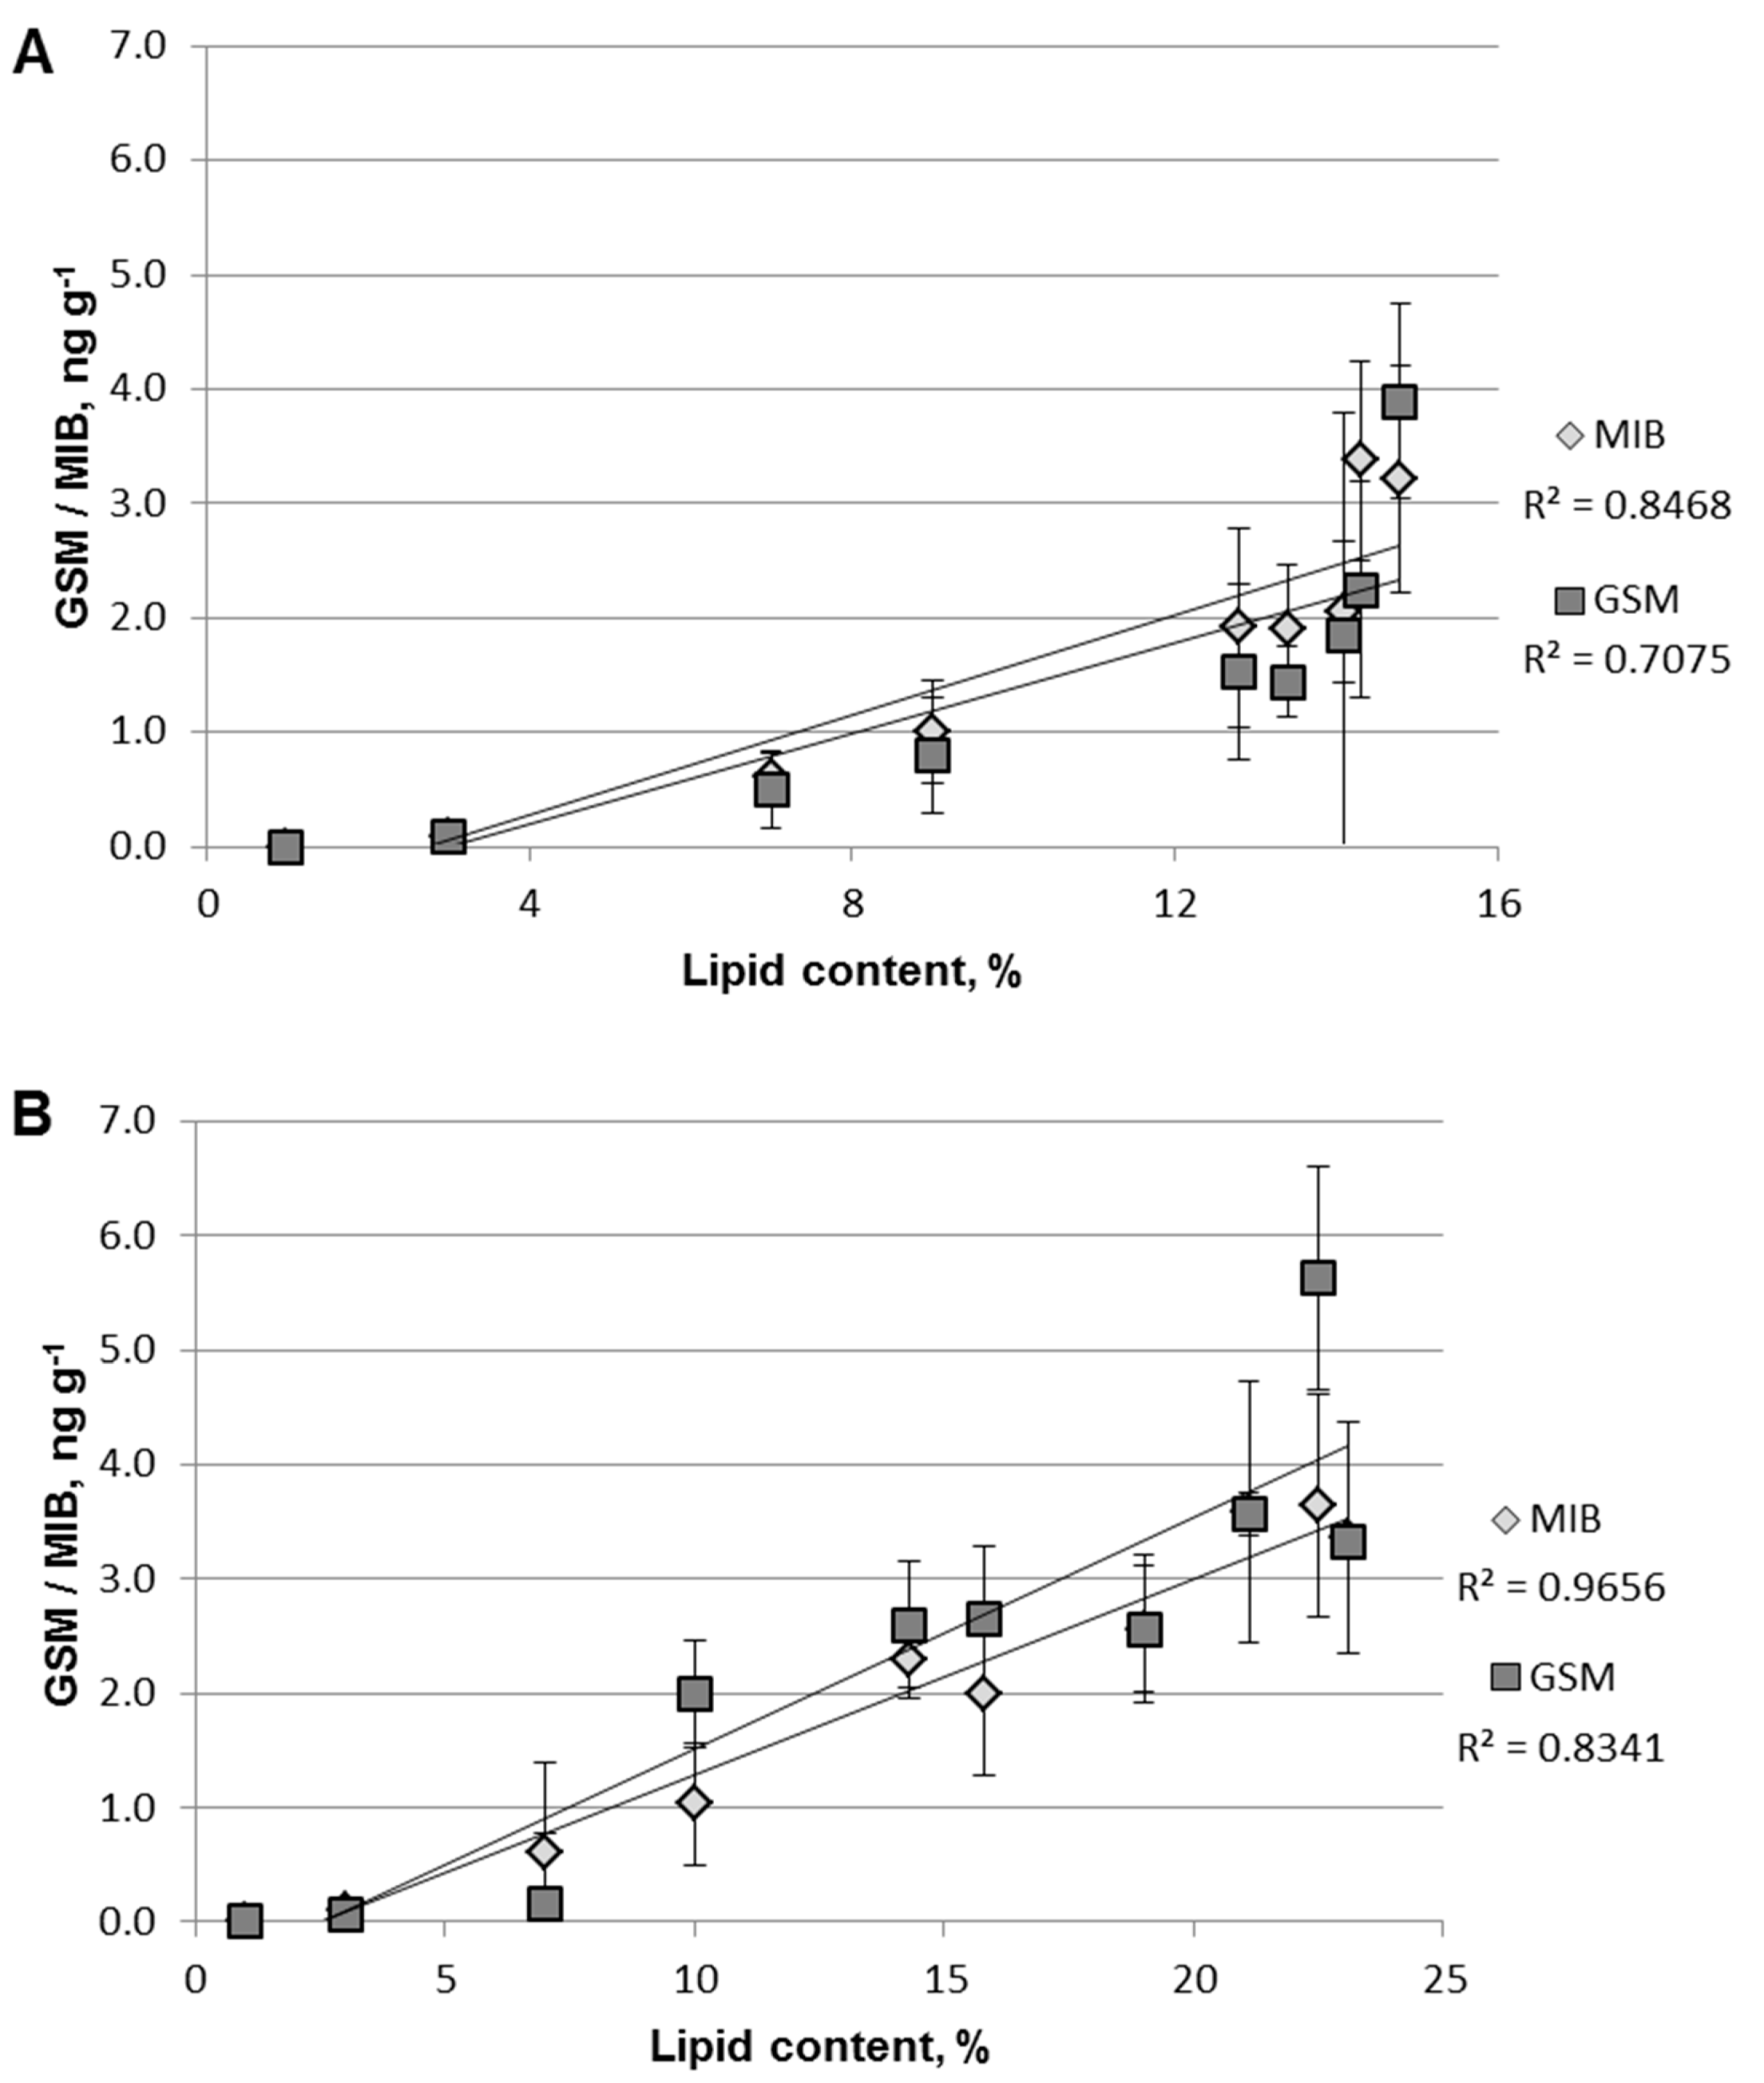
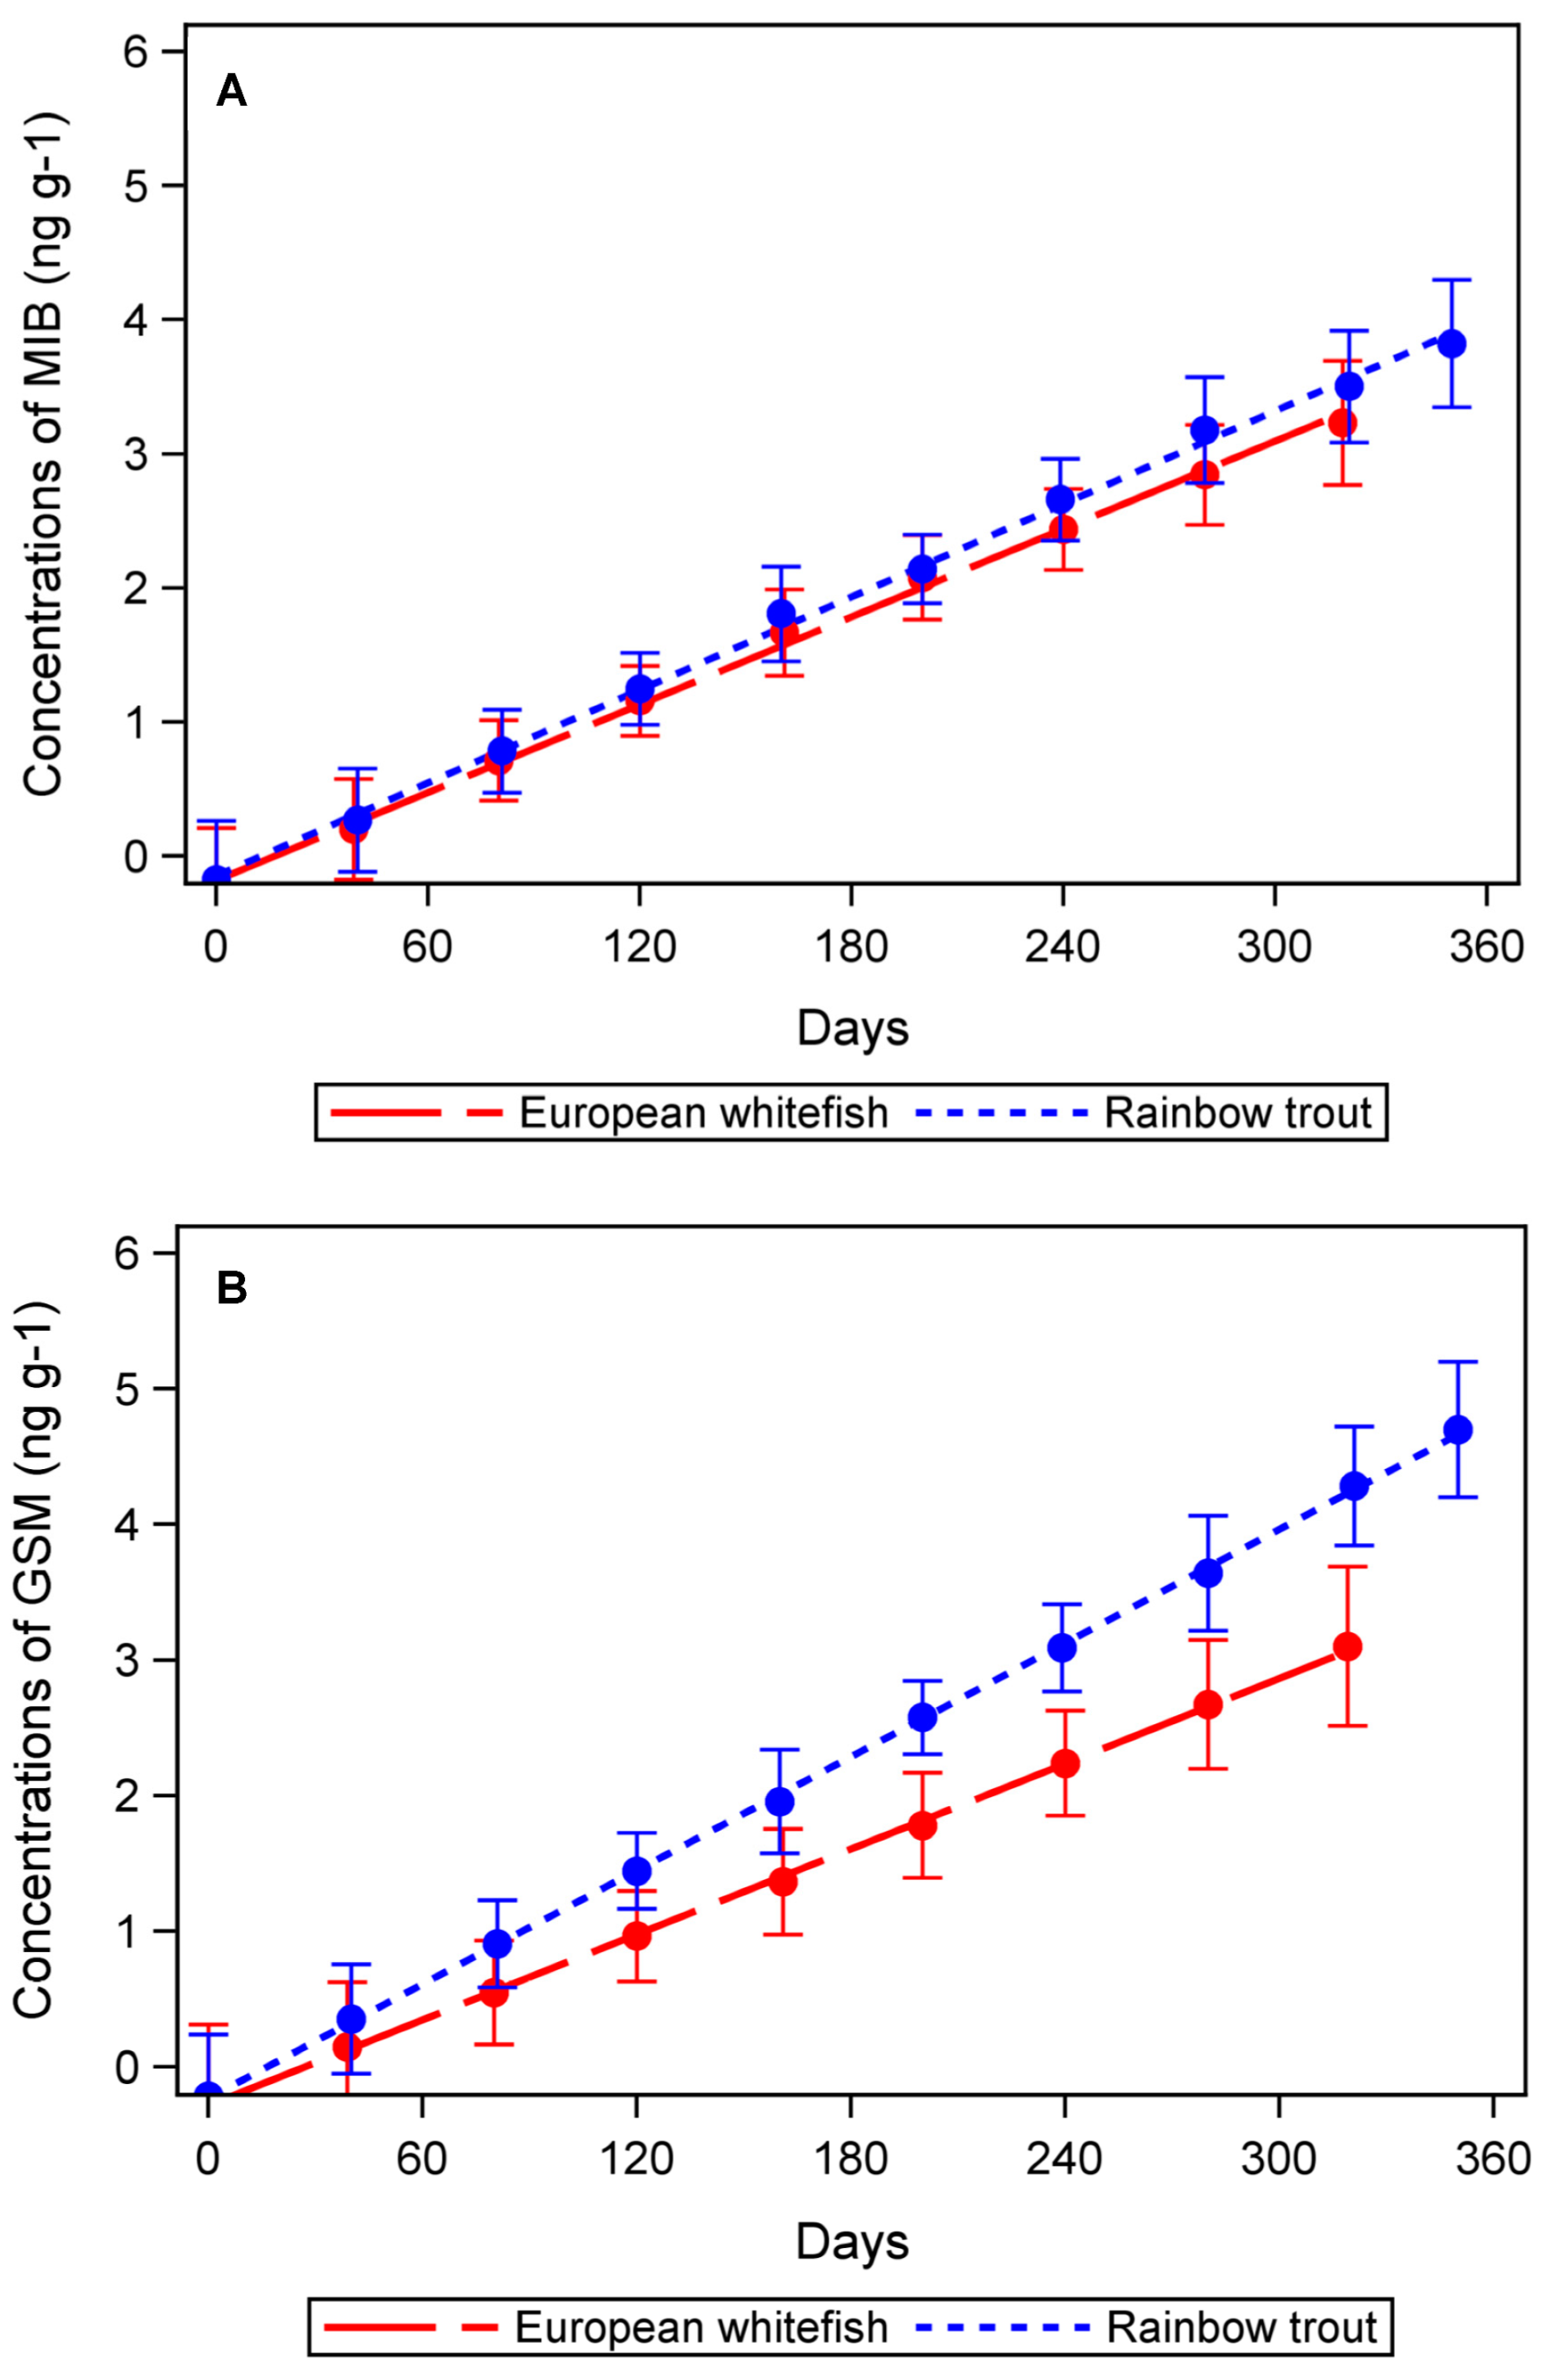
2.1. GSM and MIB in Fish Fillet

At the beginning of the experiment, the fish were very small (< 5 g) with low fat content, showing concentrations of GSM and MIB below the LODs. After the first four months, the concentrations in European whitefish (Figure 1a) were about 1 ng·g−1 for both GSM and MIB. After six months, average concentrations of 1.5 ng·g−1 (GSM) and up to 1.9 ng·g−1 (MIB) were detected in European whitefish. At the end of the experiment, average concentrations of 3.2 ng·g−1 (MIB) and 3.9 ng·g−1 (GSM) were reached. For rainbow trout, average concentrations ranged from < LOD to 3.6 ng·g−1 (MIB) and from < LOD to 5.6 ng·g−1 (GSM) during the 12 months of the experiment (Figure 1b).
The lipid content of both species increased over the 12 month period, reaching 14.8% for European whitefish (Figure 1A) and 22.5% for rainbow trout (Figure 1B). Similarly, the experiment showed that rainbow trout increased in weight faster, reaching an average of 660 g, compared to 240 g of European whitefish (Figure 2).

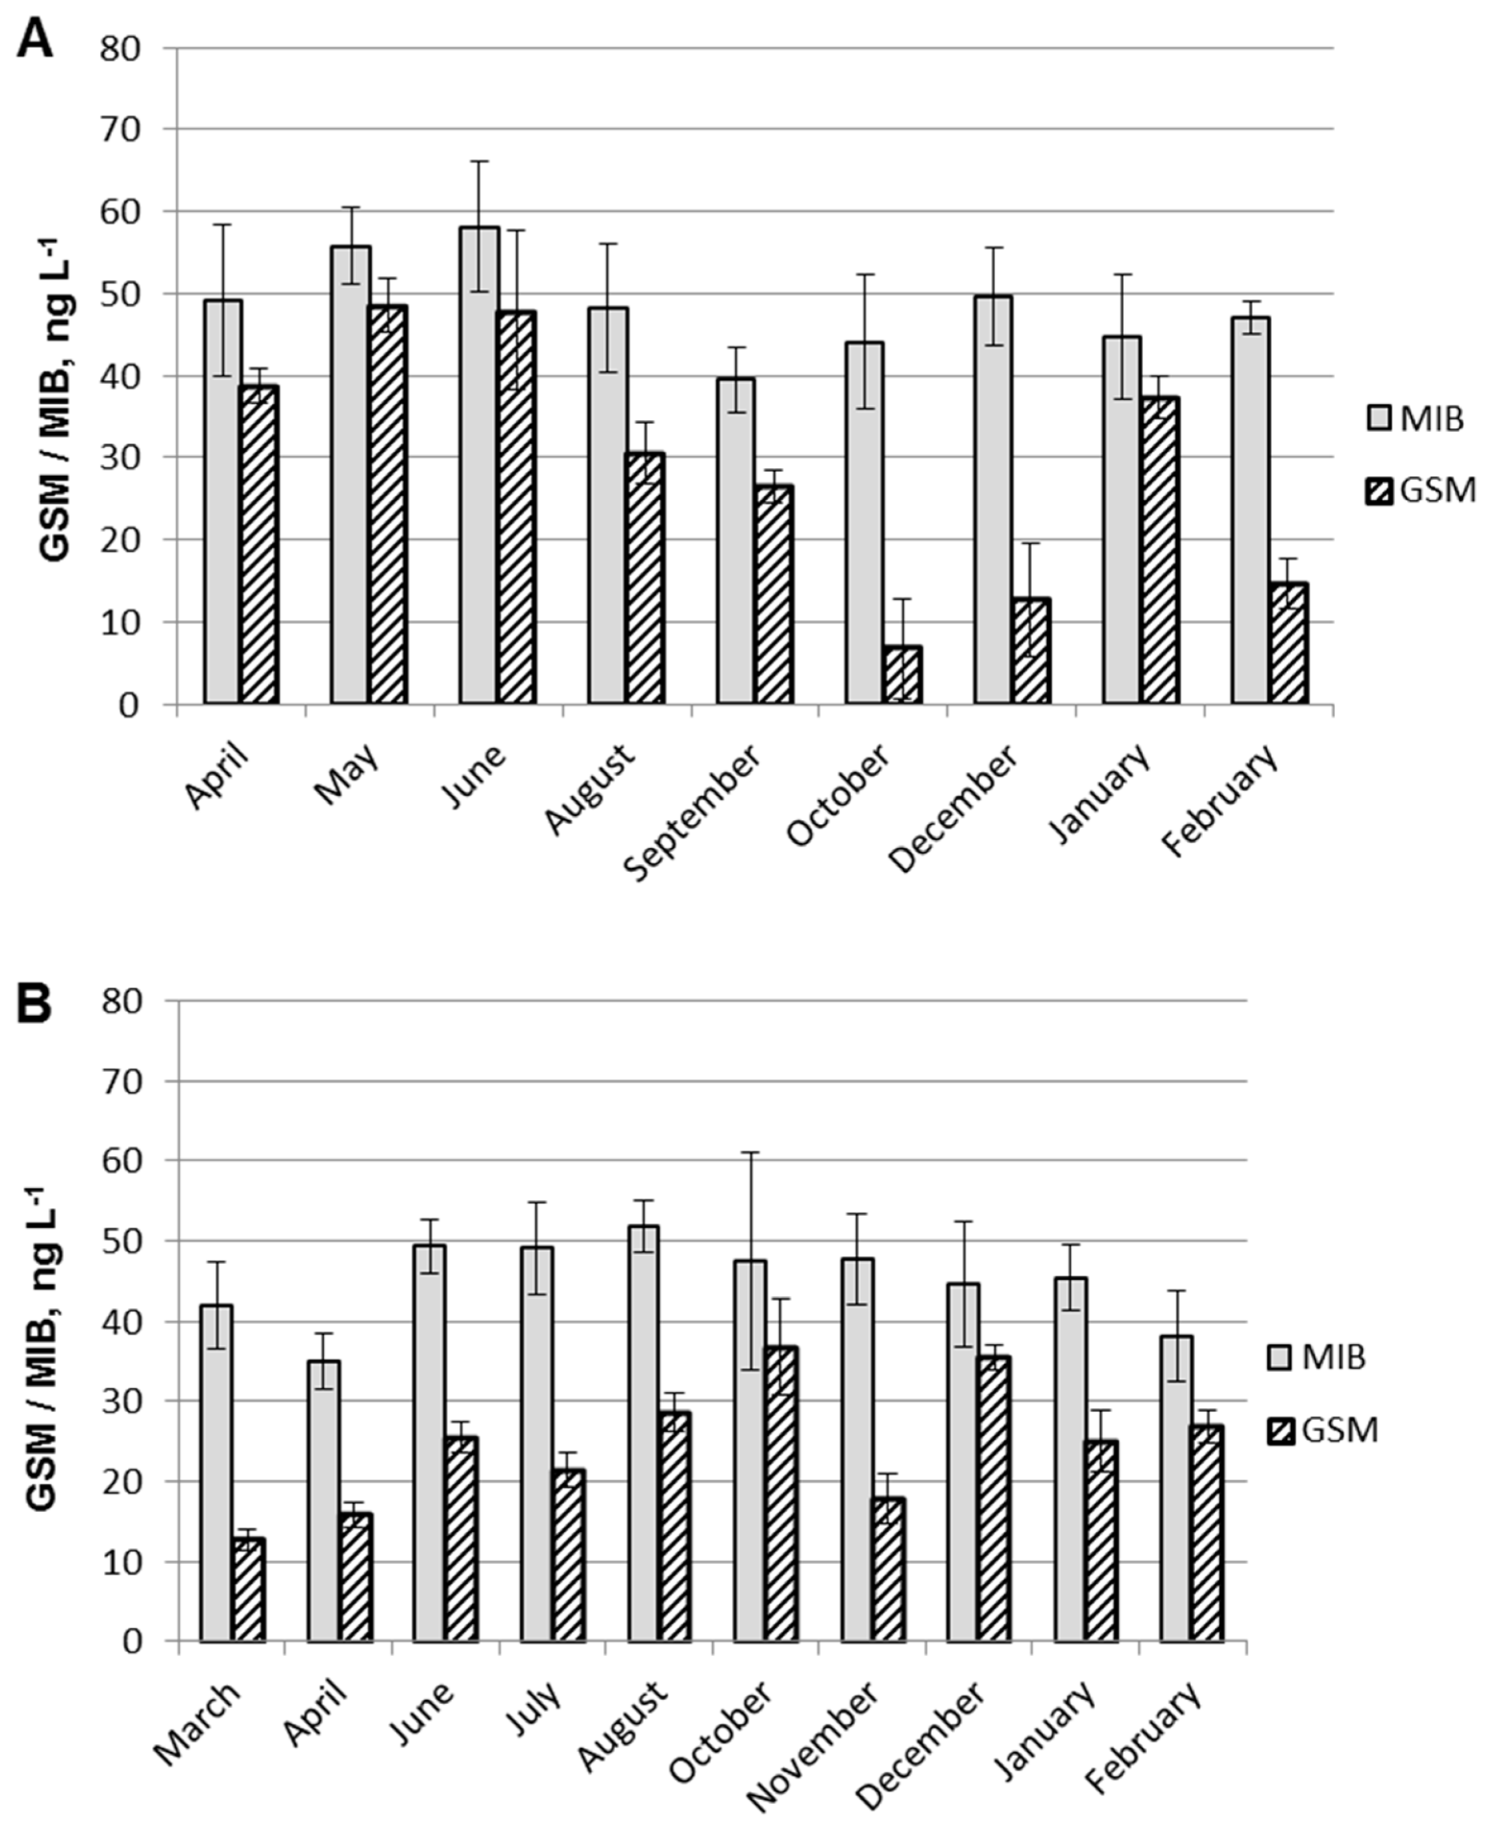
2.2. GSM and MIB in Water

Even though both species were reared in a shared RAS, differences in concentrations of GSM and MIB in the circulating water taken from tanks of each species were observed. However, the concentrations of GSM and MIB remained in a similar range for both species, with GSM showing lower values than MIB (Figure 3). In the tank water for European whitefish, the levels of GSM ranged from 6.8 to 49 ng·L−1, while for MIB they ranged from 39 to 58 ng·L−1 (Figure 3A). In the case of the circulating water in the rainbow trout rearing tank, concentrations ranged from 13 to 37 ng·L−1 (GSM), and from 35 to 52 ng·L−1 (MIB, Figure 3B).

2.3. Statistical Analyses of GSM and MIB Concentrations

Based on the statistical model, increases in GSM and MIB concentrations in fish flesh were plotted against the days of the experiment (Figure 4, Table S1). The concentrations of MIB increased very similarly for both species (Figure 4A, p = 1.00). This indicates no difference in accumulation of MIB between the species. However, the concentrations of GSM increased more quickly for rainbow trout than for European whitefish (Figure 4B, p = 0.15, Table S1b). Regarding the statistically non-significant interaction, the difference of the slopes was compared at different time points. At the beginning of the experiment (0–120 days), there was no statistically significant difference in GSM concentrations between the species, but after 140 days, the p values were lower than 0.05.
The lipid content of fish was chosen as the covariant for the statistical model. First, correlation expectancies of 0.10, 0.50, and 0.90 were tested. A correlation expectancy of 0.9 was chosen, because lipid content is generally considered to correlate to off-flavor concentrations [3,18]. However, all three gave very similar probabilities (0.60 < p < 0.63 for MIB and 0.80 < p < 0.84 for GSM), but none could be considered statistically significant (p < 0.05, Table S1). Concentrations found in the tank water were also tested as covariants but were not statistically significant (p = 0.63 for MIB, p = 0.84 for GSM).

3. Discussion

Overall, the accumulation of off-flavors increased as the fish increased in weight and lipid content. It is known that even relatively small concentrations in circulating water can lead to an accumulation of off-flavors in fish fillet, emphasizing the importance of the good quality of the water used for depuration and the efforts made to reduce the levels of off-flavors in circulating water. However, in this study, the concentrations in the rearing tank water did not correlate with statistical significance (p > 0.05) to the concentrations found in the fish fillet (Table S2, Figure S1).
Compared to many other systems, the concentrations of GSM and MIB found in fish fillet can be considered fairly high. For example, Zimba et al. [30] reported only 0.27–0.59 ng·g−1 for GSM, but higher levels of 4.8–19.7 ng·g−1 for MIB in RAS farmed rainbow trout. On the other hand, Sarker et al. [31] detected concentrations of 6 ng·g−1 (GSM) in rainbow trout, similar to results of this study. Robertson et al. [32] determined sensory detection limits of 0.9 ng·g−1 for GSM and 0.7–0.9 ng·g−1 for MIB in rainbow trout. Later, Petersen et al. [33] observed that geosmin was detectable even at 0.25 ng·g−1 in rainbow trout. In this study, this level was reached already after a couple of months of the experiment. This suggests that there might have been favorable conditions for microbes producing these off-flavors. For example, high turbidity levels (particulate matter) were detected in the system which is known to facilitate microbes. The fish of this study were raised only for research purposes, but it still emphasizes the need for depuration of fish in similar conditions.
Throughout the experiment, the levels of MIB remained higher than those of GSM in the rearing tank water (Figure 3), but for GSM there was a somewhat larger fluctuation in concentrations. Off-flavor concentrations in the water most likely fluctuate due to system management, including changing population of microbial off-flavor producers, cleaning of biofilters and tanks. Furthermore, turbidity increased during the experiment as the concentrations of GSM and MIB increased in fish fillet. Increase in turbidity often correlates to the increase in organic matter, which can facilitate all kinds of microbial growth, including those producing off-flavors [34]. However, turbidity in circulating water and concentrations of GSM and MIB in flesh of both species showed only moderate (R2 0.30–0.43) correlation in this study (Supplementary Figure S2).
We aimed at studying two species in similar conditions, but as the results show, there were differences in water quality, fish size and lipid contents, and eventually in concentrations of off-flavors. There were differences in concentrations of GSM and MIB between the rearing tanks of the two species, especially in the beginning of the experiment (Figure 3). More identical results were expected, because a shared water treatment system was used, and the circulating water flowed through all the rearing tanks before treatment. Possibly, GSM and MIB were produced by the tank wall biofilm. There might have been fluctuations in microbial counts of those species producing off-flavors as the microbial species compete for space and substrate [35]. Even though the biomasses were equal and conditions similar, rainbow trout increased in weight faster. At the end of the experiment, the fish densities reached 100 kg m−3. This relatively high fish density might have affected the local concentrations of off-flavor compounds due to excretion by the fish [36]. This is often not the case [21], because any release of off-flavor compounds due to fish metabolism probably remains undetected from water due to their low concentrations and possible transformation into conjugates or other transformation products [22]. All these factors affected the differences in concentrations between the species.
Slightly increased levels of off-flavors were found in the water of European whitefish rearing tanks during the summer months (Figure 3), but the same effect was less obvious in the case of rainbow trout. The slight increase in the summer may be due to the increased GSM and MIB levels of the inlet water from Lake Peurunka. Some strains of bacteria, such as cyanobacteria, can induce increased levels of off-flavor compounds in the summer [37]. Unfortunately, concentrations of GSM and MIB were not monitored from the inlet water to confirm this. Furthermore, the amount of biofilm can vary from tank to tank, which may explain the observed differences. This emphasizes the importance of cleaning the pipelines and tanks, and minimizing the growth of biofilm [38].
The concentrations in the circulating water were at the similar range to those reported from other RASs and can be considered typical [2,39]. However, concentrations of GSM and MIB can vary widely (20–650 ng·L−1, [2,40], because all RAS systems are unique, with different bacterial communities, conditions required for each species, process solutions, and inlet water properties.
In this study, the relatively high (14.8%) lipid contents can result from the fairly high (18%) lipid contents of feed as reported by Koskela et al. [41] (1998) and Quinton et al. [42] (2007). The concentrations of GSM and MIB in European whitefish and rainbow trout increased during the experiment as the fish grew (Figure 1, Figure 2) and increased in lipid content. However, lipid content as a covariant showed no statistically significant correlation (p > 0.05).
As early as 1988, Wu & Jüttner [43] found that GSM tended to attach to particulate matter, while MIB was largely found in soluble fractions. Although Wu & Jüttner [43] did not study the effect on fish flesh, their results may offer some insight into why a difference was observed between these two compounds. The different proportions of protein and lipid cells of the different species may partially explain the difference of GSM and MIB concentrations observed in this study. Secondly, the octanol/water partition coefficient for GSM is slightly higher (3.57) than that of MIB (3.31) [15], which may contribute to the more intense accumulation in the species with a higher fat content. Furthermore, GSM can be transformed to some of its conjugates, which may not occur for MIB [21]. The differences in the formation of conjugates and their location in fish may be due to physiological differences between the species. For example, Schram et al. [22] suggested that the distribution of GSM was not only due to lipid content in tissue but to biotransformation, which could occur in the liver. However, they did not study if biotransformation occurred for MIB.
To our knowledge, this study was the first to investigate off-flavor accumulation between different fish species under a shared RAS. Rainbow trout and European whitefish are both valuable and commercially raised species for consumers, and are often reared in RAS. These results suggest a difference in the accumulation of GSM between the species, while the same behavior was not observed for MIB. Based on this, we would recommend for choosing European whitefish as the reared species, if other economic and market-related issues were equal. The underlying accumulation mechanism and the affecting factors remain a subject for further research, suggesting a difference between the accumulations of these compounds.

4. Materials and Methods

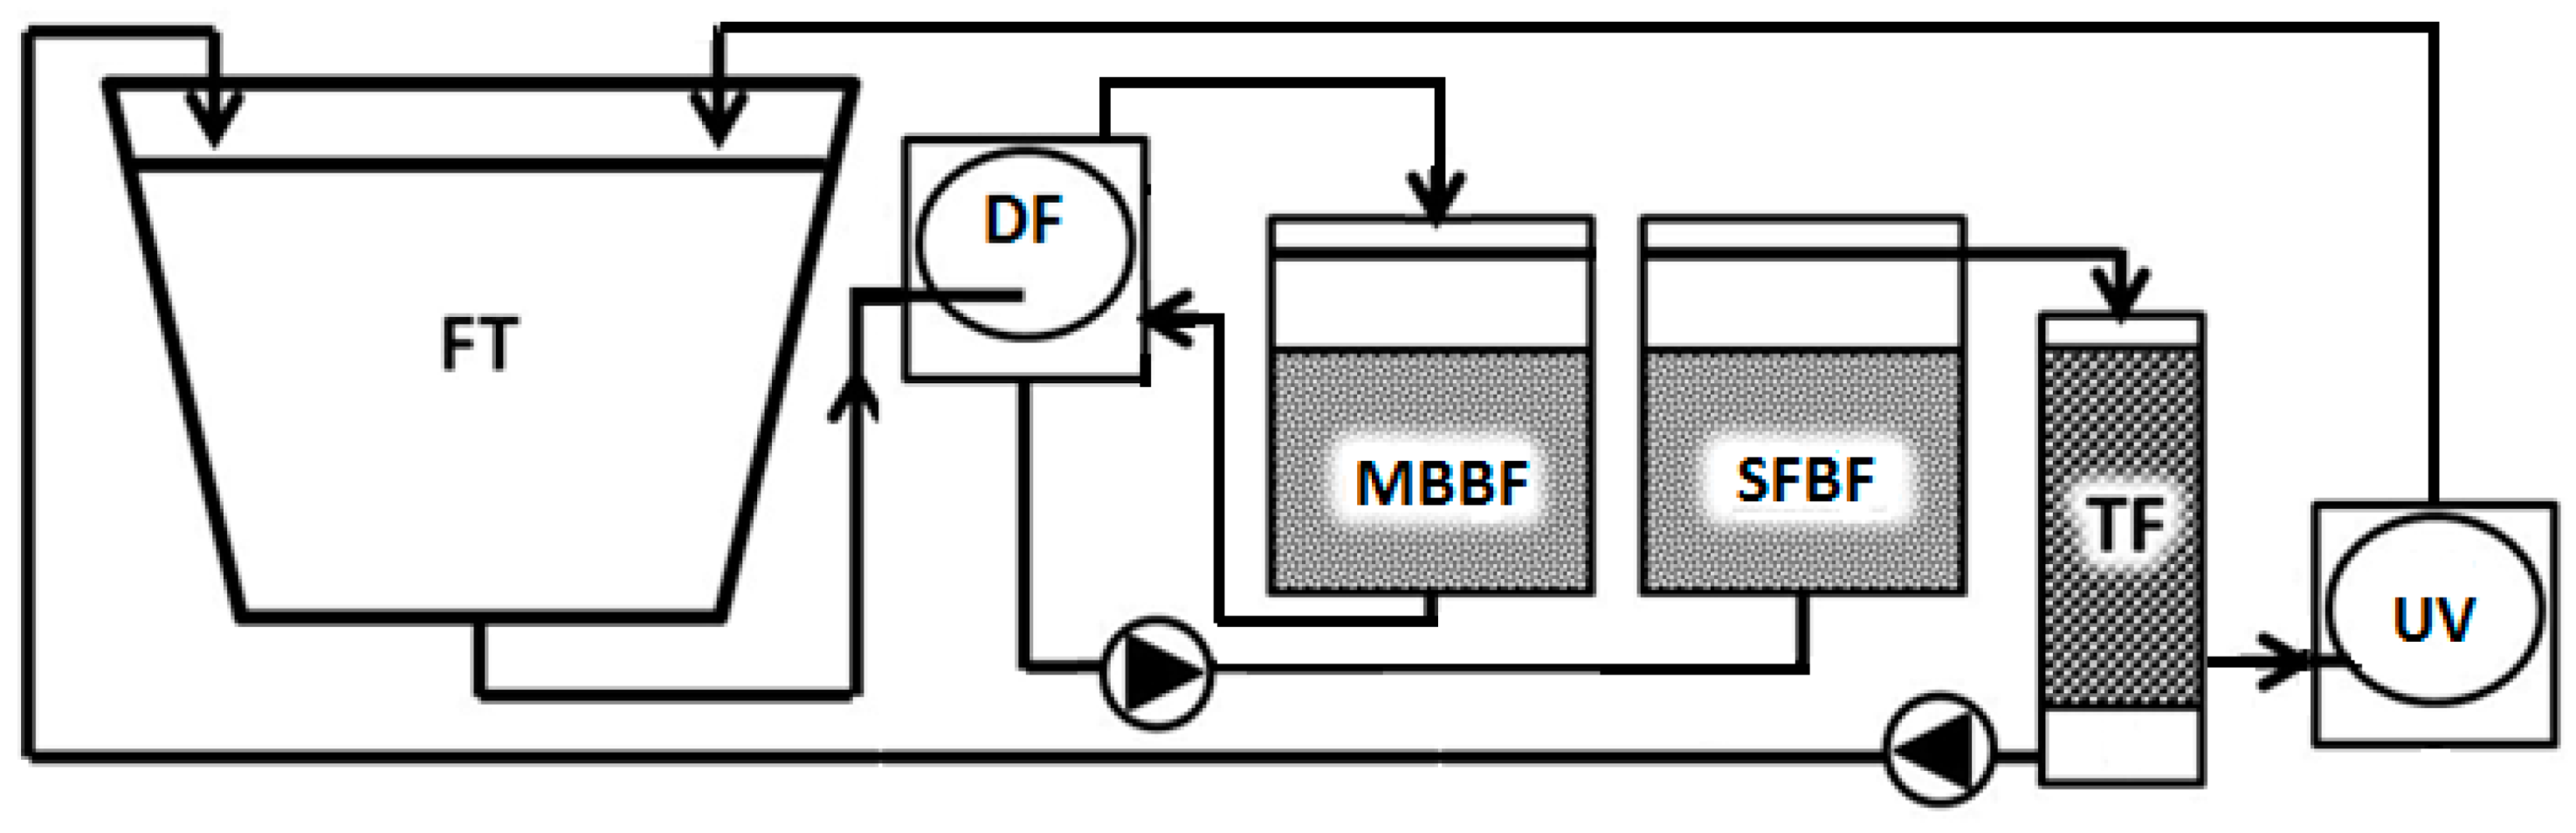
4.1. Experimental Setup

The experiment was performed at the Natural Resources Institute Finland (Luke) Laukaa fish farm using an experimental RAS platform. The RAS consisted of 20 identical bottom-drained rearing tanks made of fiberglass (450 L), which had a shared water treatment system (Figure 5). The solids removal system consisted of a drum filter with 60 µm mesh size (F2-80, Faivre, Baume-les-Dames, France). In nitrification, ammonium was transformed to nitrite and further to nitrate. Moving-bed biofilter (MBBF) filled with RK Bioelements heavy (750 m2·m−3) carrier material and a biofilter (CycloBio, Marine Biotech Inc., Beverly, MA, USA) filled with fine sand were used, stabilized to full maturity during previous trials prior to the start of this trial. The circulating water was aerated in the moving-bed biofilter and in a cascade column, filled with plastic balls (polypropylene, 50 mm in diameter) as filter media. The circulating water was treated with UV light (4 × 220 W UV light bulbs) for disinfection (Skjölstrup & Grönborg, Aalborg, Denmark).
Surface water from the oligotrophic Lake Peurunka (area 694 ha, 60000 m3) was used as the clean replacement water without further treatment at a water renewal rate of 2.5 m3·day−1, corresponding to about 750 L·kg−1 of feed.
Oxygen levels in the fish tanks were kept to an average of 7.3 mg·L−1 by aerating the water in the MBBF and injecting oxygen into the cascade column. The pH of the circulating water was adjusted with a 2:1 mixture of NaHCO3 (Solvay Chemicals International SA, Brussels, Belgium) and Microdol powder (CaMg(CO3)2, Talc As, Fjell, Norway). The water temperature was maintained at 14.8 °C and the pH at 7.0, in the pump sump throughout the experiment (Figure 6, Table 1). The measured parameters were monitored regularly and adjusted when required. Water quality parameters (total nitrogen (TAN), nitrite-N (NO2-N), nitrate-N (NO3-N), sulfate (SO42−), alkalinity, and turbidity) were monitored by laboratory tests once a week. TAN, NO2-N, and NO3-N were monitored by spectrophotometric tests (Procedure 8038 Nessler, LCK340, LCK341, UN3316 9 II), sulfate by SulfaVer 4 (Hach 1206599 sulfate reagent powder pillows, 0–70 mg·L−1 range), alkalinity by a standard titration method (ISO 9963-1:1994, TitraLab AT1000, Hach, Loveland, USA), and turbidity with a Hach 2100Q Turbidimeter, USA (Figure 2, Table 1).

4.2. Fish and Feeding

At the beginning of the experiment in March 2018, 3570 European whitefish (Coregonus lavaretus) and 5500 rainbow trout (Oncorhynchus mykiss) originating from the National JALO selective breeding program (Natural Resources Institute Finland, Tervo, Finland) with an average weight of 0.28 g and 1.36 g were divided into rearing tanks, each species in separate tanks within the same RAS. Thus, apart from the fish tanks, all water treatment units of the RAS were shared by both species. The operational design and the rearing conditions for both species were listed in Table 2. Both species were collected as fertilized eggs from the Hanka-Taimen facility. Biomasses were equalized in intermediate weighing when required, both species a total of four times during the experiment, to adjust the feeding based on the correct tank biomass. Similarly, the number of fish was decreased and adjusted when required to maintain the tank biomass at a suitable level. The tanks were illuminated with white light of 100–150 24 h per day. The fish were visually inspected on a daily basis. No irregular behavior was observed. Ethical approval of this study was obtained from the Finnish Food Authority and the experiment was performed in accordance with the guidelines of Directive 2010/63/EU [44].
At the beginning of the experiment, the feeding rate was set to 5% bw·d−1 for rainbow trout, and 4% bw·d−1 for European whitefish. For rainbow trout, the feeding ranged from 5% to 0.3% as the fish grew to an average harvest weight of 660 g, while for European whitefish, it ranged from 4% to 0.3% and a weight of 240 g. The fish were fed 6 h per day (06:00–12:00) by the belt feeders, and the feed intake was monitored using a feed collector unit located under the water outlet of each rearing tank. Feeding was adjusted based on appetite (0.3–5% bw·d−1) to avoid uneaten feed, leading to only a few dozen pellets in the feed collector per day (Table 2).
The main ingredients of feeds consisted of fish meal made of Baltic herring and sprat, soy, and bean, fish and rapeseed oil being the lipid sources in the diets. The whitefish were fed with commercial diets named Caviar 200–300 µm (BernAqua, Olen, Belgium, 55% protein, 15% lipids), 0.5 mm (60% protein, 12% lipids) and 0.8 mm (57% protein, 15% lipids) Vita (Veronesi, Verona, Italy, imported by Raisioaqua), 1.2 mm (53% protein, 18% lipids) and 1.5 mm (48% protein, 24% lipids) Hercules (Raisioaqua, Finland), and finally with 1.7 mm (49% protein, 16% lipids), 2.5 mm (48% protein, 17% lipids), and 3.5 mm (47% protein, 18% lipids) Circuit Silver (Raisioaqua, Raisio, Finland), as given by the manufacturer.
The rainbow trout were fed with 0.5 mm and 0.8 mm Vita (Veronesi, Italy, imported by Raisioaqua), 1.2 mm, 1.5 mm, and 1.7 mm (48% protein, 24% lipids) Hercules (Raisioaqua, Raisio, Finland), and finally with 2.5 mm (47% protein, 23% lipids), 3.5 mm (45% protein, 24% lipids), and 5.0 mm (43% protein, 26% lipids) Circuit Red (Raisioaqua, Raisio, Finland). All the crude protein and lipid content of the diets were given by the manufacturer.

4.3. Sample Collection for Off-flavor Analyses

The circulating water from the fish tanks for both rainbow trout and European whitefish was collected approximately every 40 days. Although the tanks for both species were located within the shared RAS, water samples were taken from the separate rearing tanks of both species. Water samples were collected in 250 mL high-density polyethylene (HDPE) plastic jars with HDPE plastic caps and stored at −22 °C. Similarly, the fish were sampled from the same tanks as the water samples were taken. In each sampling, three fish were taken, euthanized, gutted and stored frozen at −22 °C until the analysis. For the analyses, the fish were melted and flesh from the lateral part of fillet [3] was taken from the three fish, homogenized and taken 4 × 1 g for the analyses (n = 4).

4.4. Chemical Analyses

The lipid content of the fish fillet was determined by Synlab (Synlab, Analytics & Services Finland Oy, Karkkila, Finland). The accredited method by Synlab Oy included lyophilization, combined with acid hydrolysis (Synlab internal method 076) to determine the lipid content per g of dry fish fillet.
For the chemical analyses of GSM and MIB, four parallel analyses were performed from a pooled sample of three different fish and the mean values were reported. The fish were filleted, skin was removed, and the samples were taken from the lateral part of the fillet, as shown in [3]. At the beginning of the experiment, the fish were very small (< 5 g), and more than three fish were required to obtain sufficient material for the analyses. They were not filleted due to their small size, but their heads were removed.
The pretreatment and analysis were performed as previously reported and validated by Lindholm-Lehto et al. [4]. In brief, a headspace solid phase microextraction (HS-SPME) procedure was performed, with a manual SPME assembly and an extraction fiber coated with StableFlex divinylbenzene/carboxene/polydimethyl siloxane (DVB/CAR/PDMS), 1 cm, 50/30 μm (part no. 105 57328-U, Supelco, Merck, Darmstadt, Germany).
First, 1 g of fish flesh or 1 mL of water was placed in a 10 mL HS vial. A saturated solution of NaCl (98% purity, Merck, Darmstadt, Germany) was prepared, and 750 μL was added to the vial. The method of standard addition with five additions (TraceCERT®, 100 μg·mL−1 in MeOH) of (+/-) GSM and MIB, Merck, Darmstadt, Germany) was used to construct calibration curves for quantification of GSM and MIB in both fish and water samples. Sealed sample vials were placed in a water bath at 60 °C. The septum of the sample vial was pierced with a needle, and the DVB/CAR/PDMS fiber was exposed in the headspace for extraction of 30 minutes, before introducing the fiber directly into the gas chromatograph coupled with a mass spectrometry (GC-MS) injection port for desorption.
An Agilent 6890 series/5973 N GC/MSD (Palo Alto, CA, USA) system with a Phenomenex Zebron ZB-5MSi (Torrance, CA, USA) capillary column (30 m × 0.25 mm × 0.25 μm) was used to separate and detect the analytes. The temperature of the injector was adjusted to 270 °C in the splitless mode. Helium was used as the carrier gas at flow rate of 0.7 mL min−1. The temperature of the oven started at 45 °C for 3 min and increased by 30 °C min−1 up to 300 °C, taking a total of 14.5 min. The electron impact (EI)-MS conditions were selected at 230 °C for the ion source, with a 5 min delay time and an ionizing voltage of 70 eV. The selected ion monitoring (SIM) mode was used for detection, with m/z 112, 162, 126, 182 (GSM) and m/z 95, 135, 168 (MIB). Base peak areas of m/z 95 and 112 were used for the quantification of GSM and MIB. For fish fillet, levels of quantification (LOQ)s were 2.1 ng g−1·for GSM and 1.5 ng·g−1 for MIB, while for aqueous samples, they were 2.8 ng L−1 (GSM) and 1.6 ng·L−1 (MIB). Levels of detection (LODs) and the full method validation have been reported in Lindholm-Lehto et al. [4].

4.5. Statistical Analyses

All analyses were performed using the SAS Enterprise Guide 7.15 (SAS Institute Inc., Cary, NC, USA). The IML procedure was used for simulations and the CORR, MIXED, GLIMMIX, and MIANALYZE procedures for statistical analyses.
Data consisted of ten time points measured approximately every 40 days (0–350 days) for rainbow trout, and nine time points (0–319 days) for European whitefish, respectively. Four replicates of each time point per species were analyzed in the laboratory, but depending on the analytical method with standard addition quantification, only means and standard deviations were returned for both species in each time point instead of original observations. However, based on these means and deviations, we were able to simulate new data with four replicates from every time point as replica from the original data. Actually, a thousand this kind of simulated samples with the assumption of the normality of dependent variables (GSM and MIB) were formed for both species. Thus, simulated data consisted of 76,000 observations: 1000 samples from 19 time points and 4 replicates. Simulation was performed with zero correlation expectancy between variables for every observation, except for concentrations of GSM and MIB with the lipid content. A strong correlation (r = 0.9) was expected in these cases, but correlations of 0, 0.1, and 0.5 were also tested.
A linear model was used for each simulated sample, and the information of a thousand models was gathered with a statistically appropriate way, leading to one combined model for both concentrations. Used model was based on repeated measures of ANCOVA design with the species (rainbow trout and European whitefish), days as a continuous variable (time points) and their interaction as fixed effects. Lipid content and concentrations of GSM and MIB in circulating water were also tested as covariants, but the concentrations were removed from the models, based on the lack of linearity with dependent variables. The differences in the slopes of species were tested every twenty days by simple t-tests [45].
The assumption of equal variances of species was tested and rejected in both cases based on a likelihood ratio test. Allowing unequal variances of species improved the residuals of the models achieving the assumption of normality. All models were fitted using the restricted maximum likelihood estimation method and a significance level of α = 0.05. The degrees of freedom were calculated using the Kenward-Roger method [46].

Supplementary Materials

The following are available online at https://0-www-mdpi-com.brum.beds.ac.uk/2410-3888/5/2/13/s1, Table S1: Comparison of the accumulation of MIB (a) and GSM (b) between rainbow trout and European whitefish, Supplementary Table S2 & Figure S1: Correlation between the concentrations of MIB (a) and GSM (b) in tank water and in rainbow trout and European whitefish flesh, Figure S2: Correlations between turbidity in circulating water and concentrations of GSM and MIB in (a) European whitefish and (b) rainbow trout flesh.

Author Contributions

Conceptualization, J.V. and P.L.-L.; Data Curation, J.K. (Janne Kaseva) and P.L.-L.; Formal Analysis, P.L.-L.; Investigation, J.K. (Juha Koskela) and J.V.; Methodology, P.L.-L. and J.K. (Janne Kaseva); Supervision, J.K. (Juha Koskela) and J.V.; Project Administration, J.V.; Validation, P.L.-L.; Visualization, P.L.-L., J.K. (Janne Kaseva); Writing—Original Draft Preparation, P.L.-L.; Writing—Review & Editing, J.K. (Juha Koskela), J.K. (Janne Kaseva) and J.V. All authors have read and agreed to the published version of the manuscript.

Funding

This research was funded by the European Maritime and Fisheries Fund.

Acknowledgments

We wish to express our gratitude for the expertise given to the statistical analyses by senior scientist Mika Kurkilahti from Natural Resources Institute Finland.

Conflicts of Interest

The authors declare that they have no conflict of interest.

References

  1. Dalsgaard, J.; Lund, I.; Thorarinsdottir, R.; Drengstig, A.; Arvonen, K.; Pedersen, P.B. Farming different species in RAS in Nordic countries: Current status and future perspectives. Aquac. Eng. 2013, 53, 2–13. [Google Scholar] [CrossRef] [Green Version]
  2. Burr, G.S.; Wolters, W.R.; Schrader, K.K.; Summerfelt, S.T. Impact of depuration of earthy-musty off-flavors on fillet quality of Atlantic salmon, Salmo salar, cultured in a recirculating aquaculture system. Aquac. Eng. 2012, 50, 28–36. [Google Scholar] [CrossRef]
  3. Hathurusingha, P.I.; Davey, K.R. Experimental validation of a time-dependent model for chemical taste taint accumulation as geosmin (GSM) and 2-methylisoborneol (MIB) in commercial RAS farmed barramundi (Lates calcarifer). Ecol. Model. 2016, 340, 17–27. [Google Scholar] [CrossRef]
  4. Lindholm-Lehto, P.C.; Vielma, J.; Pakkanen, H.; Alén, R. Depuration of geosmin- and 2-methylisoborneol-induced off-flavors in recirculating aquaculture system (RAS) farmed European whitefish Coregonus lavaretus. J. Food Sci. Technol. 2019, 56, 4585–4594. [Google Scholar] [CrossRef] [PubMed] [Green Version]
  5. Tucker, C.S. Off-flavor problems in aquaculture. Rev. Fish. Sci. 2000, 8, 45–88. [Google Scholar] [CrossRef]
  6. Petersen, M.A.; Md. Alam, A.; Md. Rahman, M.; Md. Ali, L.; Mahmud, S.; Schlüter, L.; Jørgensen, N.O.G. Geosmin off-flavour in pond-raised fish in southern Bangladesh and occurrence of potential off-flavour producing organisms. Aquac. Environ. Interact. 2014, 5, 107–116. [Google Scholar] [CrossRef] [Green Version]
  7. Liu, H.; Li, H.; Wei, H.; Zhu, X.; Han, D.; Jin, J.; Yang, Y.; Xie, S. Biofloc formation improves water quality and fish yield in a freshwater pond aquaculture system. Aquaculture 2019, 506, 256–269. [Google Scholar] [CrossRef]
  8. Wang, R.; Dong, L.; Chao, X.J.; Bing, W.Y. Seasonal occurrence and species specificity of fishy and musty odor in Huajiang Reservoir in winter, China. Water Res. Ind. 2015, 11, 13–26. [Google Scholar] [CrossRef] [Green Version]
  9. Gerber, N.N. Geosmin from microorganisms in trans-1,10-dimethyl-trans-9-decalol. Tetrahedron Lett. 1968, 25, 2971–2974. [Google Scholar] [CrossRef]
  10. Gerber, N.N. A volatile metabolite of actinomycetes: 2-methylisoborneol. J. Antibiot. 1969, 22, 508–509. [Google Scholar] [CrossRef] [Green Version]
  11. Polak, E.H.; Provasi, J. Odor sensitivity to geosmin enantiomers. Chem. Senses 1992, 17, 23–26. [Google Scholar] [CrossRef]
  12. Dickschat, J.S.; Bode, H.B.; Mahmud, T.; Müller, R.; Schulz, S. A novel type of geosmin biosynthesis in myxobacteria. J. Org. Chem. 2005, 70, 5174–5182. [Google Scholar] [CrossRef] [PubMed]
  13. Ludwig, F.; Medger, A.; Börnick, H.; Opitz, M.; Lang, K.; Göttfert, M.; Röske, I. Identification and expression analyses of putative sesquiterpene synthase genes in Phormidium sp. and prevalence of geoA-like genes in a drinking water reservoir. Appl. Environ. Microbiol. 2007, 73, 6988–6993. [Google Scholar] [CrossRef] [PubMed] [Green Version]
  14. Zuo, Y.; Li, L.; Zhang, T.; Zheng, L.; Dai, G.; Liu, L.; Song, L. Contribution of Streptomyces in sediment to earthy odor in the overlying water in Xionghe reservoir, China. Water Res. 2010, 44, 6085–6094. [Google Scholar] [CrossRef] [PubMed]
  15. Clark, K.E.; Gobas, A.P.C.; Mackay, D. Model of organic chemical uptake and clearance by fish from food and water. Environ. Sci. Technol. 1990, 24, 1203–1213. [Google Scholar] [CrossRef]
  16. Nichols, J.W.; McKim, J.M.; Anderdsen, M.E.; Gargas, M.L.; Clewell, H.J.; Erickson, R.J. A physiologically based toxicokinetic model for the uptake and disposition of waterborne organic chemicals in fish. Toxicol. Appl. Pharmacol. 1990, 106, 433–447. [Google Scholar] [CrossRef]
  17. Arnot, J.A.; Gobas, F.A.P.C. A review of bioconcentration factor (BCF) and bioaccumulation factor (BAF) assessments for organic chemicals in aquatic organisms. Environ. Rev. 2006, 14, 257–297. [Google Scholar] [CrossRef]
  18. Howgate, P. Tainting of farmed fish by geosmin and 2-methyliso-borneol: A review of sensory aspects and of uptake/depuration. Aquaculture 2004, 234, 155–181. [Google Scholar] [CrossRef]
  19. Watson, S.B.; Monis, P.; Baker, P.; Giglio, S. Biochemistry and genetics of taste- and odor producing cyanobacteria. Harmful Algae 2016, 54, 112–127. [Google Scholar] [CrossRef]
  20. Lukassen, M.B. Off-Flavour Producing Bacteria in Aquaculture. Ph.D. Thesis, Aalborg University, Aalborg, Denmark, 2017. [Google Scholar]
  21. Schram, E.; van Kooten, T.; van de Heul, J.W.; Schrama, J.W.; Verreth, J.A.J.; Murk, A.J. Geosmin depuration from European eel (Anguilla anguilla) is not affected by the water renewal rate of depuration tanks. Aquac. Res. 2017, 48, 4646–4655. [Google Scholar] [CrossRef]
  22. Schram, E.; Schrama, J.W.; van Kooten, T.; Kwadijijk, C.J.A.F.; Kampen, H.; van de Heul, J.W.; Verreth, J.A.J.; Murk, A.J. Experimental validation of geosmin uptake in rainbow trout, Oncorhynchus mykiss (Waldbaum) suggests biotransformation. Aquac. Res. 2018, 49, 668–675. [Google Scholar] [CrossRef] [Green Version]
  23. Papp, Z.G.; Kerepeczki, É.; Pekár, F.; Gál, D. Natural origins of off-flavours in fish related to feeding habits. Water Sci. Technol. 2007, 55, 301–309. [Google Scholar] [CrossRef] [PubMed]
  24. Powell, A.; Scolding, J.W.S. Direct application of ozone in aquaculture systems. Rev. Aquac. 2016, 10, 424–438. [Google Scholar] [CrossRef]
  25. Spiliotopoulou, A.; Rojas-Tirado, P.; Chhetri, R.K.; Kaarsholm, K.M.S.; Martin, R.; Pedersen, P.B.; Pedersen, L.-F.; Andersen, H.R. Ozonation control and effects of ozone on water quality in recirculating aquaculture systems. Water Res. 2018, 133, 289–298. [Google Scholar] [CrossRef] [Green Version]
  26. Fotiou, T.; Triantis, T.M.; Kaloudis, T.; Hiskia, A. Evaluation of the photocatalytic activity of TiO2 based catalysts for the degradation and mineralization of cyanobacterial toxins and water off-odor compounds under UV-A, solar and visible light. Chem. Eng. J. 2015, 261, 17–26. [Google Scholar] [CrossRef]
  27. Xue, Q.; Liu, Y.; Zhou, Q.; Utsumi, M.; Zhang, Z.; Sugiura, N. Photocatalytic degradation of geosmin by Pd nanoparticle modified WO3 catalyst under simulated solar light. Chem. Eng. J. 2016, 283, 614–621. [Google Scholar] [CrossRef]
  28. Azaria, S.; Nir, S.; van Rijn, J. Combined adsorption and degradation of the off-flavor compound 2-methylisoborneol in sludge derived from a recirculating aquaculture system. Chemosphere 2017, 169, 69–77. [Google Scholar] [CrossRef]
  29. Hanson, T.R. Off-Flavors in Aquaculture, ACS Symposium Series; American Chemical Society: Washington, DC, USA, 2003. [Google Scholar] [CrossRef] [Green Version]
  30. Zimba, P.V.; Schrader, K.K.; Hyldig, G.; Strobel, B.W.; Jørgensen, N.O.G. Evaluation of geosmin and 2-methylisoborneol off-flavour in smoked rainbow trout fillets using instrumental and sensory analyses. Aquac. Res. 2012, 43, 149–153. [Google Scholar] [CrossRef]
  31. Sarker, P.; Pilote, A.; Auffret, M.; Proulx, É.; Villemur, R.; Deschamps, M.-H.; Vandenberg, G. Reducing geosmin off-flavor compounds and waste outputs through dietary phosphorus management in rainbow trout aquaculture. Aquac. Environ. Interact. 2014, 6, 105–117. [Google Scholar] [CrossRef] [Green Version]
  32. Robertson, R.F.; Jauncey, K.; Beveridge, M.C.M.; Lawton, L.A. Depuration rates and the sensory threshold concentration of geosmin responsible for earthy-musty taint in rainbow trout, Onchorhynchus mykiss. Aquaculture 2005, 245, 89–99. [Google Scholar] [CrossRef]
  33. Petersen, M.A.; Hyldig, G.; Strobel, B.W.; Henriksen, N.; Jørgensen, N.O.G. Chemical and sensory quantification of geosmin and 2-methylisoborneol in rainbow trout (Oncorhynchus mykiss) from recirculated aquacultures in relation to concentrations in basin water. J. Agric. Food Chem. 2011, 59, 12561–12568. [Google Scholar] [CrossRef] [PubMed]
  34. Parinet, J.; Rodriguez, M.J.; Sérodes, J. Influence of water quality on the presence of off-flavour compounds (geosmin and 2-methylisoborneol). Water Res. 2010, 44, 5847–5856. [Google Scholar] [CrossRef] [PubMed]
  35. Blancheton, J.P.; Attramadal, K.J.K.; Michaud, L.; Roque d’Orbcastel, E.; Vadstein, O. Insight into bacterial population in aquaculture systems and its implication. Aquac. Eng. 2013, 53, 30–39. [Google Scholar] [CrossRef]
  36. Schram, E.; Verdegem, M.C.J.; Widjaja, R.T.O.B.H.; Kloet, C.J.; Foss, A.; Schelvis-Smit, R.; Roth, B.; Imsland, A.K. Impact of increased flow rate on specific growth rate of juvenile turbot (Scophthalmus maximus, Rafinesque 1810). Aquaculture 2009, 292, 46–52. [Google Scholar] [CrossRef]
  37. Guttman, L.; van Rijn, J. 2-Methylisoborneol and geosmin uptake by organic sludge derived from a recirculating aquaculture system. Water Res. 2009, 43, 474–480. [Google Scholar] [CrossRef]
  38. Davidson, J.; Schrader, K.; Ruan, E.; Swift, B.; Aalhus, J.; Juarez, M.; Wolters, W.; Burr, G.; Good, C.; Summerfelt, S.T. Evaluation of depuration procedures to mitigate the off-flavor compounds geosmin and 2-methylisoborneol from Atlantic salmon Salmo salar raised to market-size in recirculating aquaculture systems. Aquac. Eng. 2014, 61, 27–34. [Google Scholar] [CrossRef] [Green Version]
  39. Podduturi, R.; Petersen, M.A.; Vestergaard, M.; Jørgensen, N.O.G. Geosmin fluctuations and potential hotspots for elevated levels in recirculated aquaculture system (RAS): A case study from pikeperch (Stizostedion lucioperca) production in Denmark. Aquaculture 2020, 514, 734501. [Google Scholar] [CrossRef]
  40. Lukassen, M.B.; Saunders, A.M.; Sindilariu, P.D.; Nielsen, J.L. Quantification of novel geosmin-producing bacteria in aquaculture systems. Aquaculture 2017, 497, 304–310. [Google Scholar] [CrossRef]
  41. Koskela, J.; Jobling, M.; Savolainen, R. Influence of dietary fat level on feed intake, growth and fat deposition in the whitefish Coregonus lavaretus. Aquac. Int. 1998, 6, 95–102. [Google Scholar] [CrossRef]
  42. Quinton, C.D.; Kause, A.; Ruohonen, K.; Koskela, J. Genetic relationships of body composition and feed utilization traits in European whitefish (Coregonus lavaretus L.) and implications for selective breeding in fishmeal and soybean meal-based diet environments. J. Anim. Sci. 2007, 85, 3198–3208. [Google Scholar] [CrossRef] [Green Version]
  43. Wu, J.-T.; Jüttner, F. Differential partitioning of geosmin and 2-methylisoborneol between cellular constituents in Oscillatoria tenuis. Arch. Microbiol. 1988, 150, 580–583. [Google Scholar] [CrossRef]
  44. Directive 2010/63/EU of the European Parliament and of the Council on the Protection of Animals Used for Scientific Purposes. Available online: https://eur-lex.europa.eu/legal-content/EN/TXT/PDF/?uri=CELEX:32010L0063&from=EN (accessed on 1 March 2020).
  45. Hsu, J. Multiple Comparisons; Chapman and Hall, CRC: New York, NY, USA, 1996. [Google Scholar] [CrossRef]
  46. Kenward, M.G.; Roger, J.H. An improved approximation to the precision of fixed effects from restricted maximum likelihood. Comput. Stat. Data Anal. 2009, 53, 2583–2595. [Google Scholar] [CrossRef]
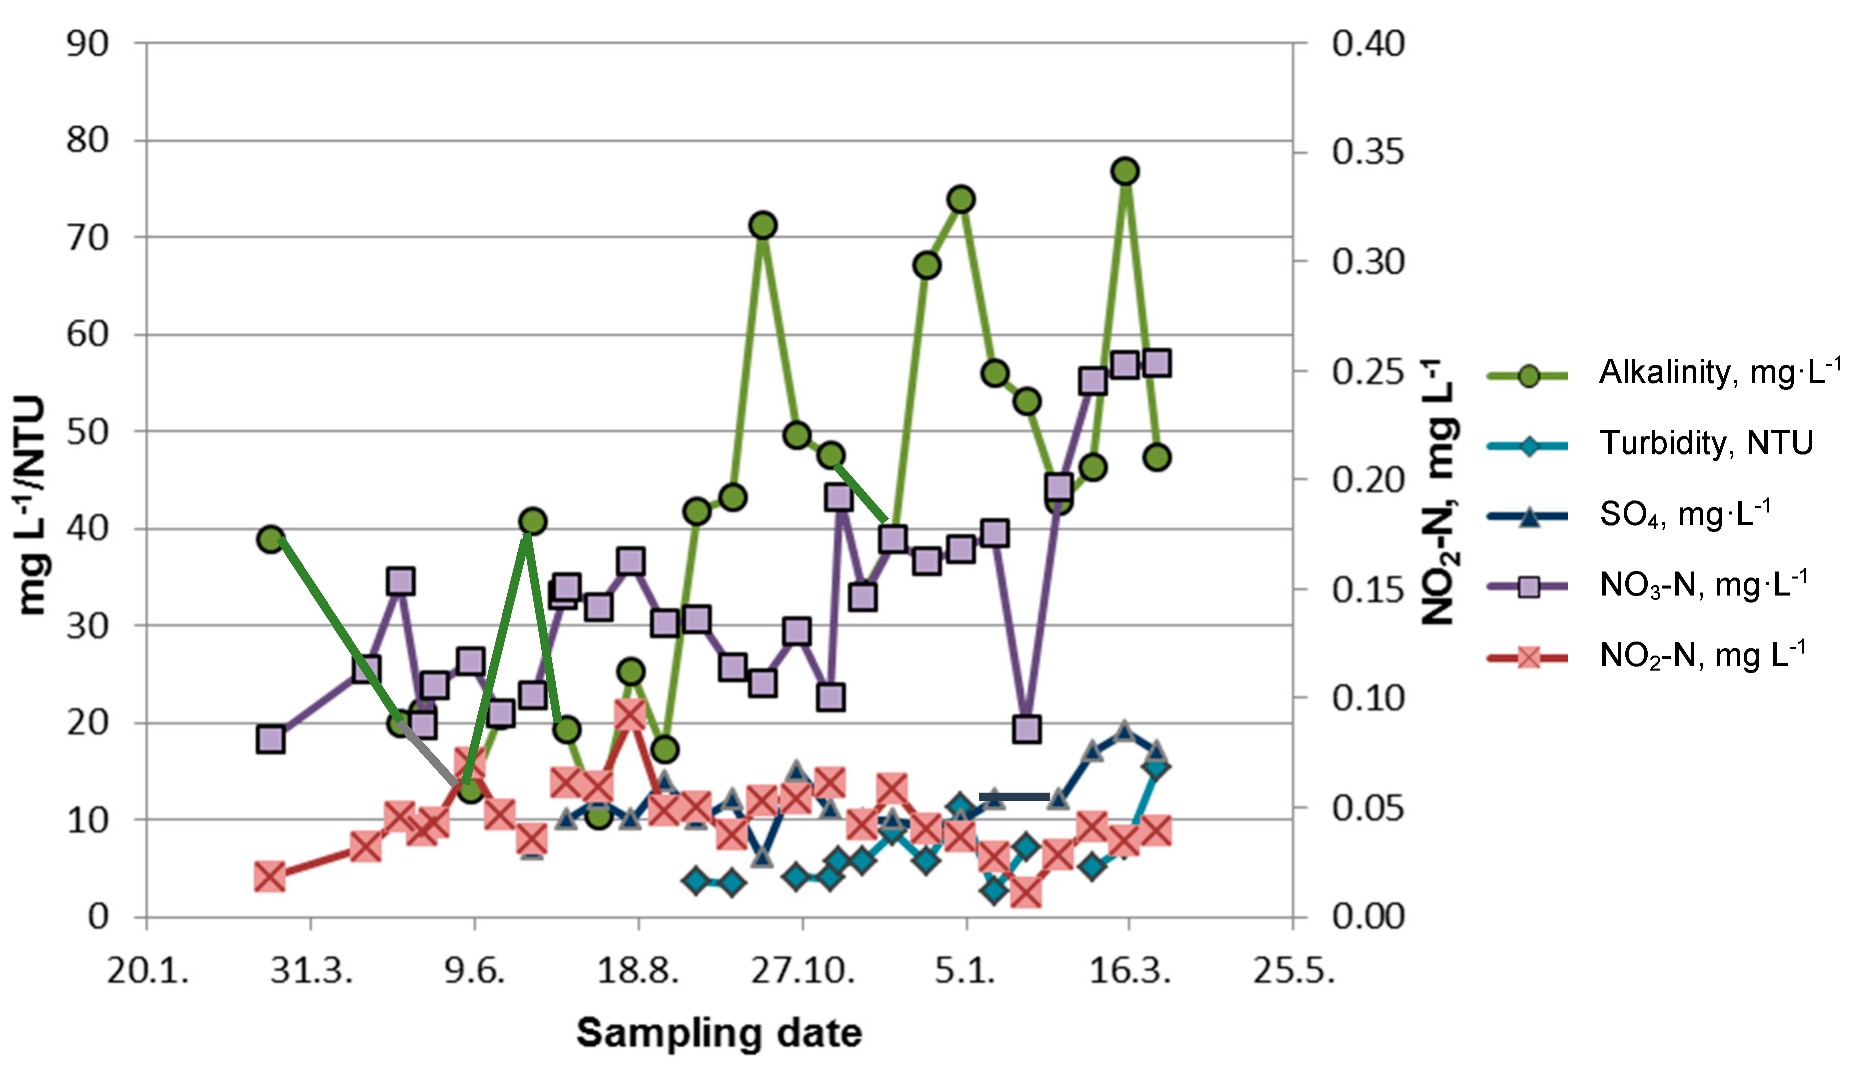
Figure 1. Concentrations of GSM and MIB (ng·g−1, n = 4, ± SD) in European whitefish (A) and in rainbow trout (B) vs. lipid content in fish fillet (%) during the experiment.
Fishes 05 00013 g001
Figure 2. Concentrations of GSM and MIB (ng·g−1, n = 4, ± SD) in European whitefish (A) and in rainbow trout (B) vs. weight (g) during the experiment.
Fishes 05 00013 g002
Figure 3. Concentrations of GSM and MIB (ng·L−1, n = 4, ± SD) in circulating water for European whitefish (A) and rainbow trout (B) during the experiment.
Fishes 05 00013 g003
Figure 4. Increase of MIB (ng·g−1, (A) and GSM concentrations (ng·g−1, (B) vs. duration of experiment in days after every 40 days, based on the statistical model: rainbow trout (blue line) and European whitefish (red dashed line). Point estimates are shown with 95% confidence interval.
Fishes 05 00013 g004
Figure 5. Flowchart of the RAS setup, showing a fish tank (FT), drum filter (DF), moving-bed biofilter (MBBF), sand-filled biofilter (SFBF), and a cascade aeration column (TF), followed by UV treatment.
Fishes 05 00013 g005
Figure 6. Measured parameters of water quality: alkalinity, NO2-N, NO3-N, SO42− (mg·L−1), and turbidity (NTU) in RAS rearing rainbow trout (Oncorhynchus mykiss), and European whitefish (Coregonus lavaretus) over the course of the experiment.
Fishes 05 00013 g006
Table 1. Water quality parameters (± range) in RAS rearing rainbow trout (Oncorhynchus mykiss) and European whitefish (Coregonus lavaretus).
ParameterMeasurementUnit
pH7.0 ± 0.3-
Temperature14.8 ± 0.9°C
Oxygen7.3 ± 0.6mg·L−1
Alkalinity40.6 ± 19.2mg·L−1
TAN0.39 ± 0.1mg·L−1
NO2-N0.04 ± 0.02mg·L−1
NO3-N32.8 ± 10.8mg·L−1
SO42−11.7 ± 3.4mg·L−1
Turbidity7.0 ± 3.2NTU
Table 2. Operational design of RAS units and rearing conditions of rainbow trout (Oncorhynchus mykiss) and European whitefish (Coregonus lavaretus) in the experiment.
CharacteristicsValueUnit
Water renewal750L·kg−1 feed
Fish quantity per tank:
European whitefish
Rainbow trout

3570–274
5500–83
 
pcs
Fish density:
European whitefish
Rainbow trout
 
1.0–56.1
7.5–54.5
kg·tank−1
Average fish size:
European whitefish
Rainbow trout
 
0.28–242
1.36–657
g
Feed quantity:
European whitefish
Rainbow trout
 
0.04–0.33
0.04–0.50
kg·d−1
Feed pellet size:
European whitefish
Rainbow trout
 
0.2–3.5
0.2–5.0
mm

