
SNP Development in Penaeus vannamei via Next-Generation Sequencing and DNA Pool Sequencing

1
Key Laboratory of Healthy Mariculture for the East China Sea, Ministry of Agriculture, Fisheries College, Jimei University, Xiamen 361021, China
2
Fisheries Research Institute of Fujian, Xiamen 361000, China
*
Authors to whom correspondence should be addressed.
Fishes 2021, 6(3), 36; https://0-doi-org.brum.beds.ac.uk/10.3390/fishes6030036
Submission received: 6 August 2021
/
Revised: 26 August 2021
/
Accepted: 2 September 2021
/
Published: 7 September 2021
Abstract
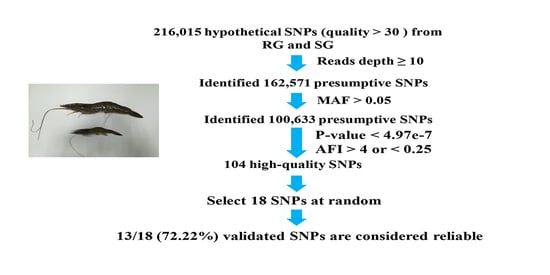
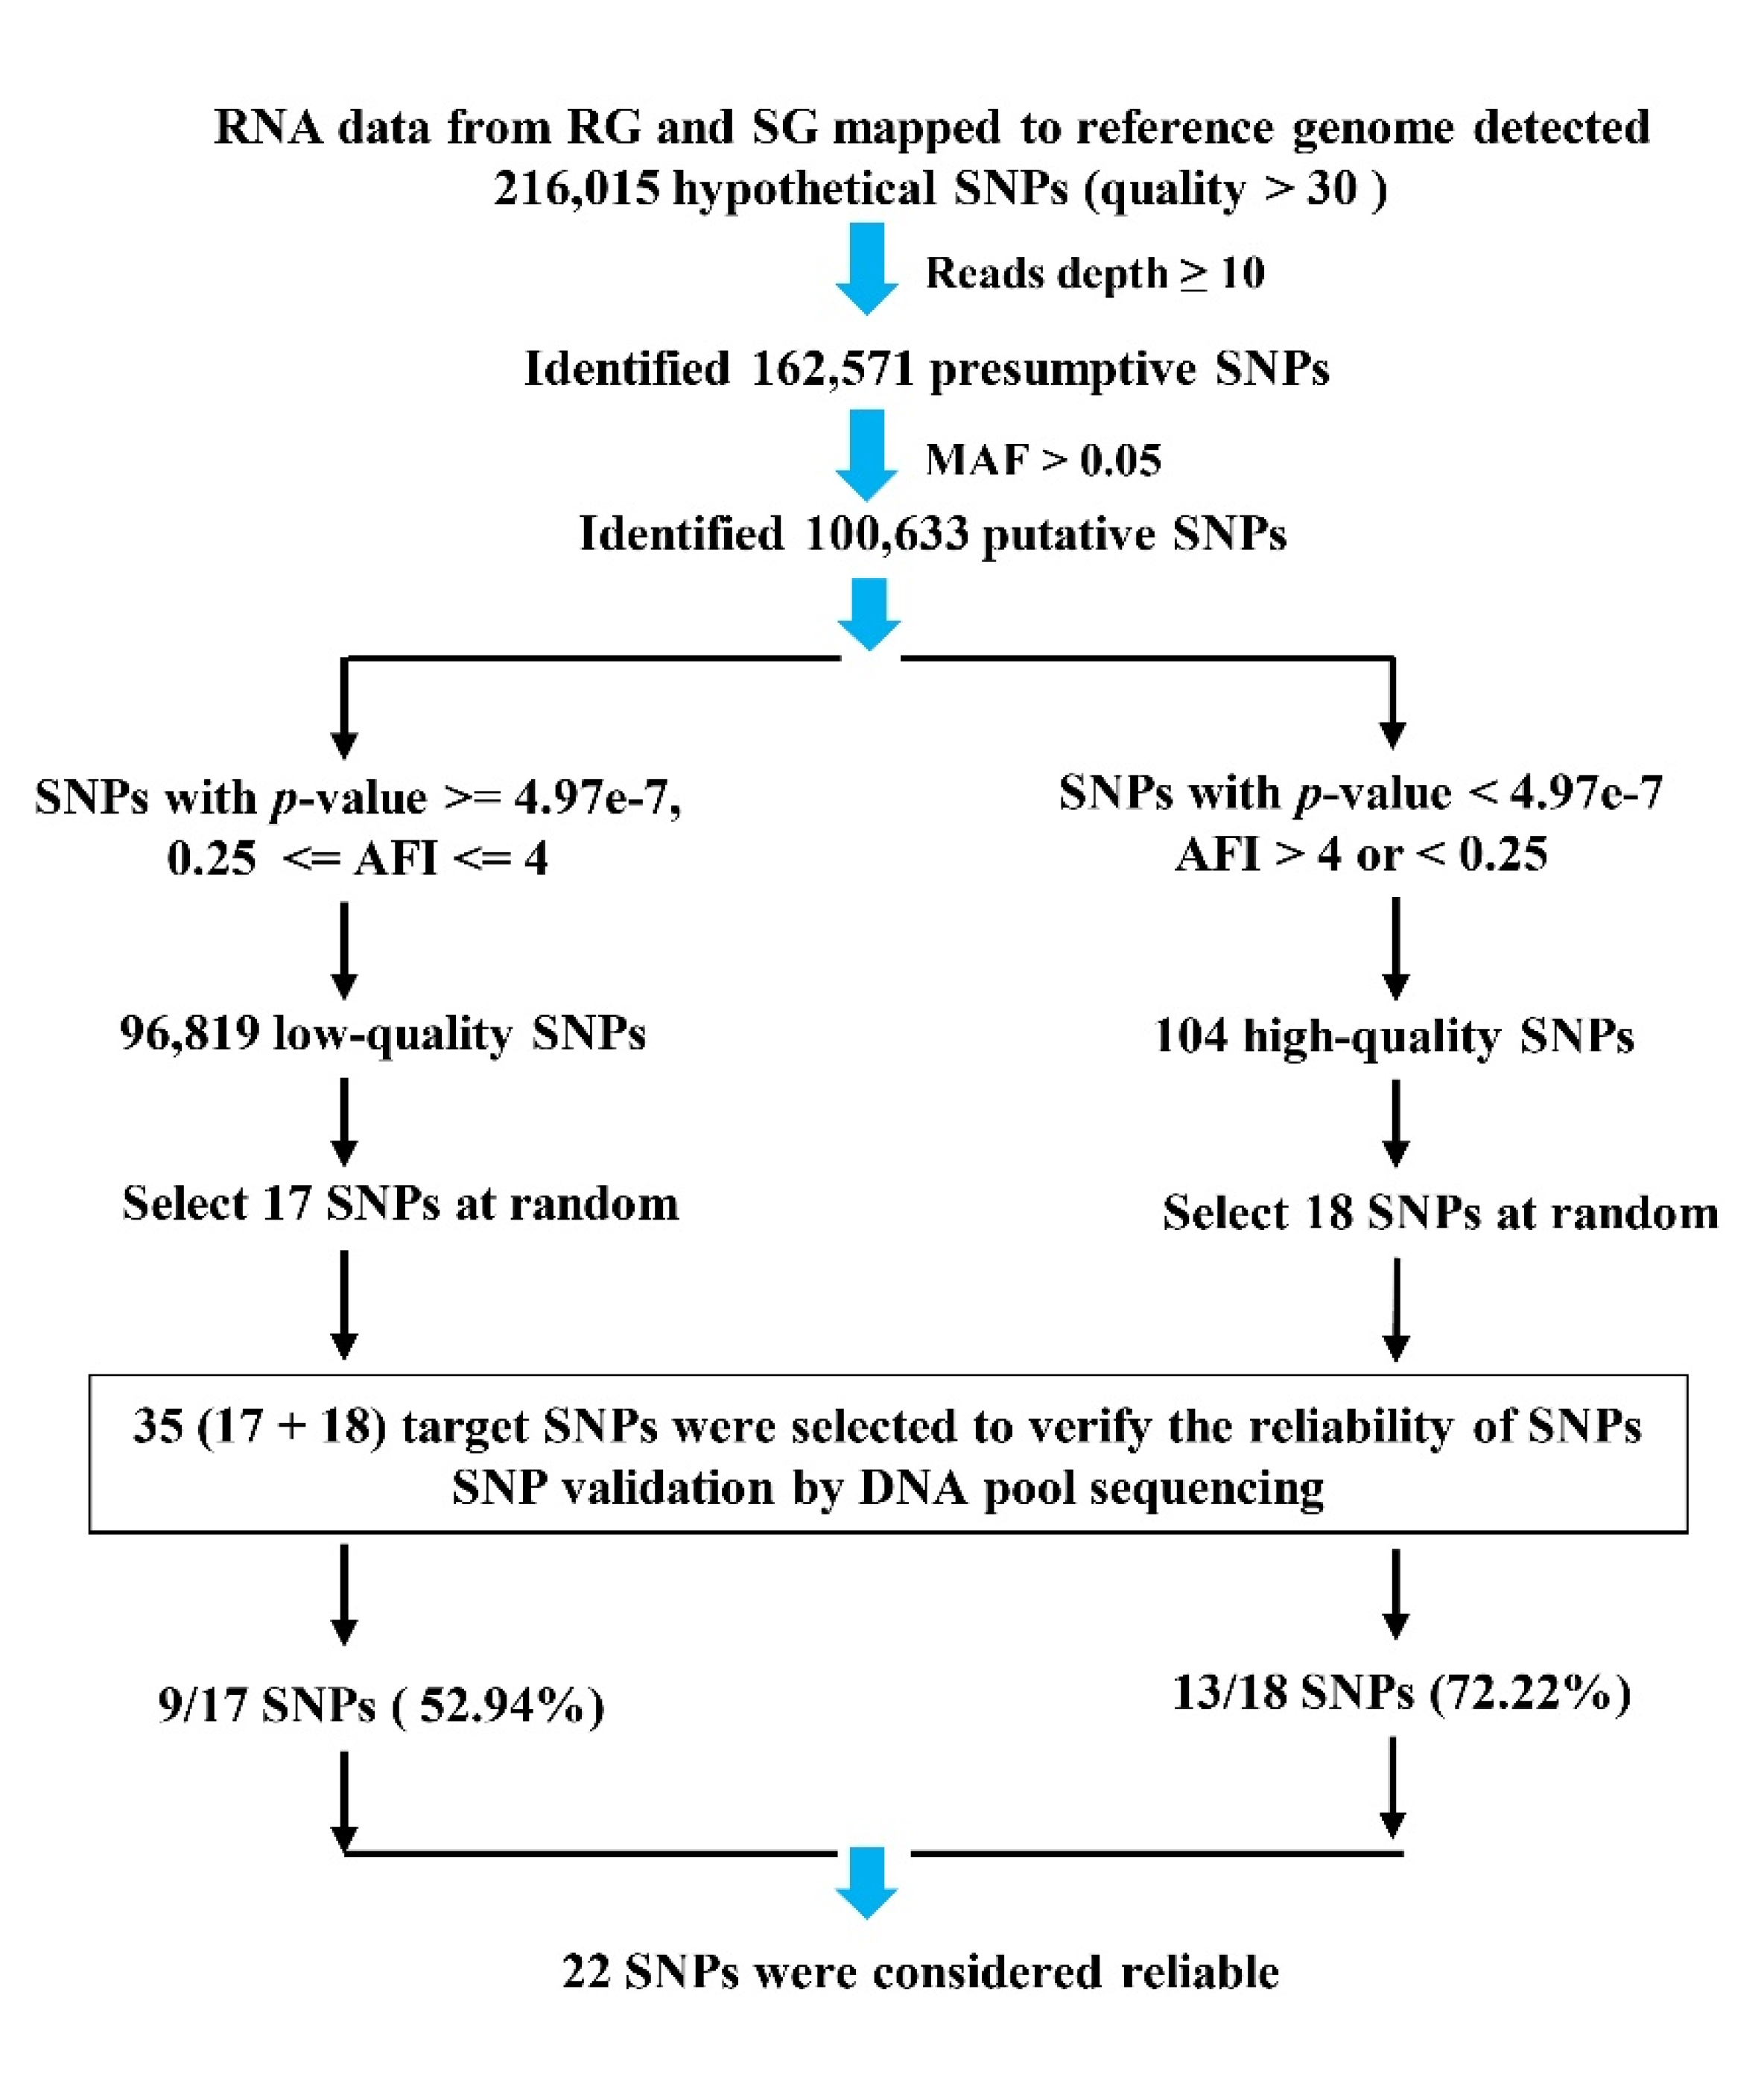
:Next-generation sequencing and pool sequencing have been widely used in SNP (single-nucleotide polymorphism) detection and population genetics research; however, there are few reports on SNPs related to the growth of Penaeus vannamei. The purpose of this study was to call SNPs from rapid-growing (RG) and slow-growing (SG) individuals’ transcriptomes and use DNA pool sequencing to assess the reliability of SNPs. Two parameters were applied to detect SNPs. One parameter was the p-values generated using Fisher’s exact test, which were used to calculate the significance of allele frequency differences between RG and SG. The other one was the AFI (minor allele frequency imbalance), which was defined to highlight the fold changes in MAF (minor allele frequency) values between RG and SG. There were 216,015 hypothetical SNPs, which were obtained based on the transcriptome data. Finally, 104 high-quality SNPs and 96,819 low-quality SNPs were predicted. Then, 18 high-quality SNPs and 17 low-quality SNPs were selected to assess the reliability of the detection process. Here, 72.22% (13/18) accuracy was achieved for high-quality SNPs, while only 52.94% (9/17) accuracy was achieved for low-quality SNPs. These SNPs enrich the data for population genetics studies of P. vannamei and may play a role in the development of SNP markers for future breeding studies.
1. Introduction
Penaeus vannamei is a widely farmed penaeid shrimp. With the development of culture technology, higher-density farming has become a trend. Currently, fast-growing strains are under development. Genetic studies have been conducted to understand the molecular mechanisms of target traits in P. vannamei, such as linkage map construction [1,2,3,4] and quantitative trait locus detection [5,6]. As a major shrimp cultured in China, there are few genetic markers of P. vannamei for growth performance. In 1996, the development of single-nucleotide polymorphisms (SNPs) brought genetic diversity research to a new stage [7]. SNPs widely exist in the genome, and they serve as suitable markers for linkage maps, genome-wide association studies (GWAS), and marker-assisted selection (MAS) of target traits [8,9,10,11,12,13,14,15,16]. SNP markers are becoming increasingly important in P. vannamei. There have been several studies to discover SNPs associated with the phenotypes of interest [17,18,19,20]; however, the available information for genetic diversity studies is still insufficient.
With the development of next-generation sequencing (NGS), the cost of sequencing has declined significantly, making the identification of SNPs feasible in non-model species [21,22]. As RNA-seq focuses on the functional information in a genome, it has been widely used to identify SNP markers [23,24]. Transcriptome sequencing has been used for SNP detection in plants and animals, such as Ginkgo biloba [25], Arachis hypogaea L [26], Oncorhynchus mykiss [27], Ictalurus punctatus [28], and P. vannamei [17,29,30,31,32]. A GWAS study found that several SNPs in the deoxycytidylate deaminase gene and non-receptor protein tyrosine kinase gene were associated with body weight in P. vannamei [16]; however, so far little transcriptome information is available regarding the growth of P. vannamei and fewer reports have been conducted regarding growth-related SNPs [16,20,31].
Although sequencing technology is developing rapidly, high-quality genome sequences are still mostly limited to model organisms; therefore, RNA-seq technology is an effective strategy [24,33]. The use of expressed sequence (RNA-seq) data has been recognized as an efficient method to develop new SNP markers [23,25,34]. Although RNA-seq cannot provide whole-genome observations, many SNPs can be found based on the transcriptome. RNA-seq data can enrich SNPs in functional regions and can call SNPs in exon regions [35]; therefore, these SNPs may have a more direct impact on gene function. Moreover, using RNA-seq technology can reflect gene expression and can be used to discover rare alleles in highly expressed genes [36]. Finally, this approach can be applied to a wide variety of species at a reasonable cost when genomes are not available.
From RNA extracts to SNP validation, standard protocols exist for developing SNPs based on transcriptome sequencing [23,37]. Transcriptome sequencing has been adopted to identify SNPs in many aquatic species, such as Crassostrea gigas [38], Cyprinus carpio [39], and Artemia franciscana [40]. Moreover, genetic differences can be shown by comparing SNPs in different population transcriptomes [31,41], which is consistent with the purpose of this study—to find SNPs associated with growth traits in P. vannamei.
Several factors may cause false SNPs in an SNP calling process, such as alignment errors, unequal levels of allele-specific gene expression [42], paralogous genes [36,37], inexact repeats, and RNA editing [36]; hence, some data will be lost and erroneous sites will be obtained when using the transcriptome to develop SNP markers. The number of SNPs called by the transcriptome is daunting. It is a considerable challenge to remove noise and identify SNPs associated with target traits. To deal with an enormous number of SNPs and reflect genetic information as much as possible, a precise screening procedure is needed to maximize accuracy and prevent false-positive SNP detection. Some criteria should be applied to screen SNPs, and only those SNPs with these criteria will be selected for downstream analysis.
Next-generation resequencing of DNA pools is an efficient method that is used for the identification of SNPs [43]. DNA pool sequencing can detect rare variants and estimate allele frequencies at a moderate cost [44,45,46]. Furthermore, pool sequencing requires less DNA from each individual and reduces the time of sequencing [47]. On the other hand, a more accurate step must be established to avoid sequencing errors. The rare SNPs (allele frequency, AF < 0.01) require a more efficient model [46,47], such as the SKAT test [48], Bayesian model [49,50], or KBAC test [51].
In this work, SNPs were detected using transcriptome data [52]. In order to identify high-quality SNPs that might be related to growth performance, while resequencing of DNA pools was used to assess the reliability of these SNPs. We hope that these SNPs from this experiment will provide a basis for the development of SNP markers and selective breeding in the future.
2. Materials and Methods
2.1. Biological Sampling
Sixteen shrimp strains with different genetic backgrounds (produced by four different strains interbred with each other, Table 1) were used in the present study. A total of three ponds and forty-eight cages (1 m × 1 m) were assigned to culture each crossbred in triplicate. Sixteen strains were stocked in 16 net cages in each pool with a random arrangement, while each cage contained only 1000 larvae from a single strain.
These ponds were connected by pipes in one breeding building. Seawater was circulated via pumps into the three pools, with four aeration zones in each pond. There were five aeration points in each cage; one was in the center and the others were in the four corners. The number of individuals was adjusted every month to maintain a consistent density by taking individuals out of the cages. After 120 days of breeding, the five heaviest individuals were collected from each cage in the first pond, with eighty shrimps in total.
The molting process is directly related to the muscle growth of crustaceans, while the eyestalk secretes hormones that regulate molting. Ocular stalk ablation is the most successful method for affecting ecdysis and growth [53,54]. The hepatopancreas and intestines contain digestive enzymes. Many studies have shown that a high growth rate and final weight are positively correlated with digestive ability [55,56,57]; thus, the eyestalks, hepatopancreas, and intestinal tract tissues were collected to extract total RNA. The total RNA from three tissue samples was mixed equally as sample RG1. In the same manner, we sampled the five lightest individuals in each cage in the first pond, and the mixture of the total RNA from their three tissue samples was regarded as sample SG1. Similarly, in the second and third ponds, samples RG2, SG2, RG3, and SG3 were obtained. We used paper towels to soak up the water on the surface of the shrimp, then an electronic balance was used to measure each group’s weight, with an accuracy of 0.01 g. The average weights of RG1–RG3 were 18.44 g ± 0.83, 19.75 g ± 1.04, and 19.8 g ± 0.17, respectively. The average weights of SG1–SG3 were 5.23 g ± 0.09, 5.46 g ± 0.31, and 5.08 g ± 0.03, respectively.
2.2. Library Construction and Sequencing
After the total RNA was extracted using the Eastep™ Super Total RNA extraction kit (Promega, Shanghai, China), the mRNA was enriched using oligo (dT) beads (NEBNext Ultra RNA Library Prep Kit for Illumina (NEB#7530, New England Biolabs, Ipswich, MA, USA)), while mRNA was enriched by removing rRN-A using the Ribo-ZeroTM Magnetic Kit (Epicentre Biotechnology Co., Ltd., Madison, WI, USA). The enriched mRNA was then reverse-transcribed into cDNA with random primers (NEB#7530, New England Biolabs, Ipswich, MA, USA). Then, second-strand cDNA was synthesized using DNA polymerase I, RNase H, dNTP, and buffer (NEB#7530, New England Biolabs, Ipswich, MA, USA). Next, after purification with the QiaQuick PCR extraction kit, repair, and addition of poly (A), the cDNA fragments were ligated to Illumina sequencing adapters. The sizes (300–400 bp) of ligation products were selected via agarose gel electrophoresis. Finally, six libraries were constructed and sequenced using the HiSeqTM 2500 platform. To obtain high-quality, clean reads, the adapters, poly-N, and low-quality reads were filtered further using fastp software [58]. Bowtie2 [59] was used to remove rRNA via mapping to an rRNA database (all rRNA sequences of P. vannamei in GenBank). Then, the unmapped reads (the reads with ribosomal RNA removed from clean HQ reads) were aligned to the reference genome (ncbi_GCA_003789085.1) by TopHat2 [60]. All raw data were stored in NCBI (BioProject PRJNA664224, accession numbers: SRR12664621–SRR12664626).
2.3. SNP Identification
The unmapped reads were aligned to the reference genome and the HaplotypeCaller from GATK software [61] was used to call SNPs via default parameters, then ANNOVAR [62] was applied to annotate SNPs. The two-tailed Fisher’s exact test [63] was applied to determine the significance of the allele frequency difference for each SNP between RG and SG. After Bonferroni correction [64], we analyzed the significance of the difference in allele frequency between RG and SG with a threshold p-value < 4.97e−7 (calculated from 0.05 divided by 100,633). Moreover, the AFI (minor allele frequency imbalances, the ratio between the minor allele frequencies of the RG and the SG) were defined and computed [27], then used to detect high-quality SNPs if the value was > 4 or < 0.25.
2.4. SNP Data Statistics and Functional Annotation
Differentially expressed genes (DEGs) were identified with |Log2FoldChange| ≥ 1 and FDR (false discovery rate) < 0.05 using the edgeR package [65]. We analyzed the types, locations, and classifications of mutations. The functions of all genes that contained candidate SNPs (p-value < 0.05, AFI > 4 or < 0.25) were analyzed via GO (Gene Ontology) [66] and KEGG (Kyoto Encyclopedia of Genes and Genomes) [67] databases and visualized using the ggpubr [68] and ggplot2 [69] R packages. The VennDiagram package [70] in R was adopted to illustrate the Venn plot.
2.5. SNP Validation
A total of 35 target SNPs were selected from 100,633 putative SNPs for further validation (Figure 1). Eighteen SNPs were selected from the 104 high-quality SNPs (p-value < 4.97e−7, AFI > 4 or < 0.25), while the other 17 SNPs were randomly chosen from 96,819 low-quality SNPs (p-value >= 4.97e−7, and 0.25 <= AFI <= 4). Then, the sequences of ± 200 bp of SNP loci were extracted, and Primer3 online software (https://bioinfo.ut.ee/primer3-0.4.0/, accessed on 20 November 2012) was used to design primers (Table S1, Primers) and amplify the flanking sequence of SNPs. The product sizes were mostly in the range of 100–150 bp. All primers were synthesized by TsingKe Biotechnology Co., Ltd. (Beijing, China). In total, 240 rapid-growing individuals (RG) and 240 slow-growing individuals (SG) were selected for DNA extraction and to form two DNA pools, one of which served as an RG template, while the other served as an SG template. The purified PCR products were recycled from agarose gel electrophoresis using the HiPure Gel Pure DNA Mini Kit (Magen, Guangzhou, China), then these products were then mixed equally to ensure that each product contributed an equal amount of DNA to the pool [46,71,72]. The two samples (RG and SG) were sent to Gene Denovo Biotechnology Co., Ltd. (Guangzhou, China), for DNA pool sequencing.
3. Results
3.1. RNA-Seq Data
SG (slow-growing individuals) and RG (rapid-growing individuals) groups were divided into three replicates per group. High-quality, clean reads were obtained by filtering clean data. Here, 52,476,282; 54,200,380; 59,824,174; 55,354,830; 54,220,100; and 43,292,594 high-quality reads were obtained. These high-quality, clean reads were mapped to the rRNA database (all rRNA sequences of P. vannamei in GenBank), then the unmapped reads were used for subsequent analysis. There were 46,852,556; 50,450,550; 55,177,690; 51,620,794; 48,853,888; and 40,165,176 unmapped reads, respectively (Table 2).
3.2. SNP Statistics
In total, 216,015 hypothetical SNPs were annotated (Table S2, SNPs); most mutations were transitions, accounting for 64.73%, while transversion accounted for 35.27%. Among the transition types, the GA and CT were almost equal in number. In terms of transversions, the proportions of AC and GT were equivalent, while the quantity of AT was nearly twice that of GC (Table 3).
The localization of SNPs is shown in Table 4. The numbers of SNPs located in exons and intergenic regions were almost equal (about 38% locations), followed by downstream (12.53%) and intronic (8.63%) regions, respectively. The other locations were not over 3%.
3.3. SNP Detection
A total of 216,015 hypothetical SNPs were obtained from transcriptome data. Then, the 162,571 presumptive SNPs were obtained after filtering read depths ≥ 10. Afterward, we obtained 100,633 putative SNPs from 162,571 presumptive SNPs after filtering with MAF (minor allele frequency, ALT_counts divided by REF_counts) > 0.05. P-values and AFI values (minor allele frequency imbalance, MAF of RG divided by MAF of SG) were calculated and used to screen out SNPs, then 104 high-quality SNPs (p-value < 4.97e−7, AFI > 4 or < 0.25) were obtained from 100,633 putative SNPs. Strict thresholds contribute to discovering true SNPs and also filter out some false-negative results. We were more willing to accept false negatives than false positives. Meanwhile, with p-value > 4.97e−7 and 0.25 ≤ AFI ≤ 4, 96,819 low-quality SNPs were also obtained from 100,633 putative SNPs. Finally, among 104 high-quality SNPs, 18 SNPs were selected for further validation analysis. For comparison, we also randomly chose 17 SNPs from 96,819 low-quality SNPs (Figure 1).
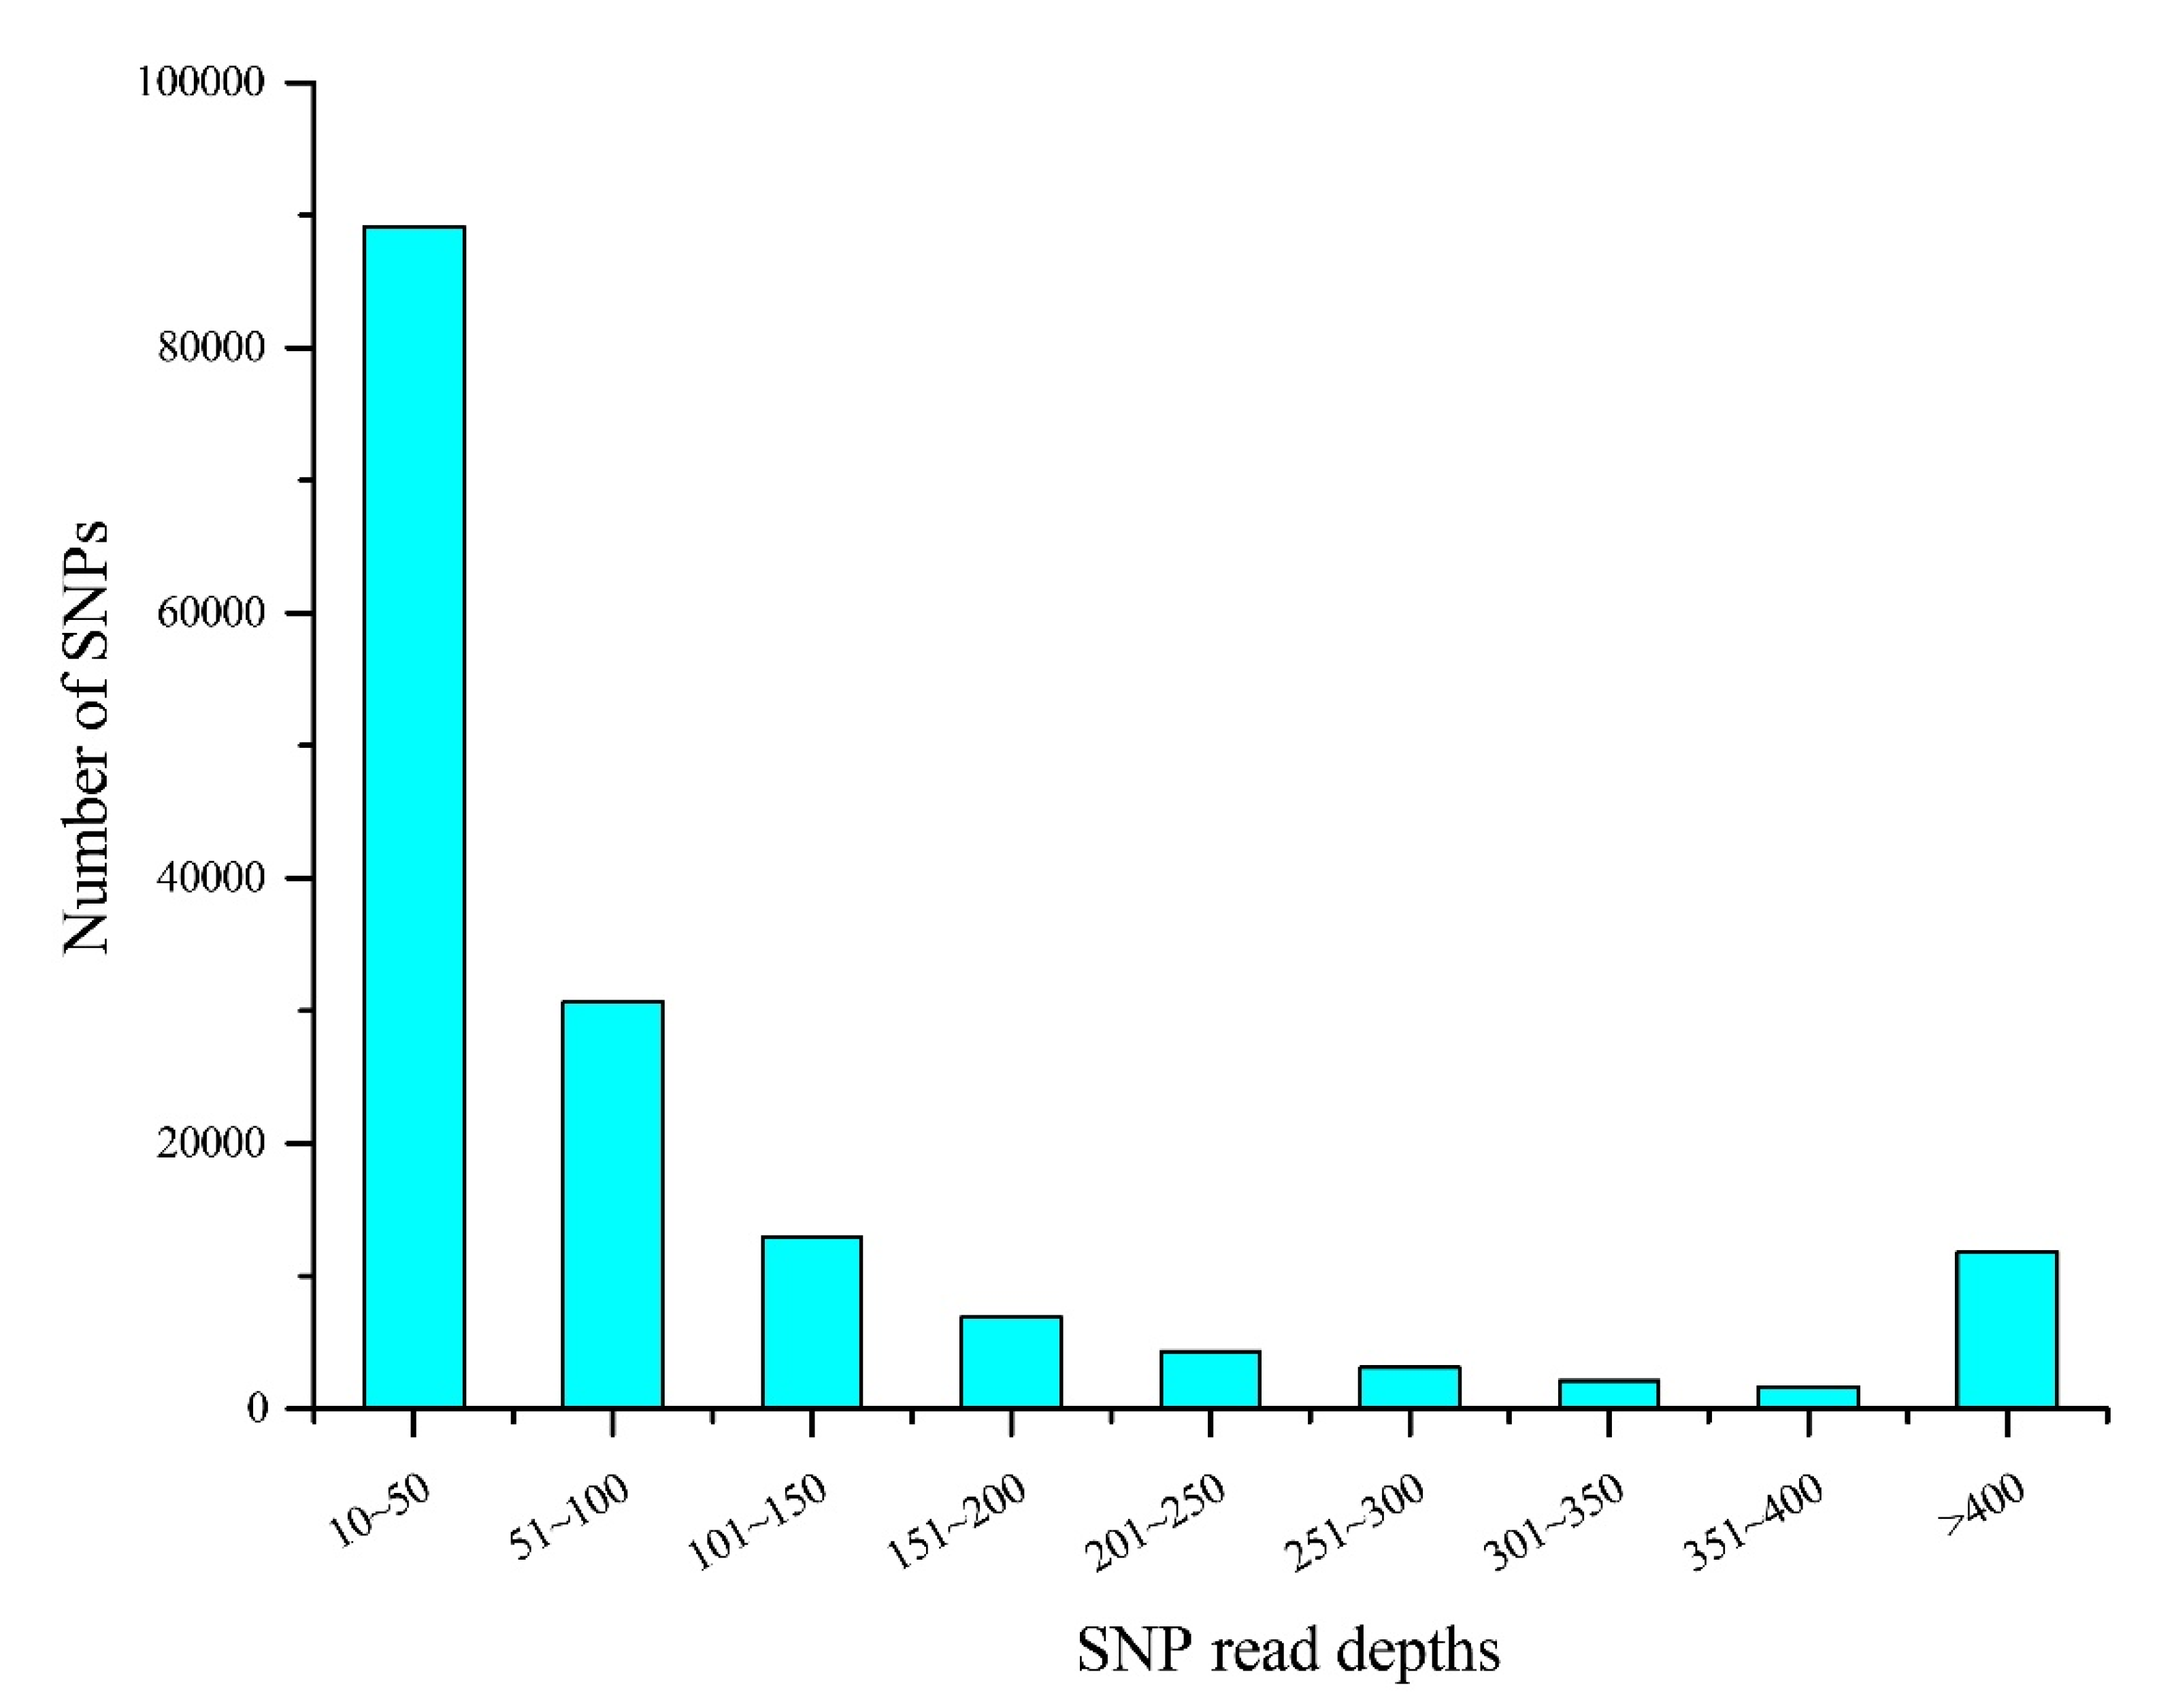
3.4. Read Depth and AFI Distribution
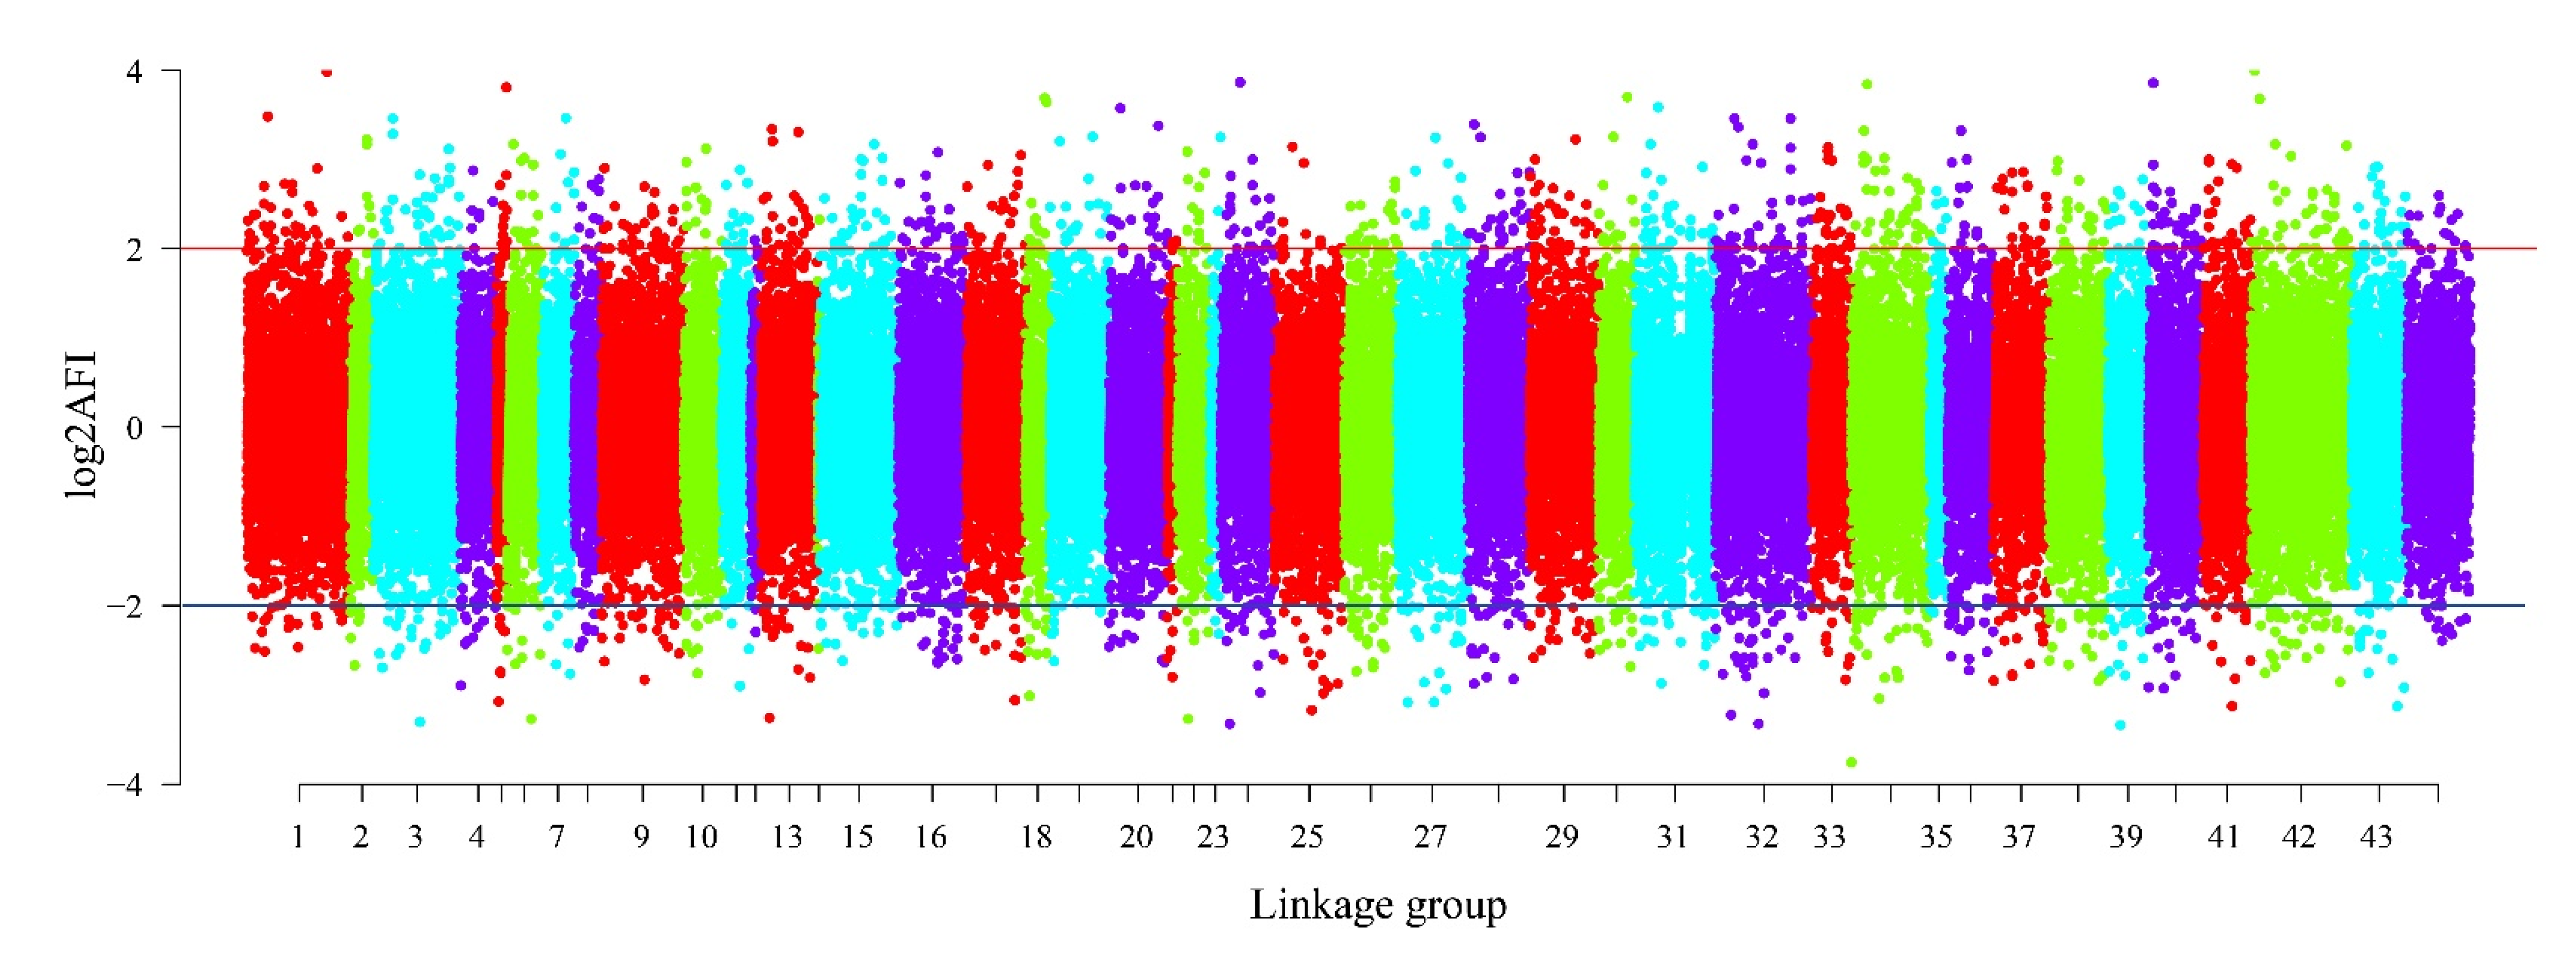
The read depth is a key factor affecting the accuracy of SNP detection. The 162,571 presumptive SNPs obtained after filtering read depths ≥ 10 were calculated and drawn (Figure 2). The figure shows that most SNP (41.25%) read depths ranged from 10 to 50, while 14.19% of the SNP read depths were between 51 and 100. There were 100,633 putative SNPs in total with > 0.05 MAF. The distribution of AFI values in the linkage groups is illustrated in Figure 3. The most SNPs (82,770, 82.25%) had AFI values between 0.5 and 2. SNPs with AFI values over 4.0 or below 0.25 only accounted for 1.74%.
3.5. SNP Annotation and Functional Analysis
Of 216,015 hypothetical SNPs, a total of 82,663 SNPs were annotated (Table 5). Among these 82,663 annotated SNPs, most were synonymous SNPs (63,286), followed by 17,790 nonsynonymous SNPs and 1587 unknown SNPs. Here, 133,352 SNPs (61.73%) were not annotated.
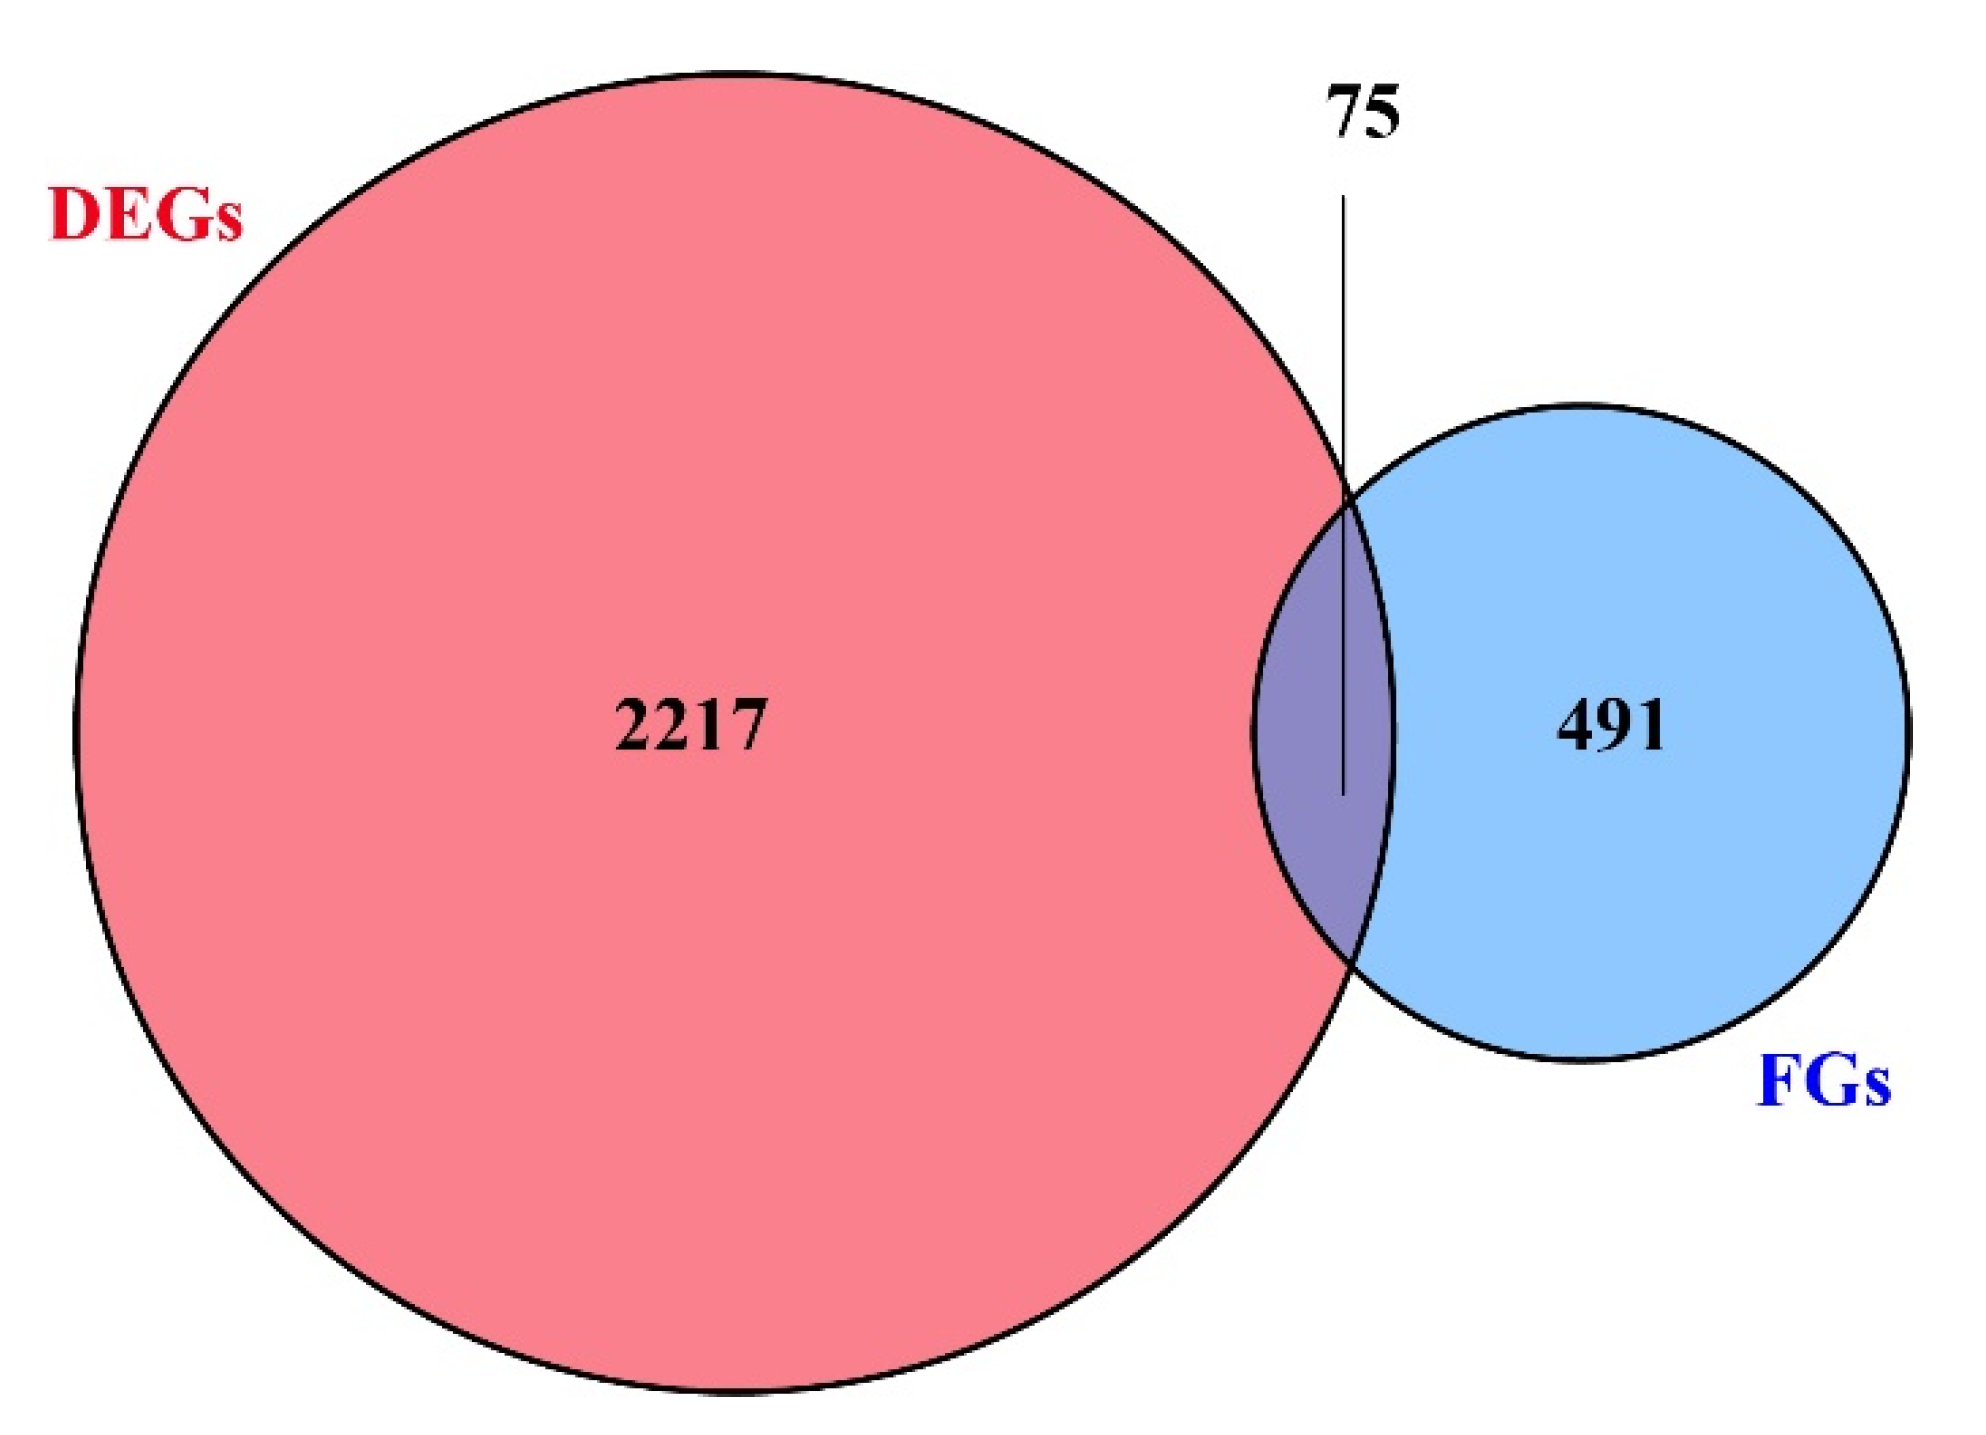
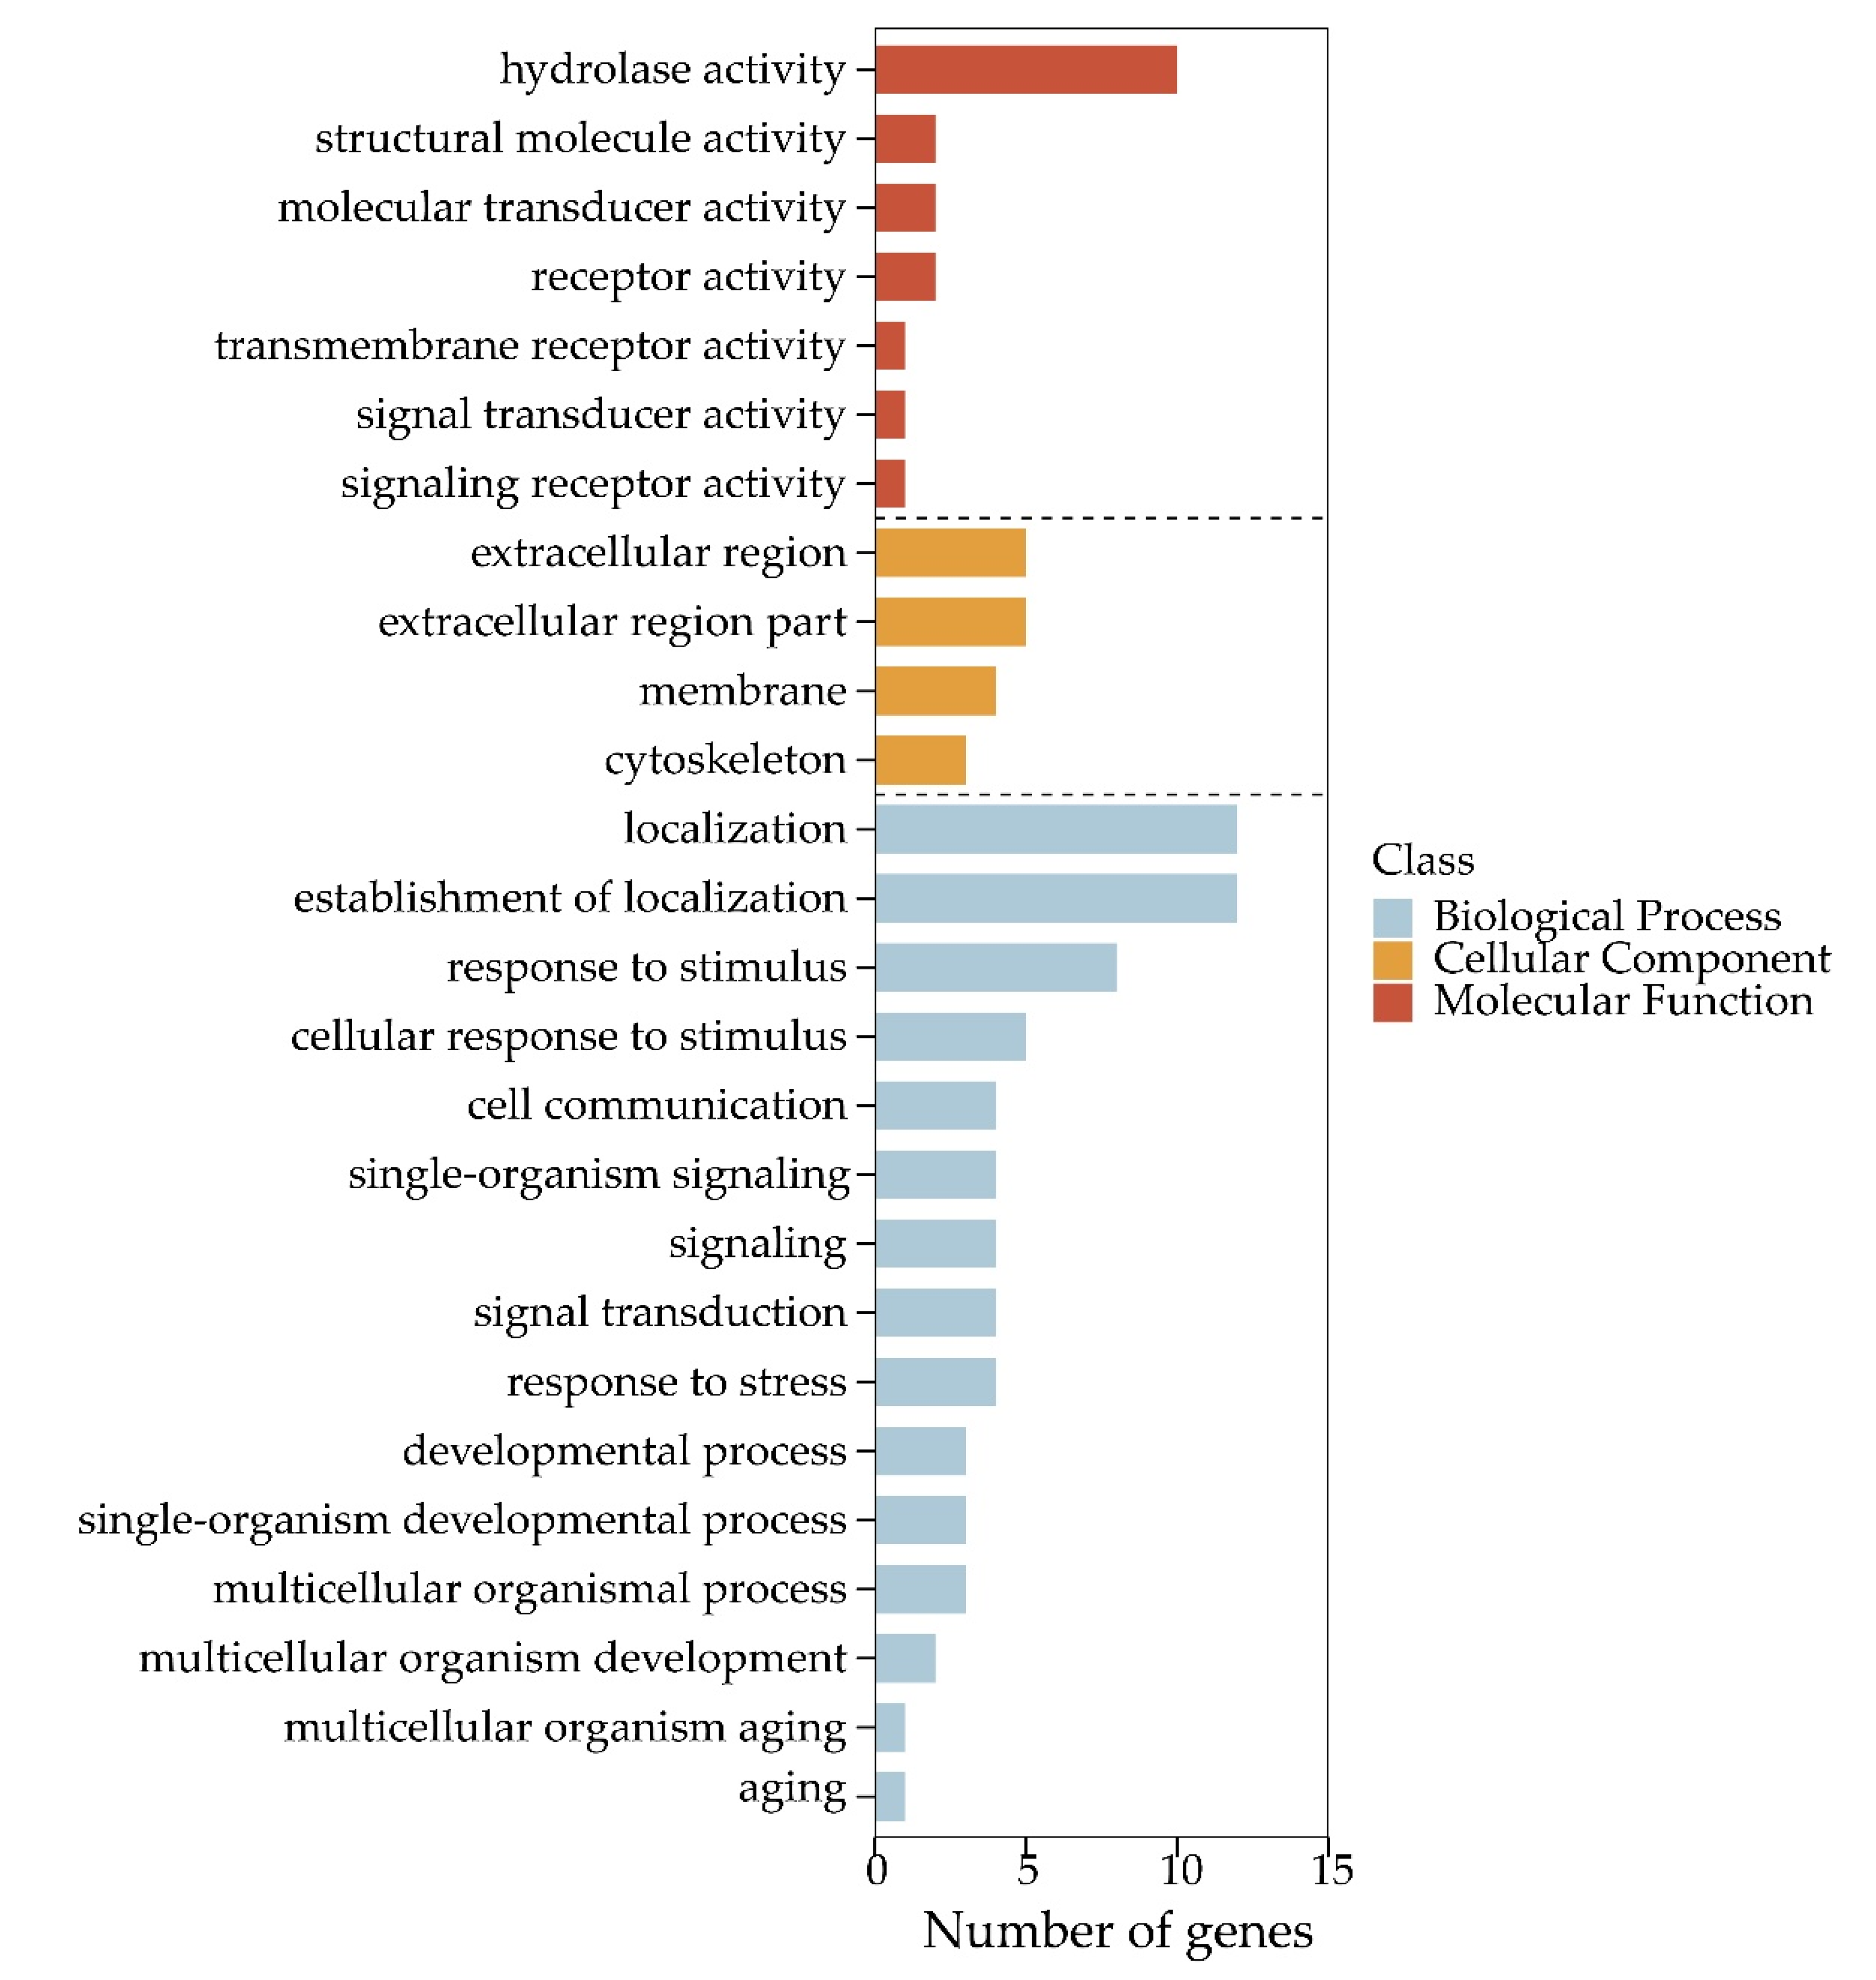
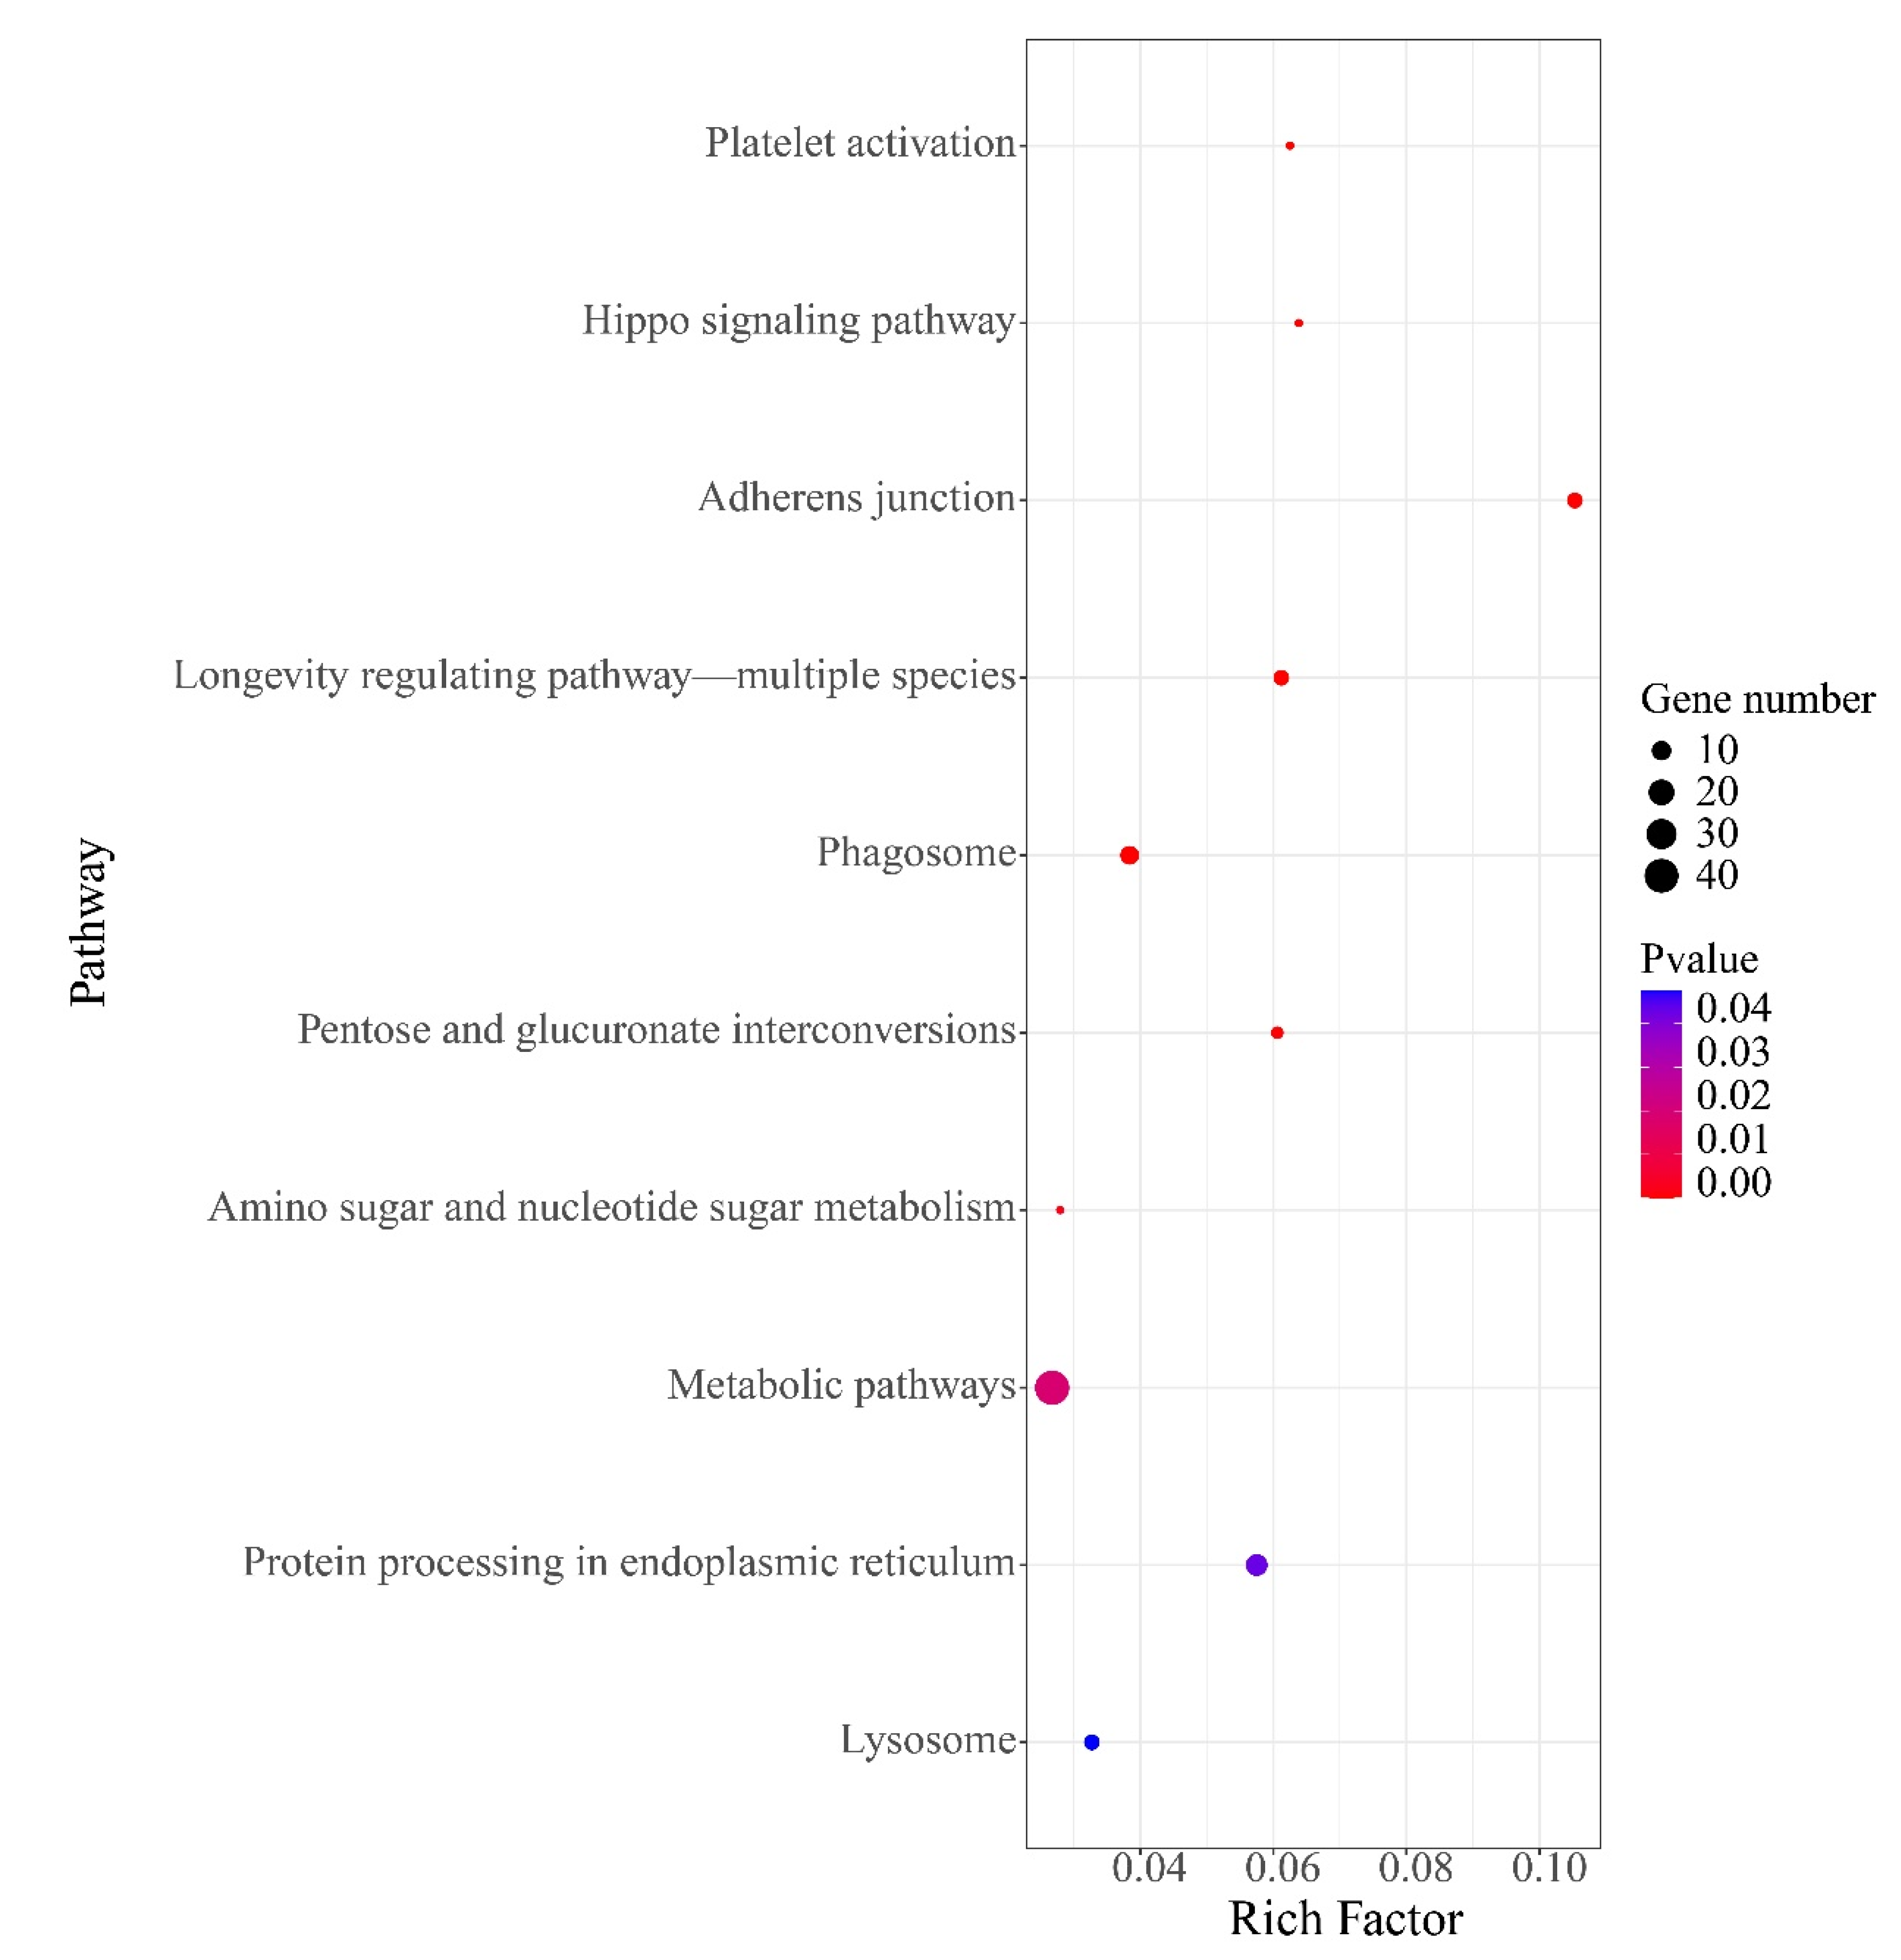
Among 100,633 putative SNPs, 1511 candidate SNPs (p-value < 0.05, AFI > 4 or < 0.25) were obtained in total. All 566 functional genes (FGs) that contained these candidate SNPs were extracted. In Figure 4, the 2292 DEGs (differentially expressed genes) are shown, which were identified in previous a previous study [52]. The Venn diagram shows that these 566 functional genes include 75 DEGs. All 566 FGs were further analyzed by GO and KEGG enrichment with p-values < 0.05. These FGs were mapped to fifteen biological processes (including 70 FGs), four cellular components (including 17 FGs), and seven molecular functions (containing 19 FGs). As shown in Figure 5, the term “hydrolase activity” was a representative group regarding molecular function. Among the cellular components, FGs were predominantly enriched in the “extracellular region”. In terms of the biological processes, most FGs were concentrated in the “localization” and “establishment of localization” categories. All pathways of FG enrichment are shown in Table S2, Pathway. Only the top 10 KEGG pathways are shown in Figure 6. FGs were mainly concentrated in the “metabolism” pathway, followed by “protein processing in the endoplasmic reticulum”, “phagosome”, and “lysosome” pathways (Figure 6).
3.6. SNP Validation via Pool Sequencing
A total of 35 target SNPs were selected from 100,633 putative SNPs to assess the reliability of the workflow (Figure 1). Table 6 shows the SNP position information for 35 amplifiable target sequences. The former 17 SNPs were from 96,819 low-quality SNPs, while the latter 18 SNPs came from 104 high-quality SNPs. The “pool-seq” column represents the mutant base detected by DNA pool sequencing at the target SNP location. Completed pool-seq results are shown in Table S1, Pools-seq results. As shown in Table 6, only 9 of 17 SNPs could be detected via pool sequencing. The detection rate for low-quality SNPs was 52.94%. After filtering (p-value < 4.97e−7, AFI > 4 or < 0.25), 13 of 18 high-quality SNPs could be verified and the detection rate was 72.22%. The detection rate for high-quality SNPs was 36 percent higher than that of low-quality SNPs. Regarding read depth, even at values as high as 5404, G233420A was still not detected in pool sequencing. Meanwhile, T221463A, with a read depth equal to 40.5, was detected. For a similar p-value, A137866G (0.0371) had a read depth of 1134, while T50172C (0.0391) failed and had a read depth of 32. Regarding p-values, even at values as low as 1.24e−58, C247322T was not detected. On the contrary, A137866G, with a high p-value (0.0371), was detected. AFI values of SNPs showed no correlation with detection. For example, T133937C, with an AFI equal to 1.04, was detected, although C785995T, with a high AFI, was not detected.
4. Discussion
4.1. The Feasibility of the Workflow Used for Screening SNPs
Although only 35 SNPs were resequenced, the accuracy was more than 50%, meaning these SNPs might be related to growth. When stricter threshold values were set, the odds would be well over 70% for high-quality SNPs. In this experiment, the read depth, MAF, p-value, and AFI were used as screening indicators, which had effects on SNP detection.
The read depth is an important factor for identifying SNPs [73]. In general, the read depth is set to 10 to detect SNPs. A higher read depth was not implemented since this read depth above 10 accounts for 75% of SNPs, which was sufficient to find credible variants. It also ensured that most SNPs in the population could be detected. In our pool-seq results, the read depth may not be a primary factor. Even if the read depth is at a high level, this may still allow false SNPs.
When a significance test applied only one SNP, the threshold p-value was set to 0.05. The Bonferroni correction was performed to adjust the threshold so as to improve SNP reliability. In this work, SNPs with a p-value < 4.97e−7 were considered as reaching a critical significance level. It was apparent that this threshold was too strict and would lead to many true SNPs being discarded, although we believed this trade-off was acceptable; however, even if the threshold is very strict, false positives cannot be avoided. As such, additional screening indicators were needed to increase the credibility.
The MAF is used to calculate the frequency of alleles in a population [74], and setting its threshold is usually the first step in analyzing population data [75]. Previous research showed that SNPs with low MAF values were more likely to lead to spurious results [76]. Especially in GWAS analysis, any SNPs with MAF < 10% would be removed [77,78]; however, this strategy would cause mass data loss and leave few data points for further analysis. Some scholars recommend not to remove low MAF values (<1% or <5%) [79]. In general, researchers distrust results arising from low-MAF SNPs. To prevent false SNPs arising from sequencing errors, a cut-off of 5% MAF was set in this work, with about 62% (100,633/162,517) of SNPs meeting this threshold. A large amount of data was left, which was a huge challenge in terms of subsequent individual genotyping.
Our main goal was not only screening for positive SNPs but looking for SNPs that drastically differed between rapid and slow growth groups; therefore, we needed a metric to show that difference. AFI was defined and performed to highlight the differences in MAF values between the two populations. Our pool-seq function detected SNPs with AFI values between 0.1 and 8. We acknowledge that our cut-off value may have been strict, although it did have advantages. Our results might suggest that AFI could be used as an optional parameter for detecting differences among groups. As reported previously, AFI values were used to discover SNPs of O. mykiss [27].
4.2. SNP Validation via DNA Pool Sequencing
DNA-pool-targeted resequencing experiments were applied to verify SNPs. In1991, Michelmore et al. [80] developed and demonstrated a method called bulked segregate analysis (BSA) for rapidly identifying markers linked to any specific gene or genomic region. Using this method, two bulked DNA samples were constructed from a segregating population from a single cross. Pool sequencing has been proven to be an effective strategy for variant detection, and there is an outstanding correlation between pool-seq and genotyping results based on individuals [42,47,81,82].
Although high-quality SNPs showed 36% higher accuracy than low-quality SNPs, there were still undetected sites, for which there were three possible reasons: (i) mismatch, whereby the target fragment was not amplified accurately; (ii) individual contributions, as each individual had a different contribution to the DNA pool; (iii) nonexistent SNPs. PCR products were mapped to the shrimp genome. The size and sequence of PCR products were expected, while the probability of mismatch was very low in our study. Although it is possible that some individuals had more DNA in the DNA pools, the depth of the pool-seq was sufficient and balanced (Table S1, Pools-seq results). It is unlikely that the true site was not detected at all. The ideal situation is when the individual DNA in the pool has an exactly equal molar concentration [46]; however, this is also one of the biggest technical challenges of the pool-seq method because it is unrealistic. For example, technical errors in DNA quantification would lead to unequal pool concentrations. Our sample size was sufficient, so it had little effect on the accuracy [42,46,72]. The third reason was most likely that there was no SNP at the site, which meant that there were still be some false-positive results after screening.
Using a DNA pool as a PCR template can accurately reflect the contribution of each individual. In order to reduce the error, it is necessary to ensure the consistency of individual concentrations as much as possible. By mixing many individuals, sampling errors can be significantly reduced [46]. Pool sequencing requires less DNA from each individual, which increases the efficiency of the laboratory and reduces the time and cost. DNA pool-seq should be cautiously chosen to discover rare variants. Calling SNPs from a pool will result in a high probability of sequencing error unless the depth is sufficient.
4.3. Functional Analysis of SNPs
The results of the functional analysis showed that these FGs might link to metabolic processes, such as “fructose and mannose metabolism”, “amino sugar and nucleotide sugar metabolism”, and “glutathione metabolism”. The results indicated that growth performance may be associated with certain basic metabolic processes. Fructose and mannose metabolism provide upstream substrates for amino sugar and nucleotide sugar metabolism [83]. The latter is involved in environmental stress responses, such as those from salt [84] and nitrite [85]. Glutathione metabolism is an important pathway of antioxidant and stress tolerance. Glutathione S-transferases participate in the detoxification of xenobiotics and defend against oxidative damage [86,87,88,89]; therefore, these SNPs may affect metabolic processes, leading to energy expenditure and consequently further affecting growth traits. Additionally, “protein processing in the endoplasmic reticulum”, “phagosome”, and “lysosome” pathways enriched some of the FGs. High levels of oxidative stress inhibit organism growth [52]. Oxidative stress induces misfolding of endoplasmic reticulum proteins, while the protein processing in the endoplasmic reticulum pathway mainly plays a role in maintaining protein homeostasis [90]. When the endoplasmic reticulum is unable to maintain homeostasis, the body may eliminate misfolded proteins through phagosomes and lysosomes; hence, all of these processes might be a drag on growth. These findings provided useful information for developing potentially useful SNP markers. Moreover, the molecular mechanisms of the effects of these SNPs on growth performance require further analysis. Finally, Figure 4 shows that there were 75 DEGs containing SNPs with different allele frequencies (p-value < 0.05, AFI > 4 or < 0.25), with differences in the expression patterns of these 75 DEGs possibly being related to SNPs.
4.4. SNP Portability
Another study also reported growth-related SNPs in P. vannamei [20]. They highlighted that more SNPs were found in genes, such as actin, ryanodine receptor, astakine, chitinase, and cuticle. Although the background and sampled tissue of P. vannamei were different, a total of 42,848 consistent SNPs (Table S2, Consistent SNPs) were found by reanalyzing their transcriptome data. Furthermore, five validated SNPs (Table 6; T133937C, A1031552T, T585697C, T917813C, A110344G) were identified in these consistent SNPs. The SNPs developed in a particular population might have no polymorphism in another population. This may limit the use of these SNPs for breeding in other populations. The consistent SNPs will make subsequent genotyping experiments more valuable. In summary, this study is an appropriate reference and we hope that these SNPs can be used in other populations.
5. Conclusions
The purpose of this study was to identify SNPs (especially growth-related SNPs) in P. vannamei via transcriptome sequencing. A total of 216,015 hypothetical SNPs were detected from RNA-seq data. Various filtering criteria were applied to screen SNPs in our study. The results showed that the read depth and MAF are important but not critical factors, while p-values and AFI values can predict SNP sites effectively. These two indicators (p-values and AFIs) are the most likely to identify SNPs associated with growth. Twenty-two SNPs were successfully validated in this experiment. These validated SNPs can provide a theoretical basis for the development of markers for future marker-assisted breeding programs. In conclusion, these SNPs identified in this paper may contribute to the breeding of P. vannamei. Our workflow may have potential for SNP development for species in aquaculture and could also enable interesting SNP sites to be found efficiently among thousands of SNPs.
Supplementary Materials
The following are available online at https://0-www-mdpi-com.brum.beds.ac.uk/article/10.3390/fishes6030036/s1: Table S1: Pools-seq results and all primers. Table S2: All SNPs, FG-enriched KEGG pathways and Consistent SNPs.
Author Contributions
Conceptualization, G.W., and Z.Y.; methodology, G.W., and Z.Y.; validation, Y.H.; formal analysis, Y.H.; investigation, Y.H.; resources, S.H.; writing—original draft preparation, Y.H.; writing—review and editing, L.Z., H.G., G.W., and Z.Y.; supervision, S.H.; project administration, L.Z.; funding acquisition, S.H. All authors have read and agreed to the published version of the manuscript.
Funding
This research was supported by the earmarked fund for the National Natural Science Foundation of China (grant number 31702339), the Seed Industry Innovation and Industrialization Engineering Project of Fujian Province (grant number 2017FJSCZY02), Foreign Cooperation Project of Fujian Province (grant number 2018I0013).
Data Availability Statement
All raw data were stored in NCBI (BioProject 664224, accession numbers SRR12664621– SRR12664626).
Acknowledgments
We are grateful to Guangzhou Genedenovo Biotechnology Co., Ltd., for assisting with sequencing.
Conflicts of Interest
The authors declare no conflict of interest.
References
- Alcivar-Warren, A.; Meehan-Meola, D.; Won, S.; Xu, Z.; Zuniga, G. ShrimpMap: A low-density, microsatellite-based linkage map of the pacific whiteleg shrimp, Litopenaeus vannamei: Identification of sex-linked markers in linkage group 4. J. Shellfish Res. 2017, 26, 1259–1277. [Google Scholar] [CrossRef]
- Du, Z.Q.; Ciobanu, D.C.; Onteru, S.K.; Gorbach, D.; Mileham, A.J.; Jaramillo, G.; Rothschild, M.F. A gene-based SNP linkage map for pacific white shrimp, Litopenaeus vannamei. Anim. Genet. 2010, 41, 286–294. [Google Scholar] [CrossRef]
- Pérez, F.; Erazo, C.; Zhinaula, M.; Filip, V. A sex-specific linkage map of the white shrimp Penaeus (Litopenaeus) vannamei based on AFLP markers. Aquaculture 2004, 242, 105–118. [Google Scholar] [CrossRef] [Green Version]
- Zhang, L.; Yang, C.; Zhang, Y.; Li, L.; Zhang, X.; Zhang, Q.; Xiang, J. A genetic linkage map of Pacific white shrimp (Litopenaeus vannamei): Sex-linked microsatellite markers and high recombination rates. Genetica 2007, 131, 37–49. [Google Scholar] [CrossRef]
- Andriantahina, F.; Liu, X.; Huang, H.; Liu, Z. Genetic map construction and quantitative trait locus (QTL) detection of growth-related traits in Litopenaeus vannamei for selective breeding applications. PLoS ONE 2013, 8, e75206. [Google Scholar] [CrossRef]
- Jones, D.B.; Nguyen, H.T.; Khatkar, M.S.; Simma, D.B.; Zenger, K.R. The identification of a major sex QTL in the white-leg shrimp, Litopenaeus vannamei. Aquaculture 2020, 529, 735673. [Google Scholar] [CrossRef]
- Lander, E.S. The new genomics: Global views of biology. Science 1996, 274, 536–539. [Google Scholar] [CrossRef] [PubMed] [Green Version]
- Atwell, S.; Huang, Y.S.; Vilhjálmsson, B.J.; Willems, G.; Horton, M.; Li, Y.; Meng, D.; Platt, A.; Tarone, A.M.; Hu, T.T.; et al. Genome-wide association study of 107 phenotypes in Arabidopsis thaliana inbred lines. Nature 2010, 465, 627–631. [Google Scholar] [CrossRef]
- Hubert, S.; Higgins, B.; Borza, T.; Bowman, S. Development of a SNP resource and a genetic linkage map for Atlantic cod (Gadus morhua). BMC Genom. 2010, 11, 191. [Google Scholar] [CrossRef] [Green Version]
- Moen, T.; Hayes, B.; Nilsen, F.; Delghandi, M.; Fjalestad, K.T.; Fevolden, S.-E.; Berg, P.R.; Lien, S. Identification and characterisation of novel SNP markers in Atlantic cod: Evidence for directional selection. BMC Genet. 2008, 9, 18. [Google Scholar] [CrossRef] [Green Version]
- Prudence, M.; Moal, J.; Boudry, P.; Daniel, J.Y.; Quéré, C.; Jeffroy, F.; Mingant, C.; Ropert, M.; Bédier, E.; Wormhoudt, A.V. An amylase gene polymorphism is associated with growth differences in the Pacific cupped oyster Crassostrea gigas. Anim. Genet. 2006, 37, 348–351. [Google Scholar] [CrossRef] [Green Version]
- Sarropoulou, E.; Nousdili, D.; Magoulas, A.; Kotoulas, G. Linking the genomes of nonmodel teleosts through comparative genomics. Mar. Biotechnol. 2008, 10, 227–233. [Google Scholar] [CrossRef]
- Thanh, N.M.; Barnes, A.C.; Mather, P.B.; Li, Y.; Lyons, R.E. Single nucleotide polymorphisms in the actin and crustacean hyperglycemic hormone genes and their correlation with individual growth performance in giant freshwater prawn Macrobrachium rosenbergii. Aquaculture 2010, 301, 7–15. [Google Scholar] [CrossRef]
- Wang, S.; Sha, Z.; Sonstegard, T.S.; Liu, H.; Xu, P.; Somridhivej, B.; Peatman, E.; Kucuktas, H.; Liu, Z. Quality assessment parameters for EST-derived SNPs from catfish. BMC Genom. 2008, 9, 450. [Google Scholar] [CrossRef] [Green Version]
- Jones, D.B.; Jerry, D.R.; Khatkar, M.S.; Raadsma, H.W.; Steen, H.V.; Prochaska, J.; Forêt, S.; Zenger, K.R. A comparative integrated gene-based linkage and locus ordering by linkage disequilibrium map for the Pacific white shrimp, Litopenaeus vannamei. Sci. Rep. 2017, 7, 10360. [Google Scholar] [CrossRef] [Green Version]
- Lyu, D.; Yu, Y.; Wang, Q.; Luo, Z.; Zhang, Q.; Zhang, X.; Xiang, J.; Li, F. Identification of growth-associated genes by genome-wide association study and their potential application in the breeding of Pacific white shrimp (Litopenaeus vannamei). Front. Genet. 2021, 12, 611570. [Google Scholar] [CrossRef]
- Ciobanu, D.C.; Bastiaansen, J.W.M.; Magrin, J.; Rocha, J.L.; Jiang, D.H.; Yu, N.; Geiger, B.; Deeb, N.; Rocha, D.; Gong, H. A major SNP resource for dissection of phenotypic and genetic variation in Pacific white shrimp (Litopenaeus vannamei). Anim. Genet. 2010, 41, 39–47. [Google Scholar] [CrossRef] [PubMed]
- Gorbach, D.M.; Hu, Z.L.; Du, Z.Q.; Rothschild, M.F. SNP discovery in Litopenaeus vannamei with a new computational pipeline. Anim. Genet. 2010, 40, 106–109. [Google Scholar] [CrossRef] [PubMed]
- Lu, X.; Kong, J.; Meng, X.; Cao, B.; Luo, K.; Dai, P.; Luan, S. Identification of SNP markers associated with tolerance to ammonia toxicity by selective genotyping from de novo assembled transcriptome in Litopenaeus vannamei. Fish Shellfish Immunol. 2018, 73, 158–166. [Google Scholar] [CrossRef] [PubMed]
- Santos, C.A.; Andrade, S.C.S.; Freitas, P.D. Identification of SNPs potentially related to immune responses and growth performance in Litopenaeus vannamei by RNA-seq analyses. PeerJ 2018, 6, e5154. [Google Scholar] [CrossRef] [PubMed] [Green Version]
- Garvin, M.R.; Saitoh, K.; Gharrett, A.J. Application of single nucleotide polymorphisms to non-model species: A technical review. Mol. Ecol. Resour. 2010, 10, 915–934. [Google Scholar] [CrossRef] [PubMed]
- Helyar, S.J.; Limborg, M.T.; Bekkevold, D.; Babbucci, M.; van Houdt, J.; Maes, G.E.; Bargelloni, L.; Nielsen, R.O.; Taylor, M.I.; Ogden, R.; et al. SNP discovery using next generation transcriptomic sequencing in atlantic herring (Clupea harengus). PLoS ONE 2012, 7, e42089. [Google Scholar] [CrossRef] [PubMed]
- De Wit, P. SNP discovery using next generation transcriptomic sequencing. Methods Mol. Biol. 2016, 1452, 81–95. [Google Scholar] [CrossRef]
- Wang, Z.; Gerstein, M.; Snyder, M. RNA-Seq: A revolutionary tool for transcriptomics. Nat. Rev. Genet. 2009, 10, 57–63. [Google Scholar] [CrossRef] [PubMed]
- Wu, Y.; Zhou, Q.; Huang, S.; Wang, G.; Xu, L.A. SNP development and diversity analysis for Ginkgo biloba based on transcriptome sequencing. Trees 2019, 33, 587–597. [Google Scholar] [CrossRef]
- Chopra, R.; Burow, G.; Farmer, A.; Mudge, J.; Simpson, C.E.; Wilkins, T.A.; Baring, M.R.; Puppala, N.; Chamberlin, K.D.; Burow, M.D. Next-generation transcriptome sequencing, SNP discovery and validation in four market classes of peanut, Arachis hypogaea L. Mol. Genet. Genom. 2015, 290, 1169–1180. [Google Scholar] [CrossRef] [PubMed]
- Mohamed, S.; Vallejo, R.L.; Leeds, T.D.; Yniv, P.; Sixin, L.; Annas, S.; Rexroad, C.E.; Jianbo, Y.; Zhanjiang, L. RNA-Seq identifies SNP markers for growth traits in Rainbow trout. PLoS ONE 2012, 7, e36264. [Google Scholar]
- Liu, S.; Zhou, Z.; Lu, J.; Sun, F.; Wang, S.; Liu, H.; Jiang, Y.; Kucuktas, H.; Kaltenboeck, L.; Peatman, E.; et al. Generation of genome-scale gene-associated SNPs in catfish for the construction of a high-density SNP array. BMC Genom. 2011, 12, 53. [Google Scholar] [CrossRef] [Green Version]
- Ames, I.A.; Mei, Y.U.; Cheng, Y.E.; Rothschild, M.F. SNP analysis of Molting related genes in Penaeus monodon and Litopenaeus vannamei shrimp (Brief report). Arch. Fur. Tierz. 2006, 49, 356. [Google Scholar]
- Marti, S.M.; Onteru, S.K.; Du, Z.Q.; Rothschild, M.F. Short communication. SNP analyses of the 5HT1R and STAT genes in Pacific white shrimp, Litopenaeus vannamei. Span. J. Agric. Res. 2010, 8, 53–55. [Google Scholar] [CrossRef] [Green Version]
- Yu, Y.; Wei, J.; Zhang, X.; Liu, J.; Liu, C.; Li, F.; Xiang, J. SNP discovery in the transcriptome of white pacific shrimp Litopenaeus vannamei by next generation sequencing. PLoS ONE 2014, 9, e87218. [Google Scholar] [CrossRef]
- Glenn, K.L.; Grapes, L.; Suwanasopee, T.; Harris, D.L.; Li, Y.; Wilson, K.; Rothschild, M.F. SNP analysis of AMY2 and CTSL genes in Litopenaeus vannamei and Penaeus monodon shrimp. Anim. Genet. 2005, 36, 235–236. [Google Scholar] [CrossRef] [PubMed]
- Gayral, P.; Melo-Ferreira, J.; Glémin, S.; Bierne, N.; Carneiro, M.; Nabholz, B.; Lourenco, J.M.; Alves, P.C.; Ballenghien, M.; Faivre, N.; et al. Reference-free population genomics from next-generation transcriptome data and the vertebrate-invertebrate gap. PLoS Genet. 2013, 9, e1003457. [Google Scholar] [CrossRef] [Green Version]
- Guo, Y.; Su, B.; Tang, J.; Zhou, F.; Qiu, L.J. Gene-based SNP identification and validation in soybean using next-generation transcriptome sequencing. Mol. Genet. Genom. 2018, 293, 623–633. [Google Scholar] [CrossRef]
- Piskol, R.; Ramaswami, G.; Li, J.B. Reliable identification of genomic variants from RNA-Seq data. Am. J. Hum. Genet. 2013, 93, 641–651. [Google Scholar] [CrossRef] [Green Version]
- Lopez-Maestre, H.; Brinza, L.; Marchet, C.; Kielbassa, J.; Bastien, S.; Boutigny, M.; Monnin, D.; Filali, A.E.; Carareto, C.M.; Vieira, C.; et al. SNP calling from RNA-seq data without a reference genome: Identification, quantification, differential analysis and impact on the protein sequence. Nucleic Acids Res. 2016, 44, e148. [Google Scholar] [CrossRef] [PubMed] [Green Version]
- De Wit, P.; Pespeni, M.H.; Palumbi, S.R. SNP genotyping and population genomics from expressed sequences—Current advances and future possibilities. Mol. Ecol. 2015, 24, 2310–2323. [Google Scholar] [CrossRef] [Green Version]
- Wang, J.; Li, Q. Characterization of novel EST-SNP markers and their association analysis with growth-related traits in the Pacific oyster Crassostrea gigas. Aquac. Int. 2017, 25, 1707–1719. [Google Scholar] [CrossRef]
- Jian, X.; Peifeng, J.; Zixia, Z.; Yan, Z.; Jianxin, F.; Jian, W.; Jiongtang, L.; Xiaofeng, Z.; Lan, Z.; Guangzan, L. Genome-wide SNP discovery from transcriptome of four Common carp strains. PLoS ONE 2012, 7, e48140. [Google Scholar]
- Valenzuela-Miranda, D.; Gallardo-Escárate, C.; Valenzuela-Muñoz, V.; Farlora, R.; Gajardo, G. Sex-dependent transcriptome analysis and single nucleotide polymorphism (SNP) discovery in the brine shrimp Artemia franciscana. Mar. Genom. 2014, 18, 151–154. [Google Scholar] [CrossRef]
- Zakas, C.; Schult, N.; McHugh, D.; Jones, K.L.; Wares, J.P. Transcriptome Analysis and SNP development can resolve population differentiation of Streblospio benedicti, a developmentally dimorphic marine annelid. PLoS ONE 2012, 7, e31613. [Google Scholar] [CrossRef] [PubMed] [Green Version]
- Schlötterer, C.; Tobler, R.; Kofler, R.; Nolte, V. Sequencing pools of individuals-mining genome-wide polymorphism data without big funding. Nat. Rev. Genet. 2014, 15, 749–763. [Google Scholar] [CrossRef]
- Bansal, V. A statistical method for the detection of variants from next-generation resequencing of DNA pools. Bioinformatics 2010, 26, i318–i324. [Google Scholar] [CrossRef] [PubMed]
- Ingman, M.; Gyllensten, U. SNP frequency estimation using massively parallel sequencing of pooled DNA. Eur. J. Hum. Genet. 2009, 17, 383–386. [Google Scholar] [CrossRef]
- Out, A.A.; van Minderhout, I.J.; Goeman, J.J.; Ariyurek, Y.; Ossowski, S.; Schneeberger, K.; Weigel, D.; van Galen, M.; Taschner, P.E.; Tops, C.M.; et al. Deep sequencing to reveal new variants in pooled DNA samples. Hum. Mutat. 2009, 30, 1703–1712. [Google Scholar] [CrossRef]
- Futschik, A.; Schlotterer, C. The next generation of molecular markers from massively parallel sequencing of pooled DNA samples. Genetics 2010, 186, 207–218. [Google Scholar] [CrossRef] [Green Version]
- Anand, S.; Mangano, E.; Barizzone, N.; Bordoni, R.; Sorosina, M.; Clarelli, F.; Corrado, L.; Martinelli Boneschi, F.; D’Alfonso, S.; De Bellis, G. Next generation sequencing of pooled samples: Guideline for variants’ filtering. Sci. Rep. 2016, 6, 33735. [Google Scholar] [CrossRef]
- Wu, F.F.; Michael, C.; Lee, S.; Cai, T.; Li, Y.; Boehnke, M.; Lin, X. Rare-variant association testing for sequencing data with the sequence kernel association test. Am. J. Hum. Genet. 2011, 89, 82–93. [Google Scholar] [CrossRef] [PubMed] [Green Version]
- Yi, N.; Zhi, D. Bayesian analysis of rare variants in genetic association studies. Genet. Epidemiol. 2011, 35, 57–69. [Google Scholar] [CrossRef] [Green Version]
- Zhou, B. An empirical bayes mixture model for SNP detection in pooled sequencing data. Bioinformatics 2012, 28, 2569–2575. [Google Scholar] [CrossRef]
- Basu, S.; Pan, W. Comparison of statistical tests for disease association with rare variants. Genet. Epidemiol. 2011, 35, 606–619. [Google Scholar] [CrossRef] [PubMed]
- Huang, Y.Y.; Wang, G.D.; Liu, J.S.; Zhang, L.L.; Huang, S.Y.; Wang, Y.L.; Yang, Z.W.; Ge, H. Analysis of transcriptome difference between rapid-growing and slow-growing in Penaeus vannamei. Gene 2021, 787, 145642. [Google Scholar] [CrossRef]
- Chen, S.; Wu, J.; Huner, J.V.; Malone, R.F.J.A. Effects of temperature upon ablation-to-molt interval and mortality of red swamp crawfish (Procambarus clarkii) subjected to bilateral eyestalk ablation. Aquaculture 1995, 138, 191–204. [Google Scholar] [CrossRef]
- Allayie, S.A.; Ravichandran, S.; Bhat, B.A. Hormonal regulatory role of eyestalk factors on growth of heart in mud crab, Scylla serrata. Saudi J. Biol. Sci. 2011, 18, 283–286. [Google Scholar] [CrossRef] [PubMed] [Green Version]
- Brito, R.; Chimal, M.E.; Gaxiola, G.; Rosas, C. Growth, metabolic rate, and digestive enzyme activity in the white shrimp Litopenaeus setiferus early postlarvae fed different diets. J. Exp. Mar. Biol. Ecol. 2000, 255, 21–36. [Google Scholar] [CrossRef]
- Gamboa-delgado, J.; Molina-poveda, C.; Cahu, C.J.A.R. Digestive enzyme activity and food ingesta in juvenile shrimp Litopenaeus vannamei (Boone, 1931) as a function of body weight. Aquac. Res. 2003, 34, 1403–1411. [Google Scholar] [CrossRef] [Green Version]
- Pavasovic, A.; Anderson, A.J.; Mather, P.B.; Richardson, N.A.J.A.R. Influence of dietary protein on digestive enzyme activity, growth and tail muscle composition in redclaw crayfish, Cherax quadricarinatus (von Martens). Aquac. Res. 2007, 38, 644–652. [Google Scholar] [CrossRef]
- Chen, S.; Zhou, Y.; Chen, Y.; Gu, J. fastp: An ultra-fast all-in-one FASTQ preprocessor. Bioinformatics 2018, 34, i884–i890. [Google Scholar] [CrossRef]
- Langmead, B.; Salzberg, S.L. Fast gapped-read alignment with Bowtie 2. Nat. Methods 2012, 9, 357–359. [Google Scholar] [CrossRef] [Green Version]
- Kim, D.; Pertea, G.; Trapnell, C.; Pimentel, H.; Kelley, R.; Salzberg, S.L. TopHat2: Accurate alignment of transcriptomes in the presence of insertions, deletions and gene fusions. Genome Biol. 2013, 14, R36. [Google Scholar] [CrossRef] [Green Version]
- Van der Auwera, G.A.; Carneiro, M.O.; Hartl, C.; Poplin, R.; Del Angel, G.; Levy-Moonshine, A.; Jordan, T.; Shakir, K.; Roazen, D.; Thibault, J.; et al. From FastQ data to high confidence variant calls: The Genome Analysis Toolkit best practices pipeline. Curr. Protoc. Bioinform. 2013, 43, 11.10.1–11.10.33. [Google Scholar] [CrossRef]
- Wang, K.; Li, M.; Hakonarson, H. ANNOVAR: Functional annotation of genetic variants from high-throughput sequencing data. Nucleic Acids Res. 2010, 38, e164. [Google Scholar] [CrossRef] [PubMed]
- Fisher, R.A. On the interpretation of χ 2 from contingency tables, and the calculation of P. J. R. Stat. Soc. 1922, 85, 87–94. [Google Scholar] [CrossRef]
- Bland, J.M.; Altman, D. Statistics notes: Multiple significance tests: The Bonferroni method. BMJ (Clin. Res. Ed.) 1995, 310, 170. [Google Scholar] [CrossRef] [Green Version]
- Robinson, M.D.; McCarthy, D.J.; Smyth, G.K. edgeR: A Bioconductor package for differential expression analysis of digital gene expression data. Bioinformatics 2010, 26, 139–140. [Google Scholar] [CrossRef] [PubMed] [Green Version]
- Ashburner, M.; Ball, C.A.; Blake, J.A.; Botstein, D.; Butler, H.; Cherry, J.M.; Davis, A.P.; Dolinski, K.; Dwight, S.S.; Eppig, J.T.; et al. Gene ontology: Tool for the unification of biology. The gene ontology consortium. Nat. Genet. 2000, 25, 25–29. [Google Scholar] [CrossRef] [Green Version]
- Kanehisa, M.; Goto, S. KEGG: Kyoto encyclopedia of genes and genomes. Nucleic Acids Res. 2000, 28, 27–30. [Google Scholar] [CrossRef]
- Kassambara, A.; Kassambara, M.A. Package ‘ggpubr’. Available online: https://mran.microsoft.com/snapshot/2017-04-22/web/packages/ggpubr/ggpubr.pdf (accessed on 14 March 2017).
- Villanueva, R.A.M.; Chen, Z.J. ggplot2: Elegant graphics for data analysis (2nd ed.). Meas. Interdiscip. Res. Perspect. 2019, 17, 160–167. [Google Scholar] [CrossRef]
- Chen, H.; Boutros, P.C.J.B.b. VennDiagram: A package for the generation of highly-customizable Venn and Euler diagrams in R. BMC Bioinform. 2011, 12, 35. [Google Scholar] [CrossRef] [Green Version]
- Cutler, D.J.; Jensen, J.D. To Pool, or Not to Pool? Genetics 2010, 186, 41–43. [Google Scholar] [CrossRef] [PubMed] [Green Version]
- Gautier, M.; Foucaud, J.; Gharbi, K.; Galan, M.; Loiseau, A.; Thomson, M.; Pudlo, P.; Estoup, A. Estimation of population allele frequencies from next-generation sequencing data: Pool-versus individual-based genotyping. Mol. Ecol. 2013, 22, 3766–3779. [Google Scholar] [CrossRef] [PubMed]
- Li, S.; Zhang, X.; Sun, Z.; Li, F.; Xiang, J. Transcriptome analysis on Chinese shrimp Fenneropenaeus chinensis during WSSV acute infection. PLoS ONE 2013, 8, e58627. [Google Scholar]
- Van Tassell, C.P.; Smith, T.P.; Matukumalli, L.K.; Taylor, J.F.; Schnabel, R.D.; Lawley, C.T.; Haudenschild, C.D.; Moore, S.S.; Warren, W.C.; Sonstegard, T.S. SNP discovery and allele frequency estimation by deep sequencing of reduced representation libraries. Nat. Methods 2008, 5, 247–252. [Google Scholar] [CrossRef]
- Linck, E.; Battey, C.J. Minor allele frequency thresholds strongly affect population structure inference with genomic data sets. Mol. Ecol. Resour. 2019, 19, 639–647. [Google Scholar] [CrossRef]
- Lam, A.C.; Schouten, M.; Aulchenko, Y.S.; Haley, C.S.; de Koning, D.-J. Rapid and robust association mapping of expression quantitative trait loci. BMC Proc. 2007, 1 (Suppl. 1), S144. [Google Scholar] [CrossRef] [PubMed] [Green Version]
- Cupples, L.A.; Arruda, H.T.; Benjamin, E.J.; D’Agostino, R.B., Sr.; Demissie, S.; DeStefano, A.L.; Dupuis, J.; Falls, K.M.; Fox, C.S.; Gottlieb, D.J.; et al. The Framingham Heart Study 100K SNP genome-wide association study resource: Overview of 17 phenotype working group reports. BMC Med. Genet. 2007, 8 (Suppl. 1), S1. [Google Scholar] [CrossRef] [PubMed] [Green Version]
- Florez, J.C.; Manning, A.K.; Dupuis, J.; McAteer, J.; Irenze, K.; Gianniny, L.; Mirel, D.B.; Fox, C.S.; Cupples, L.A.; Meigs, J.B. A 100K genome-wide association scan for diabetes and related traits in the Framingham Heart Study: Replication and integration with other genome-wide datasets. Diabetes 2007, 56, 3063–3074. [Google Scholar] [CrossRef] [Green Version]
- Tabangin, M.E.; Woo, J.G.; Martin, L.J. The effect of minor allele frequency on the likelihood of obtaining false positives. BMC Proc. 2009, 3 (Suppl. 7), S41. [Google Scholar] [CrossRef] [Green Version]
- Michelmore, R.W.; Paran, I.; Kesseli, R.V. Identification of markers linked to disease-resistance genes by bulked segregant analysis: A rapid method to detect markers in specific genomic regions by using segregating populations. Proc. Natl. Acad. Sci. USA 1991, 88, 9828–9832. [Google Scholar] [CrossRef] [PubMed] [Green Version]
- Hirao, A.S.; Onda, Y.; Shimizu-Inatsugi, R.; Sese, J.; Shimizu, K.K.; Kenta, T. Cost-effective discovery Of nucleotide polymorphisms in populations of an allopolyploid species using pool-seq. Am. J. Mol. Biol. 2017, 7, 1031–1046. [Google Scholar] [CrossRef] [Green Version]
- Holt, K.E.; Teo, Y.Y.; Li, H.; Nair, S.; Dougan, G.; Wain, J.; Parkhill, J. Detecting SNPs and estimating allele frequencies in clonal bacterial populations by sequencing pooled DNA. Bioinformatics 2009, 25, 2074–2075. [Google Scholar] [CrossRef] [Green Version]
- Lee, D.K.; Ahn, S.; Cho, H.Y.; Yun, H.Y.; Park, J.H.; Lim, J.; Lee, J.; Kwon, S.W. Metabolic response induced by parasitic plant-fungus interactions hinder amino sugar and nucleotide sugar metabolism in the host. Sci. Rep. 2016, 6, 37434. [Google Scholar] [CrossRef] [PubMed] [Green Version]
- Geng, G.; Lv, C.; Stevanato, P.; Li, R.; Liu, H.; Yu, L.; Wang, Y. Transcriptome analysis of salt-sensitive and tolerant genotypes reveals salt-tolerance metabolic pathways in Sugar beet. Int. J. Mol. Sci. 2019, 20, 5910. [Google Scholar] [CrossRef] [PubMed] [Green Version]
- Xu, Z.; Li, T.; Li, E.; Chen, K.; Ding, Z.; Qin, J.G.; Chen, L.; Ye, J. Comparative transcriptome analysis reveals molecular strategies of oriental river prawn Macrobrachium nipponense in response to acute and chronic nitrite stress. Fish Shellfish Immunol. 2016, 48, 254–265. [Google Scholar] [CrossRef] [PubMed]
- Eaton, D.L.; Bammler, T.K. Concise review of the glutathione S-transferases and their significance to toxicology. Toxicol. Sci. 1999, 49, 156–164. [Google Scholar] [CrossRef] [PubMed] [Green Version]
- Goto, S.; Kawakatsu, M.; Izumi, S.; Urata, Y.; Kageyama, K.; Ihara, Y.; Koji, T.; Kondo, T. Glutathione S-transferase pi localizes in mitochondria and protects against oxidative stress. Free Radic. Biol. Med. 2009, 46, 1392–1403. [Google Scholar] [CrossRef] [PubMed] [Green Version]
- Sheehan, D.; Meade, G.; Foley, V.M.; Dowd, C.A. Structure, function and evolution of glutathione transferases: Implications for classification of non-mammalian members of an ancient enzyme superfamily. Biochem. J. 2001, 360, 1–16. [Google Scholar] [CrossRef]
- Frova, C. Glutathione transferases in the genomics era: New insights and perspectives. Biomol. Eng. 2006, 23, 149–169. [Google Scholar] [CrossRef]
- Inagi, R. Endoplasmic reticulum stress as a target of therapy against oxidative stress and hypoxia. In Studies on Renal Disorders; Springer: Berlin/Heidelberg, Germany, 2011; pp. 657–672. [Google Scholar] [CrossRef]
Figure 1.
Workflow used to identify SNPs in the P. vannamei transcriptome.

Figure 2.
Statistics for 162,571 presumptive SNP read depths.

Figure 3.
The AFI distribution of 100,633 putative SNPs in linkage groups.

Figure 4.
Venn diagram. DEGs represent differently expressed genes between RG (rapid-growing individuals) and SG (slow-growing individuals). FGs represent functional genes containing candidate SNPs (p-value < 0.05, AFI > 4 or < 0.25).
Figure 4.
Venn diagram. DEGs represent differently expressed genes between RG (rapid-growing individuals) and SG (slow-growing individuals). FGs represent functional genes containing candidate SNPs (p-value < 0.05, AFI > 4 or < 0.25).

Figure 5.
Gene Ontology classifications for 566 functional genes (FGs).

Figure 6.
The top 10 KEGG pathways for 566 functional genes (FGs).


Table 1.
Sixteen crossbred groups used in this experiment.
| Strain | A♀ | B♀ | C♀ | D♀ |
|---|---|---|---|---|
| A♂ | A♂ × A♀ | A♂ × B♀ | A♂ × C♀ | A♂ × D♀ |
| B♂ | B♂ × A♀ | B♂ × B♀ | B♂ × C♀ | B♂ × D♀ |
| C♂ | C♂ × A♀ | C♂ × B♀ | C♂ × C♀ | C♂ × D♀ |
| D♂ | D♂ × A♀ | D♂ × B♀ | D♂ × C♀ | D♂ × D♀ |
Note: The four different strains (A, B, C, and D) were interbred with each other to produce the 16 crossbred families. Strain A was from Xiaxinglong, Xiamen shrimp breeding factory, China. Population crossbreeding was performed in 2012 and was used in 2019. Strain B, was from Syaqua, Thailand. Population crossbreeding was performed in 2017 and was used in 2019. Strain C was from Hainan, China. Population crossbreeding was performed in 2017 and was used in 2019. Strain D was from Texas Primo Broodstock, Inc., USA. Population crossbreeding was performed in 2017 and was used in 2019.
Table 2.
RNA-seq data.
| Samples | SG1 | SG2 | SG3 | RG1 | RG2 | RG3 |
|---|---|---|---|---|---|---|
| Clean Reads | 53,417,000 | 55,225,902 | 60,854,638 | 56,319,016 | 55,217,378 | 44,038,758 |
| HQ Clean Reads | 52,476,282 (98.24%) | 54,200,380 (98.14%) | 59,824,174 (98.31%) | 55,354,830 (98.29%) | 54,220,100 (98.19%) | 43,292,594 (98.31%) |
| Q20 | 98.59% | 98.48% | 98.60% | 98.55% | 98.59% | 98.51% |
| Q30 | 95.24% | 94.97% | 95.29% | 95.14% | 95.24% | 95.06% |
| GC | 49.27% | 49.00% | 49.24% | 48.41% | 49.05% | 48.25% |
| Unmapped Reads 1 | 46,852,556 (89.28%) | 50,450,550 (93.08%) | 55,177,690 (92.23%) | 51,620,794 (93.25%) | 48,853,888 (90.10%) | 40,165,176 (92.78%) |
1 The unmapped reads represent the reads with ribosomal RNA removed from HQ, clean reads, which were used for further analysis. RG: rapid-growing individuals; SG: slow-growing individuals.
Table 3.
Mutation types statistics for 216,015 hypothetical SNPs.
| Type | Transition | Transversion | ||||
|---|---|---|---|---|---|---|
| GA | CT | AC | AT | GC | GT | |
| Number | 69,765 | 70,055 | 17,499 | 27,376 | 13,758 | 17,562 |
| Percentage | 32.30% | 32.43% | 8.10% | 12.67% | 6.37% | 8.13% |
Table 4.
Mutation location statistics for 216,015 hypothetical SNPs.
| Location | Number | Percentage |
|---|---|---|
| Exonic | 82,663 | 38.27% |
| Intergenic | 82,225 | 38.06% |
| Downstream | 27,077 | 12.53% |
| Intronic | 18,650 | 8.63% |
| Upstream | 5276 | 2.44% |
| Splicing | 124 | 0.06% |
Table 5.
Classification of 216,015 hypothetical SNPs using ANNOVAR.
| Classification | Number | Percentage |
|---|---|---|
| Synonymous | 63,286 | 29.30% |
| Nonsynonymous | 17,790 | 8.24% |
| Unknown | 1587 | 0.73% |
| Not annotated | 133,352 | 61.73% |
| Total | 216,015 |
Table 6.
The information for 35 target SNPs.
| Gene Id | Position | Ref | Alt | Read Depth | p-Value | MAF | AFI | Pool-Seq | Name | |
|---|---|---|---|---|---|---|---|---|---|---|
| RG | SG | |||||||||
| C7M84_022026 | 27796 | G | A | 287.5 | 0.0028 | 0.633 | 0.752 | 0.84 | A | G27796A |
| C7M84_023984 | 36958 | C | T | 326 | 0.0279 | 0.844 | 0.774 | 1.09 | T | C36958T |
| LOC113805038 | 349955 | G | C | 16.5 | 0.0403 | 0.750 | 1.000 | 0.75 | NA | G349955C |
| C7M84_004438 | 204734 | G | A | 138 | 0.0276 | 0.700 | 0.819 | 0.85 | A | G204734A |
| C7M84_005801 | 133937 | T | C | 2182 | 0.0008 | 0.900 | 0.867 | 1.04 | C | T133937C |
| C7M84_007144 | 137866 | A | G | 1134 | 0.0371 | 0.457 | 0.413 | 1.11 | G | A137866G |
| C7M84_009716 | 107815 | T | C | 659.5 | 0.0112 | 0.629 | 0.560 | 1.12 | NA | T107815C |
| C7M84_017766 | 148891 | C | T | 106 | 0.0070 | 0.061 | 0.186 | 0.33 | NA | C148891T |
| C7M84_021354 | 328130 | A | G | 53.5 | 0.0065 | 0.319 | 0.100 | 3.19 | G | A328130G |
| C7M84_021883 | 50172 | T | C | 32 | 0.0391 | 0.079 | 0.308 | 0.26 | NA | T50172C |
| LOC113828755 | 914967 | C | T | 314 | 1.17e−06 | 0.061 | 0.194 | 0.31 | NA | C914967T |
| C7M84_022385 | 231745 | G | A | 139 | 0.0099 | 0.154 | 0.056 | 2.74 | NA | G231745A |
| C7M84_022682 | 221463 | T | A | 40.5 | 0.0095 | 0.529 | 0.234 | 2.26 | A | T221463A |
| C7M84_023278 | 233420 | G | A | 5404 | 0.0062 | 0.102 | 0.119 | 0.86 | NA | G233420A |
| C7M84_023424 | 1031552 | A | T | 377.5 | 0.0330 | 0.675 | 0.597 | 1.13 | T | A1031552T |
| C7M84_020628 | 42707 | C | T | 146 | 0.2135 | 0.265 | 0.200 | 1.33 | NA | C42707T |
| C7M84_024169 | 1182178 | T | A | 241 | 0.0003 | 0.403 | 0.575 | 0.70 | A | T1182178A |
| After Filtering | ||||||||||
| C7M84_013676 | 55042 | G | A | 118.5 | 2.93e−07 | 0.065 | 0.325 | 0.20 | NA | G55042A |
| C7M84_022166 | 785995 | C | T | 172.5 | 2.14e−22 | 0.059 | 0.588 | 0.10 | NA | C785995T |
| C7M84_025140 | 59957 | T | C | 1659.5 | 4.37e−71 | 0.067 | 0.298 | 0.22 | C | T59957C |
| C7M84_000346 | 559390 | A | G | 86.5 | 4.58e−10 | 0.143 | 0.604 | 0.24 | G | A559390G |
| C7M84_000503 | 110344 | A | G | 390 | 2.31e−54 | 0.790 | 0.127 | 6.21 | G | A110344G |
| C7M84_000990 | 656281 | G | A | 323.5 | 7.39e−38 | 0.157 | 0.665 | 0.24 | A | G656281A |
| C7M84_001073 | 1317191 | T | A | 164 | 1.37e−07 | 0.073 | 0.294 | 0.25 | NA | T1317191A |
| C7M84_003252 | 917813 | T | C | 54 | 9.89e−13 | 0.075 | 0.727 | 0.10 | C | T917813C |
| C7M84_004254 | 362599 | C | T | 830 | 5.10e−30 | 0.262 | 0.057 | 4.59 | T | C362599T |
| C7M84_006107 | 134086 | G | C | 128.5 | 2.12e−20 | 0.598 | 0.074 | 8.08 | C | G134086C |
| C7M84_011240 | 585697 | T | C | 2094 | 6.46e−84 | 0.489 | 0.103 | 4.77 | C | T585697C |
| C7M84_012141 | 195878 | T | C | 79.5 | 9.74e−09 | 0.439 | 0.052 | 8.45 | C | T195878C |
| C7M84_012205 | 93082 | T | C | 214.5 | 1.67e−07 | 0.235 | 0.054 | 4.36 | C | T93082C |
| C7M84_013033 | 54546 | C | T | 61.5 | 1.72e−10 | 0.625 | 0.085 | 7.38 | T | C54546T |
| C7M84_014204 | 246976 | A | G | 74 | 2.72e−07 | 0.113 | 0.510 | 0.22 | G | A246976G |
| C7M84_016823 | 230068 | A | T | 615 | 2.96e−28 | 0.303 | 0.067 | 4.57 | NA | A230068T |
| C7M84_018561 | 236704 | C | T | 223 | 4.18e−11 | 0.290 | 0.055 | 5.30 | T | C236704T |
| C7M84_014903 | 247322 | C | T | 859 | 1.24e−58 | 0.064 | 0.386 | 0.17 | NA | C247322T |
Note: The former 17 SNPs were randomly chosen from 96,819 low-quality SNPs. After filtering means that these eighteen SNPs were selected at random from 104 high-quality SNPs. NA represents SNPs that could not be verified by pool sequencing in the target position. The “pool-seq” column represents the mutant base detected by DNA pool sequencing at the target SNP location.
Publisher’s Note: MDPI stays neutral with regard to jurisdictional claims in published maps and institutional affiliations. |
© 2021 by the authors. Licensee MDPI, Basel, Switzerland. This article is an open access article distributed under the terms and conditions of the Creative Commons Attribution (CC BY) license (https://creativecommons.org/licenses/by/4.0/).
Share and Cite
MDPI and ACS Style
Huang, Y.; Zhang, L.; Ge, H.; Wang, G.; Huang, S.; Yang, Z. SNP Development in Penaeus vannamei via Next-Generation Sequencing and DNA Pool Sequencing. Fishes 2021, 6, 36. https://0-doi-org.brum.beds.ac.uk/10.3390/fishes6030036
AMA Style
Huang Y, Zhang L, Ge H, Wang G, Huang S, Yang Z. SNP Development in Penaeus vannamei via Next-Generation Sequencing and DNA Pool Sequencing. Fishes. 2021; 6(3):36. https://0-doi-org.brum.beds.ac.uk/10.3390/fishes6030036
Chicago/Turabian StyleHuang, Yongyu, Lili Zhang, Hui Ge, Guodong Wang, Shiyu Huang, and Zhangwu Yang. 2021. "SNP Development in Penaeus vannamei via Next-Generation Sequencing and DNA Pool Sequencing" Fishes 6, no. 3: 36. https://0-doi-org.brum.beds.ac.uk/10.3390/fishes6030036