Article

Molecular Characterization and Dietary Regulation of Glutaminase 1 (gls1) in Triploid Crucian Carp (Carassius auratus)

1
College of Animal Science and Technology, Hunan Agriculture University, Changsha 410003, China
2
Hunan Provincial Key Laboratory of Nutrition and Quality Control of Aquatic Animals, Department of Biological and Environmental Engineering, Changsha University, Changsha 410022, China
3
State Key Laboratory of Freshwater Ecology and Biotechnology, Institute of Hydrobiology, Chinese Academy of Sciences, Wuhan 430072, China
*
Authors to whom correspondence should be addressed.
Submission received: 16 October 2022 / Revised: 2 December 2022 / Accepted: 3 December 2022 / Published: 7 December 2022
(This article belongs to the Special Issue Fish Nutrition and Physiology)

Abstract

:
Kidney-type glutaminase, encoded by the gls1 gene, plays a critical role in glutamate production and improvement of meat flavor. In this study, a gls1 gene encoding 595 amino acids was cloned from triploid crucian carp (Carassius auratus) (TCC) and showed a high similarity with the gls1 gene found in Cyprinus carpio, Sinocyclocheilus rhinocerous and Puntigrus tetrazona. Comparing the abundance of gls1 in different tissues, we found its expression level in the brain and liver were significantly higher than that in heart, gut, kidney, spleen and muscle. gls1 expression in the brain reached the highest value. In addition, the expression levels of gls1 also appeared different in diurnal variation, with the highest expression seen at 9:00, while it was low at 3:00, 6:00, 15:00 and 24:00. Furthermore, dietary regulation of gls1 expression was investigated in our study. In each feeding trial, each diet was randomly assigned to triplicate tanks. Fish were fed one of the tested diets up to satiation twice daily. The results showed that gls1 expression increased in 32% protein group and decreased in 35–41% protein group. The results of different protein source experiments showed that the expression of gls1 gene in the mixed protein group (the control group) was significantly higher than that in the fish meal and soybean meal groups. Glutamate treatment revealed that appropriate concentrations (0.10 mg/mL in vivo and 2.00% in vitro) of glutamate remarkably improved the expression of gls1. Besides, diets supplemented with 0.80–1.60% lysine-glutamate dipeptide exhibited a down regulatory impact on gls1 expression. In conclusion, this study demonstrated that the expression of gls1 in TCC was increased by 32% protein diet, mixed protein source diet and diet with 2.00% glutamate concentration, while decreased by 0.80–1.60% lysine-glutamate dipeptide. The findings of this study provide a reference for the regulation of gls1 and have a potential application in the optimization of dietary formula in aquaculture.

Graphical Abstract

1. Introduction

With the rapid development of the aquaculture industry in recent decades, people have sought high yields of aquatic animals. Still, they have also set higher standards for the quality of animal fillets [1,2]. Meat quality is a complex concept. According to Hoffmann [3], meat quality consists of sensory characteristics, technical, nutritional and health indicators. Becker [4] defined meat quality as those characteristics that can be perceived and recognized by consumers, including search quality attribute (visual and sensory traits), experience quality attribute (such as flavor and tenderness), and credence quality attribute (such as safety and health concerns). However, regardless of the definition of meat quality, the mouthfeel and taste of fish meat are the most important quality indicators for consumers [2]. The content of mouthfeel is relatively simple, and it is expressed in research as texture characteristics such as chewiness, adhesiveness, springiness, and so on. On the other hand, the taste has a more complex composition, including aroma and savor, determined by various flavor compounds [5]. One of the most important flavors of fish meat is umami. The two most important substances that determine the umami flavor of meat are free glutamate and inosine monophosphate (IMP) [6]. Glutamate has also been described as “savory”, “beefy” and “brothy” [5]. Halpern reported that appropriate concentrations of glutamate increased food palatability [7]. Therefore, the content of free glutamate in muscle is significant to the flavor of fish meat.
Glutamine is known as one of the most abundant free amino acids in fish plasma and muscle [8]. Numerous studies have revealed that glutamate is primarily produced in animals by glutamine degradation, which is catalyzed by glutaminase (GLS) [9,10]. Therefore, GLS is the primary limiting enzyme in glutamate synthesis.
There are two isozymes of phosphate-activated GLS: kidney-type glutaminase (K-glutaminase or GLS1) and liver-type glutaminase (L-glutaminase or GLS2). gls2 mRNA is found primarily in the liver, brain, pancreas, and breast cancer cells [11,12], whereas gls1 is ubiquitously expressed in kidney, brain, muscle, intestine, fetal liver, lymphocytes and tumors [13]. They are encoded by different genes [14]. At present, gls gene cloning of aquatic animals is only reported in common carp (Cyprinus carpio) [15], mandarin fish (Siniperca chuatsi) [16] and zebrafish (Danio rerio) [17]. Following sequence alignment, they were identified as gls1. gls1 is involved in various physiological and biochemical processes in animals, most notably catalyzing glutamate production [18]. It is found that gls1 mRNA ubiquitously exists in the brain, muscle, liver, gut and other tissues [16]. In addition, gls1 can regulate the inflammatory response, gls1 is expressed on the surface of neutrophils and participates in the anti-inflammatory response by regulating the generation of cytokine interleukin-8 [19]. gls1 knockout mice have impaired glutamatergic synaptic transmission, altered breathing, disorganized goal-directed behavior and died shortly after birth in an experiment [20]. gls1 is also associated with the occurrence of cancer [21,22] and the scavenging of free radicals [23].
Nutritional diets can regulate gls1 transcription. Kong, Hall, Cooper, and McCauley [24] reported that gls1 expression was regulated by glutamine-enriched parenteral nutrition in rats. In addition, in the primary culture enterocyte of common carp, the gls1 mRNA level of 1 mg L−1 glutamine group was upregulated compared with 0 mg L−1 glutamine group [15]. At present, gls1 related research has been conducted in several fields, including tumor [21,22], cranial nerve [25], virus [26], bacteria, and fungi [27]. However, there is poor research related to gls1 in nutrition study, and even fewer in aquatic fish. Triploid crucian carp (Carassius auratus) (TCC) is an omnivorous sterile fish, which are produced by multistep breeding technology [28]. Because of the characteristics of fast growth, strong disease resistance and delicious meat, TCC is the preferred variety of crucian carp for freshwater aquaculture in China [29]. The present study aimed to analyze the expression characteristics of gls1 cDNA from TCC, and explore the effects of dietary protein levels, protein sources and feed additives (glutamate and lysine-glutamate dipeptide) on the expression of gls1. The findings of this study provide a reference for further understanding of the molecular properties and expression regulation of gls1, and have a potential application in the optimization of dietary formulas and the improvement of fish quality.

2. Materials and Methods

2.1. Animals and Tissue Preparation

The crucian carp was obtained from the State Key Laboratory of Developmental Biology of Freshwater Fish, Hunan Normal University, China. For two weeks before the feeding trial, about 2000 fish were acclimated to the experimental environment by cultured in an indoor recirculating aquaculture system comprising 4 glass fiber tanks (1500 L). The rearing conditions: water temperature was 24.5 ± 1.0 °C, dissolved oxygen content was about 6.5 mg/L, the concentration of ammonia nitrogen was <0.5 mg/kg, pH maintained at 6.5–7.0, 12-h light-dark cycle (light on 8:00 a.m.). And fish was fed with a commercial diet (crude protein 32.20%, crude lipid 6.54%, ash 10.40% and gross energy 18.50 MJ/kg) twice a day, at 9:00 and 15:00.
In this study, all fish were immersed in 50 mg/L MS-222 (Sigma-Aldrich, St. Louis, MO, USA) for anesthesia before dissection. The whole dissection operation was carried out on the ice. The samples were frozen in liquid nitrogen for temporary storage after collection, and then stored at −80 °C until analysis.

2.2. gls1 Expression in Various Tissues and Diurnal Variation

After 2 weeks of acclimatization in an indoor recirculating aquaculture system comprising 4 glass fiber tanks (1500 L), seven tissues (heart, gut, liver, brain, kidney, spleen and muscle) of TCC (11.72 ± 0.16 g, fasting for 24 h) were collected to detect the tissue expression pattern of gls1. Later, in order to explore the diurnal variation of gls1 expression, the muscle of TCC was collected at eight different times (03:00, 06:00, 09:00, 12:00, 15:00, 18:00, 21:00, and 24:00). During sampling of the diurnal variation experiment, the fish was fed twice daily at 9:00 and 15:00. Three parallels were prepared for each group, the gls1 transcription level was analyzed by real-time PCR.

2.3. Muscle Cell Culture and Treatment with Glutamate

Cell isolation and culture were performed according to the methods of Luo et al. [30]. The muscle of TCC (11.72 ± 0.16 g) was rapidly separated and then washed with PBS three times. Tissues were incubated with PBS containing 0.05% (w/v) collagenase (Sigma–Aldrich, St. Louis, MO, USA) for 15 min and then washed with PBS three times. Muscle cells were cultured in a 24-well culture plate with 1 mL DMEM containing 10% fetal bovine serum (Gibco BRL, Gaithersburg, MD, USA) at a density of 800 mg in each well. After incubating the cells in a cell culture incubator at 28 °C with 5% CO2 for two days, complete cell medium containing different concentrations of glutamate (0, 0.10, 0.25, 0.50 and 1.00 mg/mL) was added to cells, respectively. After 24 h glutamate treatment, the cells were collected to analyze the expression of gls1 by quantitative real-time PCR. In this study, the TCC muscle cells could be transmitted to 3 generations. Three parallels were prepared for each treatment group.

2.4. Dietary Protein Level and Protein Source Regulation

Six isolipidic and isocaloric diets with different protein levels at 26, 29, 32, 35, 38 and 41% of crude protein (% CP) (Table 1) and three diets with protein sources derived from soybean meal, fishmeal and both of them (Table 2) were prepared to assess the effects of dietary protein levels and protein sources on triploid crucian carp gls1 expression. All fish (initial body weight: 11.72 ± 0.16 g) were raised in 18 fiberglass tanks (90 L, n = 25), each group contains three repeating tanks. Fish in all groups were fed to apparent satiation, twice daily at 9:00 and 15:00. During the feeding trial, the water temperature was maintained at 24.5 ± 1.0 °C, dissolved oxygen content was kept above 6.5 mg/L, the concentration of ammonia nitrogen was <0.5 mg/kg, pH maintained at 6.5–7.0, the light period was 12L/12D (light on 8:00 a.m.). After a 60-day feeding trial, the experimental fish was fasted for 24 h and then dissected as described in the Section 2.1, the muscle tissue was collected to analyze the gls1 transcription level by real-time PCR.

2.5. Dietary Glutamate Regulations

To evaluate the effects of dietary glutamate levels on TCC gls1 expression, six diets which supplemented with 0, 0.5%, 1.0%, 1.5%, 2.0%, 2.5% and 3.0% of glutamate were formulated (Table 3). TCC (initial body weight: 300.63 ± 1.31 g) were cultured in 21 floating net cages (1.2 m × 1.2 m × 2.0 m, water depth: 2.5 m) at a density of 15 fish per cage in the center of reservoir for 70 days. Triplicate cages were randomly assigned to each diet. Fish in all groups were fed to apparent satiation, twice daily at 9:00 and 15:00. During the feeding trial, the water temperature was maintained at 24.5 ± 1.0 °C, dissolved oxygen content was kept above 6.5 mg/L, the concentration of ammonia nitrogen was <0.5 mg/kg, pH maintained at 6.5–7.0, the light period was 12L/12D (light on 8:00 a.m.). After the feeding experiment, fish was fasted for 24 h and then dissected, as described in the Section 2.1, the muscle of fish was sampled for gene expression analysis by real-time PCR.

2.6. Dietary Lysine-Glutamate Dipeptide Regulation

Six diets with different concentrations of lysine-glutamate (0, 0.4%, 0.8%, 1.2%, 1.6% and 2.0%) (Table 4) were prepared to assess the effects of dietary lysine-glutamate dipeptide on TCC gls1 expression. Fish (initial body weight: 11.79 ± 0.09 g) were raised in 18 fiberglass tanks (90 L, n = 25), and triplicate tanks were randomly arranged to each group. Fish in all groups were fed to apparent satiation, twice daily at 9:00 and 15:00. During the feeding trial, the water temperature was maintained at 24.5 ± 1.0 °C, dissolved oxygen content was kept above 6.5 mg/L, the concentration of ammonia nitrogen was <0.5 mg/kg, pH was maintained at 6.5–7.0, the light period was 12L/12D (light on 8:00 a.m.). After a 60-day feeding trial, fish was fasted for 24 h and then dissected, as described in the Section 2.1, the muscle tissue was collected to analyze the gls1 transcription level by real-time PCR.

2.7. RNA Isolation and cDNA Synthesis

The Trizol reagent (RNAiso Plus, Takara, Kusatsu, Japan) was used to isolate total RNA from tissues and muscle cells. The RNA quality was determined using a 1% agarose gel electrophoresis. The purity and concentration of RNA were assessed by spectrophotometer (BioPhotometer Eppendorf, Hamburg, Germany). First strand cDNA was synthesized from 1 μg total RNA by PrimeScript™ II 1st Strand cDNA Synthesis Kit (Takara, Kusatsu, Japan).

2.8. Cloning of gls1 cDNA

Mixed cDNA from various tissues was used for the cloning of gls1 cDNA. The cloning primers of gls1 were designed based on the gls1 sequence of other teleosts. The PCR primers are listed in Table 5. PCR was carried out using a volume of 20 µL with 1 µL cDNA, 10 µL 2× Taq PCR Master Mix (Tiangen, Beijing, China), 8 µL ddH2O, 0.5 µL forward and reverse primer (100 μmol/L). PCR conditions were as follows: initial denaturation at 94 °C for 5 min, followed by 35 cycles at 94 °C for 30 s, 55 °C for 1 min, and 72 °C for 2 min, then 72 °C for 10 min. The PCR products were separated by 1% agarose gel electrophoresis. The DNA fragments were purified using a gel extraction kit (Tiangen, Beijing, China) and ligated into the pMD19-T vector (Takara, Kusatsu, Japan). The plasmids were transformed into E. coli DH5 α competent cells and purified. The inserted DNA fragments in the pMD19-T vector were sequenced using an automated DNA sequencer (ABI PRISM 3730, Applied Biosystems, Carlsbad, CA, USA).

2.9. Quantitative Real-Time PCR

gls1 mRNA expression was measured using a Bio-Rad CFX96TM Real-time PCR System (Bio-Rad, Hercules, CA, USA). Based on cDNA sequence, gene-specific primers (Table 5) were designed using Primer Premier 5. β-actin was used as an internal reference for normalization. The qRT-PCR amplification reactions (16 μL) were performed using 8 μL 2× SYBR® Green ProTaq HS Premix (Accurate Biology, Changsha, China), 0.64 μL forward and reverse primer (10 μmol/L), 1 μL cDNA template, 0.32 μL ROX Reference Dye (20 μM) and 5.4 μL ddH2O. The procedure was as follows: 50 °C 2 min, 95 °C 10 min followed by 40 cycles at 95 °C for 15 s and 60 °C for 1 min, then 95 °C 15 s, 60 °C 1 min, 95 °C 1 s. The baseline was set automatically by the software. Each sample was run in triplicate, and the relative mRNA expression level was calculated using the 2−ΔΔCt method [31].

2.10. Phylogenetic Analysis of gls1

The phylogenetic tree was built with neighbor-joining (NJ) method using the sequences of gls1 homologs from TCC and other vertebrates. The amino acid sequence was analyzed using NCBI online program ORF finder. In MEGA 11, 1000 bootstrap repetitions were used to assess the reliability of the tree.

2.11. Statistical Analysis

All data were analyzed using SPSS 19 software (Chicago, IL, USA). Statistical analysis of each experiment was conducted by one-way ANOVA analysis of variance. And if differences were found, the means were ranked using Duncan’s multiple comparisons test. The significant difference between different treatment groups was set at p values < 0.05. The data are expressed as means ± SEM in tables and figures.

3. Results

3.1. Cloning and Sequence Analysis of gls1 cDNA from TCC

The full-length of gls cDNA clone we isolated was 2190 bp (GenBank Accession No. MW435571), which contains a 1788 bp open reading frame (ORF). The ORF encodes a 595 amino acid peptide (Figure 1). The present study cloned gls of TCC was grouped with gls1 by homology analysis.
The neighbor-joining phylogenetic tree revealed two main branches, teleost and tetrapod, and demonstrated that TCC gls1 is grouped with high bootstrap support in the lineage of the other teleost. Sinocyclocheilus rhinocerous, Puntigrus tetrazona, and Cyprinus carpio gls1 are more genetically related to TCC (Carassius auratus) than the other animals studied (Figure 2). The evidence indicated that the NJ phylogenetic tree is in accordance with classical taxonomy.

3.2. Tissue Expression Patterns and Circadian Expression of gls1 mRNAs in TCC

The tissue distribution and circadian expression of gls1 from TCC were analyzed by quantitative real-time PCR. gls1 mRNA was expressed in the heart, gut, liver, brain, kidney, spleen and muscle. The expression of gls1 differed significantly among tissues, with the brain having the highest value, followed by the liver, and the expression level of gls1 was low in the other tissues (Figure 3).
The circadian rhythm of muscle gls1 mRNA was presented in Figure 4. gls1 expression showed a downward trend from 9:00 to 15:00, and an upward trend from 15:00 to 21:00. The mRNA level of gls1 was low at 3:00, 6:00, 15:00 and 24:00.

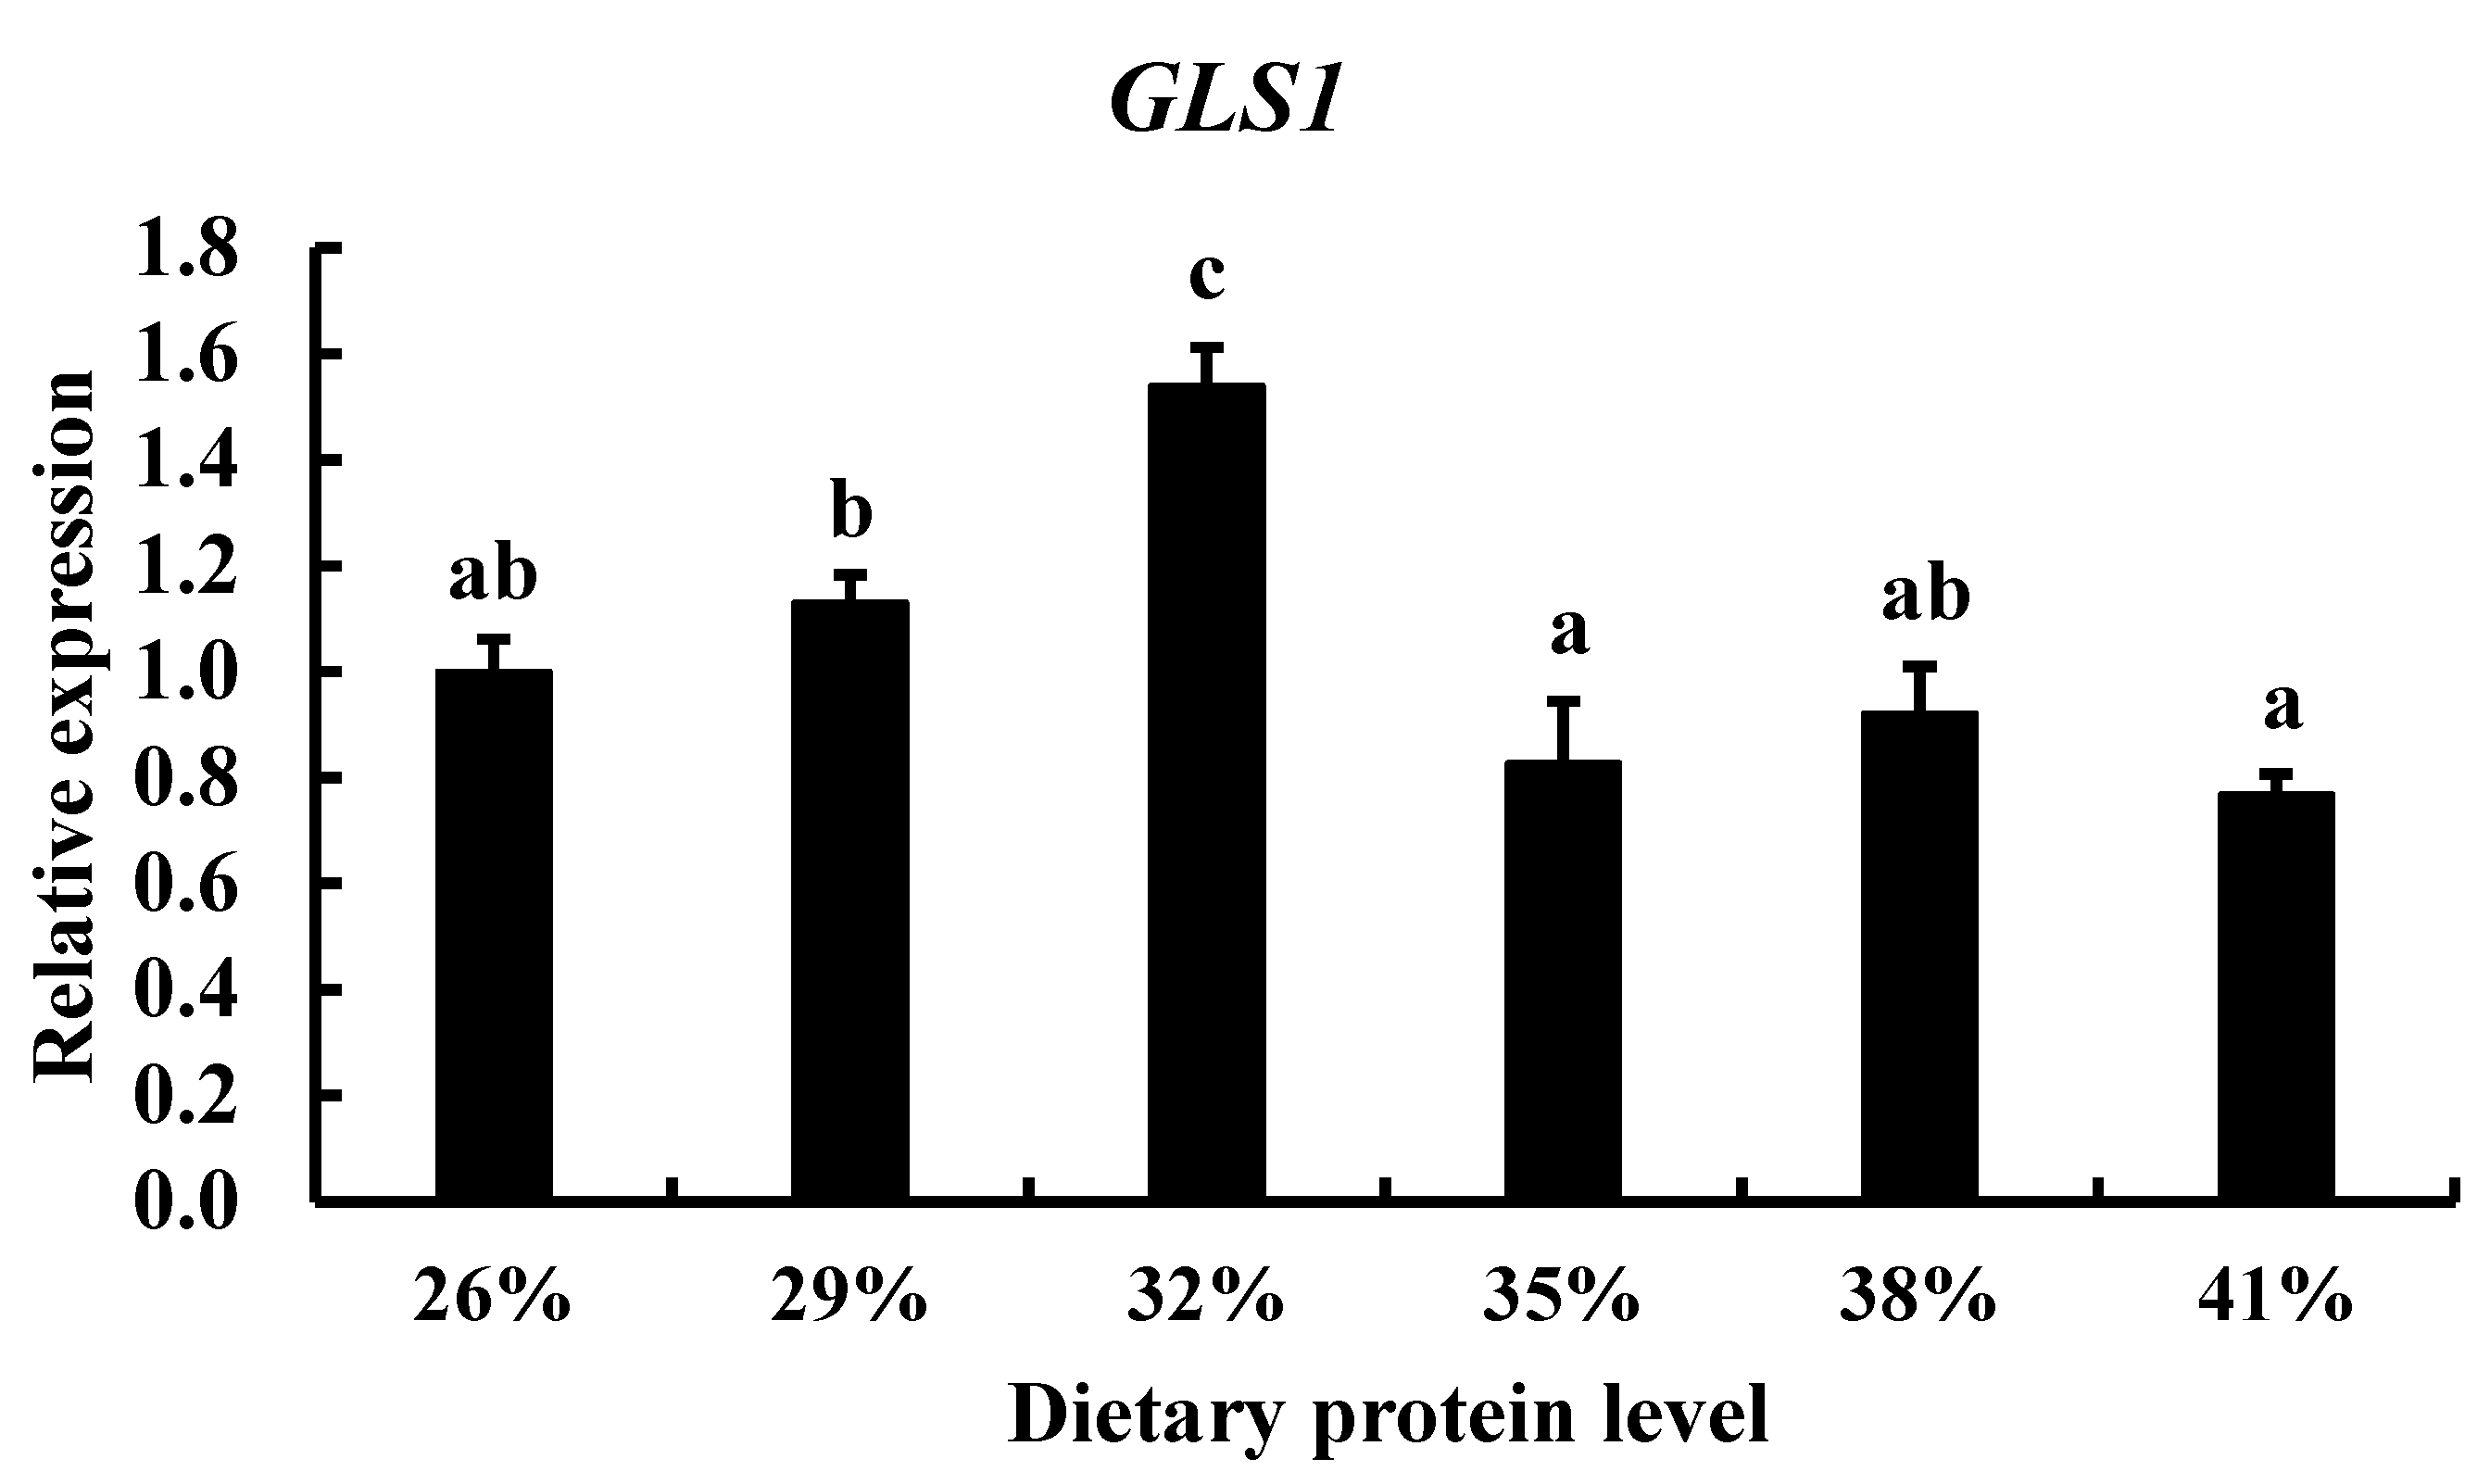
3.3. Effect of Diets with Different Protein Levels and Protein Sources on TCC gls1 Gene Expression

Protein is the main nutritional component of aquatic feeds. The effects of different protein levels and different protein sources on gls1 expression were showed in Figure 5 and Figure 6. gls1 expression increased first and then decreased with the increase in dietary protein levels. The 32% protein group had the highest gls1 expression than the other groups (p < 0.05). Feed protein sources had a significant effect on gls1 expression. The expression level of gls1 in the fish meal and soybean meal groups was significantly lower than that in the control group.

3.4. The Effects of Glutamate In Vitro and In Vivo on TCC gls1 Gene Expression

The profiles of gls1 expression after 24-h treatment with glutamate in vitro were showed in Figure 7. The 0.1 mg/mL group presented the highest gls1 expression level. The gls1 mRNA abundance in the 0.25, 0.5 and 1 mg/mL glutamate groups was lower compared to control group.
TCC was fed a diet containing various levels of glutamate to determine the effect of supplemental glutamate on gls1 expression (Figure 8). With increasing dietary glutamate levels, gls1 expression first increased and then decreased. The 2.00% glutamate supplemented group was significantly higher than the control group (p < 0.05), and there was no significant difference between the other groups and the control group.

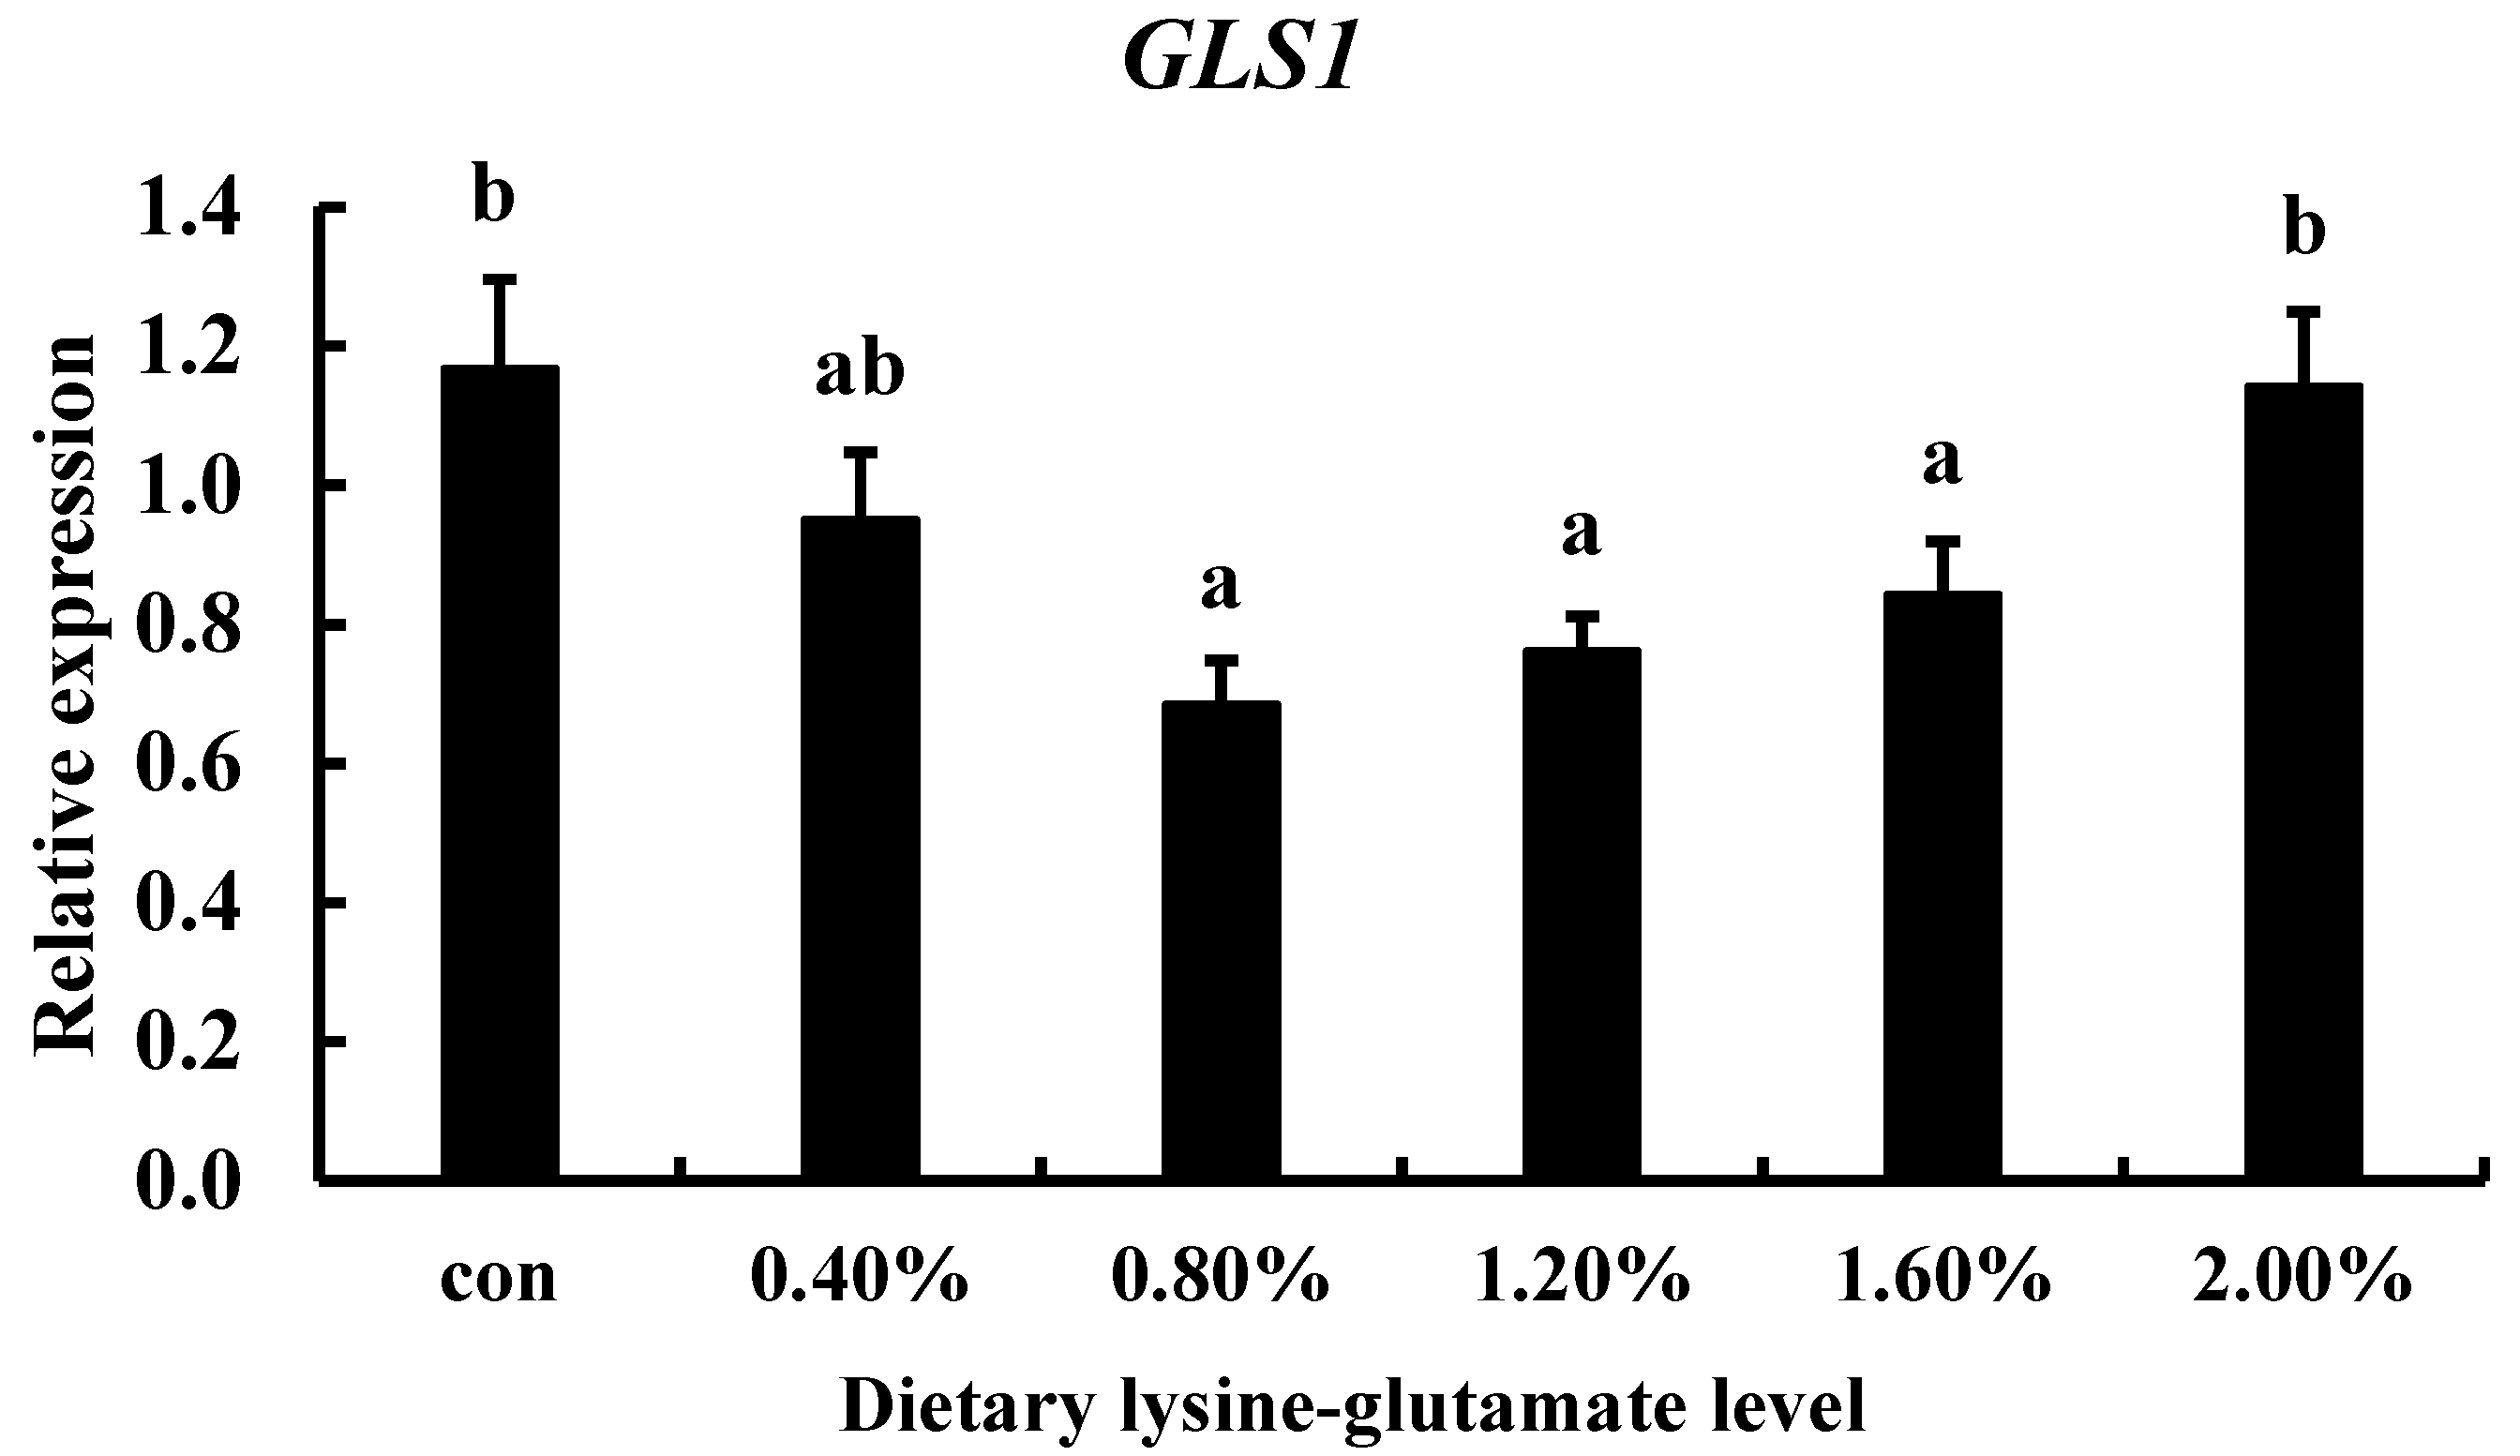
3.5. The Effect of Diets with Lysine-Glutamate on TCC gls1 Gene Expression

Lysine and glutamate are two popular additives in the feed industry. In this study, we analyzed gls1 expression after TCC feeding with lysine-glutamate dipeptides. gls1 transcript level decreased first and then increased with the increase of dietary dipeptide level (Figure 9). The expression of gls1 gene in 2.00% dipeptide supplemented group and the control group were significantly higher than that in the 0.8%, 1.2% and 1.6% supplemented groups (p > 0.05).

4. Discussion

GLS is a key enzyme in glutamate synthesis and glutaminolysis. Currently, two isozyme genes, gls1 and gls2, have been presented. Using NCBI BLAST, gls cDNA we cloned from TCC was identified as gls1. The ORF has a length of 1788 bp and encodes a 595 amino acid peptide. This result is similar in size to that reported in zebrafish (1775 bp) and common carp (1788 bp) [15], but different from mandarin fish (1920 bp) [16]. The phylogenetic tree constructed for different animals gls1 showed that teleost clustered into a single clade and Cyprinidae fish gather into a branchlet, indicating evolutionary conservation of gls1 gene in bony fish and high conservation in Cyprinidae.
In present study, gls1 gene was detected in the tissues of heart, gut, liver, brain, kidney, spleen and muscle of TCC. The highest expression level was found in brain tissue. This might be related to the fact that GLS is the main enzyme responsible for glutamate generation in vertebrates [9,10]. And glutamate is abundant in the brain, which acts as the principal excitatory neurotransmitter in the central nervous system [25]. However, different results were presented in common carp and mandarin fish; the most abundant gls1 mRNA was observed in white muscle [15] and hind kidney [16], respectively. These data presented the diversity of gls1 distribution pattern among species. In addition, the circadian rhythm of gls1 expression in TCC was studied in this experiment. There was a downward trend from 9:00 to 15:00, and an upward trend from 15:00 to 21:00. The highest expression was observed at 9:00. Early studies discovered that mRNA level of gls1 increased significantly during starvation [32], which could explain why the highest gls1 mRNA level was found at 9:00, nearly 17 h after the last meal. Also, the increased expression levels of gls1 at 18:00 and 21:00 could be attributed to the feeding conditions. During the sampling period, experimental fish were fed at 9:00 and 15:00 using a commercial diet, just as the acclimation phase. gls1 expression levels can be upregulated by nutrient substances, such as protein in the diet [33]. Therefore, the gls1 mRNA level was higher at 18:00 and 21:00, which are affected by feeding. Furthermore, the highest gls1 expression level at 9:00 can be explained by the muscle glutamate content change model. Several studies have revealed that, after starvation, the glutamate content of muscle decreases [34,35], and the content of glutamate has a negative feedback regulation on the expression level of gls1 [12,36]. The results of this experiment also verified this view. Therefore, 9:00 may be the time when muscle glutamate content is the lowest and gls1 expression is the highest during the day. However, the expression condition of gls1 at 18:00 and 21:00 seems to be explained only by ingestion status. Light exposure does not affect gls1 expression, as gls1 expression was almost comparable at 3:00, 6:00, 15:00, and 24:00.
With the increasing demand for aquatic products, aquaculture has become the main source of fish consumer goods [37]. And diet is the primary source of nutrients for cultured fish. Therefore, dietary nutrition has a prominent impact on the growth, physiological status and muscle quality of fish. In the present study, gls1 expression increased as the dietary protein level increased from 26% to 32%. However, as dietary protein levels improved further, gls1 expression decreased. A similar outcome was observed in the research of Kobayashi et al. [38]. The muscle GLS activity and gls mRNA expression of chicks fed with a high-protein diet for 10 days were significantly decreased compared to those in the control group. Interestingly, the decrease of gls expression may not be indirectly regulated by dietary protein, but rather by the feedback inhibition of glutamate, because the glutamate content of muscle in the high protein diet group is significantly higher than that in the control group. This viewpoint is supported by glutamate experiments presented in this paper. Low glutamate concentration increased gls1 expression, while high glutamate concentration decreased gls1 expression, both at the cellular and individual levels. A similar conclusion was also observed by Kuttykrishnan et al. [33]. They discovered that the effect of high protein diets on kidney GLS activity in mice was caused by the acidic effect of high protein intake rather than the high protein content of diets. Dietary protein sources significantly affected gls1 expression in the current study. The control group had the highest expression level of gls1, which could be related to the nutrient absorption condition of TCC. Because the control group used a mixture of animal and plant protein, the composition of nutrients (such as amino acid composition) is more balanced and conducive to fish absorption. Excellent nutrient absorption conditions lead to better muscle nutrient composition. Appropriate muscle nutrient composition may improve the transcription level of gls1. In addition, TCC is a typical omnivorous fish. Compared with the animal protein source of fish meal group or the plant protein source of soybean meal group, the control diet contains both animal protein and plant protein is more in line with natural feeding habits of TCC. Therefore, the dietary nutrition of control group may better suit TCC absorption and utilization. Furthermore, the regulation mechanism of dietary protein nutrition on gls1 needs to be investigated further.
One of the ten indispensable amino acids in fish, lysine, is often the first limiting amino acid in fish diets [39]. Glutamate is also an important amino acid in fish. Besides its important role in protein synthesis, it has multiple important functions [6,25]. In this study, we applied lysine-glutamate dipeptides into experimental diets, as the dipeptides are better for absorption and utilization in the fish intestine than amino acid monomers [40,41]. With the increase of dipeptide addition in diets, the expression of gls1 decreased first and then increased; the control group and 2.00% dipeptide group reached the highest value. Mai et al. [42] reported that muscle glutamate of juvenile Japanese seabass (Lateolabrax japonicus) decreased with the increase of dietary lysine. In this experiment, lysine-glutamate dipeptides may affect the expression of gls1 by regulating glutamate content in TCC muscle. While, the specific mechanism needs to be investigated, for example, by testing the effect of dietary dipeptides on plasma composition, muscle metabolome and muscle amino acid composition.

5. Conclusions

In this study, we cloned the gls1 cDNA from TCC, which encoded a 540 amino acid protein. In all tissues studied, the highest expression of gls1 gene was found in the brain. Circadian expression pattern showed that the peak expression of gls1 was observed at 9:00 a.m. The gls1 expression was increased by 32% protein diet, as well as mixed protein sources. The concentration of 0.10 mg/mL in vivo and 2.00% in vitro of glutamate significantly improved the expression of gls1. While 0.80–1.60% concentration of dietary lysine-glutamate dipeptide reduced the gls1 expression.
In summary, the results in this study provide new insights for the regulation of gls1 mRNA expression in teleost fish, which may shed light on the optimization of dietary formulas and the improvement of fish fillet flavor.

Author Contributions

Y.X.: Author. R.H.: Conducted biochemical analysis. S.C.: Drafted paper. D.Z.: Assisted gene cloning. C.X. and Z.X.: Performed the feeding trial. X.Z. (Xinran Zhang), X.Z. (Xiaomei Zhou), Y.Z.: Biochemical analysis. Z.M.: Cell culture. J.T. and J.J.: Provided technical assistance. Y.L. and J.Z.: Major study adviser. Z.L.: Designed the experiments. All authors have read and agreed to the published version of the manuscript.

Funding

This work was supported by the National Natural Science Foundation of China (Grant No. U19A2041 and 32102813), Hunan Provincial Natural Science Foundation of China (Grant No. 2021JJ40627 and 2019JJ50687), Changsha Municipal Natural Science Foundation (Grant No. kq2007083), the State Key Laboratory of Freshwater Ecology and Biotechnology (Grant No. 2022FB08) and State Key Laboratory of Developmental Biology of Freshwater Fish (Grant No. 2021KF010).

Institutional Review Board Statement

Animal experiments: All procedures did comply with the ARRIVE guidelines and carried out in accordance with U.K. Animals (Scientific Procedures) Act, 1986 and associated guidelines.

Data Availability Statement

The data that support the findings of this study are available from the corresponding author upon reasonable request.

Conflicts of Interest

The authors have no conflict of interest to declare.

References

  1. Grigorakis, K.; Alexi, N.; Vasilaki, A.; Giogios, I.; Fountoulaki, E. Chemical quality and sensory profile of the Mediterranean farmed fish shi drum (Umbrina cirrosa) as affected by its dietary protein/fat levels. Ital. J. Anim. Sci. 2016, 15, 681–688. [Google Scholar] [CrossRef] [Green Version]
  2. Yang, G.; Jiang, W.; Chen, Y.; Hu, Y.; Kumar, V. Effect of oil source on growth performance, antioxidant capacity, fatty acid composition and fillet quality of juvenile grass carp (Ctenopharyngodon idella). Aquac. Nutr. 2020, 26, 1186–1197. [Google Scholar] [CrossRef]
  3. Hoffmann, K. What is quality? Definitions, measurement and evaluation of meat quality. Meat Focus Int. 1994, 3, 73–82. [Google Scholar]
  4. Becker, T. Consumer perception of fresh meat quality: A framework for analysis. Br. Food J. 2000, 102, 158–176. [Google Scholar] [CrossRef]
  5. Watanabe, G.; Kobayashi, H.; Shibata, M.; Kubota, M.; Kadowaki, M.; Fujimura, S. Reduction in dietary lysine increases muscle free amino acids through changes in protein metabolism in chickens. Poult. Sci. 2020, 99, 3102–3110. [Google Scholar] [CrossRef] [PubMed]
  6. Bigiani, A. Glutamate Receptors in Taste Receptor Cells. In Glutamate Receptors in Peripheral Tissue: Excitatory Transmission Outside the CNS; Springer: Boston, MA, USA, 2005. [Google Scholar]
  7. Halpern, B.P. Glutamate and the Flavor of Foods. J. Nutr. 2000, 130, 910S–914S. [Google Scholar] [CrossRef] [Green Version]
  8. Ballantyne, J.S. Amino acid metabolism. Fish Physiol. 2001, 20, 77–107. [Google Scholar]
  9. Blanco, E.; Campos-Sandoval, J.; Palomino, A.; Luque-Rojas, M.J.; Bilbao, A.; Suárez, J.; Márquez, J.; Fonseca, F. Cocaine modulates both glutaminase gene expression and glutaminase activity in the brain of cocaine-sensitized mice. Psychopharmacology 2012, 219, 933–944. [Google Scholar] [CrossRef]
  10. Curthoys, N.P.; Watford, M. Regulation of glutaminase activity and glutamine metabolism. Annu. Rev. Nutr. 1995, 15, 133–159. [Google Scholar] [CrossRef]
  11. Gómez-Fabre, P.; Aledo, J.C.; Castillo-Olivares, A.D.; Alonso, F.J.; Ignacio, N.; Campos, J.A.; Márquez, J. Molecular cloning, sequencing and expression studies of the human breast cancer cell glutaminase. Biochem. J. 2000, 345, 365. [Google Scholar] [CrossRef]
  12. Rosa, V.; Campos-Sandoval, J.A.; Martin-Rufian, M.; Cardona, C.; Mates, J.M.; Segura, J.A.; Alonso, F.J.; Marquez, J. A novel glutaminase isoform in mammalian tissues. Neurochem. Int. 2009, 55, 76–84. [Google Scholar] [CrossRef]
  13. Elgadi, K.M.; Meguid, R.A.; Qian, M.; Souba, W.W.; Abcouwer, S.F. Cloning and analysis of unique human glutaminase isoforms generated by tissue-specific alternative splicing. Physiol. Genom. 1999, 1, 51–62. [Google Scholar] [CrossRef]
  14. Pérez-Gómez, C.; Matés, J.; Gómez-Fabre, P.; Castillo-Olivares, A.D.; Alonso, F.J.; Márquez, J. Genomic organization and transcriptional analysis of the human l-glutaminase gene. Biochem. J. 2003, 370, 771. [Google Scholar] [CrossRef] [Green Version]
  15. Jiang, J.; Feng, L.; Liu, Y.; Jiang, W.D.; Hu, K.; Li, S.H.; Zhou, X.Q. Molecular cloning and expression of kidney-type glutaminase from common carp (Cyprinus carpio) and its up-regulation by glutamine in primary culture enterocyte. Aquac. Nutr. 2014, 20, 731–740. [Google Scholar] [CrossRef]
  16. Liu, S.; Li, N.; Lin, Q.; Liu, L.; Niu, Y.; Liang, H.; Huang, Z.; Fu, X. Glutaminase 1 in mandarin fish Siniperca chuatsi: Molecular characterization, expression pattern and function involving in virus replication. Aquaculture 2020, 519, 734924. [Google Scholar] [CrossRef]
  17. Cambier, S.; Gonzalez, P.; Mesmer-Dudons, N.; Brethes, D.; Fujimura, M.; Bourdineaud, J.P. Effects of dietary methylmercury on the zebrafish brain: Histological, mitochondrial, and gene transcription analyses. Biometals 2012, 25, 165–180. [Google Scholar] [CrossRef]
  18. Aledo, J.C.; Gomez-Fabre, P.M.; Olalla, L.; Marquez, J. Identification of two human glutaminase loci and tissue-specific expression of the two related genes. Mamm. Genome 2000, 11, 1107–1110. [Google Scholar] [CrossRef]
  19. Castell, L.; Vance, C.; Abbott, R.; Marquez, J.; Eggleton, P. Granule localization of glutaminase in human neutrophils and the consequence of glutamine utilization for neutrophil activity. J. Biol. Chem. 2004, 279, 13305–13310. [Google Scholar] [CrossRef] [Green Version]
  20. Masson, J.; Darmon, M.; Conjard, A.; Chuhma, N.; Ropert, N.; Thoby-Brisson, M.; Foutz, A.S.; Parrot, S.; Miller, G.M.; Jorisch, R. Mice lacking brain/kidney phosphate-activated glutaminase have impaired glutamatergic synaptic transmission, altered breathing, disorganized goal-directed behavior and die shortly after birth. Knock-Out and Glutamate Transmission. J. Neurosci. 2006, 26, 4660–4671. [Google Scholar] [CrossRef] [Green Version]
  21. Le, A.; Lane, A.; Hamaker, M.; Bose, S.; Gouw, A.; Barbi, J.; Tsukamoto, T.; Rojas, C.; Slusher, B.; Zhang, H. Glucose-independent glutamine metabolism via TCA cycling for proliferation and survival in B cells. Cell Metab. 2012, 15, 110–121. [Google Scholar] [CrossRef] [Green Version]
  22. Huang, F.; Zhang, Q.; Hong, M.; Lv, Q.; Tao, Z. Expression of glutaminase is upregulated in colorectal cancer and of clinical significance. Int. J. Clin. Exp. Pathol. 2014, 7, 1093. [Google Scholar] [PubMed]
  23. Mousumi, D.; Dayanand, A. Production and antioxidant attribute of L-glutaminase from Streptomyces enissocaesilis DMQ-24. Int. J. Latest Res. Sci. Technol. 2013, 2, 1–9. [Google Scholar]
  24. Kong, S.E.; Hall, J.C.; Cooper, D.; Mccauley, R.D. Glutamine-enriched parenteral nutrition regulates the activity and expression of intestinal glutaminase. Biochim. Biophys. Acta BBA-Gen. Subj. 2000, 1475, 67–75. [Google Scholar] [CrossRef] [PubMed]
  25. Marquez, J.; Tosina, M.; de la Rosa, V.; Segura, J.A.; Alonso, F.J.; Mates, J.M.; Campos-Sandoval, J.A. New insights into brain glutaminases: Beyond their role on glutamatergic transmission. Neurochem. Int. 2009, 55, 64–70. [Google Scholar] [CrossRef] [PubMed]
  26. Fontaine, K.A.; Camarda, R.; Lagunoff, M. Vaccinia Virus Requires Glutamine but Not Glucose for Efficient Replication. J. Virol. 2014, 88, 4366. [Google Scholar] [CrossRef] [Green Version]
  27. Amobonye, A.; Singh, S.; Pillai, S. Recent advances in microbial glutaminase production and applications—A concise review. Crit. Rev. Biotechnol. 2019, 39, 944–963. [Google Scholar] [CrossRef]
  28. Chen, S.; Wang, J.; Liu, S.J.; Qin, Q.B.; Xiao, J.; Duan, W.; Luo, K.K.; Liu, J.H.; Liu, Y. Biological characteristics of an improved triploid crucian carp. Sci. China 2009, 52, 733–738. [Google Scholar] [CrossRef]
  29. Fu, Y.; Liang, X.; Li, D.; Gao, H.; Hu, F. Effect of Dietary Tryptophan on Growth, Intestinal Microbiota, and Intestinal Gene Expression in an Improved Triploid Crucian Carp. Front. Nutr. 2021, 8, 322. [Google Scholar] [CrossRef]
  30. Luo, W.; Qu, F.; Song, P.; Xiong, D.; Yin, Y.; Li, J.; Liu, Z. Molecular characterization and taurine regulation of two novel CDOs (CDO1 and CDO2) from Carassius auratus. Comp. Biochem. Physiol. B Biochem. Mol. Biol. 2019, 235, 54–61. [Google Scholar] [CrossRef]
  31. Livak, K.J.; Schmittgen, T.D. Analysis of Relative Gene Expression Data using Real-Time Quantitative PCR. Methods 2002, 25, 402–408. [Google Scholar] [CrossRef]
  32. Kong, S.E.; Hall, J.C.; Cooper, D.; McCauley, R.D. Starvation alters the activity and mRNA level of glutaminase and glutamine synthetase in the rat intestine. J. Nutr. Biochem. 2000, 11, 393–400. [Google Scholar] [CrossRef]
  33. Kuttykrishnan, C.; Santhanam, K.; Rao, R.; Vijayaraghavan, P.K. Effect of dietary protein quality on rat kidney glutaminase activity. Ann. Nutr. Metab. 1981, 25, 151–157. [Google Scholar] [CrossRef]
  34. Viana, M.T.; D’Abramo, L.R.; Gonzalez, M.A.; García-Suárez, J.V.; Shimada, A.; Vásquez-Peláez, C. Energy and nutrient utilization of juvenile green abalone (Haliotis fulgens) during starvation. Aquaculture 2007, 264, 323–329. [Google Scholar] [CrossRef]
  35. Shiau, C.Y.; Pong, Y.J.; Chiou, T.K.; Tin, Y.Y. Effect of starvation on free histidine and amino acids in white muscle of milkfish Chanos chanos. Comp. Biochem. Physiol. Part B Biochem. Mol. Biol. 2001, 128, 501–506. [Google Scholar] [CrossRef]
  36. Pérez-Gómez, C.; Matés, J.; Gómez-Fabre, P.; Castillo-Olivares, A.D.; Alonso, F.J.; Márquez, J. Co-expression of glutaminase K and L isoenzymes in human tumour cells. Biochem. J. 2005, 386, 535–542. [Google Scholar] [CrossRef] [Green Version]
  37. FAO. The State of World Fisheries and Aquaculture 2020; FAO: Rome, Italy, 2020. [Google Scholar]
  38. Kobayashi, H.; Eguchi, A.; Takano, W.; Shibata, M.; Kadowaki, M.; Fujimura, S. Regulation of muscular glutamate metabolism by high-protein diet in broiler chicks. Anim. Sci. J. 2011, 82, 86–92. [Google Scholar] [CrossRef]
  39. Deng, D.F.; Dominy, W.; Ju, Z.Y.; Koshio, S.; Murashige, R.; Wilson, R.P. Dietary lysine requirement of juvenile Pacific threadfin (Polydactylus sexfilis). Aquaculture 2010, 308, 44–48. [Google Scholar] [CrossRef]
  40. Daniel, H. Molecular and integrative physiology of intestinal peptide transport. Annu. Rev. Physiol. 2004, 66, 361–384. [Google Scholar] [CrossRef]
  41. Gilbert, E.R.; Wong, E.A.; Webb, K.E. Board-invited review: Peptide absorption and utilization: Implications for animal nutrition and health. J. Anim. Sci. 2008, 86, 2135–2155. [Google Scholar] [CrossRef]
  42. Mai, K.; Lu, Z.; Ai, Q.; Duan, Q.; Zhang, C.; Li, H.; Wan, J.; Liufu, Z. Dietary lysine requirement of juvenile Japanese seabass, Lateolabrax japonicus. Aquaculture 2006, 258, 535–542. [Google Scholar] [CrossRef]
Figure 1. Nucleotide sequence and deduced amino acid sequences of the gls1 from TCC. Numbers to the left refer to nucleotides and amino acids positions. The “*” indicates the termination code. (GenBank accession number is MW435571).
Fishes 07 00377 g001
Figure 2. Neighbor-joining phylogenetic tree of TCC gls1. The GenBank accessions numbers are: Sinocyclocheilus rhinocerous XP_016426105.1, Cyprinus carpio ADB02907.1, Danio rerio NP_001038509.1, Acanthopagrus latus XP_036946949.1, Puntigrus tetrazona XP_043079425.1, Pimephales promelas XP_039538560.1, Pygocentrus nattereri XP_037390573.1, Colossoma macropomum XP_036417964.1, Pangasianodon hypophthalmus XP_026766287.2, Electrophorus electricus XP_035377023.1, Tachysurus fulvidraco XP_027016628.1, Scleropages formosus XP_018599377.1, Homo sapiens NP_055720.3, Mus musculus NP_001074550.1, Bos taurus AAI26538.1, Canis lupus familiaris XP_038303348.1. The “*” indicates the gls1 of TCC.
Fishes 07 00377 g002
Figure 3. The relative expression of TCC gls1 in the heart, gut, liver, brain, kidney, spleen, and muscle. Different letters represent significant difference (p < 0.05, n = 9 for each bar).
Fishes 07 00377 g003
Figure 4. Circadian rhythm analysis of gls1 mRNA expression in TCC muscle. Different letters represent significant difference (p < 0.05, n = 9 for each bar).
Fishes 07 00377 g004
Figure 5. Effect of diets with different protein levels on TCC gls1 gene expression (mean ± SE of relative expression; n = 9). Different letters represent significant difference (p < 0.05).
Fishes 07 00377 g005
Figure 6. Effect of diets with different protein sources on TCC gls1 gene expression (mean ± SE of relative expression; n = 9). Different letters represent significant difference (p < 0.05).
Fishes 07 00377 g006
Figure 7. The effects of Glu on TCC gls1 gene expression in the primary culture muscle cells. Different letters represent significant difference (p < 0.05, n = 9 for each bar).
Fishes 07 00377 g007
Figure 8. TCC gls1 gene expression with different supplemental glutamate (mean ± SE of relative expression; n = 9). Different letters represent significant difference (p < 0.05).
Fishes 07 00377 g008
Figure 9. TCC gls1 gene expression with different supplemental lysine-glutamate peptide (mean ± SE of relative expression; n = 9). Different letters represent significant difference (p < 0.05).
Fishes 07 00377 g009
Table 1. Diet formulation of different protein levels (% dry matter).
Dietary Protein Levels
26%29%32%35%38%41%
Fishmeal 112.0012.0012.0012.0012.0012.00
Soybean meal 120.0020.0020.0020.0020.0020.00
Rapeseed meal 115.0015.0015.0015.0015.0015.00
Casein 10.003.206.509.8013.1016.40
Fish oil3.003.003.003.003.003.00
Soybean oi3.003.003.003.003.003.00
Corn starch25.0021.0016.8012.608.404.20
Wheat flour10.0010.0010.0010.0010.0010.00
Choline0.500.500.500.500.500.50
Premix 23.003.003.003.003.003.00
CMC3.003.003.003.003.003.00
Cellulose5.506.307.208.109.009.90
Total100.00100.00100.00100.00100.00100.00
Proximate composition
Crude protein26.0829.0032.0135.0338.0441.05
Crude lipid8.078.078.078.078.078.07
Gross energy (MJ/kg)18.0518.0618.0718.0818.0818.09
Moisture9.126.0110.058.195.757.26
Ash6.156.126.786.136.346.75
1 All of these ingredients were purchased from Hunan Zhenghong Science and Technology Develop Co., Ltd., Yueyang, China. 2 Vitamin and mineral premix (mg/kg diet): Vitamin B12, 0.02; folic acid, 5; calcium pantothenate, 50; inositol, 100; niacin, 100; biotin, 0.1; Vitamin B1, 20; Vitamin B2, 20; Vitamin B6, 20; Vitamin A, 11; Vitamin D, 2; Vitamin E, 50; Vitamin K, 10; Vitamin C, 100; cellulose, 3412; CaH2PO4·2H2O, 7650.6; FeSO4·7H2O, 2286.2; C6H10CaO6·5H2O, 1750.0; ZnSO4·7H2O, 178.0; NaCl, 500.0; MgSO4·7H2O, 8155.6; NaH2PO4·2H2O, 12,500.0; KH2PO4, 16,000.0; MnSO4·H2O, 61.4; CuSO4·5H2O, 15.5; CoSO4·7H2O, 0.91; KI, 1.5; Na2SeO3, 0.60; Corn starch, 899.7.
Table 2. Formulation of different dietary protein sources (% dry matter).
IngredientsControl GroupFishmeal GroupSoybean Meal Group
Fishmeal 112.0044.400.00
Soybean meal 120.000.0037.10
Rapeseed meal 115.000.0015.00
Casein 16.500.006.50
Fish oil3.001.633.50
Soybean oil3.001.633.50
Cornstarch16.8031.0010.00
Wheat flour10.0010.0010.00
Choline0.500.500.50
Premix 23.003.003.00
CMC3.003.003.00
Cellulose7.204.847.90
Total100.00100.00100.00
Proximate composition
Crude protein32.0132.0532.03
Crude lipid8.078.058.06
Gross energy (MJ/kg)18.0718.0618.00
Moisture10.059.739.86
Ash6.789.115.65
1 All of these ingredients were purchased from Hunan Zhenghong Science and Technology Develop Co., Ltd., Yueyang, China. 2 Premix (mg/kg diet): As noted in Table 1.
Table 3. Diet formulation and chemical composition of the glutamate diets (% dry matter).
Dietary Glutamate Levels (%)
0.00.51.01.52.02.53.0
Glutamate 10.000.501.001.502.002.503.00
Fishmeal 22.002.002.002.002.002.002.00
Soybean meal 234.0034.0034.0034.0034.0034.0034.00
Rapeseed meal 223.6023.6023.6023.6023.6023.6023.60
Wheat flour 216.0016.0016.0016.0016.0016.0016.00
Fish oil2.002.002.002.002.002.002.00
Soybean oil2.502.502.502.502.502.502.50
Cornstarch6.006.006.006.006.006.006.00
Choline0.110.110.110.110.110.110.11
Premix 31.501.501.501.501.501.501.50
Methionine0.500.500.500.500.500.500.50
CMC3.003.003.003.003.003.003.00
Cellulose8.798.297.797.296.796.295.79
Total100.00100.00100.00100.00100.00100.00100.00
Proximate composition
Crude protein31.0231.5232.0232.5233.0233.5234.02
Crude lipid6.036.036.036.036.036.036.03
Moisture6.635.756.536.846.586.216.32
Ash5.665.795.635.705.305.555.62
1 Glutamate: Purchased from Henan Wan Bang Industrial Co., Ltd., Zhengzhou, China. 2 All of these ingredients were purchased from Hunan Zhenghong Science and Technology Develop Co., Ltd., Yueyang, China. 3 Premix (mg/kg diet): As noted above in Table 1.
Table 4. Diet formulation and chemical composition of the lysine-glutamate dipeptide diets (% dry matter).
Dietary Lysine-Glutamate Levels (%)
0.00.40.81.21.62.0
Fishmeal 112.0012.0012.0012.0012.0012.00
Soybean meal 120.0020.0020.0020.0020.0020.00
Rapeseed meal 115.0015.0015.0015.0015.0015.00
Casein 16.506.506.506.506.506.50
Fish oil3.003.003.003.003.003.00
Soybean oil3.003.003.003.003.003.00
Cornstarch16.8016.8016.8016.8016.8016.80
Wheat flour10.0010.0010.0010.0010.0010.00
Choline0.500.500.500.500.500.50
Premix 23.003.003.003.003.003.00
CMC3.003.003.003.003.003.00
Cellulose7.206.806.406.005.605.20
Lysine-glutamate 30.000.400.801.201.602.00
Total100.00100.00100.00100.00100.00100.00
Proximate composition
Crude protein32.0132.4132.8133.2133.6134.01
Crude lipid8.078.078.078.078.078.07
Moisture10.0512.319.809.7011.180.93
Ash6.786.486.976.546.777.15
1 All of these ingredients were purchased from Hunan Zhenghong Science and Technology Develop Co., Ltd., Yueyang, China. 2 Premix (mg/kg diet): As noted in Table 1. 3 Lysine-glutamate: purchased from Shanghai Acmec Biochemical Co., Ltd., Shanghai, China.
Table 5. Primers used for gls1 cloning and quantitative real-time PCR.
PrimerPrimer SequencePurpose
GLS-F5′-GACTGTCTAAAAAGCGGATT-3′CDS
GLS-R5′-ATGAGGCTACATTCTCCCGA-3′CDS
GLS-RT-F5′-TCTGCTTACTGGAGACCCTCG-3′Real-time PCR
GLS-RT-R5′-TTGCTTTGCACACACTTTTTG-3′Real-time PCR
β-actin-F5′-GAAACTGGAAAGGGAGGTAGC-3′Real-time PCR
β-actin-R5′-CTGTGAGGGCAGAGTGGTAGA-3′Real-time PCR
Publisher’s Note: MDPI stays neutral with regard to jurisdictional claims in published maps and institutional affiliations.

