Article

Magnetic Compton Scattering Study of Li-Rich Battery Materials

1
Graduate School of Science and Technology, Gunma University, Kiryu 376-8515, Japan
2
Japan Synchrotron Radiation Research Institute (JASRI), Sayo 679-5198, Japan
3
Graduate School of Human and Environmental Studies, Kyoto University, Kyoto 606-8501, Japan
4
Department of Chemistry and Life Science, Yokohama National University, Yokohama 240-8501, Japan
5
Department of Mechanical Engineering, Carnegie Mellon University, Pittsburgh, PA 15213, USA
6
Department of Applied Chemistry, Ritsumeikan University, Kusatsu 525-8577, Japan
7
Department of Physics, Northeastern University, Boston, MA 02115, USA
8
Department of Physics, School of Engineering Science, LUT University, 53850 Lappeenranta, Finland
*
Author to whom correspondence should be addressed.
Submission received: 11 November 2021 / Revised: 21 December 2021 / Accepted: 24 December 2021 / Published: 28 December 2021

Abstract

:
The redox process in a lithium-ion battery occurs when a conduction electron from the lithium anode is transferred to the redox orbital of the cathode. Understanding the nature of orbitals involved in anionic as well as cationic redox reactions is important for improving the capacity and energy density of Li-ion batteries. In this connection, we have obtained magnetic Compton profiles (MCPs) from the Li-rich cation-disordered rock-salt compound Li x Ti 0.4 Mn 0.4 O 2 (LTMO). The MCPs, which involved the scattering of circularly polarized hard X-rays, are given by the momentum density of all the unpaired spins in the material. The net magnetic moment in the ground state can be extracted from the area under the MCP, along with a SQUID measurement. Our analysis gives insight into the role of Mn 3 d magnetic electrons and O 2 p holes in the magnetic redox properties of LTMO.

1. Introduction

Lithium-rich disordered cathode materials, such as Li x Ti 0.4 Mn 0.4 O 2 (LTMO), are attracting a lot of current attention because their capacity can reach 300 mAhg 1 [1], which is significantly greater than that of the conventional cathode materials. For example, LiCoO 2 has a capacity of 140 mAhg 1 , and LiFePO 4 has a capacity of 170 mAhg 1 . Although the high capacity of the Li-rich cathode materials has been suggested to result from a combination of cationic and anionic redox processes [2], a fundamental understanding of the redox mechanism at play in Li-rich cathode materials is needed for optimizing their performance. Details of the anionic redox mechanisms are not fully understood because experiments that can directly probe redox orbitals are limited. In this connection, Hafiz et al. have reconstructed the orphaned O 2 p orbital of LTMO in momentum space by combining high-energy X-ray Compton scattering with accurate first-principles calculations [3]. This visualization was enabled by the bulk sensitivity of the Compton scattering technique. Studies of redox orbitals in other cathodes materials include LiCoO 2 [4], LiMn 2 O 4 [5,6], and LiFePO 4 [7]. Moreover, the imaging Compton technique has been applied to in operando and in situ measurements to monitor the lithiation state of commercial batteries, see Ref. [8] and references therein. There are fundamental difficulties in visualizing redox orbitals using X-ray photoemission spectroscopy (XPS) [9], soft X-ray absorption (XAS) [10], and X-ray resonant inelastic scattering (RIXS) [11] since these techniques are surface sensitive.
Hafiz et al. [3] have shown that the orphaned O 2 p states giving anionic redox do not hybridize with the Mn 3 d orbitals. Moreover, both Mn 3 d and O 2 p can carry a net moment, while the Ti/Li ions do not carry significant magnetic moments. Thus, a fundamental understanding of these magnetic properties can provide further insight into the redox processes [12,13,14]. Interestingly, one can take advantage of the net magnetization to extract unique orbital information in manganese oxides materials via magnetic Compton scattering experiments [15,16]. In this way, Ref. [6] discusses the nature of the unpaired Mn 3 d magnetic orbitals in the spinel Li x Mn 2 O 4 (LMO) cathode material. Here, along the same lines, we extract both the Mn 3 d and O 2 p spin momentum densities and the corresponding net magnetic moments. LTMO, such as LMO, becomes ferrimagnetic in the presence of lithium vacancies and develops a small net magnetic moment [6]. Therefore, through magnetic Compton scattering, we can extract further details concerning the magnetic electron involved in the anionic redox process in LTMO. Notably, the X-ray scattering cross-section from magnetic electrons is two orders of magnitude smaller than in the charge scattering channel. Therefore, magnetic Compton scattering experiments in battery materials have only become practical in recent years via the use of circularly polarized light at high energy, high-intensity synchrotron sources, such as SPring-8 in Japan.

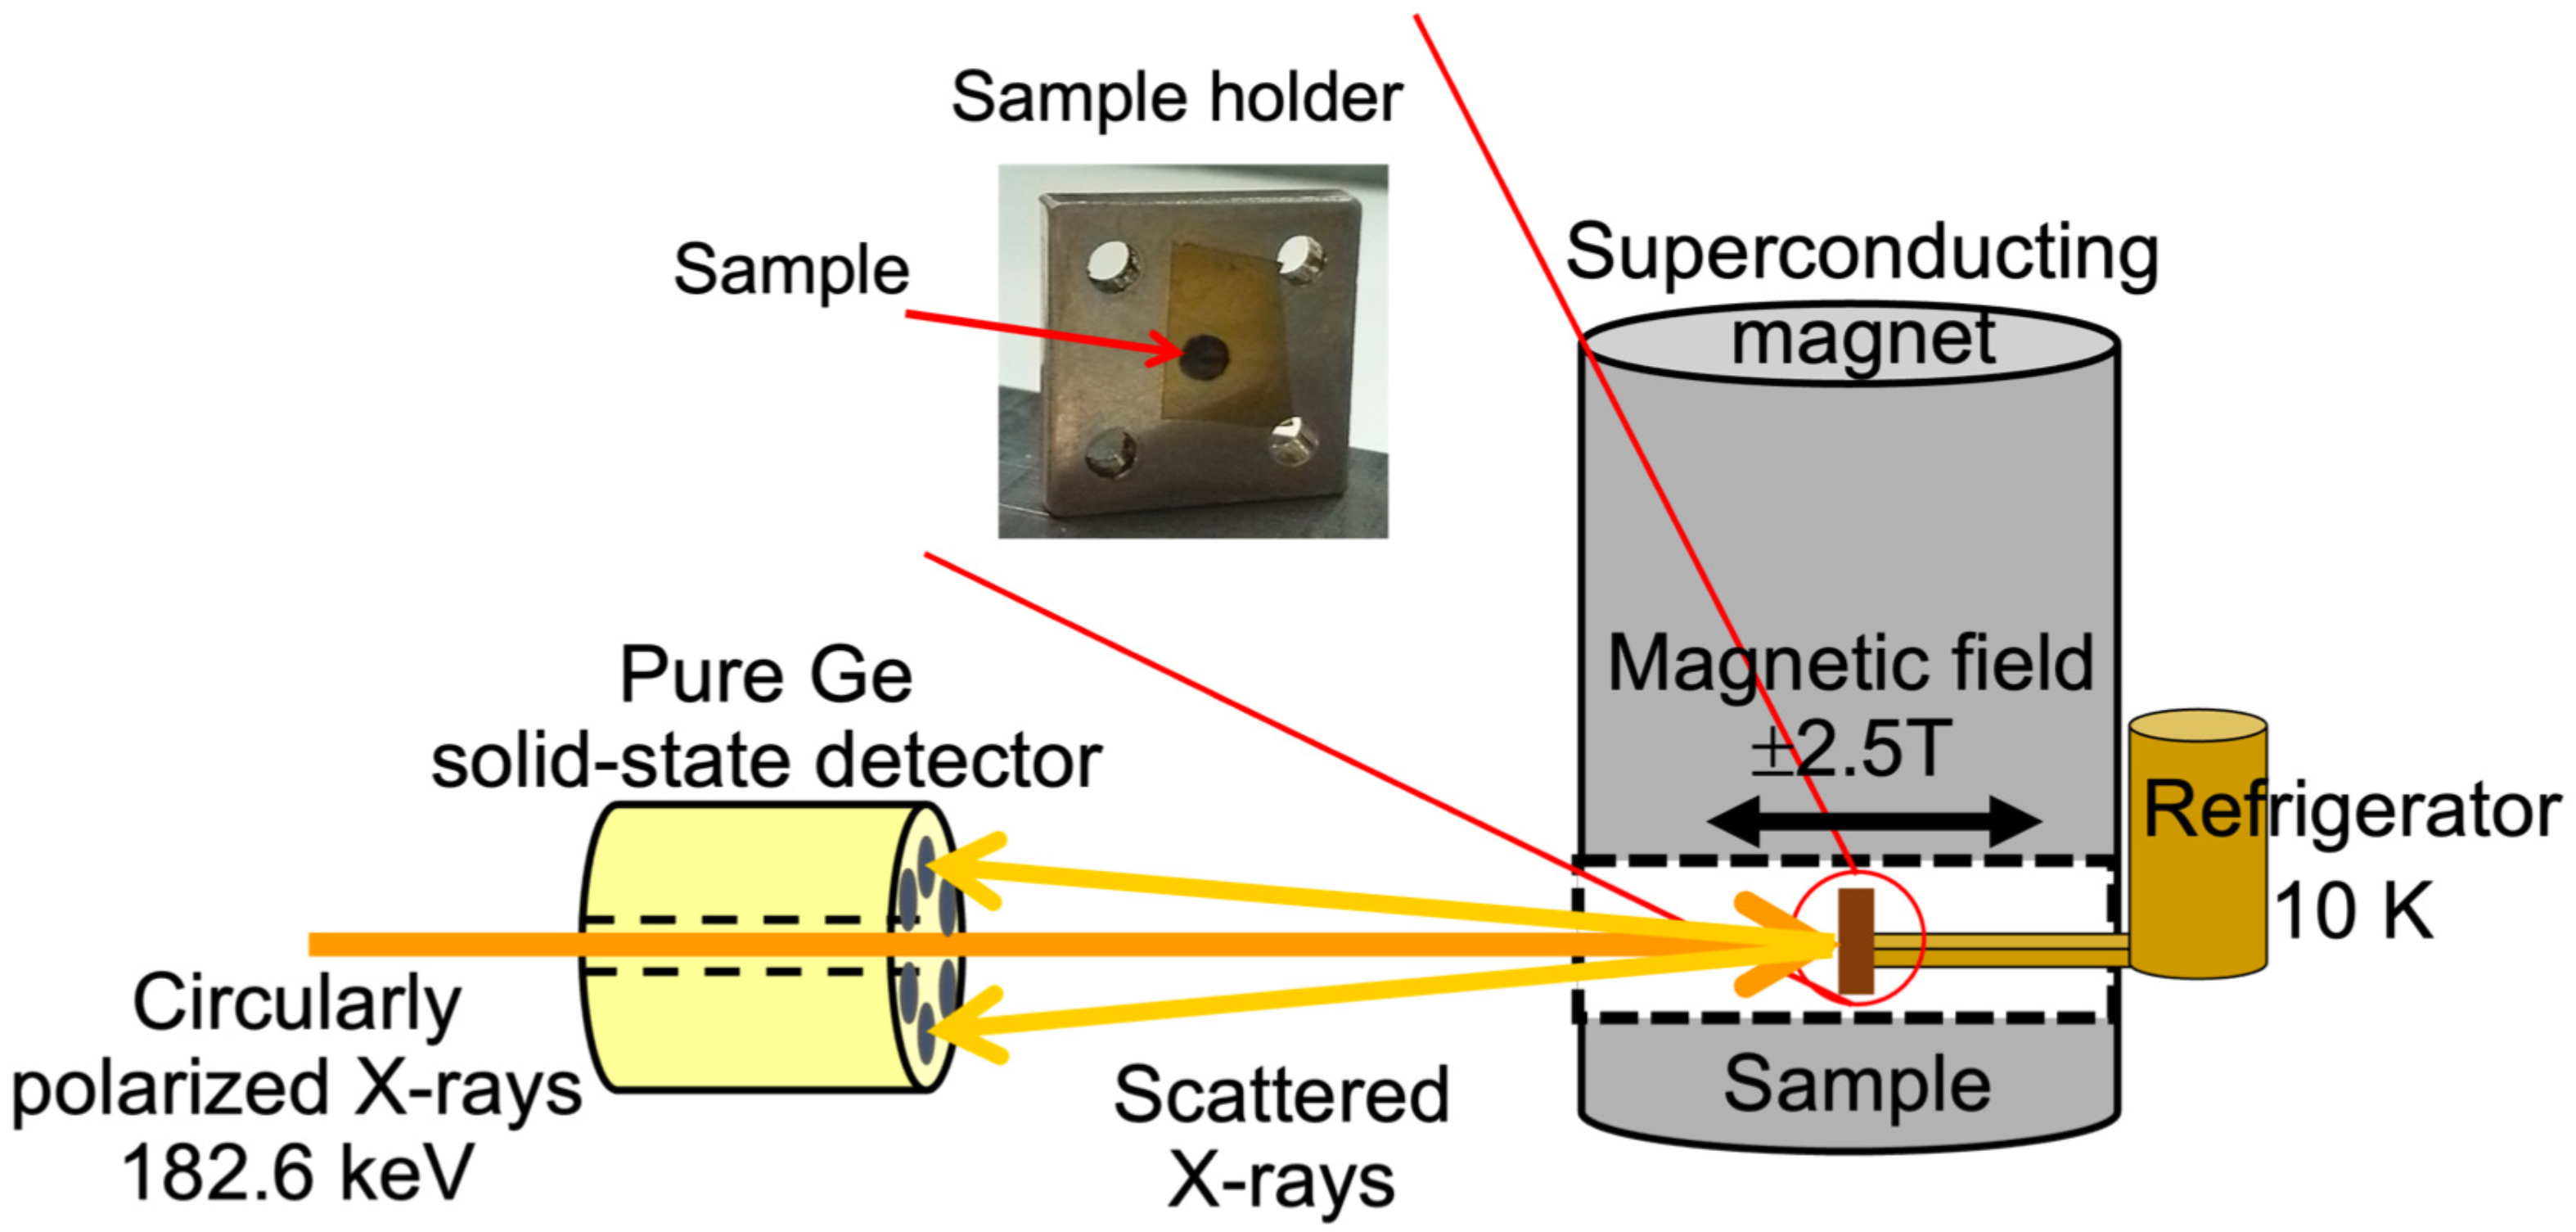
2. Materials and Methods

Polycrystalline LTMO samples were prepared starting with a mixture of Li 2 CO 3 , TiO 2 (Wako Pure Chemical Industries, Tokyo, Japan) and Mn 2 O 3 starting materials [17], which was heated at 900 C for 12 h in an inert atmosphere. The resulting LTMO powder was remixed with 10 wt% of acetylene black. The LTMO samples for lithium concentrations x = 0, 0.4, and 0.8 were then prepared through chemical oxidation using an oxidizing agent. The X-ray diffraction patterns, see Figure S1 of Supplementary Material, show that the samples have a single rock-salt-type structure. Magnetization curves for the samples were obtained using a SQUID magnetometer (MPMS5-SW, Quantum Design, Inc., Tokyo, Japan). The measurements were carried out at around 10 K by scanning the magnetic field from −5 T to 5 T. The magnetization curves for various lithium concentrations are shown in the Supplementary Materials.
Magnetic Compton profiles were measured at high-energy inelastic scattering beamline 08W of SPring-8, Japan [18,19]. The experimental setup is shown in Figure 1. Circularly polarized 182.6 keV X-rays (circularly polarization factor p c is ≃ 0.55), which were emitted from an elliptical multipole wiggler, irradiate the sample. The size of the incident X-ray beam at the sample position is a 1 mm square, which is formed by the incident slit. The scattering angle is fixed at 178 degrees. The Compton-scattered X-rays were measured with 10 independent pure Ge solid-state detectors. The measurements were performed by applying a magnetic field of ± 2.5 T to the sample at 10 K in a vacuum atmosphere. The magnetic Compton profile J m a g ( p z ) is related to the spin momentum density as follows [20]:
J m a g p z = ρ ( p ) ρ ( p ) d p x d p y
where p = ( p x , p y , p z ) is the electron momentum, and ρ ( p ) and ρ ( p ) are the momentum densities of the majority and minority spins, respectively. The ρ σ ( p ) can be written as
ρ σ ( p ) = i n σ i | Φ i ( p , σ ) | 2
Φ i ( p , σ ) = ψ i ( r , σ ) exp ( i p · r ) d 3 r
where σ is the spin, Φ i ( p , σ ) is an electron wavefunction in momentum space, ψ i ( r , σ ) is the wavefunction in real space and n σ i is the occupation number. Equations (1)–(3) show how the magnetic Compton profile J m a g ( p z ) is directly related to wavefunctions of the magnetic electrons and the spin-resolved electronic structure of the magnetic materials.

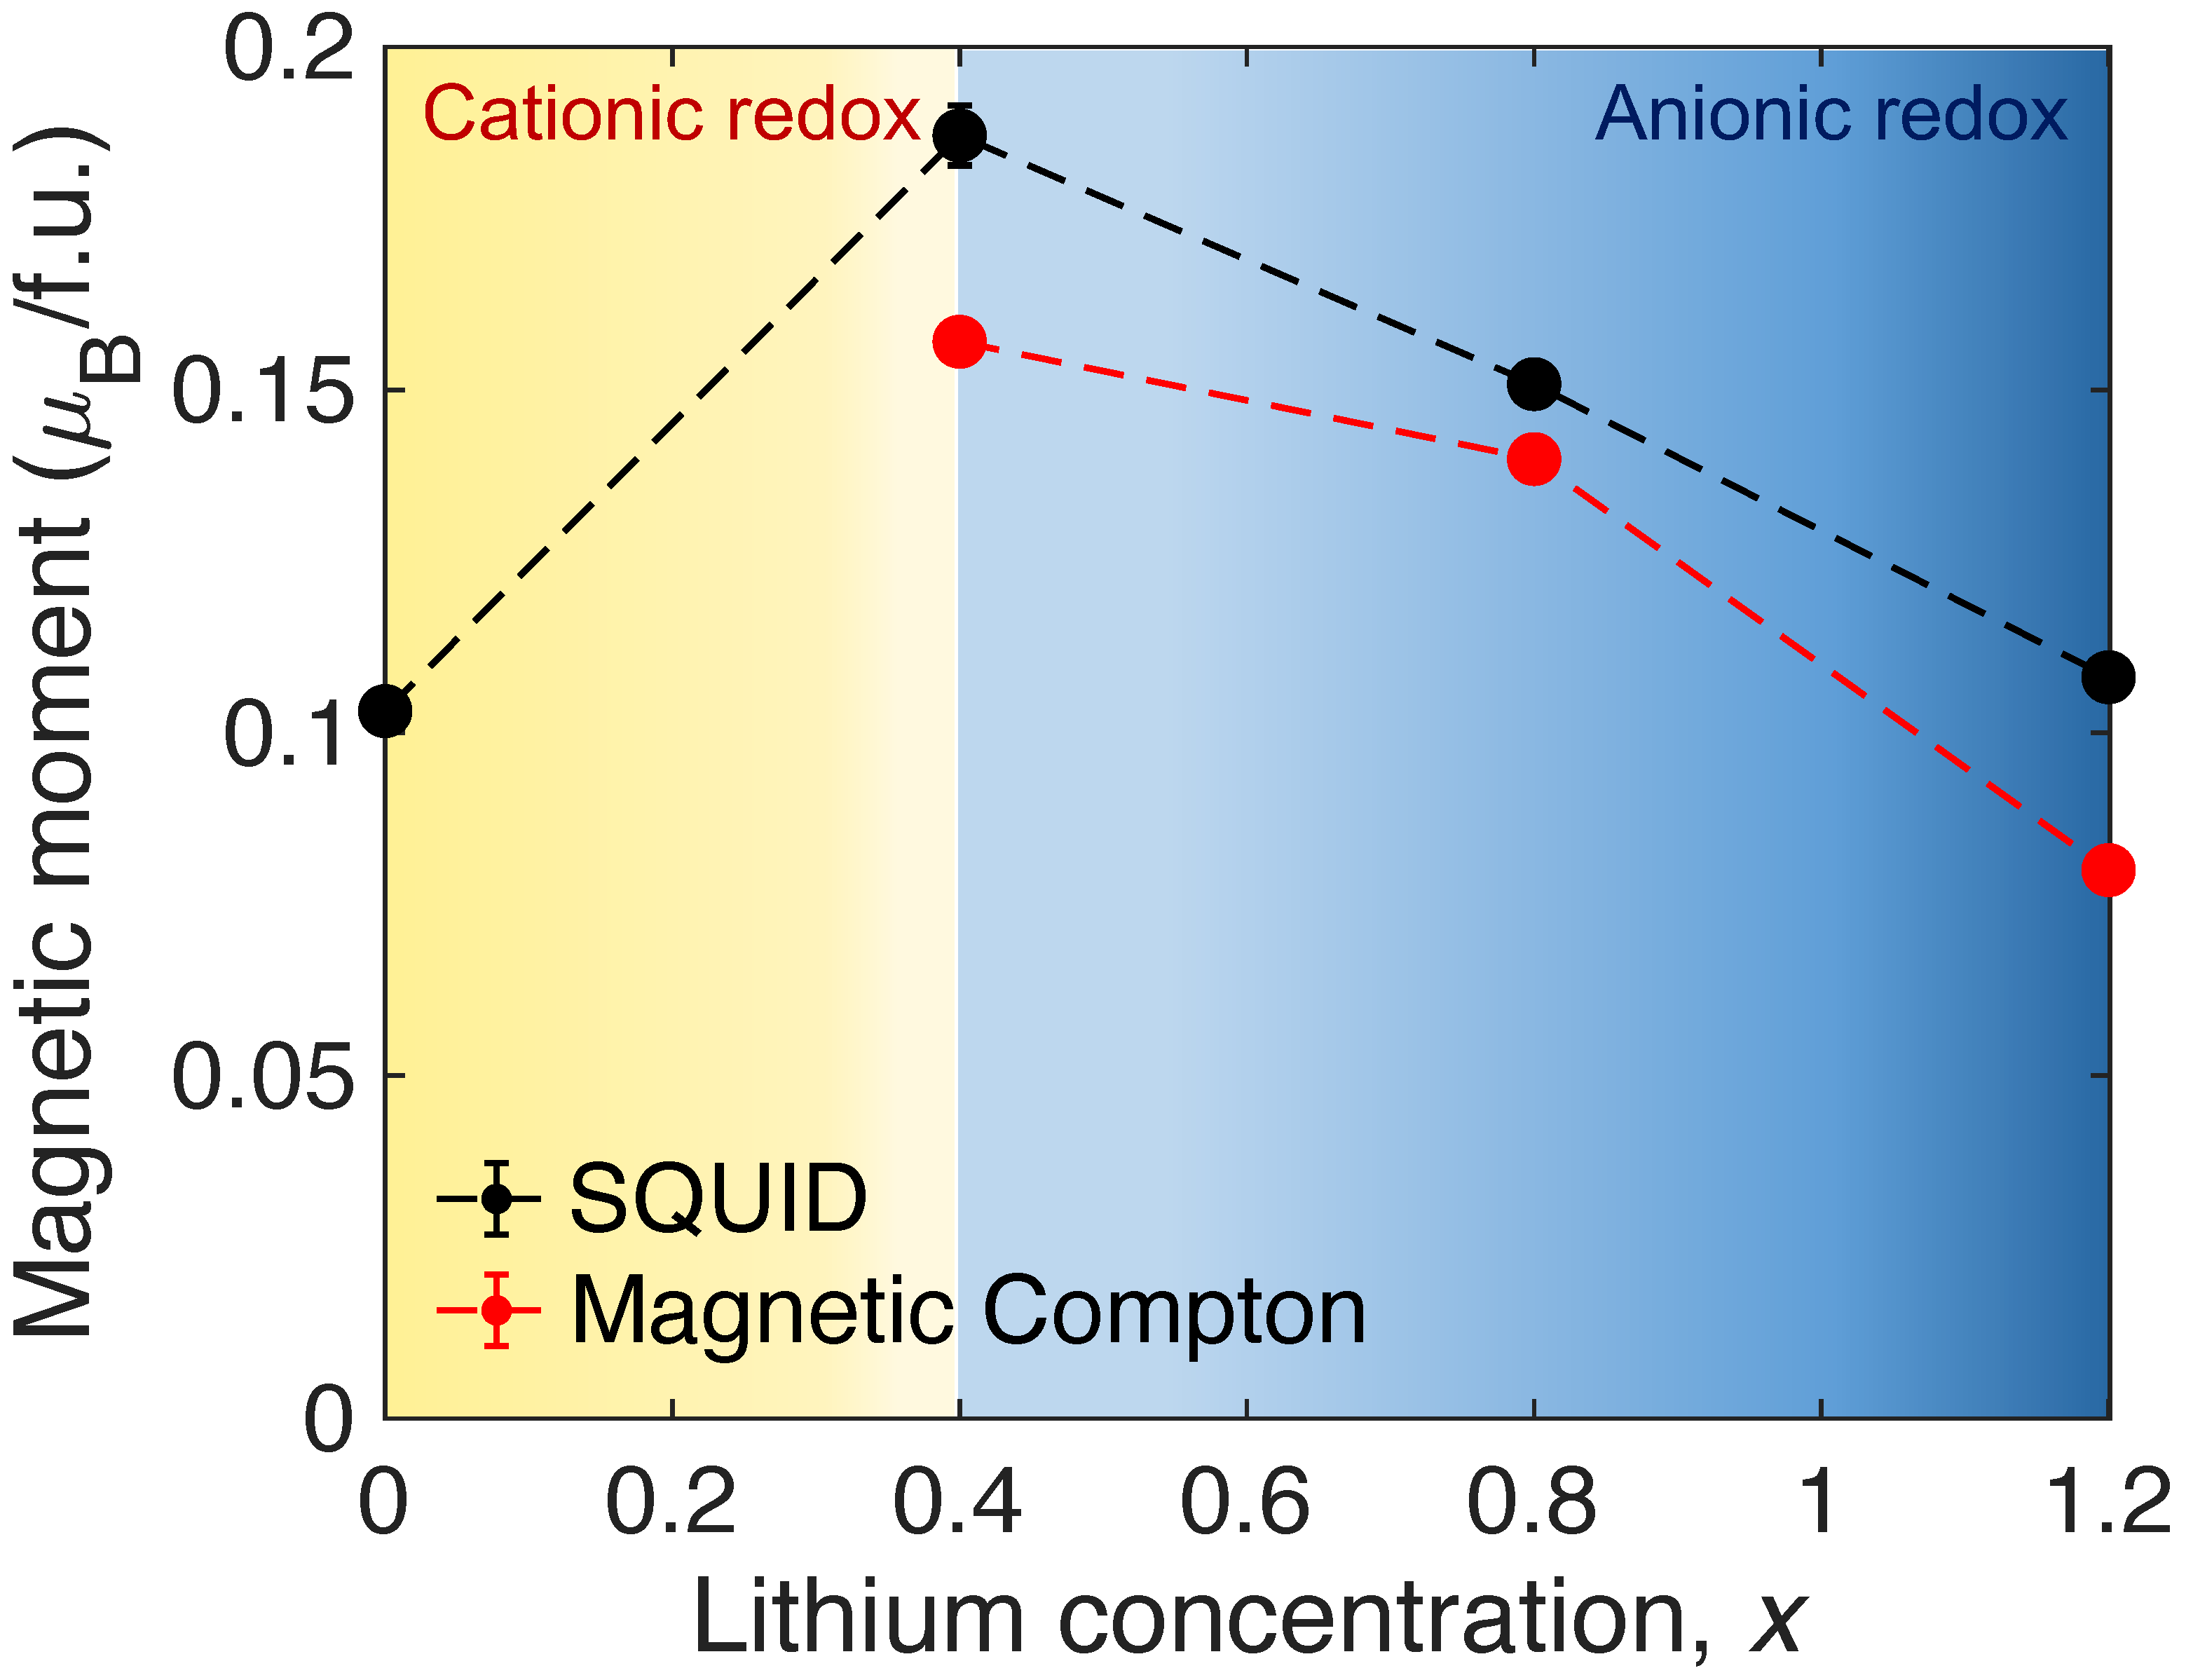
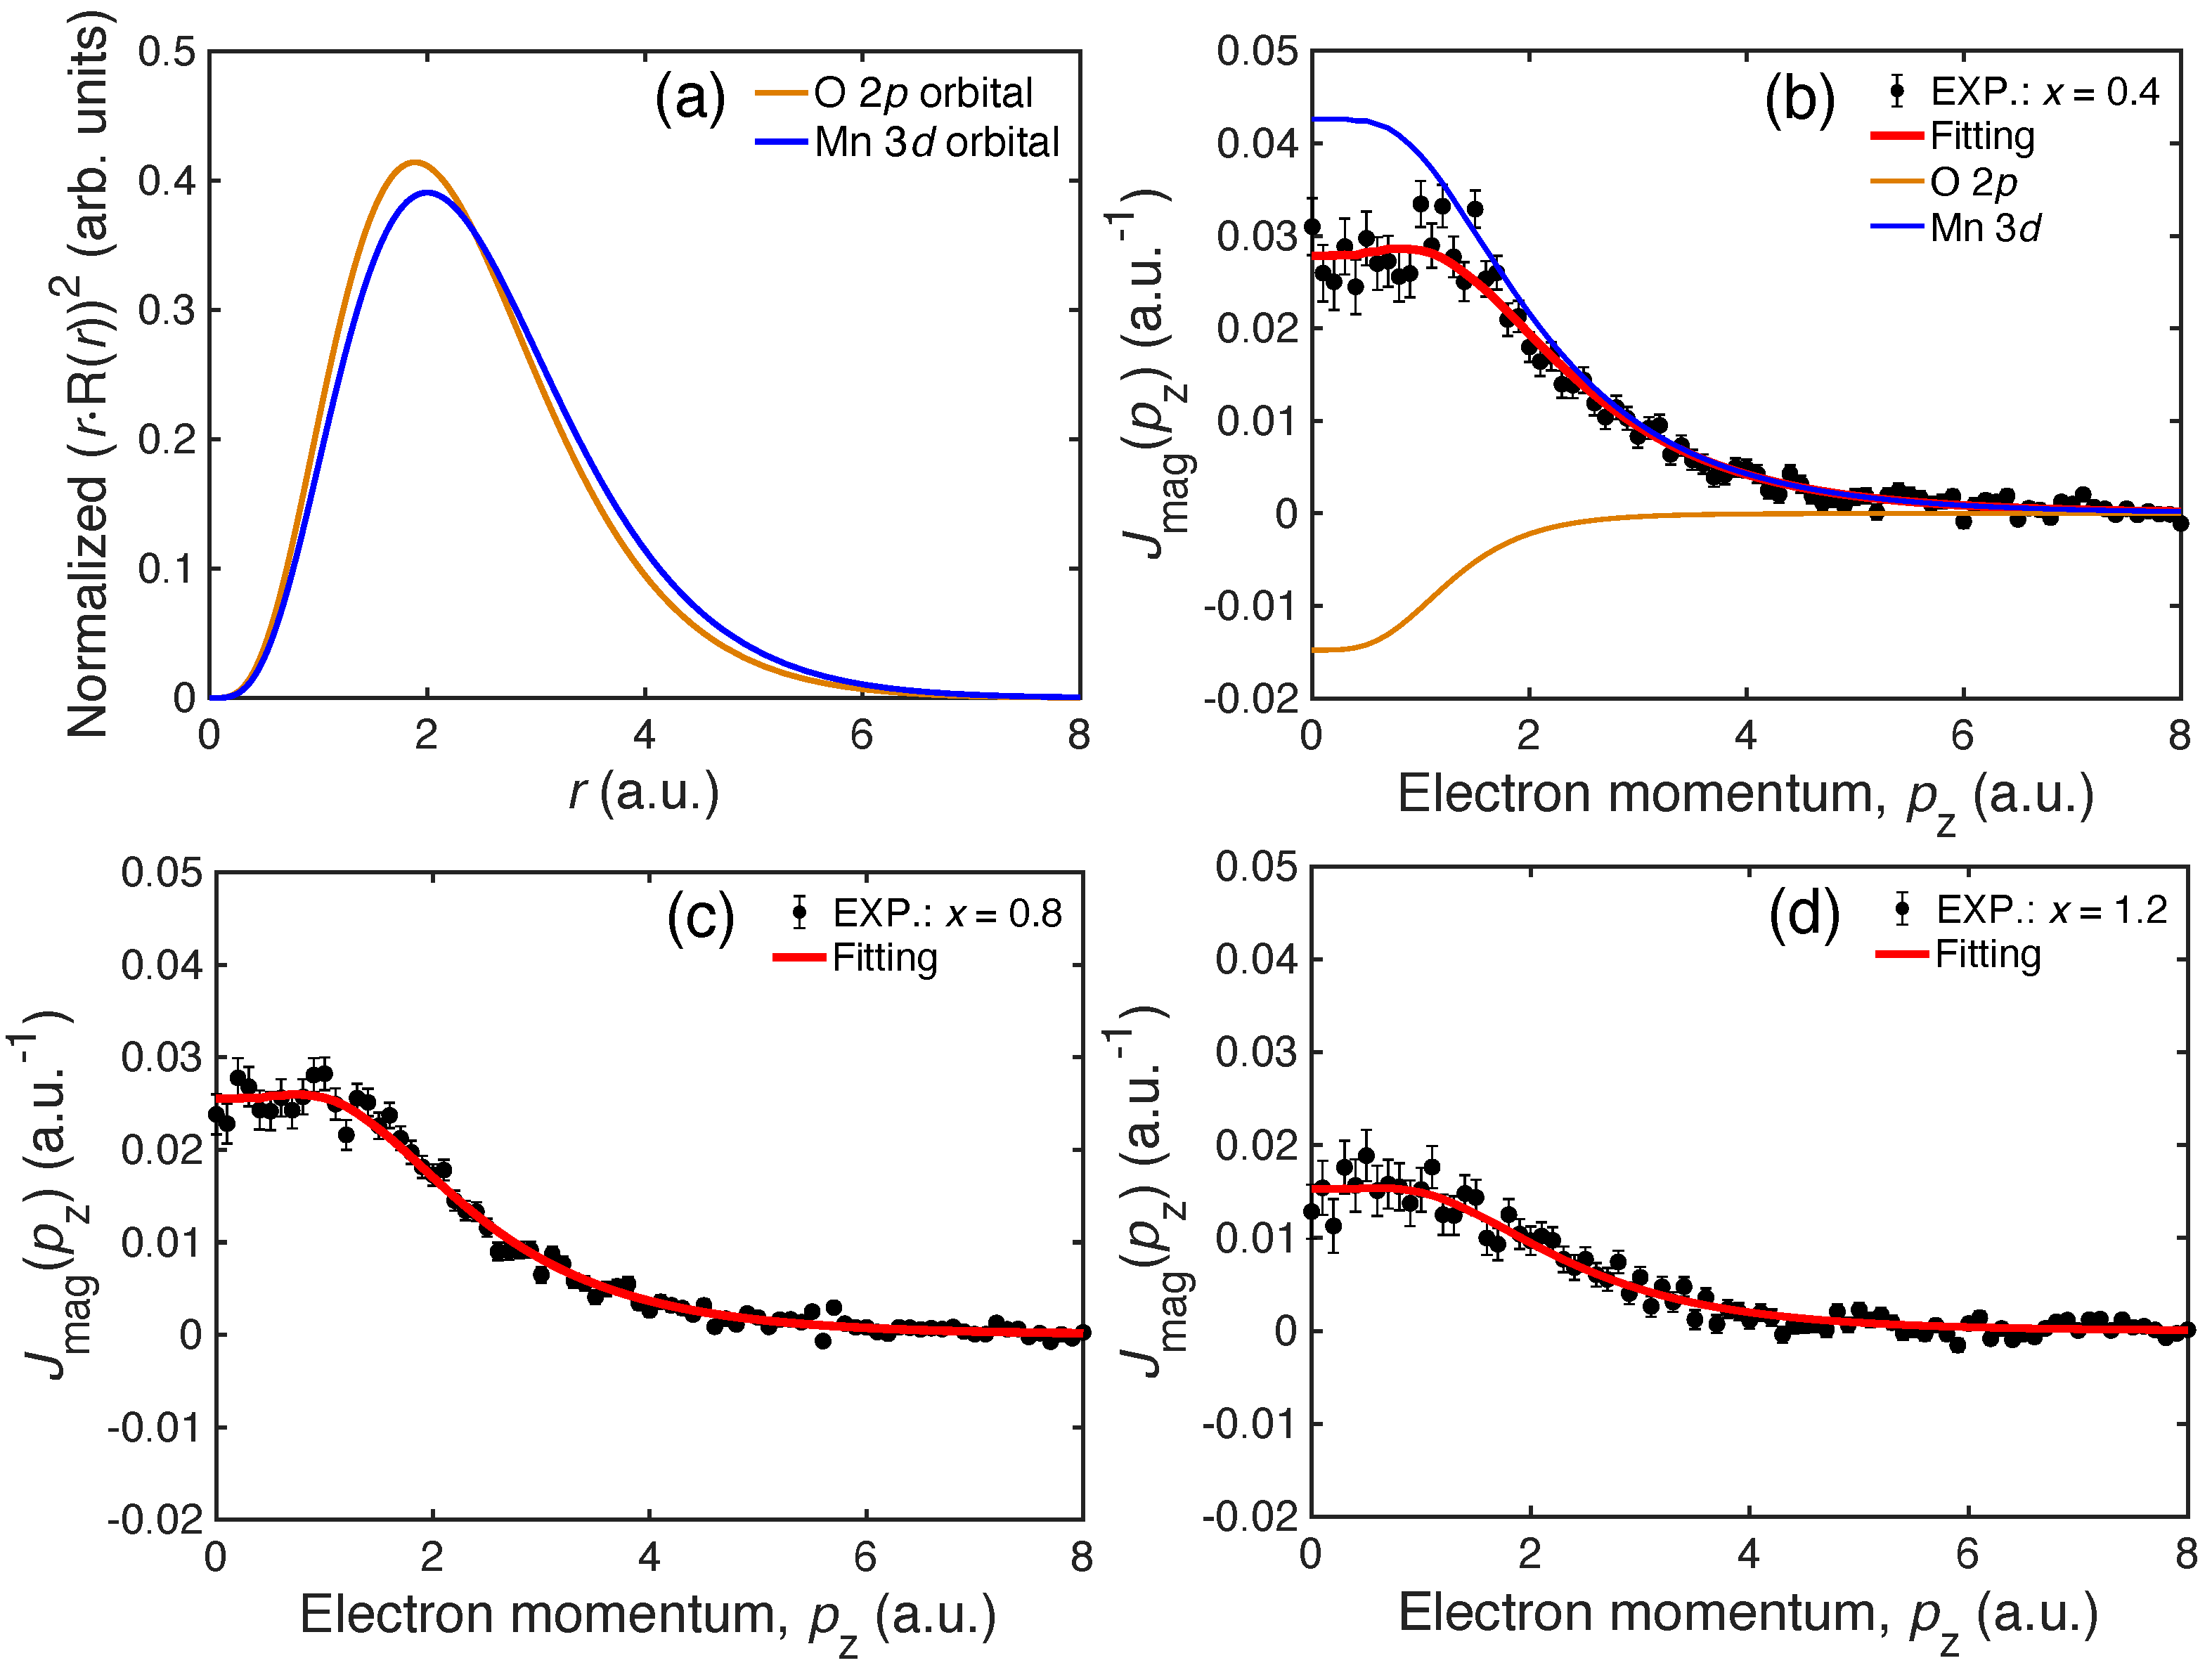
3. Results and Discussions

Figure 2 shows the spin magnetic moments and the total magnetic moments of LTMO ( x = 0, 0.4, 0.8 and 1.2) obtained via the magnetic Compton scattering technique and SQUID magnetometry. The yellow and blue background colors separate the cationic and the anionic redox regions, respectively [1]. The cationic redox reaction dominates over the lithium concentration range 0 < x < 0.4 , while the anionic redox dominates for 0.4 < x < 1.2 [17]. The total magnetic moments obtained from SQUID magnetometry are extracted from the magnetization corresponding to a magnetic field of 2.5 T. These results can be compared to the spin magnetic moment extracted from the magnetic Compton profile using the sum rule:
m = J m a g ( p z ) d p z .
These spin magnetic moments obtained from Compton profiles reproduce the total magnetic moments obtained from SQUID measurements well. A slight difference between the spin magnetic moments and the total magnetic moments comes from the orbital contribution to the total moments. The magnetic moments in Figure 2 are seen to increase with Li concentration in the cationic regime, which is also found to be the case in spinel cathode materials [6]. Interestingly, the magnetic moment decreases with the addition of Li in the anionic regime. The crossover between these two distinct trends occurs around x = 0.4. This can be rationalized as follows. At a low Li concentration (0 < x < 0.4), a valence electron from the Li 2 p shell is transferred into a Mn 3 d molecular orbital, which increases the magnetic moment of the Mn site involved in cationic redox. This trend is consistent with the cationic behavior of LMO [6]. In contrast, for 0.4 < x < 1.2, a Li 2 p valence electron is transferred into a 2 p orbital of a magnetic O ion to initiate anionic redox. This oxygen reduction decreases the local spin moment of the O ion and produces a net decrease in the total magnetic moment. The small value of the measured magnetic moment (per Mn atom) in LTMO (< 0.2 μ B ) indicates that we have a similar magnetic configurations as that in LMO. Korringa–Kohn–Rostoker-coherent-potential-approximation (KKR-CPA) computations [21,22,23] in LMO suggest that magnetic properties can be described by a spin-glass-like behavior with randomly oriented Mn moments of about 3 μ B [5]; other calculations [6] show that weak ferrimagnetic states appear as soon as Li vacancies are present in the unit cell.
In order to extract atomic features driving the magnetic behavior in Figure 2, we have carried out a curve-fitting analysis of the magnetic Compton profiles, as illustrated in Figure 3b–d. Figure 3a shows radial distributions of the orphaned O 2 p orbital and Mn 3 d orbitals. The areas under the radial distributions are normalized to the same value. The magnetic Compton profiles are normalized by the spin magnetic moment for each Li concentration. The curve-fitting is performed by using:
m = J mag ( p z ) dp z = a J O 2 p ( p z ) dp z + b J Mn 3 d ( p z ) dp z ,
where a and b are weight parameters, and J O 2 p ( p z ) and J M n 3 d ( p z ) are the Compton profiles of O 2 p [3] and Mn 3 d [24] orbitals, respectively. Our analysis is based on DFT simulations [3], which show that electrons on the orphaned O 2 p , which occupies the B site of rock-salt-type structure, and Mn 3 d states, which partially occupy the A site of rock-salt-type structure, couple antiferromagnetically and that the magnetic contribution from Ti can be neglected. Table 1 summarizes the results of our fit.

4. Conclusions

We show that magnetic Compton scattering spectra measured under a magnetic field of 2.5 T allow access to the momentum density of unpaired spins of disordered lithium-rich cathode material Li x Ti 0.4 Mn 0.4 O 2 (LTMO) over a wide range of lithium concentrations x. The net moment increases in the cationic redox region (0 < x < 0.4), whereas it decreases in the anionic redox region (0.4 < x < 1.2). At a low Li concentration, a Li 2 p valence electron is transferred into a Mn 3 d molecular orbital to induce an increase in the Mn magnetic moment involved in cationic redox. In contrast, at a high Li concentration, the Li 2 p valence electron is transferred into a 2 p orbital of a magnetic O ion to initiate anionic redox, which produces a net decrease in the total magnetic moment. Our study provides conclusive evidence for the anionic redox mechanism in LTMO and suggests new avenues for designing high-energy-density cathodes for batteries.

Supplementary Materials

The following are available online at https://0-www-mdpi-com.brum.beds.ac.uk/article/10.3390/condmat7010004/s1. Figure S1: X-ray diffraction pattern of prepared Li 1.2 Ti 0.4 Mn 0.4 O 2 . Figure S2: Hysteresis curves for various lithium concentrations ( x ) obtained by a SQUID magnetometer. Measurements were performed at approximately 10K.

Author Contributions

Conceptualization, H.S., Y.U., Y.S., V.V., A.B. and B.B.; methodology, N.T., K.Y., N.Y., Y.O. (Yuki Orikasa), Y.U., and Y.S.; software, K.S., Y.O. (Yuji Otsuka), N.T. and Y.S.; validation, K.S., Y.O. (Yuji Otsuka), K.H., H.S., H.H. and B.B; formal analysis, K.S., Y.O. (Yuji Otsuka), K.H. and H.S.; investigation, K.S., H.S., H.H. and B.B.; resources, H.S., N.T., K.Y., N.Y., Y.O. (Yuki Orikasa), Y.U., V.V., A.B. and B.B.; data curation, K.S., Y.O. (Yuji Otsuka), K.H., H.S., H.H. and B.B.; writing original draft preparation, K.S., H.S, H.H. and B.B; writing review and editing, all authors; visualization, K.S., Y.O. (Yuji Otsuka), K.S, H.S., H.H. and B.B.; supervision, H.S., N.Y., Y.U., Y.S., V.V., A.B. and B.B.; project administration, B.B.; funding acquisition, K.S. and A.B. All authors have read and agreed to the published version of the manuscript.

Funding

This research was funded by JSPS KAKENHI grant number JP19K05519 and the U.S. Department of Energy (DOE), Office of Science, Basic Energy Sciences (Grant No. DE-FG02-07ER46352), and it also benefited from Northeastern University’s Advanced Scientific Computation Center (ASCC) and the NERSC Supercomputing Center through DOE (Grant No. DE-AC02-05CH11231).

Data Availability Statement

The data that support the findings of this study are available upon reasonable requests from the corresponding author.

Acknowledgments

K.S. was supported by JSPS KAKENHI Grant No. JP19K05519. Compton scattering experiments were performed with the approval of JASRI (Proposal No. 2020A0648). The SQUID measurement was performed with the approval of Gunma University-Industry Collaboration and Intellectual Property Strategy Center (Proposal 2020). The work at Northeastern University was supported by the U.S. Department of Energy (DOE), Office of Science, Basic Energy Sciences (Grant No. DE-FG02-07ER46352), and the paper benefited from Northeastern University’s Advanced Scientific Computation Center (ASCC) and the NERSC Supercomputing Center through DOE (Grant No. DE-AC02-05CH11231).

Conflicts of Interest

The authors declare no conflict of interest.

References

  1. Assat, G.; Tarascon, J.M. Fundamental understanding and practical challenges of anionic redox activity in Li-ion batteries. Nat. Energy 2018, 3, 373–386. [Google Scholar] [CrossRef]
  2. Okubo, M.; Yamada, A. Molecular orbital principles of oxygen-redox battery electrodes. ACS Appl. Mater. Interfaces 2017, 9, 36463–36472. [Google Scholar] [CrossRef]
  3. Hafiz, H.; Suzuki, K.; Barbiellini, B.; Tsuji, N.; Yabuuchi, N.; Yamamoto, K.; Orikasa, Y.; Uchimoto, Y.; Sakurai, Y.; Sakurai, H.; et al. Tomographic reconstruction of oxygen orbitals in lithium-rich battery materials. Nature 2021, 594, 213–216. [Google Scholar] [CrossRef] [PubMed]
  4. Barbiellini, B.; Suzuki, K.; Orikasa, Y.; Kaprzyk, S.; Itou, M.; Yamamoto, K.; Wang, Y.J.; Hafiz, H.; Yamada, R.; Uchimoto, Y.; et al. Identifying a descriptor for d-orbital delocalization in cathodes of Li batteries based on x-ray Compton scattering. Appl. Phys. Lett. 2016, 109, 073102. [Google Scholar] [CrossRef] [Green Version]
  5. Suzuki, K.; Barbiellini, B.; Orikasa, Y.; Go, N.; Sakurai, H.; Kaprzyk, S.; Itou, M.; Yamamoto, K.; Uchimoto, Y.; Wang, Y.J.; et al. Extracting the Redox Orbitals in Li Battery Materials with High-Resolution X-Ray Compton Scattering Spectroscopy. Phys. Rev. Lett. 2015, 114, 087401. [Google Scholar] [CrossRef] [PubMed] [Green Version]
  6. Hafiz, H.; Suzuki, K.; Barbiellini, B.; Orikasa, Y.; Kaprzyk, S.; Tsuji, N.; Yamamoto, K.; Terasaka, A.; Hoshi, K.; Uchimoto, Y.; et al. Identification of ferrimagnetic orbitals preventing spinel degradation by charge ordering in LixMn2O4. Phys. Rev. B 2019, 100, 205104. [Google Scholar] [CrossRef] [Green Version]
  7. Hafiz, H.; Suzuki, K.; Barbiellini, B.; Orikasa, Y.; Callewaert, V.; Kaprzyk, S.; Itou, M.; Yamamoto, K.; Yamada, R.; Uchimoto, Y.; et al. Visualizing redox orbitals and their potentials in advanced lithium-ion battery materials using high-resolution X-ray Compton scattering. Sci. Adv. 2017, 3, e1700971. [Google Scholar] [CrossRef] [Green Version]
  8. Suzuki, K.; Suzuki, S.; Otsuka, Y.; Tsuji, N.; Jalkanen, K.; Koskinen, J.; Hoshi, K.; Honkanen, A.P.; Hafiz, H.; Sakurai, Y.; et al. Redox oscillations in 18650-type lithium-ion cell revealed by in operando Compton scattering imaging. Appl. Phys. Lett. 2021, 118, 161902. [Google Scholar] [CrossRef]
  9. Naylor, A.J.; Makkos, E.; Maibach, J.; Guerrini, N.; Sobkowiak, A.; Björklund, E.; Lozano, J.G.; Menon, A.S.; Younesi, R.; Roberts, M.R.; et al. Depth-dependent oxygen redox activity in lithium-rich layered oxide cathodes. J. Mater. Chem. A 2019, 7, 25355–25368. [Google Scholar] [CrossRef] [Green Version]
  10. Li, M.; Liu, T.; Bi, X.; Chen, Z.; Amine, K.; Zhong, C.; Lu, J. Cationic and anionic redox in lithium-ion based batteries. Chem. Soc. Rev. 2020, 49, 1688–1705. [Google Scholar] [CrossRef]
  11. Xu, J.; Sun, M.; Qiao, R.; Renfrew, S.E.; Ma, L.; Wu, T.; Hwang, S.; Nordlund, D.; Su, D.; Amine, K.; et al. Elucidating anionic oxygen activity in lithium-rich layered oxides. Nat. Commun. 2018, 9, 1–10. [Google Scholar] [CrossRef] [PubMed]
  12. Chernova, N.A.; Nolis, G.M.; Omenya, F.O.; Zhou, H.; Li, Z.; Whittingham, M.S. What can we learn about battery materials from their magnetic properties? J. Mater. Chem. 2011, 21, 9865–9875. [Google Scholar] [CrossRef]
  13. Zhang, Q.; Luo, X.; Wang, L.; Zhang, L.; Khalid, B.; Gong, J.; Wu, H. Lithium-ion battery cycling for magnetism control. Nano Lett. 2016, 16, 583–587. [Google Scholar] [CrossRef] [PubMed] [Green Version]
  14. Wei, G.; Wei, L.; Wang, D.; Chen, Y.; Tian, Y.; Yan, S.; Mei, L.; Jiao, J. Reversible control of the magnetization of spinel ferrites based electrodes by lithium-ion migration. Sci. Rep. 2017, 7, 1–8. [Google Scholar] [CrossRef] [PubMed] [Green Version]
  15. Koizumi, A.; Miyaki, S.; Kakutani, Y.; Koizumi, H.; Hiraoka, N.; Makoshi, K.; Sakai, N.; Hirota, K.; Murakami, Y. Study of the e g Orbitals in the Bilayer Manganite La 2- 2 x Sr 1+ 2 x Mn 2 O 7 by Using Magnetic Compton-Profile Measurement. Phys. Rev. Lett. 2001, 86, 5589. [Google Scholar] [CrossRef] [PubMed]
  16. Li, Y.; Montano, P.; Mitchell, J.; Barbiellini, B.; Mijnarends, P.; Kaprzyk, S.; Bansil, A. Temperature-dependent orbital degree of freedom of a bilayer manganite by magnetic Compton scattering. Phys. Rev. Lett. 2004, 93, 207206. [Google Scholar] [CrossRef] [PubMed] [Green Version]
  17. Yabuuchi, N.; Nakayama, M.; Takeuchi, M.; Komaba, S.; Hashimoto, Y.; Mukai, T.; Shiiba, H.; Sato, K.; Kobayashi, Y.; Nakao, A.; et al. Origin of stabilization and destabilization in solid-state redox reaction of oxide ions for lithium-ion batteries. Nat. Commun. 2016, 7, 1–10. [Google Scholar] [CrossRef]
  18. Sakurai, Y. High-energy inelastic-scattering beamline for electron momentum density study. J. Synchrotron Radiat. 1998, 5, 208–214. [Google Scholar] [CrossRef] [Green Version]
  19. Kakutani, Y.; Kubo, Y.; Koizumi, A.; Sakai, N.; BL, A. Magnetic Compton profiles of fcc-Ni, fcc-Fe50Ni50 and hcp-Co. J. Phys. Soc. Jpn. 2003, 72, 599–606. [Google Scholar] [CrossRef]
  20. Cooper, M.J.; Mijnarends, P.; Mijnarends, P.E.; Shiotani, N.; Sakai, N.; Bansil, A. X-ray Compton scattering; Oxford University Press on Demand: Oxford, UK, 2004. [Google Scholar]
  21. Bansil, A. Coherent-potential and average t-matrix approximations for disordered muffin-tin alloys. I. Formalism. Phys. Rev. B 1979, 20, 4025. [Google Scholar] [CrossRef]
  22. Bansil, A. Coherent-potential and average t-matrix approximations for disordered muffin-tin alloys. II. Application to realistic system. Phys. Rev. B 1979, 20, 4035. [Google Scholar] [CrossRef]
  23. Bansil, A.; Kaprzyk, S. First-principles treatment of disorder effects in complex alloys: A study of BaxK1-xBiO3 and BaPb1-xBixO3. Phys. Rev. B 1991, 43, 10335. [Google Scholar] [CrossRef] [PubMed] [Green Version]
  24. Biggs, F.; Mendelsohn, L.; Mann, J. Hartree-Fock Compton profiles for the elements. At. Data Nucl. Data Tables 1975, 16, 201–309. [Google Scholar] [CrossRef]
Figure 1. A schematic of the experimental magnetic Compton scattering setup at BL08W of SPring-8.
Condensedmatter 07 00004 g001
Figure 2. Magnetic moments for various lithium concentrations x obtained by SQUID magnetometry (black circles) and magnetic Compton profile measurements (red circles). Background colors mark regions of cationic and anionic redox.
Condensedmatter 07 00004 g002
Figure 3. (a) Radial distributions of O 2 p and Mn 3 d orbitals. (bd) Curve-fitting analysis of the magnetic Compton profiles, which are composed of the O 2 p (orange line) and the Mn 3 d (blue line) contributions. Momentum is given in atomic units (a.u.).
Condensedmatter 07 00004 g003
Table 1. O 2 p and Mn 3 d contributions to the spin magnetic moments for various lithium concentrations. The error bars are based on the number of measured scattered photons.
Lithium ConcentrationSpin Magnetic MomentO 2pMn 3d
0.40.157 ± 0.0020.0270.184
0.80.140 ± 0.0020.0220.162
1.20.080 ± 0.0020.0100.090
Publisher’s Note: MDPI stays neutral with regard to jurisdictional claims in published maps and institutional affiliations.

