Indoor Thermal Environment and Occupant’s Living Pattern of Traditional Timber Houses in Tropics


1
Department of Architecture, Chittagong University of Engineering and Technology (CUET), Chittagong 4349, Bangladesh
2
Department of Architecture, Bangladesh University of Engineering and Technology (BUET), Dhaka 1000, Bangladesh
*
Author to whom correspondence should be addressed.
Designs 2021, 5(1), 10; https://0-doi-org.brum.beds.ac.uk/10.3390/designs5010010
Submission received: 7 August 2020
/
Revised: 2 February 2021
/
Accepted: 4 February 2021
/
Published: 14 February 2021
(This article belongs to the Special Issue Sustainable and Conventional Buildings)
Abstract
:Traditional timber houses in tropics have specific environmental characteristics that evolved considering material constraints, local construction technology and climate. To provide occupants with the necessary comfort, these naturally ventilated houses adopted several passive design strategies. Moreover, occupants have unique living patterns which may have contributed towards achieving indoor thermal comfort. However, scientific knowledge regarding these issues is still limited. Therefore, considering traditional timber houses of Bangladesh as sample cases, this study aims to investigate existing relationship between an indoor thermal environment and an occupant’s living pattern within these tropical houses. Physical measurement of thermal parameters and questionnaire surveys followed by personal observations were conducted. Findings show that indoor air temperature (AT °C) fluctuates readily with that outdoors without a timelag resulting in daytime overheating. The occupant’s daytime thermal sensation is mostly slightly warm to hot. Semi-open and outdoor shaded spaces become a way to cope with the daytime overheating period. Occupants frequently use indoor spaces during the night when thermal sensation ranges between neutral to slightly cool. Finally, from the findings an interpretational graph has been developed relating indoor thermal environment with occupant’s living pattern within a traditional timber house. Findings will contribute to professionals and policy-makers developing architectural design strategies that may impact the occupant’s well-being in future.
1. Introduction
Today people spend most of their life indoors while using mechanical solutions for thermal comfort making the building sector one of the major consumers of world’s total energy [1]. Residential buildings are responsible for 27% of total energy consumption [2] where heating/cooling is one of the key energy-consuming sectors for providing occupants with necessary indoor thermal comfort [3]. Heating-cooling energy consumption causes greenhouse gas (GHG) emissions resulting in climate change. To deal with climate change consequences, environmentally sustainable designs are gaining priority. However, studies show that traditional houses are less associated with heating-cooling energy consumption [4]. Traditional houses are adapted to the natural environment with their physical adaptive qualities that include built-form, space organization, materials composition, thermal mass, etc. [5,6]. However, traditional houses do not adequately meet user’s requirements in their material composition alone [7,8]. Studies on traditional houses show that an occupant’s lifestyle and adaptive behavior impact indoor thermal comfort [9,10,11,12,13] and an indoor thermal environment can be enhanced by an occupant’s lifestyle adaptation within traditional houses [14].
In the tropics, varieties of houses have evolved in response to regional climate [1] and traditional timber houses of Bangladesh are one such example. These houses are the product of longstanding labors of local people. They are constructed using local technology and available indigenous materials. These naturally ventilated houses have adopted several passive design strategies considering regional culture and climate for creating thermally comfortable indoors for their occupants [15,16,17]. These houses are believed to be thermally comfortable. Although evaluation of thermal performance and indoor thermal environment of timber houses, performance of envelope materials and eco-adaptability have already been conducted and documented in the existing research, these houses are located either in different climatic and/or cultural conditions [18,19,20,21,22], compared to those in Bangladesh. Hence they lack necessary scientific knowledge. Furthermore, occupants of traditional timber houses have unique living patterns which may contribute towards enhanced indoor thermal environment. However, study of timber houses considering occupants’ living patterns in evaluating the indoor thermal environment is still marginal. Therefore, the research question that is addressed in this study is ‘what is the relationship between indoor thermal environment and occupant’s living pattern within traditional timber houses in Bangladesh?’ Thus, this study is based on the following three major objectives: (a) evaluating existing indoor thermal environment of traditional timber house regarding thermal comfort, (b) occupant’s indoor thermal perception and subsequent adaptation of living pattern and (c) finding out the correlation between indoor thermal environment and the occupant’s way of life. Findings will contribute to professionals and policy-makers for developing architectural design strategies towards environmentally sustainable building design in tropics.
1.1. Location and Climate
Traditional timber houses are detached residential units used for living purposes only. Three typologies were found during field investigation: (i) single-storied, (ii) double-storied and (iii) stilt timber houses. Among these, single and double-storied houses are built by local people in many areas of Barisal and Khulna divisions. In contrast, stilt ones are constructed exclusively by Rakhine ethnic groups in some regions of Cox’s Bazaar, Barguna and Patuakhali districts.
In Bangladesh, hot-humid partly characterizes the tropical composite climate for majority of the year [23] with four pre-dominant seasons: dry winter (December to February), hot and dry pre-monsoon (March to May), hot and wet monsoon (June to September) and post-monsoon (October to November) [24,25,26]. Regional climate data of Cox’s Bazaar and Pirojpur (location of the studied houses) is shown in Table 1. For both regions, June–September has the highest rainfall with moderate temperature ranges between maximum 29–31 °C and 31–34 °C in Cox’s Bazaar and Pirojpur, respectively [27]. High relative humidity (RH%) combined with moderately high air temperature (AT °C) causes acute discomfort, hence they are considered for this study.
1.2. Thermal Comfort: Code and Standard
Thermal comfort is a subjective response and is defined as a state of mind expressing satisfaction with the existing environment [28,29]. Being in the same thermal environment, different occupants can have other thermal sensations. Similarly, other occupants can express the same thermal feeling in various thermal environments. Therefore it is difficult to mention the specific numerical value of thermal comfort [30,31,32]. Again thermal comfort range vary with location, personal and climatic factors, i.e., comfort range, are higher for warmer climates than colder ones [33,34].
Unfortunately, there is no specific standard regarding indoor thermal comfort in naturally ventilated houses in the Bangladesh National Building Code (BNBC) 2008. In Bangladesh’s context, existing thermal comfort studies are mostly urban-centric and the study on thermal comfort in rural areas has been neglected [23,24,35]. Limited studies in the rural perspective of Bangladesh suggests that people feel comfortable between the range of 17–32 °C in winter [36] and 24–32 °C with RH range of 50–90% having little or no air movement in summer [37,38] for people wearing simple summer clothing and engaged with light/sedentary activities. The aforementioned ranges have been considered as the baseline for this study.
2. Conceptual Framework
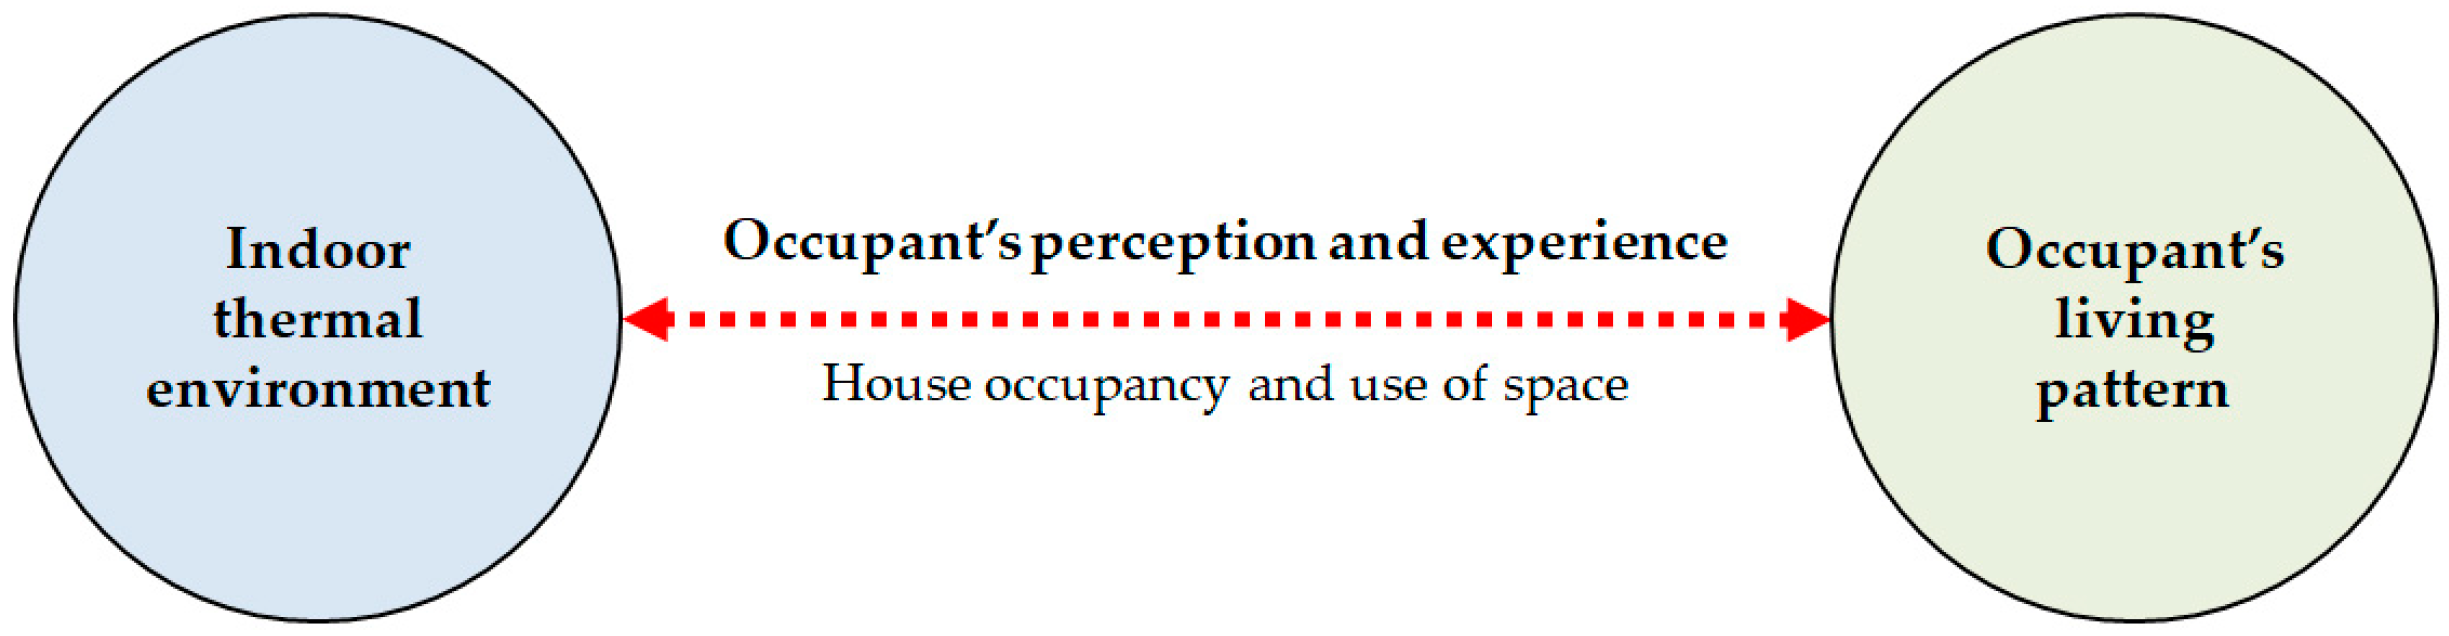
The indoor thermal environment affects an occupant’s perception of thermal comfort and creates different experiences [28,39]. On the other hand, occupants have different living perceptions and experiences in their living environment [40] where sensation and experience of thermal discomfort are essential as they determine how people react to space [41,42]. Therefore, the indoor thermal environment causes its occupants to adapt their way of living within house (Figure 1).
It is claimed that today people spend 90% of their life indoors, but this is not always true. In traditional timber houses of Bangladesh, occupants stay most of their time outside the house during day. Their pattern of daily household chores is primarily outdoor-oriented. Houses remain occupied during the night. Traditional timber houses are designed to provide necessary comfort for their occupants with naturally ventilated condition. Therefore, the indoor thermal environment may influence occupant’s distinctive lifestyle. Consequently, this study is based on the hypothesis that in a traditional timber house, indoor thermal environment influences occupants to adapt their way of living.
3. Research Methodology
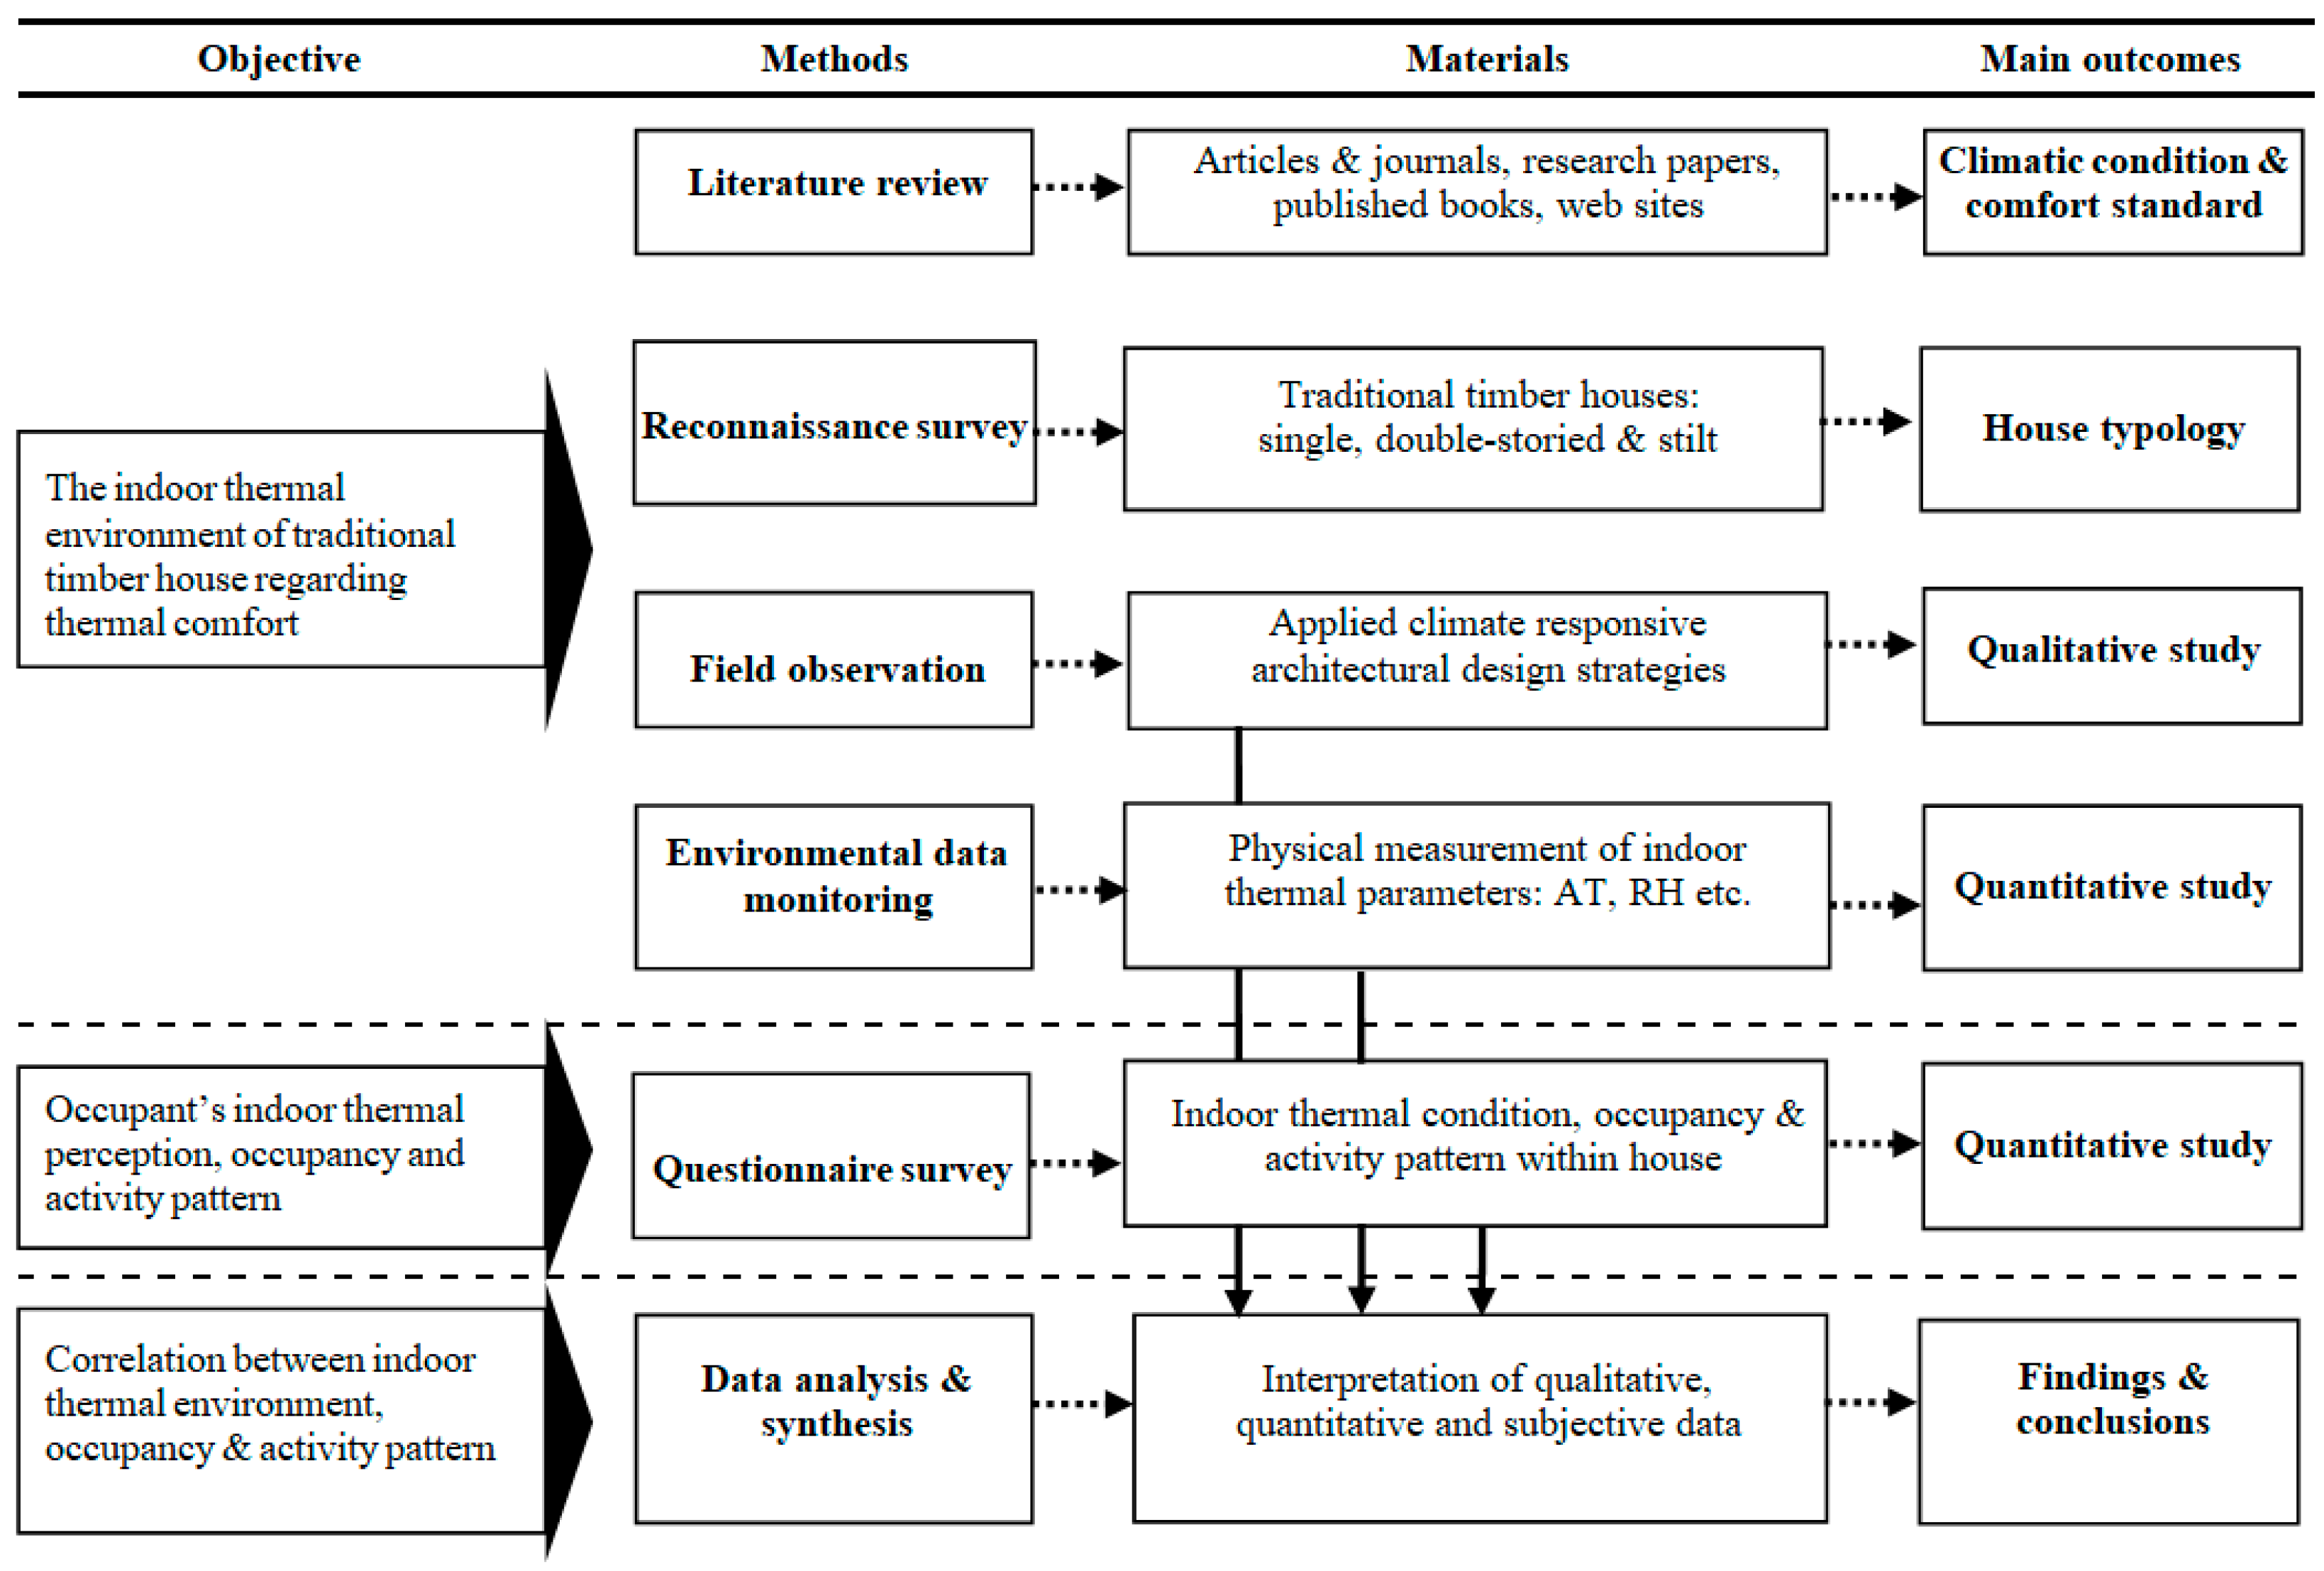
Recent studies identified that field observation is a widely used method for environmental evaluation of naturally ventilated houses [43]. This study, emphasizing field observations, includes physical measurement of thermal parameters and questionnaire surveys. Personal observations, interviews and discussions were conducted simultaneously. First of all, literature reviews were performed to select the specific location of the house, survey period and comfort standard regarding rural context. Studies on traditional timber houses in Bangladesh are still limited and a reconnaissance survey was conducted to specify the house typology to be studied. Three typologies were traced and five cases from each typology were selected for a detailed survey. To understand the occupant’s indoor thermal experience, it is necessary to evaluate the traditional timber house’s indoor thermal environment qualitatively and quantitatively. Therefore, qualitative data on local construction techniques and materials, passive design strategies adopted towards indoor thermal comfort and the occupant’s lifestyle were collected. For quantitative data collection, three houses from each typology were selected for insitu data monitoring on thermal parameters, i.e., AT °C, RH%, etc. Occupants of a house may have different expectations depending on the way they use it. Therefore, occupant’s responses will help us to understand the relationship between indoor thermal environment and the occupant’s living pattern. A questionnaire survey was conducted to outline the occupant’s perception of existing indoor thermal environment, occupancy and activity pattern. Finally, all monitored data were analyzed and synthesized concerning thermal comfort to identify the correlation between indoor thermal environment and house occupancy and activity pattern within traditional timber houses. Figure 2 shows the structure of the study.
3.1. Selection of Case Studies and Field Observations
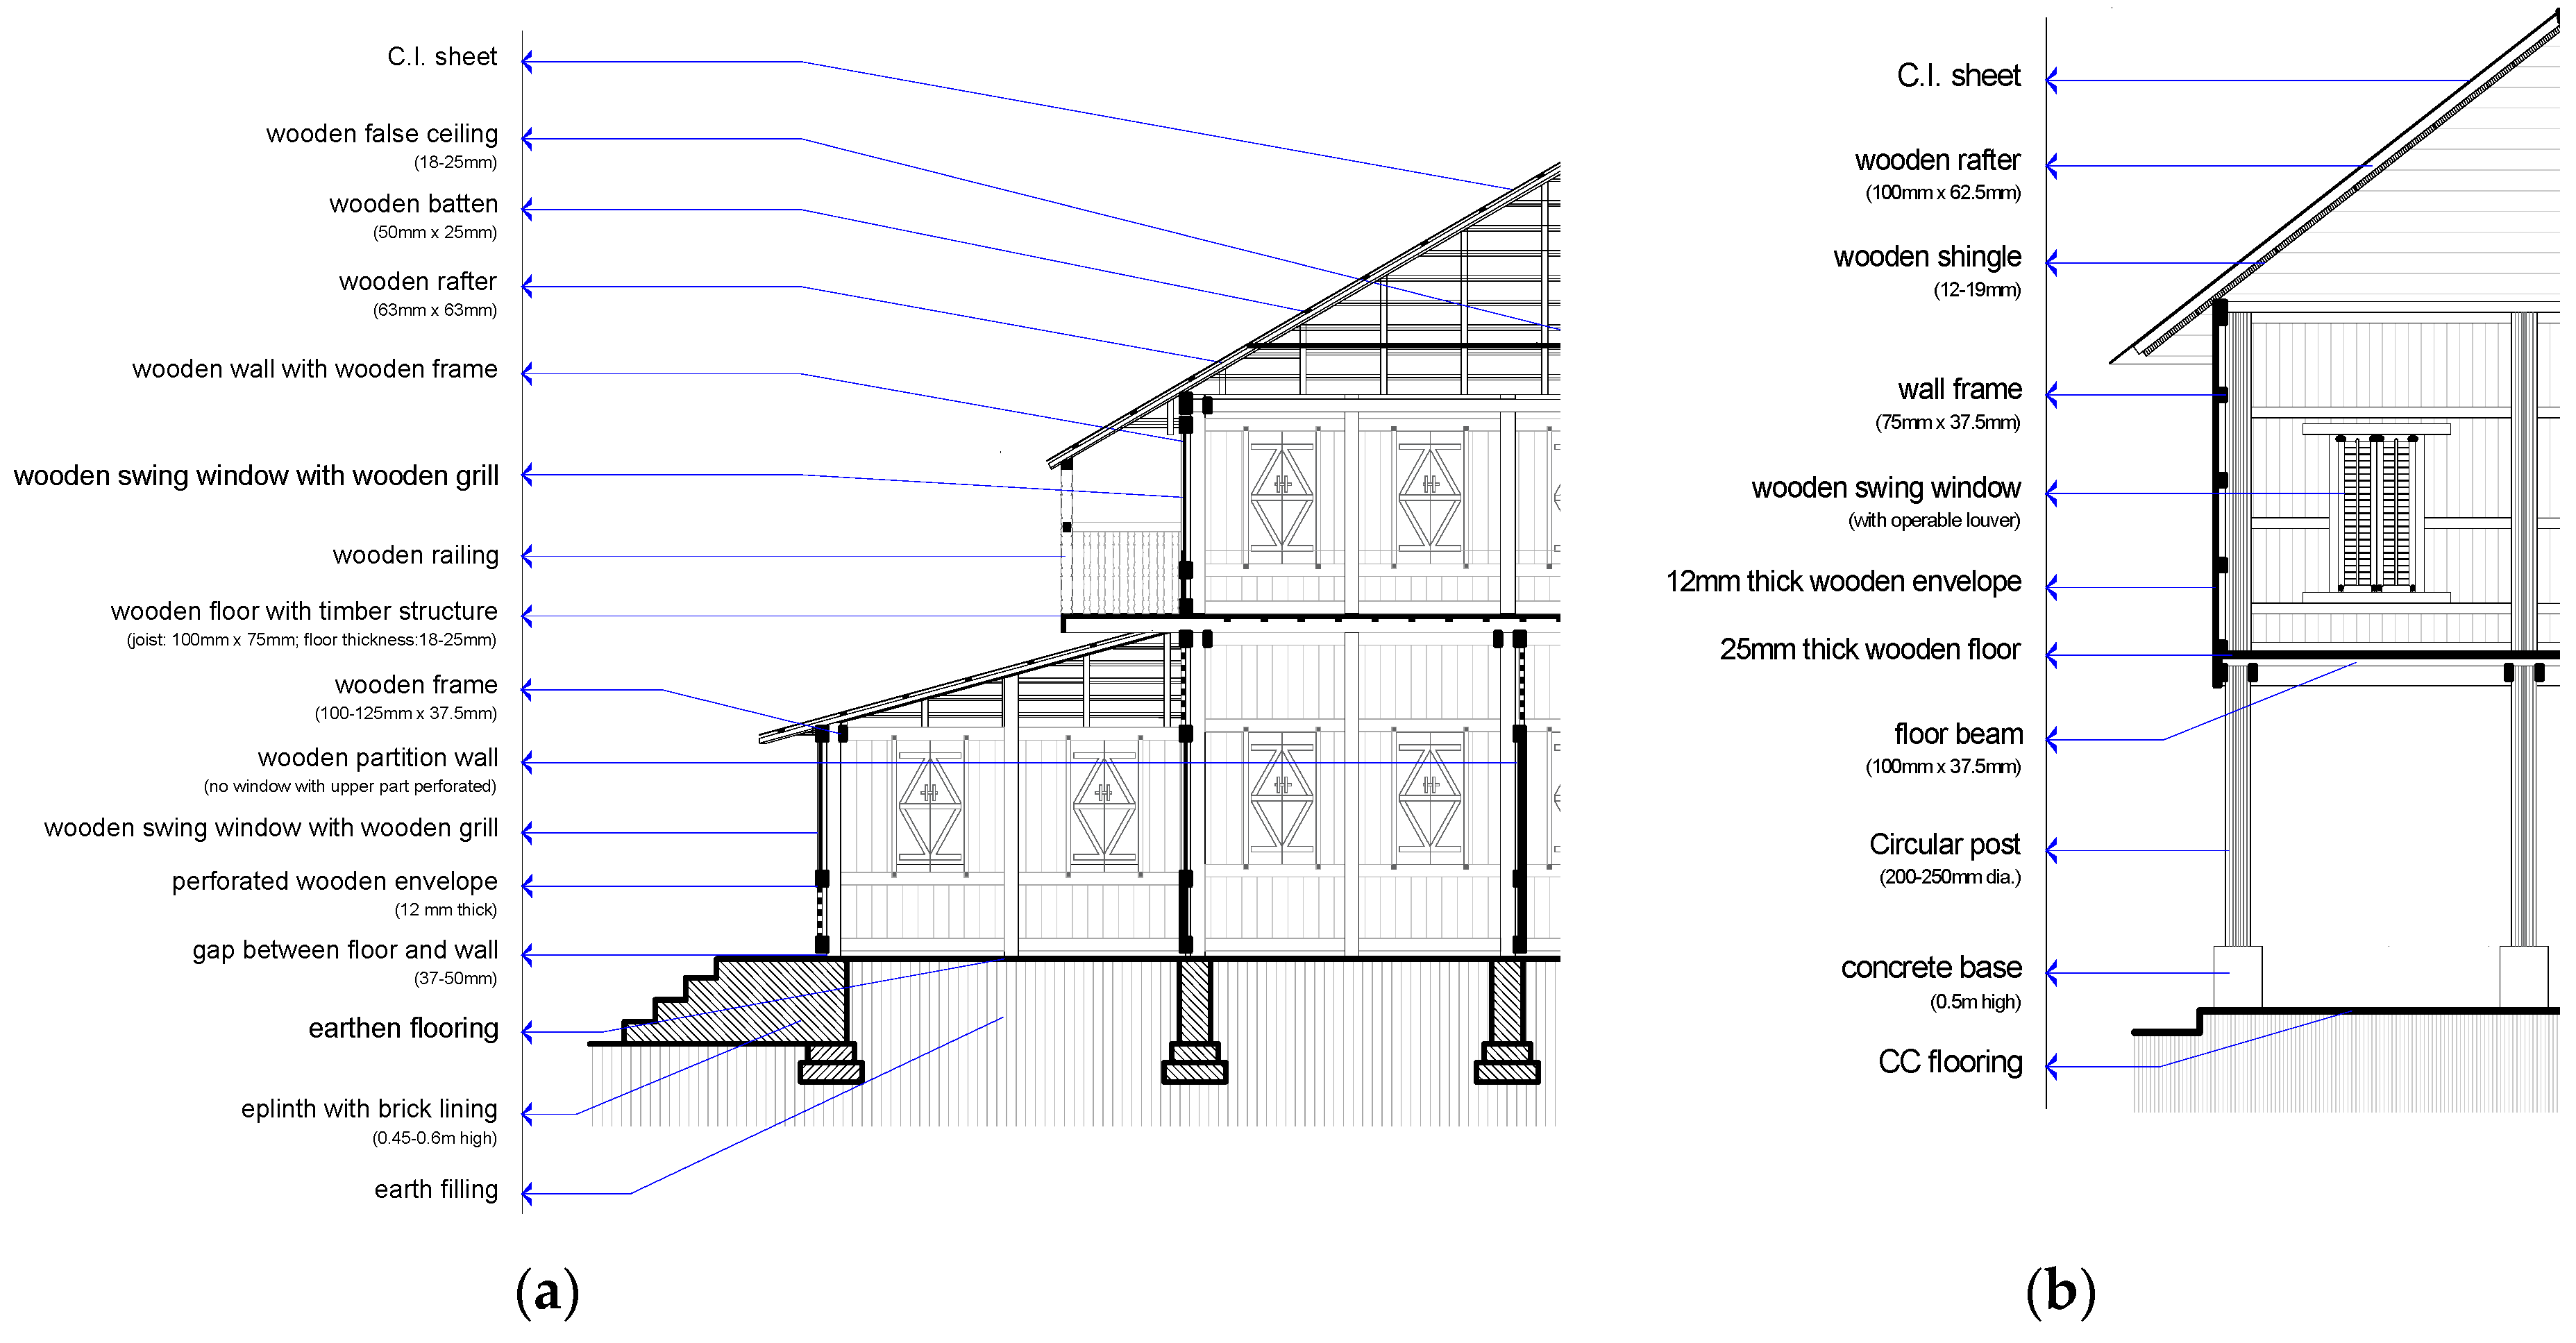
Traditional houses have no written documentation on paper. Therefore, each of the three typologies has been investigated regarding architectural components, local technologies, materials used, etc. As traditional timber houses have gone through many changes, therefore, those that have received little change were given priority for selecting case study samples. Moreover, the traditional way of living was given priority; hence, houses in rural context were selected as the living pattern of occupants varies between urban and rural areas. Properties and characteristics of selected houses are discussed below. Because of adequate similarities between traditional single and double-storied, these are discussed together. Figure 3 shows a cross-sectional view of the selected houses and Table 2 provides the thermal properties of construction materials.
- (a)
- Floor
Traditional single/double-storied house has 0.5–1.0 m high plinth which is sometimes provided with peripheral 250 mm brick with outer 12 mm plaster lining. The ground floor has either earthen or Cement Concrete (CC) flooring. For CC flooring, concrete mix (cement:sand:aggregate = 1:2:4) is laid on one layer of local brick having sand filling underneath. Traditional stilt houses usually have an earthen ground or only one course of local brick soling. But for both single/double-storied and stilt timber houses, the first floor is constructed with 25 mm wooden plank supported by timber-frame structure.
- (b)
- Wall
Most of the walls are made of a 12 mm thick wooden envelope having a timber frame structure. The wall has dark brown to black color which results from the use of Mobil or Tarpin oil coating for protecting the wall against insects and weathering action. In a traditional single/double-storied house, wall has considerable portion of perforation, nearly 25–30% and 37.5–50 mm gap between floor/roof and wall. In contrast, a traditional stilt house has no perforation in the wall.
- (c)
- Roof
Roof hasa hipped shape with a slope ranges from 30–40°.It has 0.12–0.5 mm thick CI (Corrugated Iron) sheet covering over timber frame structure. A traditional single/double-storied house’s main roof is provided with an additional 25–37.5 mm thick wooden false ceiling creating ventilated attic space (average height 1.2–1.5 m). A roof over a ‘veranda’/’pashchati’ is provided with 12 mm thick wooden shingle or average 6 mm thick bamboo knitted mat just beneath CI sheet covering. ‘Chadoa’ (traditional artifact: a light fabric) is extended under the ceiling. However, the roof of traditional stilt houses is provided with 12–19 mm thick wooden shingle or average 6 mm thick bamboo knitted mat just below the roof structure having no attic.
- (d)
- Window and Door
Both single/double-storied and stilt timber houses have swing windows of 12 mm thick wooden panels. Average window height is 1 m with an average 0.6 m high sill from floor level. In contrast, a stilt house’s window panels are provided with an operable wooden louver (fin is 75 mm wide and 12 mm thick) and average window height is 1.4 m. Average sill height is 0.4 m from floor.
3.2. Insitu Data Monitoring
Day-long insitu thermal parameter measurements were taken between June–August 2019. Rooms having at least two exterior walls (direct contact with outdoor) were selected. Data logger (HOBO ware Pro. U30) was installed in mid-position of the room (Table 3).
Insitu measurements on both indoor and outdoor climatic data for at least 24 h were recorded with smart sensors and thermal monitoring tools. Indoor data were collected at two different heights: human occupancy zone, which is head level of sitting person as recommended by ISO 7726 [49] and near the ceiling (2.4 m for single/double storied and 3.6 m for stilt house) (Table 3). Because of occupants’ differences in lifestyle between single/double-storied and stilt houses, two different levels were considered. Culturally occupants of stilt houses use limited furniture and directly sit/sleep on the floor, whereas others use furniture. Height of the furniture was considered while selecting the human occupancy zone. Therefore, for single/double-storied traditional timber houses 1.1 m and for stilt houses 0.9 m from floor level were considered as human occupancy height. Similarly, the ceiling measurement height is also different for each house because of differences in room height. Surface temperatures (laser non-contact thermometer: MT4) and thermal images (thermal digital camera: FLIR Z-CAMERA) were collected for a deep insight regarding indoor thermal environment. Instrument details are listed in Table 4.
3.3. Questionnaire Survey
A questionnaire survey was conducted simultaneously with in-situ data monitoring to understand occupants’ indoor thermal experience. Occupants’ verbal consent was taken before conducting the questionnaire survey. Questionnaire was prepared based on information from ASHRAE (American Society of Heating, Refrigerating and Air-Conditioning Engineers) 55-2004Informative Appendix E [28] and similar previous studies [50,51,52]. For easy understanding by the occupants, the questionnaire was prepared using the native language. It had three major parts: general and personal information (date, age and gender), evaluation of thermal environment (thermal sensation and feeling, clothing, activity pattern) and personal (passive) micro-climate control. The ASHRAE 7-point scale was used for measuring thermal sensation and feelings where instead of numbering written annotation (Appendix B) was used. For broader understanding of occupants’ thermal experience, they were asked to respond from their experience other than their present feelings. At least three occupants from each of the15 selected houses participated. Responses of 41 and 18 (a total of 59 responses) from traditional single/double-storied and stilt timber houses were collected, respectively.
3.4. Data Interpretation Strategy
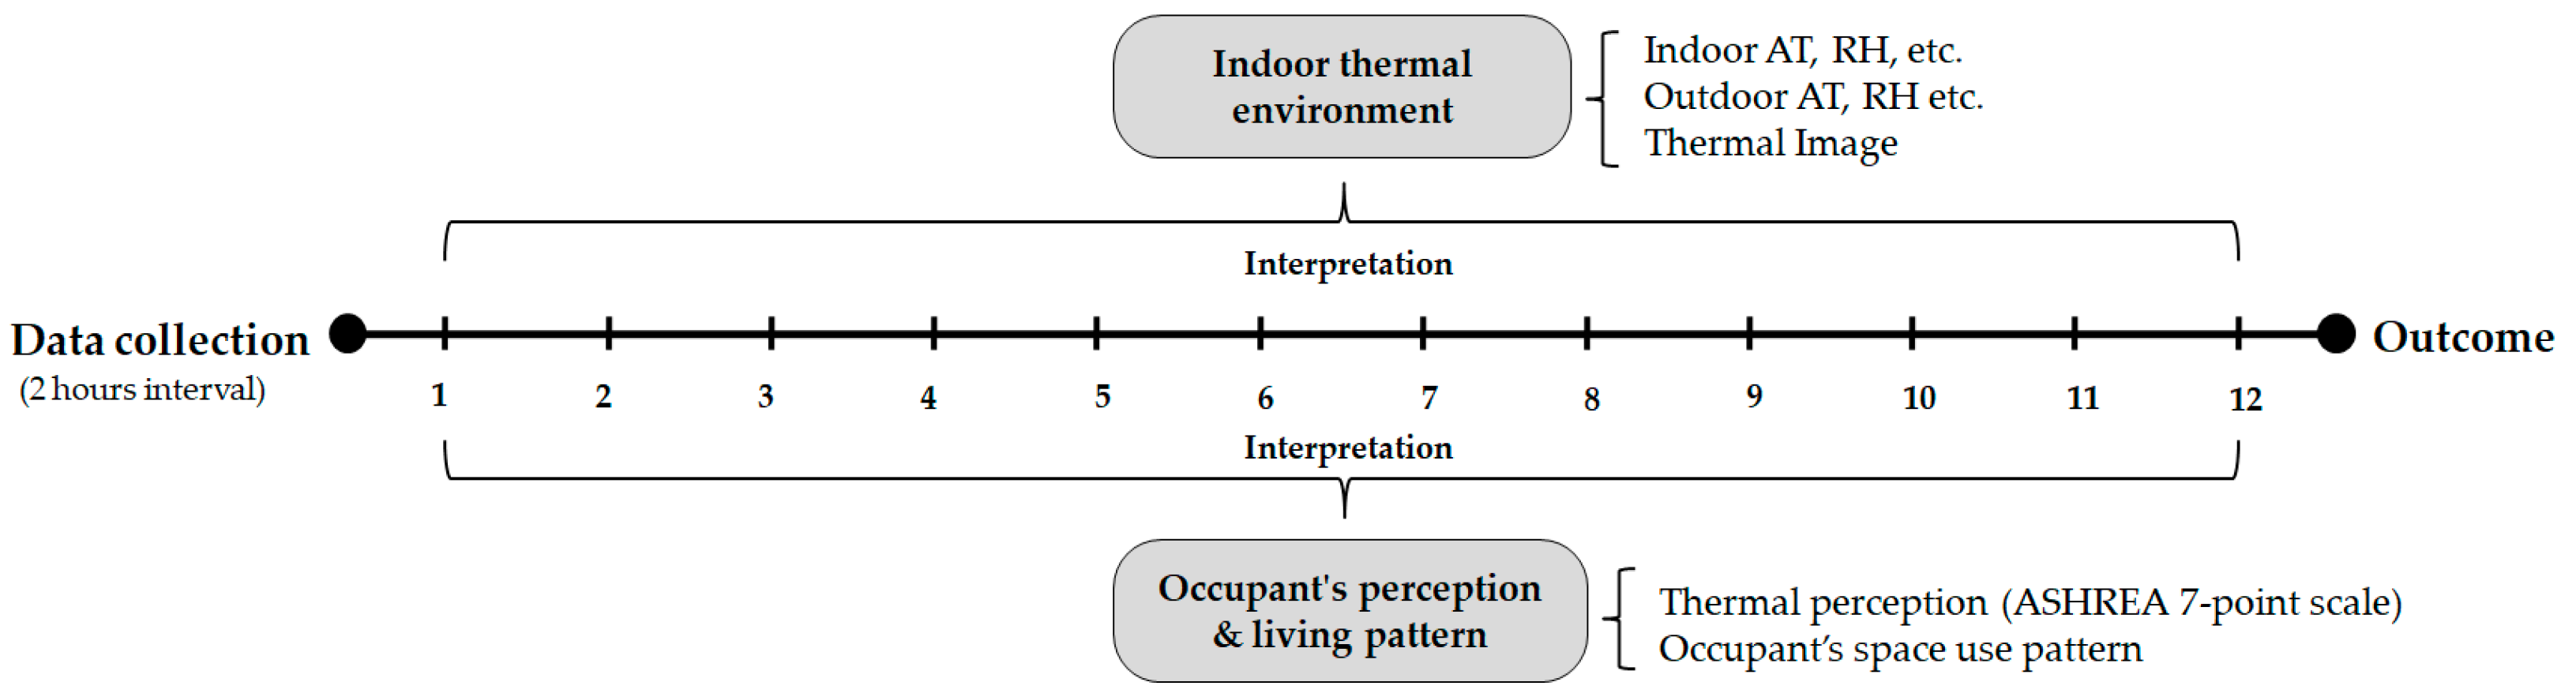
Indoor thermal environmental data were collected for each second for at least 24 h. From these, data average values were calculated for every 2 h, i.e., 4:00 am, 6:00 am, 8:00 am and so on. Similarly, data on occupant’s thermal perception and space use pattern were collected for these selected periods. Then, these two types of data were set against time and interpretational graph was developed showing existing relationship between indoor thermal environment and occupant’s living patterns within traditional timber houses.
Although three typologies of houses were surveyed, because of similarities between single and double-storied timber houses they are considered together. Therefore, two interpretational graphs were developed for traditional single/double-storied and stilt timber houses. Figure 4 illustrates the data interpretation strategy used for this study.
4. Findings and Data Interpretation
4.1. Qualitative Study: Adapted Passive Design Strategies Related to Indoor Thermal Comfort
All design strategies applied in houses related to indoor thermal environment were analyzed under some essential climatic aspects: sun-path and solar radiation, temperature, humidity, local wind and vegetation. Adopted passive design strategies have been presented in Table 5 using ‘description and image’ approach [53].
Detailed analysis reveals that passive techniques used are harmonized with local building techniques making methods sustainable and easily applicable solutions. Although every house doesn’t apply all design strategies, each house adopted at least two-three strategies discussed above. Overview of this observation will help us to analyze the existing indoor thermal environment.
4.2. Quantitative Study: Existing Indoor Thermal Environment of Traditional Timber Houses
Single-storied, double-storied and stilt houses selected for whole day insitu measurements were defined as H-1, H-2 and H-3 respectively. Field data monitoring was conducted between 2–8 July in single/double-storied and 22–25 August in stilt timber houses. In-situ data monitoring included AT, RH of both indoors and outdoors, wind and gust speed and solar radiation measurements.
Results of insitu data monitoring were analyzed based on followings aspects:
- Envelope materials and indoor thermal environment.
- Outdoor AT and indoor thermal environment.
4.2.1. Envelope Materials and Indoor Thermal Environment
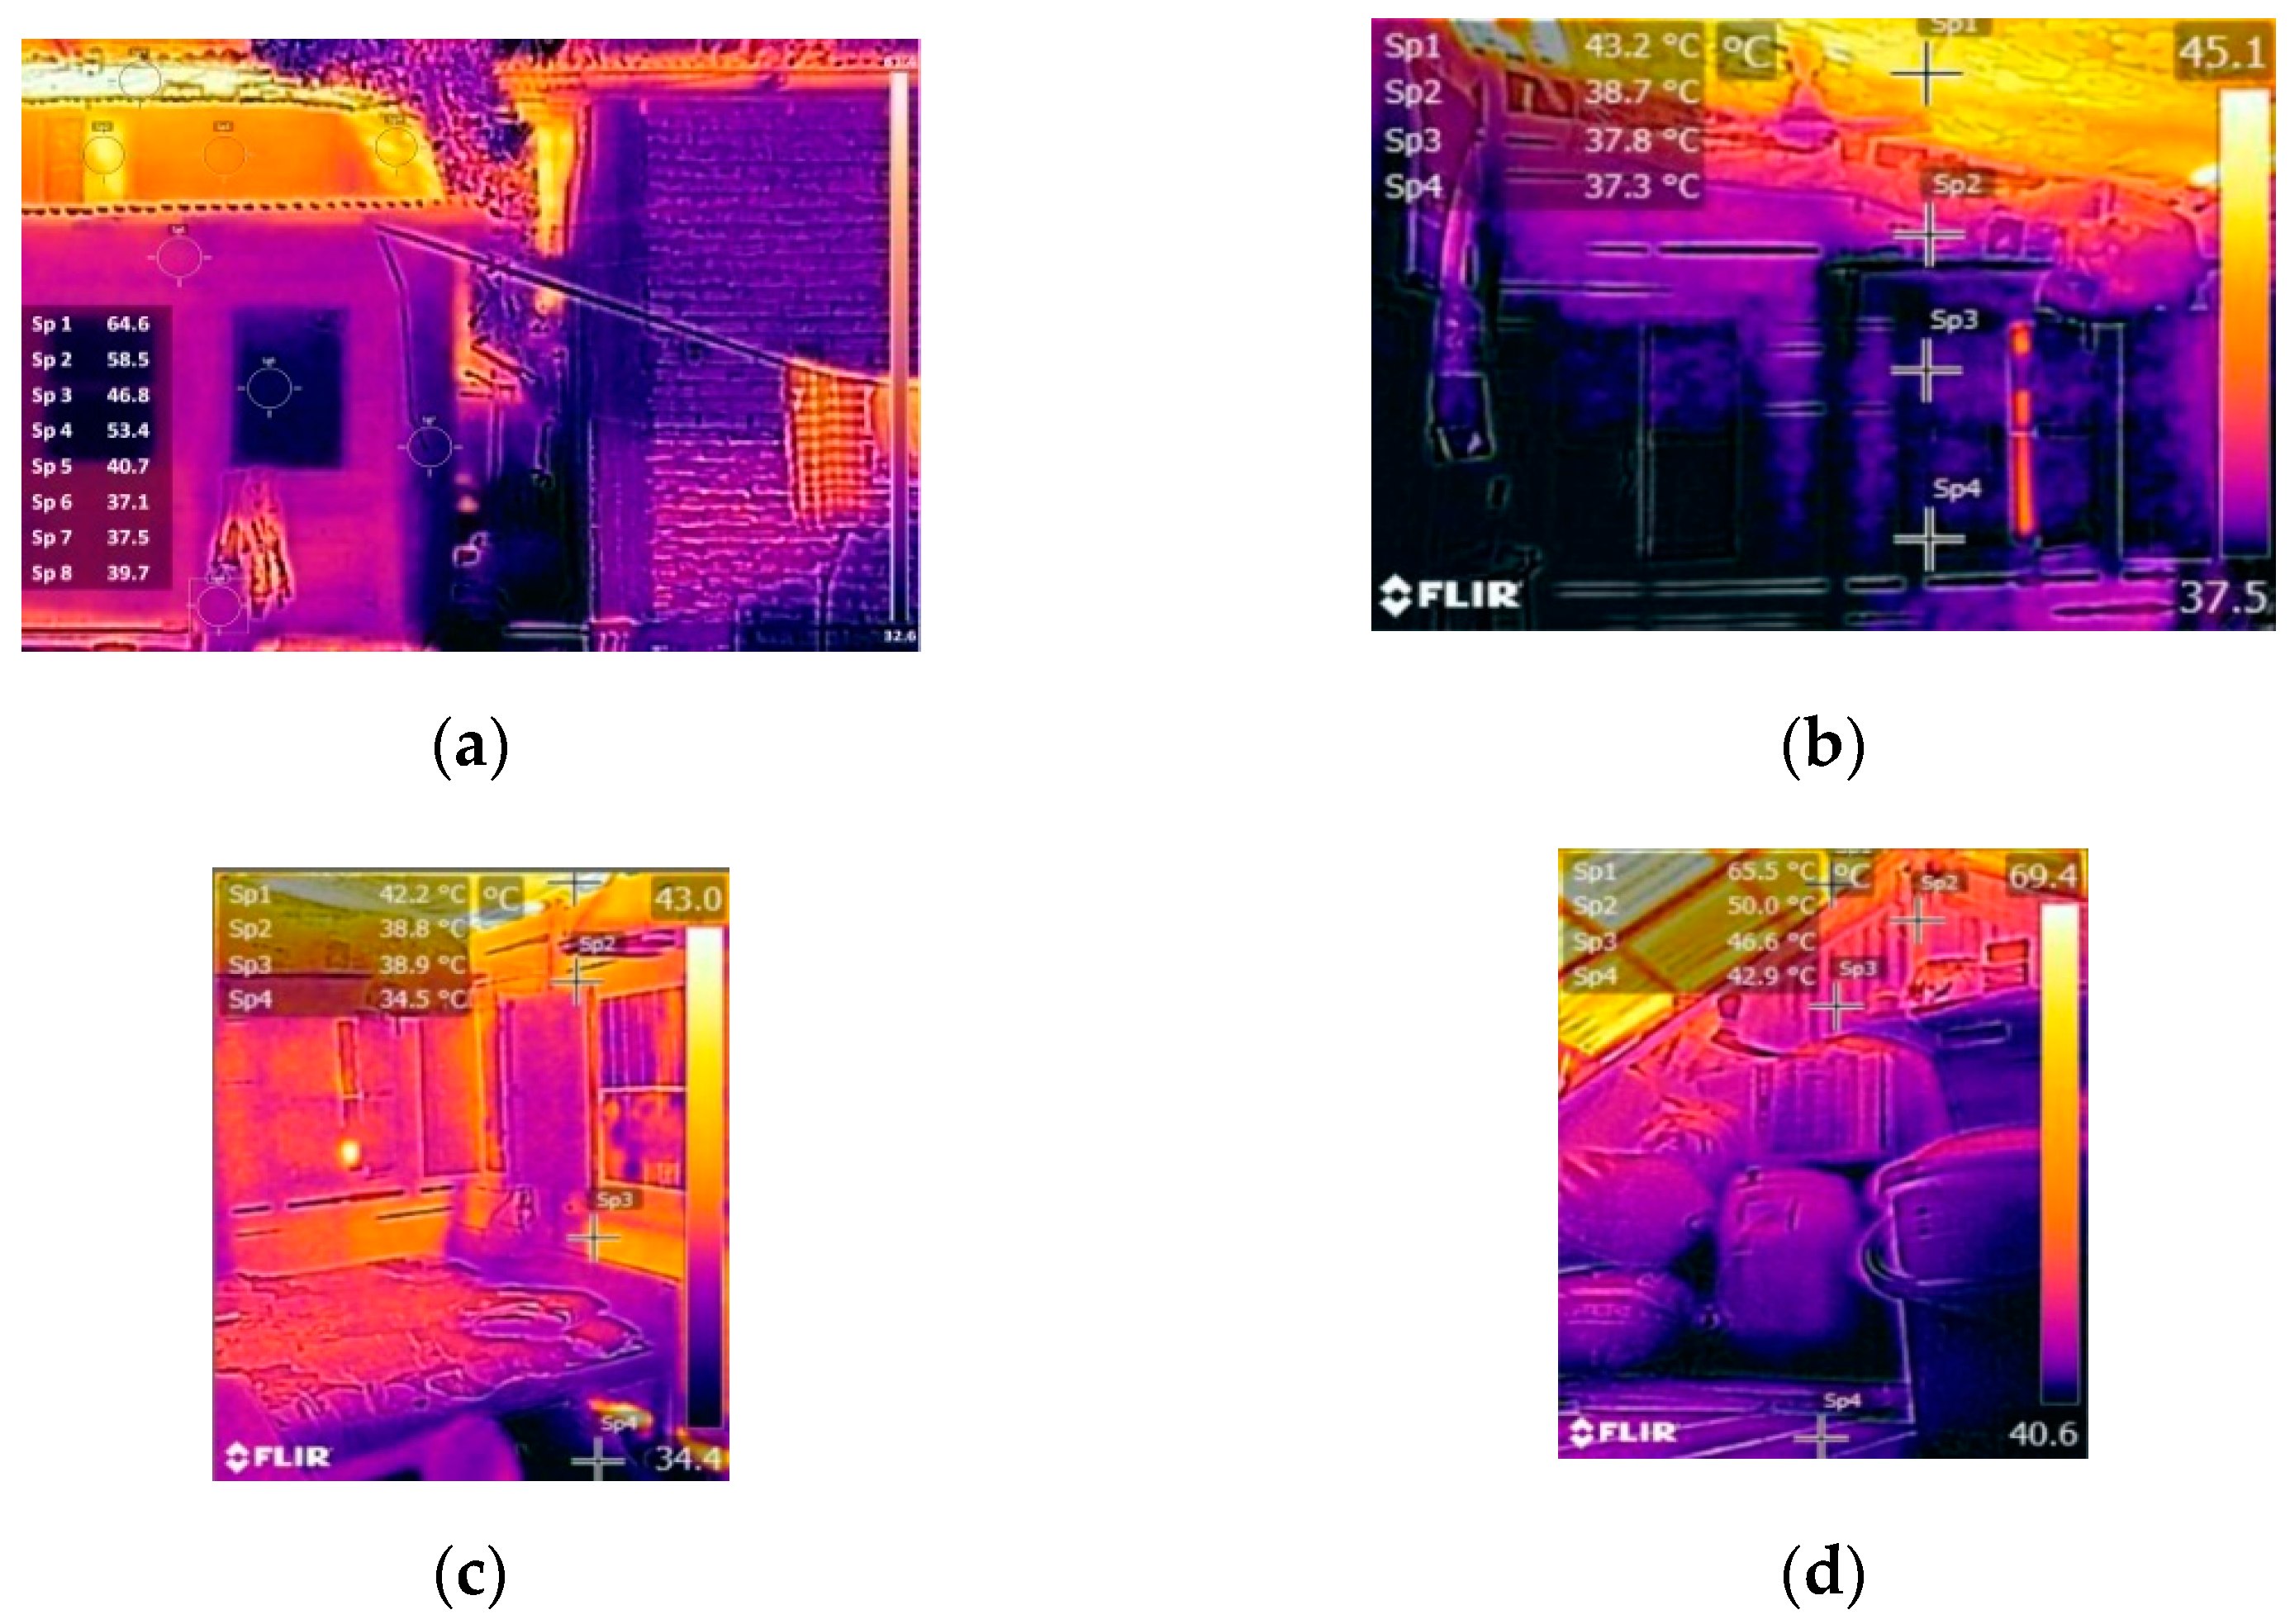
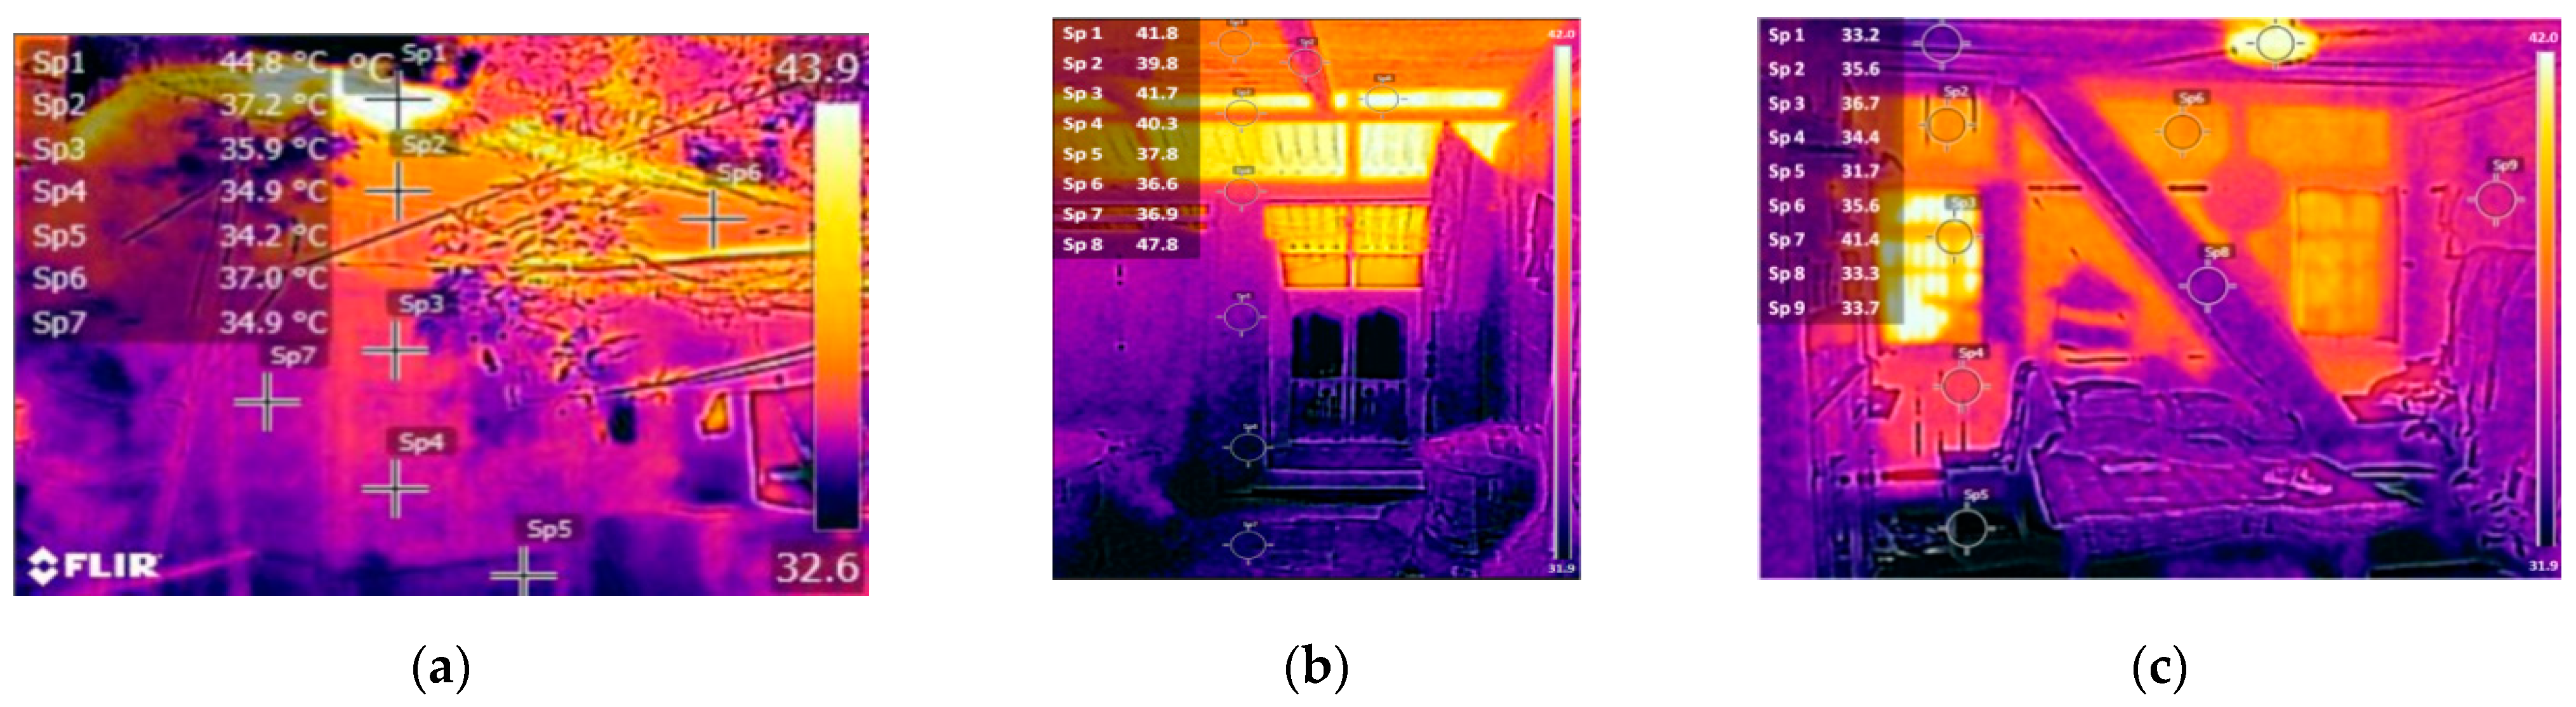
In a hot-humid climate, envelope material’s albedo, thermal mass and properties have a significant bearing on building’s thermo-physical environment [26,54,55]. Shaded surface has low surface temperature than that directly exposed to the sun. Roof covering with its higher U-value (Table 2) had maximum surface temperature ranges between 44.8–60.2 °C while the earthen floor, with its low conductivity, had minimum surface temperature (Figure 5, Figure 6 and Figure 7) compared to other envelope materials. Surface temperature of the earthen floor was 31.7 °C (max.).
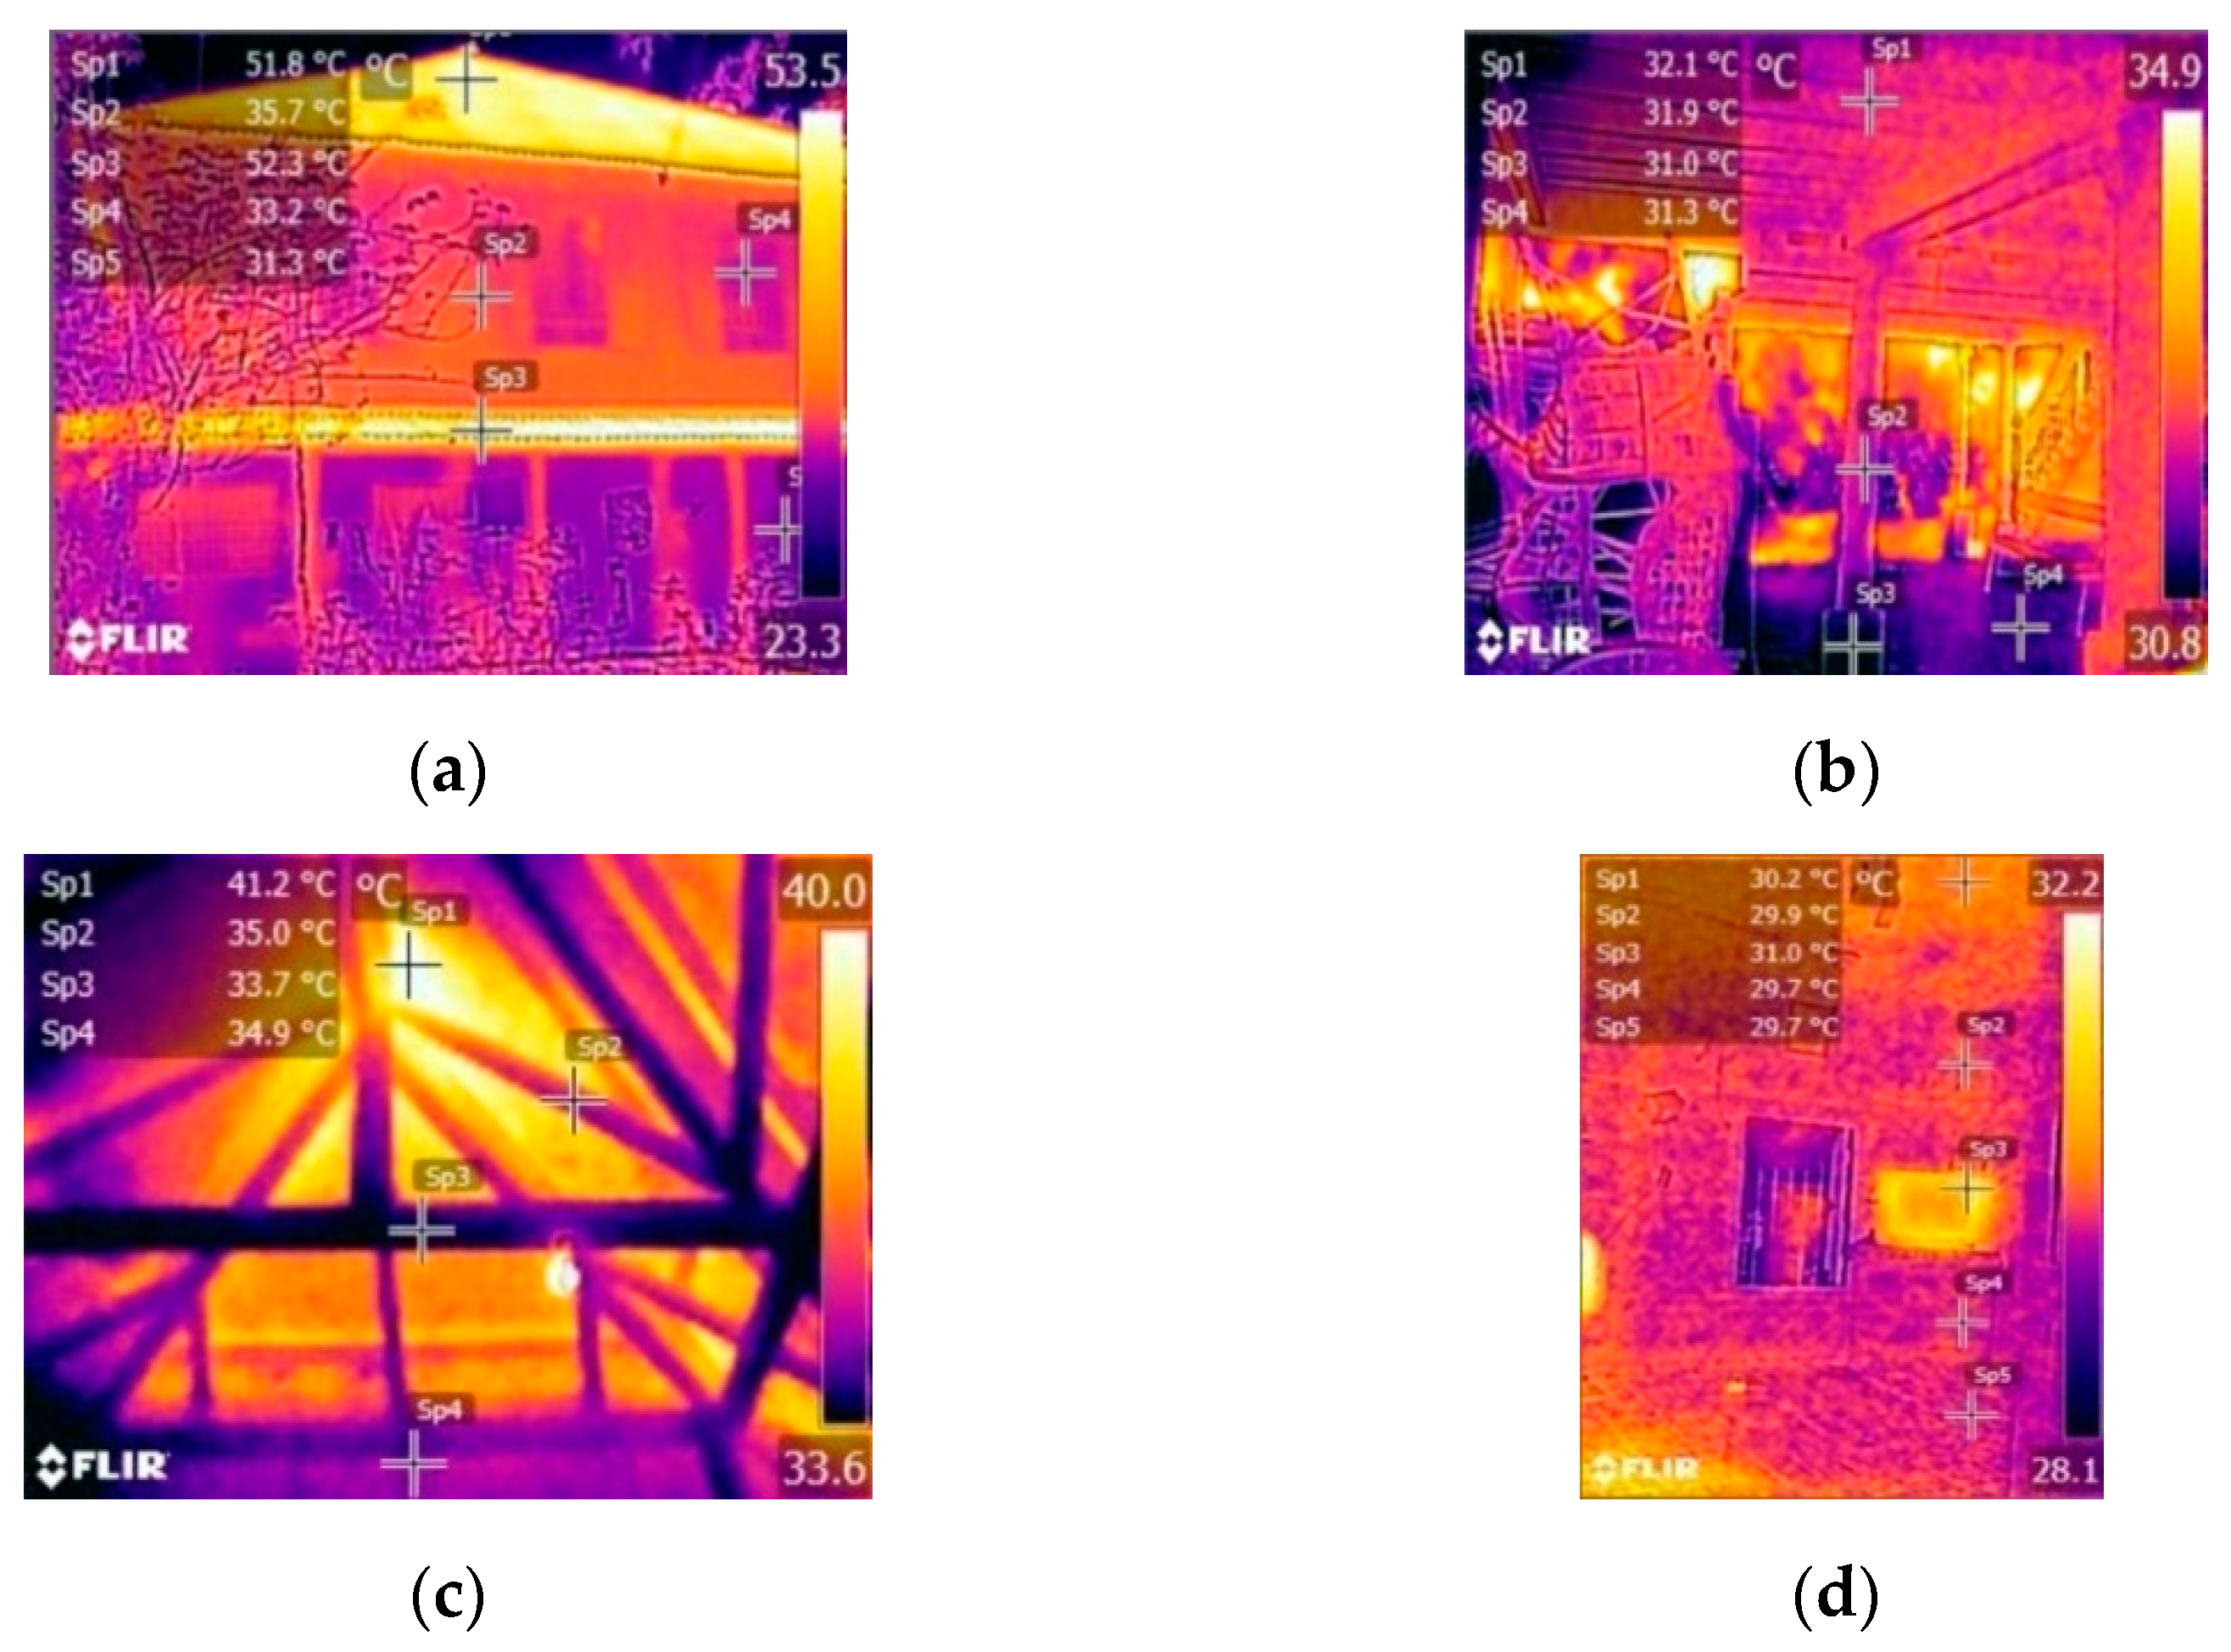
Wall surface temperature was lower than the roof. In all cases, because of radiant heat from roofing materials, wall surface temperatures were lower near the ground than near the roof. In H-1 (Figure 5), wall surface temperature difference between indoor and outdoor was nearly 8 °C whereas in H-2 and H-3 it was 2 °C and 5.8 °C (Figure 6 and Figure 7) consecutively. Shade from trees contributes towards lower surface temperature. Besides that in H-3, as the floor is elevated from ground, therefore, off to radiant heat gain from hot ground which contributes towards lower surface temperature. During the night, surface temperature of CI sheet decreases but wall and floor envelope materials cool down slowly by radiating heat in the surrounding environment. This result in high indoor AT near the ground compared to the ceiling and outdoors during the night.
In terms of roof, in H-1, a non-insulated CI sheet had internal surface temperature of 47.8 °C. But in H-2 and H-3, with a 12–18 mm thick wooden insulation, inner surface temperature decreased by 12.7 °C and 16.5 °C (Figure 6 and Figure 7) respectively. The first floor’s roofs of H-1 and H-2 are provided with an attic and wooden false-ceiling (Figure 3). This resulted in surface temperature differences of 16.1 °C and 4.5 °C between external and internal ceiling surfaces of H-1 and H-2, respectively. Table 6 shows temperatures of interior and exterior surfaces between 12:00 pm–4:00 pm.
4.2.2. Outdoor Air Temperature (AT) and Indoor Thermal Environment
Indoor AT of timber houses was cooler than outdoor during early morning until midday. In all cases, indoor AT temperature started increasing from 7:00 am and reached its maximum between 12:00 am–4:00 pm. But after midday, outdoor AT started decreasing. At night, outdoor AT became cooler compared to indoor AT.
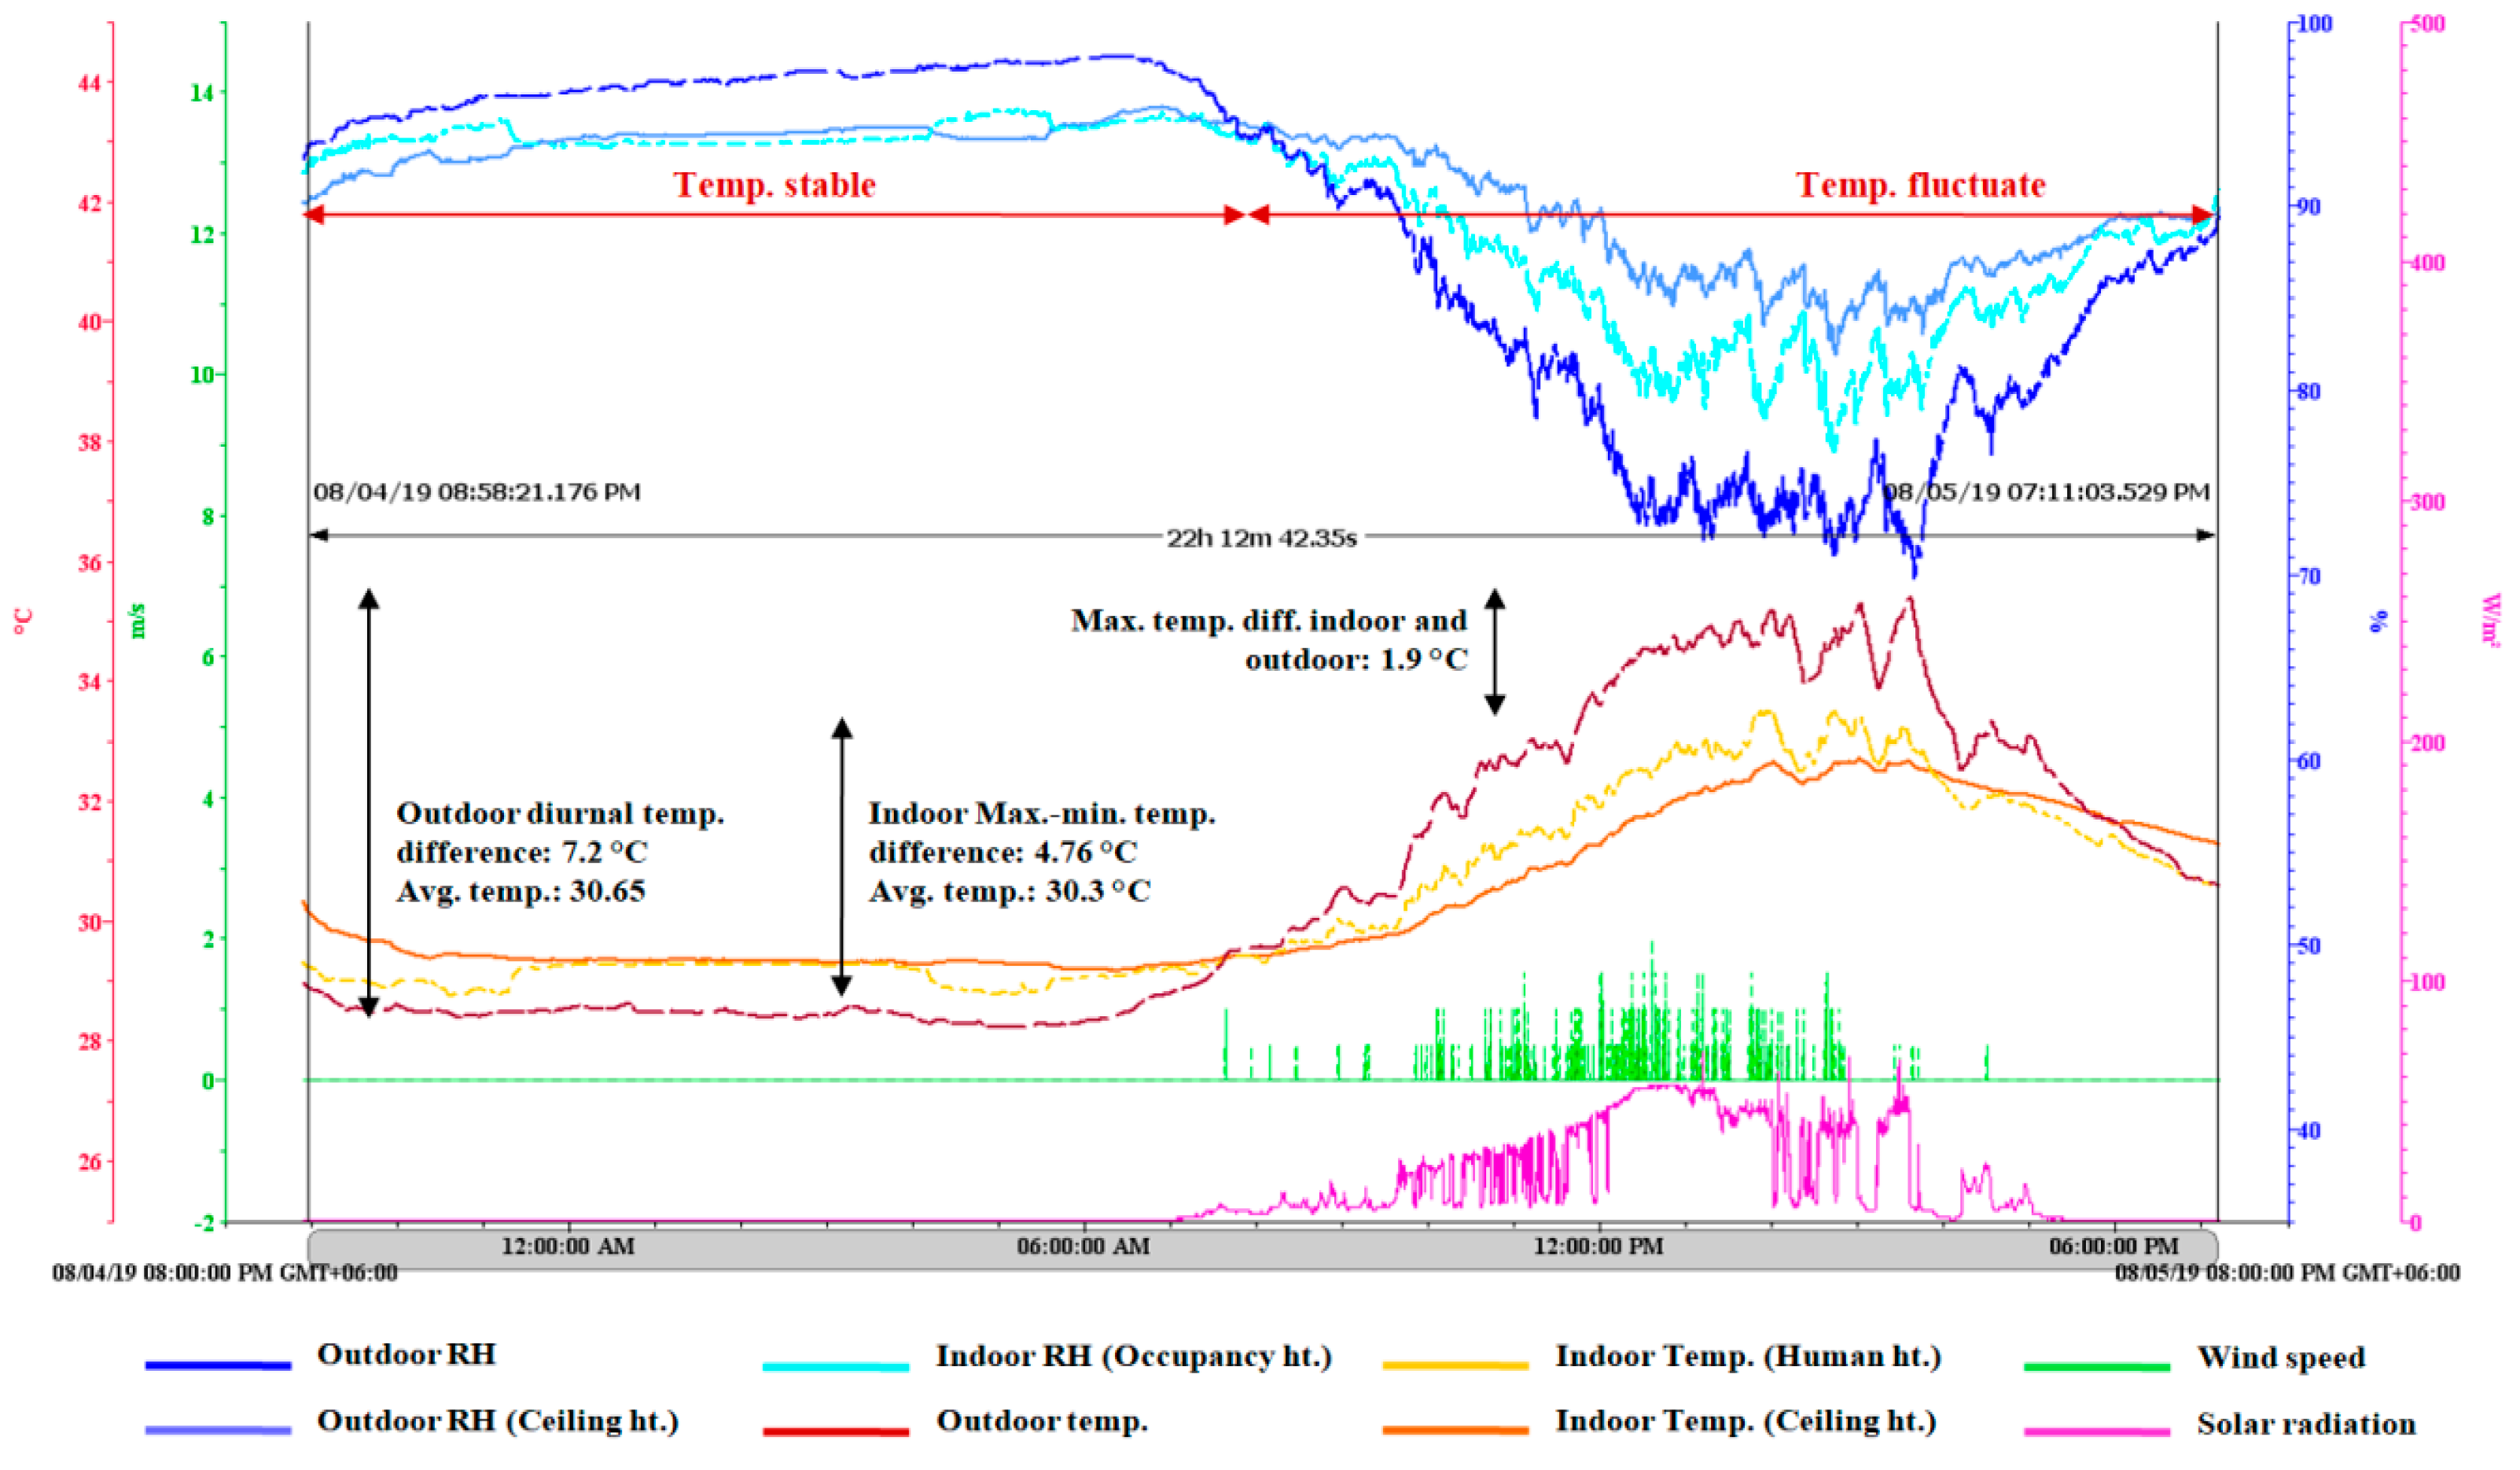
Figure 8 shows indoor thermal environmental data of H-1 for 24 h (4–5 August 2019). Diurnal variation of average 7.2 °C and 4.76 °C of outdoor and indoor were recorded consecutively. Both indoor and outdoor AT remained stable during night-time and fluctuated during the day. The low thermal mass of wooden envelope and large openings on all sides contributed towards conductive and convective heat gain resulting in higher day-time indoor having no time-lag. Indoor and outdoor temperatures were reached their maximum between 12:00 pm–4:00 pm but indoor AT was lower (avg. 32.5 °C) than outdoor (avg. 34.46 °C). During the night openings were kept closed and the attic remained unvented, therefore, indoor AT was higher than outdoor. During night to early morning, RH of indoors and outdoors was average 93.7% and 96.58%, respectively. RH showed a reverse scenario compared to AT.
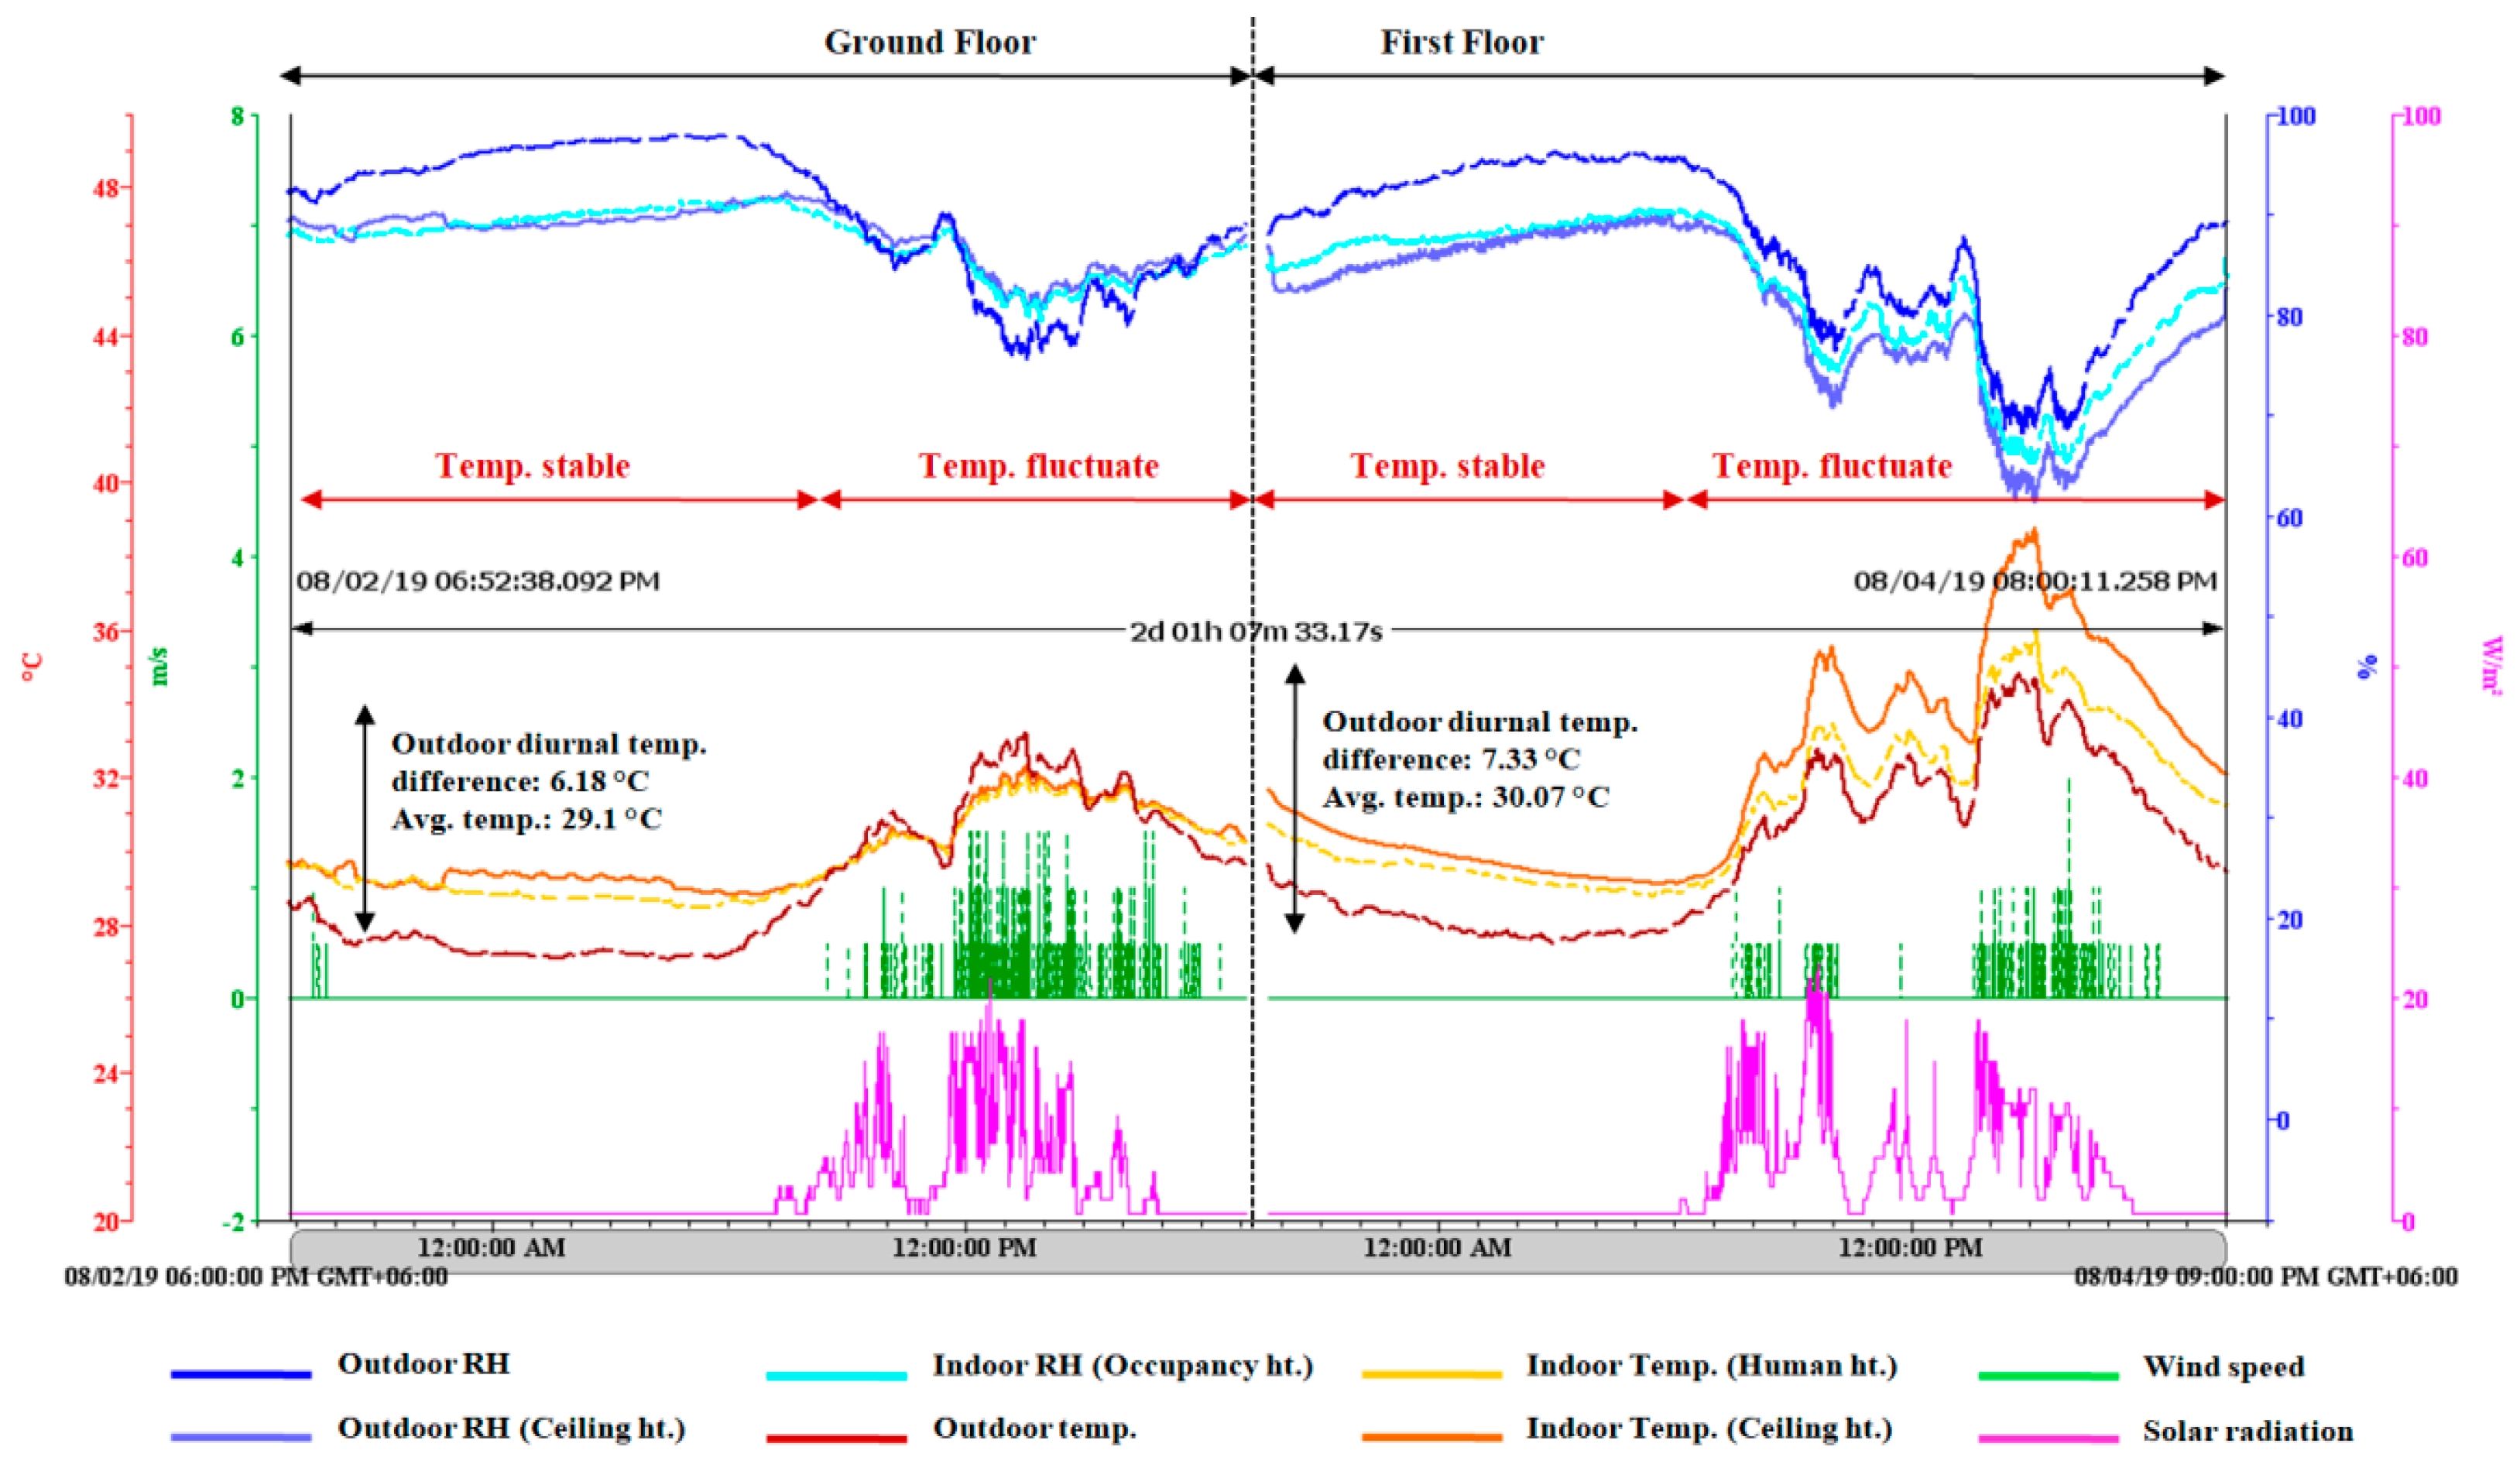
Figure 9 shows 49 h (2–4 August 2019) data of H-2. The instrument was shifted from ground to first floor and early 24 h show ground floor’s while later 24 h show first floor’s indoor thermal environmental data. During the night, ground floor’s human and ceiling ht. indoor AT was higher than outdoor by 1.56 °C and 2.09 °C respectively while during the day it was slightly lower by 1.31 °C and 0.91 °C than outdoors correspondingly. Reason is that upper floor acts as heat barrier for ground floor ceiling while earthen floor radiates storage heat slowly during night. Besides that during night, occupants for security purposes usually kept doors and windows closed which obstructs convective heat loss through ventilation while internal gain from human body and mechanical equipment also contributed towards higher indoor AT. On the first floor, radiant heat from the CI sheet resulted in higher ceiling level AT (38.7 °C) compared to human occupancy level and outdoors.
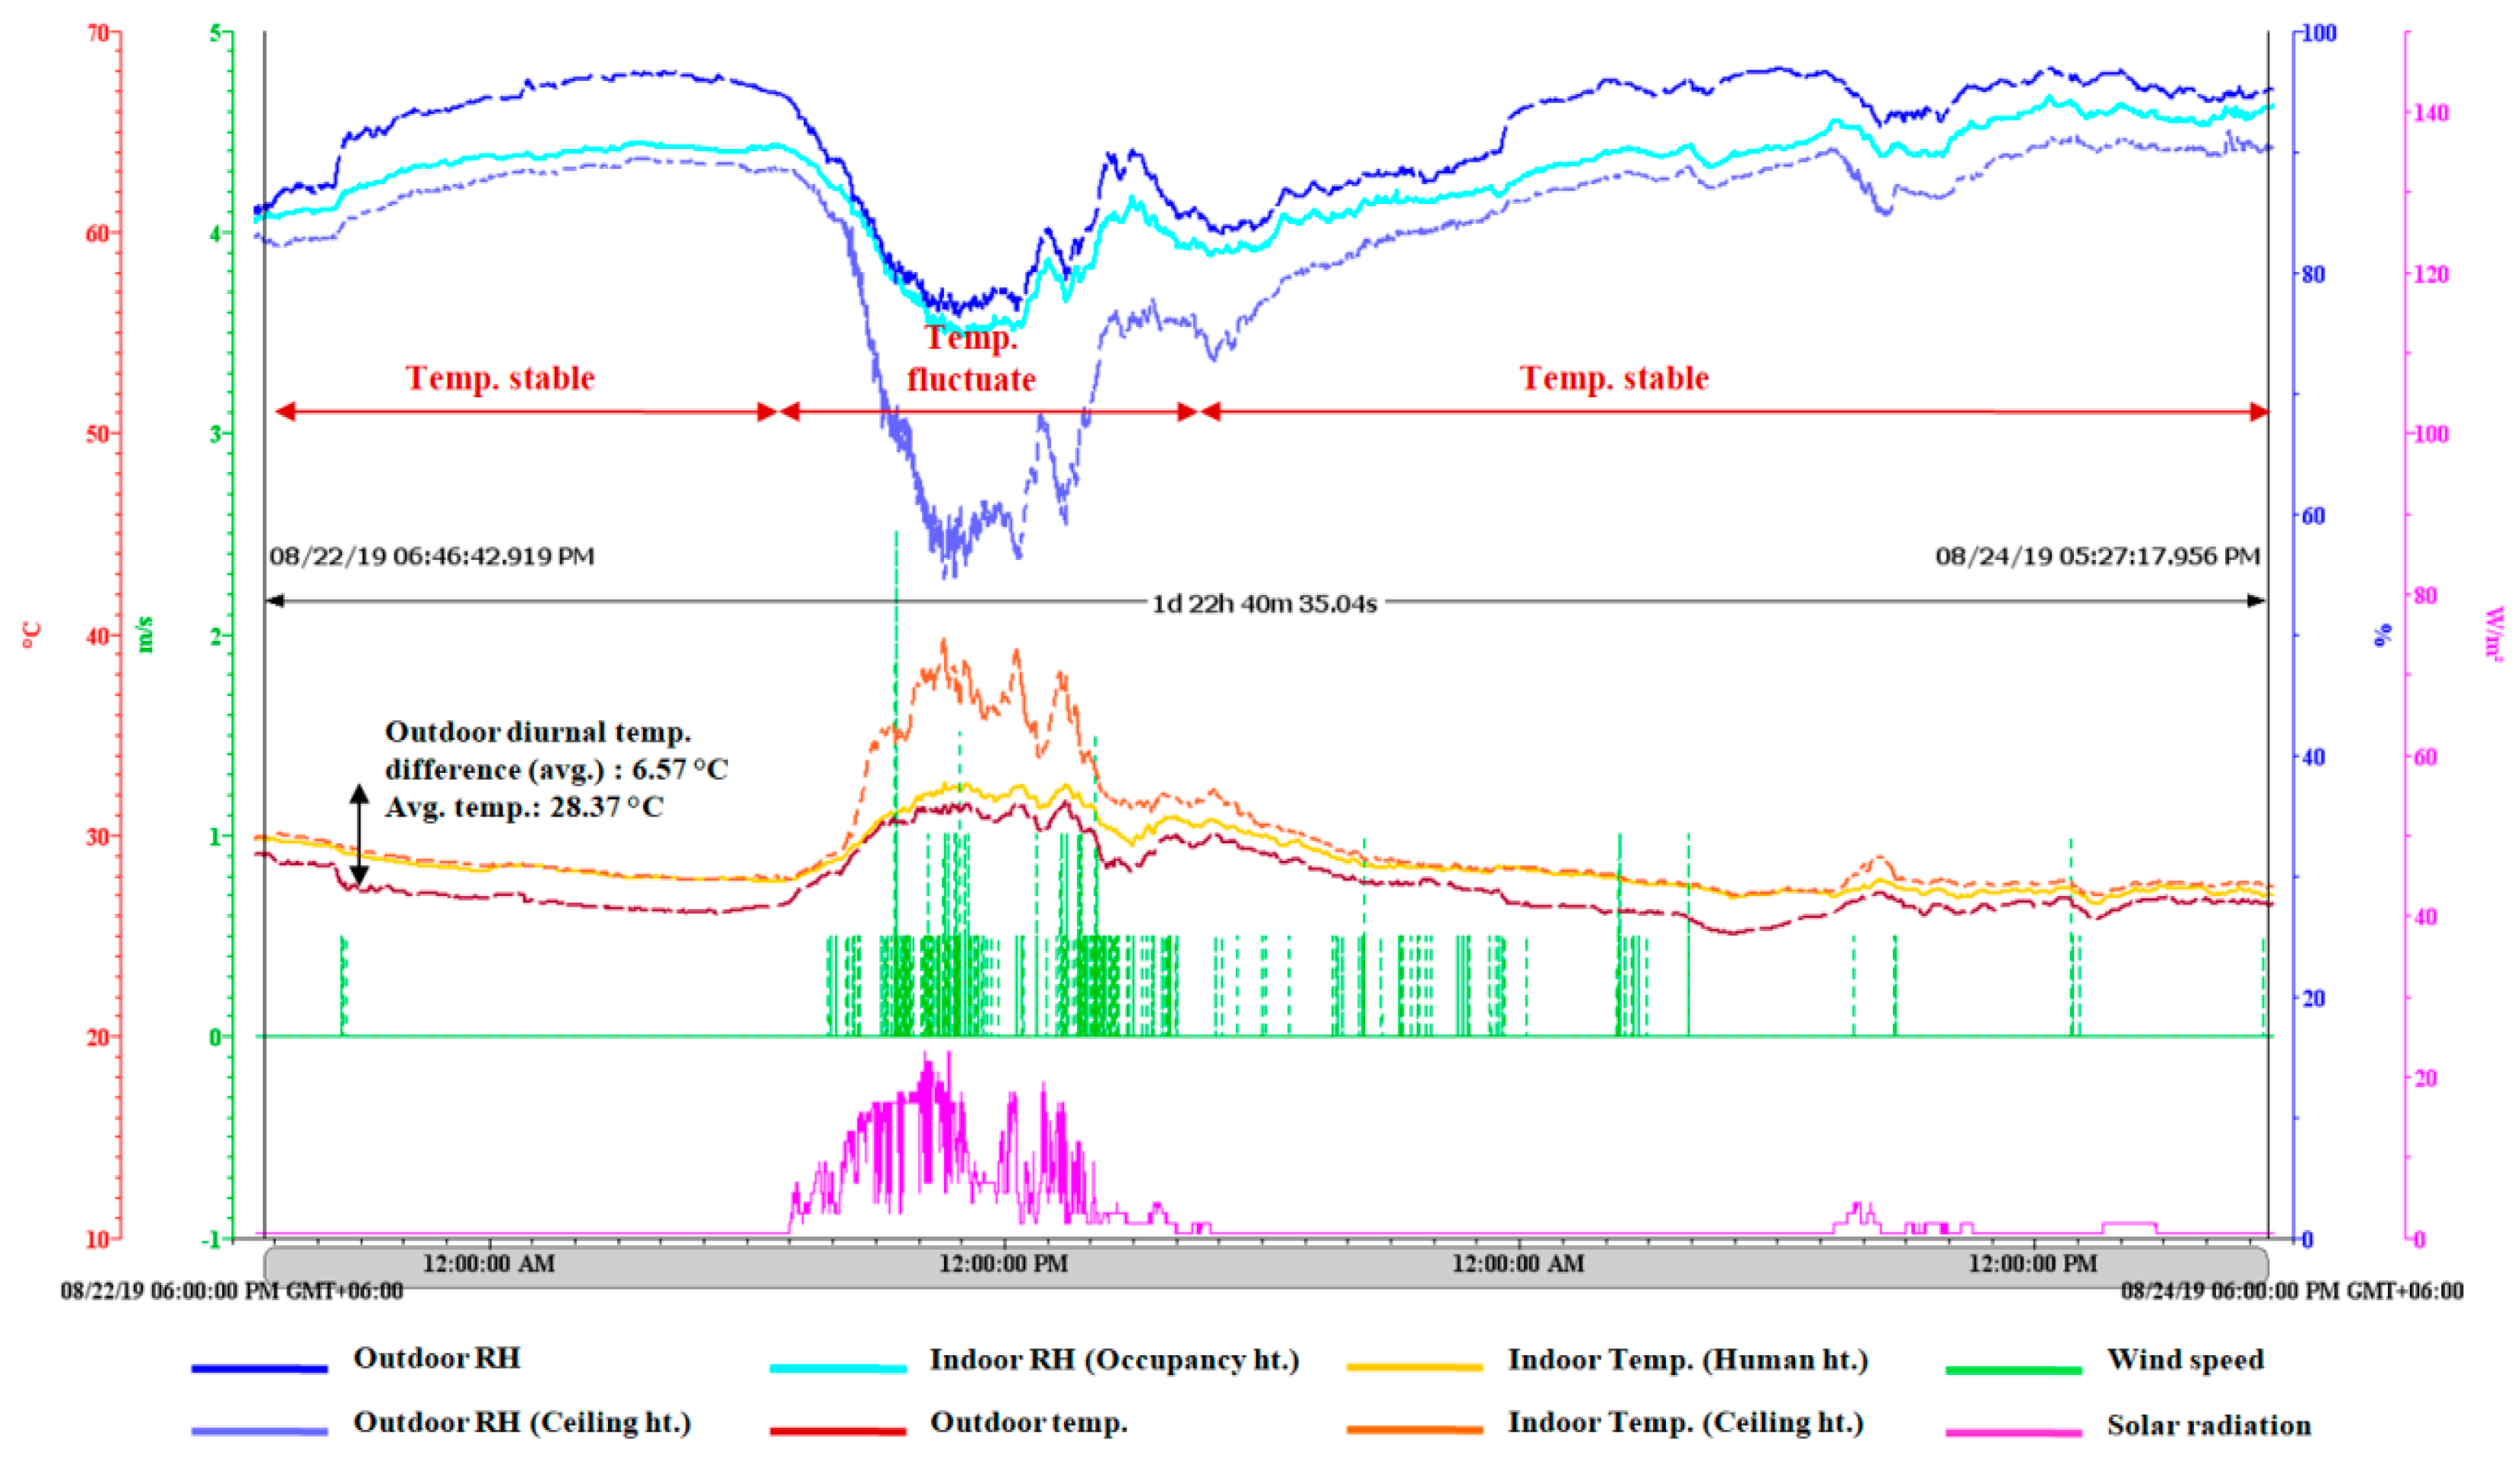
Indoor thermal environmental data (22–24 August 2019) of H-3 for 46 h is presented in Figure 10. The first 24 h cycle shows that outdoor AT fluctuated considerably between 8:00 am–6:00 pm and remained stable at night to early morning. Indoor AT showed a similar scenario. During day, indoor human occupancy level had similar AT that of the outdoor. Ceiling level and outdoor AT had a difference of max. 8.09 °C. In H-3, roof was provided with 19 mm thick wooden shingles just beneath a roof covering resulting in more radiant heat entering indoors compared to H-1 and H-2. Higher room height (average 3.5 m) having no opening at roof level causes warm air to gather at that level.
On the second day, outdoor AT remained almost constant and lower than a typical sunny day because of cloudy weather and rain. Indoor AT was slightly higher and had nearly steady temperature difference with outdoor AT.
In all cases (Figure 8, Figure 9 and Figure 10), open planning and adequate indoor ventilation resulted in nearly no significant difference between indoor and outdoor AT. Indoor AT remained within the comfort range, was slightly higher than outdoor at night. Occupants usually keep doors and windows open during day and closed at night for security purposes. This causes convective heat gain during the day and internal heat gain from different sources as they get trapped. Perforation and the gap between floor/roof and wall allow some natural night ventilation in H-1 and H-2. However, H-3 with its operable window louver had adequate night ventilation which contributed towards convective heat loss resulting in cool indoors early at night. This supports previous result that night-time ventilation improves indoor thermal comfort reducing operative temperature in a hot-humid climate [56].
4.2.3. Occupant’s Subjective Response and Space Use Pattern
People living in single/double-storied houses are mainly involved in agriculture and wood-related business/labor. In silt timber houses people are mainly engaged in agriculture and fishing, but business, crafting, boat-making, weaving, etc. are also common. Their daily activity is simple. Indoor activity includes sleeping, resting, doing daily household chores, cooking and other sedentary activities for which metabolism remains within a range of ≤3. Clothing value ranges from 0.43–0.5 clo. except during winter. Personal parameters of the respondents are presented in Table 7.
Occupants of traditional single/double-storied timber houses found it comfortable late-night to early-morning (10:00 pm–6:00 am). But during the day, the occupant’s perception of indoor thermal environment shifted from neutral to uncomfortable (Appendix B). Most of the respondents of single/double-storied houses found it very uncomfortable between 12:00 pm–3:00 pm. Conversely, occupants of stilt houses found the indoor thermal environment comfortable most of the time. During day-time discomfort hours, most of the respondents preferred staying in an airy place/veranda or only outside for performing daily chores. A small percentage of the respondents preferred changing clothes or taking showers. Occupants stay at houses during night and operation of fan is another way to cope with discomfort period. Table 8 illustrates occupant’s perception of indoor thermal environment.
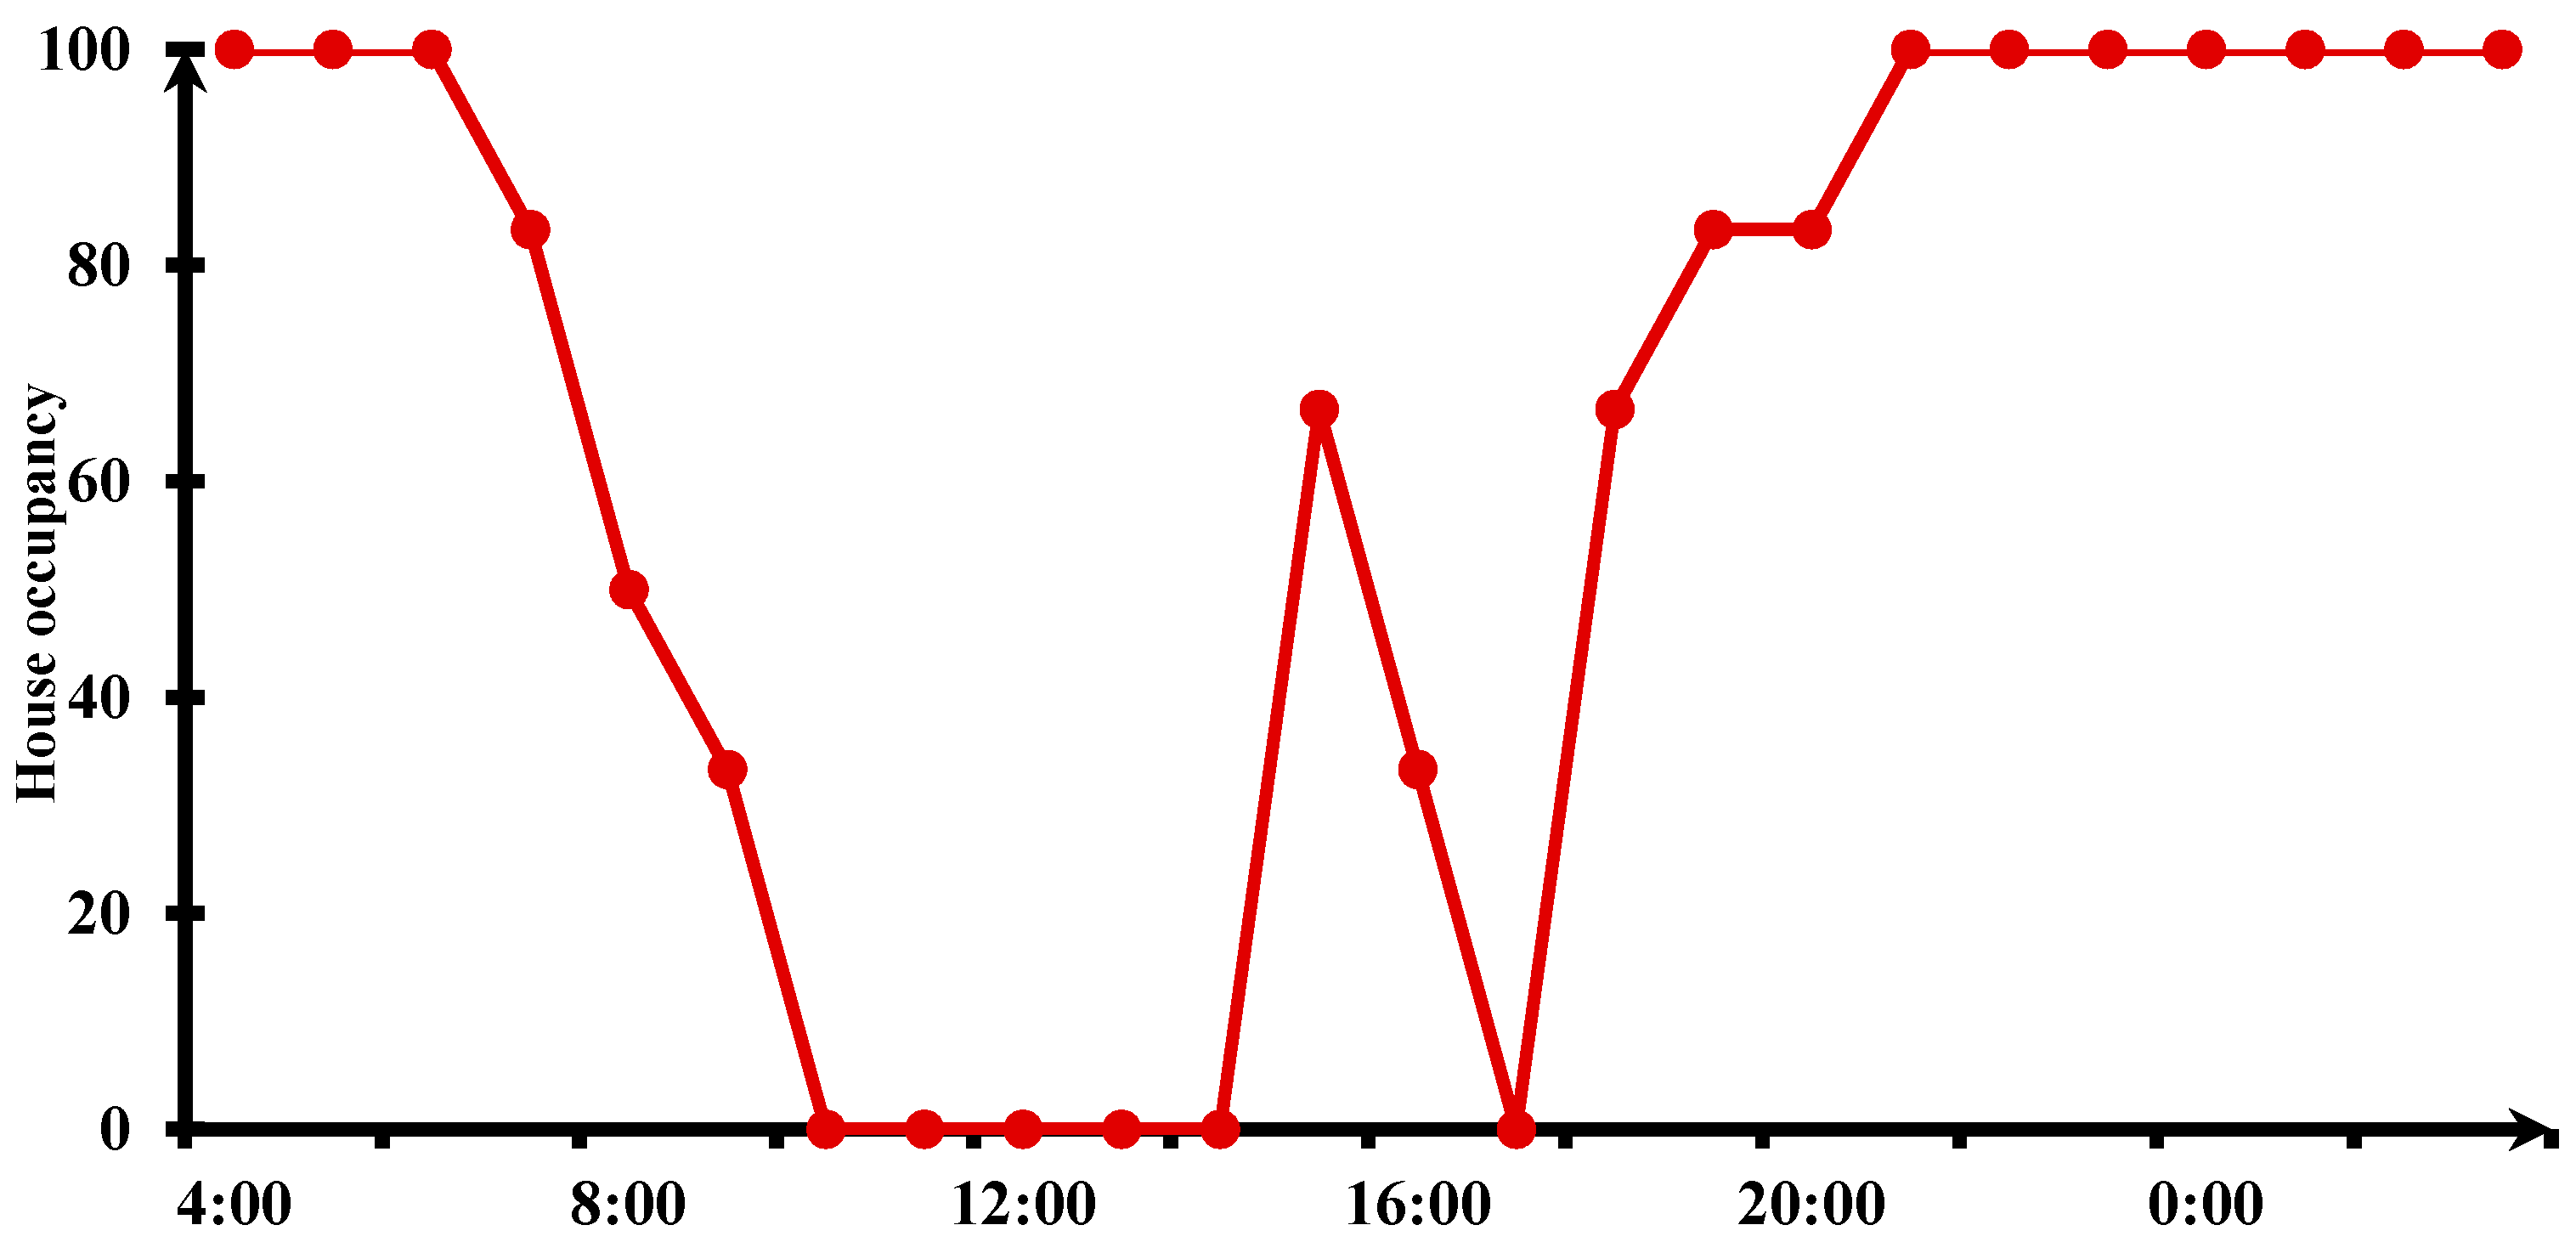
In terms of house occupancy, during the day, male members remain outside most of time while female members stay in the backyard of the house for performing daily household chores. During noon lunch is eaten at service block situated northern part of house. After lunch, female members usually stayed in the back/front yard’s airy spaces for their social interaction with adjacent house’s female members. By late afternoon, when male members returned home, they rested in the front ‘pashchati’ veranda at the south. The main house block is generally used to remain unoccupied during day. At night it is used for sleeping. Similarly, people of stilt houses spend most of their daytime in airy shaded space under elevated platform for performing their daily chores, i.e., cooking, eating, weaving, relaxing, etc. House remained occupied from evening to early morning. Figure 11 illustrates occupant’s frequency of indoor space use for a typical day.
5. Discussion
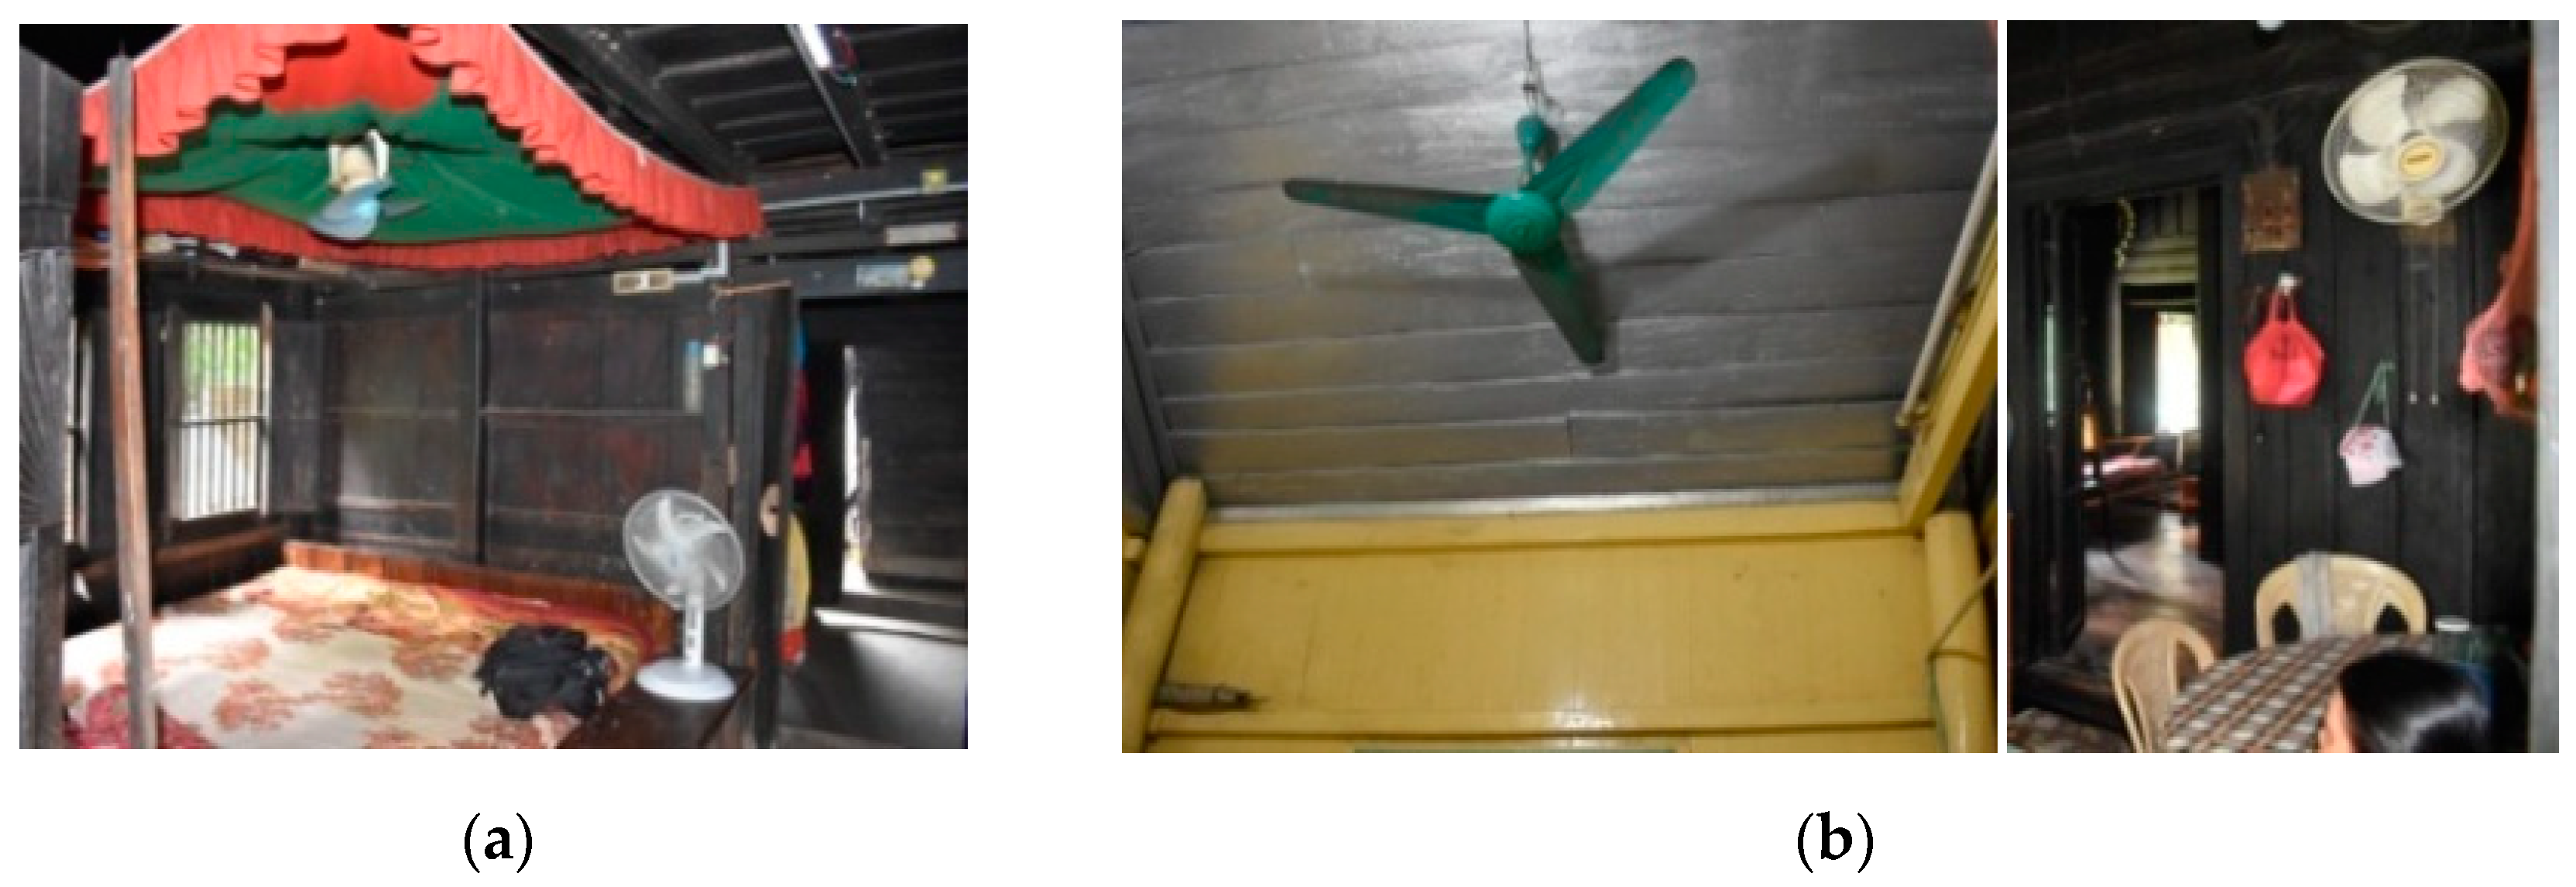
This study aims to understand the relationship between the indoor thermal environment and the occupant’s living patterns in traditional timber houses in tropics. Field observation for collecting qualitative data on adopted passive design strategies regarding indoor thermal comfort, insitu quantitative data monitoring on thermal parameters and questionnaire survey for subjective responses were conducted. Quantitative data-monitoring shows that diurnal temperature variation is low (≤7.2 °C) and indoor AT rise along with outdoor AT without time-lag. In single/double-storied houses, indoor AT rises considerably between 11:00 am–4:00 pm and ground floor AT is lower than first floor which ranges between 32.79–35.99 °C. In stilt timber houses, indoor AT rises sharply between 10:00 am–2:00 pm with value vary between 31.3–32.6 °C. For both cases, indoor AT remains above the thermal comfort range (Section 1.2) during day and occupant’s responses regarding indoor thermal environment indicate uncomfortable conditions. Thus, people barely use the indoor space during day. Occupants usually stay at outdoor spaces like veranda/open-air shaded areas. These spaces are primarily passive design strategies regarding indoor thermal comfort (Table 5). During the night both indoor and outdoor AT remains stable. Although indoor AT is slightly higher than outdoor, it remains within the comfortable range and occupants perceive indoor thermal environment as comfortable. Therefore, timber houses remain occupied mostly from 6:00 pm to 7:00 am. During the period 6:00 pm–12:00 am, indoor AT ranges between 28.9–29.9 °C where stilt houses had a minimum and single/double-storied houses had a maximum indoor AT. The reason is that traditional timber houses are designed as naturally ventilated and stilt houses because of their location near the sea have ample airflow. Multiple openings with operable louver on all sides and opening height at occupancy level help its occupants to use prevailing wind effectively. Besides that room’s significant height causes hot air to gather far away from the human occupancy level which further benefits indoor comfort. However, in single- and double-storied houses the door-window operation most importantly depends on times of the day and security feeling. Occupant opens doors and windows early in the morning between 5:30 am–6:00 am for natural light and ventilation. Opening doors and windows helped reduce indoor temperature by promoting cross-ventilation [58]. During questionnaire survey, 29.26% of respondents of traditional single/double-storied houses responded in terms of opening windows at midnight. In comparison, 61.1% of the respondents of stilt timber houses prefer to open an operable window louver instead of opening a window. Occupant closes doors and windows late at night between 10:00 pm–11:30 pm for security purposes which hampers night ventilation. At night indoor AT ranges between 28.1–29.0 °C and the majority of people use either pedestal or ceiling mounted fan (Figure 12). Operation of fan plays a significant role in occupant’s thermal sensation and acceptance of indoor environment by promoting air movement [23,58]. All the respondents of single/double-storied houses and 89.9% of respondents prefer using a fan during the night although indoor AT was within the comfort level (Figure 7, Figure 8 and Figure 9). This may be because of occupants ‘memories’ of the previous day’s weather conditions that influence people to act differently even under the same conditions [58,59].
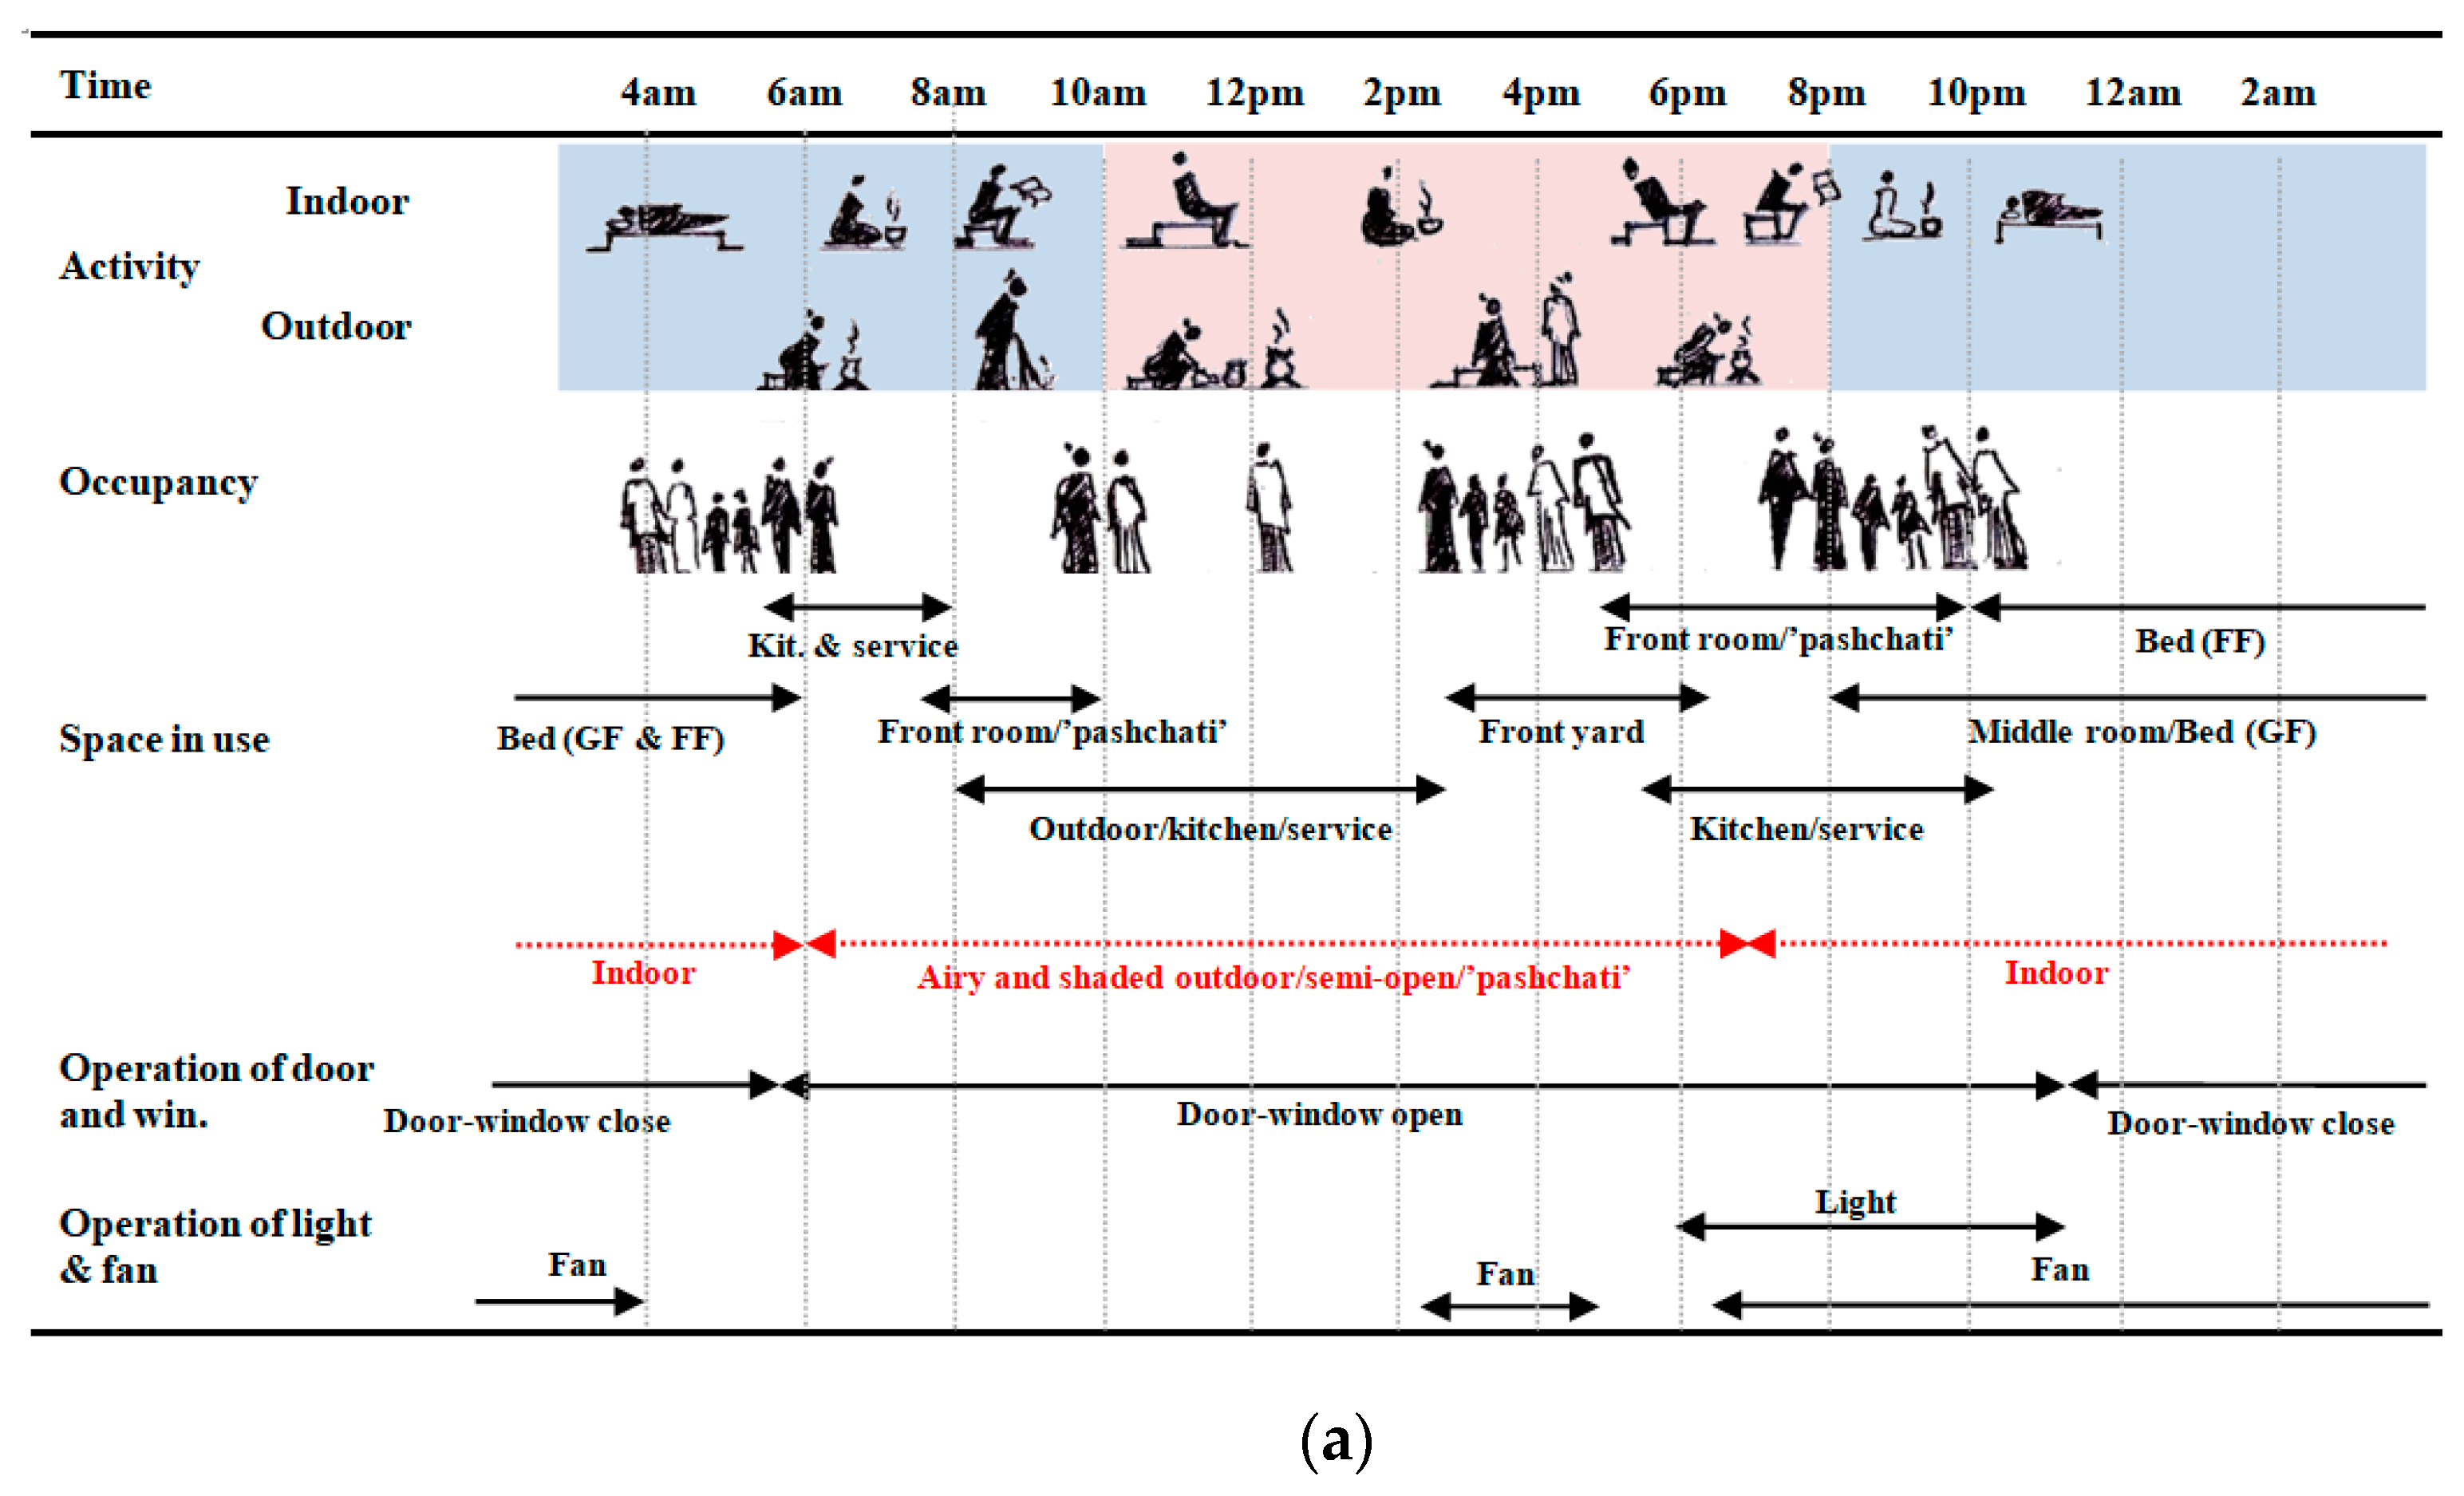
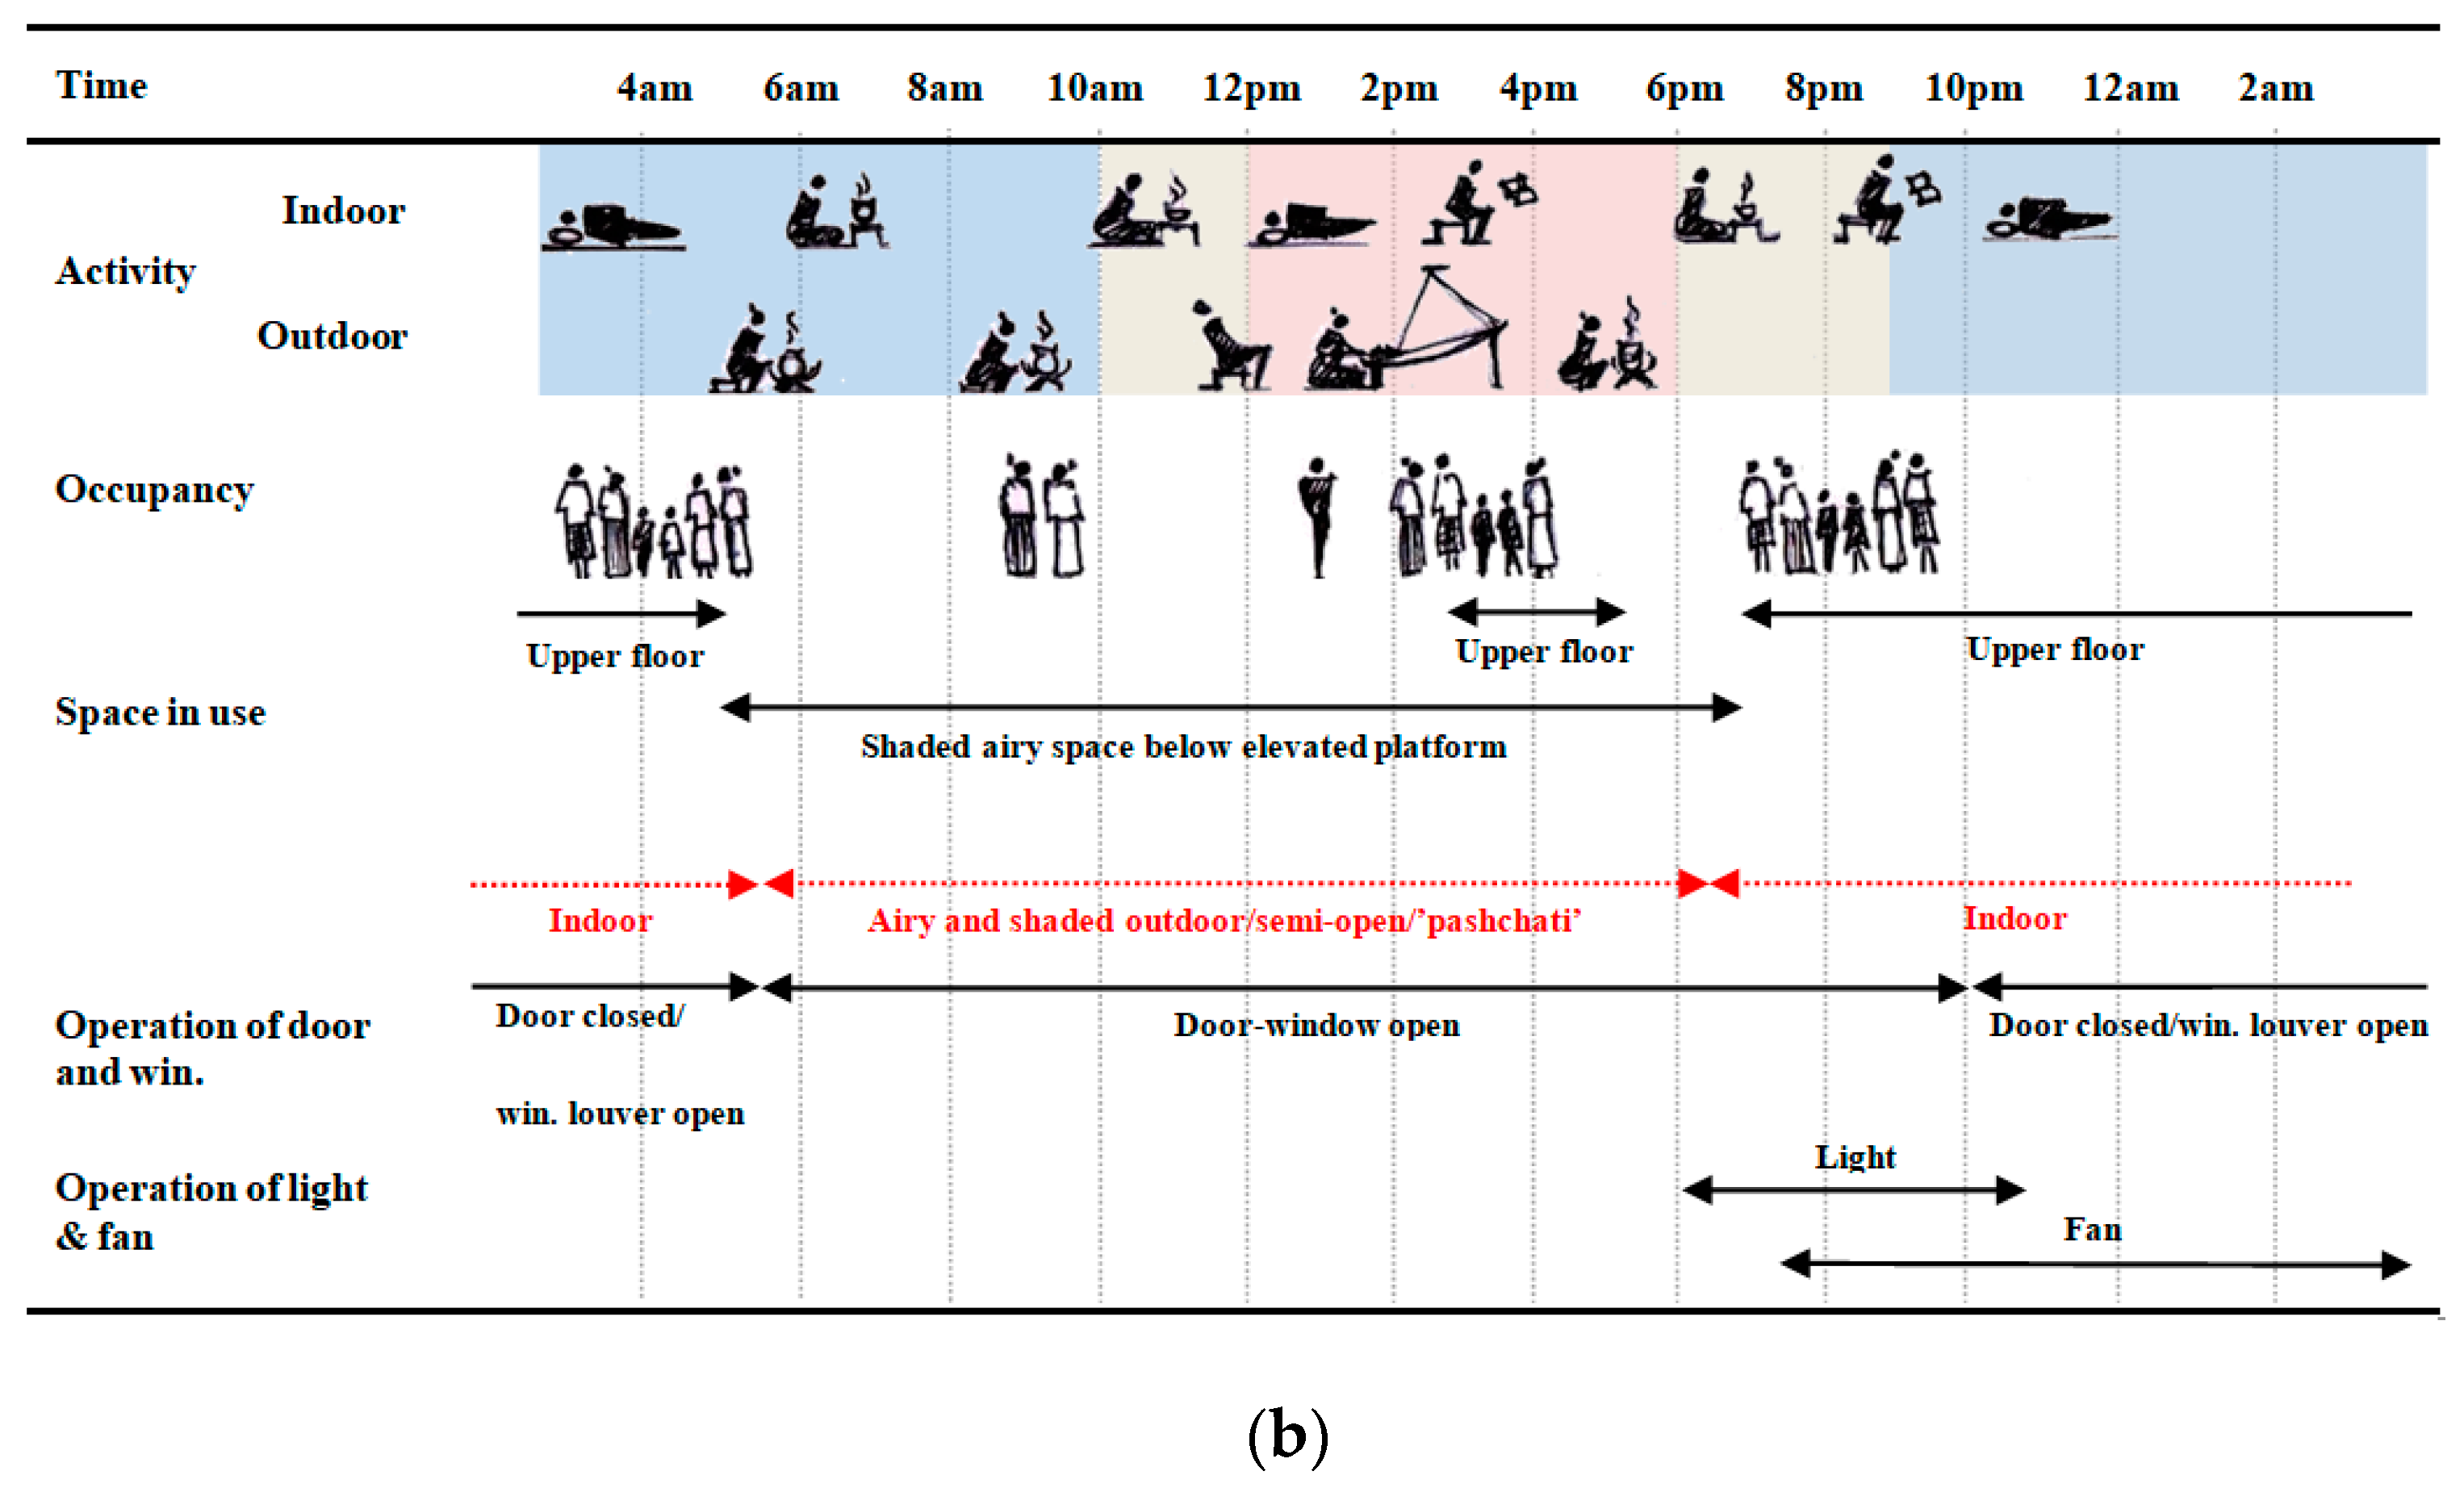
Therefore, it can be concluded that people use indoor spaces mostly during night when the indoors become comfortable and operation of fan is preferred for enhanced indoor comfort. During the day-time overheating period, people usually prefer to stay in airy-shaded outdoor spaces for comfort. From these findings, an interpretational graph has been developed showing relationship between indoor thermal environment and occupant’s living pattern. Figure 13 illustrates the developed interpretational graph for traditional timber houses in the tropics.
However, this study considers only hot and wet monsoon periods. Therefore, consideration of whole year thermal environmental data and subsequent occupant’s living patterns will result in a more reliable interpretation towards assessing relationships between indoor thermal environment and lifestyle adaptation. The current study only gives an overview of subjective parameters, i.e., level of activity, clothing, etc. but detailed consideration of these factors for rationalization was out of the scope of this study. As well as that, inclusion of design factors, i.e., air leakage through perforations, internal gains, etc. will further contribute towards more accurate interpretation.
This study will contribute towards proper occupancy scheduling for assessing thermal performance of traditional timber houses. Moreover, findings will help designers and policy-makers towards developing architectural design strategies considering a dweller’s living patterns that may impact sustainable building development in tropical rural contexts and the occupant’s well-being in future.
Nonetheless, this study uses field data for interpretation between indoor thermal environment and occupant’s living pattern. A simulation study considering aforementioned design factors and actual occupancy schedule will help towards an accurate analysis of the thermal performance of traditional timber houses [60,61]. Therefore, parametric study accommodating critical design and subjective factors that impact thermal performance analysis of traditional timber houses can be one of the key future research directions.
6. Conclusions
This study develops an interpretational graph regarding the relationship between indoor thermal environment and the occupant’s living patterns within traditional timber houses. Indoor thermal environment significantly impacts occupant’s activity and space use pattern inside house. In traditional timber houses, indoor AT fluctuates readily with outdoor AT without a time-lag resulting in daytime overheating. Maximum indoor AT difference of +3.98 °C with upper limit of comfort was found during day while night-time average AT was 29.0 °C. Moreover, the occupant’s perception of indoor thermal environment varies with different times of the day. They found indoor thermal environment as slightly warm to hot and neutral to slightly cool during day and night consecutively. Occupants used to stay on the veranda or in outdoor semi-open spaces during discomfort hours to perform their daily chores while fans are used to enhance indoor comfort as they kept doors and windows closed for security purposes during the night. Thus, uses of space and door-window and fan operation related behavior become a way to cope with discomfort hour of the day. However, detailed consideration of critical design and subjective factors will lead to a more appropriate interpretation. Findings of this study will contribute towards sustainable development in the rural context of the tropics as well as the occupant’s well-being in the future.
Author Contributions
Conceptualization, R.I. and K.S.A.; methodology, R.I.; formal analysis, R.I.; investigation, R.I.; resources, R.I.; data curation, R.I.; writing—original draft preparation, R.I.; writing—review and editing, R.I.; supervision, K.S.A. All authors have read and agreed to the published version of the manuscript.
Funding
This research received no external funding.
Informed Consent Statement
Verbal consent was obtained from all subjects involved in the study.
Acknowledgments
This research is a part of 1st author’s ongoing master’s thesis, Department of Architecture, Bangladesh University of Engineering and Technology (BUET), Dhaka 1000, Bangladesh. Authors are thankful to survey participants for their participation and co-operation throughout the survey.
Conflicts of Interest
The authors declare no conflict of interest.
Appendix A

Table A1.
Max., min and avg. AT and AH of H-1, H-2 and H-3 (Source: Field experiment).
| Outdoor | Indoor (Human Height) | Indoor (Ceiling Height) | ||||||
|---|---|---|---|---|---|---|---|---|
| H-1 | Sample: 8018 | Temp °C | RH% | Temp °C | RH% | Temp °C | RH% | |
| Maximum | 35.42 | 98.1 | 33.52 | 95.2 | 32.72 | 95.4 | ||
| Minimum | 28.22 | 69.7 | 28.77 | 76.6 | 30.95 | 81.9 | ||
| Average | 30.64 | 88.86 | 30.83 | 89.82 | 32.19 | 91.12 | ||
| Standard Deviation(σ) | 2.42 | 8.97 | 1.497 | 5.02 | 0.46 | 3.41 | ||
| Outdoor wind speed: 1.51 m/s (max.) and Solar radiation: 70.6 W/m2 (max.) | ||||||||
| H-2 | Ground Floor | Sample: 8729 | Temp °C | RH% | Temp °C | RH% | Temp °C | RH% |
| Maximum | 33.24 | 97.8 | 32.02 | 91.5 | 32.3 | 92.1 | ||
| Minimum | 27.06 | 75.2 | 28.47 | 79.3 | 28.79 | 80.0 | ||
| Average | 29.1 | 90.56 | 29.76 | 87.46 | 29.98 | 87.9 | ||
| Standard Deviation(σ) | 1.91 | 6.57 | 1.09 | 2.99 | 1.02 | 2.68 | ||
| First Floor | Sample: 8736 | Temp °C | RH% | Temp °C | RH% | Temp °C | RH% | |
| Maximum | 34.81 | 96.2 | 35.99 | 90.6 | 38.78 | 90.0 | ||
| Minimum | 27.48 | 68.2 | 28.74 | 65.1 | 29.12 | 61.2 | ||
| Average | 30.07 | 87.06 | 31.21 | 82.32 | 32.21 | 80.24 | ||
| Standard Deviation(σ) | 2.15 | 7.98 | 2.02 | 7.08 | 2.72 | 7.87 | ||
| Outdoor wind speed: 1.01 m/s (max.) and Solar radiation: 21.9 W/m2 (max.) | ||||||||
| H-3 | Sample: 8619 | Temp °C | RH% | Temp °C | RH% | Temp °C | RH% | |
| Maximum | 31.64 | 96.5 | 32.6 | 90.7 | 39.77 | 89.3 | ||
| Minimum | 26.06 | 76.1 | 27.7 | 74.5 | 27.73 | 54.4 | ||
| Average | 28.37 | 88.21 | 29.5 | 84.88 | 30.82 | 78.9 | ||
| Standard Deviation(σ) | 1.72 | 6.03 | 1.53 | 4.71 | 3.29 | 9.98 | ||
| Outdoor wind speed: 1.01 m/s (max.) and Solar radiation: 23.1 W/m2 (max.), | ||||||||
Appendix B
Table A2.
Thermal sensation of respondents.
| Time | Cold | Cool | Slightly Cool | Neutral | Slightly Warm | Warm | Hot | |
|---|---|---|---|---|---|---|---|---|
| −3 | −2 | −1 | 0 | 1 | 2 | 3 | ||
| Single/Double storied | 4 am–6 am | 56.1 | 43.9 | |||||
| 7 am–9 am | 9.75 | 78.05 | 12.2 | |||||
| 10 am–12 pm | 21.95 | 78.05 | ||||||
| 1 pm–3 pm | 12.2 | 87.8 | ||||||
| 4 pm–6 pm | 21.95 | 65.85 | 12.2 | |||||
| 7 pm–9 pm | 21.95 | 43.9 | 34.15 | |||||
| 10 pm–12 am | 12.2 | 56.1 | 31.7 | |||||
| 1 am–3 am | 21.95 | 56.1 | 21.95 | |||||
| Stilt | 4 am–6 am | 83.33 | 16.67 | |||||
| 7 am–9 am | 11.11 | 61.11 | 27.78 | |||||
| 10 am–12 pm | 11.11 | 27.78 | 50 | 11.11 | ||||
| 1 pm–3 pm | 61.11 | 38.89 | ||||||
| 4 pm–6 pm | 27.78 | 55.55 | 16.67 | |||||
| 7 pm–9 pm | 50 | 38.89 | 11.11 | |||||
| 10 pm–12 am | 38.89 | 44.44 | 16.67 | |||||
| 1 am–3 am | 27.78 | 55.55 | 16.67 |
Note: Highlighted values shows the response of participant nearly or above 50%. Cold ; Cool ; Slightly Cool ; Neutral ; Slightly Warm ; Warm ; Hot .
Table A3.
Thermal perception of respondents.
| Time/Perception (%) | Very Com. | Com. | Slightly Com. | Neutral | Slightly Uncom. | Uncom. | Very Uncom | |
|---|---|---|---|---|---|---|---|---|
| −3 | −2 | −1 | 0 | 1 | 2 | 3 | ||
| Single/Double storied | 4 am–6 am | 29.27 | 70.73 | |||||
| 7 am–9 am | 68.29 | 21.95 | 9.75 | |||||
| 10 am–12 pm | 9.75 | 12.2 | 39.03 | 29.27 | 9.75 | |||
| 1 pm–3 pm | 7.32 | 14.63 | 34.15 | 43.9 | ||||
| 4 pm–6 pm | 19.51 | 29.27 | 39.02 | 12.2 | ||||
| 7 pm–9 pm | 21.95 | 34.14 | 43.91 | |||||
| 10 pm–12 am | 21.95 | 43.9 | 21.95 | 12.2 | ||||
| 1 am–3 am | 12.2 | 80.49 | 7.31 | |||||
| Stilt | 4 am–6 am | 11.11 | 88.89 | |||||
| 7 am–9 am | 83.33 | 16.67 | ||||||
| 10 am–12 pm | 61.11 | 38.89 | ||||||
| 1 pm–3 pm | 11.11 | 16.66 | 66.67 | 5.56 | ||||
| 4 pm–6 pm | 27.78 | 66.67 | 5.56 | |||||
| 7 pm–9 pm | 33.33 | 50 | 16.66 | |||||
| 10 pm–12 am | 44.45 | 27.78 | 16.66 | 11.11 | ||||
| 1 am–3 am | 11.11 | 66.67 | 22.22 | |||||
Note: Highlighted values shows the response of participant nearly or above 50%. Very Comfortable ; Comfortable ; Slightly Comfortable ; Neutral ; Very Uncomfortable ; Uncomfortable ; Slightly Uncomfortable .
References
- Cao, X.; Dai, X.; Liu, J. Building energy-consumption status worldwide and the state-of-the-art technologies for zero-energy buildings during the past decade. Energy Build. 2016, 128, 198–213. [Google Scholar] [CrossRef]
- Laustsen, J. Energy Efficiency Requirements in Building Codes, Energy Efficiency Policies for New Buildings; IEA: Paris, France, 2008. [Google Scholar]
- International Energy Agency. Online Data Services. Available online: http://data.iea.org/ieastore/statslisting.asp (accessed on 28 January 2021).
- Alzoubi, H.H.; Almalkawi, A.T. A comparative study for the traditional and modern houses in terms of thermal comfort and energy consumption in Umm Qais city, Jordan. J. Ecol. Eng. 2019, 20, 14–22. [Google Scholar] [CrossRef]
- Mofidi, S.M. Methodology for selection of climatic settlements in the study of urban form history. In Proceedings of the Research Conference in Built and Human Environment, Salford, UK, 15–16 March 2001. [Google Scholar]
- Korboe, D. Family-houses in Ghanaian Cities: To be or not to be? Urban Stud. 1992, 29, 1159–1171. [Google Scholar] [CrossRef]
- Pereira, P.F.; Ramos, N.M.; Almeida, R.M.; Simões, M.L.; Barreira, E. Occupant influence on residential ventilation patterns in mild climate conditions. Energy Procedia 2017, 132, 837–842. [Google Scholar] [CrossRef]
- Evola, G.; Marletta, L.; Costanzo, V.; Caruso, G. Different strategies for improving summer thermal comfort in heavyweight traditional buildings. Energy Procedia 2015, 78, 3228–3233. [Google Scholar] [CrossRef] [Green Version]
- Kvisgaard, B.; Collet, P.F. Occupants influence on air change in dwellings. In Proceedings of the Comunicação Apresentada em 7th AIC Conference, Stratford-upon-Avon, UK, 29 September–2 October 1986. [Google Scholar]
- Nguyen, A.T.; Singh, M.K.; Reiter, S. An adaptive thermal comfort model for hot humid South-East Asia. Build. Environ. 2012, 56, 291–300. [Google Scholar] [CrossRef] [Green Version]
- Singh, M.K.; Mahapatra, S.; Atreya, S. Solar passive features in vernacular architecture of North-East India. Sol. Energy 2011, 85, 2011–2022. [Google Scholar] [CrossRef]
- Singh, M.K.; Mahapatra, S.; Atreya, S. Thermal performance study and evaluation of comfort temperatures in vernacular buildings of North-East India. Build. Environ. 2010, 45, 320–329. [Google Scholar] [CrossRef]
- Huang, L.; Zhu, Y.X.; Ouyang, Q.; Cao, B. Field survey of indoor thermal comfort in rural housing of northern China in heating season. J. Southeast Univ. 2010, 26, 169–172. [Google Scholar]
- Hong, T.; Yan, D.; D’Oca, S.; Chen, C.-F. Ten questions concerning occupant behavior in buildings: The big picture. Build. Environ. 2017, 114, 518–530. [Google Scholar] [CrossRef] [Green Version]
- Oliver, P. Encyclopedia of Vernacular Architecture of the World; Cambridge University Press: Cambridge, UK, 1997; Volume 3. [Google Scholar]
- Oliver, P. Earth as a building material today. Oxf. Art J. 1983, 5, 31–38. [Google Scholar] [CrossRef]
- Sassu, M. Vernacular Housing Construction; University of Pisa: Pisa, Italy, 2002. [Google Scholar]
- Adekunle, T.O. Thermal Performance of Low-Carbon Prefabricated Timber Housing in the UK; University of Kent: Kent, UK, 2014. [Google Scholar]
- Adekunle, T.O.; Nikolopoulou, M. Thermal comfort, summertime temperatures and overheating in prefabricated timber housing. Build. Environ. 2016, 103, 21–35. [Google Scholar] [CrossRef]
- Adekunle, T.O.; Nikolopoulou, M. Winter performance, occupants comfort and cold stress in prefabricated timber buildings. Build. Environ. 2019, 149, 220–240. [Google Scholar] [CrossRef]
- Kholil, A. A thermal performance comparison of residential envelopes at the tropical highland for occupants thermal comfort. Earth Environ. Sci. 2018, 200, 012034. [Google Scholar]
- Prianto, E.; Setyowati, E. Thermal comfort of wood-wall house in coastal and mountainous region in tropical area. Procedia Eng. 2015, 125, 725–731. [Google Scholar] [CrossRef]
- Mallick, F.H. Thermal Comfort for Urban Housing in Bangladesh. Ph.D. Thesis, Architectural Association School of Architecture, London, UK, 1994. Unpublished work. [Google Scholar]
- Ahmed, K.S. Approaches to Bioclimatic Urban Design for the Tropics with Special Reference to Dhaka, Bangladesh. Ph.D. Thesis, Architectural Association School of Architecture, London, UK, 1995. Unpublished work. [Google Scholar]
- Ahsan, T. Passive Design Features for energy-Efficient Residential Buildings in Tropical Climates: The context of Dhaka, Bangladesh. Master’s Thesis, KTH Institute, Stockholm, Sweden, 2009. Unpublished work. [Google Scholar]
- Mridha, A.M.M.H. A study of Thermal Performance of Operable Roof Insulation, with special Reference to Dhaka. Master’s Thesis, Bangladesh University of Engineering and Technology, Dhaka, Bangladesh, 2002; pp. 8–12, Unpublished work. [Google Scholar]
- Meteoblue. Climate Data. Available online: https://www.meteoblue.com (accessed on 1 August 2020).
- American Society of Heating, Refrigerating and Air-Conditioning Engineers; American National Standards Institute. Thermal Environmental Conditions for Human Occupancy; American Society of Heating, Refrigerating and Air-Conditioning Engineers (ASHRAE): Atlanta, GA, USA, 2017. [Google Scholar]
- Brager, G.S.; De Dear, R.J. Thermal adaptation in the built environment: A literature review. Energy Build. 1998, 27, 83–96. [Google Scholar] [CrossRef] [Green Version]
- De Dear, R.J.; Brager, G.S. Thermal comfort in naturally ventilated buildings: Revisions to ASHRAE standard. Energy Build. 2002, 34, 549–561. [Google Scholar] [CrossRef] [Green Version]
- Auliciems, A. Towards a psycho-physiological model of thermal perception. Int. J. Biometeorol. 1981, 25, 109–122. [Google Scholar] [CrossRef] [PubMed]
- Rajasekar, E.; Ramachandraiah, A. Adaptive comfort and thermal expectations—A subjective evaluation in hot humid climate. In Proceedings of the Adapting to Change: New Thinking on Comfort Conference, Windsor, UK, 9–11 April 2010; pp. 9–11. [Google Scholar]
- Givoni, B. Comfort, climate analysis and building design guidelines. Energy Build. 1992, 18, 11–23. [Google Scholar] [CrossRef]
- Humphreys, M. Outdoor temperature and comfort indoors. Build. Res. Establ. Curr. Pap. 1978, 6, 53–78. [Google Scholar] [CrossRef]
- Ahmed, Z.N. Assessment of Residential Sites in Dhaka with Respect to Solar Radiation Gain. Ph.D. Thesis, De Montfort University in collaboration with the University of Sheffield, Leicester, UK, Sheffield, UK, 1994. [Google Scholar]
- Ahmad, M.H.; Rashid, R. Thermal comfort of Bangladesh traditional house in a high density environment with the worst surroundings condition in Dhaka City: A case study at a Bangladesh traditional house at Gulshan in Dhaka City. In Proceedings of the Conference on Technology and Sustainability in the Built Environment (TSBE), Riyadh, Saudi Arabia, 3–6 January 2010. [Google Scholar]
- Mallick, F.H. Thermal comfort and building design in the tropical climates. Energy Build. 1996, 23, 161–167. [Google Scholar] [CrossRef]
- Sharma, M.R.; Ali, S. Tropical summer index—A study of thermal comfort of Indian subjects. Build. Environ. 1986, 21, 11–24. [Google Scholar] [CrossRef]
- Madrigal, J.A.; Cabello, J.J.; Sagastume, A.; Balbis, M. Evaluación de la climatización en locales comerciales, integrandotécnicas de termografía, simulación y modeladoporelementosfinitos. Inf. Tecnol. 2018, 29, 179–188. [Google Scholar] [CrossRef]
- Chowdhury, S.; Noguchi, M.; Doloi, H. Defining Domestic Environmental Experience for Occupants’ Mental Health and Wellbeing. Designs 2020, 4, 26. [Google Scholar] [CrossRef]
- Gagge, A.; Stolwijk, J.; Hardy, J. Comfort and thermal sensations and associated physiological responses at various ambient temperatures. Environ. Res. 1967, 1, 1–20. [Google Scholar] [CrossRef]
- Amasuomo, T.T.; Amasuomo, J.O. Perceived thermal discomfort and stress behaviours affecting studentslearning in lecture theatres in the humid tropics. Buildings 2016, 6, 18. [Google Scholar] [CrossRef] [Green Version]
- Nicol, J.F.; Humphreys, M.A. Adaptive thermal comfort and sustainable thermal standards for buildings. Energy Build. 2002, 34, 563–572. [Google Scholar] [CrossRef]
- Thermal Conductivity. Available online: https://www.engineeringtoolbox.com/thermal-conductivity-d_429.html (accessed on 12 December 2020).
- Chowdhury, S.; Ahmed, K.S.; Hamada, Y. Thermal performance evaluation of cavity air-gap for tropical factory envelope. Int. J. Archit. Eng. Constr. 2016, 6, 1–12. [Google Scholar]
- Hadden, R.; Bartlett, A.; Hidalgo, J.P.; Santamaria, S.; Wiesner, F.; Bisby, L.A.; Deeny, S.; Lane, B. Effects of exposed cross laminated timber on compartment fire dynamics. Fire Saf. J. 2017, 91, 480–489. [Google Scholar] [CrossRef]
- Wade, C.; Spearpoint, M.; Fleischmann, C.; Baker, G.; Abu, A. Predicting the fire dynamics of exposed timber surfaces in compartments using a two-zone model. Fire Technol. 2018, 54, 893–920. [Google Scholar] [CrossRef]
- Engineering Toolbox. Heat Loss Transmission. Available online: https://www.engineeringtoolbox.com/heat-loss-transmission-d_748.html (accessed on 2 August 2020).
- International Organization of Standardization (ISO). Ergonomics of the Thermal Environment-Instruments for Measuring Physical Quantities; International Organization for Standardization: Geneva, Switzerland, 1998. [Google Scholar]
- Wong, N.; Feriadi, H.; Lim, P.; Tham, K.W.; Sekhar, C.; Cheong, K.; Cheong, D. Thermal comfort evaluation of naturally ventilated public housing in Singapore. Build. Environ. 2002, 37, 1267–1277. [Google Scholar] [CrossRef]
- Wang, Z.; Zhang, L.; Zhao, J.; He, Y. Thermal comfort for naturally ventilated residential buildings in Harbin. Energy Build. 2010, 42, 2406–2415. [Google Scholar] [CrossRef]
- Feriadi, H.; Wong, N.H. Thermal comfort for naturally ventilated houses in Indonesia. Energy Build. 2004, 36, 614–626. [Google Scholar] [CrossRef]
- Nguyen, A.-T.; Tran, Q.-B.; Tran, D.-Q.; Reiter, S. An investigation on climate responsive design strategies of vernacular housing in Vietnam. Build. Environ. 2011, 46, 2088–2106. [Google Scholar] [CrossRef] [Green Version]
- Cheng, V.; Ng, E.; Givoni, B. Effect of envelope colour and thermal mass on indoor temperatures in hot humid climate. Sol. Energy 2005, 78, 528–534. [Google Scholar] [CrossRef]
- Givoni, B. Estimation of the Effect of Climate on Man: Development of a New Thermal Index; Hebrew University: Jerusalem, Israel, 1963. [Google Scholar]
- Kubota, T.; Chyee, D.T.H.; Ahmad, S. The effects of night ventilation technique on indoor thermal environment for residential buildings in hot-humid climate of Malaysia. Energy Build. 2009, 41, 829–839. [Google Scholar] [CrossRef]
- Engineering ToolBox. Clo-Clothing and Thermal Insulation. Available online: https://www.engineeringtoolbox.com/clo-clothing-thermal-insulation-d_732.html (accessed on 2 August 2020).
- Raja, I.A.; Nicol, J.F.; McCartney, K.J.; Humphreys, M.A. Thermal comfort: Use of controls in naturally ventilated buildings. Energy Build. 2001, 33, 235–244. [Google Scholar] [CrossRef]
- Stazi, F.; Naspi, F.; D’Orazio, M. A literature review on driving factors and contextual events influencing occupants’ behaviours in buildings. Build. Environ. 2017, 118, 40–66. [Google Scholar] [CrossRef]
- Bianchi, C.; Zhang, L.; Goldwasser, D.; Parker, A.; Horsey, H. Modeling occupancy-driven building loads for large and diversified building stocks through the use of parametric schedules. Appl. Energy 2020, 276, 115470. [Google Scholar] [CrossRef]
- Dong, B.; Yan, D.; Li, Z.; Jin, Y.; Feng, X.; Fontenot, H. Modeling occupancy and behavior for better building design and operation—A critical review. Build. Simul. 2018, 11, 899–921. [Google Scholar] [CrossRef]
Figure 1.
Conceptual framework of the study (Illustration: Author, based on literature survey).

Figure 2.
Structure of the study.

Figure 3.
Cross-sectional view of the traditional timber houses: (a) double-storied (b) stilt.

Figure 4.
Data interpretation strategy.

Figure 5.
Surface temperature of H-1: (a) outdoors, (b) indoor west wall, (c) south wall and (d) attic.
Figure 5.
Surface temperature of H-1: (a) outdoors, (b) indoor west wall, (c) south wall and (d) attic.

Figure 6.
Surface temperature of H-2: (a) outdoors, (b) first and (c) ground floor.

Figure 7.
Surface temperature of H-3: (a) outdoor, (b) under elevated platform, (c) roof and (d) room interior.
Figure 7.
Surface temperature of H-3: (a) outdoor, (b) under elevated platform, (c) roof and (d) room interior.

Figure 8.
Indoor thermal performance of H-1 (Source: Field data from HOBO weather station).

Figure 9.
Indoor thermal performance of H-2 (Source: Field data from HOBO weather station).

Figure 10.
Indoor thermal performance of H-3 (Source: Field data from HOBO weather station).

Figure 11.
Frequency of indoor space use of the traditional timber house.

Figure 12.
Installation of light and fan: (a) single/double-storied, (b) stilt timber house.

Figure 13.
Relationship between indoor thermal experience and occupant’s living pattern in traditional timber houses: (a) single/double-storied house; (b) stilt house; Note: Responses nearly 50% or above: (−3 to −1) (0) (+1 to +3).
Figure 13.
Relationship between indoor thermal experience and occupant’s living pattern in traditional timber houses: (a) single/double-storied house; (b) stilt house; Note: Responses nearly 50% or above: (−3 to −1) (0) (+1 to +3).


Table 1.
Monthly climate data of Cox’s Bazaar and Pirojpur.
| Month/Variables | Jan. | Feb. | Mar. | Apr. | May | Jun. | Jul. | Aug. | Sep. | Oct. | Nov. | Dec. | ||
|---|---|---|---|---|---|---|---|---|---|---|---|---|---|---|
| Cox’s Bazaar | Temp. (°C) | Max | 26.7 | 28.5 | 30.9 | 32.1 | 32.3 | 30.7 | 30.0 | 30.2 | 30.9 | 31.6 | 30 | 27.5 |
| Min | 15.0 | 17.0 | 20.7 | 23.9 | 25.1 | 25.2 | 25.1 | 25.0 | 25.0 | 24.3 | 21.1 | 16.6 | ||
| Precip. (mm) | 4.1 | 17 | 34.7 | 121.8 | 286.8 | 801.9 | 924.6 | 667.1 | 330.1 | 213.6 | 109.4 | 13.0 | ||
| RH (%) | 72 | 71 | 75 | 78 | 80 | 87 | 89 | 88 | 86 | 82 | 77 | 74 | ||
| Projpur | Temp. (°C) | Max | 25.6 | 28.2 | 32.2 | 33.4 | 33.0 | 31.7 | 30.8 | 30.9 | 31.5 | 31.6 | 29.6 | 26.5 |
| Min | 11.9 | 14.9 | 20.2 | 23.6 | 24.7 | 25.6 | 25.5 | 25.6 | 25.3 | 23.6 | 18.8 | 13.3 | ||
| Precip. (mm) | 8.9 | 27.0 | 57.1 | 132.3 | 232.9 | 408.4 | 407.3 | 371.3 | 259.4 | 158.6 | 52.4 | 12.6 | ||
| RH (%) | 81 | 78 | 76 | 80 | 83 | 88 | 90 | 89 | 89 | 87 | 84 | 83 | ||
Table 2.
Thermal properties of materials of traditional timber house.
| Material | Conductivity (W/m-K) | Density (Kg/m3) | Specific Heat (J/kg-K) | U-Value (W/m2-K) | Reference |
|---|---|---|---|---|---|
| Earthen floor | 0.5~1.4 | - | - | - | [44] |
| Concrete (cement:sand:agg=1:2:4) | 1.34 | 2487 | 670~850 | - | [45] |
| Local brick | 0.55~1.34 | 1200~1790 | 1172~1450 | - | [45] |
| Plaster (cement:sand = 1:5) | 0.43 | 2375 | 650~753 | - | [45] |
| Timber (wall/flooring) | 0.13–0.14 | 515–650 | 1200–1600 | 1.48 | [46,47] |
| CI sheet | - | - | - | 8.5 | [48] |
Table 3.
Instrument position in plan and section.
| Type | Instrument Position in Plan | Instrument Height in Section |
|---|---|---|
| H-1 (Single-storied) |  |  |
| H-2(Double storied) |  |  |
| H-3(Stilt house) |  |  |
Table 4.
Instruments used and their properties.
| Instrument | Environmental indicator | Accuracy | Image |
|---|---|---|---|
| HOBO U30 with smart sensor | Environmental/Energy Monitoring System:
| ± 0.25% of FSR from 50 mV to FSV (range −40 to 60 °C) |  |
| FLIR Z-CAMERA | Thermal Digital Camera: forms an image using infrared radiation | ±2 °C (±3.6 °F) or ±2% of reading for ambient temperature 15 °C to 35 °C (59 °F to 95 °F) and object temp. above 0 °C (32 °F) |  |
| MT4 Laser Non-Contact Thermometer | Surface temperature | 98% (range 0–750 °C) |  |
| Environmental Quality Meter |
| ±5%@calibrated wavelength 633 nm/1 mW (range: 0~40 °C, 80% non condensing, maximum) |  |
Table 5.
Adopted passive design strategies related to indoor thermal environment.
| Traditional Single/Double-Storied Timber House | Stilt Timber House | ||
|---|---|---|---|
| Design Strategies | Graphical Illustration | Design Strategies | Graphical Illustration |
| Smaller arm-side of the house towards south. Facing south while placing the main block in the middle for protection from direct sun. |  | Smaller arm-side towards south. Facing south or east. Layout of plan for better solar protection and catching prevailing wind: bedrooms on south-eastern part, services on north-western part and less used room on the west. |  |
| ‘Pashchati’ veranda (front) with low height roof for effective solar shading. |  | Veranda or overhanging low-height roof on service area or both helps to cut direct sun-ray incident on wall. |  |
| ‘Chadoa’ just beneath wooden ceiling acts as insulation for internal radiant heat gain. |  | Window sashes with wooden louver help natural ventilation while blocking direct sun-rays entering the house. |  |
| Wooden false ceiling acts as insulation against conduction of external heat through the roof. |  | Wood shingle/bamboo knitted mat just beneath roof covering acts as insulation. |  |
| Shorter side towards south. Hip roof generally having angle of 30–35°. Slope roof is less affected by the sun’s rays than a flat roof. |  | Shorter side towards south with slope roofing (30–40°) reduces incident heat on surface by reflecting max. amount of heat. |  |
| Large trees around house and upper cantilever veranda provide shade. |  | Different levels of roof and large trees around house provide shade. |  |
| Open planning and free spaces between detached houses help to capture prevailing wind and enhance natural ventilation. |  | Raising structure on stilts at an average height of 2.4 m from ground allows obstacle-free airflow through entire area. |  |
| Day-time activity is performed in shaded semi-outdoor/outdoor at north/south side. | Less activity on west. Day-time activity under shaded airy space below raised platform. | ||
| ‘Pashchati’ veranda with its huge openings allows constant airflow inside main block while protecting it from rain. |  | Average room height is 2.4 m and 3.8 m near wall and middle of room respectively. Formation of hot air layer far above human occupancy zone. |  |
| Paper/poster is glued on wall and fabric is filled between gaps of floor/roof and wall to prevent cool air penetration in winter. |  | Flexibility of controlling indoor environment, during hot, cold, and rainy seasons. Window sashes provided with operable louvered. |  |
| Large opening and folded sashes help to control opening area and air change between indoor & outdoor providing occupants with necessary flexibility. |  | Lange opening (with adjustable louver/not) at height of 0.3 m from floor allows air-flow at occupancy level and control over indoor environment. |  |
| Crack in walls and wood carving on lower and upper part of the interior/exterior wall allows air to penetrate inside. |  | Raised platform/wooden walls have cracked between wood joints allowing air penetration inside house. |  |
| Perforation in both exterior and interior walls allows night-time ventilation. |  | Perforation in upper part of interior wall acts as ventilator and allows ventilation in internal spaces. |  |
| Lightweight wooden wall (12 mm thick wooden shingle) helps night cooling by quickly releasing heat at night. Humility doesn’t accumulate on thin walls. |  | Lightweight wooden wall helps night cooling by quickly releasing heat at night and also protecting from humidity accumulation. |  |
| Gap between wall andfloor allows cool air to enter andgap between roof and wall helps hot air to escape when window and door are closed. |  | Operable louver helps hot air to escape when window and door are closed. |  |
| Traditionally separate kitchen (red marked) is practiced but a new trend is an attached kitchen. For both cases, it is placed on leeward side to avoid heat gain from the kitchen. |  | Traditionally kitchen (red marked) is kept on ground floor but nowadays attached one is also found. For both cases, kitchen is placed on north-eastern corner (leeward side) to avoid external heat gain. |  |
| Attic has a height of one-third of width of main block, usually 1.52 m, contributes evacuation of hot air indoor. |  | Stilt post keeps house off from the radiant heat gain from hotter ground and evacuates hot air at ground level. |  |
| Raised plinth (0.3–0.6 m) from ground and gap between house and plinth prevent ground moisture penetration. |  | Raised platform protects house from ground moisture. |  |
Table 6.
Surface temperature (mid-day:12:00 pm–4:00 pm) differences of timber house envelope.
| House/Level | Floor (°C) (avg.) | Wall (°C) (avg.) | Roof/Ceiling (°C) (avg.) | Outdoor Air Temp. (°C) | |||
|---|---|---|---|---|---|---|---|
| Exterior | Interior | Exterior | Interior | ||||
| H-1 | 35.3 | 42.2 | 37.7 | 58.1 | 42.0 | 35.42 | |
| H-2 | Ground Floor | 31.5 | 35.5 | 33.5 | 46.1 | 33.3 | 32.3 |
| First Floor | 37.0 | 38.2 | 37.8 | 41.6 | |||
| H-3 | Elevated Floor | 29.9 | 36.3 | 30.0 | 50.1 | 33.6 | 31.03 |
Table 7.
Personal parameters of the respondents.
| Parameters | Single/Double | Remarks | Stilt | Remarks | |
|---|---|---|---|---|---|
| Age distribution | <20 | 7.32% | Male respondent 51.22% and female respondent 48.78% Total respondent: 41 | 11.11% | Male respondent 38.89% and female respondent 61.11% Total respondent: 18 |
| 21–30 | 24.39% | 27.78% | |||
| 31–40 | 19.51% | 16.67% | |||
| 41–50 | 14.63% | 22.22% | |||
| 51–60 | 29.27% | 11.11% | |||
| >60 | 4.88% | 11.11% | |||
| Clothing (clo.) (avg.) | Male | 0.5 | Lungi, shirt/panjabi [23] | 0.44 | Lungi, full sleeve light shirt [23,57] |
| Female | 0.5 | Bra, panty, petticoat, short sleeve blouse, cotton saree [23] | 0.43 | Bra, panty, short sleeve top, lungi [23,57] | |
| Metabolism (met)(avg.) | ≤ 3 | Max. value for cooking [23] | ≤ 3 | Max. value for cooking [23] | |
Table 8.
Summary of the questionnaire survey.
| Time/Comfort Feeling (%) | Single/Double-Storied | Stilt | ||||||
|---|---|---|---|---|---|---|---|---|
| −3 to −1 | 0 | +1 to +3 | Activity pattern | −3 to −1 | 0 | +1 to +3 | Activity Pattern | |
| 4:00 am–6:00 am | 100 | Staying at airy place/veranda & going outside (78.04%), using fan (100%), clothing change (41.46%), taking shower (19.5%), other (9.76%). | 100 | Staying in an airy place and going outdoor (72.22%), using a fan (88.9%), clothing change (27.78%), taking shower (33.33%), other (11.11%). | ||||
| 7:00 am–9:00 am | 90.25 | 9.75 | 83.33 | 16.67 | ||||
| 10:00 am–12:00 pm | 9.75 | 12.2 | 78.05 | 61.11 | 38.89 | |||
| 1:00 pm–3:00 pm | 7.32 | 92.68 | 11.11 | 88.89 | ||||
| 4:00 pm–6:00 pm | 19.51 | 80.49 | 27.78 | 72.22 | ||||
| 7:00 pm–9:00 pm | 21.95 | 34.14 | 43.91 | 33.33 | 50 | 16.67 | ||
| 10:00 pm–12:00 am | 65.85 | 21.95 | 12.2 | 72.22 | 16.67 | 11.11 | ||
| 1:00 am–3:00 am | 100 | 100 | ||||||
Note: Responses nearly 50% or above: (−3 to −1) (0) (+1 to +3).
Publisher’s Note: MDPI stays neutral with regard to jurisdictional claims in published maps and institutional affiliations. |
© 2021 by the authors. Licensee MDPI, Basel, Switzerland. This article is an open access article distributed under the terms and conditions of the Creative Commons Attribution (CC BY) license (http://creativecommons.org/licenses/by/4.0/).
Share and Cite
MDPI and ACS Style
Islam, R.; Ahmed, K.S. Indoor Thermal Environment and Occupant’s Living Pattern of Traditional Timber Houses in Tropics. Designs 2021, 5, 10. https://0-doi-org.brum.beds.ac.uk/10.3390/designs5010010
AMA Style
Islam R, Ahmed KS. Indoor Thermal Environment and Occupant’s Living Pattern of Traditional Timber Houses in Tropics. Designs. 2021; 5(1):10. https://0-doi-org.brum.beds.ac.uk/10.3390/designs5010010
Chicago/Turabian StyleIslam, Rezuana, and Khandaker Shabbir Ahmed. 2021. "Indoor Thermal Environment and Occupant’s Living Pattern of Traditional Timber Houses in Tropics" Designs 5, no. 1: 10. https://0-doi-org.brum.beds.ac.uk/10.3390/designs5010010