
Smart Monitoring Pad for Prediction of Pressure Ulcers with an Automatically Activated Integrated Electro-Therapy System

1
Biomedical Engineering Department, Al-Nahrain University, Baghdad 10072, Iraq
2
Engineering Physics Program, Xavier University, Cincinnati, OH 45040, USA
*
Author to whom correspondence should be addressed.
Designs 2021, 5(3), 47; https://0-doi-org.brum.beds.ac.uk/10.3390/designs5030047
Submission received: 31 May 2021
/
Revised: 8 July 2021
/
Accepted: 21 July 2021
/
Published: 29 July 2021
(This article belongs to the Special Issue Design and Control of Collaborative Robotic Solutions and Wearable Assistive Robots to Enhance Human Capabilities)
Abstract
:Pressure ulcers (PU) are deep scars on the skin that cause pain, infections and severe health complications. Most movement-impaired subjects are vulnerable to PU, leading to permanent and irreversible skin damage. The system proposed in this paper aims to prevent PU formation with the design and implementation of a wirelessly controlled device that predicts PUs before their occurrence and attempts to prevent it using therapeutic feedback. A flexible pad that consists of multiple types of sensors is used, theses sensors continuously and non-invasively monitor ulcer-related vital signs in vulnerable areas, and uses these data to predict PU with a decision-making process. When PU is detected an electrical stimulation (ES) unit is automatically activated. Stimulation prevents PU formation by increasing local blood flow to the simulated area and eliminating the main factor that leads to PU formation. The system successfully monitored and predicted PU; tests were performed on three healthy volunteers and one volunteer with sacral ulcers. Results including readings of blood oxygenation, force, humidity and temperature were recorded as graphs to monitor decay/increase in values more efficiently.
1. Introduction
Pressure ulcers (PU) are localized injuries to the skin and underlying tissues caused by a local breakdown of cells as a result of compression between a bony prominence and an external surface [1]. Subjects with impaired mobility tend to remain in certain poses for long periods of time, leading to high forces applied at pressure concentration points for critical durations. The living tissue in these areas will suffer from narrowing and pinching of blood vessels, and consequently less oxygen and nutrients are supplied, which eventually leads to cell death and formation of PU [2]. Many people are susceptible to developing PU, but it is most critical in bedridden patients, including the elderly, quadriplegic subjects, intensive care unit patients and respiratory care unit patients [3].
Statistics show that PU affects 2.5 million patients per year according to the Centers for Disease Control (CDC), including 159,000 subjects in nursing homes. Treatment of PU cost ($9.1–$11.6) billion per year in the US alone while the cost of individual patient care ranges from ($20,900–$151,700) per patient [4]. PU is most common among bedridden subjects; it is estimated that more than (80%) of bedridden subjects develop PU [5].
The PU may form as soon as after 1–3 h of remaining in the same position, depending on age, skin health, weight, disease and diet. The formation of PU starts at the deep skin layers; as these layers suffer from oxygen deprivation sooner, the damage may not be visible superficially until late stages [2]. Preventive methods taken today to avoid PU in hospitals and home-nursing are: frequent repositioning every 1–3 h, which requires so much time and effort from the nursing staff, and it does not completely prevent PU formation. Another option is fluidized mattresses, but these are expensive and not very effective [6]. Treatment is very challenging and often the damage is irreversible, hence prevention is considered a much better solution [7].
Previous research in this field involves monitoring of a subject’s position and incorporated timers. For example in 2011, an intelligent monitoring/caution system for PU prevention was introduced; it employs multiple pressure sensors incorporated with a wearable garment. Artificial intelligence (AI) was used to predict the subject’s position based on sensor readings and to alert the nursing staff when the subject maintained one position for a critical period of time (90 min) [8]. In 2013, a patent was proposed suggesting a pressure mapping system that records the subject’s bed posture including upper and lower limbs, and the system helps the nursing staff to identify the subject’s pressure concentration points, leading to a more efficient PU management [9]. In 2020, a deep learning approach for PU prevention was designed, including accelerometers and netometer attached to a wearable vest to monitor the subject’s motion patterns. The system was trained to detect the subject’s critical positions, such as maintaining a sitting or lying position for too long [10]. Another PU management approach is a statistical method to evaluate the risk of PU based on previously collected data, such as one that was carried out in 2011, in which a statistical risk prediction method used preoperative data to predict hospital-acquired PU, and around 300 cases were investigated and analyzed, which revealed eight significant risk factors: age ≥ 75 years, female gender, American Society of Anesthesiologists ≥ 3, body mass index < 23, preoperative Braden score ≤ 14, anemia, respiratory disease, and hypertension were identified using multivariate logistic regression analyses [11]. Additionally, in 2019, the development of a novel scale for predicting in-hospital acquired PUs was introduced. It was performed on 383 patients; 252 patients were used to train the algorithm, and 131 patients were used in the validation. Their new scale combined observational and on-site information regarding mobility of patients [12]. Another form of PU care is the mechanical design of beds that allow a change in orientation. In 2011, a group of researchers proposed a platform that collects information from different sensors incorporated into a mechanical bed, and the data are then analyzed to create a time-stamped, whole-body pressure distribution map. Based on the acquired map, the system commands the bed’s actuators to periodically adjust its surface profile to redistribute pressure over the entire body [13]. In 2013, the design, simulation, and experimental testing of a mechanically actuated smart hospital bed was proposed, the mechanical bed is used to ensure that patients are consistently turned using actuating and control systems [14]. All of the previously mentioned methods do not include monitoring of PU-related vital signs in the living tissue such as blood oxygen, temperature and humidity, nor do they provide electrotherapeutic feedback, as the proposed solution in this paper does.
The presented paper suggests a wirelessly controlled device that accurately predicts a PU before it actually forms, based on real-time monitoring of data related to skin health, coupled with a decision-making process and therapeutic feedback. When PU is predicted, an ES unit is automatically activated; ES causes vasodilatation which promotes blood flow to the targeted area, and prevents PU formation. ES is a form of physical therapy which has been used for increasing local blood circulation in many previous researches [15,16,17]. Promoting local blood supply prevents PU formation since insufficient blood supply is the main cause of PU [18]. Additionally, electrical stimulation causes muscle contraction, which increases the resistance to the applied external force and reduces the risk of PU [18].
Prediction is based on readings from various sensors which monitor PU early clinical remarks: oxygen saturation in the blood-SpO2, force applied by patient’s weight to the monitored area, relative humidity and temperature of the monitored area [19,20] Statistical and physiological information is used to build a decision-making process which is a form of artificial intelligence, allowing the system to decide whether the subject is at risk of PU or not; prevention of PU is achieved by automatically activating the ES unit to eliminate PU symptoms.
2. Materials and Methods
To successfully predict PU, skin health must be monitored continuously, PU forms in areas of high force concentration leading to the collapse of blood vessels and low blood oxygen saturaton-SpO2 in the area. Non-invasive sensors are used to monitor these two factors—force and SpO2—and to detect the time where they reach critical levels and activate the therapeutic ES unit when needed. Another important aspect to monitor is bacterial infection, which is related to the skin’s relative humidity and temperature; the concept is to prevent the favorable growth environment of the most common bacterial infection that accompanies PU scars, by preventing certain humidity levels accompanied by specific temperatures [19,20]. When predicted, the system will send an alarm message to adjust the skin’s humidity and temperature. The overall system block diagram is shown in Figure 1. The device consists of three main parts: PU sensing device, ES unit and user interface/control. The PU sensing device is a flexible three-layered pad made of cushioned high-density polyethylene covered with an absorbing cloth. It is engraved to house the sensors that must have direct contact with the subject’s skin. The second layer is a cushion for the subject’s comfort, and the final layer acts as a backbone to the first layer. The sheet is located over the targeted area (the sacral region within 15 × 15 area). This area is chosen because it is the first area to develop PU in bedridden subjects [20].
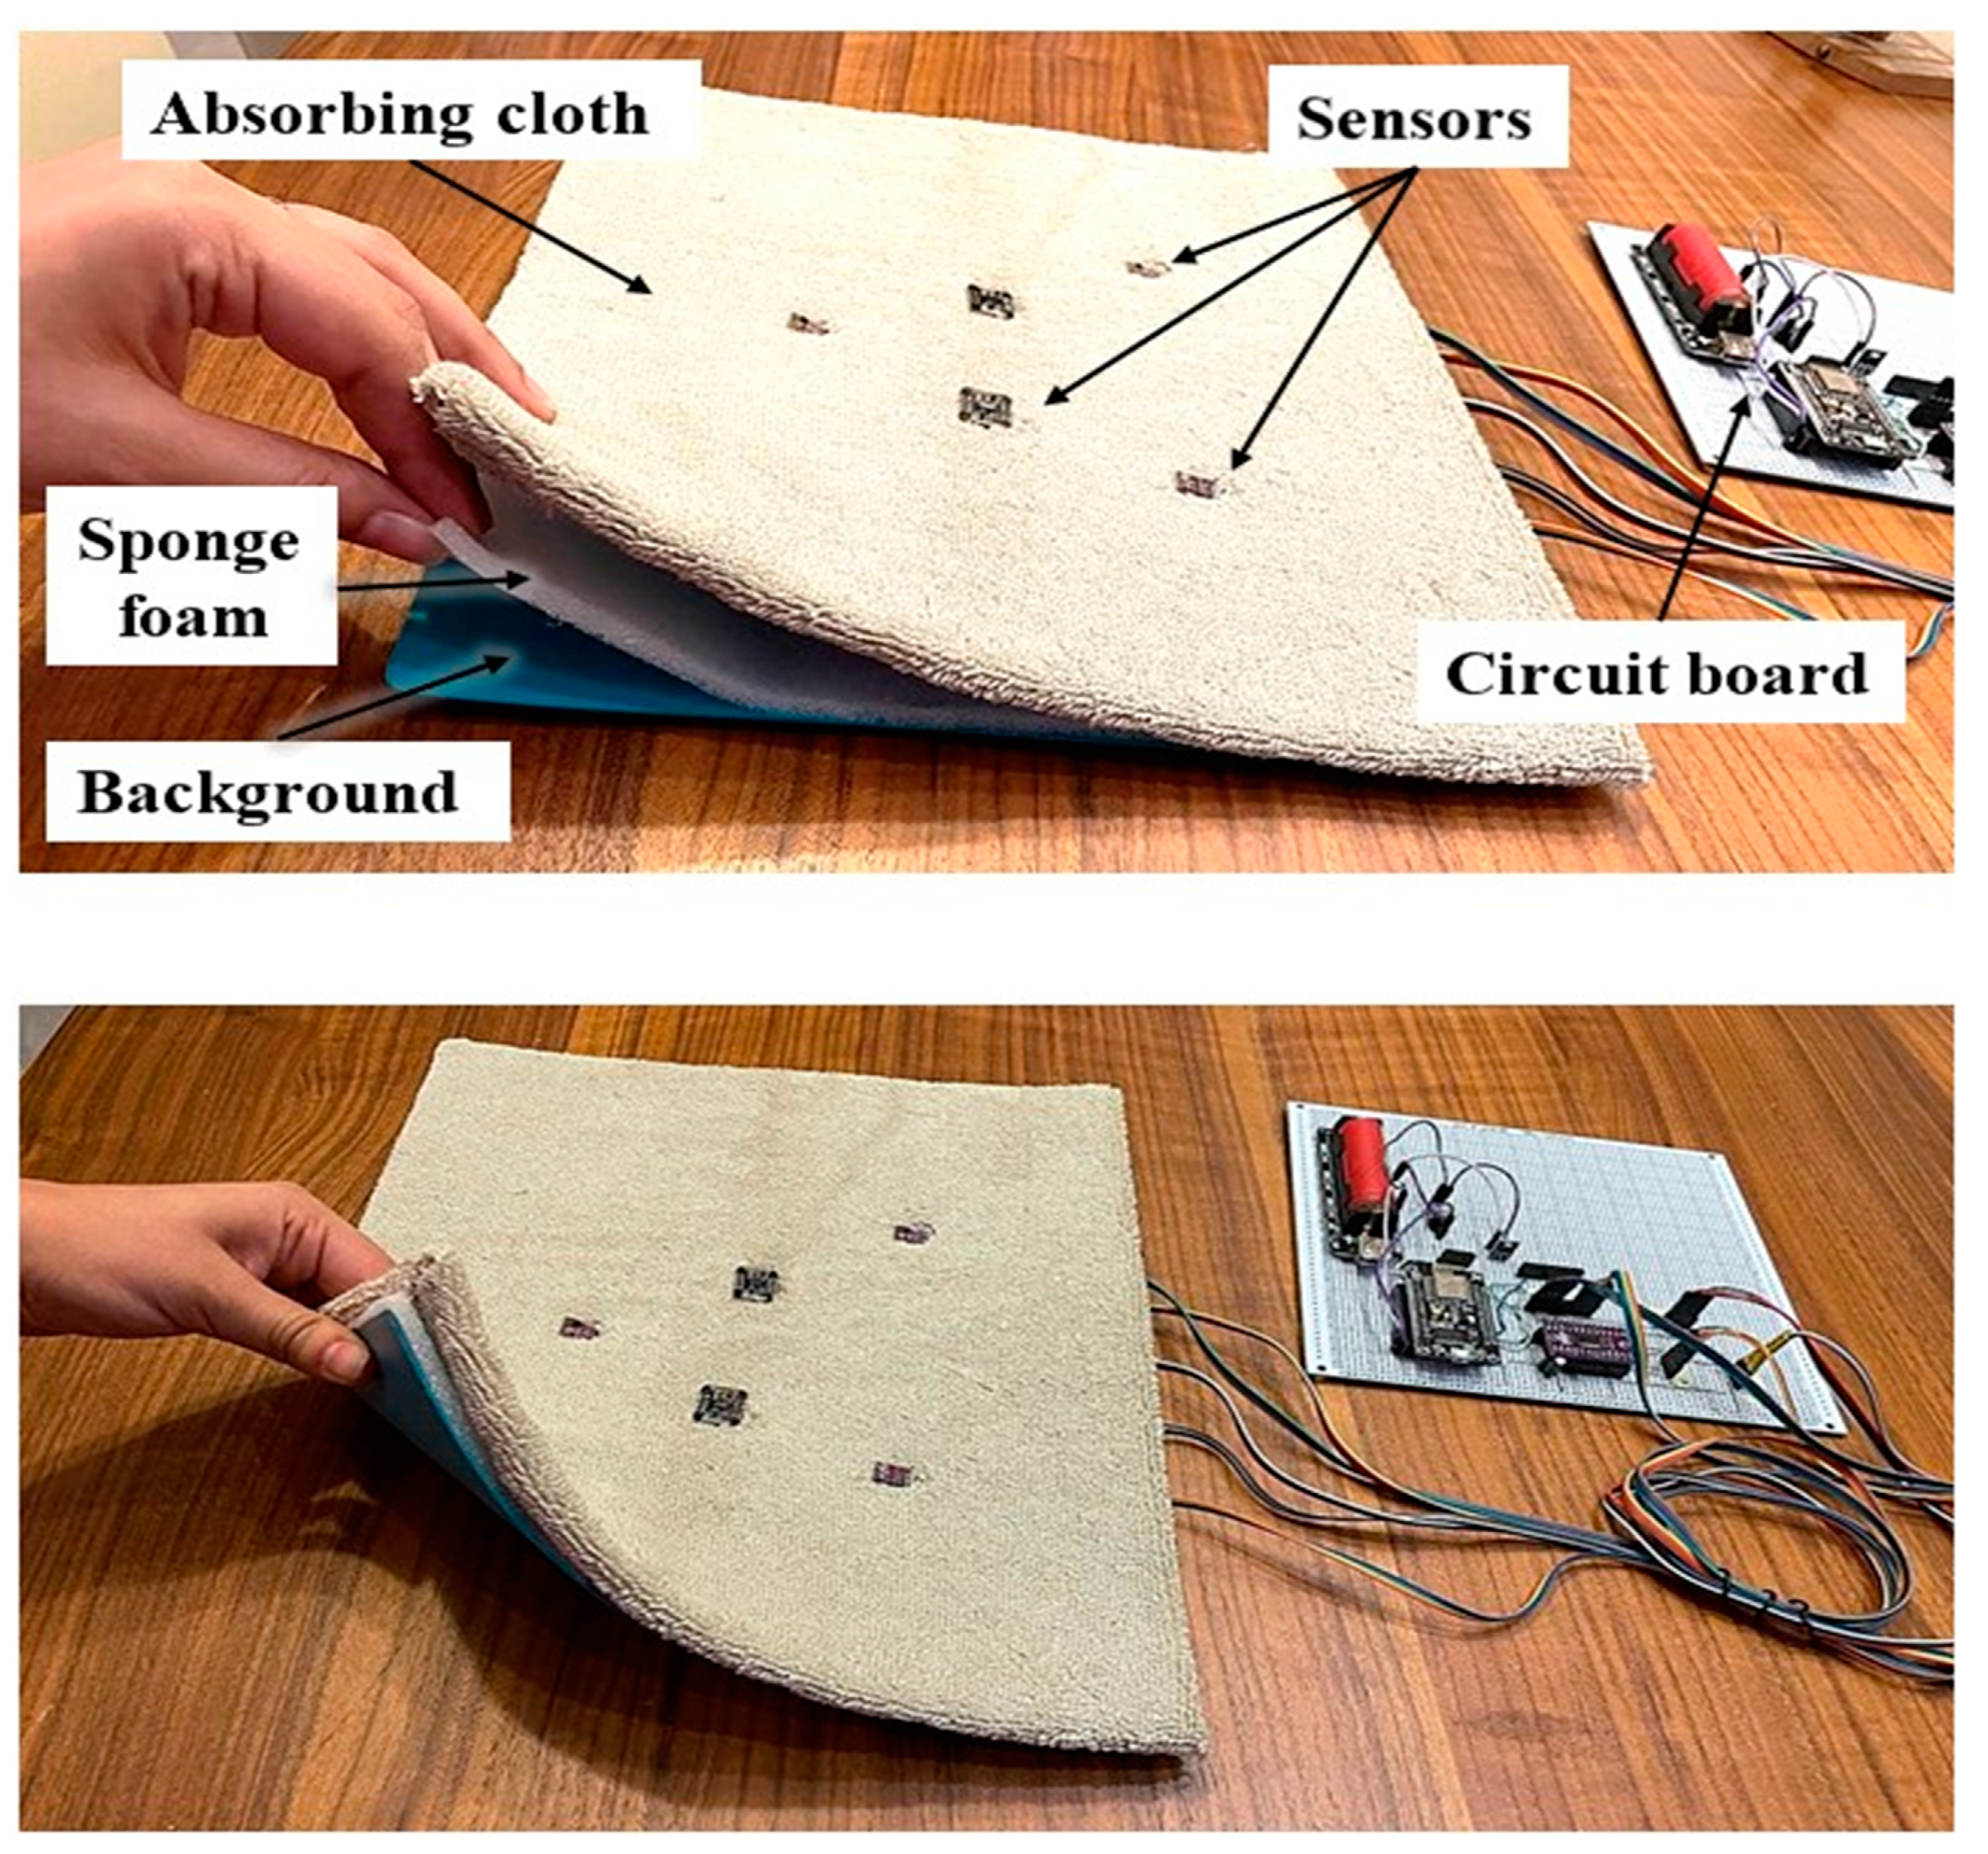
The design of the pad (shown in Figure 2) allows sensors to be fixed in their appropriate positions, the wiring to be protected and the signal’s motion artifact to be limited. The use of multiple engraved layers and cushions leads to a smoother surface of the pad and prevents the impact of the sensor’s rough surface on the subject’s skin. The locations of all the sensors are shown in Figure 2, and the execution of the pad is shown in Figure 3. Secondly, the ES unit which is designed to provide multiple therapeutic modes and parameters must be set by the physician based on the subject’s skin health within the universal safety standards [21]. Stimulation is applied using self-adhesive surface electrodes applied to the thoracic level of the back, which is proven to increase blood flow to the sacral region.
2.1. Hardware Design
The design of the proposed system includes the following sensors: (Flexiforce sensors [22], Load cells [23], MAX30102 IR/R/Photodetector module [24], SHT30 Humidity/Temperature sensor [25]). These sensors are derived by a microcontroller (NodeMCU: ESP8266) which extracts data from all sensors including the Flexiforce sensors via an analogue to digital convertor (ADS1115), and duplicated sensors (two SpO2 sensors, three Humidity/Temperature sensors) via the multiplexer (TCA9548A). Four load cells are also incorporated for more accurate force readings; the Flexiforce sensor shows high drift during prolonged test periods. Load cells are rather bulky and require two hard plates, so they was covered with a cushion for the patients’ comfort. The sensors have different sampling rates, but recording is performed at 0.2 Hz, i.e., one sample every five seconds for all readings to ensure consistency. The schematic of the sensors’ driving circuit and the ES unit circuit is shown in Figure 4.
2.2. Software
Prediction software is based on a decision-making process, which has been used in many fields, such as as an artificial intelligence (AI), that allows the machine to perform operations and make decisions based on given data [26,27]. In this paper, two decision-making algorithms are used; PU prediction and bacterial infection prediction:
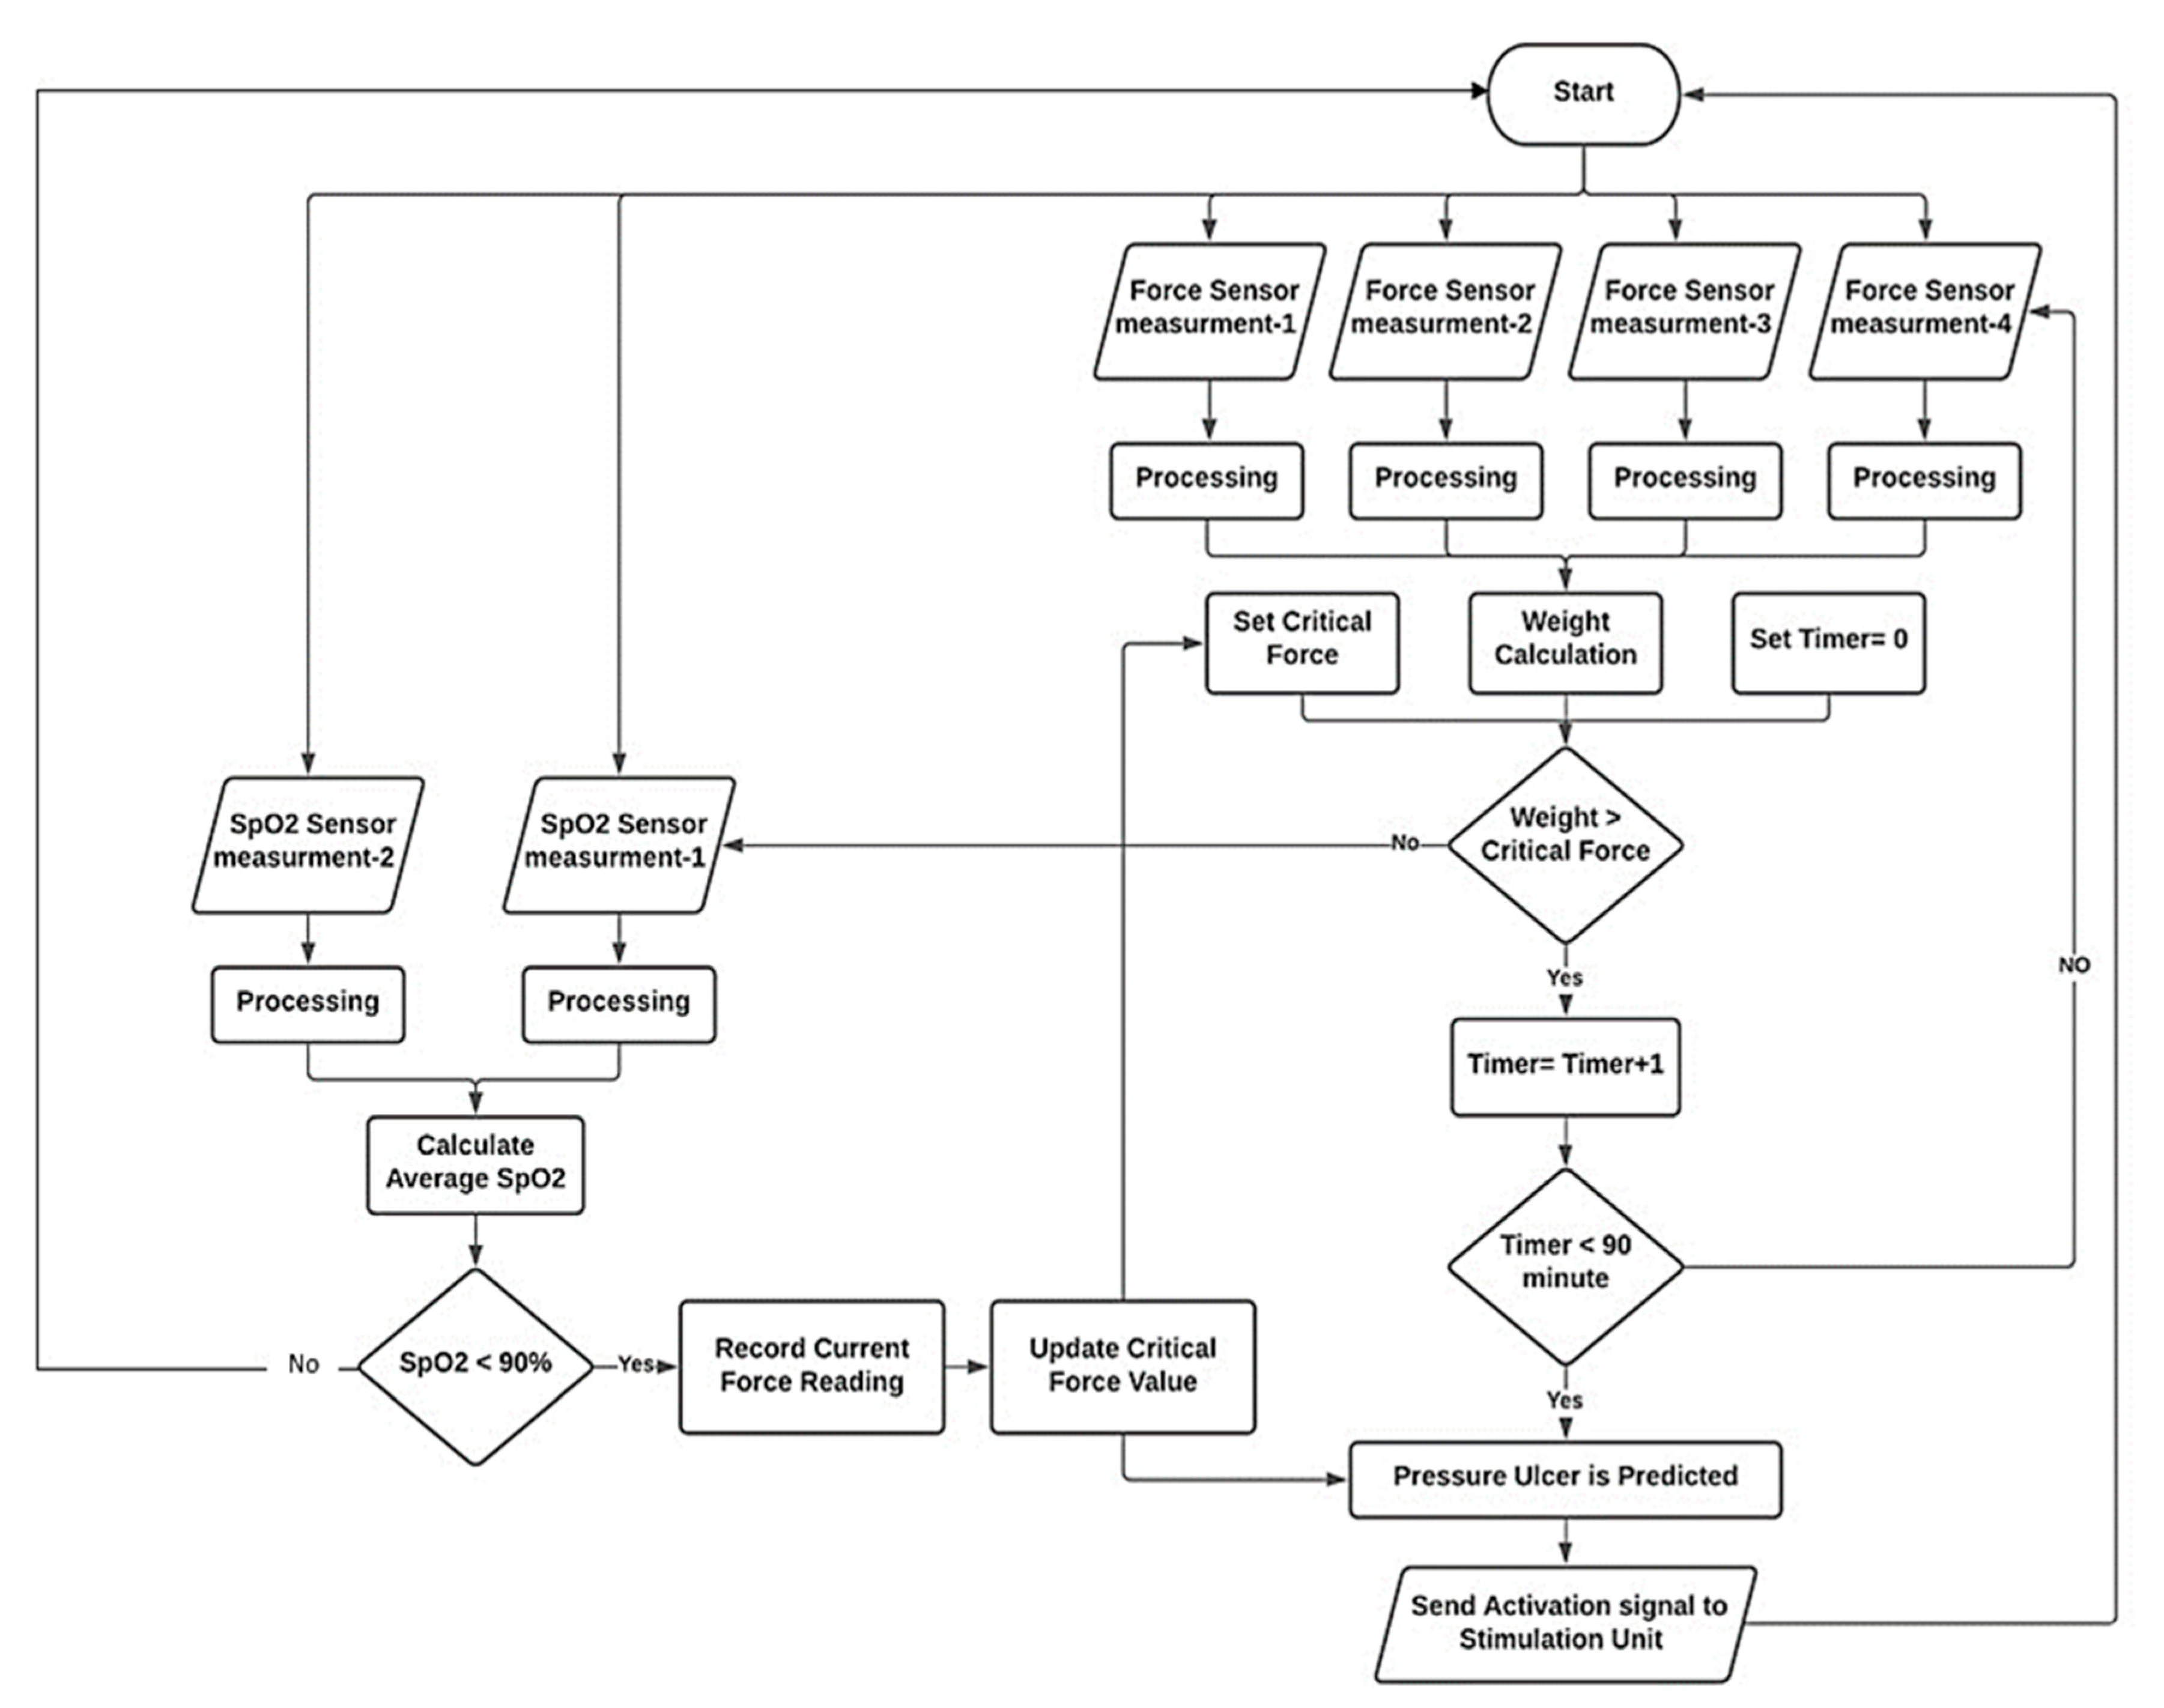
- Decision-making of PU prediction is a multi-step algorithm built based on the physiological process that leads to PU formation. The main indicator of PU is saturation of oxygen in blood (SpO2); oxygen drops due to the force applied on the area causing the collapse of blood vessels, this force is basically a portion of the subject’s weight applied to the sacral region; many researchers assumed different levels of critical force that leads to PU formation [28]. These values are set as “initial critical force”, and this value is continuously updated based on SpO2 levels. As the subject lay down in supine position (bedridden posture), both force and SpO2 levels are measured simultaneously, and the value of force that will cause oxygen levels to drop is detected and recorded which is a specific value for that certain subject. This value is set as the “updated critical force”; if force exceeds this threshold, the microcontroller checks oxygen level; if it is not affected, then no prediction occurs, but if the critical force persists at high level for more than a critical time (90 min based on previous research [7,8,9,10,11,12,13,14,15,16,17,18,19,20]), then the prediction is true. The SpO2 is monitored continuously, and if oxygen concentration falls below a critical range (90–89%) PU prediction is set to true immediately. When PU prediction is true, the system automatically activates the ES unit to begin the electrotherapy session; the stimulation increases blood flow and increases SpO2 level, and it also causes muscle movement (contraction), making the area more resistant to PU. Figure 5 shows a simplified flowchart of the prediction algorithm.
- Prediction of bacterial infection is based on monitoring and preventing the growth of skin bacteria known as Staphylococcus aureus [29]. It is one of the most common bacteria that grows alongside PU scars [30,31]. The system aims to prevent the favorable growth environment of this bacteria. The two main factors in bacterial growth in the skin are temperature and humidity, hence the system continuously monitors these two factors using the (SHT30) Humidity/Temperature sensor at three different locations on the subject’s back to cover the sacral area. Next, the system runs calculations comparing the sensor’s readings against preset thresholds to estimate the risk of developing the infection. Once the risk is detected, an alarm message is sent to the user interface alerting the healthcare givers to take preventive measures, for example, “use cloth to remove sweating and adjust skin temperature”. The threshold for temperature is (>35 °C) and (<39–40 °C), relative humidity between (70–80%). These conditions mark the favorable environment for developing infection in ulcerated skin if they occur together [32]. In this case, time is not accounted for, so when predicted, the healthcare giver is instructed to adjust relative humidity/temperature immediately by drying the skin or ventilating the area, for example. In the case of temperatures dropping below 20 °C, an alarm message will be sent, because it has been shown that lower temperatures leads to low blood flow, which encourages PU formation. Additionally, if temperature is above 38 °C, an alarm indicating that the subject has developed a fever will be shown on the user interface screen. Figure 6 shows a simplified algorithm for bacterial infection prediction.
2.3. User Interface
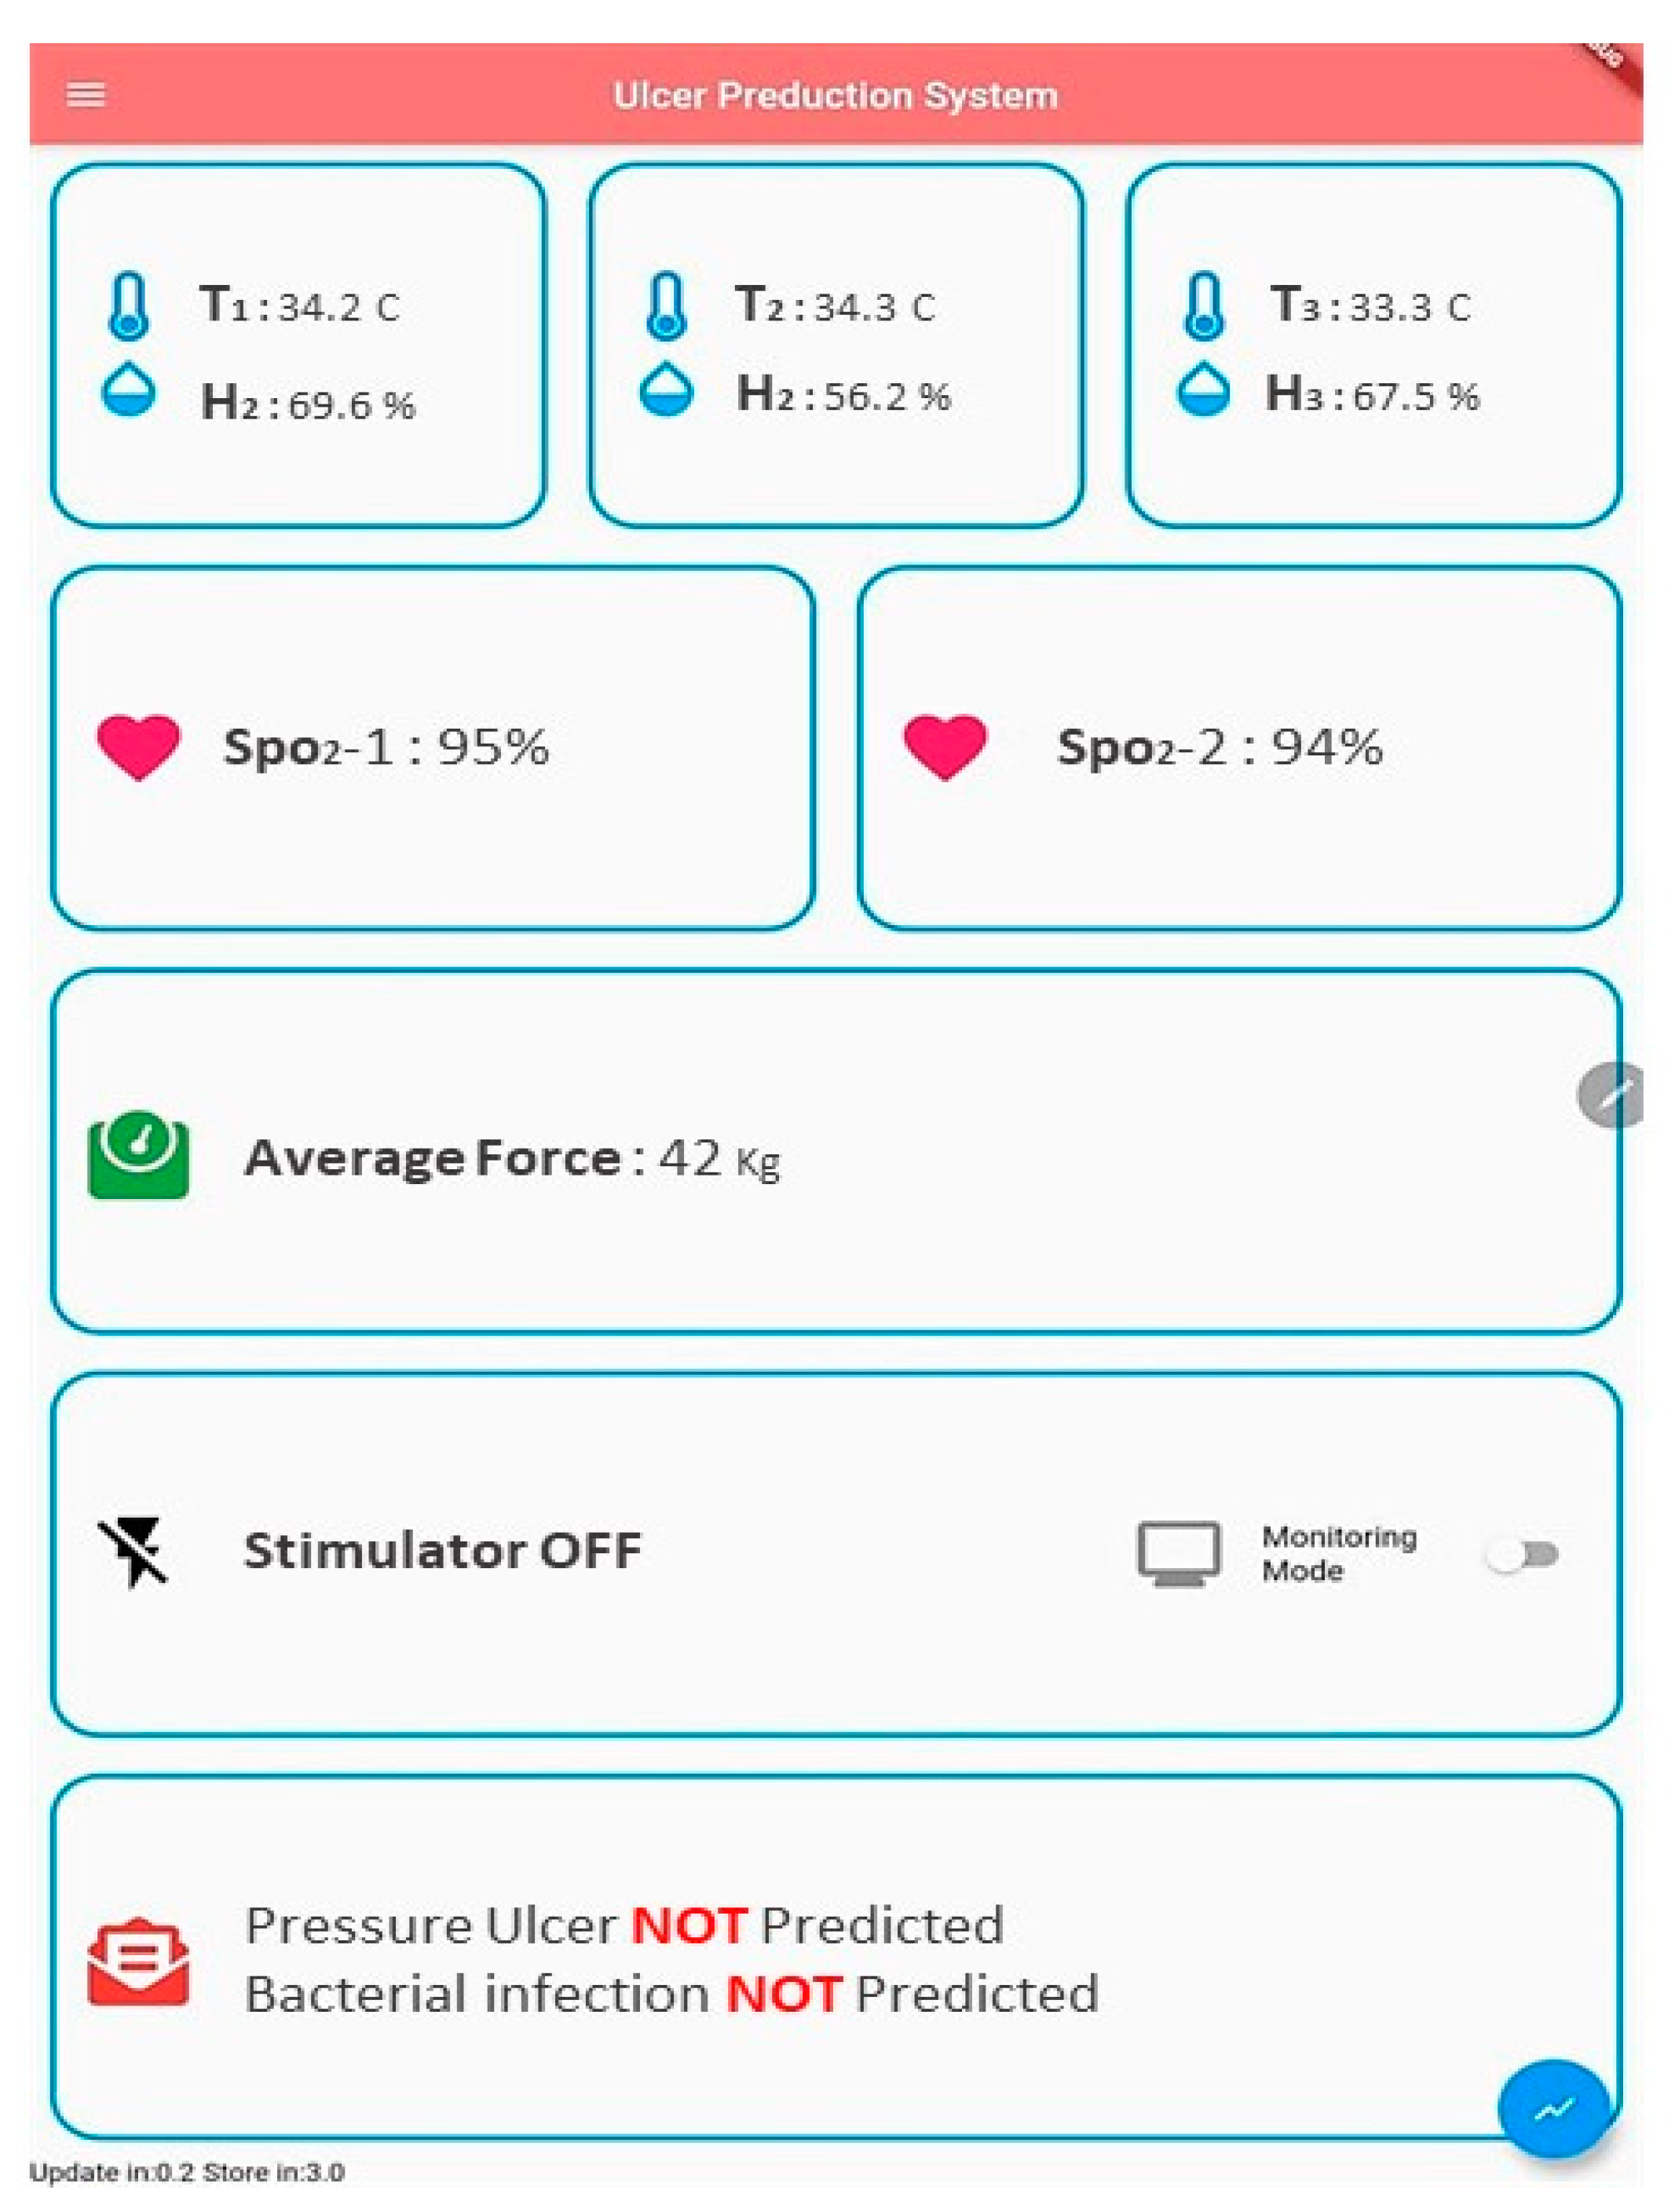
To visualize data and control the system, an application was built using Flutter platform and the Dart programming language. The front screen of the developed application is shown in Figure 7. The application runs extensive operations; it is responsible for receiving and previewing all data sent by the NodeMCU via Wi-Fi, and it also runs the pre-diction algorithms and their feedback. The screen shows data from all sensors; these data are charted into graphs at a rate of 0.2 Hz. Graphs are shown in the results sections.
3. Results
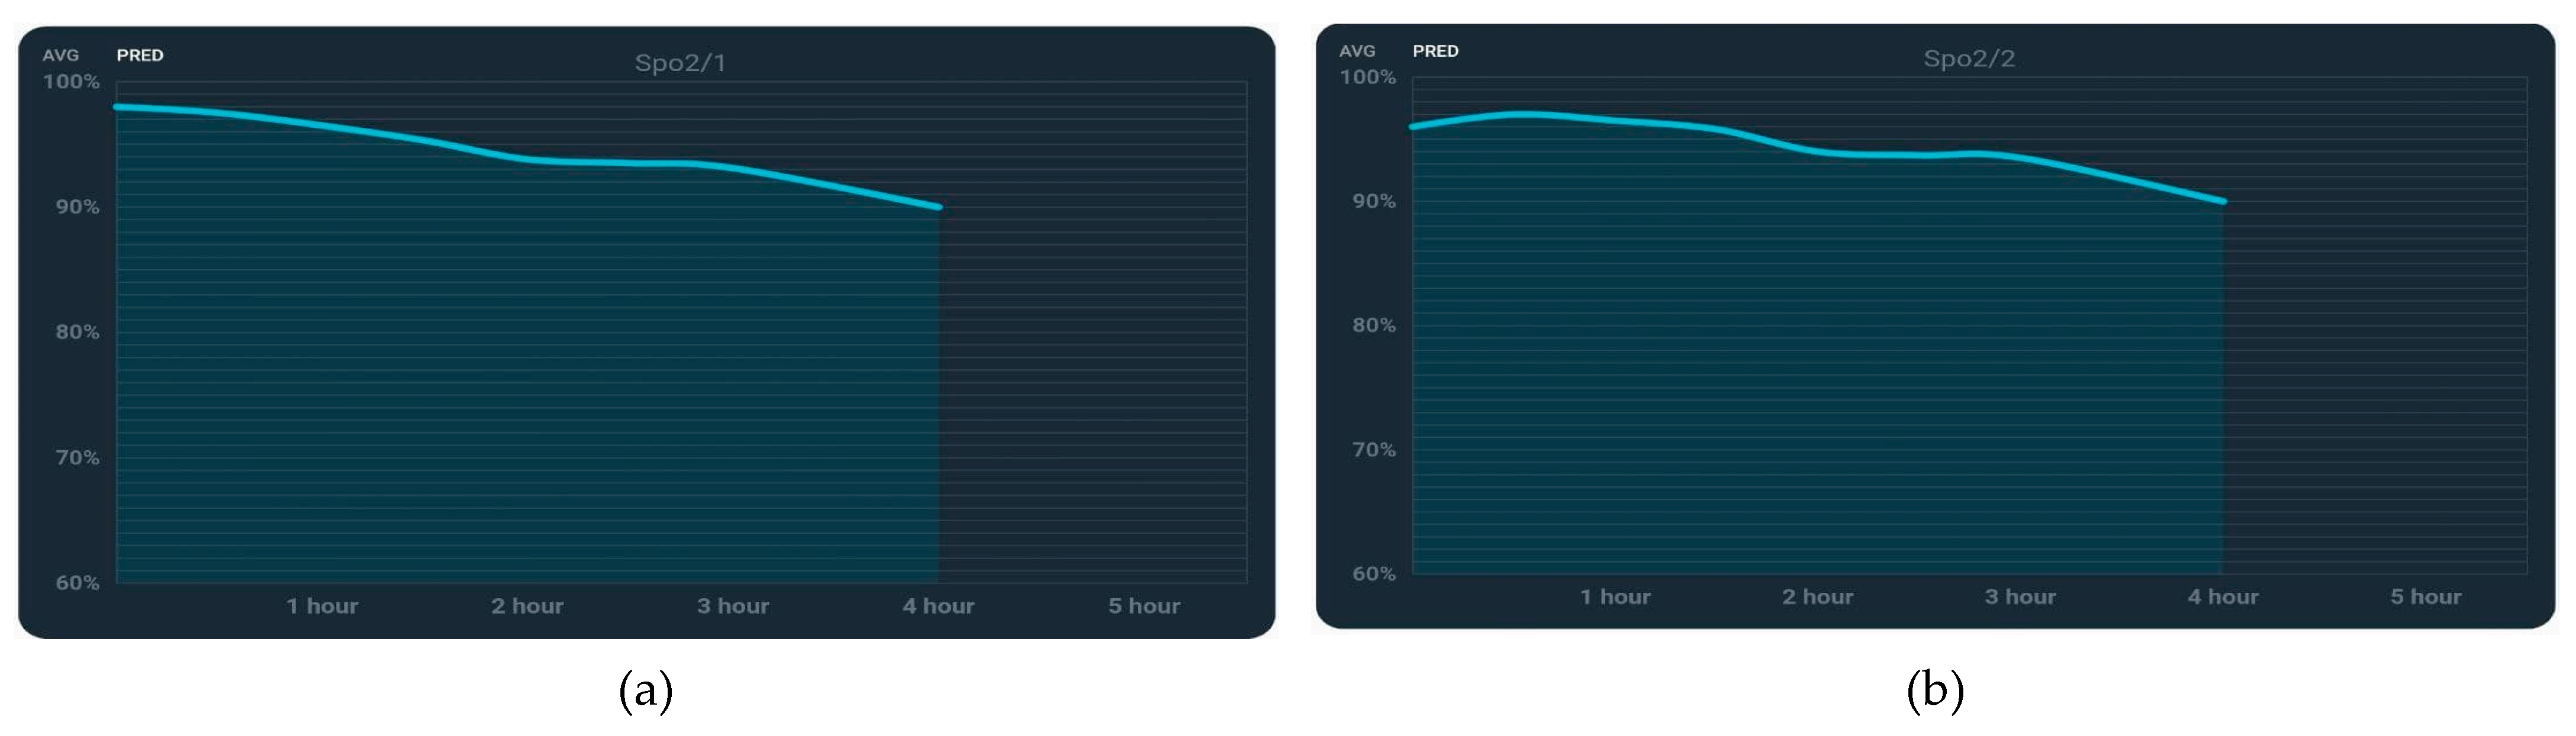
The test involved four subjects laying in supine position with PU sensing device on the targeted area (the sacral region). The volunteers‘ specifications are depicted in Table 2. Obviously, different weight distributions led to different forces being applied on the sacral region, which helped in investigating the effect of force, while body mass index (BMI) indicates weight distribution. Readings were collected in graphical formats with a total recording time of 4 h, which is enough to investigate the change in vital signs. Recording was then stopped when SpO2 reached near critical levels ~90% to ensure the volunteers’ safety. To validate the decision-making algorithms, the critical SpO2 level was changed from 90% to 95% to avoid waiting for lower oxygen saturation levels which would harm the volunteer. Figure 8a shows the sensors’ locations over the targeted area for healthy subjects, which are chosen to efficiently cover the sacral region (targeted area). The SpO2 sensors’ locations are B1 and B2. The relative humidity/temperature sensors’ locations are A1, A2 and A3. The four load cells are placed at the corners of a rectangle (area C) to measure average force. Figure 8b shows the sensors’ locations for the subject with a sacral ulcer; sensors are placed near the scar to investigate the vitals of the skin adjacent to the sore, and the force sensors are at the same location (area C), measuring the applied force over the sacral region, while Figure 9 shows the plot of force (weight) measurements indicating steady values of force (~45 kg). Figure 10 shows plots of filtered SpO2 measurements that reveal a slow decrease in SpO2 with time to around (90%). Figure 11 illustrates relative humidity measurements from three location, showing an exponential increase in values to (~60–80%), and Figure 12 shows temperature measurements from the same locations, it also shows a slight increase to (~37.5 °C) throughout the test period. All these previewed results are collected from the first volunteer. The same procedures were performed on other healthy volunteers.
For comparison purposes, results of the volunteer with sacral ulcer are previewed. Figure 13 shows the sensor’s location on the ulcerated skin where sensors were placed as close as possible to the sacral ulcer to record physiological changes in the abnormal skin. Recording was performed for 16 min; because the purpose PU volunteer is not for prediction but for comparison, no extended waiting for vitals drop was required, as PU had already occurred and vitals were already low. Figure 14 shows the plot of force (weight) measurements from area C, showing a steady value of 30 kg, and Figure 15 shows recorded SpO2 levels, which reveal extremely low values of blood oxygenation in the tested area (81–82%). Figure 16 illustrates relative humidity measurements from three locations showing more steady values in locations A2 and A3 of about ~80%, and a slight increase in location A1 to 60%. Figure 17 shows temperature measurements from the same locations showing lower skin temperature (27–28 °C) when compared with the healthy skin.
4. Discussion
A wireless non-invasive sensing device was implemented successfully, and this proposed device differs from previous solutions in many ways. First, it does not rely on data regarding the applied force only. Instead, the device monitors force accompanied by the local vitals of the skin (SpO2, relative humidity and temperature) resulting in more accurate prediction, assessment and understanding of PU formation. Second, it provides automatically activated therapeutic feedback, allowing the device to be used without major staff intervention and reducing the effort and cost of PU management. Finally, the device is portable and can be used in nursing homes and hospitals, unlike smart beds that are bulky and difficult to relocate. Testing on volunteers shows SpO2 decay with time as expected in the hypothesis. The device withholds volunteers’ weight without failure, and prediction alarm messages were previewed on the screen at the correct time. Higher applied force resulting from a subject’s higher BMI leads to lower recorded SpO2 levels for the same period of time and similar skin health. Subject 1 (with highest BMI, recorded force on sacral region: 42 kg) resulted in the lowest SpO2 (91%), while subject 2 (lowest BMI, recorded force 35 kg) resulted in the highest SpO2 (93%) after the same recording period. Relative humidity and temperature tend to increase with time regardless of BMI.
Force measurements from Flexiforce sensors were used to measure the amount of applied force to the sacral region, and the sensor showed high drift (±10 kg), and instability after 1 h of recording. Flexiforce sensors are recommended for short-term readings only. These sensors were replaced by load cells, which showed more stable readings over longer periods of time with a very low drift (±0.001 kg) within 4 h, and a low error of (±0.2 kg) during the calibration process. Temperature and relative humidity sensor (SHT30), showed good accuracy and low error (temperature ± 0.3 °C), (relative humidity ± 5%) and rate (0.5 Hz). The three sensors efficiently covered the targeted area (sacral region) and showed slight difference between upper and lower sensor readings due to anatomical differences. Measurements from MAX30102 sensor showed (±2%) drift, which is attributed to the subject’s breathing motion and limb movement. This drift was eliminated using digital filtering (10-point moving average filter) which is sufficient enough to remove the noise without causing delayed output. The sensor efficiently monitored blood oxygenation for long sessions (4 h) and was not affected by the subject’s weight. Blood oxygen level began to fall slowly after 2 h, then dropped faster in the next hour and finally reached a minimum of 89% after 4 h. This drop is caused by the subject’s weight measured from the sacral region that leads to the collapse of blood vessels. The subject’s weight is directly related to the subject’s BMI and not to total weight, higher BMIs led to higher values of force (weight) applied to the sacral region, and lower BMIs led to lower values of force (weight) applied to the sacral region. Temperature readings showed a slow increase over the session (4 h) from normal body temperatures (36–37 °C) to slightly higher temperatures (37–38 °C); this warming is caused by low ventilation level in the monitored area. Humidity readings showed a faster increase when compared with temperature from 65–70% to a maximum of 90% after 4 h; this is due to the subject’s sweating when higher temperature levels are recorded.
Author Contributions
Z.S.S.: Design, implementation and testing of the proposed system besides the drafting of the manuscript. A.Q.A.-N.: consultation on the design process, supervising the research and reviewing the manuscript. H.K.R. overseeing the research, co-advising, and editing of the manuscript. All authors have read and agreed to the published version of the manuscript.
Funding
This research received no external funding.
Institutional Review Board Statement
The study was conducted according to the guidelines of the Declaration of Helsinki, and approved by the Institutional Review Board (or Ethics Committee) of Al-Nahrain University, 2020.
Informed Consent Statement
Informed consent was obtained from all subjects involved in the study.
Data Availability Statement
The data presented in this study are available upon request from the corresponding author. The data are not publicly available due to ethical reasons.
Conflicts of Interest
The authors declare no conflict of interest.
References
- Bhattacharya, S.; Mishra, R.K. Pressure ulcers: Current understanding and newer modalities of treatment. Indian J. Plast. Surg. 2015, 48, 4–16. [Google Scholar] [CrossRef] [PubMed]
- Josef, G.; Keith, H.; Steuart, E. ABC of wound healing Pressure Ulcers. BMJ J. 2006, 332, 472–475. [Google Scholar]
- Hadiza, M.; Farouk, M.A. Pressure Ulcer Stages among Bed-Ridden Patients in Ahmadu Bello University Teaching Hospital (ABUTH). IOSR J. Nurs. Health Sci. 2014, 3, 1. [Google Scholar]
- Pressure Sore Facts & Statistics. Available online: https://aquilacorp.com/resources/pressure-sores/statistics/ (accessed on 15 September 2020).
- Kaur, S.; Singh, A.; Tewari, M.K.; Kaur, T.R. Comparison of Two Intervention Strategies on Prevention of Bedsores among the Bedridden Patients: A Quasi Experimental Community-based Trial. Indian J. Palliat Care 2018, 24, 28–34. [Google Scholar] [PubMed]
- Thomas, D.R. Issues and Dilemmas in the Prevention and Treatment of Pressure Ulcers: A Review. J. Gerontol. Ser. A 2001, 56, M328–M340. [Google Scholar] [CrossRef] [PubMed] [Green Version]
- Sauvage, P. Pressure ulcers prevention efficacy of an alternating pressure air mattress in elderly patients: E2MAO a randomized study. J. Wound Care 2017, 26, 304–312. [Google Scholar] [CrossRef] [PubMed] [Green Version]
- Wang, T.; Chen, S.; Huang, H.; Kuo, S.; Shiu, Y. The Development of an Intelligent Monitoring and Caution System for Pressure ulcer Prevention. In Proceedings of the 2011 International Conference on Machine Learning and Cybernetics, Guilin, China, 10–13 July 2011. [Google Scholar]
- Nourani, M.; Pompeo, M.Q.; Tamil, L.S.; Ostadabbas, S.; Yousefi, R. Methods and Systems for Preventing Pressure Ulcers. U.S. Patent US20130090571A1, 11 April 2013. [Google Scholar]
- Cicceri, G.; Vita, F.D.; Bruneo, D.; Merlino, G.; Puliafito, A. A deep learning approach for pressure ulcer prevention using wearable computing. Hum. Cent. Comput. Inf. Sci. 2020, 10, 5869. [Google Scholar] [CrossRef]
- Aloweni, F.; Ang, S.Y.; Fook-Chong, S.; Agus, N.; Yong, P.; Goh, M.; Tucker-Kellogg, L.; Soh, R. A prediction tool for hospital-acquired pressure ulcers among surgical patients: Surgical pressure ulcer risk score. Int. Wound J. 2019, 16, 164–175. [Google Scholar] [CrossRef] [PubMed] [Green Version]
- Cichosz, S.L.; Voelsang, A.; Tarnow, L.; Hasenkam, J.M.; Fleischer, J. Prediction of In-Hospital Pressure Ulcer Development. Adv. Wound Care 2019, 8, 1–6. [Google Scholar] [CrossRef] [PubMed] [Green Version]
- Yousefi, R.; Ostadabbas, S.; Faezipour, M.; Nourani, M. A smart bed platform for monitoring & Ulcer prevention. In Proceedings of the 2011 4th International Conference on Biomedical Engineering and Informatics (BMEI), Shanghai, China, 15–17 October 2011. [Google Scholar]
- Brush, Z.; Bowling, A.; Tadros, M.; Russell, M. Design and control of a smart bed for pressure ulcer prevention. In Proceedings of the 2013 IEEE/ASME International Conference on Advanced Intelligent Mechatronics, Wollongong, Australia, 9–12 July 2013. [Google Scholar]
- Chesterton, L.S.; Foster, N.E.; Wright, C.C.; Baxter, G.D.; Barlas, P. Effects of TENS frequency, intensity and stimulation site parameter manipulation on pressure pain thresholds in healthy human subjects. PAIN J. 2003, 106, 73–80. [Google Scholar] [CrossRef]
- Jin, H.-K.; Hwang, T.-Y.; Cho, S.-H. Effect of Electrical Stimulation on Blood Flow Velocity and Vessel Size. Open Med. J. 2017, 12, 5–11. [Google Scholar] [CrossRef] [PubMed]
- Cramp, A.F.; Gilsenan, C.; Lowe, A.S.; Walsh, D.W. The effect of high and low-frequency transcutaneous electrical nerve stimulation upon cutaneous blood flow and skin temperature in healthy subjects. Clin. Physiol. J. 2000, 20, 150–157. [Google Scholar] [CrossRef] [PubMed]
- Nisar, H.; Malik, A.R.; Asawal, M.; Cheema, H.M. An Electrical Stimulation based Therapeutic Wearable for Pressure Ulcer Prevention. In Proceedings of the IEEE EMBS Conference on Biomedical Engineering and Sciences, Kuala Lumpur, Malaysia, 4–8 December 2016. [Google Scholar]
- Kottner, J.; Black, J.; Call, E.; Gefen, A.; Santamaria, N. Microclimate: A critical review in the context of pressure ulcer prevention. Clin. Biomech. J. 2018, 59, 62–70. [Google Scholar] [CrossRef] [PubMed]
- Burns, T.; Breathnach, S.; Cox, N.; Griffiths, C. Rook’s Textbook of Dermatology, 4 Volume Set, 9th ed.; Wiley-Blackwell: Hoboken, NJ, USA, 2010. [Google Scholar]
- Bader, D.L.; Bouten, C.V.; Colin, D.; Oomens, C.W. Pressure Ulcers Research Current and Future Perspectives; Springer: Berlin/Heidelberg, Germany, 2005. [Google Scholar]
- Teferra, M.N. Functional Electrical Stimulation (FES): Review. Int. J. Latest Res. Eng. Technol. 2017, 24, 795–802. [Google Scholar]
- Flexiforce Sensoratasheet. Available online: https://cdn.sparkfun.com/datasheets/Sensors/ForceFlex/FLX-A201-A.pdf (accessed on 15 September 2020).
- Loadcell Datasheet. Available online: https://media.digikey.com/pdf/Data%20Sheets/Seeed%20Technology/114990100_Web.pdf (accessed on 15 September 2020).
- Datasheet of MAX30102 Sensor. Available online: https://www.alldatasheet.com/datasheet-pdf/pdf/859400/MAXIM/MAX30102.html (accessed on 15 September 2020).
- Datasheet SHT30. Available online: https://www.alldatasheet.com/datasheet-pdf/pdf/897974/ETC2/SHT30.html (accessed on 15 September 2020).
- Garcia-Vidal, C.; Sanjuan, G.; Puerta-Alcalde, P.; Moreno-Garcí, E.; Soriano, A. Artificial intelligence to support clinical decision-making processes. EBioMedicine 2019, 46, 27–29. [Google Scholar] [CrossRef] [PubMed] [Green Version]
- Lynn, L.A. Artificial intelligence systems for complex decision-making in acute care medicine: A review. Patient Saf. Surg. 2014, 13, 7575. [Google Scholar] [CrossRef] [PubMed] [Green Version]
- Sen, D.; McNeill, J.; Mendelson, Y.; Dunn, R.; Hickle, K. A New Vision for Preventing Pressure Ulcers: Wearable wireless devices could help solve a common-and serious-problem. IEEE J. 2018, 9, 28–31. [Google Scholar] [CrossRef] [PubMed]
- Tong, S.Y.C.; Davis, J.S.; Eichenberger, E.; Holland, T.L.; Fowler, V.G. Staphylococcus aureus Infections: Epidemiology, Pathophysiology, Clinical Manifestations, and Management. Clin. Microbiol. Rev. J. 2015, 28, 603–661. [Google Scholar] [CrossRef] [PubMed] [Green Version]
- Dana, A.N.; Bauman, W.A. Bacteriology of pressure ulcers in individuals with spinal cord injury: What we know and what we should know. J. Spinal Cord Med. 2015, 38, 147–160. [Google Scholar] [CrossRef] [Green Version]
- Wilkoff, V.L.; Westbrook, L.; Dixon, G. Factors affecting the persistence of Staphylococcus aureus on fabrics. Appl. Microbiol. J. 1969, 17, 268–274. [Google Scholar] [CrossRef] [PubMed]
Figure 1.
Proposed system block diagram showing the sensors’ attachment to the human body and Wi-Fi communication with the user interface and ES unit.
Figure 1.
Proposed system block diagram showing the sensors’ attachment to the human body and Wi-Fi communication with the user interface and ES unit.

Figure 2.
(a) Shape and location of the ulcer-sensing device over the targeted area. (b) Design of the ulcer-sensing pad.
Figure 2.
(a) Shape and location of the ulcer-sensing device over the targeted area. (b) Design of the ulcer-sensing pad.

Figure 3.
Fabrication of the ulcer-sensing pad showing its flexibility and multiple layers.

Figure 4.
(a) Schematic of all sensors used and their interface with the main microcontroller. (b) Schematic of the ES unit and its interface with the human body.
Figure 4.
(a) Schematic of all sensors used and their interface with the main microcontroller. (b) Schematic of the ES unit and its interface with the human body.

Figure 5.
Pressure ulcer prediction algorithm structure.

Figure 6.
Algorithm structure for prediction of bacterial infection risk.

Figure 7.
Application layout.

Figure 8.
(a) Locations of the sensors covering the targeted area in control subjects. (b) Locations of sensors around the sacral ulcer in subjects with PU.
Figure 8.
(a) Locations of the sensors covering the targeted area in control subjects. (b) Locations of sensors around the sacral ulcer in subjects with PU.

Figure 9.
Force measurement from overall sacral region C.

Figure 10.
SpO2 measurements: (a) from location B1, and (b) from location B2.

Figure 11.
Humidity measurements; (a) from location A1, (b) from location A2, and (c) from location A3.
Figure 11.
Humidity measurements; (a) from location A1, (b) from location A2, and (c) from location A3.

Figure 12.
Temperature measurements: (a) from location A1, (b) from location A2, and (c) from location A3.
Figure 12.
Temperature measurements: (a) from location A1, (b) from location A2, and (c) from location A3.

Figure 13.
Sensors’ locations of sacral ulcer subject.

Figure 14.
Force measurement from overall sacral region C.

Figure 15.
SpO2 measurements: (a) from locations B1, and (b) from location B2.

Figure 16.
Humidity measurements: (a) from location A1, (b) from location A2, and (c) from location A3.
Figure 16.
Humidity measurements: (a) from location A1, (b) from location A2, and (c) from location A3.

Figure 17.
Temperature measurements: (a) from location A1, (b) from location A2, and (c) from location A3.
Figure 17.
Temperature measurements: (a) from location A1, (b) from location A2, and (c) from location A3.


Table 1.
Specifications of the sensors.
| Sensor | Range | Accuracy | Response Time |
|---|---|---|---|
| Flexiforce | 0.5–45 kg | ±3% | 5 µs |
| Load Cells | 50 kg | ±0.018% | 1 s |
| MAX30102 | 0–100% | ± 1% | 0.01 s |
| SHT30 | RH = 0–100% T = −40–125 °C | RH = ±1.5% T = ±0.2 °C | 2 s |
Table 2.
Volunteers’ specifications.
| Subject 9 | Age/Years | Gender | Weight kg | BMI kg/m2 | Condition |
|---|---|---|---|---|---|
| Subject 1 | 29 | Male | 75 | 29.3 | Control |
| Subject 2 | 25 | Male | 60 | 22 | Control |
| Subject 3 | 33 | Male | 90 | 28 | Control |
| Subject 4 | 43 | Male | 57 | 18.3 | Sacral ulcer |
Publisher’s Note: MDPI stays neutral with regard to jurisdictional claims in published maps and institutional affiliations. |
© 2021 by the authors. Licensee MDPI, Basel, Switzerland. This article is an open access article distributed under the terms and conditions of the Creative Commons Attribution (CC BY) license (https://creativecommons.org/licenses/by/4.0/).
Share and Cite
MDPI and ACS Style
Saleh, Z.S.; Al-Neami, A.Q.; Raad, H.K. Smart Monitoring Pad for Prediction of Pressure Ulcers with an Automatically Activated Integrated Electro-Therapy System. Designs 2021, 5, 47. https://0-doi-org.brum.beds.ac.uk/10.3390/designs5030047
AMA Style
Saleh ZS, Al-Neami AQ, Raad HK. Smart Monitoring Pad for Prediction of Pressure Ulcers with an Automatically Activated Integrated Electro-Therapy System. Designs. 2021; 5(3):47. https://0-doi-org.brum.beds.ac.uk/10.3390/designs5030047
Chicago/Turabian StyleSaleh, Zeena Sh., Auns Qusai Al-Neami, and Haider K. Raad. 2021. "Smart Monitoring Pad for Prediction of Pressure Ulcers with an Automatically Activated Integrated Electro-Therapy System" Designs 5, no. 3: 47. https://0-doi-org.brum.beds.ac.uk/10.3390/designs5030047