Resistance Assessment of Service-Proven Aging Bridges Incorporating Deterioration-Load Dependency


1
Department of Civil Engineering, Monash University, Clayton VIC 3800, Australia
2
School of Civil Engineering, The University of Sydney, Sydney NSW 2006, Australia
Infrastructures 2020, 5(1), 10; https://0-doi-org.brum.beds.ac.uk/10.3390/infrastructures5010010
Submission received: 27 December 2019
/
Revised: 16 January 2020
/
Accepted: 17 January 2020
/
Published: 20 January 2020
(This article belongs to the Special Issue Structural Performances of Bridges)
Abstract
:The historical vehicles passed through an existing bridge can be regarded as proof-loading tests for the bridge, and, as a result, are evident of the bridge’s performance. Such service history information has been utilized to update the estimate of bridge resistance in previous studies with the help of a Bayesian method, where the resistance deterioration process was assumed to be independent of the vehicle load process. This assumption is, however, untenable in many cases where the deterioration stochastic process is statistically correlated with the load process (e.g., a greater load intensity may affect/accelerate the deterioration of structural resistance and the accumulation of structural fragility). With this regard, this paper investigates the effect of correlation between the resistance deterioration and load processes on updating the resistance of aging bridges with prior service load information. The copula function is employed to model the joint distribution of the correlated deterioration and load processes, with which the correlation is measured by the Kendall’s tau. A new method is developed in this paper to assess the updated bridge resistance taking into consideration the deterioration-load dependency in an explicit form. The applicability of the proposed method is illustrated using an existing RC beam bridge. The sensitivity analysis is conducted to examine how the deterioration-load dependency affects the updated resistance of service-proven aging bridges.
1. Introduction
In-service bridges may suffer from aggressive environments and increasing traffic loads and volumes, which may cause the degradation in their load capacity and serviceability. Evaluations often should be made regarding the safety of these bridges, providing quantitative evidence that they can withstand future load events with an acceptable level of reliability during future service lives. Significant uncertainties are unavoidably associated with the estimate of load-carrying capacity of an existing bridge, because many factors affect the degradation process, including environmental conditions, traffic loads and volumes and quality of periodic maintenance, whose exact influences on structural degradation are difficult to predict. To increase the accuracy in the estimate of resistance and reliability of existing bridges, an effective way is to update the probabilistic resistance models using in-site information that are representative of the site characteristics, e.g., service load history. Historical survived loads are evident of the performance of existing structures as they can be regarded as incomplete load tests. The estimate of resistance and reliability of an existing bridge can be updated using these data as long as the load history was measured and accounted for reasonably [1,2,3,4].
The work by Hall [1] was one of the first attempts to reassess the resistance of existing structures using the data of survived service loads. In later researches, the method was further used to update the reliability of existing bridges [5] and to update the piping reliability of flood defenses [6] based on survived load information. However, Hall [1] treated the structural resistance as a random variable, which is independent of the age of the structure; as a result, the effect of resistance deterioration cannot be accounted for in that method. The resistance deterioration has a significant impact on the reliability of existing structures within future service lives, as demonstrated by Stewart and Val [7], who investigated the negative effects of structural deterioration and positive effects of service load history on the updated resistance of aging structures through complex Monte Carlo simulation analysis, showing the necessity to model the structural deterioration process stochastically. Li and Wang [3] proposed close-form formulas to update the estimates of structural current resistance, initial resistance and reliability for subsequent years in the context of time-dependent reliability. However, in to-date updating methods, the resistance deterioration process was assumed independent of the load history process; such assumption is unrealistic in many cases, for example, significant load events may cause shock deterioration to the resistance of engineering structures and contribute to the accumulation of structural fragility, indicating the association between the resistance deterioration and load processes [8,9,10]. The question arises then regarding the effect of deterioration-load dependency in updating the resistance of existing aging bridges using prior service loads.
This paper investigates the role of correlation between resistance deterioration and load processes in updating the resistance of existing aging bridges with successful load history information. A closed form formula is proposed to update the estimate of current resistance taking into account the uncertainty associated with the time-variant resistance and the deterioration-load dependency. Through reassessing the resistance of an existing reinforced concrete beam bridge, the application of the proposed method is illustrated, and the effect of deterioration-load dependency on the updated resistance is investigated parametrically.
2. Resistance Deterioration Process
For an aging bridge, the structural resistance deteriorates in time due to damage accumulation caused by load effects and environmental attacks. The time-variant resistance changes in time according to Equation (1), where is the resistance at time t; is the initial resistance and is the deterioration function (a stochastic process). In this paper, is assumed independent of .
Without rehabilitation or other types of strengthening, the deterioration process is by nature a non-increasing complex stochastic process [11,12,13]. However, some relatively rudimentary/simplified models of resistance deterioration (e.g., fully correlated stochastic process), as in previous studies regarding reliability analysis of aging infrastructure [14,15,16,17], may also account for the main characteristics of structural deterioration. Moreover, Li et al. [18] reported that when performing structural time-dependent reliability analysis, the resistance deterioration process may be approximated reasonably as a fully correlated one. As a result, in this paper, the resistance deterioration process is modeled as fully correlated, as described in Equation (2),
where a is a random variable which accounts for the randomness of and is a parameter representing the deterioration type. For example, and 0.5 corresponds to deterioration due to corrosion of reinforcement, sulfate attack and diffusion-controlled aging, respectively [19].
3. Deterioration-Load Dependency
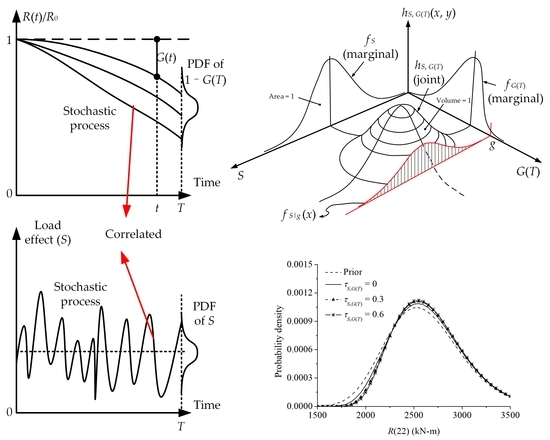
A stochastic load process and a fully correlated deterioration process of a bridge are shown in Figure 1a. For purpose of simplicity, the load process is assumed to be stationary. The service life of T years of the structure is divided into n identical discrete time intervals , , , and the CDF (cumulative density function) and PDF (probability density function) of the maximum load effect, S, experienced during each time interval are and respectively. Suppose that the current resistance of the bridge, , is evaluated and its PDF is . According to the probability distribution of initial resistance and keeping in mind the deterioration process is fully correlated, the PDF of can be obtained, denoted by . Taking into account the correlation between the load process and the deterioration process, a schematic diagram for the joint probability distribution of correlated and S, , is shown in Figure 1b (after [20]). Corresponding to different deterioration value, g, the conditional PDF of S, , changes as a result of deterioration-load dependency. Physically and S can be treated as positively correlated.
With the marginal distributions of S and given and denoted as and respectively, according to Sklar’s Theorem [21], there exists such a copula function that can be employed to construct the joint function of S and . With this, the joint distribution function of S and , , takes the form of
where is the copula function. With Equation (3), the conditional CDF of S on , , is obtained as follows,
Mathematically, various measures can be used to describe the correlation between two random variables, such as linear correlation (Pearson correlation) and rank correlation (e.g., Kendall’s tau) [22]. The Pearson correlation is commonly used to measure the bivariate linear association, and is very sensitive to the non-normality of the variables (e.g., [23]). Note that the load intensity and damage accumulation is usually non-normal and physically nonlinear. Thus, the rank-type Kendall’s tau is employed in this paper to describe the correlation between the load process and the deterioration process. For random variables X and Y, the Kendall correlation coefficient, , is defined as the probability of concordance minus the probability of discordance for a pair of observations and chosen from the samples of randomly, i.e.,
where Pr( ) denotes the probability of the event in the bracket. Note that for two random variables, various copula functions may exist leading to identical bivariate Kendall’s tau. In the paper, two types of copula functions, namely Gumbel-Hougaard copula [24] and Frank copula [25] will be utilized to construct the joint function of S and . For the Gumbel-Hougaard (G-H for abbreviation) copula,
and for the Frank copula,
It is noticed that only one parameter, , is involved in both Equations (6) and (7), which is by nature related to the Kendall’s tau, . The relationship between and for the two copula functions can be found in Appendix A. Substituting Equations (6) and (7) into Equation (3) and conditioning as g, can be obtained according to Equation (4). For illustration purpose, Figure 2 plots and for the cases of and 0.6 respectively employing the two copula functions, where S follows an Extreme type I distribution with a mean value of 1 and a standard deviation of 0.3, while follows a lognormal distribution with a mean value of 0.35 and a standard deviation of 0.06. It is seen that with S and modeled positively correlated, if g is less than the mean value of , the conditional distribution of S shifts leftwards slightly and becomes narrower compared with the prior distribution, indicating that the variance of conditional S is significantly reduced; when g is greater than the mean value of , the conditional distribution of S moves rightwards obviously, implying that the mean value of conditional S is increased by the positive correlation between S and . In addition, the choice of copula function also affects the probabilistic behavior of conditional S provided the same correlation coefficient, and the difference between the prior and conditional distributions of S is more significant for the case of Frank copula.
Furthermore, in order to visualize the dependence structure of S and , Figure 3 presents the contour plots of the joint PDF of S and , , associated with G-H and Frank copula functions for the cases of , 0.3 and 0.6. It is seen that the difference between the dependence structures of S and for different correlation coefficients or copula functions is significant, although the marginal distributions of S and are fixed for the five cases as in Figure 2. The effect of this difference on updating the structural resistance will be discussed later.
4. Resistance Updating of Service-Proven Bridges
For an existing aging bridge with a service year of T years, given the fact that the bridge survived the n maximum load effects, , experienced during the time intervals , , …, the explicit estimate of updated current resistance for subsequent service years can be found in the literature [3], where the correlation between structural deterioration and load intensity has been ignored. Now this correlation is considered in the estimate of service-proven bridges. First, one has [3,4]
where is the updated PDF of current resistance , A represents a successful performance of the bridge in the past T years, . Using the law of total probability, the numerator of Equation (8) becomes
while the denominator of Equation (8) is obtained as
where denotes the bridge reliability during the time period , and is the PDF of . Substituting Equations (9) and (10) into Equation (8), one has
5. Case Study
The Qingfang Bridge is located in the southeast of Tianjin province, China, about 1.5 km away from Bohai Bay. The bridge has a service life of 22 years, and the deterioration of the bridge’s resistance is mainly triggered by the chloride-induced corrosion of reinforcing bars [3]. It is chosen to illustrate the applicability of the proposed methods in this paper. The detailed configuration (including photo, deck section and girder section) of this bridge can be found in [3] and are listed in Table 1. The bridge is subjected to the combination of dead load and live (traffic) load. The estimate of the bridge’s current resistance will be considered, taking into account its successful service history. For the purpose of comparison, two live load intensities are considered, i.e., Case 1, kN·m; Case 2, kN·m, where denotes the mean value of the live load. The coefficient of variation (COV) of the live load is 0.18 for both cases.
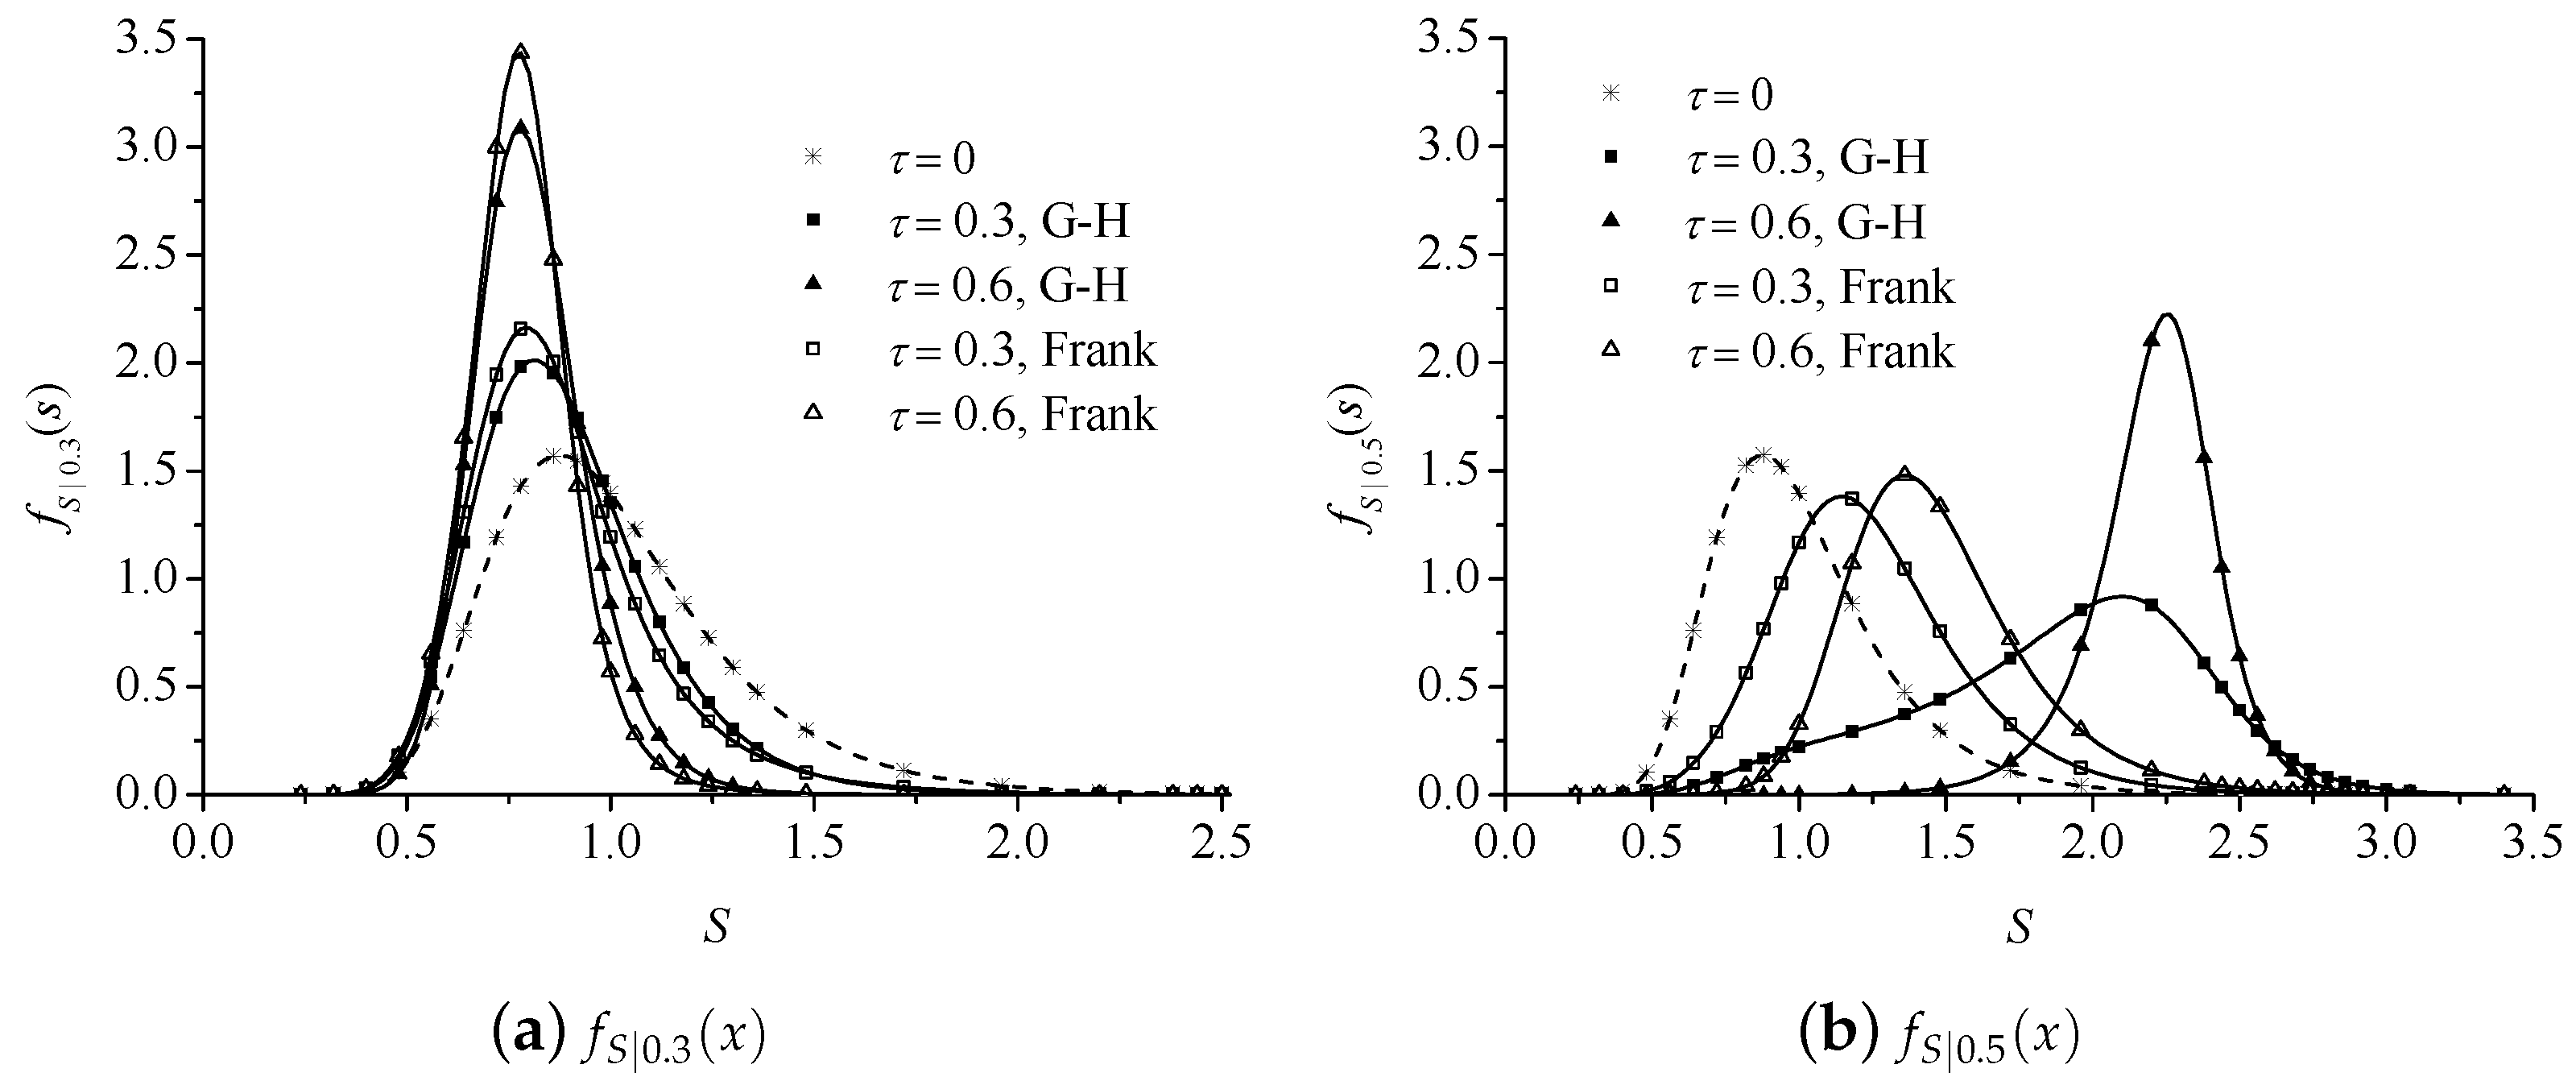
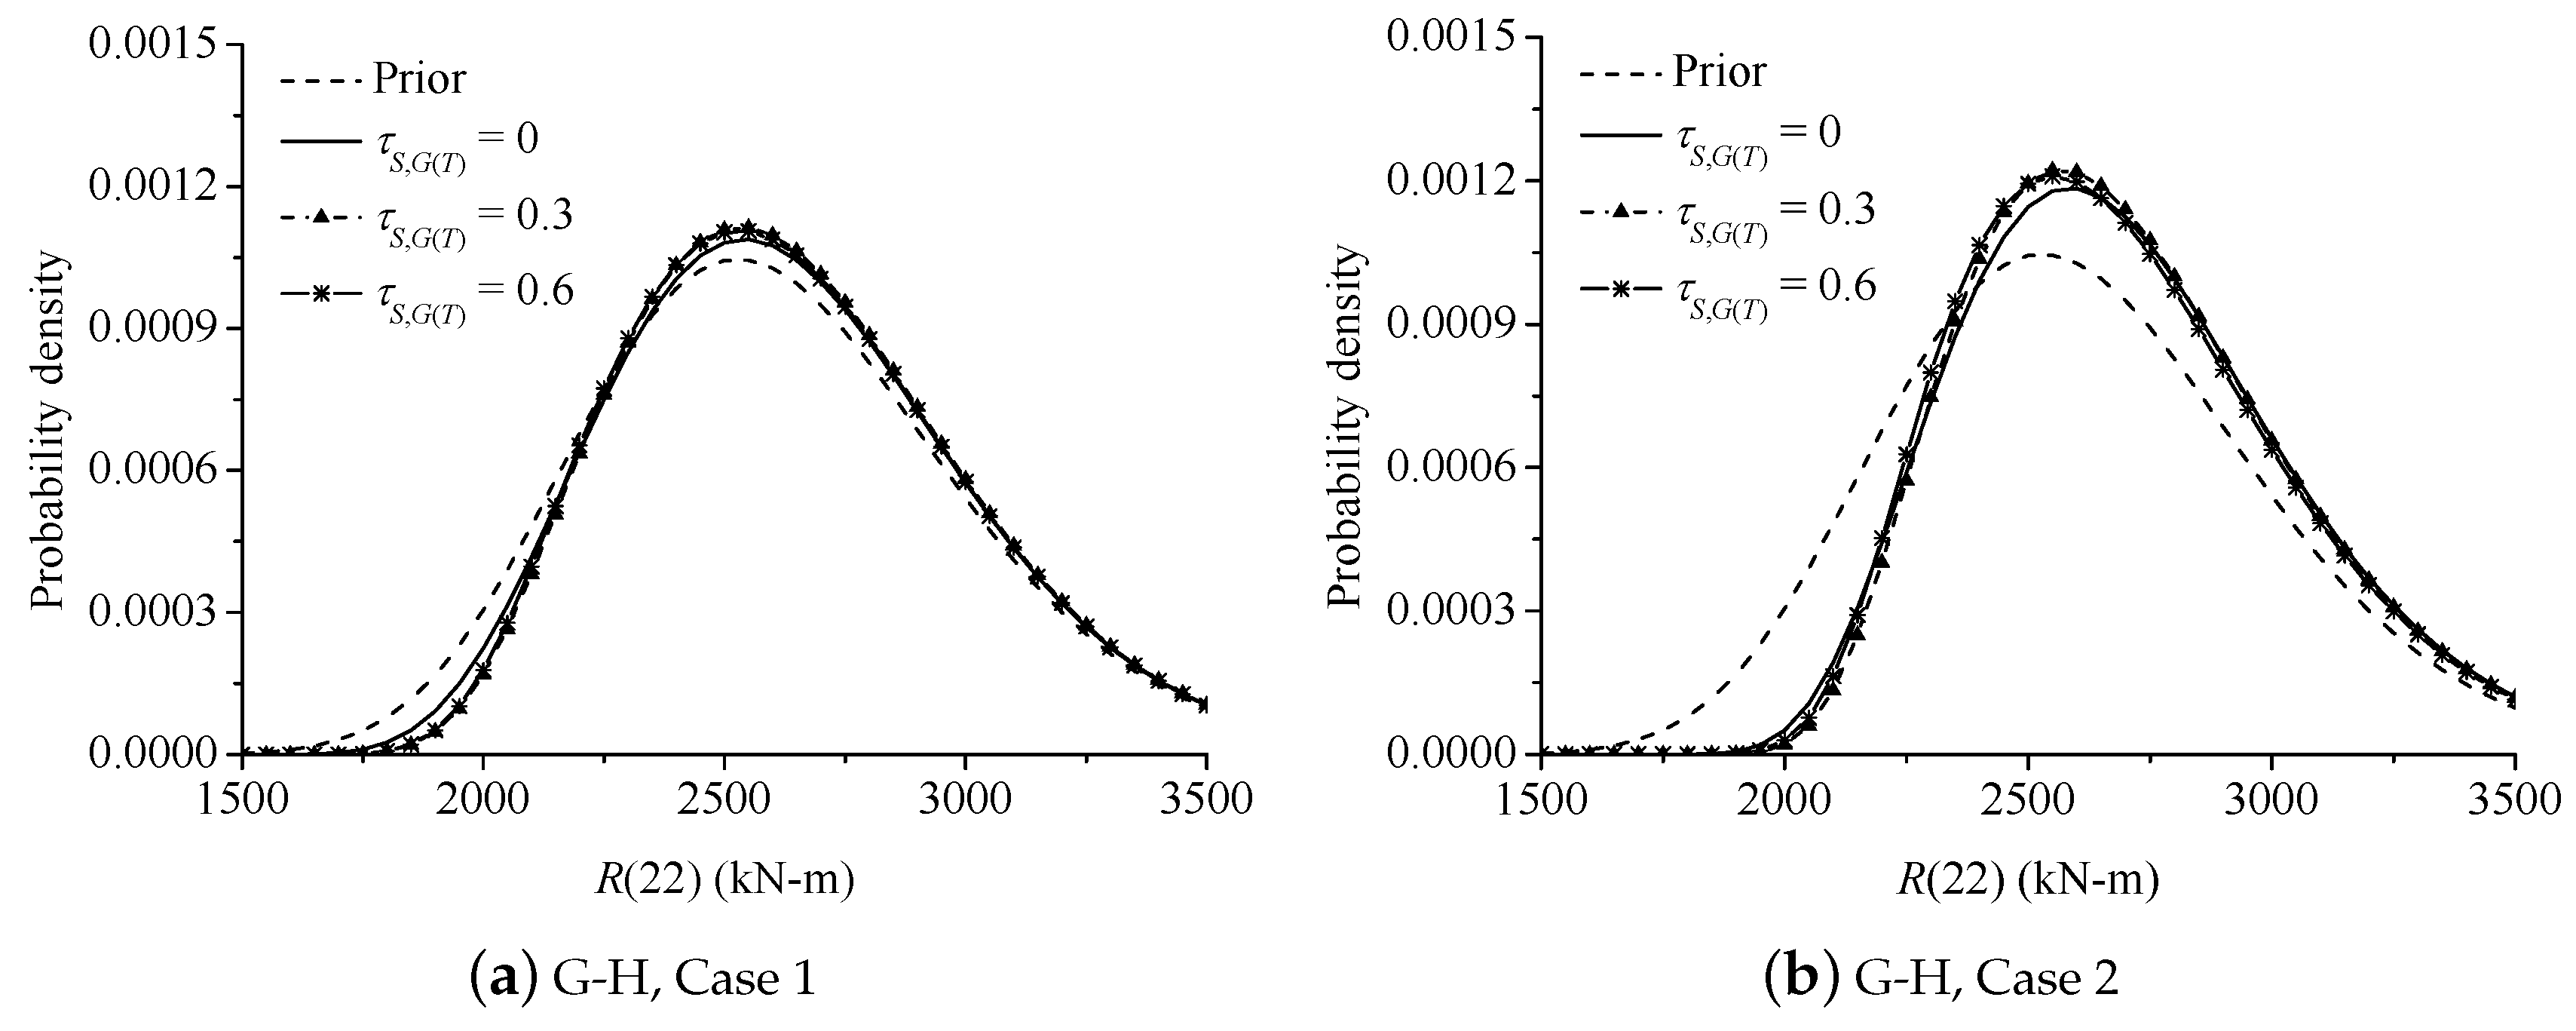
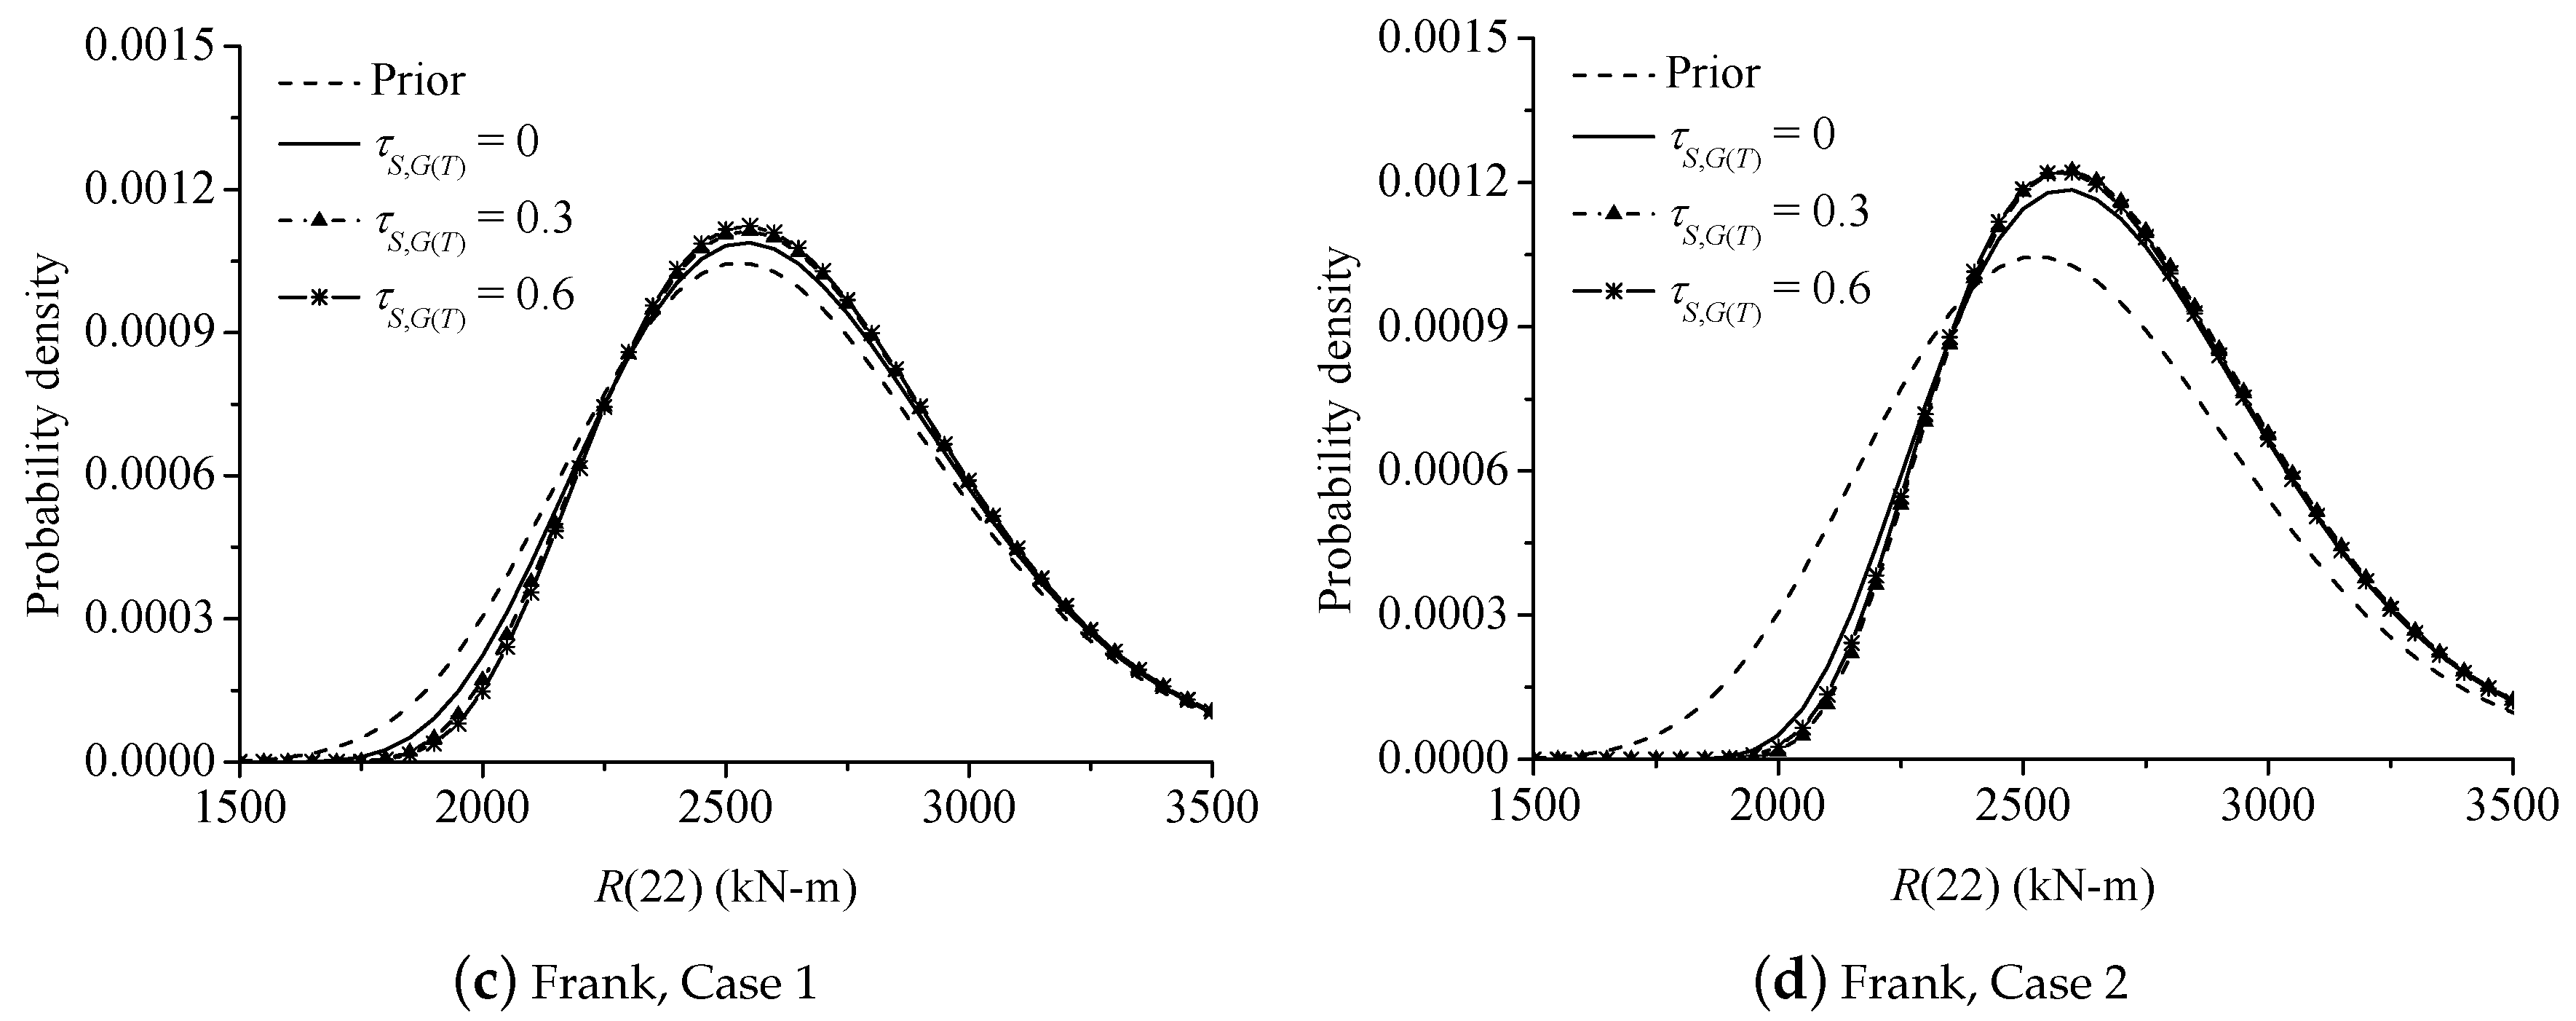
In order to demonstrate the impact that the correlation coefficient of S and has on updating the estimate of current resistance, Figure 4 plots the updated estimates of obtained from Equation (11), where the Kendall’s tau, , is set as 0, 0.3 and 0.6 respectively. The service life, years, is divided into 22 identical sections by year, and the resistance is assumed to degrade linearly (i.e., in Equation (2)) for all cases, due to the dominating deterioration mechanism of chloride-induced corrosion of reinforcing bars. The service loads cause the failure of some deficient bridges, so the lower tail of the resistance distribution is truncated. The correlation between S and affects the updated distribution of . For instance, for the case of kN·m with G-H copula employed, the mean values of updated are 2712.9 kN·m, 2716.7 kN·m and 2704.8 kN·m respectively corresponding to , 0.3 and 0.6, while the standard deviations of are 352.3 kN·m, 345.2 kN·m and 347.7 kN·m accordingly. For the case of kN·m with Frank copula, the mean values of updated are 2646.1 kN·m, 2659.3 kN·m and 2663.9 kN·m when , 0.3 and 0.6 respectively, while the corresponding standard deviations of are 376.8 kN·m, 369.0 kN·m and 366.2 kN·m. In terms of the lower tail behaviour of , ignoring the deterioration-load dependency will shift the distribution leftwards and thus yields a conservative estimate of the updated resistance. The difference between the probabilistic behavior of updated associated with different can be explained by the fact that contributes to the variation of (see Table 2), while the truncation of the distribution of updated resistance is related to the failure of the bridges (c.f. the denominator of Equation (8)). This explanation will also hold for other values of T (i.e., duration of service period) according to Equation (8). From the observations in Figure 4, it is suggested that one may update the estimate of bridge resistance with the assumption of independent deterioration and load processes in an attempt to achieve a relatively conservative assessment in the presence of incomplete information on the deterioration-load dependency. Finally, it is noticed that the greater the failure probability within the past service period, the more significant the difference between the prior and updated current resistances.
6. Conclusions
This paper investigated the sensitivity of updating the resistance of existing aging bridges with successful service history information to the correlation between the deterioration and load processes. The copula function was employed to help construct the joint distribution of resistance deterioration and load intensity, where the deterioration-load dependency is measured by the rank-type Kendall’s tau. A new method was developed to update the bridge resistance in an explicit form (c.f. Equation (11)). Parametric study showed that the deterioration-load dependency impacts the updated current resistance, because this correlation contributes to the variation of the reliability within the past service period, while the truncation of the distribution of updated resistance is related to the failure of the bridges. However, if the deterioration-load dependency is unknown in practice, one may model the resistance deterioration and load processes as independent when updating the current resistance of aging service-proven bridges so as to achieve a relatively conservative assessment in terms of the lower tail behaviour.
Funding
This research received no external funding.
Acknowledgments
The author would like to acknowledge the thoughtful suggestions of three anonymous reviewers, which substantially improved the present paper.
Conflicts of Interest
The author declares no conflict of interest.
Appendix A. Relationship between θ and τS,G(T)
In this section, the relationship between and will be discussed. First, by noting that both copula functions (G-H and Frank) as discussed in this paper are Archimedean copulas, the Kendall correlation, , can be determined by [26]
where is the generator function. For the G-H copula, . Hence, . Since is defined in , it is obvious to see that if equals 1, S and are statistically independent; as approaches infinite, the limit of is 1, indicating that S and are fully positively correlated (The G-H copula can only model two non-negatively correlated random variables since ).
Next, the Frank copula is discussed. Its generator function is , where is defined in . Thus,
and
Substituting Equations (A2) and (A3) into Equation (A1), and solving Equation (A1) numerically, the relationship between and can be fitted using a polynomial. For the range of , one has
Specially, , 8 and 18.2 corresponds to the cases of , 0.6 and 0.8 respectively. When , , indicating that S and are negatively correlated once is smaller than 0.
References
- Hall, W.B. Reliability of service-proven structures. J. Struct. Eng. 1988, 114, 608–624. [Google Scholar] [CrossRef]
- Ellingwood, B.R. Reliability-based condition assessment and LRFD for existing structures. Struct. Saf. 1996, 18, 67–80. [Google Scholar] [CrossRef]
- Li, Q.; Wang, C. Updating the assessment of resistance and reliability of existing aging bridges with prior service loads. J. Struct. Eng. 2015, 141, 04015072. [Google Scholar] [CrossRef]
- Wang, C.; Feng, K.; Zhang, L.; Zou, A. Estimating the resistance of aging service-proven bridges with a Gamma process-based deterioration model. J. Traffic Transp. Eng. (Engl. Ed.) 2019, 6, 76–84. [Google Scholar] [CrossRef]
- Faber, M.H.; Val, D.V.; Stewart, M.G. Proof load testing for bridge assessment and upgrading. Eng. Struct. 2000, 22, 1677–1689. [Google Scholar] [CrossRef]
- Schweckendiek, T.; Vrouwenvelder, A.; Calle, E. Updating piping reliability with field performance observations. Struct. Saf. 2014, 47, 13–23. [Google Scholar] [CrossRef]
- Stewart, M.G.; Val, D.V. Role of load history in reliability-based decision analysis of aging bridges. J. Struct. Eng. 1999, 125, 776–783. [Google Scholar] [CrossRef]
- Choe, D.E.; Gardoni, P.; Rosowsky, D. Fragility increment functions for deteriorating reinforced concrete bridge columns. J. Eng. Mech. 2010, 136, 969–978. [Google Scholar] [CrossRef]
- Kumar, R.; Cline, D.B.; Gardoni, P. A stochastic framework to model deterioration in engineering systems. Struct. Saf. 2015, 53, 36–43. [Google Scholar] [CrossRef]
- Wang, C.; Zhang, H. Roles of load temporal correlation and deterioration-load dependency in structural time-dependent reliability. Comput. Struct. 2018, 194, 48–59. [Google Scholar] [CrossRef]
- Dieulle, L.; Bérenguer, C.; Grall, A.; Roussignol, M. Sequential condition-based maintenance scheduling for a deteriorating system. Eur. J. Oper. Res. 2003, 150, 451–461. [Google Scholar] [CrossRef]
- Saassouh, B.; Dieulle, L.; Grall, A. Online maintenance policy for a deteriorating system with random change of mode. Reliab. Eng. Syst. Saf. 2007, 92, 1677–1685. [Google Scholar] [CrossRef]
- Wang, C.; Li, Q.; Ellingwood, B.R. Time-dependent reliability of ageing structures: An approximate approach. Struct. Infrastruct. Eng. 2016, 12, 1566–1572. [Google Scholar] [CrossRef]
- Enright, M.P.; Frangopol, D.M. Service-life prediction of deteriorating concrete bridges. J. Struct. Eng. 1998, 124, 309–317. [Google Scholar] [CrossRef]
- Ellingwood, B.R. Risk-informed condition assessment of civil infrastructure: State of practice and research issues. Struct. Infrastruct. Eng. 2005, 1, 7–18. [Google Scholar] [CrossRef]
- Stewart, M.G.; Mullard, J.A. Spatial time-dependent reliability analysis of corrosion damage and the timing of first repair for RC structures. Eng. Struct. 2007, 29, 1457–1464. [Google Scholar] [CrossRef]
- Bastidas-Arteaga, E.; Schoefs, F.; Stewart, M.G.; Wang, X. Influence of global warming on durability of corroding RC structures: A probabilistic approach. Eng. Struct. 2013, 51, 259–266. [Google Scholar] [CrossRef] [Green Version]
- Li, Q.; Wang, C.; Ellingwood, B.R. Time-dependent reliability of aging structures in the presence of non-stationary loads and degradation. Struct. Saf. 2015, 52, 132–141. [Google Scholar] [CrossRef]
- Mori, Y.; Ellingwood, B.R. Reliability-based service-life assessment of aging concrete structures. J. Struct. Eng. 1993, 119, 1600–1621. [Google Scholar] [CrossRef]
- Melchers, R.E.; Beck, A.T. Structural Reliability Analysis and Prediction; John Wiley & Sons: Hoboken, NJ, USA, 2018. [Google Scholar]
- Schweizer, B.; Sklar, A. Operations on distribution functions not derivable from operations on random variables. Stud. Math. 1974, 52, 43–52. [Google Scholar] [CrossRef] [Green Version]
- Spiegel, M.R. Correlation Theory. In Theory and Problems of Probability and Statistics, 2nd ed.; McGraw-Hill: New York, NY, USA, 1992; pp. 294–323. [Google Scholar]
- Bishara, A.J.; Hittner, J.B. Testing the significance of a correlation with nonnormal data: comparison of Pearson, Spearman, transformation, and resampling approaches. Psychol. Methods 2012, 17, 399. [Google Scholar] [CrossRef] [PubMed] [Green Version]
- Hutchinson, T.P. Continuous Bivariate Distributions Emphasising Applications; Technical Report; Rumsby Scientific Publishing: Adelaide, Australia, 1990. [Google Scholar]
- Frank, M.J. On the simultaneous associativity of F(x,y) and x + y − F(x,y). Aequ. Math. 1979, 19, 194–226. [Google Scholar] [CrossRef]
- Nelsen, R.B. An Introduction to Copulas; Springer: New York, NY, USA, 2007. [Google Scholar]
Figure 1.
Illustration of the processes of load and resistance deterioration.
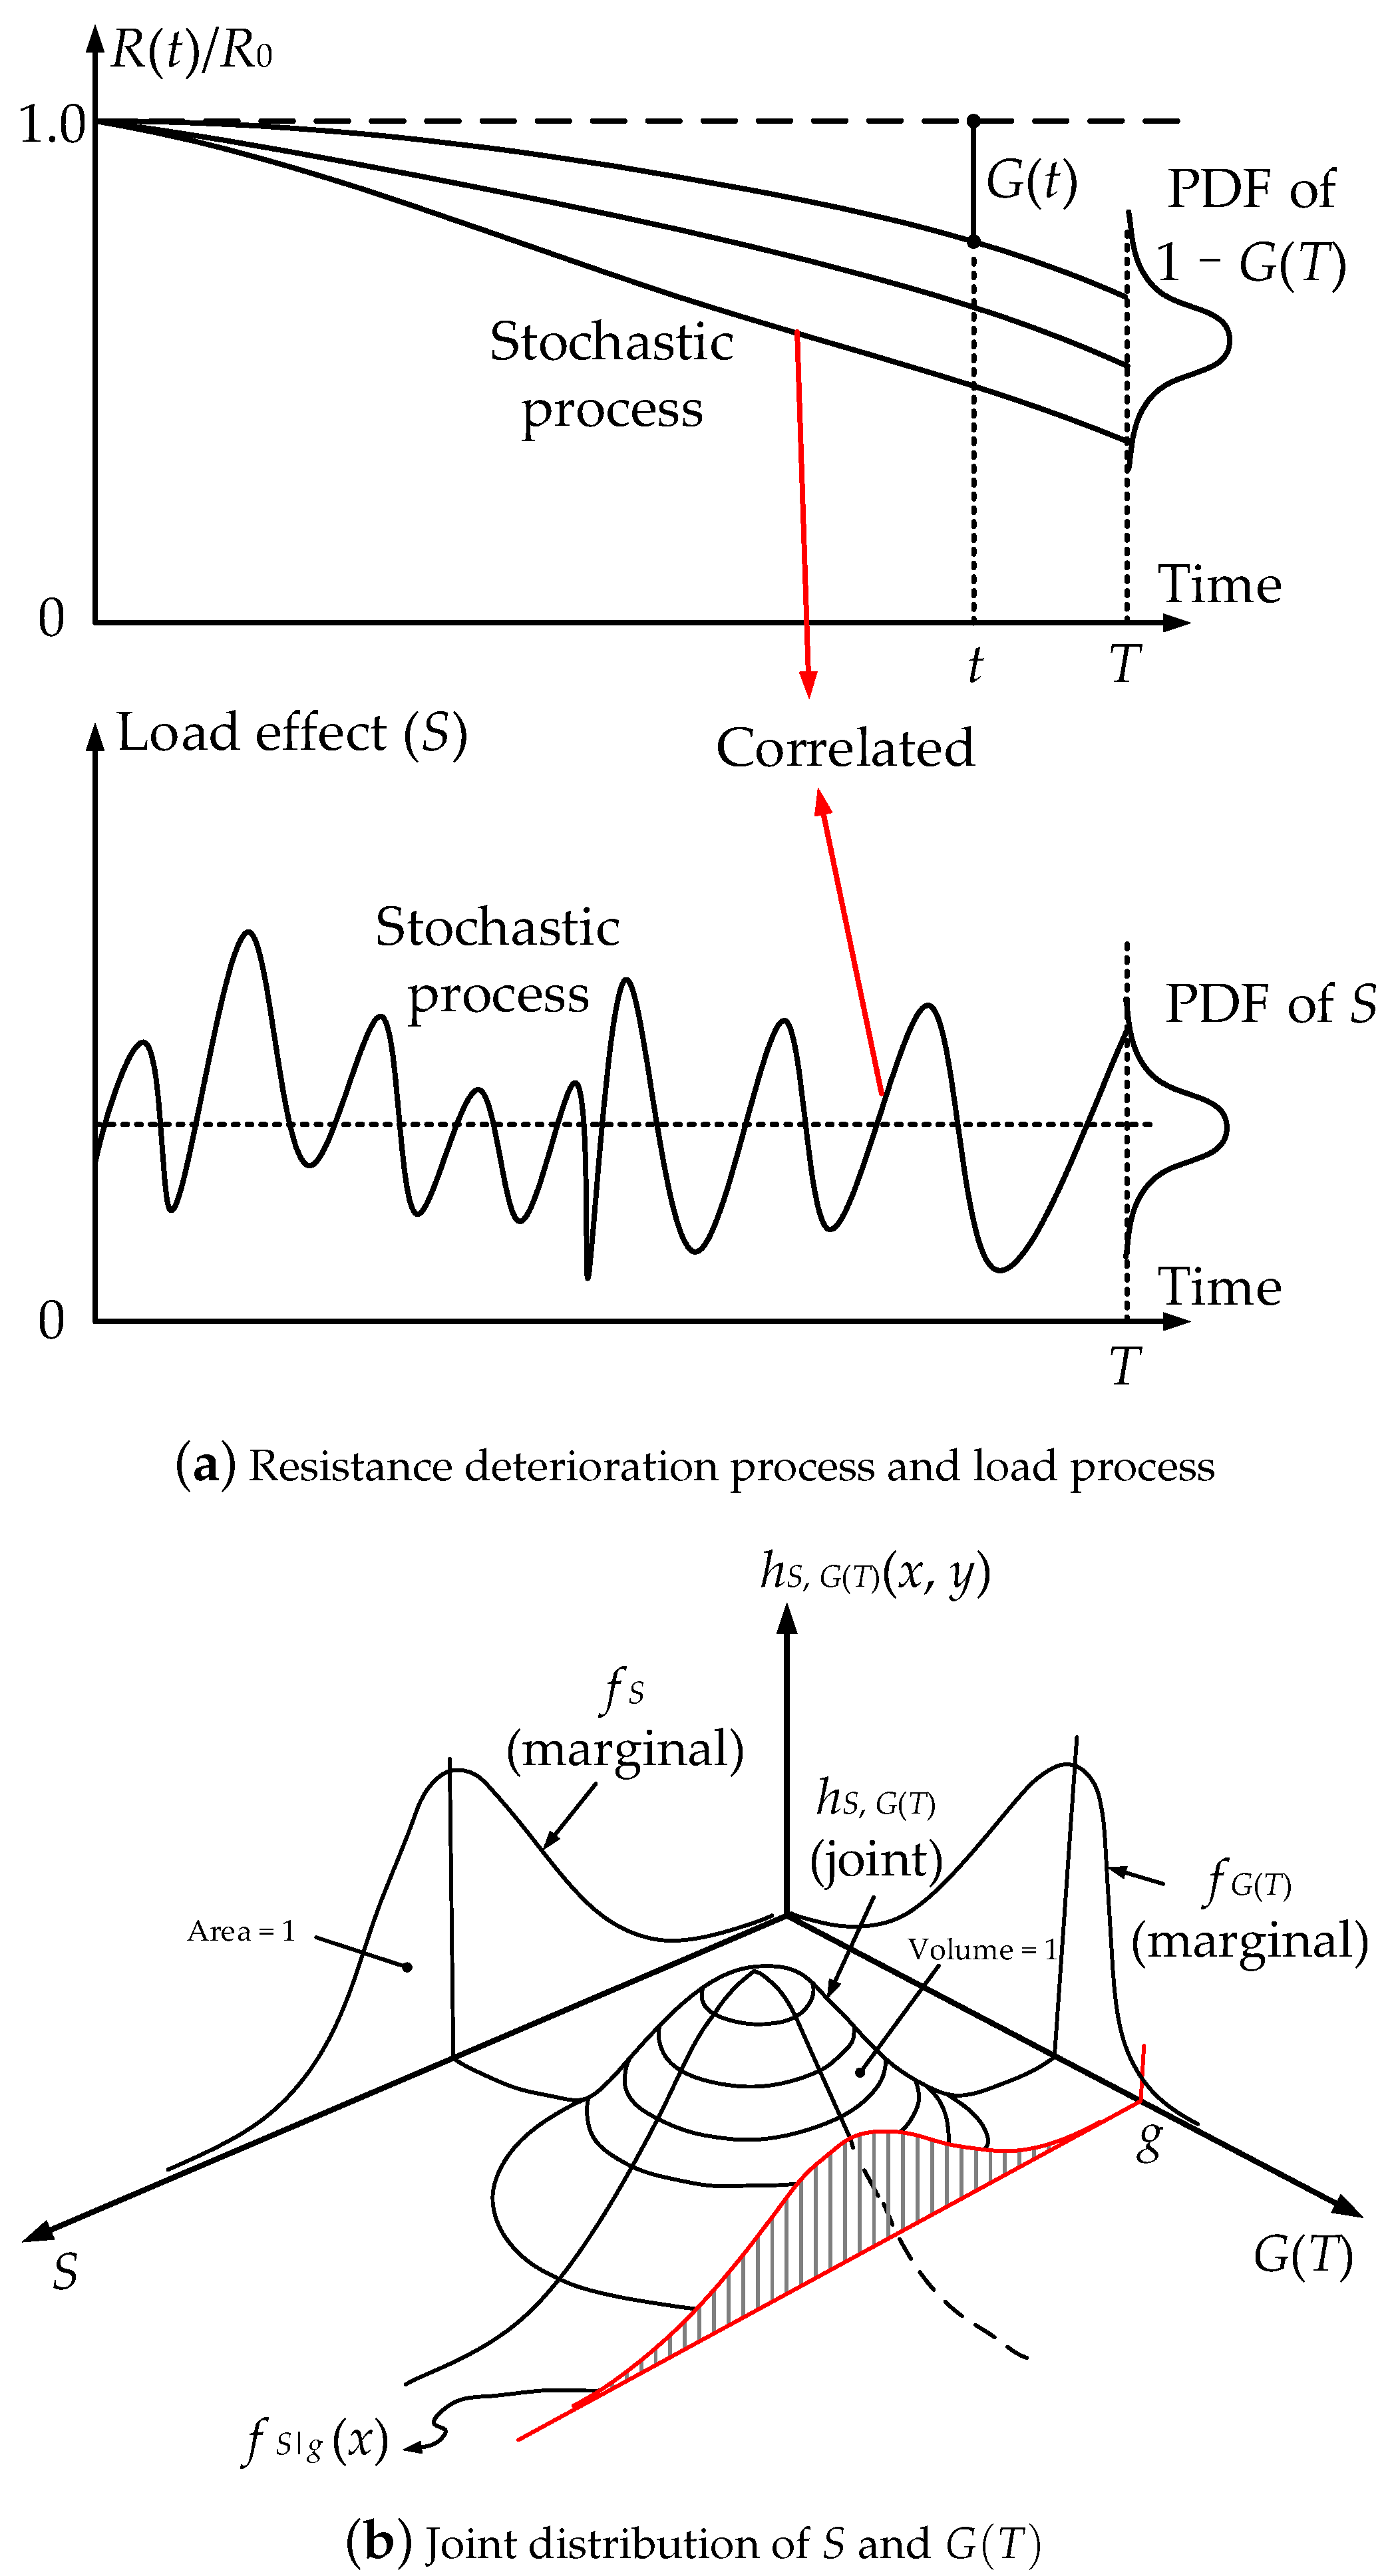
Figure 2.
and for the cases of , 0.3 and 0.6 respectively.

Figure 3.
Contour plots of the joint PDF of S and .
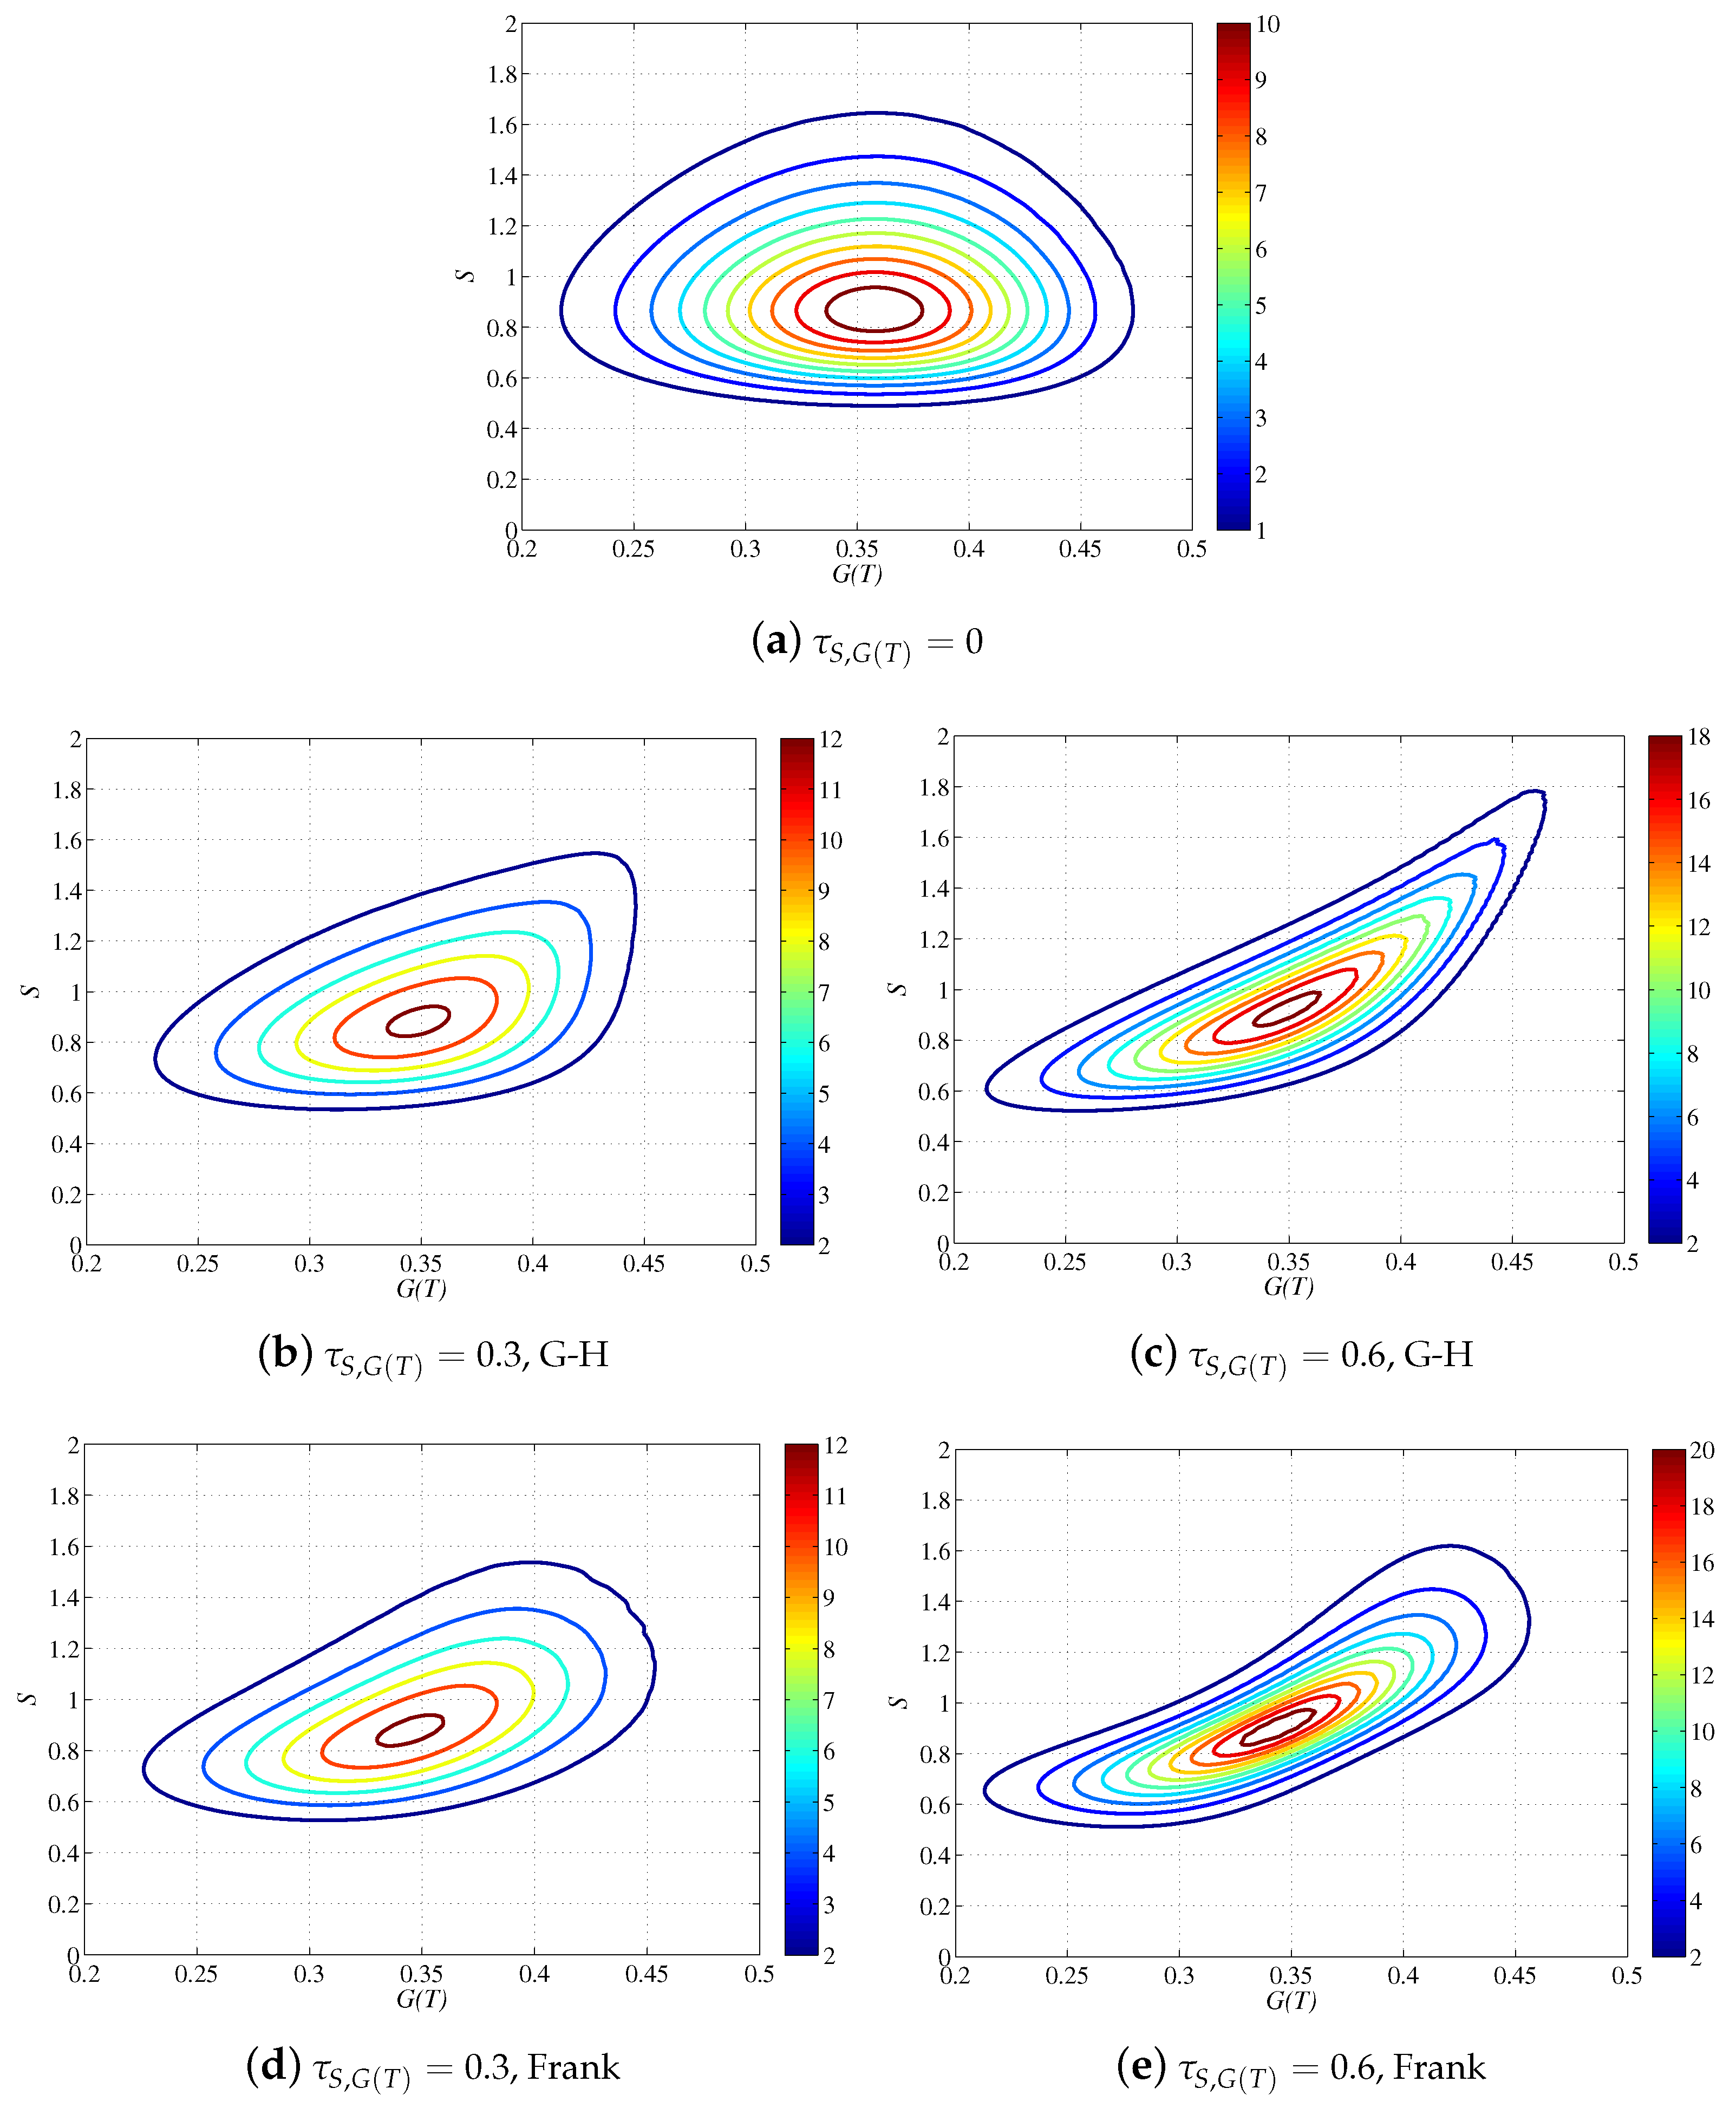
Figure 4.
Updated and prior PDFs of R(22) with different values of .


Table 1.
Parameters of Qingfang Bridge and their distributions.
| Items | Distribution | Mean | Standard Deviation |
|---|---|---|---|
| Age (T, in years) | Deterministic | 22 | / |
| Da (kN·m) | Deterministic | 1169 | 0 |
| Lb (kN·m) | Extreme Type I | ||
| (kN·m) | Lognormal | 2614 | 392 |
| (kN·m) | Lognormal | 4022 | 479 |
| Lognormal | 0.65 | 0.0592 |
aD is the dead load; b L refers to the yearly maximum live load.
Table 2.
associated with different for the case of linear deterioration.
| Copula | (kN·m) | |||
|---|---|---|---|---|
| G-H | 559 | 0.9434 | 0.9329 | 0.9416 |
| 850 | 0.8147 | 0.8249 | 0.8505 | |
| Frank | 559 | 0.9434 | 0.9245 | 0.9189 |
| 850 | 0.8145 | 0.7970 | 0.8127 |
© 2020 by the author. Licensee MDPI, Basel, Switzerland. This article is an open access article distributed under the terms and conditions of the Creative Commons Attribution (CC BY) license (http://creativecommons.org/licenses/by/4.0/).
Share and Cite
MDPI and ACS Style
Wang, C. Resistance Assessment of Service-Proven Aging Bridges Incorporating Deterioration-Load Dependency. Infrastructures 2020, 5, 10. https://0-doi-org.brum.beds.ac.uk/10.3390/infrastructures5010010
AMA Style
Wang C. Resistance Assessment of Service-Proven Aging Bridges Incorporating Deterioration-Load Dependency. Infrastructures. 2020; 5(1):10. https://0-doi-org.brum.beds.ac.uk/10.3390/infrastructures5010010
Chicago/Turabian StyleWang, Cao. 2020. "Resistance Assessment of Service-Proven Aging Bridges Incorporating Deterioration-Load Dependency" Infrastructures 5, no. 1: 10. https://0-doi-org.brum.beds.ac.uk/10.3390/infrastructures5010010