Article

Durability-Based Design of Structures Made with Ultra-High-Performance/Ultra-High-Durability Concrete in Extremely Aggressive Scenarios: Application to a Geothermal Water Basin Case Study

1
Department of Civil and Environmental Engineering, Politecnico di Milano, 20133 Milan, Italy
2
Roads and Transportations Engineering Department, University of Al-Qadisiyah, Diwaniyah 58001, Iraq
3
Enel Green Power(EGP)-Innovation and Sustainability (I&S), 00198 Rome, Italy
*
Author to whom correspondence should be addressed.
Submission received: 13 October 2020 / Revised: 8 November 2020 / Accepted: 11 November 2020 / Published: 17 November 2020
(This article belongs to the Special Issue Durability of Concrete Infrastructure)

Abstract

:
This paper provides the formulation and description of the framework and methodology for a Durability Assessment-based Design approach for structures made of the Ultra-High-Durability Concrete materials conceived, produced and investigated in the project ReSHEALience (Rethinking coastal defence and Green-energy Service infrastructures through enHancEd-durAbiLity high-performance cement-based materials) funded by the European Commission within the Horizon 2020 Research and Innovation programme (Call NMBP 2016–2017 topic 06-2017 GA 780624). The project consortium, coordinated by Politecnico di Milano, gathers 13 partners from 7 countries, including 6 academic institutions and 7 industrial partners, covering the whole value chain of the concrete construction industry. The innovative design concept informing the whole approach herein presented has been formulated shifting from a set of prescriptions, mainly referring to material composition and also including, in case, an allowable level of damage defined and quantified in order not to compromise the intended level of “passive” protection of sensitive material and structural parts (deemed-to-satisfy approach; avoidance-of-deterioration approach), to the prediction of the evolution of the serviceability and ultimate limit state performance indicators, as relevant to the application, as a function of scenario-based aging and degradation mechanisms. The new material and design concepts developed in the project are being validated through design, construction and long-term monitoring in six full-scale proofs-of concept, selected as representative of cutting edge economy sectors, such as green energy, Blue Growth and conservation of R/C heritage. As a case study example, in this paper, the approach is applied to a basin for collecting water from a geothermal power plant which has been built using tailored Ultra-High-Durability Concrete (UHDC) mixtures and implementing an innovative precast slab-and-buttress structural concept in order to significantly reduce the thickness of the basin walls. The geothermal water contains a high amount of sulphates and chlorides, hence acting both as static load and chemical aggressive. The main focus of the analysis, and the main novelty of the proposed approach is the prediction of the long-term performance of UHDC structures, combining classical structural design methodologies, including, e.g., cross-section and yield line design approaches, with material degradation laws calibrated through tailored tests. This will allow us to anticipate the evolution of the structural performance, as a function of exposure time to the aggressive environment, which will be validated against continuous monitoring, and pave the way towards a holistic design approach. This moves from the material to the structural durability level, anticipating the evolution of the structural performance and quantifying the remarkable resulting increase in the service life of structures made of UHDC, as compared to companion analogous ones made with ordinary reinforced concrete solutions.

1. Introduction

The engineering professional and research community along with the society stakeholders has been paying more and more attention to effectively implement the concept of sustainability into the design, construction, management and maintenance of reinforced concrete structures and infrastructures. Ultra-High-Performance (Fiber-Reinforced) Concrete (UHPC/UHPFRC) has been proved a promising category of materials for the aforesaid goal to be pursued, through several applications around the world [1,2,3,4,5,6,7]. This is especially true considering that reinforced concrete (R/C) structures exposed to marine and chemically aggressive environments (XS and XA exposure conditions as per Eurocode 2 [8]) experience several durability time-dependent problems, such as ageing and corrosion of reinforcement, which actually result in the need of early and often continuous repairs. Moreover, a case history analysis provided by the CON-REP-NET project [9] showed that 50% of the repaired concrete structures failed once again, 25% of which in the first 5 years, 75% within 10 years and 95% within 25 years. This highlights the urgent need of a profound rethinking of the concept and design processes for both new and repaired R/C structures in aggressive environments in view of cost-effectiveness demands.
UHPC/UHPFRC can be regarded one of the most significant innovations in the (fiber-reinforced) concrete technology introduced in the last twenty years or so. The material concept relies upon a micromechanics based design of the mix composition which optimizes the balance between crack-tip toughness and fiber pull-out work [10,11,12]. Once the first crack is formed, the crack bridging action of the fibers is activated, which results in a through-crack stress redistribution. The mix composition makes the energy necessary to form a new crack elsewhere lower than the work needed to pull-out the fibers at the formed crack and continue to opening that same crack. The iteration of this mechanism until saturation of the crack spacing leads to a stable multiple cracking process, resulting in a strain-hardening tensile behavior, up to the onset of the unstable localization of one single crack [13].
The mix-composition that enables the material to achieve this signature tensile behavior, which may make UHPC/UHPFRC a breakthrough in the concept and design of “reinforced concrete” structures, is characterized by a high binder content (both cement and cement substitutes, the latter featuring either pozzolanic or delayed cementitious activity) and a low water/binder ratio, compensated by a high dosage of superplasticizer. This yields a thorough enhancement of the performance of the material, including:
A superior performance in the fresh state, highly conducive to self-compacting and self-levelling consistency. This, besides the inborn technological advantage of an easier fabrication of even complex shapes, also results in the possibility of aligning the fibers coherently with the direction of the casting flow. The latter can be designed in such a way that the preferential direction of fiber alignment matches, as close as possible, with the direction of the principal tensile stresses within the structural element when in service. The structural use of the material can thus greatly benefit from such a tailored alignment of the fibers. The suitably balanced fresh-state performance would allow to mould the shape of an element and, thanks to a tailored casting process, to align the fibers along the direction of the principal tensile stresses resulting from its structural function. A closer correspondence between the shape of an element and its structural function [14,15,16,17,18,19,20,21] can be thus effectively pursued;
A superior durability in the un-cracked state, because of the high compactness of the matrix, as due to the high content of binders as well as to the use of small maximum aggregate sizes [22];
A superior durability in the cracked state, due to the highly effective crack-width control that the material is able to develop under tensile stresses, the proneness to penetration of aggressive agents being governed by the width of the single crack [23,24,25].
The synergy between crack tightness and material composition, as described above, also results in a high conduciveness to autogenous self-healing, with synergetic effects on the enhancement of the material and structural durability [22,26,27,28,29,30,31,32,33,34,35,36,37,38,39,40,41,42,43,44,45,46,47,48,49].
As a matter of fact, the matrix is able, on the one hand, through its extremely high compactness and crack controlling ability, to slow down the penetration of aggressive agents into its core structure, and eventually to the level of the reinforcement. On the other hand, the presence of large amount of binder, which is likely to remain anhydrous because of the low water/binder ratio and can then undergo delayed hydration, results in a high autogenous self-healing potential. The matrix is thus able to progressively seal the same tightly spaced and narrow opened cracks, thus drawing towards a recovery of its pristine level of performance in the un-cracked state, with reference to both durability and mechanical properties. These also benefit from the fact that healing products, besides reconstructing the through-crack matrix continuity, are also likely to improve the fiber-matrix bond [50]. This may also result, upon reloading a healed specimen, into the formation of new cracks, far from the healed one, instead of the re-opening of the latter [30].
Anyway, the UHPC/UHPFRC technology, despite its evident, widely predicated and lab-scale demonstrated benefits, and though several even iconic engineering applications of UHPC/UHPFRC do exist throughout the world, still has not succeeded in the breakthrough market penetration it could potentially achieve.
This is surely due, on the one hand, to the higher inertia of the construction sector in implementing innovation, as compared to other industry sectors. This may only be partially “justified” considering the concurring effects of the “safety of people concerns” embedded in the design and building of each and all building/civil engineering feats as well as to the “uniqueness” features that not seldom each single feat has. It has to be furthermore remarked that most of the UHPC/UHPFRC applications built so far have dealt with landmark infrastructure items (bridges) for which no problem existed in sustaining the significantly higher cost of a high performance material. From the first UHPFRC pedestrian bridge built in Canada in 1997, different applications (mainly bridges but also retrofitting) were built in Canada, France, Germany, Spain and China. Proprietary products were often used, which has made the category of UHPC/UHPFRC materials to be still regarded as a sort of “luxury product”, a biased idea which has hindered and could still continue to hinder their wider market penetration [51].
On the other hand, and strictly related to this, though some national guidelines have been and are going to be published, UHPC/UHPFRC has so far suffered from the lack of internationally recognized testing and design standards, which would have provided engineers the required confidence to exploit its multiple benefits in the design and construction of high-end engineering applications. As such, current solutions for new concrete constructions in Extremely Aggressive Exposures (EAEs), as recommended and enforced by design codes, are scantly taking into account this category of advanced cement based materials, neither new constituents and products specifically conceived to improve their durability (including, e.g., nanoparticles or self-healing promoters). Fib Model Code 2010 [52] has only recently introduced Fiber-Reinforced Concrete as a structural material, providing a consistent design methodology which also includes provisions for the experimental identification of the design parameters. Anyway, though strain-hardening fiber-reinforced materials, such as UHPC/UHPFRC, are covered in the Model Code, there is still no consensus about the most suited test for the experimental identification of its tensile constitutive behavior. [15,16,53,54].
With reference to durability, current approaches recommended and/or enforced by design codes mostly deal with the verification of related limit states, which, still as per fib Model Code 2010 [52], can be done according to one of the following safety formats:
Probabilistic safety format;
Partial safety factor format;
Deemed-to-satisfy approach;
Avoidance-of-deterioration approach.
So far, national and international concrete standards provide requirements to achieve the desired design service life based on the “deemed to-satisfy” and the “avoidance of deterioration” approach, where durability-related exposure conditions are defined according to 17 exposure classes [55]. Nevertheless, fib Model Code 2010 [52] recognizes that “If more refined service life designs are to be undertaken by the use of deterioration modelling, this classification of the environmental load must be related to quantified parameters, e.g., chloride concentrations for marine structures. When publishing this Model Code, such quantified parameters were not available in any operational standard. Information must therefore be found by measurements on existing structures and in the literature”.
It is nevertheless worth remarking that, even in the case of those deterioration mechanisms for which models with a relatively broad international acceptance exist, the approach proposed by the codes is based on the concept of the concrete material as a passive provider of protection rather than as an active player in the durability performance achievement. This implies that the verification is always performed by checking that the critical front of the deterioration mechanism does not reach, over the intended time, a depth which is deemed as fundamental for the structural integrity, assumed equal to the reinforcement cover. No information is given on the time evolution of the material properties and hence no information is obtainable on the residual level of “safety” which characterizes the structure at the intended end of its service life. Moreover, the models proposed for the deterioration mechanisms explicitly considered in the codes, including carbonation-induced corrosion, chloride-induced corrosion and acid attack, do refer to sound un-cracked concrete, a state which hardly represents the real service conditions of reinforced concrete structures. Though the verification of some durability-related limit states may include a crack width control, no information is provided on the evolution of such a width along the structure service life, due to interaction with material aging and deterioration phenomena, which can affect (accelerate) the predicted advance of the deterioration mechanism critical front. This is also due to the fact that most of the currently available design codes have been originally formulated with reference to normal-strength (ordinary Portland cement) concrete and then further extended, with some limitations, to the broad category of high-performance concrete. However, the significance and limitations of current prescriptions on the verification of durability-related limit states, as currently done for UHPC (Table 1), has to be carefully evaluated, with additional implications due to their peculiar composition and performance.
On the one hand, the composition of UHPCs is such to implicitly fulfil most of the “deemed to satisfy” requirements currently prescribed by the codes, such as limitations to the porosity of the concrete (traditionally expressed by maximum water/binder ratio, minimum cement content and moisture curing) or the use of composite/blended cements or supplementary cementitious materials. These issues may also affect the measurement of those parameters which would be necessary to perform the verification at a more sophisticated level, not seldom the values of the aforementioned parameters falling in the sensitivity range of the employed test method. On the other hand, the high level of mechanical and durability performance achieved by UHPC may allow for a profound rethinking of the current structure concepts, in terms of element dimensions, structure shape and material service stress levels.
This even makes unsuitable a fully probabilistic safety or a partial safety factor format verification still based on the concept of passive protection, which merely controls the advance of the critical front of the deterioration mechanism. A methodology has to be defined to predict the evolution with time of the material properties and hence of the different limit state performance indicators as a function of the structural service scenario. This has to encompass the exposure conditions, defined through more precise quantification of the environmental load, which identifies the relevant deterioration mechanism(s), and the “in structure” service state of the material, in terms of stress levels and crack patterns (width, spacing), as conceptually illustrated in Figure 1.
In this framework, the project ReSHEALience [62], funded by the European Commission within the Horizon 2020 Research and Innovation Programme, is working at the formulation and validation of a Durability Assessment-based Design approach. This aims at providing a methodology to predict the evolution of the performance of structures made of/retrofitted with ordinary and advanced cement based materials, with the main focus on the Ultra-High-Durability Concrete materials conceived, produced and investigated in the framework of the project, when exposed to extremely aggressive environments, overcoming the “deemed to satisfy approach” currently recommended by codes. It is worth here remarking that Ultra-High-Durability Concrete is, as above, a signature concept of the project, defined as a “strain-hardening (fiber-reinforced) cementitious material with functionalizing micro- and nano-scale constituents (alumina nanofibers, cellulose nanofibers/crystals, crystalline admixtures) especially added to obtain a high durability in the cracked state”. Hence, it can be deemed as representing an upgrade of the UHPC/UHPFRC classical concept exactly with reference to durability in the cracked state.
The aforementioned evaluation has been undertaken in the framework of specific structural service scenarios, which, moving from the definition of environmental actions (including, but not limited to, the exposure conditions as per EN 206) has identified the degradation mechanisms and their effects on the evolution of the material properties which enter into the calculation of the serviceability and ultimate structural performance. The real “in-structure service state” of the material, which includes, e.g., the level of cracked state and sustained stress, has been explicitly considered throughout the development of the project activities, in characterizing the durability performance of the material in the intended scenarios.
To the authors’ best knowledge, though already attempted in some cases with respect to the corrosion-induced degradation of reinforced concrete cross section capacity [63,64,65,66,67,68], the approach here proposed for the first time also includes acid attack exposure and, even more importantly, addresses the use of UHPC/UHPFRC at a full structural level. In this latter case the proposed approach explicitly considers the specific features of the aforesaid category of materials, exploiting not only their signature tensile mechanical performance but also the resulting excellent stress redistribution capacity in highly redundant structure, through the adoption of appropriate design models, including, e.g., slab yield line approach.
As a future development of the work herein presented, the effects of crack self-sealing and material self-healing will be incorporated in both the identified degradation-based time evolution laws of the material properties as well as in the algorithms for structural performance evaluation. This will also allow us to overcome the current concept of the material as a mere passive provider of protection against the degradation, finally regarding it as an active provider of the performance against durability-based limit states. The final aim of the proposed methodology is to formulate scenario-based time evolution curves for the different indicators of serviceability and ultimate structural performance, which will serve, design-wise, as decision making tools for a definition of the expected service life as well as of different possible intermediate maintenance stages as a function of the actual residual level of safety.

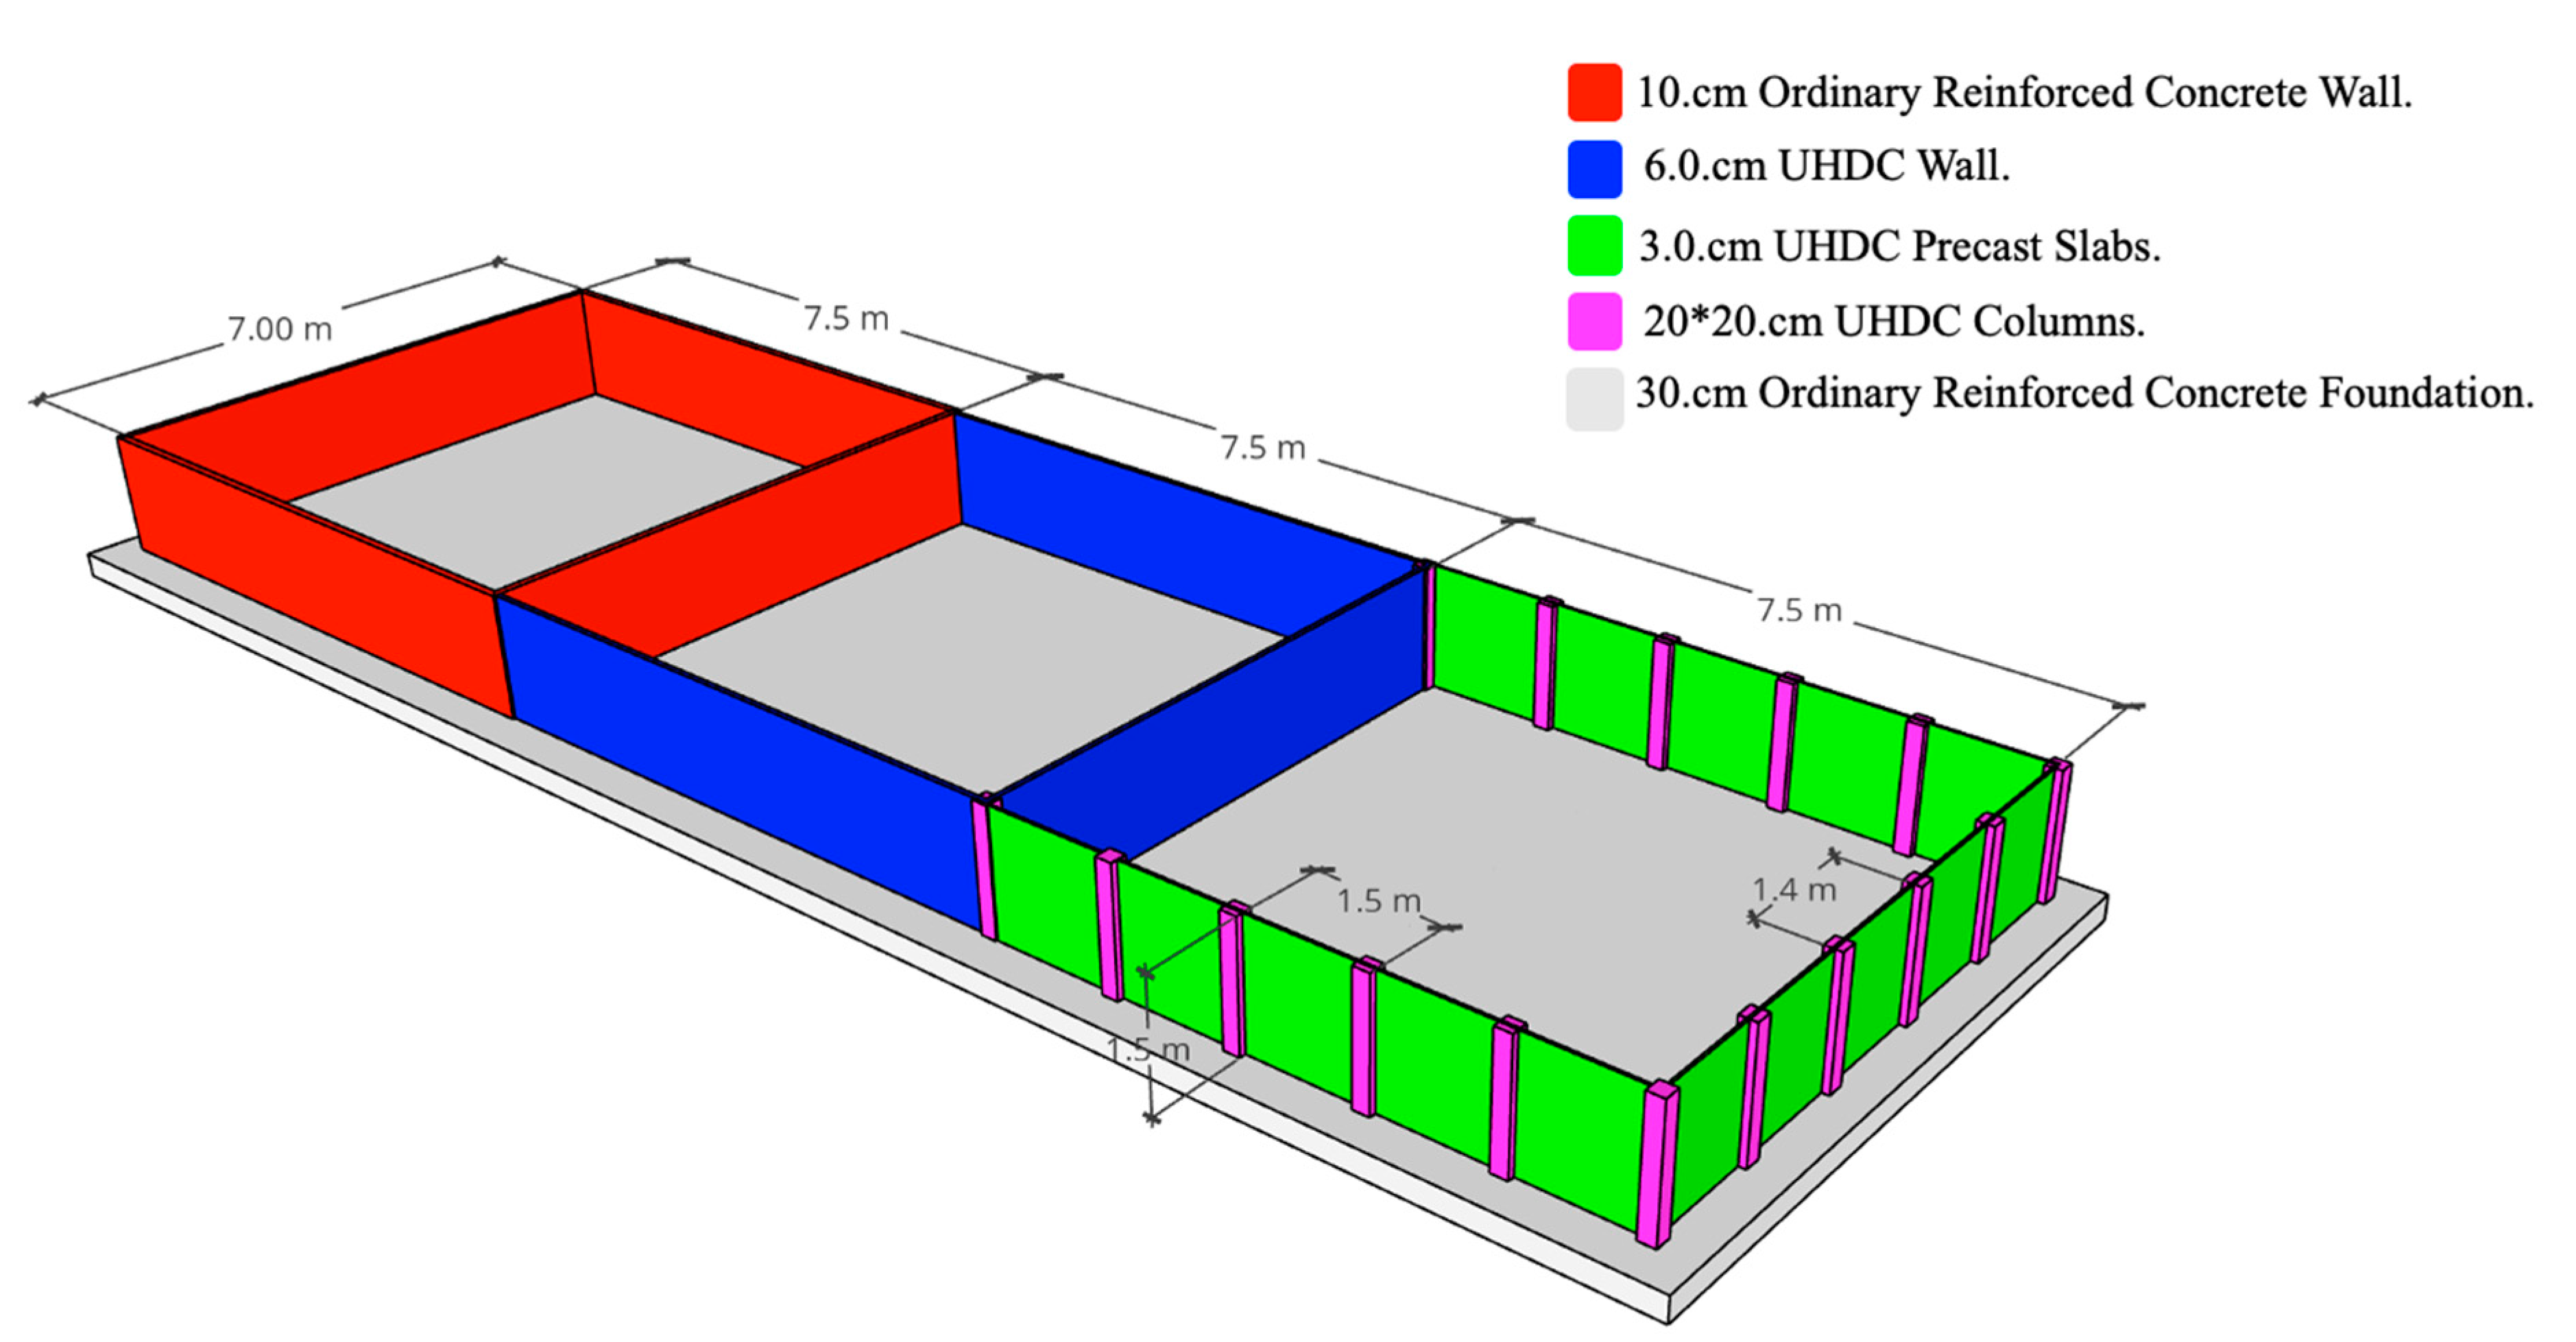
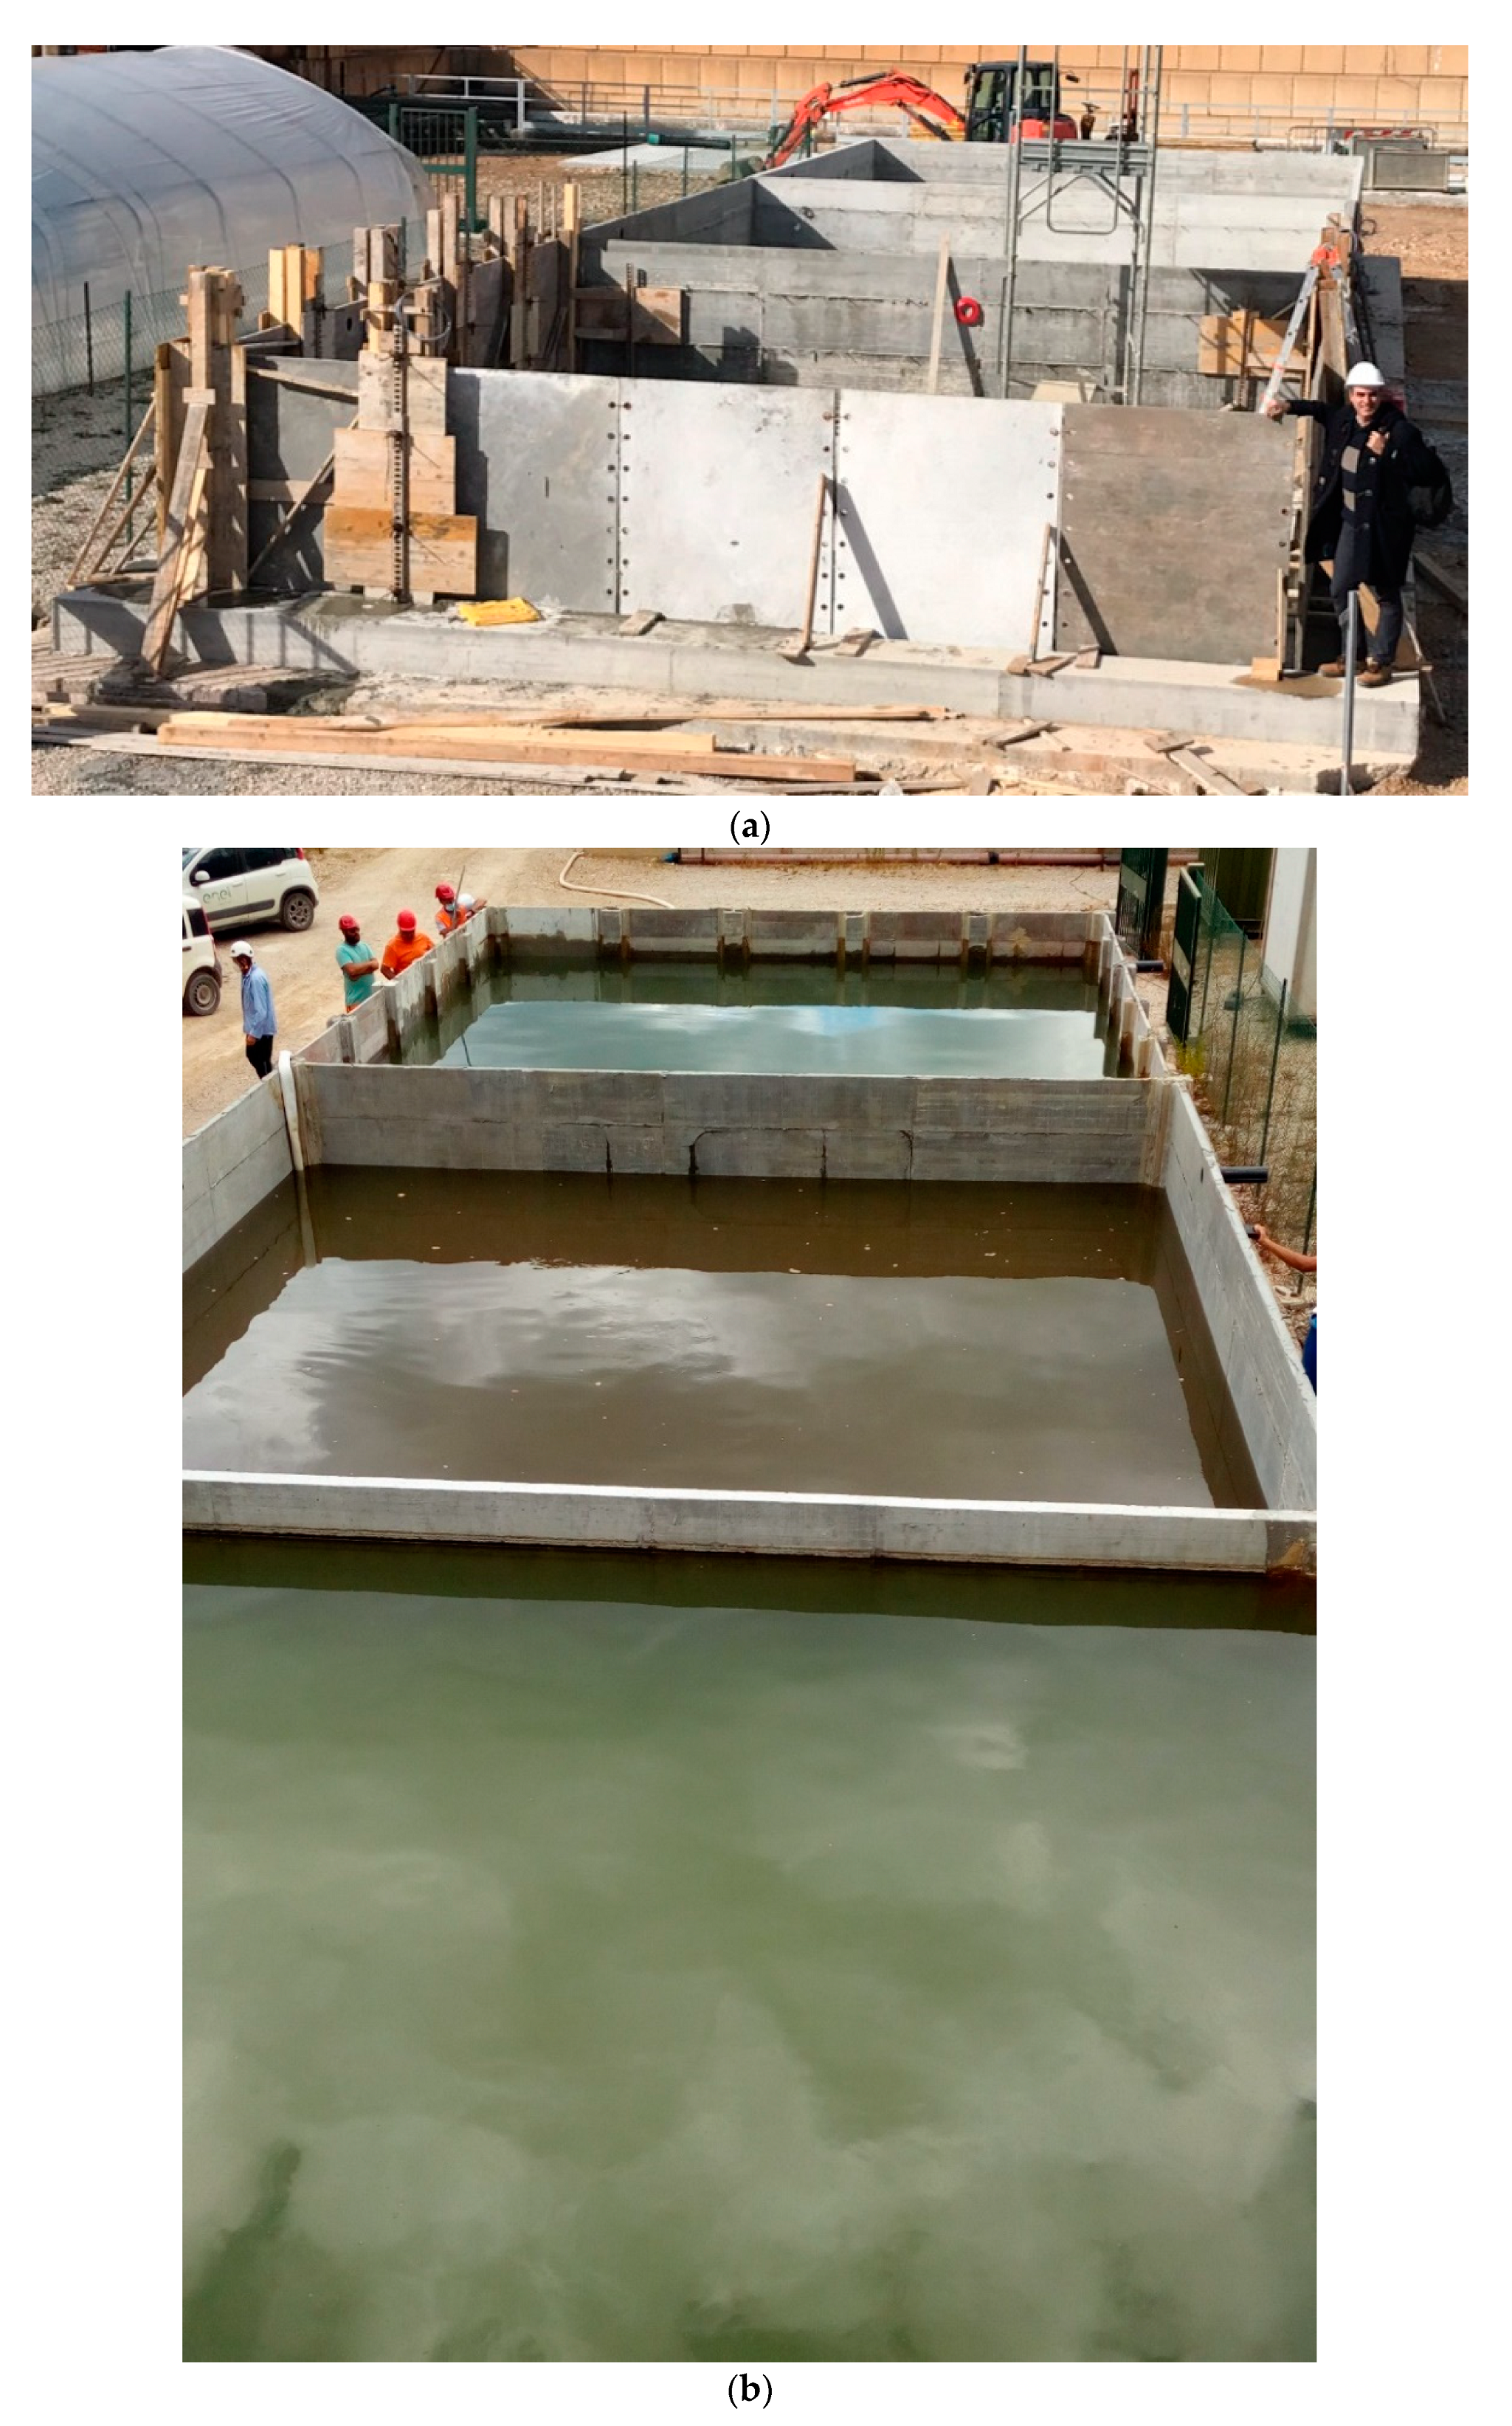
2. Description of the Pilot Case Study: A Water Basin in a Geothermal Power Plant

The concept of the durability-based design and analysis addressed above will be applied to a water basin, built on the premises of a geothermal power plant, which is schematically shown in Figure 2. The basin is meant to contain the geothermal water that comes out of the ground when drilling the geothermal pits and which is there conveyed through a cooling tower superstructure.
The structure, intended as a pilot demonstrator of the material and design concepts developed in the ReSHEALience project, is divided into three main cells by means of vertical partition walls. The in-plan dimensions of the basin are approximately 22.50 × 7.00 m2. The three compartments each measuring 7.50 × 7.00 m2 in plan, differ in materials and structural typology: one is built with ordinary reinforced concrete (R/C) and the other two in Ultra-High-Durability Concrete (UHDC). The vertical walls, which characterize the three compartments, have different thicknesses depending on the material used and the geometry of the structural elements (Figure 1). Unlike Basins 1 and 2, which have been entirely cast-in-place, Basin 3 has been designed and built adopting a partially precast solution, featuring 30-mm-thick precast slabs supported by cast-in-situ vertical buttresses with a square cross section (200 × 200 mm2), also made of UHDC and spaced 1.50 m on the long side and 1.40 m on the short side of the compartment. The dimensions of the buttresses comply with the need to ensure adequate support for the cooling tower superstructure. The precast slabs each consisting of three cell walls have been made with UHDCs featuring different compositions, with reference to specific micro- and nano-scale constituents, as further detailed in Section 4. Figure 3a, taken on 13 February 2020, shows the structure under construction. On 4 August 2020, the first load test was performed, filling the tanks with geothermal water (Figure 3b).

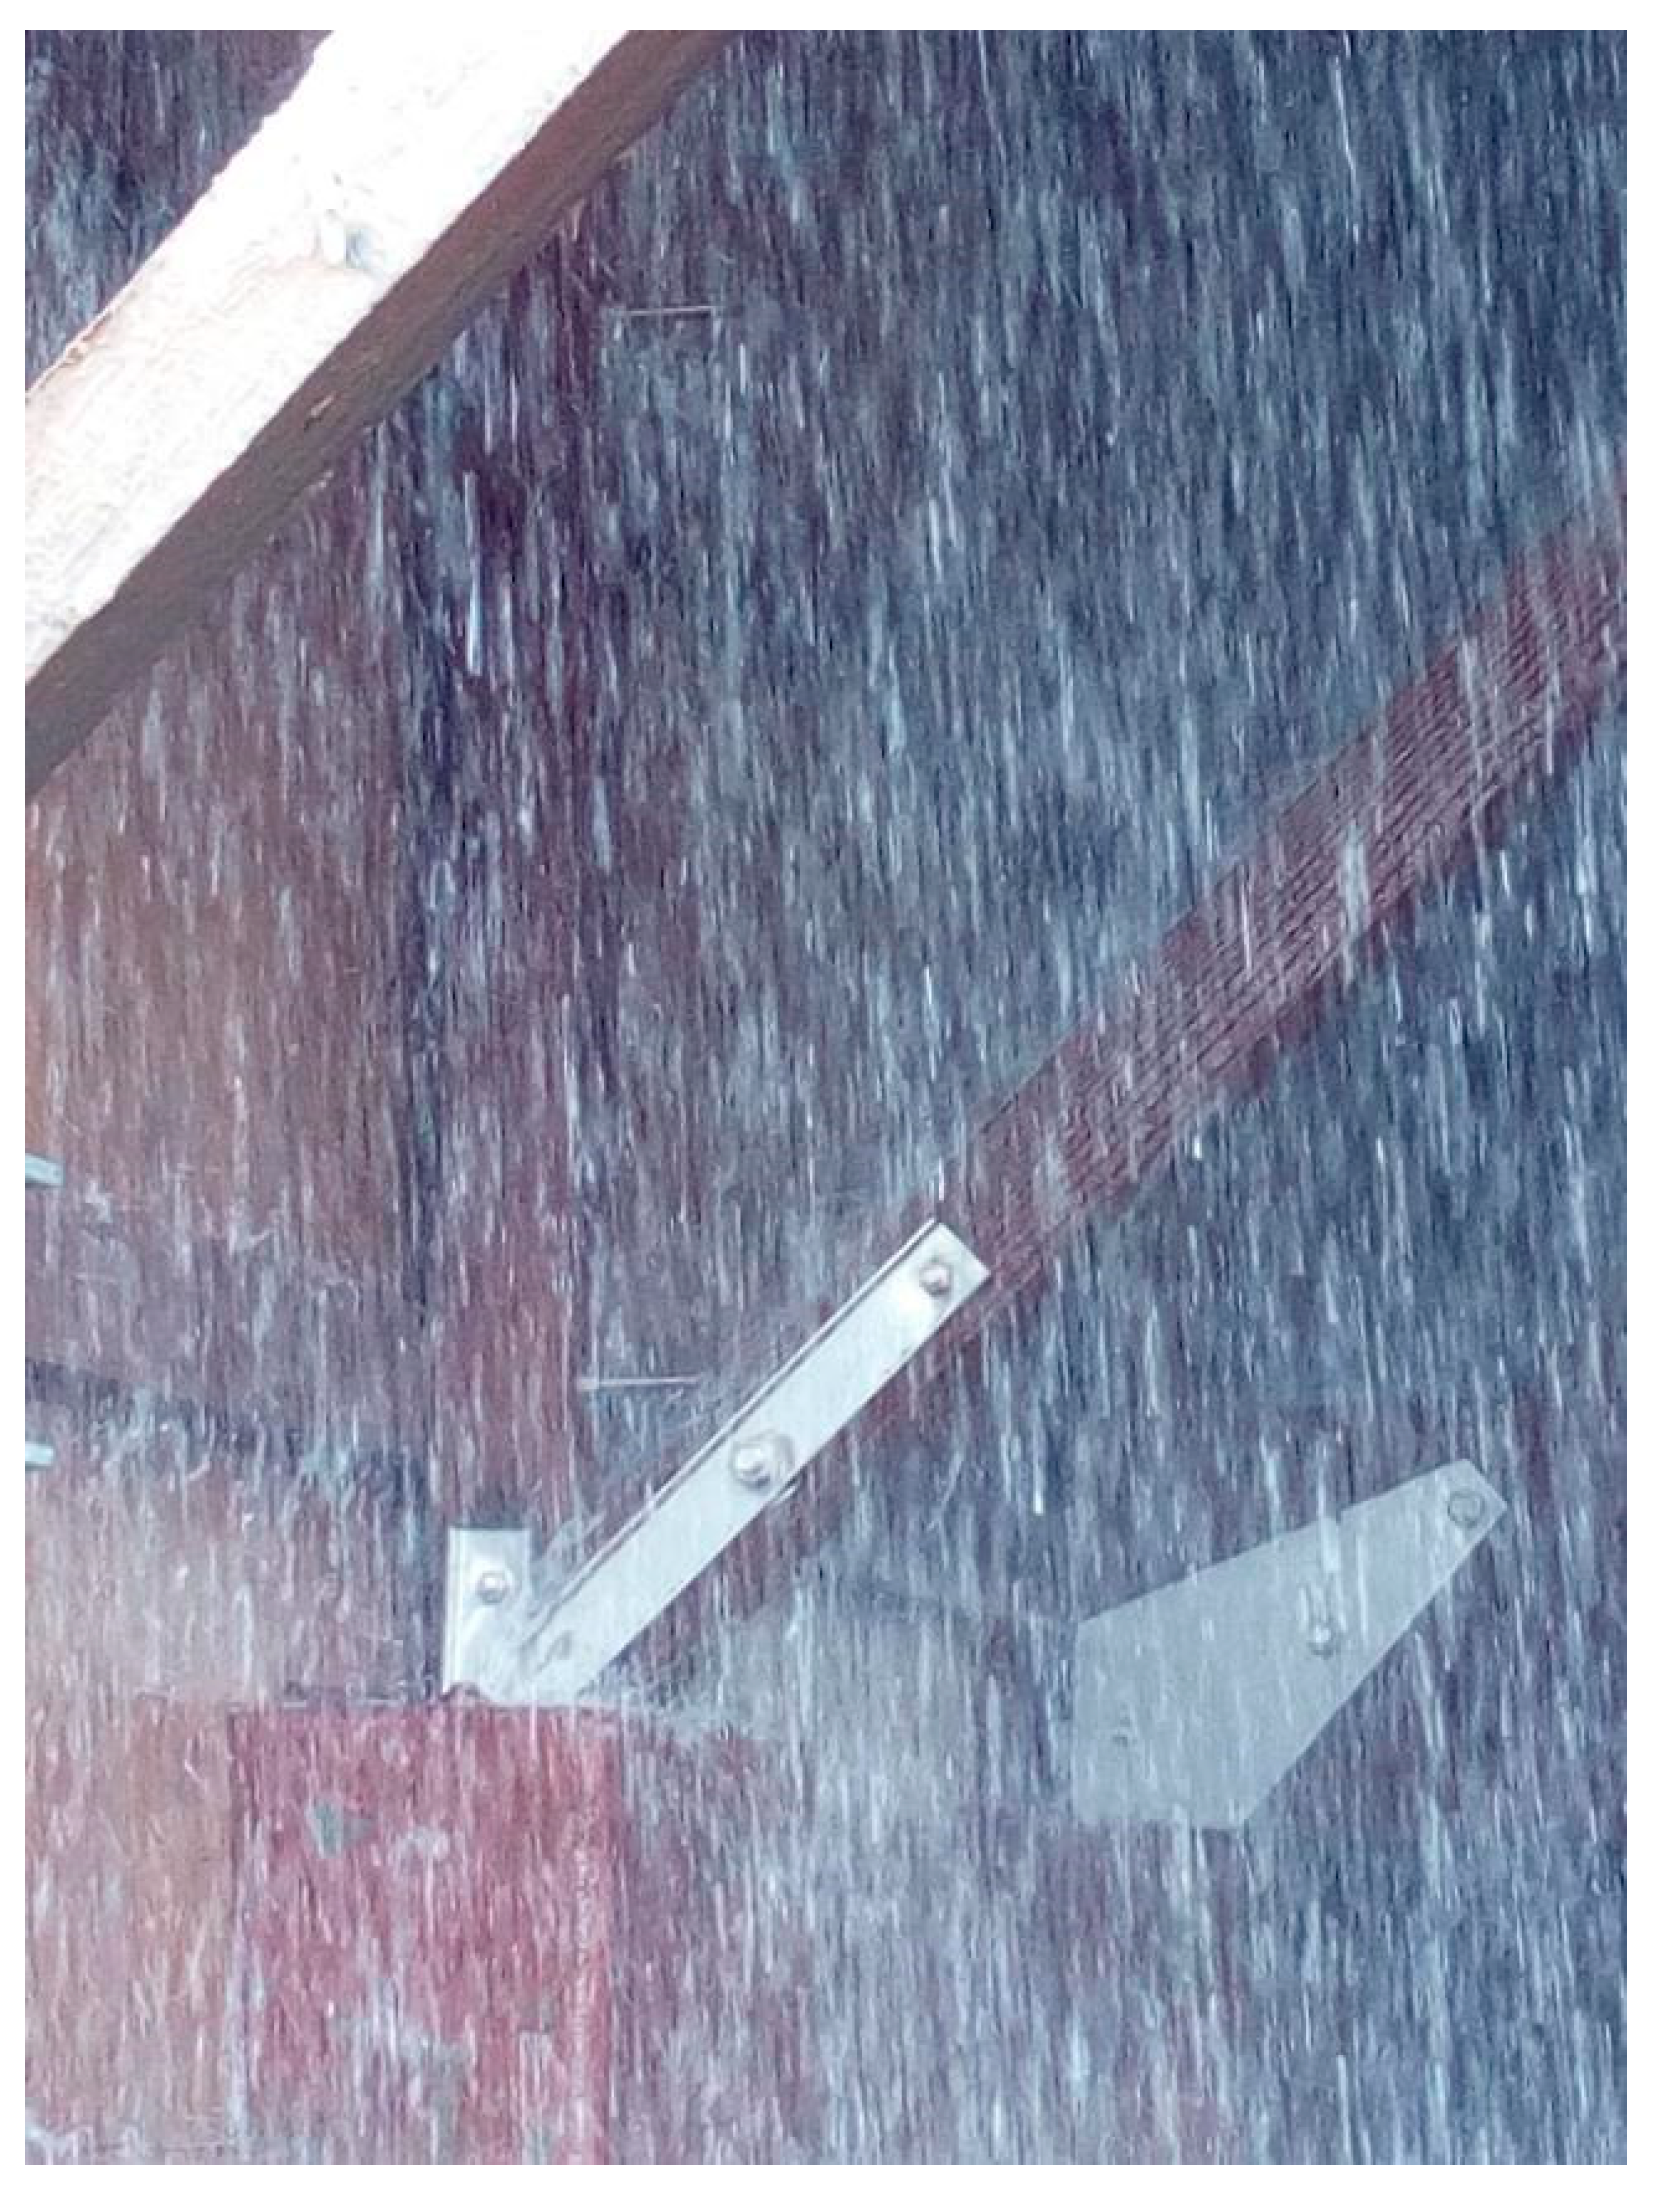
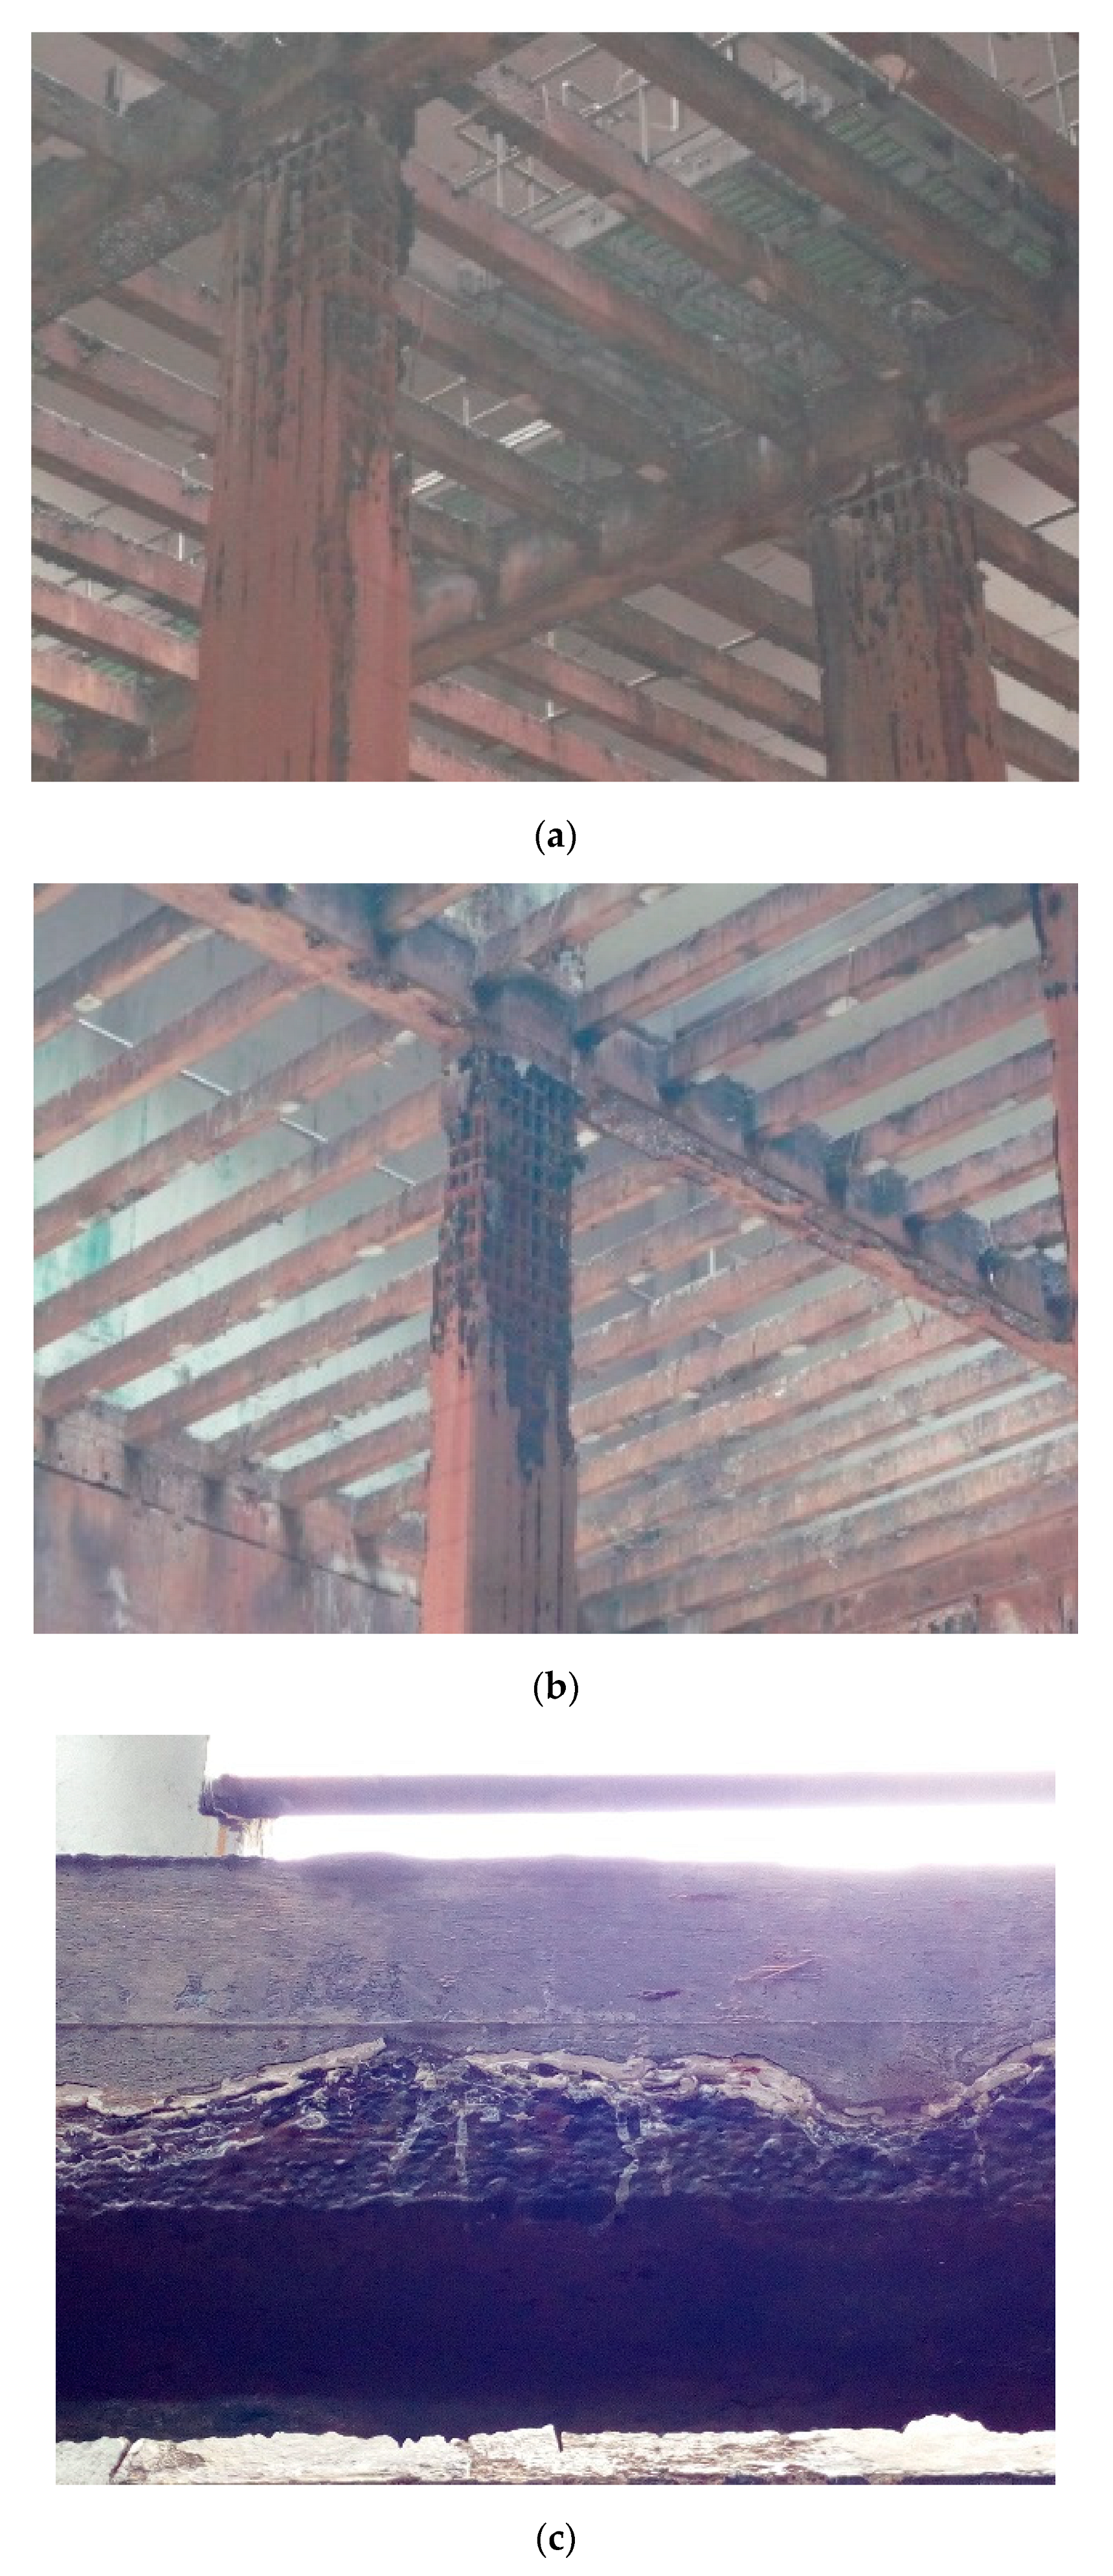
3. Current Design and Construction Practice for Structures in Geothermal Power Plants (XA Exposure Condition)

The performed design and construction of the pilot described in the previous section has to be intended as a demonstration of the “leap forward” with respect to the state of the art and technology which is made possible by the use of UHPC, functionalized and upgraded to “Ultra High Durability Concrete” thanks to the addition of self-healing crystalline stimulators and nano-constituents [69,70,71,72]. In this respect, such a current state of practice is worth being here briefly summarized also to remark the concept break-through which the proposed Durability Assessment based Design (DAD), which will be illustrated in forthcoming Section 5, is going to bring with respect to the current deemed to satisfy prescription-based approach.
Typically, in basins for cooling water and mud collection but in some cases also the superstructure of the cooling tower itself, the main source of aggressiveness is represented by the high sulphate content of the geothermal water, not seldom accompanied by chlorides, as shown in Table 2 by the summary of water characterization in different plants of the ReSHEALience consortium partner Enel Green Power. This is accompanied by the detrimental effects of mechanical erosion of the water dropping from the height of the water inlets (≅5 to 10 m) at a flow rate equal to 3500 m3/h (Figure 4). Such an exposure condition, also with reference to the composition of the water, encompasses both XS (chloride-induced corrosion) and XA (acid attack).
Typical prescriptions for this exposure classes provided in codes and standards include:
Maximum water/cement ratio according to the Code or the National Application Document (NAD).
Documents (NAD—in the case of Eurocodes) as well as depending on the type on structure (mass concrete, reinforced concrete, pre-stressed concrete) ranges from 0.4 for XS3 conditions (Danish code for offshore concrete structures DNV-OS-C502 2012 [73]) to 0.65 for XS1 conditions (German code ZTV-W-LB215 issued by Federal Waterways Engineering and Research Institute BAW [74]). Similar prescriptions hold for XA exposure conditions.
A minimum content of cement, accompanied in some case by cement type prescription (see the Irish NAD to EN 1992-1-1), which, once again according to the Code and depending on the type of structure, ranges from about 300 kg/m3 (Spanish NDA to EN 1992-1-1 for XS1 condition) to 350 kg/m3 (Spanish NAD to EN 1992-1-1) or even more than 400 kg/m3 (Danish code for offshore concrete structures) for XS3 conditions. As for XA conditions, while the Spanish NAD to EN 1992-1-1 reports similar values as for XS, the Irish NAD recommends dosages from 320 kg/m3 for XA1 to 400 kg/m3 for XA3, also depending on the type of cement and on the always recommended total content of ground granulated blast furnace slag (GGBS).
In addition to the above prescriptions, EN 1992-3 requires an adequate resistance to abrasion in silos (mainly caused by mechanical, physical and chemical attack), both for avoiding the contamination of the stored material, and to limit the reduction of the cover. Some construction regulations also limit the total content of chlorides accepted in concrete constituents, ranging from 0.1/0.2 to 0.4% of the weight of the sample, respectively for prestressed and reinforced concrete and for both XS and XA exposures [75].
These prescriptions are meant to achieve a sufficiently high concrete strength class (from C30/37 for XS/XA1 to C40/50 for XS/XA3) with sufficiently low accessible porosity and low permeability, meant as an indirect indicator of the concrete durability. For both XS and XA exposure conditions, a water accessible porosity between 6 and 9% is generally recommended, though there is so far no type of consensus about the most suitable test to measure this parameter. If reference is made to the measurement of water penetration under pressure, as per EN 12390-8 [76], an average depth between 20 and 30 mm and a maximum depth between 30 and 50 mm should be recommended for the exposure conditions at issue.
Acceptable permeability of concrete may also be quantified through a limit value of the chloride ion diffusion coefficient, as determined, e.g., through dedicated tests which will also be discussed in Section 5, which for ordinary concretes fulfilling the prescriptions above is in the order of magnitude of 10−11 m2/s in the uncracked state, though cracking may lead to an increase of two orders of magnitude. Also because of this, prescriptions on material composition are accompanied by prescriptions on structural detailing and structural design parameters, which include:
Minimum cover to reinforcement, to increase the distance to the aggression front, which depends on the structural class and on the level of aggressiveness. EN 1992-1-1 and related NADs recommend a minimum cover ranging from 20 to 45 mm for XS1 condition and from 30 to 55 mm for XS3 condition (structural classes from S1 to S6). No cover prescriptions hold for XA conditions. This is meant to delay, complying with the intended service life of the structure, the penetration of chloride ions and their accumulation up to the critical threshold at the reinforcement depth. In this respect, an acceptable chloride content in the hardened state, also known as chloride threshold, is recommended, e.g., by the Spanish standard EHE-08, equal to 0.3% and 0.6% (by weight of the dried sample) for prestressed and reinforced concrete and for both XS and XA exposures, respectively.
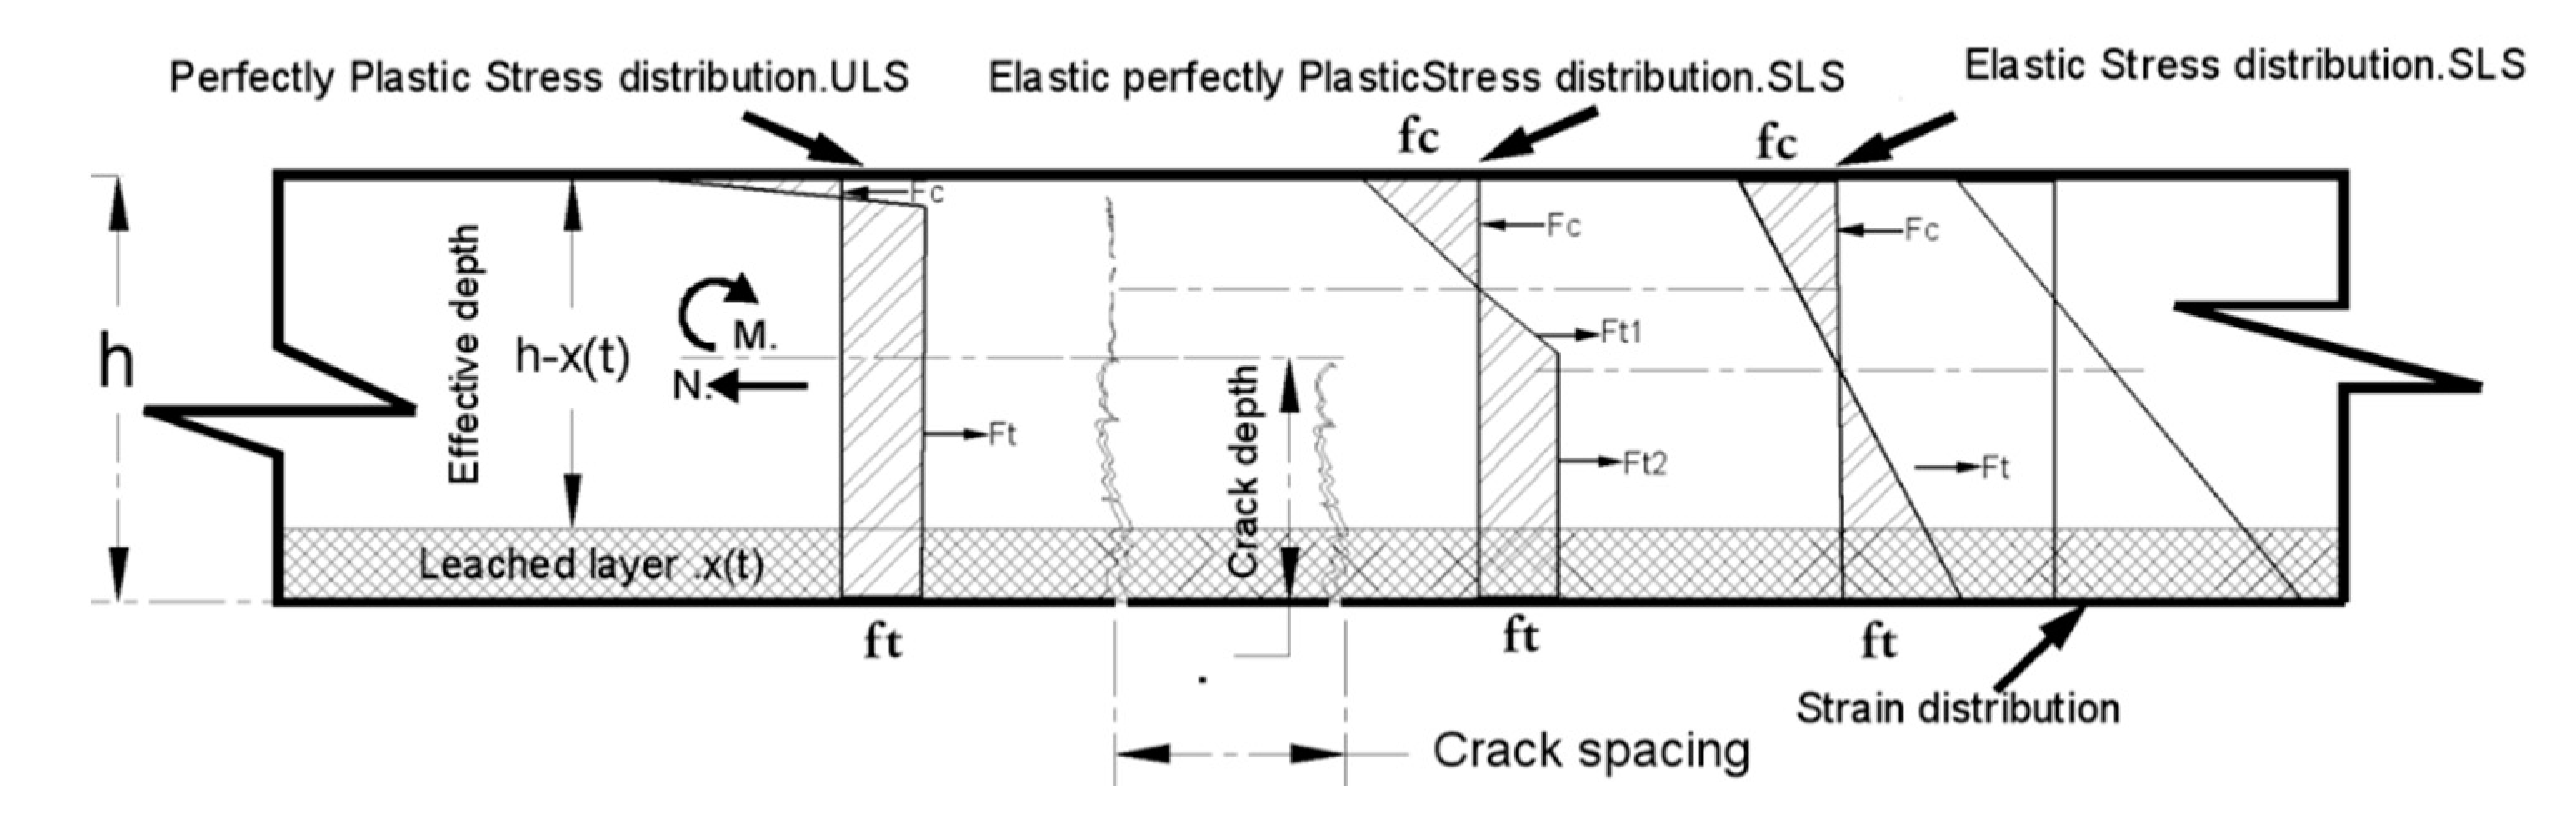
Cracking limit state, with low maximum allowable crack widths, or the use of prestressing to avoid the formation of cracks, keeping the maximum tensile stress below the cracking strength or even guaranteeing a decompression stress state. EN 1992-1-1 recommends a maximum crack width below 0.3 mm for reinforced concrete members, and prestressed members with unbonded tendons, calculated under quasi-permanent combination of actions, and a decompression state, calculated under frequent combination of actions, for prestressed members with bonded tendons. These prescriptions refer to XS conditions, no explicit requirement holding for XA, even if similar ones may be adopted. More strict requirements may be found in some EN 1992-1-1 NADs, such as 0.2 mm maximum crack width for reinforced concrete members and even 0.1 for XS3 condition for prestressed members with bonded tendons (Danish, Finnish, German and Spanish NAD). In some cases, the prescription also considering the expected service life of the structure (Swedish NAD). Specific rules for the cracking limit state are also contained in EN 1992-3, depending on the Tightness Class (from 0, when some degree of leakage is acceptable, to 3, when no leakage is permitted). Prescriptions for tightness classes above class 1 include maximum crack widths that are defined on the basis of the ratio between height of the stored liquid and thickness of the retaining structure (i.e., on the maximum pressure value), and the need to guarantee a minimum compression zone along the thickness (Table 3).
Specific criteria, including, e.g., the use of galvanized or stainless steel.
Direct durability indicators for XA exposure were only found, to the best of the authors’ knowledge, in the Canadian Standard CSA A3400-C6 on the length change of the concrete when exposed to a sulphate solution, which is fixed at 0.05–0.10%, depending on the time and severity of exposure. A summary of the afore-discussed prescriptions is provided in Table 4.
Current practice for the structure type the pilot belongs to, foresees 400-mm-thick walls and foundation slabs for the basins. Concrete class C35/45 is employed, though in older structures concrete class C25/30 can be found, with w/c ratio equal to 0.45 and minimum cement content of 360 kg/m3. To achieve the required workability (class S3 for the foundation slab and class S5 for the walls), the maximum aggregate size is limited to 20 mm. A 40-mm-thick cover is adopted.
In the case of the basins, the main pathology encountered dealt with the cracking and damage of the waterproofing, generally consisting of a bituminous coating, together with the damage of the top part of the walls, due to concurrent action of the aggressive agents in the water and of the mechanical erosion of the falling water (Figure 5a,b). The effect on the bituminous coating is even higher in the case of basins collecting geothermal drilling muds, due to the mechanical erosion of the solid particles.
Maintenance action included, besides the remake of the bituminous coating with proper sealing of construction joints, cleaning and removal of the damaged parts on the top of the walls, application of anti-corrosion mortars on the reinforcing bars and restoration of the concrete employing fiber-reinforced mortar with compensated shrinkage. Stainless steel flashings had to be placed on the top of the walls to protect the concrete from the mechanical erosion of the falling water.
In the case of concrete superstructures, the expansive action due to the reaction of the cement hydration products with the sulphates caused evident disruption in the structural frame supporting the tower, with severe cover spalling, reinforcement bar exposure and corrosion (Figure 5c). Maintenance required the building of a special metal temporary scaffolding structure, which allowed us to operate on the deteriorated beams to remove the damaged part, together with treatment and restoration of the corroded reinforcement as well as the beam and column cross section (jacketing, in case) by means of fiber-reinforced grouts with compensated shrinkage. This has led to the progressive abandonment of reinforced concrete structural solution for the tower superstructure in favor of timber or fiber glass with stainless steel joints (evident in Figure 4).

4. Materials and Design Actions

4.1. Reinforced Concrete (Basin 1)

For the design of the foundation slab and the four walls made of ordinary reinforced concrete, concrete C25/30 has been prescribed, characterized by the following mechanical properties:
  • Characteristic cylindrical compressive strength: fck = 25 MPa
  • Average direct tensile strength: fctm = 2.6 MPa
  • Average indirect tensile strength (in bending): fcfm = 3.1 MPa
  • Instantaneous modulus of elasticity: Ecm = 31 GPa
The values of the average direct and indirect tensile strength as well as of the modulus of elasticity correspond to those of the prescribed concrete class, as indicated in EN 1992-1-1 -Table 3.1 [8].
It is worth here remarking that the concrete employed to cast the outer 7-m-long wall of basin one also contained a crystalline self-healing stimulator (Penetron Admix ®), at a dosage equal to 1% by weight of cement [20]. This was meant to validate the efficacy of the same admixtures, thanks to faster and more effective self-sealing of the cracks, in reducing the chloride diffusion coefficient [77,78] and hence allow for reduced reinforcement cover values or longer design service life at equal cover thickness because of delayed onset of the corrosion process, if any.

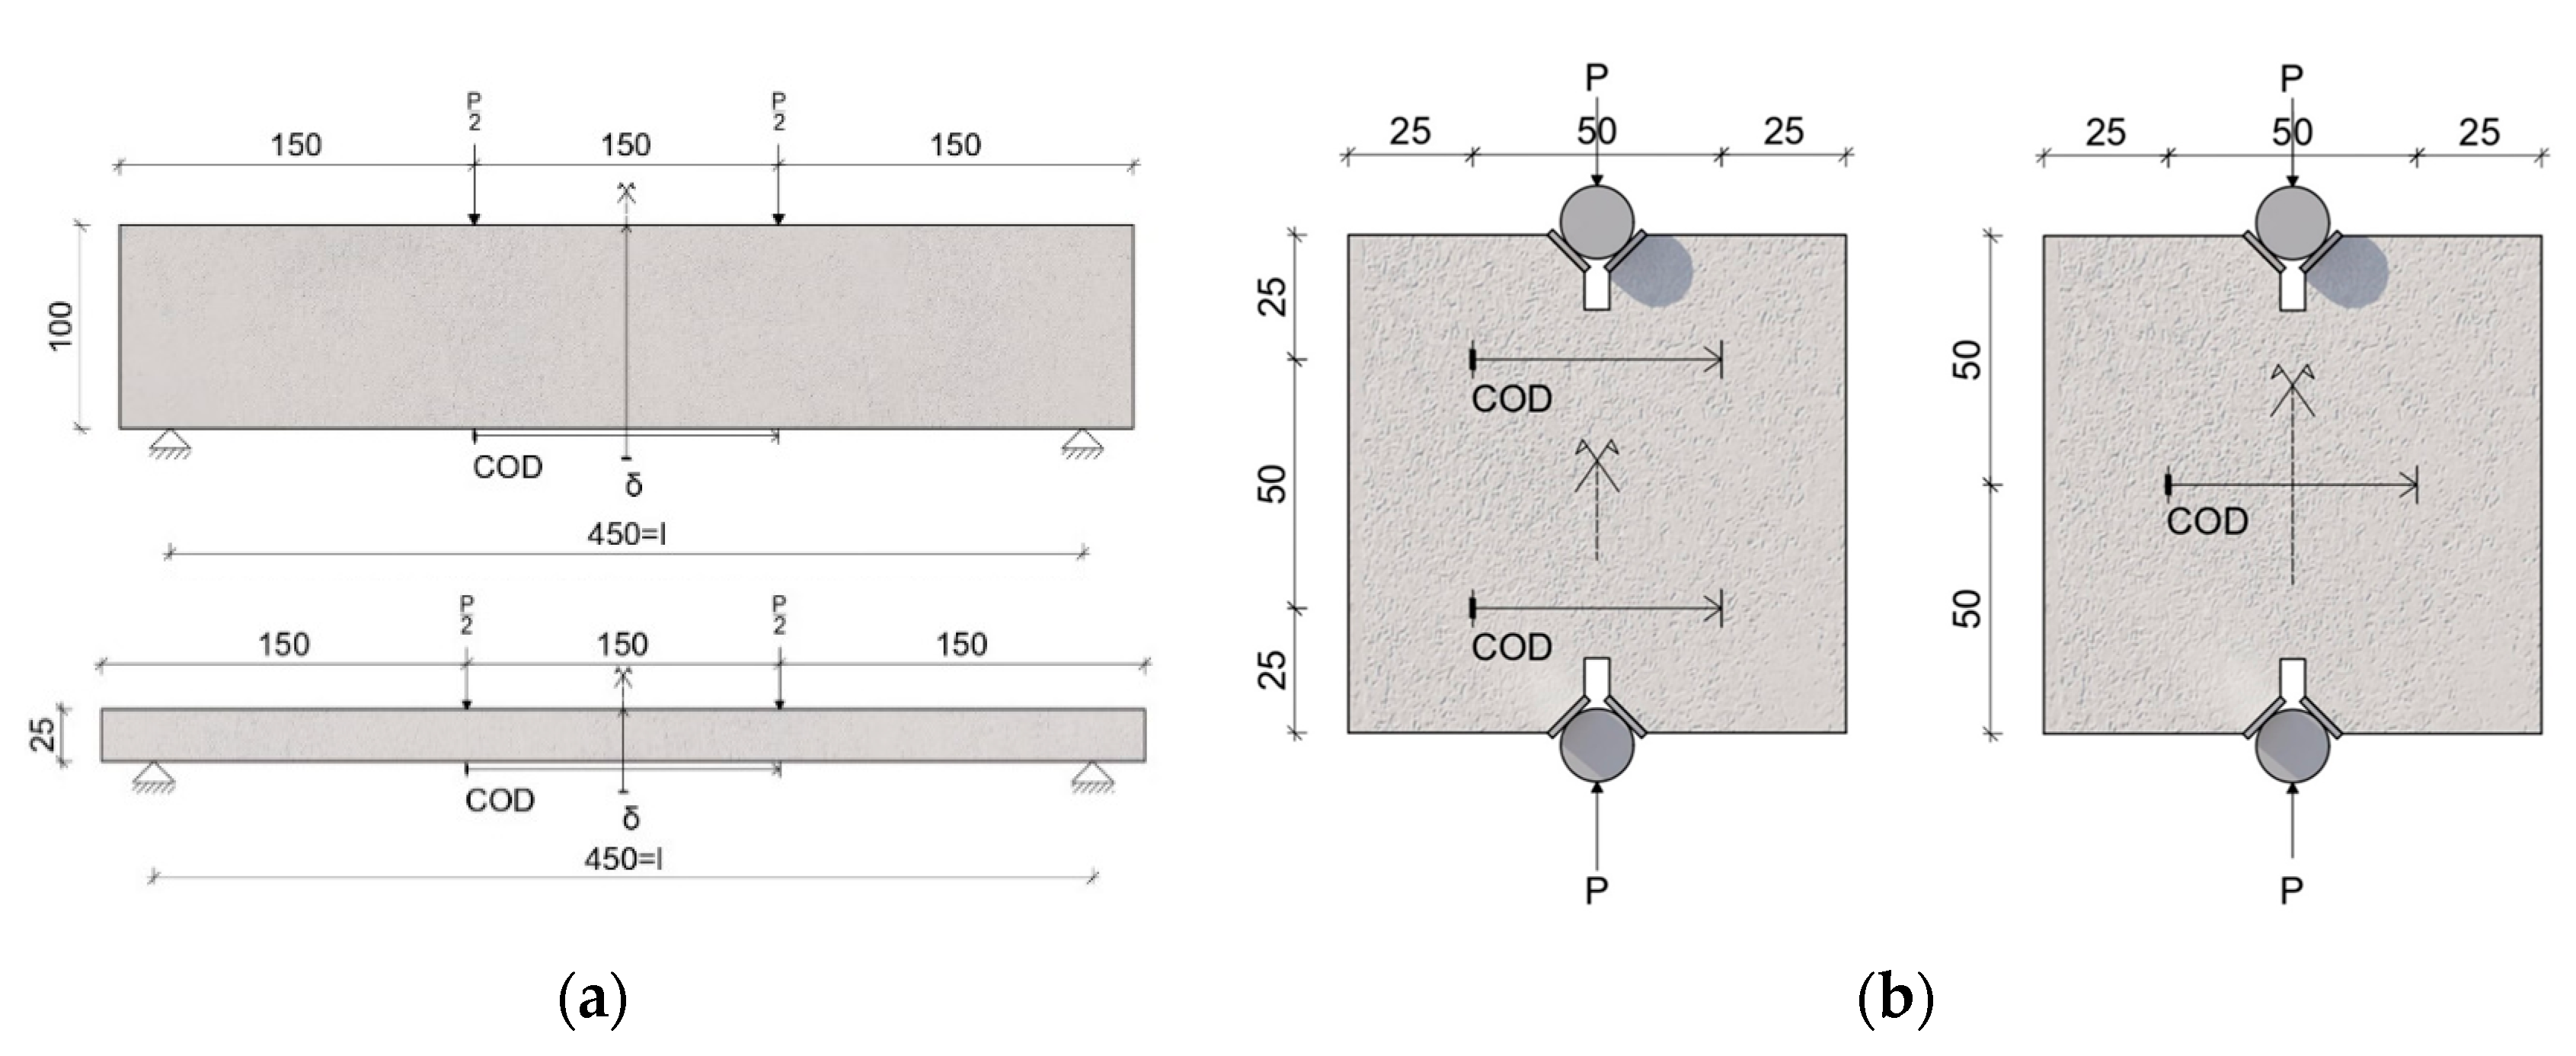
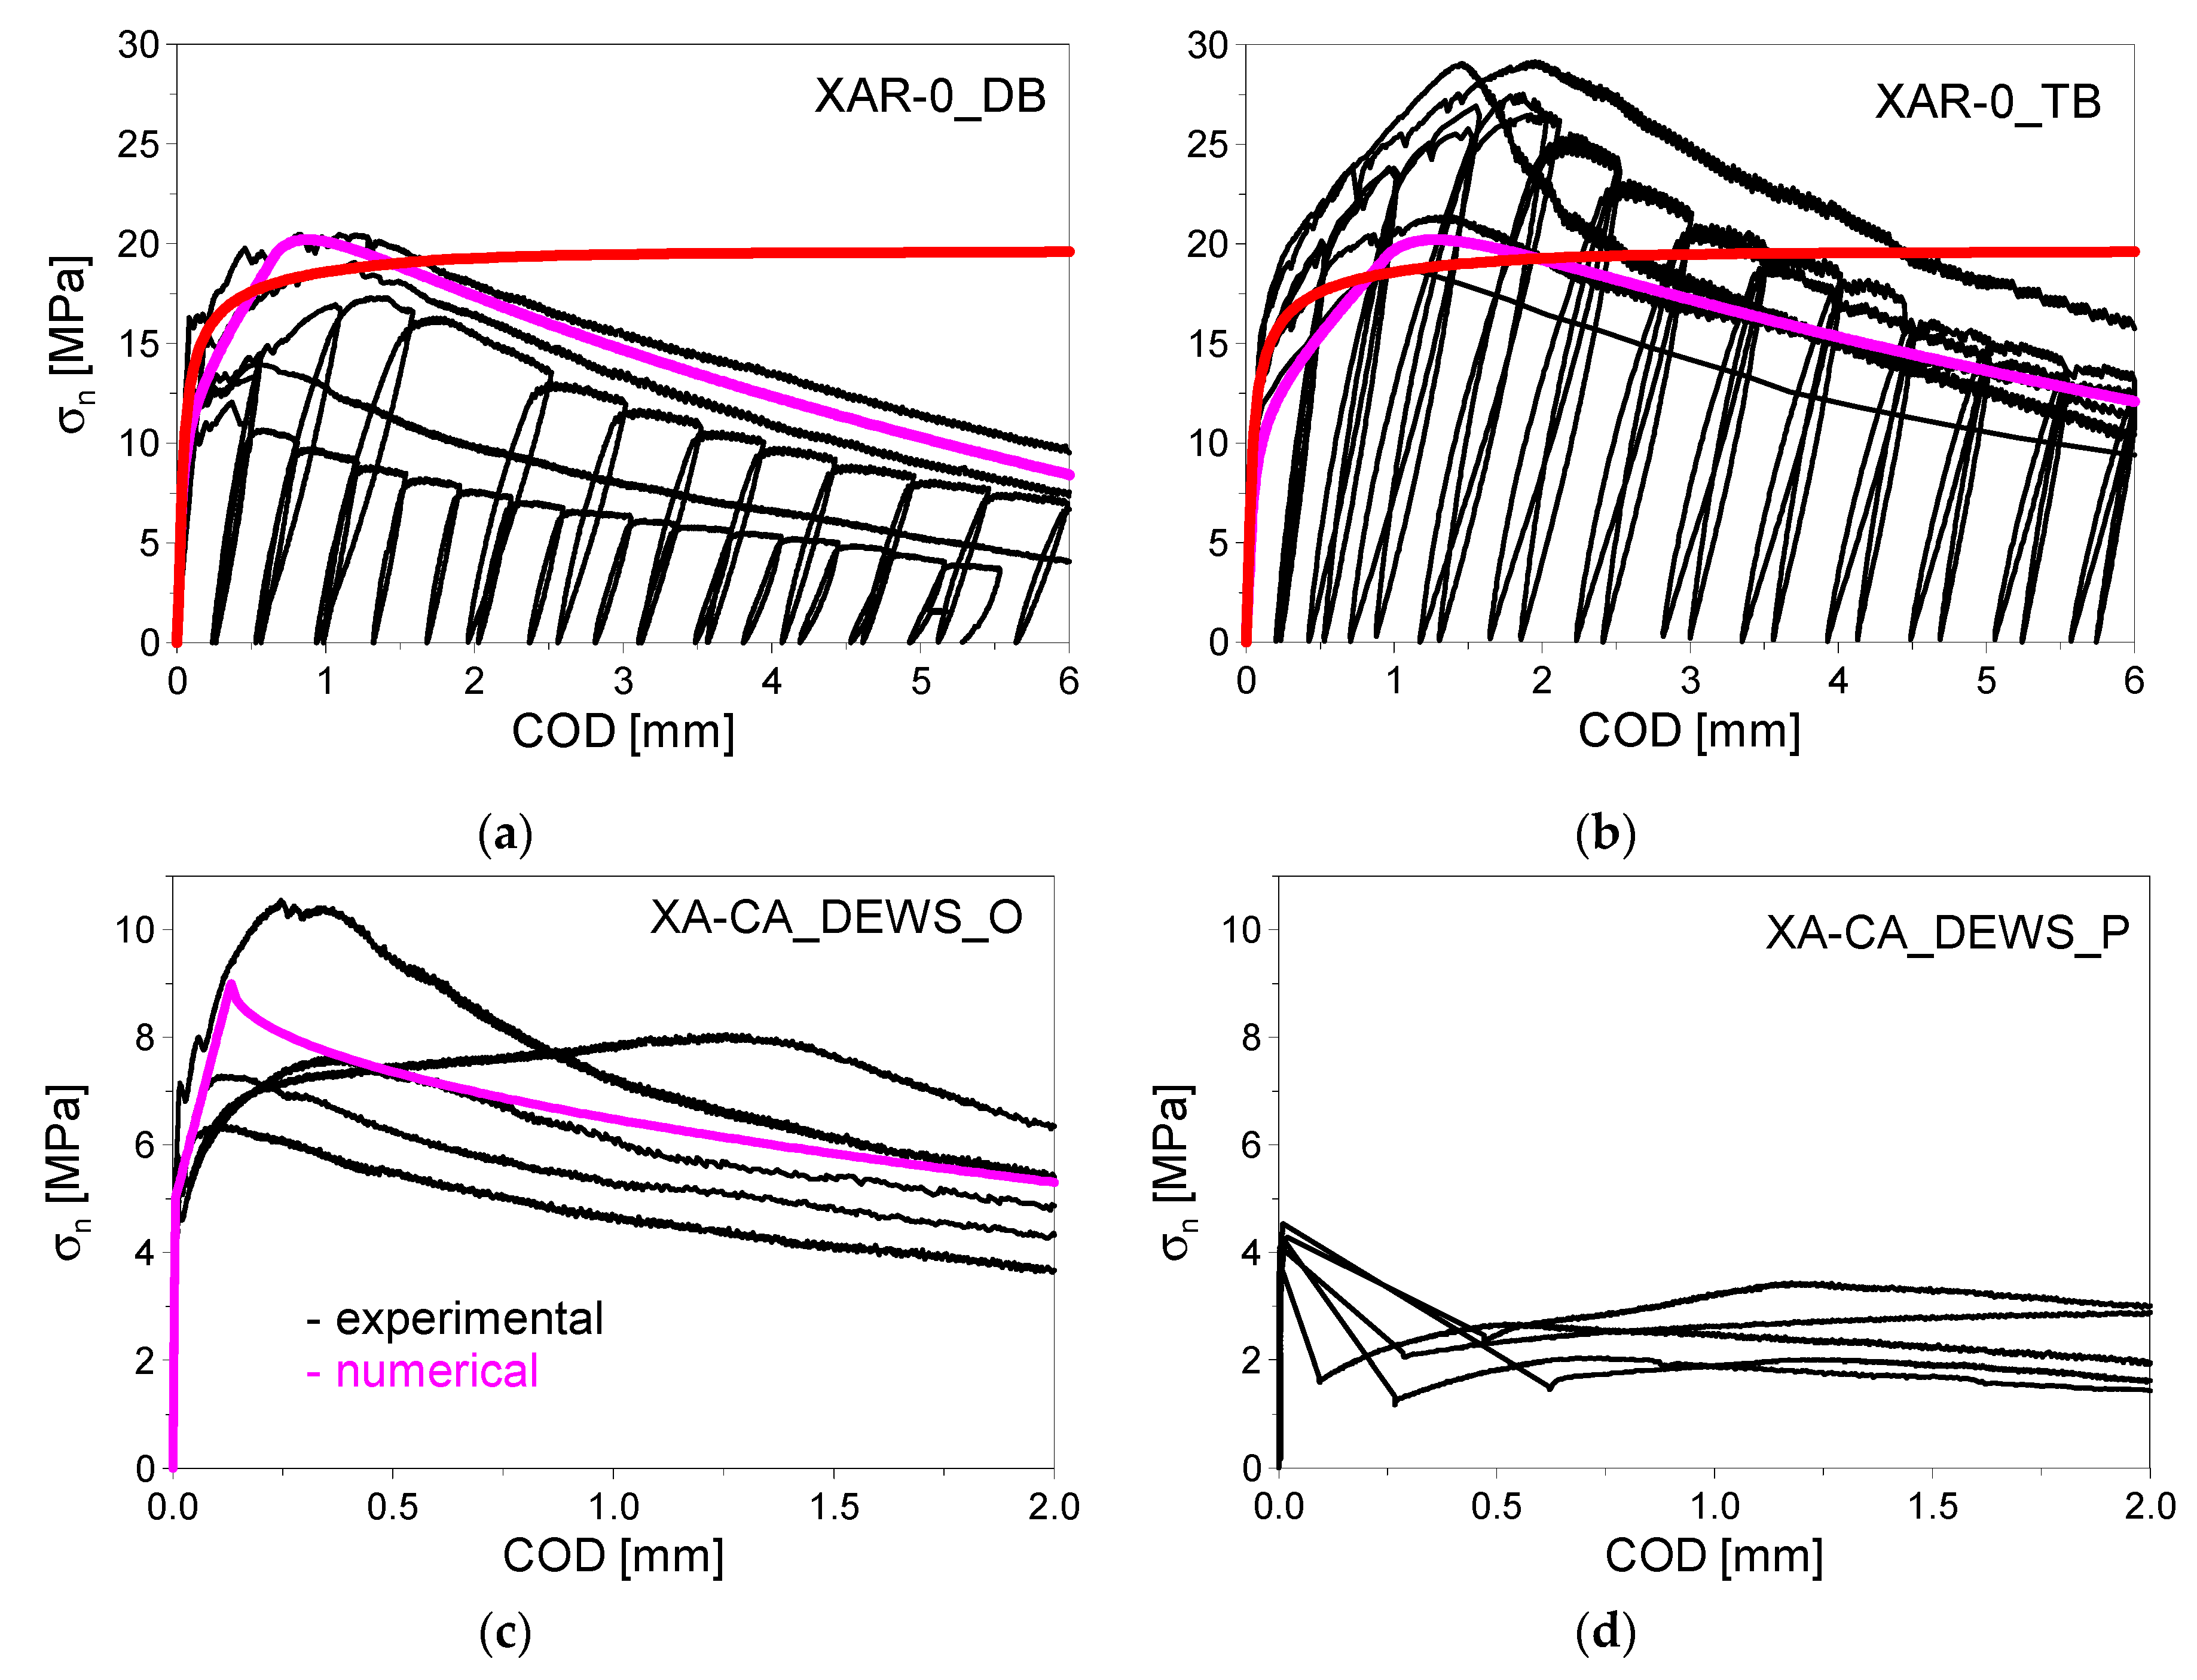
4.2. UHDC (Basins 2 and 3)

The UHDC mixes used for the other two compartments, whose detailed composition is shown in Table 5, are characterized by the presence of dispersed fiber reinforcement, to the advantage of the overall mechanical behavior and without the need of a specific traditional reinforcement.
In consideration of the peculiarities of the material, a specific experimental campaign of mechanical and durability characterization has been performed in order to investigate the post-cracking behavior, especially focusing on the multi-cracking stage [69,79]. It is worth remarking that, in Basin 3, each of the walls was made with one of the three different mixes listed in Table 5.
All the mechanical tests were performed after at least 90 days from casting, in order to limit the possible influence brought in by the delayed hydration of slag. In the curing period, all specimens were stored in controlled environmental conditions (R.H. = 90%, T = 20°C).
Four-point bending tests were carried out on two types of specimens (Figure 6a):
  • Deep Beams—DB (L × b × h = 500 × 100 × 100 mm3) (five tests per mix);
  • Thin Beams—TB (L × b × h = 500 × 100 × 25 mm3) (five tests per mix).
Indirect tensile tests were also performed according to the Double Edge Wedge Splitting concept [15], which is deemed to yield straightforward the tensile stress vs. Crack opening “constitutive” relationship of the material and is able to further discriminate the dependence of the same behavior on the flow-induced alignment of the fibers with respect to the applied tensile stress (five tests for fiber alignment either parallel or orthogonal to the applied tensile stress were performed).
In Figure 7a,b, the experimental nominal flexural stress σn (black curves) is plotted as a function of the Crack-Opening Displacement (COD) for the reference mix (labelled as XA-CA in Table 4), as measured across a 200-mm-wide central zone from four-point bending tests on deep and thin beams. The nominal stress is evaluated through the customary linear continuum mechanics relationships.
In the same plots, the response simulated employing the tensile stress–strain constitutive response calibrated on the basis of Double Edge Wedge Splitting (DEWS) tests [15] is shown. The results of DEWS tests have been also reported in Figure 7c,d for the sake of completeness [74], highlighting a moderate strain-hardening capacity in the case of favorable fiber alignment. For design purposes, in Figure 7a,b, the red curves are shown, as obtained assuming an elastic-perfectly plastic constitutive law, with direct tensile strength equal to 7 MPa, as from DEWS tests. It is worth observing that up to a COD approximately equal to 2 mm (0.01848 strain level), which is fairly beyond any serviceability limit state and appropriately corresponds to an ultimate limit state situation, the numerical results are in good agreement with the experimental ones, which supports the design reliability of the employed approach. As a consequence, the following mechanical properties were assumed (including a material partial safety factor γd = 1.25):
  • Average direct tensile strength: fctm = 7.0/1.25 = 5.6 MPa
  • Average indirect tensile strength (in bending): fcfm = 12.0/1.25 = 9.6 MPa
  • Instantaneous modulus of elasticity: Ecm = 45 GPa
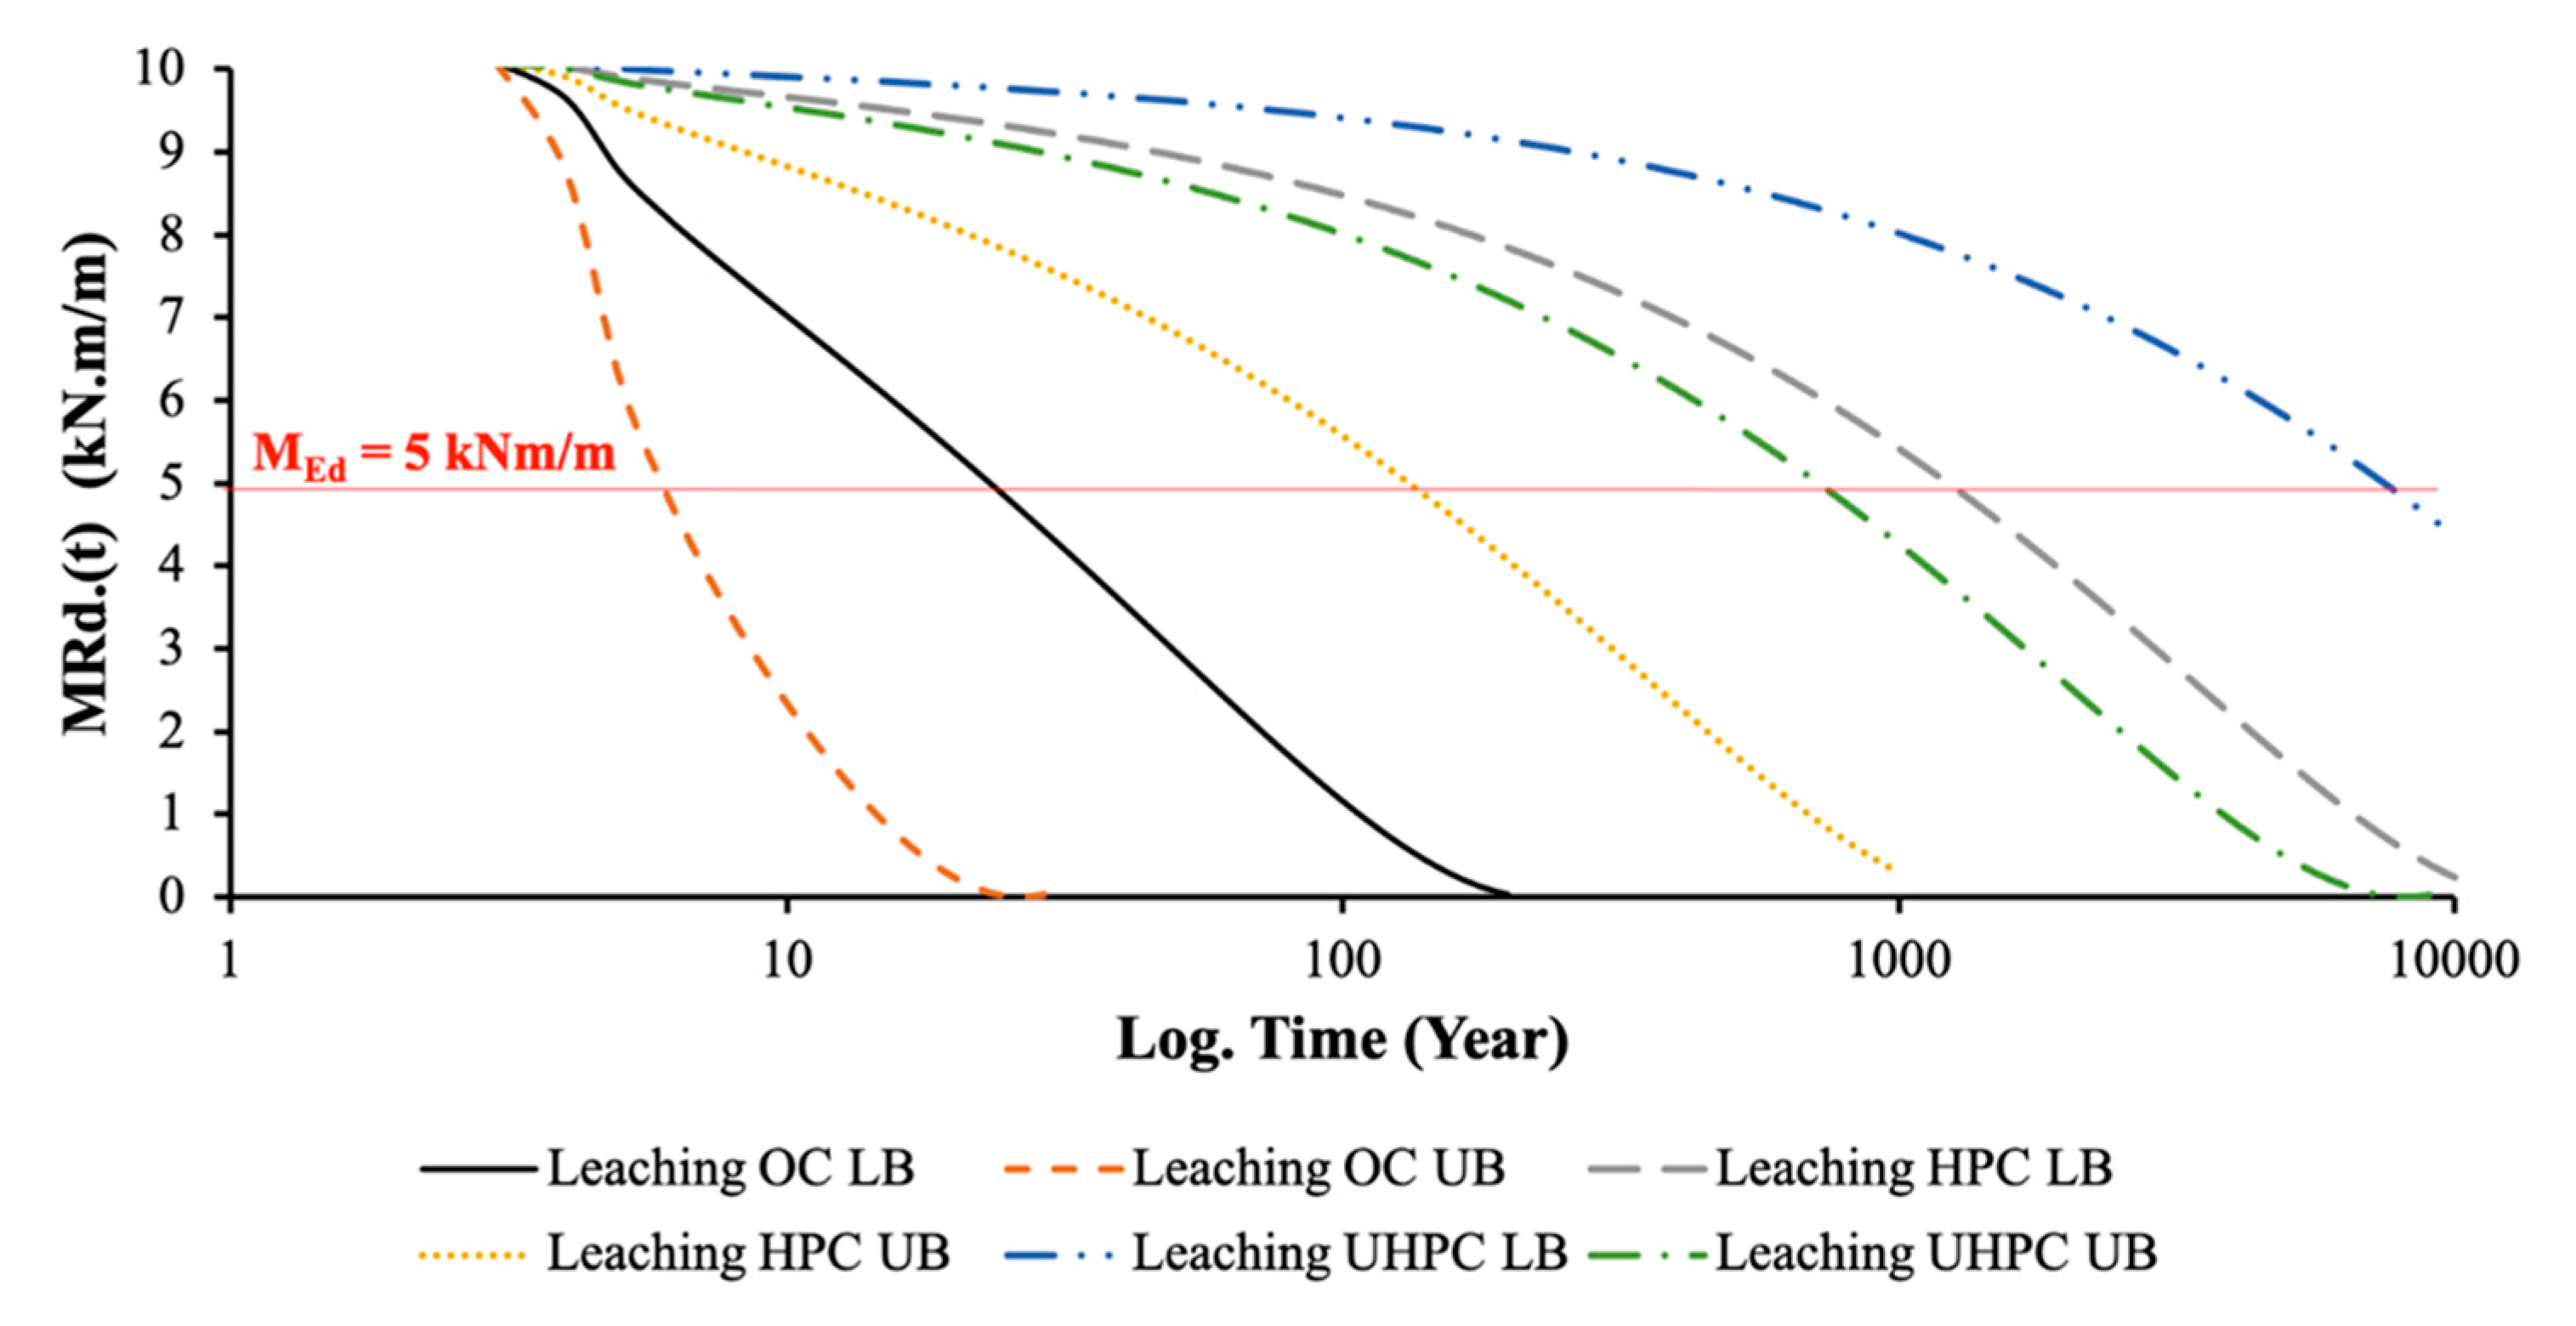
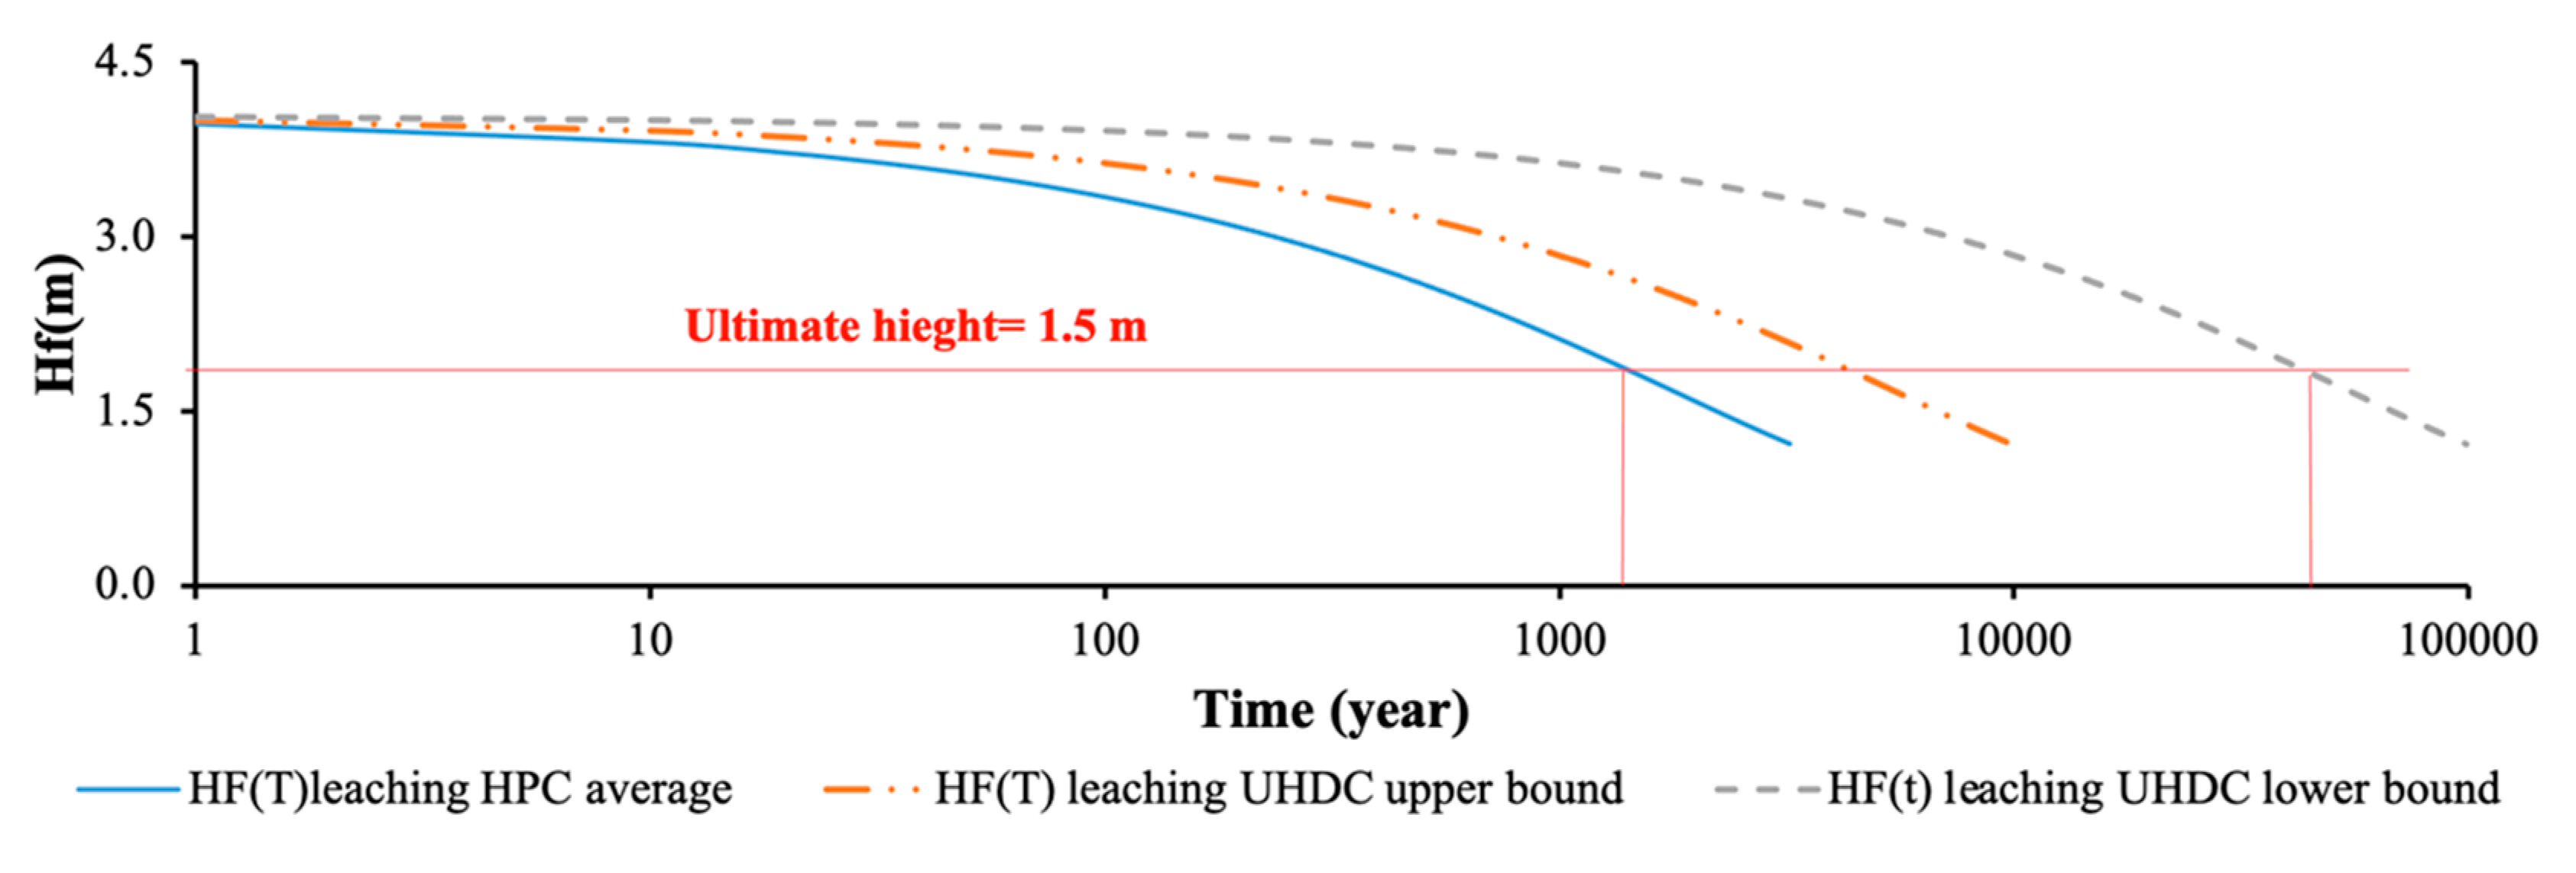
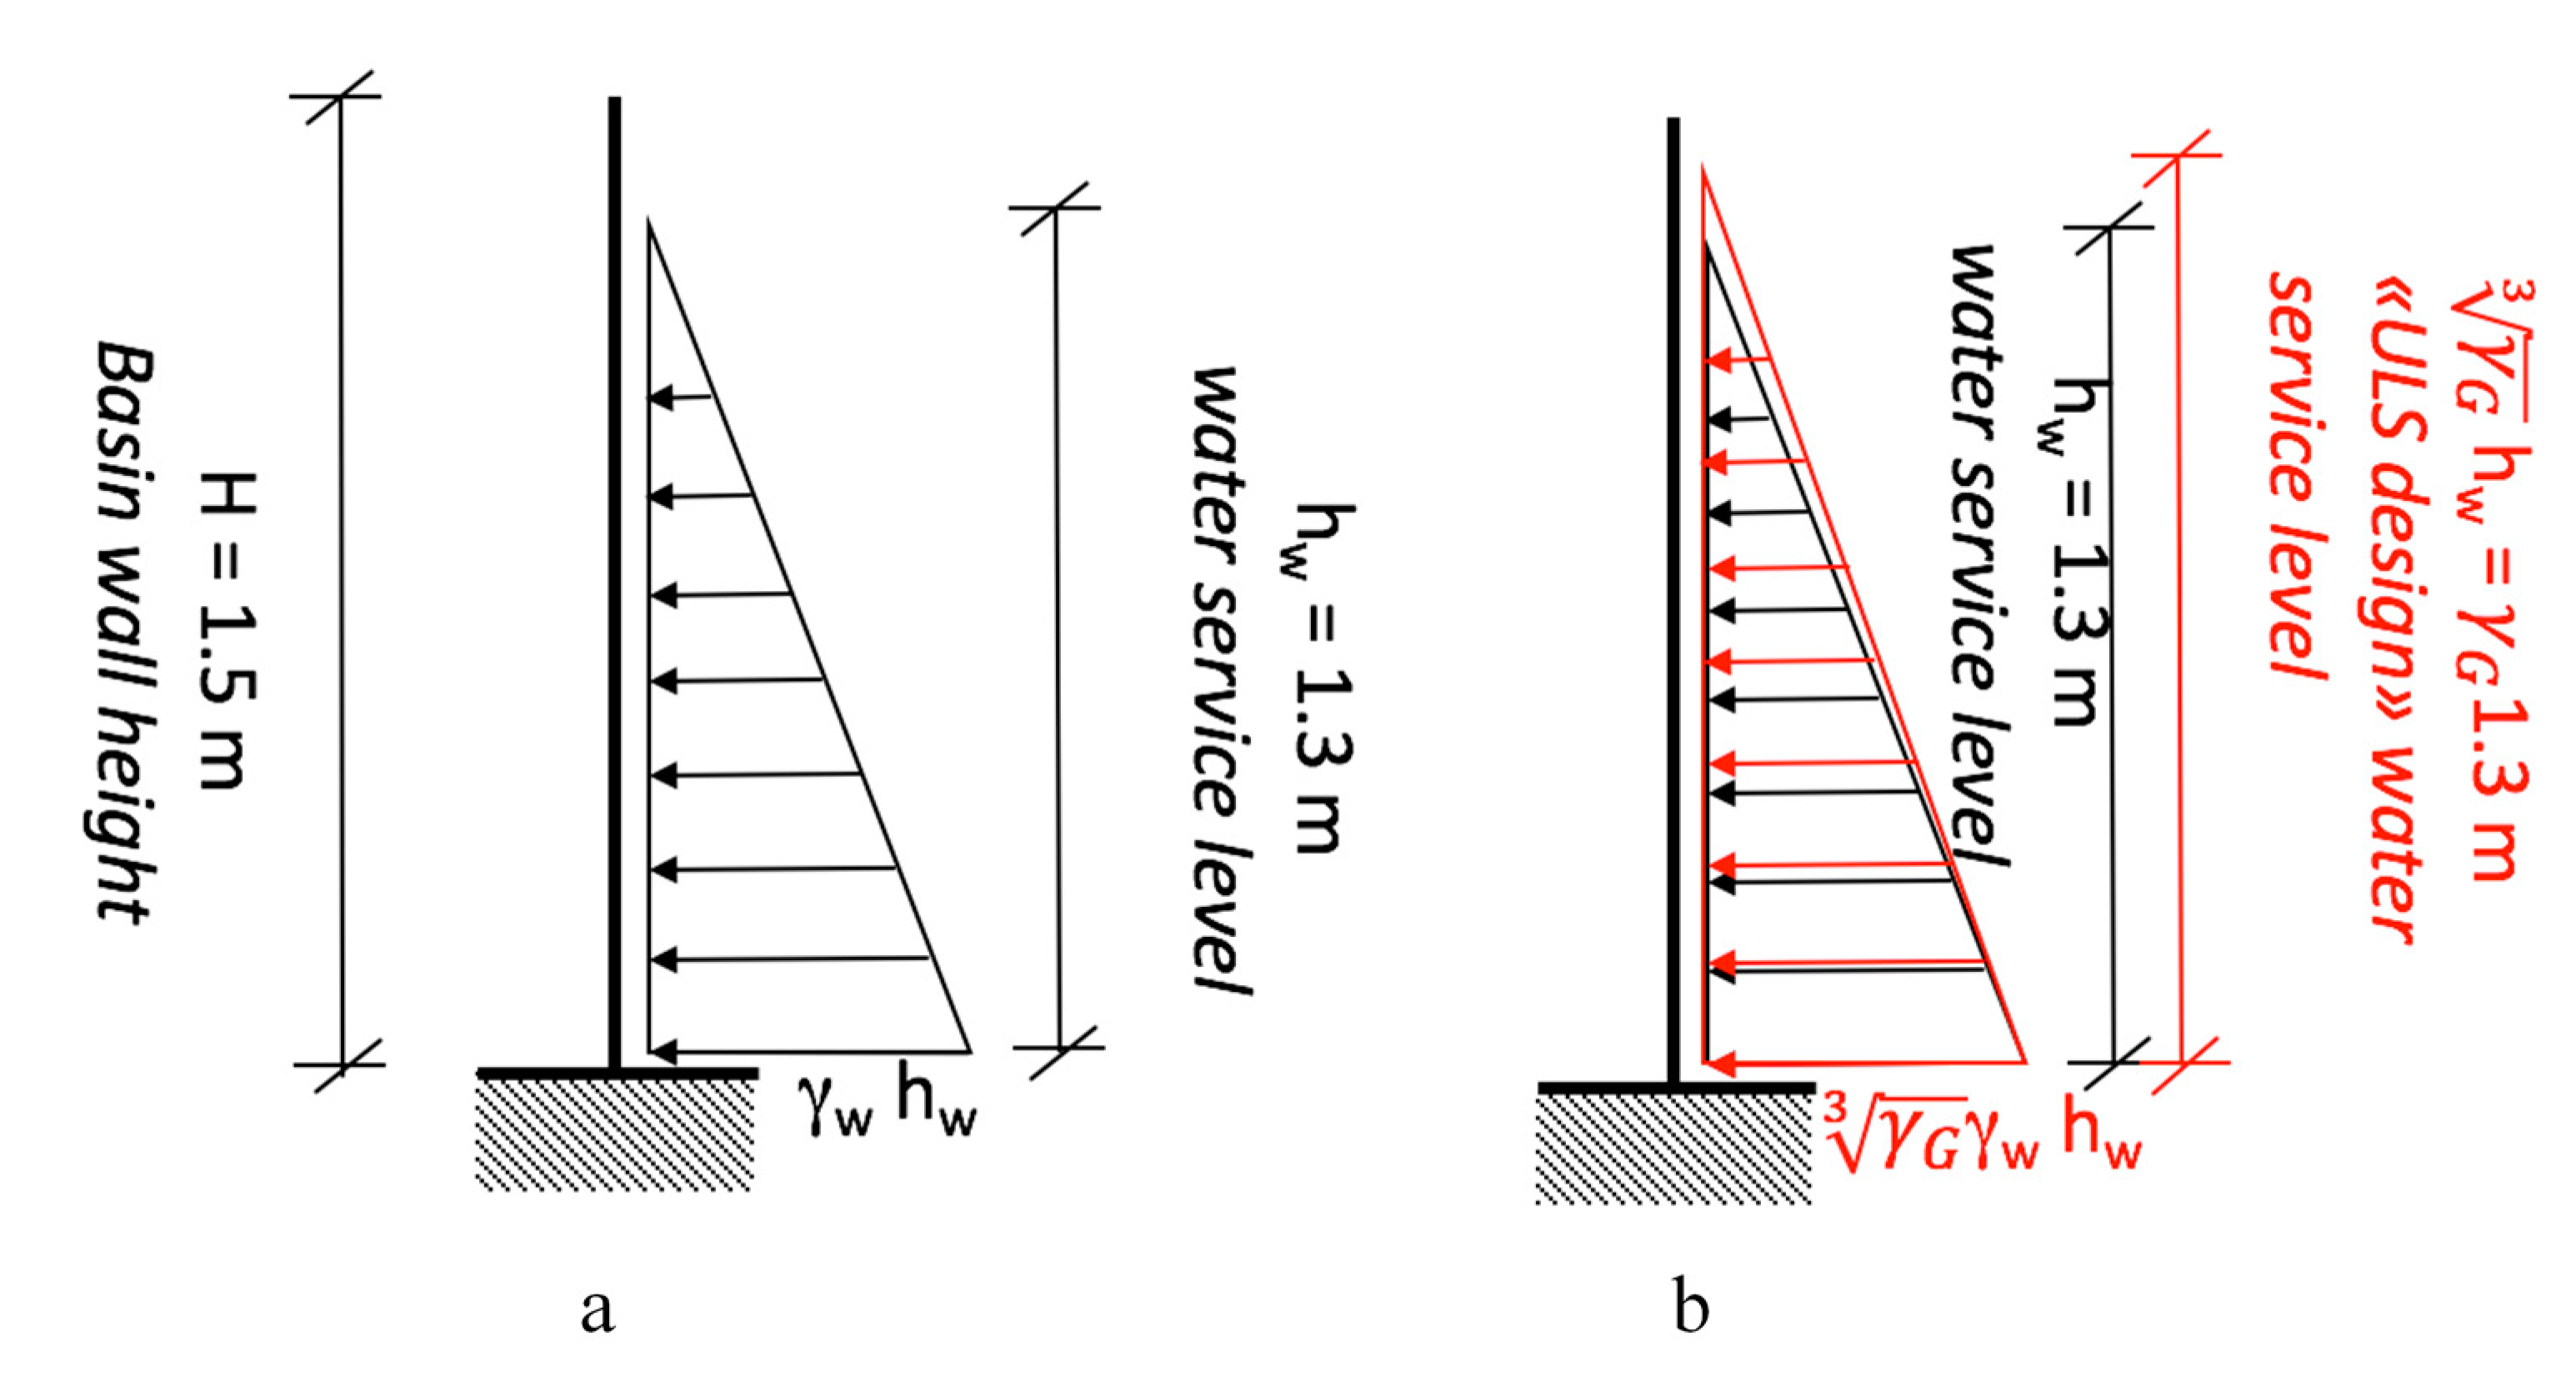
It is furthermore worth remarking that the compressive strength (cube value) for the employed set of UHDCs was always higher than 100 N/mm2 (at least six tests per mix were performed) and continued to show some increase upon longer curing, irrespective of the curing condition (both cases of moisture chamber and immersion in the same geothermal water taken from the geothermal plant were investigated) [69]. Anyway, in the design of the structural walls of the water tank, as described above, such a high value of the compressive strength is of scant interest since the design is governed by the tensile strength and strain-hardening deformation capacity of the material in the relatively thin section.

4.3. Design Actions

The loads acting on the pilot structure are the self-weight of the structural members, for which no particular finishes are foreseen, and the hydrostatic pressure due to the water inside the tank. It is worth remarking that real cooling water basins may be partially built underground, in which case also the surrounding soil pressure should be considered, with related overloads due to the use of the surrounding area. The self-weight is calculated on the basis of the specific weight of the materials, assumed in any case equal to 25 kN/m3, and the dimensions of the structural elements, as described in Section 2. The hydrostatic pressure of the water, acting on the vertical walls and on the bottom of the tank, is calculated by assuming a specific weight equal to γw = 10 kN/m3.
Two different load conditions have been considered, for the serviceability (SLS) and ultimate (ULS) conditions, respectively. In the SLS, the height of the water table, as per design provisions is assumed at 1.30 m; at the ULS, an overflow of the water is assumed, and the maximum water height (hw) compatible with the bearing capacity of the three basins is determined.
Deeper details on the design of the pilot as well as on its validation through tailored testing and monitoring protocol can be found in [80]

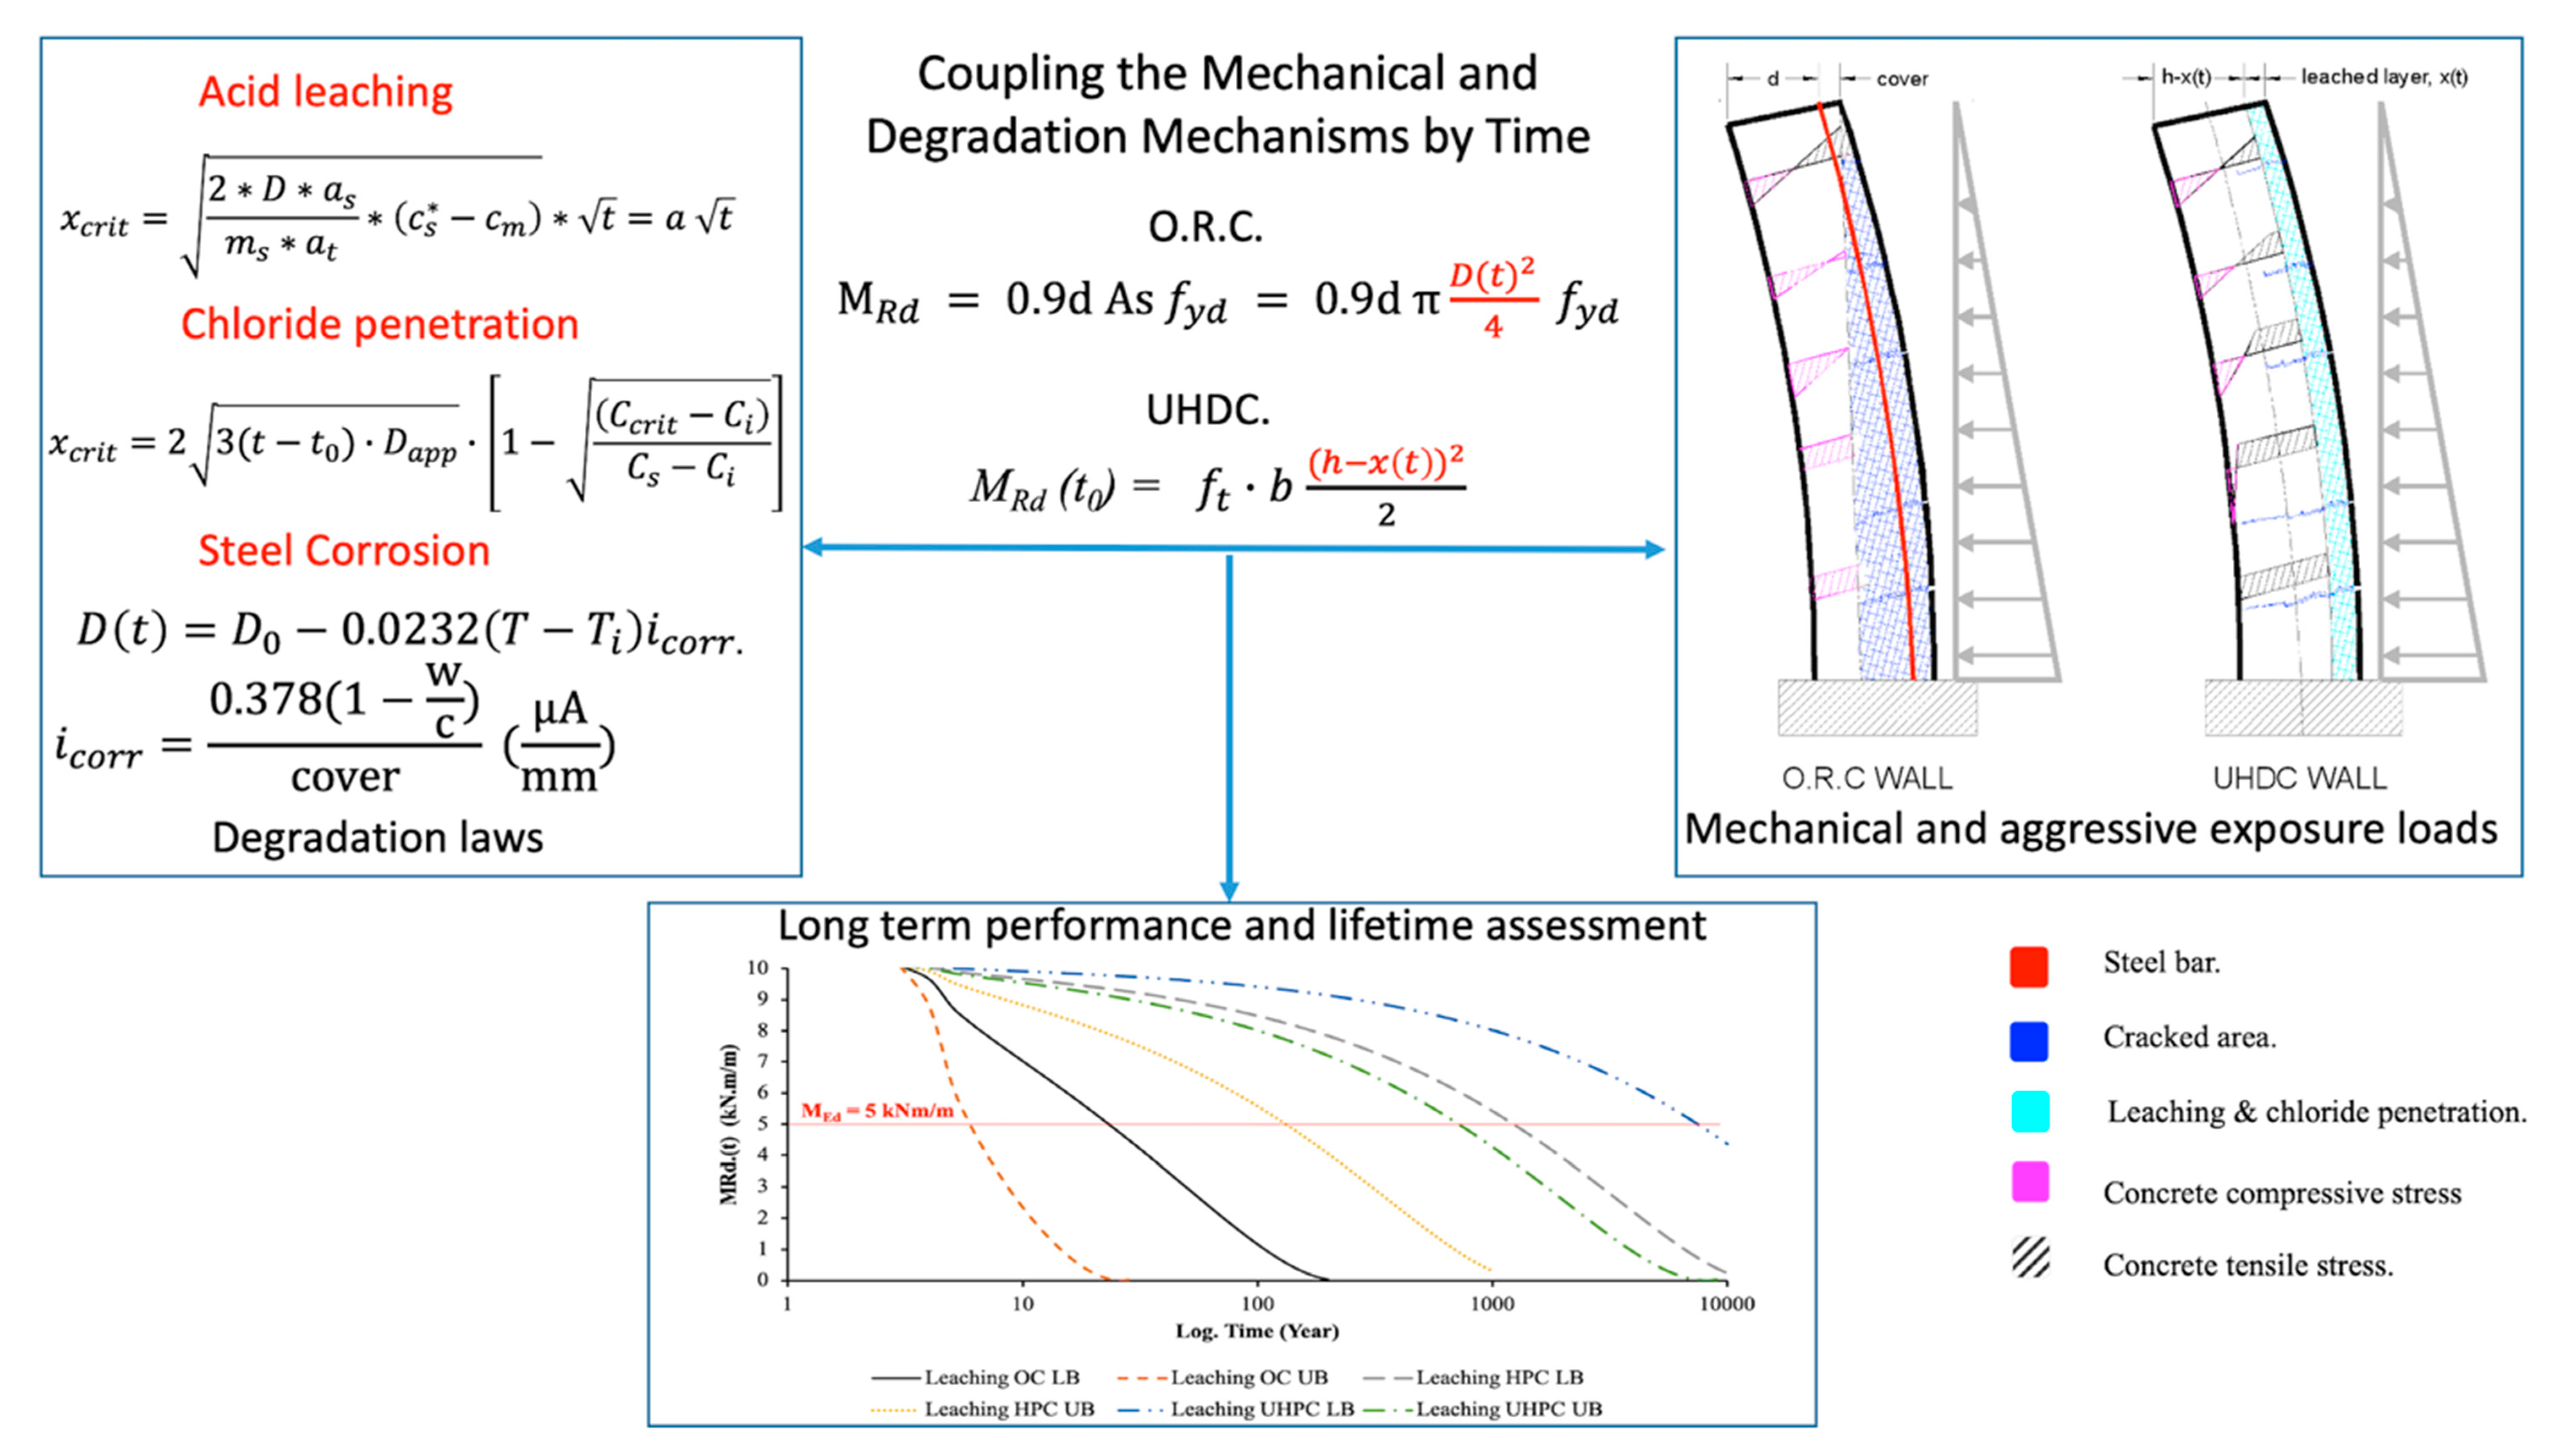
5. Durability Assessment: Degradation Mechanisms and Models and Durability Indicator Calibration

All the processes of interaction of concrete with the environment occur with the presence of moisture, as a consequence of a difference in the concentration of aggressive substances between the outdoor environment and the concrete itself. The same processes may be affected by the temperature as well [3,5,81,82,83]. The interaction of the environment with the concrete generally takes place through the penetration of the aggressive substances in the concrete pore structure and chemical interaction with pore solution and hydrated cement phases, which induces changes and evolution in the physic-chemical properties of the concrete. In order to assess the resistance of the material to the aforementioned phenomena two types of durability indicators may be selected, indirect and direct indicators, respectively. While the formers, which include, e.g., accessible porosity, permeability to gas or liquids, capillary suction, can inform on the potential durability of a specific type of concrete, the others are related to specific degradation processes, including degradation of the matrix, reinforcement corrosion and fiber-matrix interface degradation, in case.
These degradation mechanisms are the result of, and are “categorized as” by design codes, carbonation-induced corrosion, chloride-induced corrosion, acid and sulphate attack and freeze–thaw attack. Some of these degradation mechanisms, such as chloride-induced corrosion, can be described and predicted by models with a relatively broad international acceptance, whereas the models related to the acid and sulphate attack degradation mechanism are still under discussion and need further research validation with reference to the real cases. Since the structure under the study is used to collect geothermal water, which contains a significant amount of chloride and sulphates, the corresponding degradation mechanisms, which are chloride-induced corrosion and concrete leaching, are going to be considered in this study for the formulation of the proposed Durability Assessment Based Design methodology and its validation with reference to the selected pilot case study.

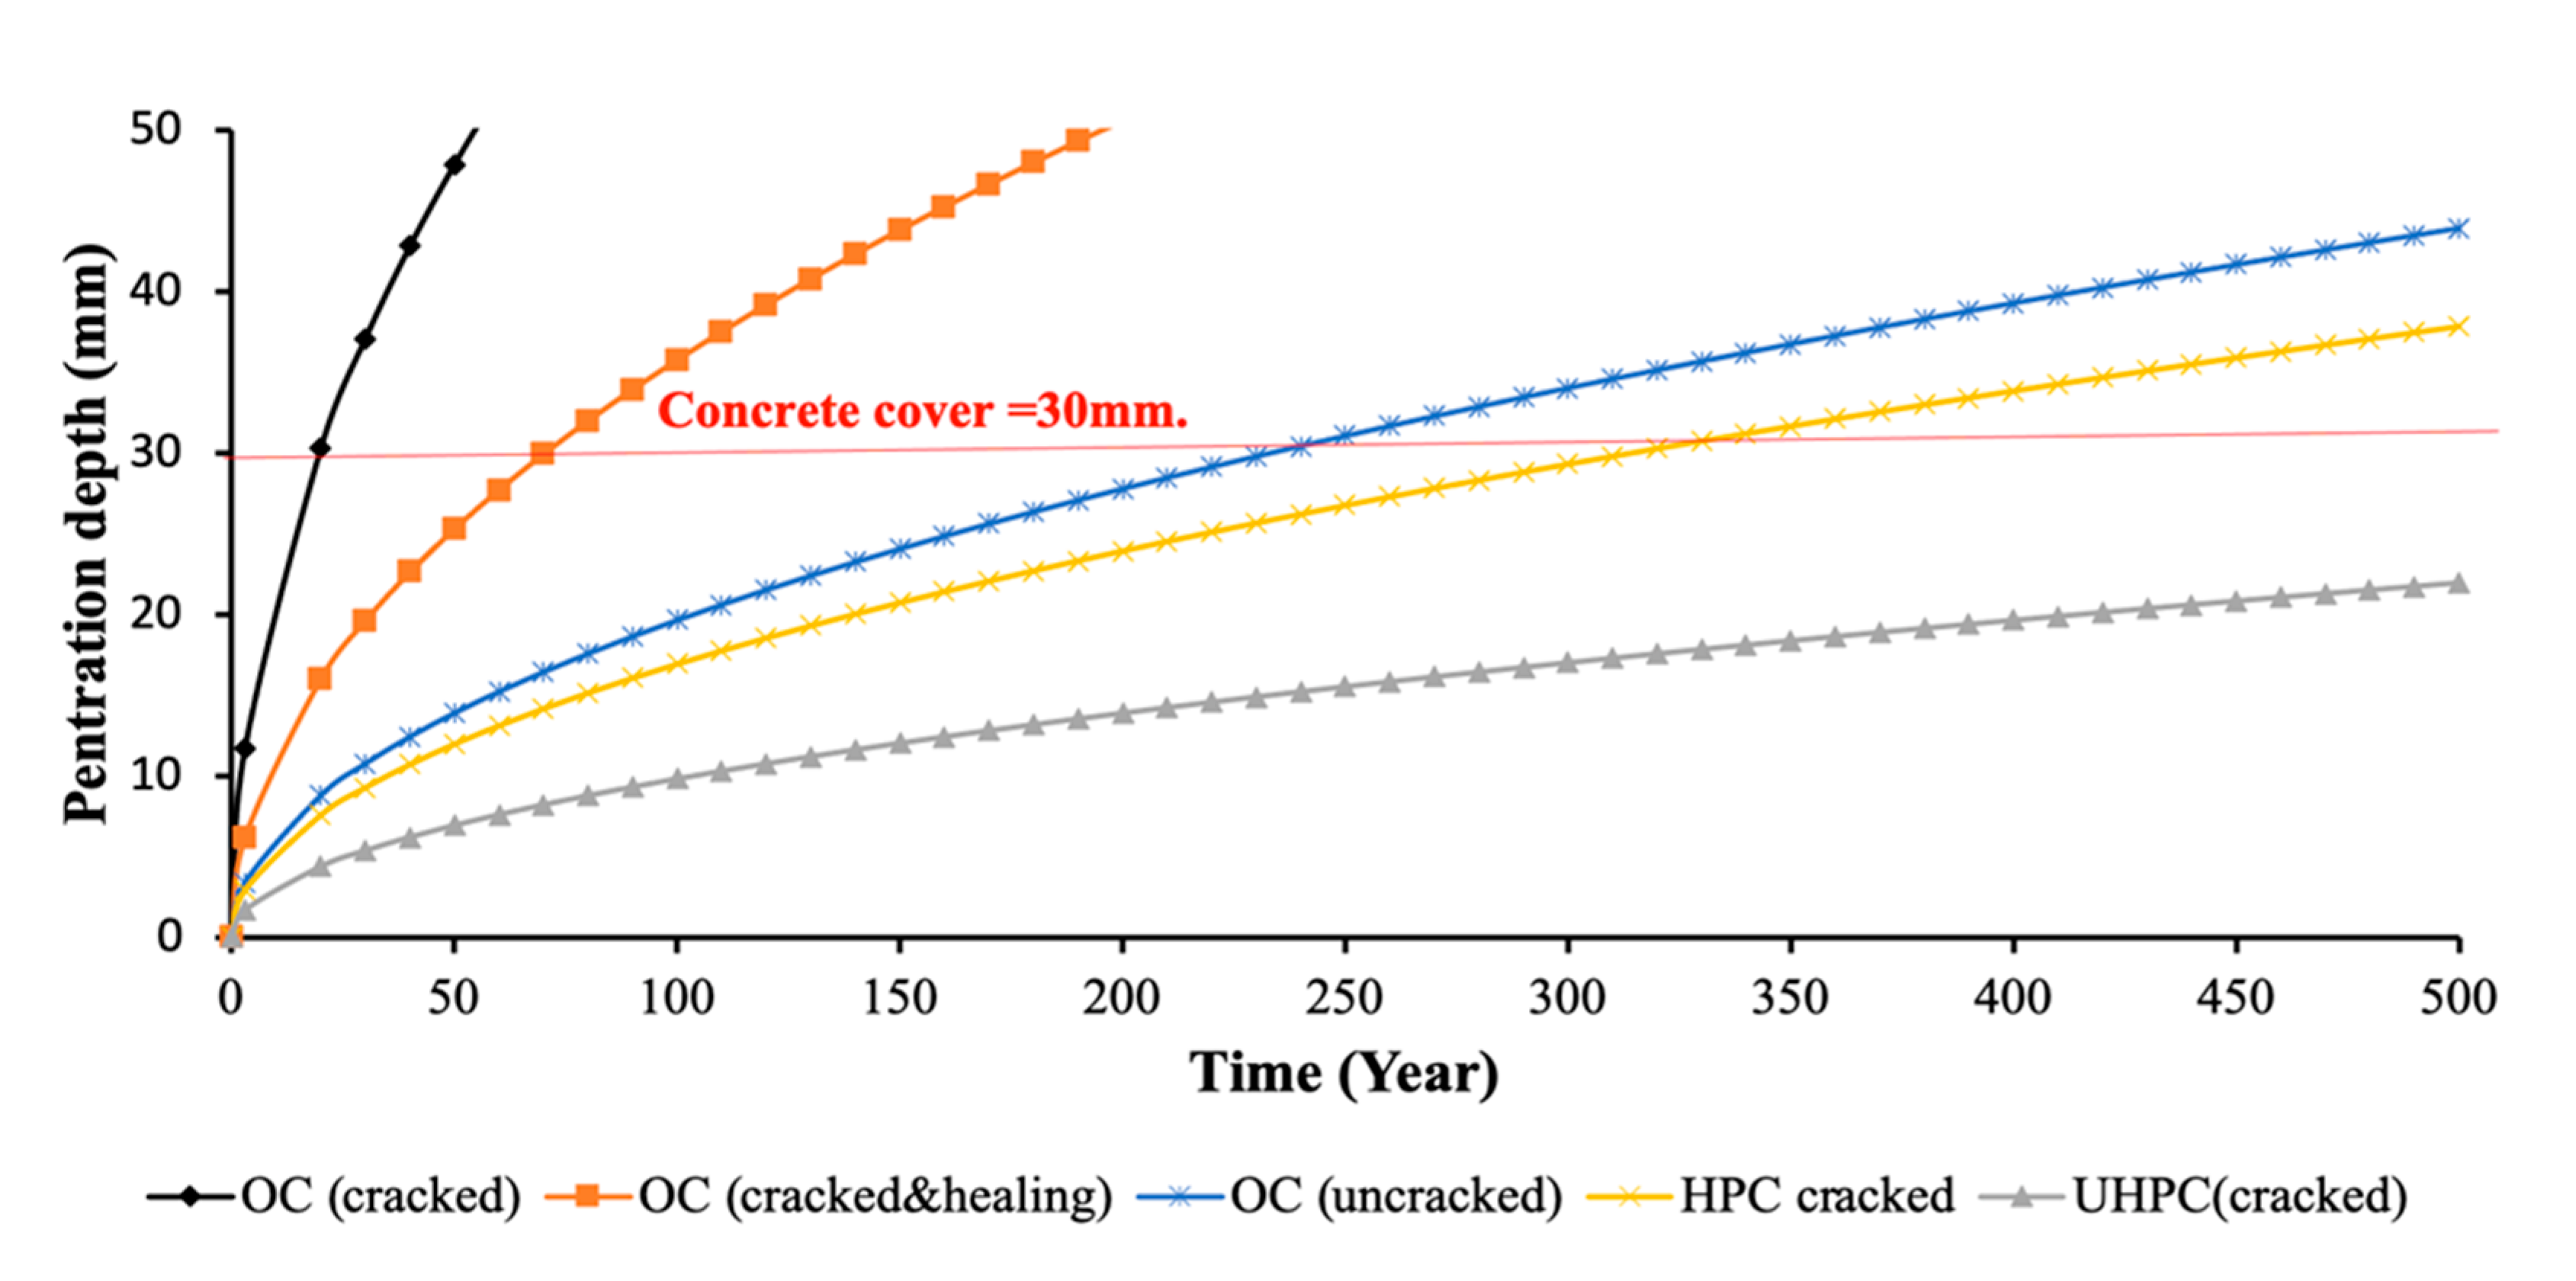
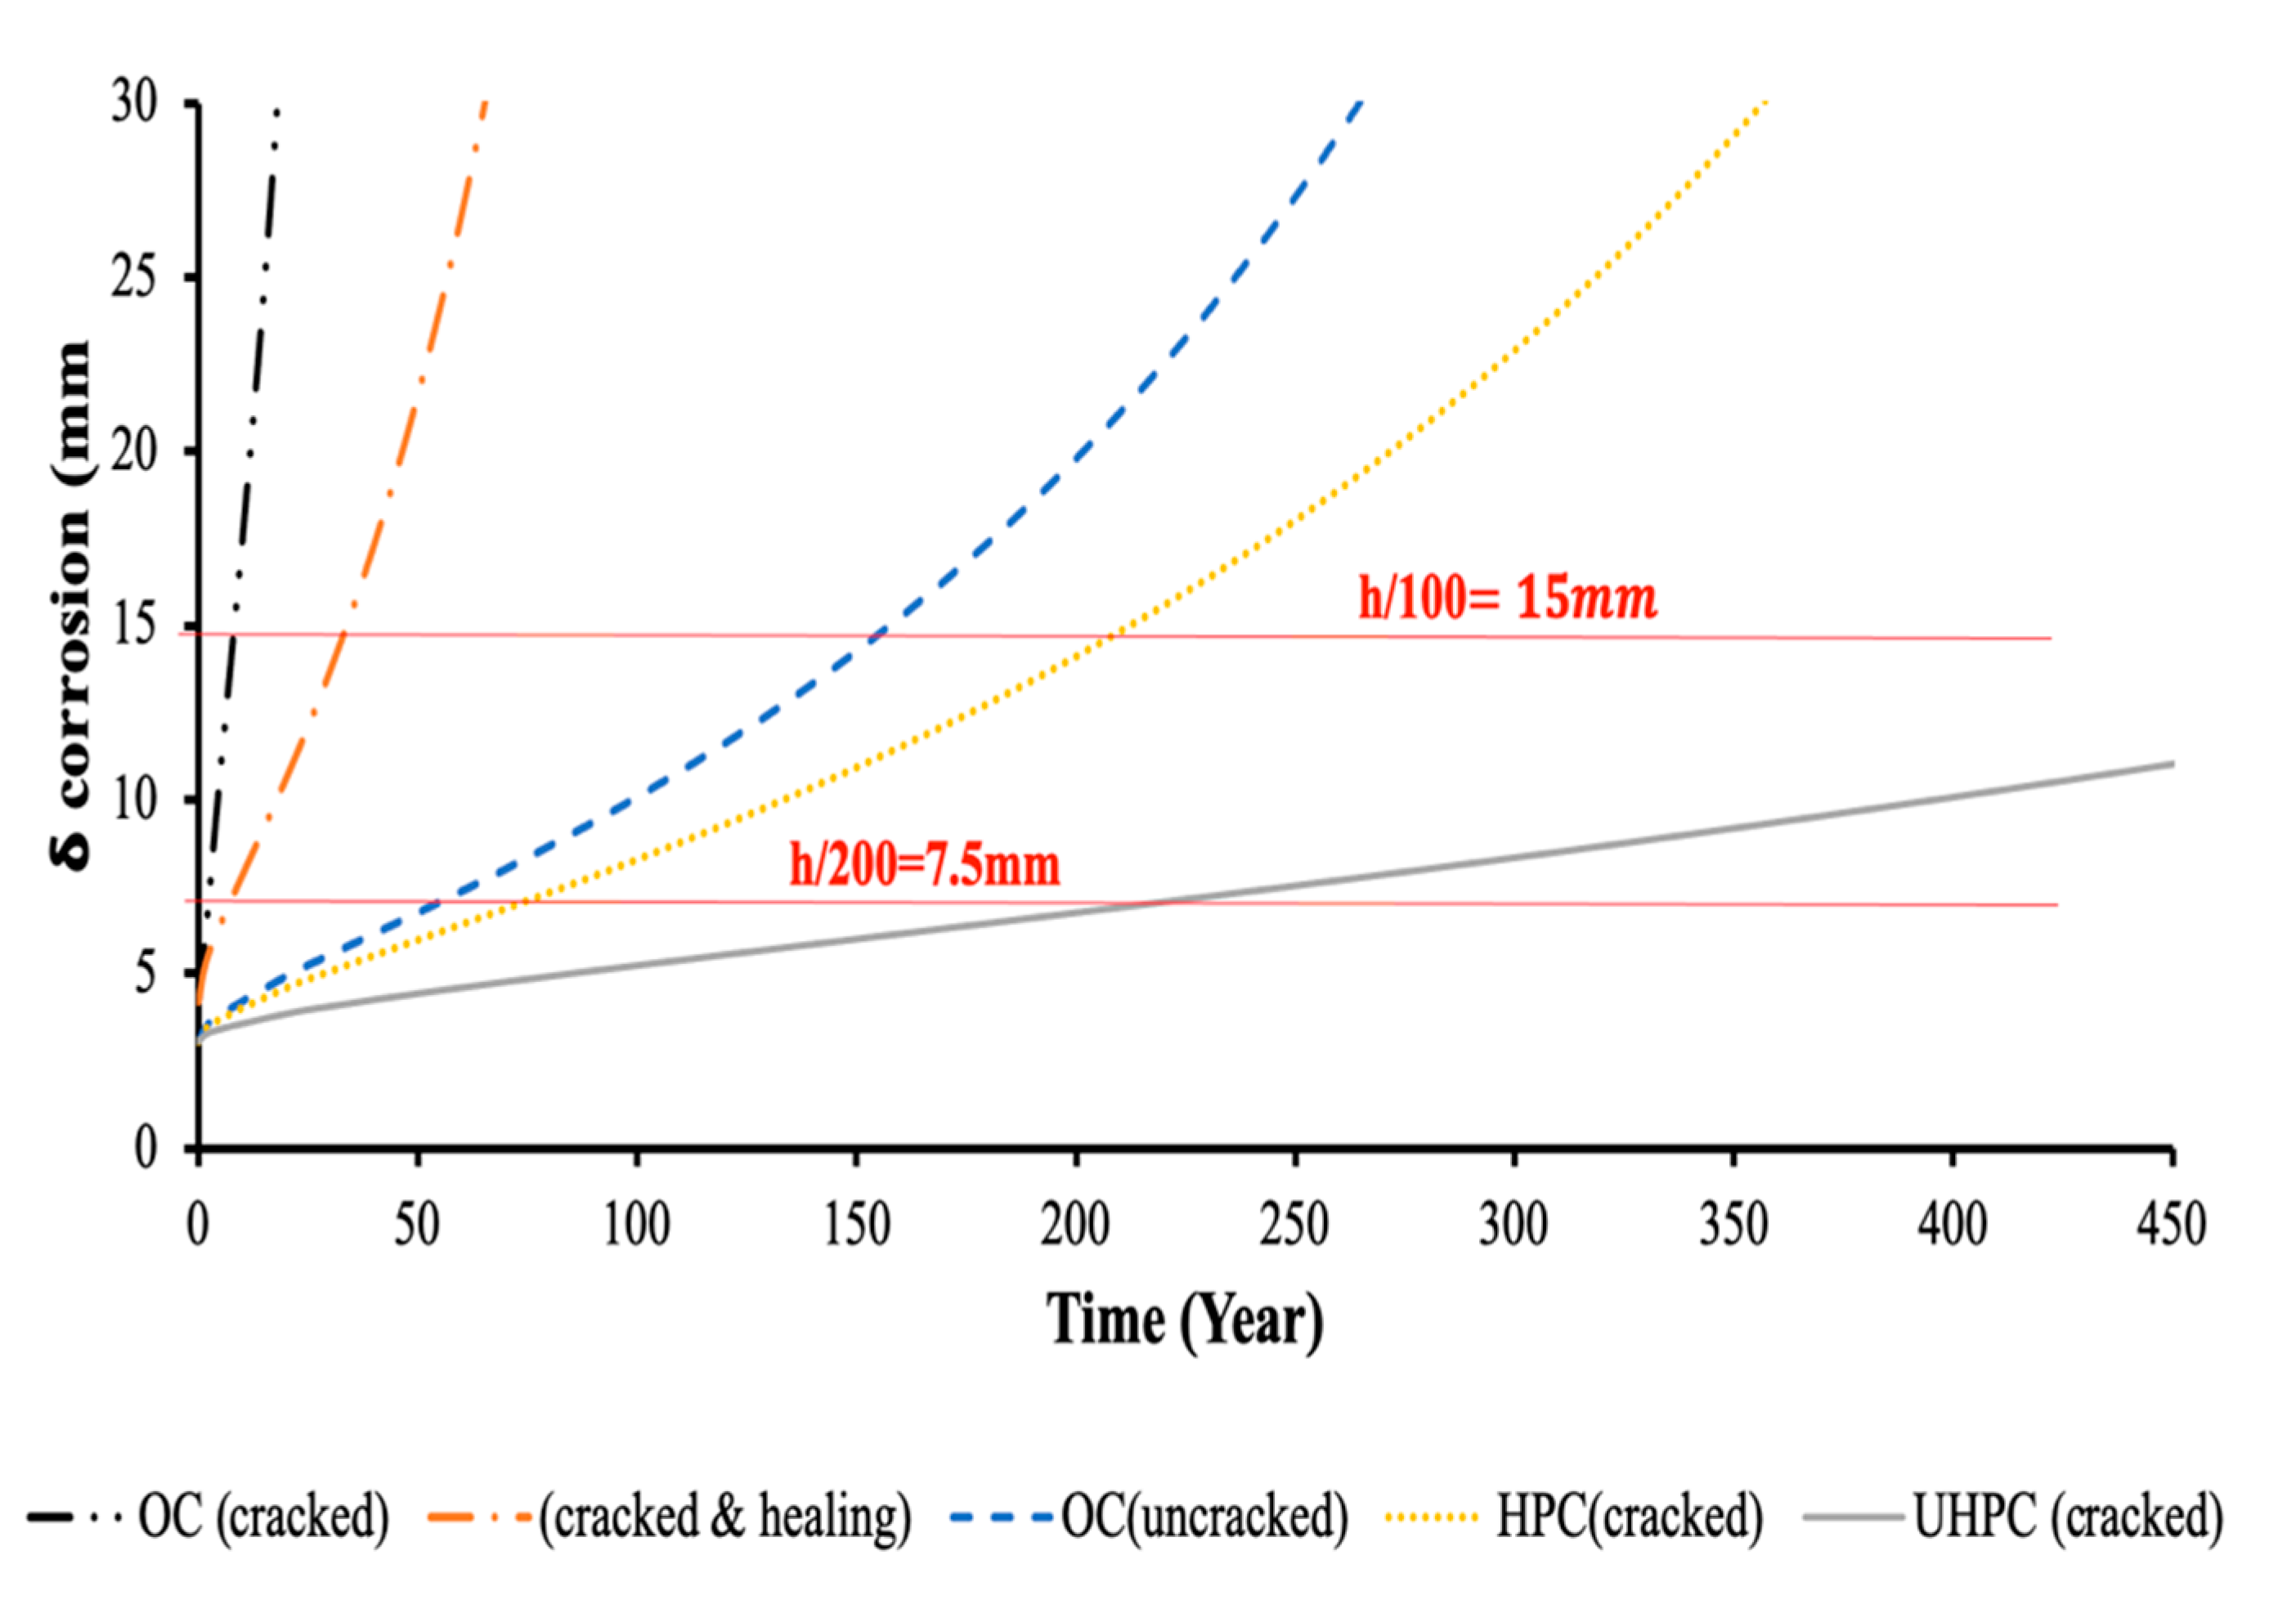
5.1. Chloride Diffusion and Chloride Induced Corrosion

The chloride penetration in concrete, which is the driver of chloride-induced corrosion, is generally governed by 2nd Fick law; Equations (1) and (2) illustrate the solutions of the 2nd Fick law in terms of chloride concentration and critical depth, respectively.
C ( x , t ) = C s ( C s C i ) [ e r f x 2 D a p p ( t ) t ]
x c r i t = 2 3 ( t t 0 ) · D a p p · [ 1 ( C c r i t C i ) C s C i ]
where Dapp: Apparent chloride diffusion coefficient (m2/s).
  • C(x,t): chloride concentration at depth x and time t (%wt binder).
  • xcrit: critical chloride depth.
  • Ci: initial chloride content of concrete (%wt binder).
  • Cs: chloride concentration at surface (x = 0).
  • Ccrit: critical chloride concentration.
As per EN 206, the initial chloride content (Ci) is limited to a quite small percentage of the mass of cement, as a function of the cement type and of the structural application. Reference has been made to these prescriptions for the value calibration as detailed in Table 6.
The chloride concentration on the surface of the structure (Cs) can be considered dependent on the exposure scenario. Table 7 below, adapted from ReSHEALience D3.2 [84], shows that the concentration of chlorides, in g/L and as experienced in different seas, is varying dramatically from 3 g/L in the Baltic Sea to more than 250 g/L in the Dead Sea. This variation will affect the service life of the concrete structures as far as the resulting degradation rates are concerned.
The critical chloride content Ccrit on its hand, can be very difficult to quantify since the mechanism between the steel and concrete interface is quite complicated. There are several papers [85,86,87] that have analyzed the variability of the Cl threshold. Total chloride contents [87] that can cause corrosion initiation have been found to vary from 0.3 to 3.5% total Cl with an average value in the order of 1.2%, even twice than that accepted in some standards. The lower values, however, are generally related to the presence of cracks. For cracks >0.4 mm it has been found the chloride threshold is reduced close to 0.2%. The large variability in chloride threshold has been attributed to the large number of characteristics that are occurring at the level of the reinforcement-concrete interface [88] as well as to differences between accelerated tests and tetss based on natural transport of chlorides, which by the way take very long time. Differences between laboratory test and field data also hold. This is reflected not only in the large variability of critical chloride content reported by different codes, standards and papers (Table 8) but also by the fact that in several surveyed case-studies [84] the measured values of chloride contents which corresponded to existence of corrosion are anyway quite higher than the recommended ones. This may corroborate the fact that current durability prescription, mainly based on the almost exclusive role of the compressive strength class and water/binder ratio, may be quite poor, together with the fact that the addition of supplementary cementitious materials, which is quite common nowadays in several concrete mixtures, may also play a role in this respect.
Regarding the apparent chloride diffusion coefficient (Dapp), in ordinary concrete, it depends on several mix-composition variables, including water/cement(binder) ratio, cement content and use, type and quantity of supplementary cementitious materials, the latter being beneficial both in terms of pore refinement and chloride binding capacity [89]. The presence of cracks also, as expected, affects the chloride diffusion coefficient. For example, Djerbi et al. [90] found that the diffusion coefficient in cracked concrete (Dcr) increases with a linear increase in the crack width for cracks narrower than 80 µm, and Dcr was constant for cracks wider than 80 µm, independent of material effects, without differences between OC and HPC. Win et al. [91] found a linear relationship between w/b ratio and Cl concentration for certain value of the crack width. Konin et al. [92] found that the composition of the concrete specimen with cracks was critical for the Cl ingress. The effects of crack width/cover depth ratio were addressed by Gowripalan et al. [93], a crack width-to-cover depth ratio of 0.01 produced an increase in the Dapp in the tension zone of about two times. Besides the influence of cracking state and mix-composition variables, in real structures the evolution of the coefficient with the time has to be taken into account, which generally implies a reduction in the apparent diffusion. For example, Thomas et al. [94] investigated a different type of HPC and UHPC specimens subjected to marine exposure for 15 years, finding that mechanical properties of the specimens were improved along time and the steel embedded inside them was intact.
As far as the influence of crack-sealing on the “recovery” of the chloride diffusion resistance, and hence on the value of the apparent chloride diffusion coefficient, results in the literature are, for example, with reference to ordinary concrete with slag as supplementary cementitious material, Savija et al. [106] reported that cracks narrow than 60 µm were healed and the penetration of Cl in healed cracks was comparable to that of uncracked concrete. Borg et al. [107] reported that the self-healing of fiber-reinforced concrete contain different types of self-healing facilitators such as silica fume, pulverized fuel ash and crystalline admixtures showed better performance in the chloride-rich environment than the distilled water immersion environment due to the synergic effect between the sealing reaction and chloride binding. Cuenca et al. [77] investigated the crack sealing and healing for double edge wedge specimens under repeated cracked and healing cycles, they concluded that the complete crack sealing was more evident for specimens contain crystalline admixture partially or continuously immersed in water and for crack width below 0.3 mm, the crack sealing of specimens having the crystalline admixture is more relevant for crack below 0.15 mm under repeated cracked and healing cycles and up to one year.
Based on these results, Figure 8 has been constructed and the penetration depth of 30 mm was specified as a target for each type of concrete hypothesized. It can be observed that, for HPC, it takes about 22 times longer than for ordinary concrete for the chloride content to reach the critical threshold value at a penetration depth equal to 30 mm and a very long time in the case of UHPC, assumed as a representative cover thickness. Though these results are based on specific assumptions as above, they can be used in this study to set-up a demonstrative application of the durability assessment-based design framework.
In ordinary reinforced concrete, once the chloride has penetrated the concrete cover and reached the critical threshold value at that depth, the steel corrosion starts. A simple model from the literature [108,109,110] to estimate the uniform degradation of the steel reinforcement is shown in Equations (3) and (4) below.
ϕ ( t ) = ϕ 0 0.0232 ( T T i ) i c o r r .
i c o r r = 0.378 ( 1 w c ) cover   ( μ A mm )
where: ϕ(t) is the bar diameter at any time (mm) and ϕ0 is initial bar diameter (mm).
  • T: degradation time (year);
  • Ti: time of corrosion initiation (year);
  • icorr; corrosion current density (mm/(mA/m2).
Regarding the chloride-induced corrosion for UHPFRC, there is general agreement among the academic researchers on the durability of un-cracked and cracked, with crack width less than 0.2 mm, where negligible loss of the residual tensile strength and compressive strength have been observed for (6 months–3 years) with wet/dry cycles and (3–5)% NaCl and the steel fiber corrosion is expected to occur at 1–5 mm from the surface without inducing any spalling or damage due to the expansive products of the corrosion. For cracks wider than 0.2 mm, severe fiber corrosion and strong loss of residual tensile strength which potentially lead to further deterioration for longer exposure and the sacrificial loss layer is expected to be (10–25) mm upon (5–20 years) of chloride exposure [111]. However, the increase in the fiber roughness due to the chloride-induced corrosion and the expansive corrosion products along with the autogenous healing, may work in favor of increasing the fiber-matrix bond and residual tensile strength as reported by Marcos-Meson et al. [112]. The precipitations of the calcium carbonates and the corrosive products and the salt crystals may eventually seal the larger cracks, especially in the presence of the steel fibers which work as preferential surfaces for the deposit of these materials, and prevent oxygen and the chloride from penetrating through the material [113].

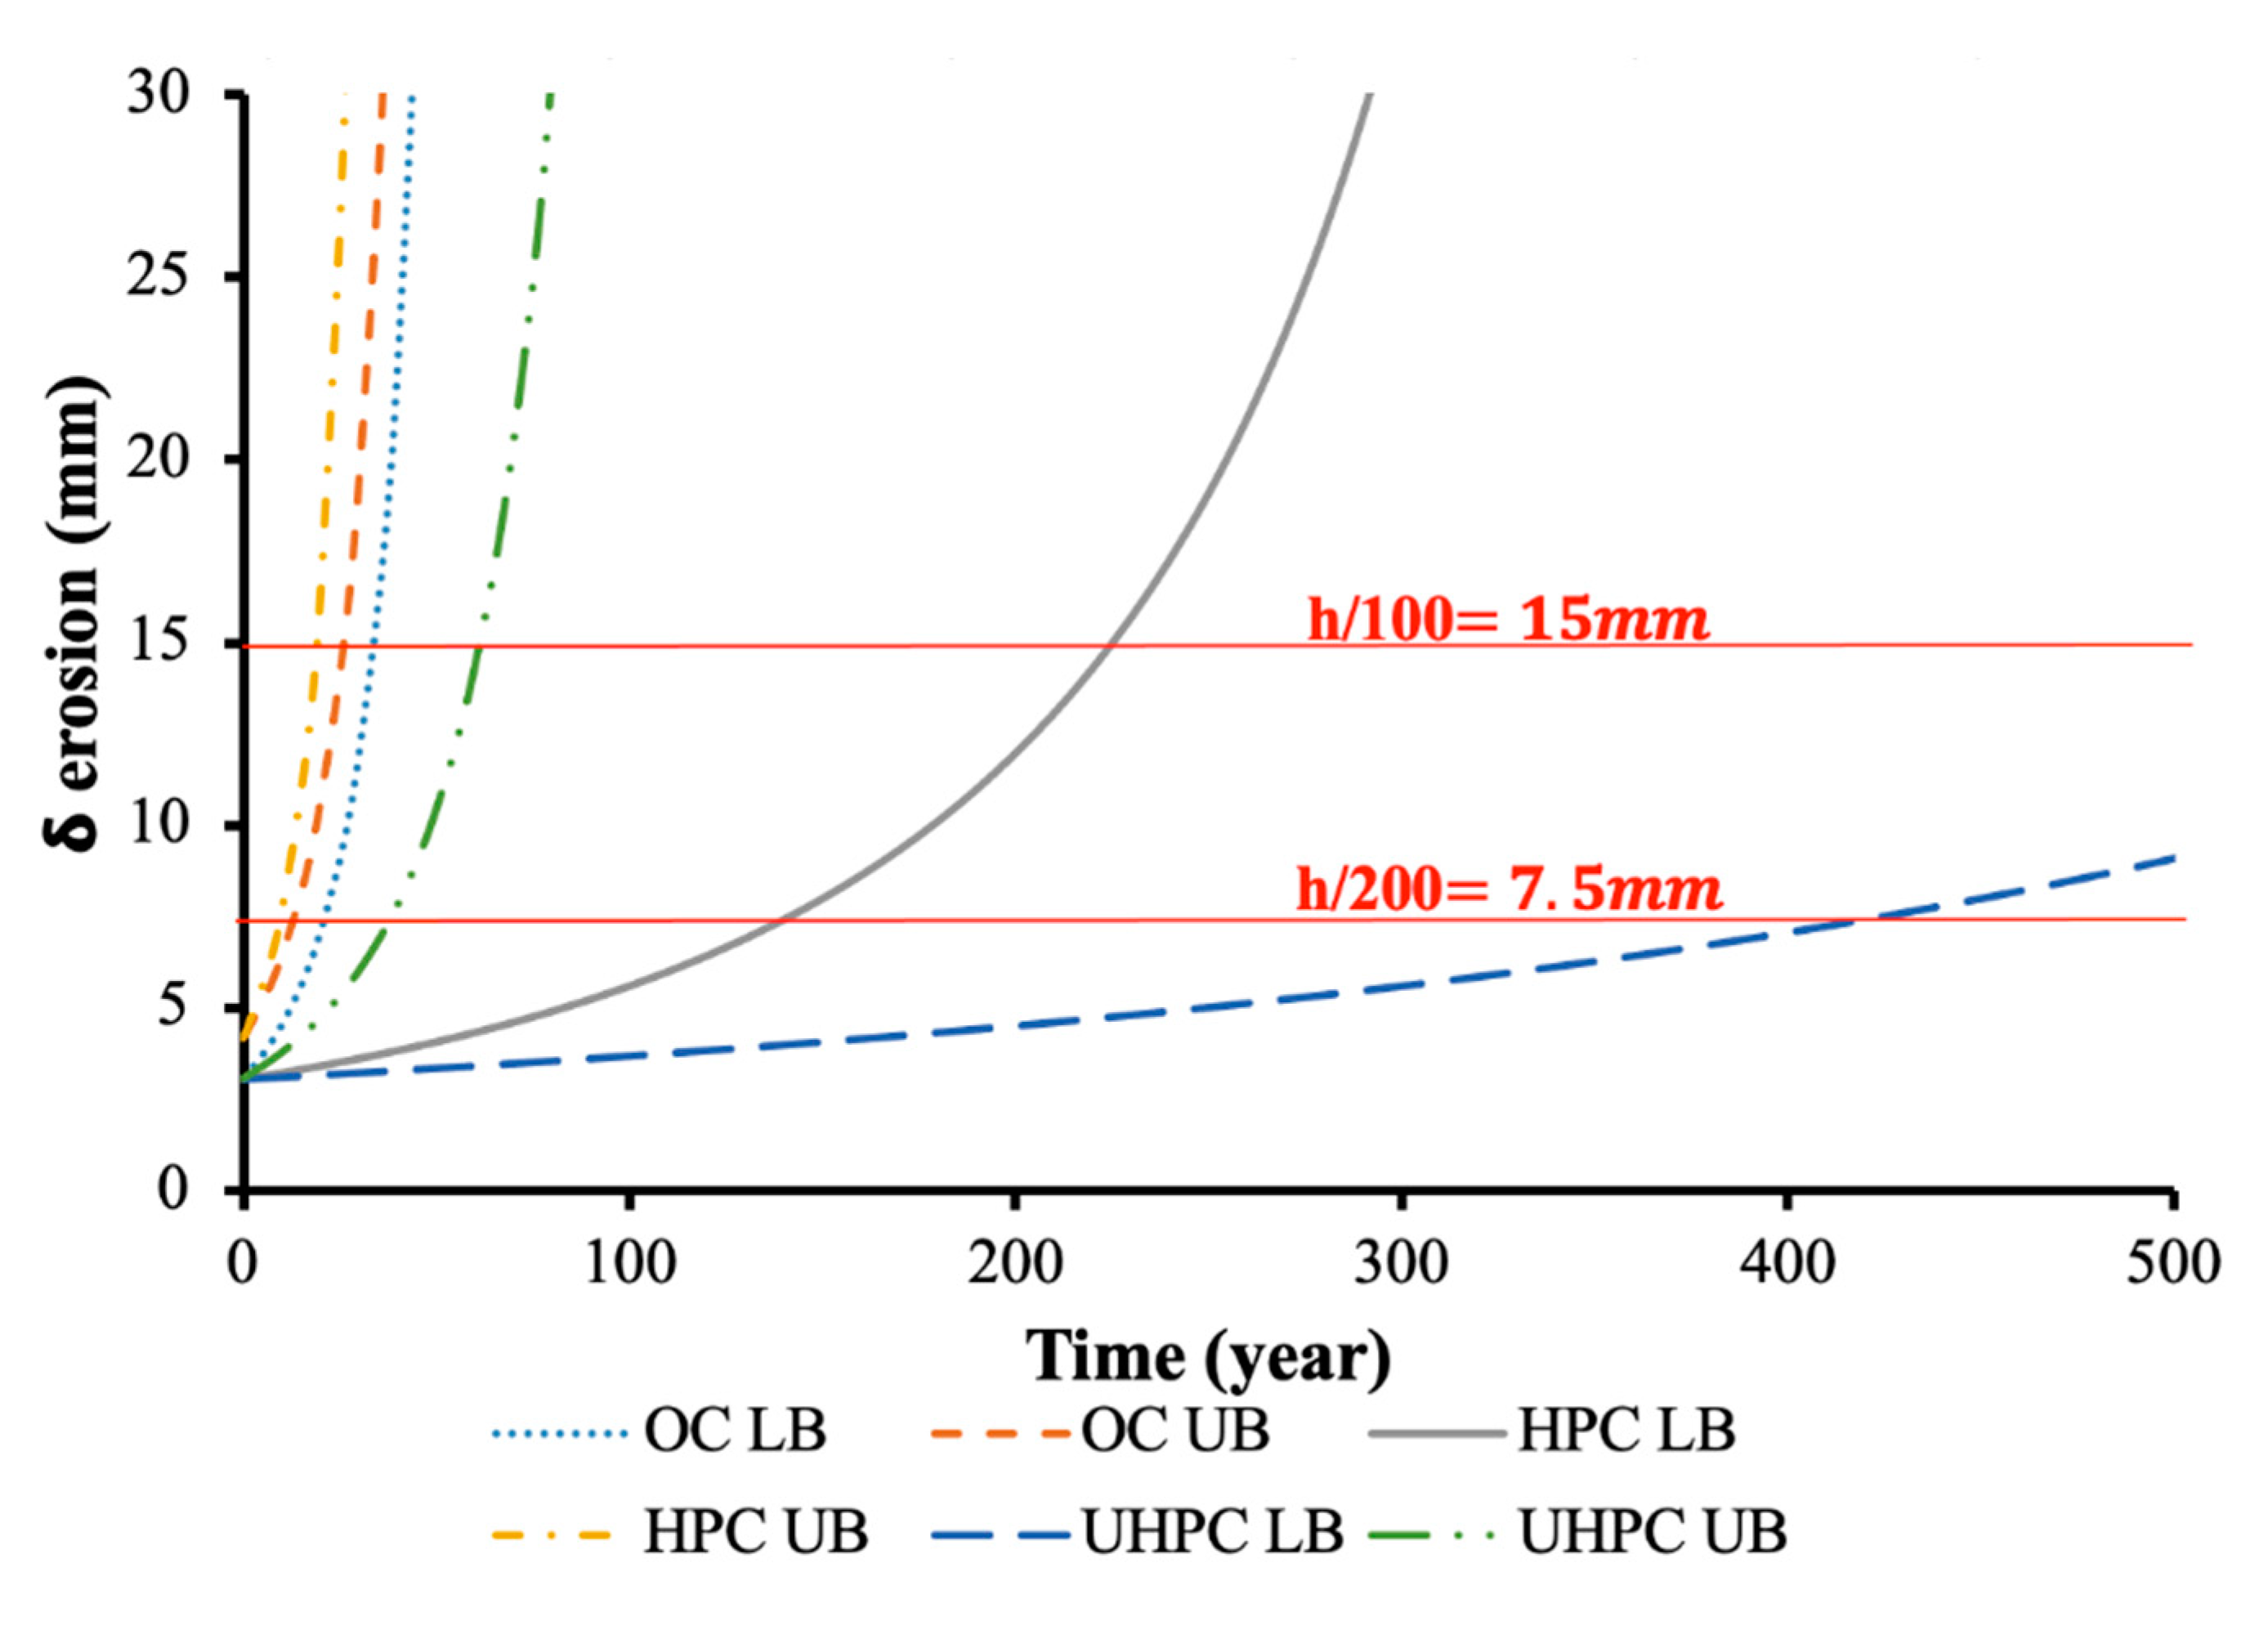
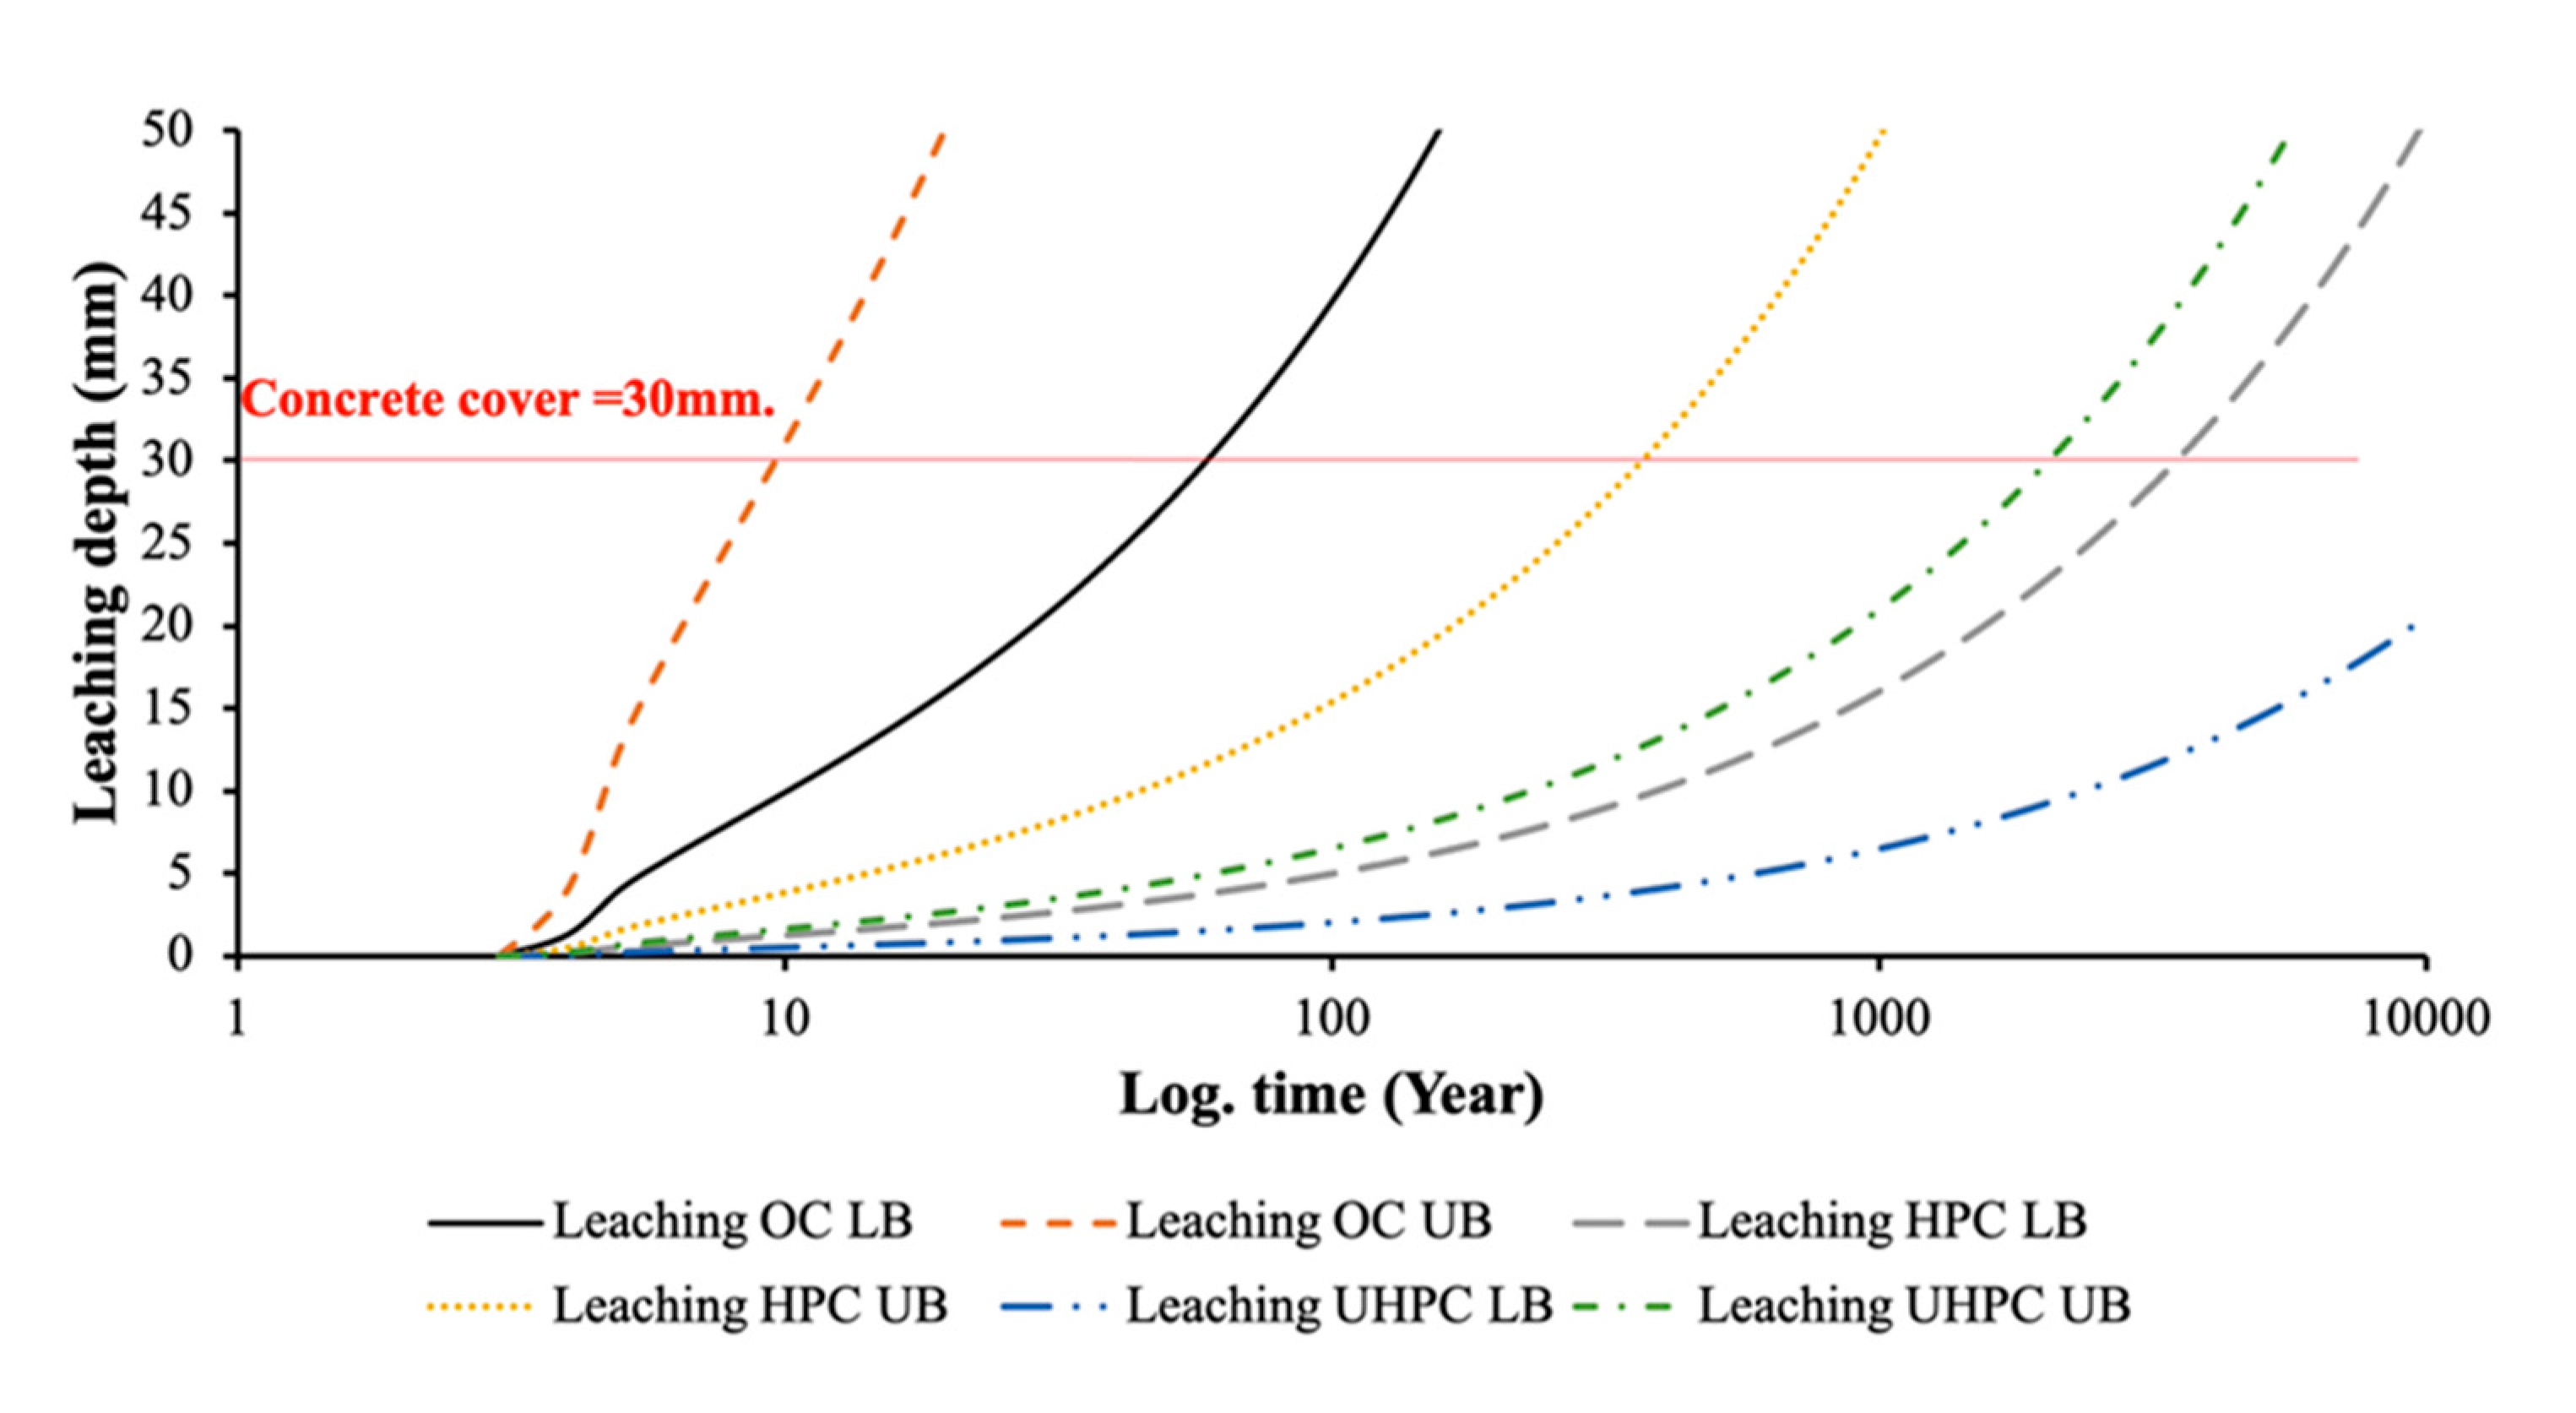
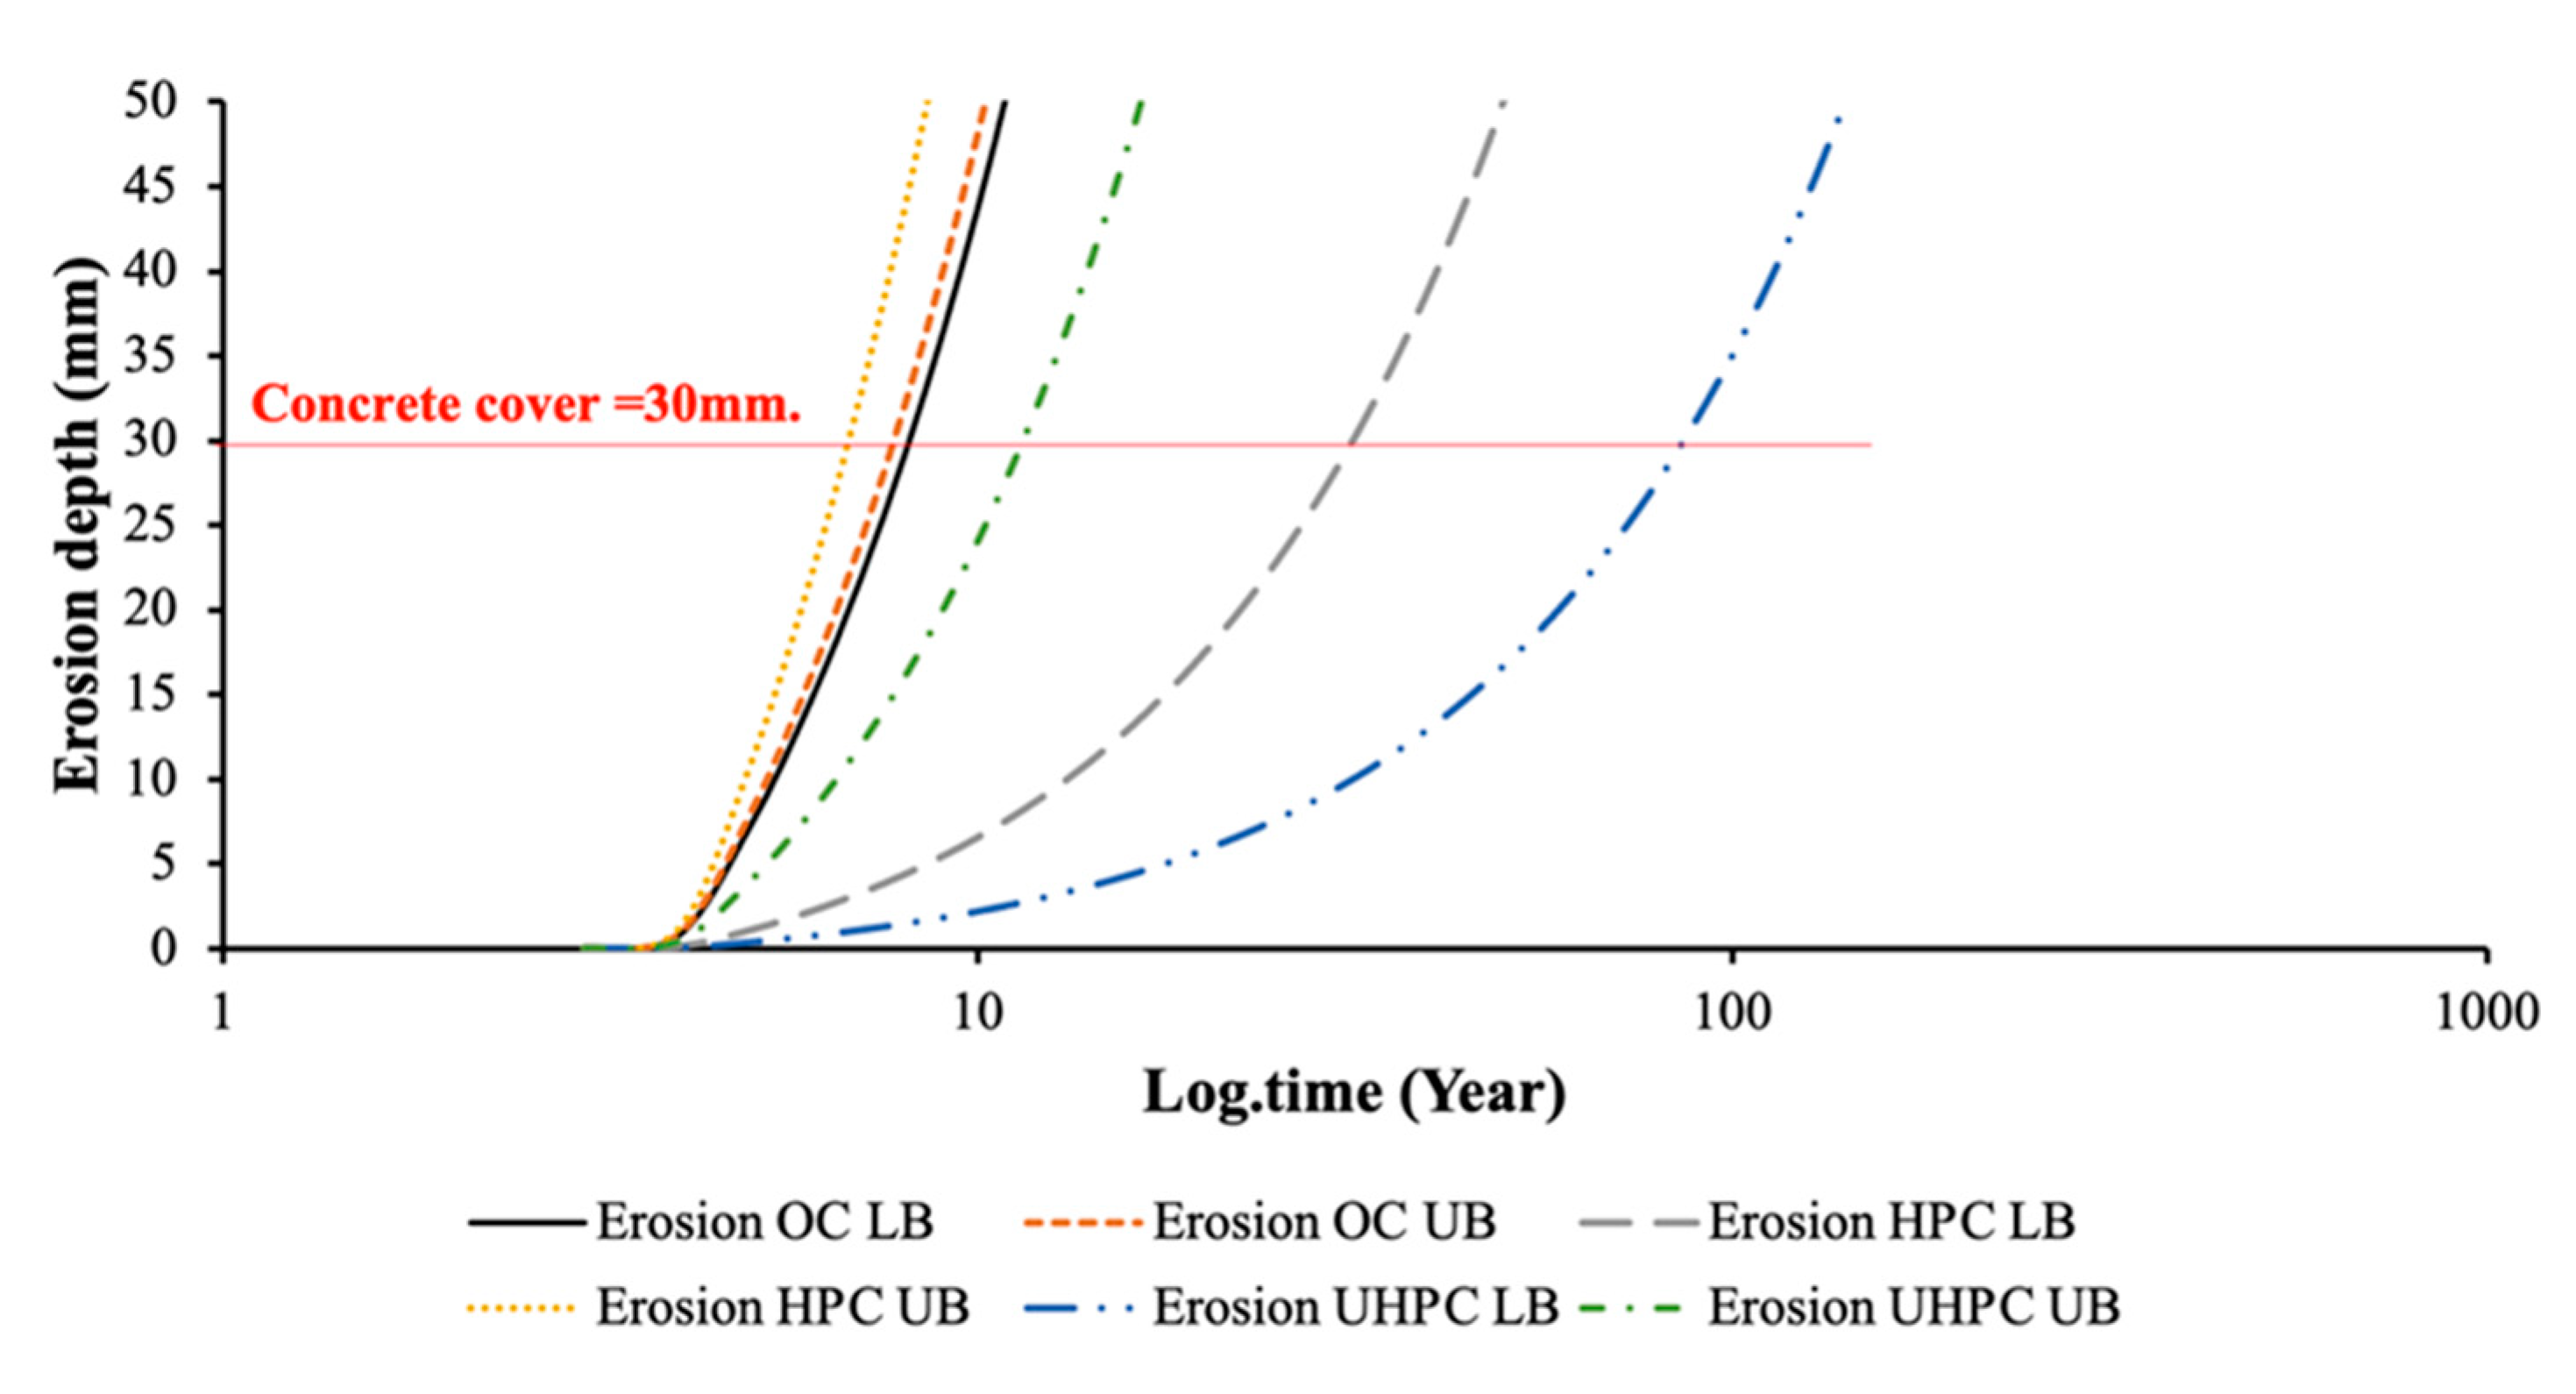
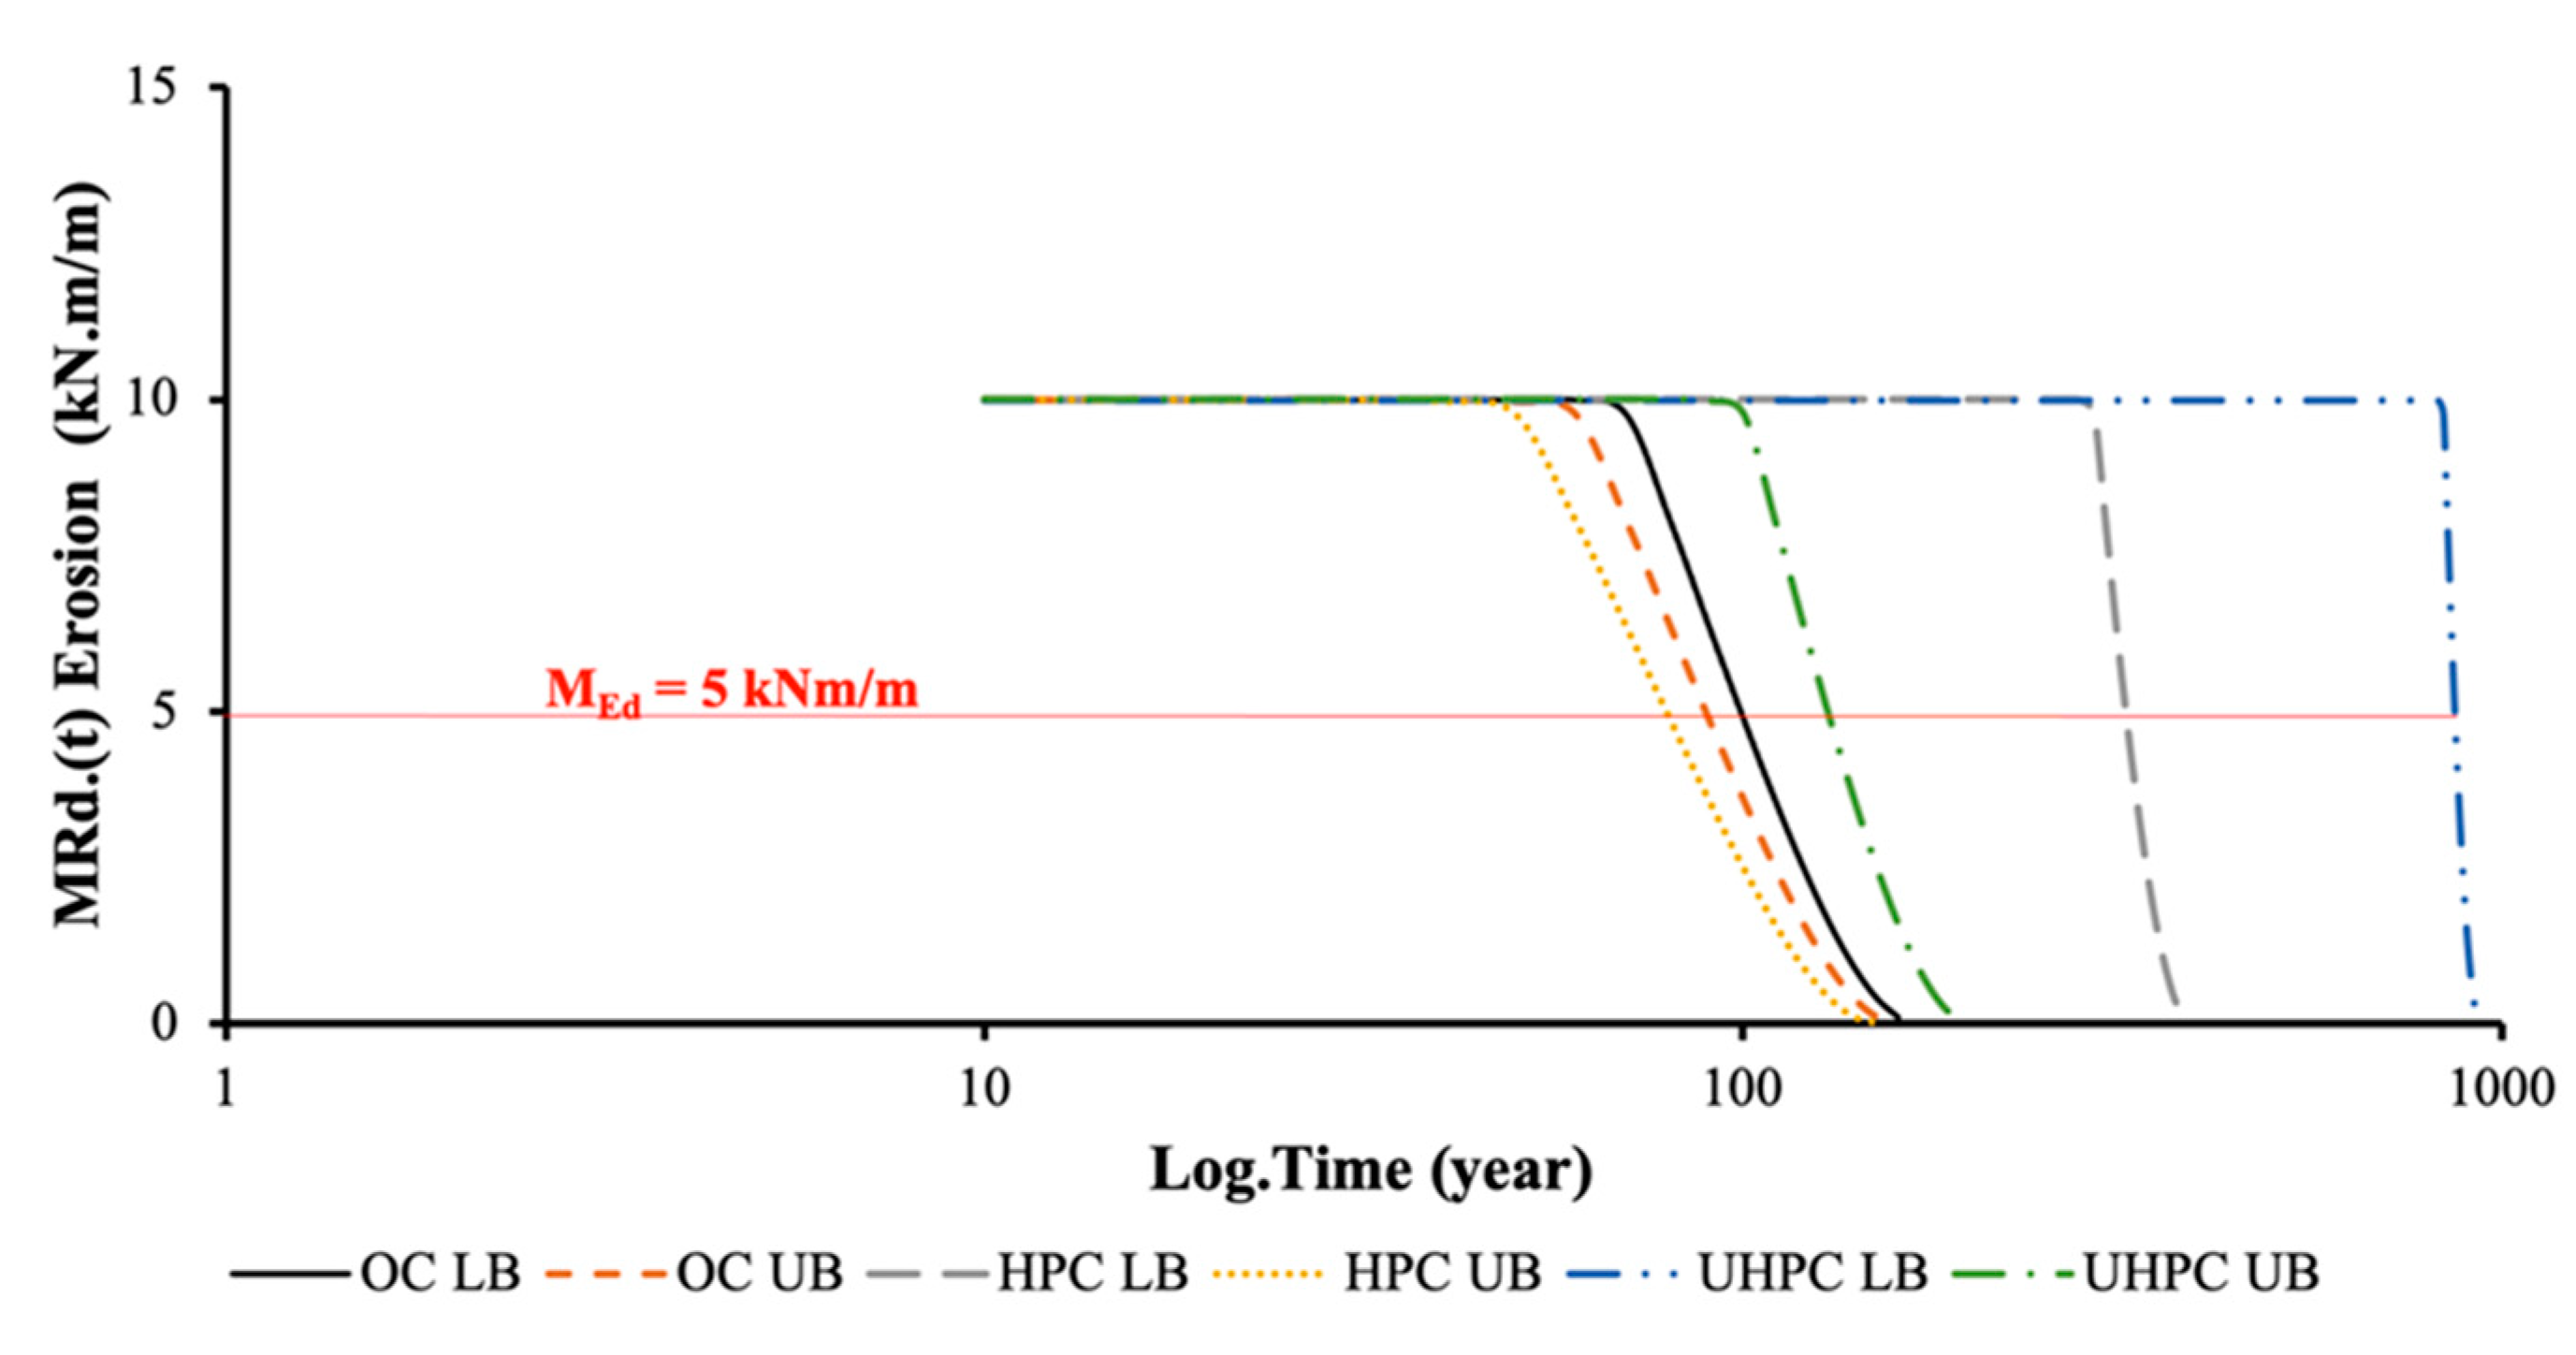
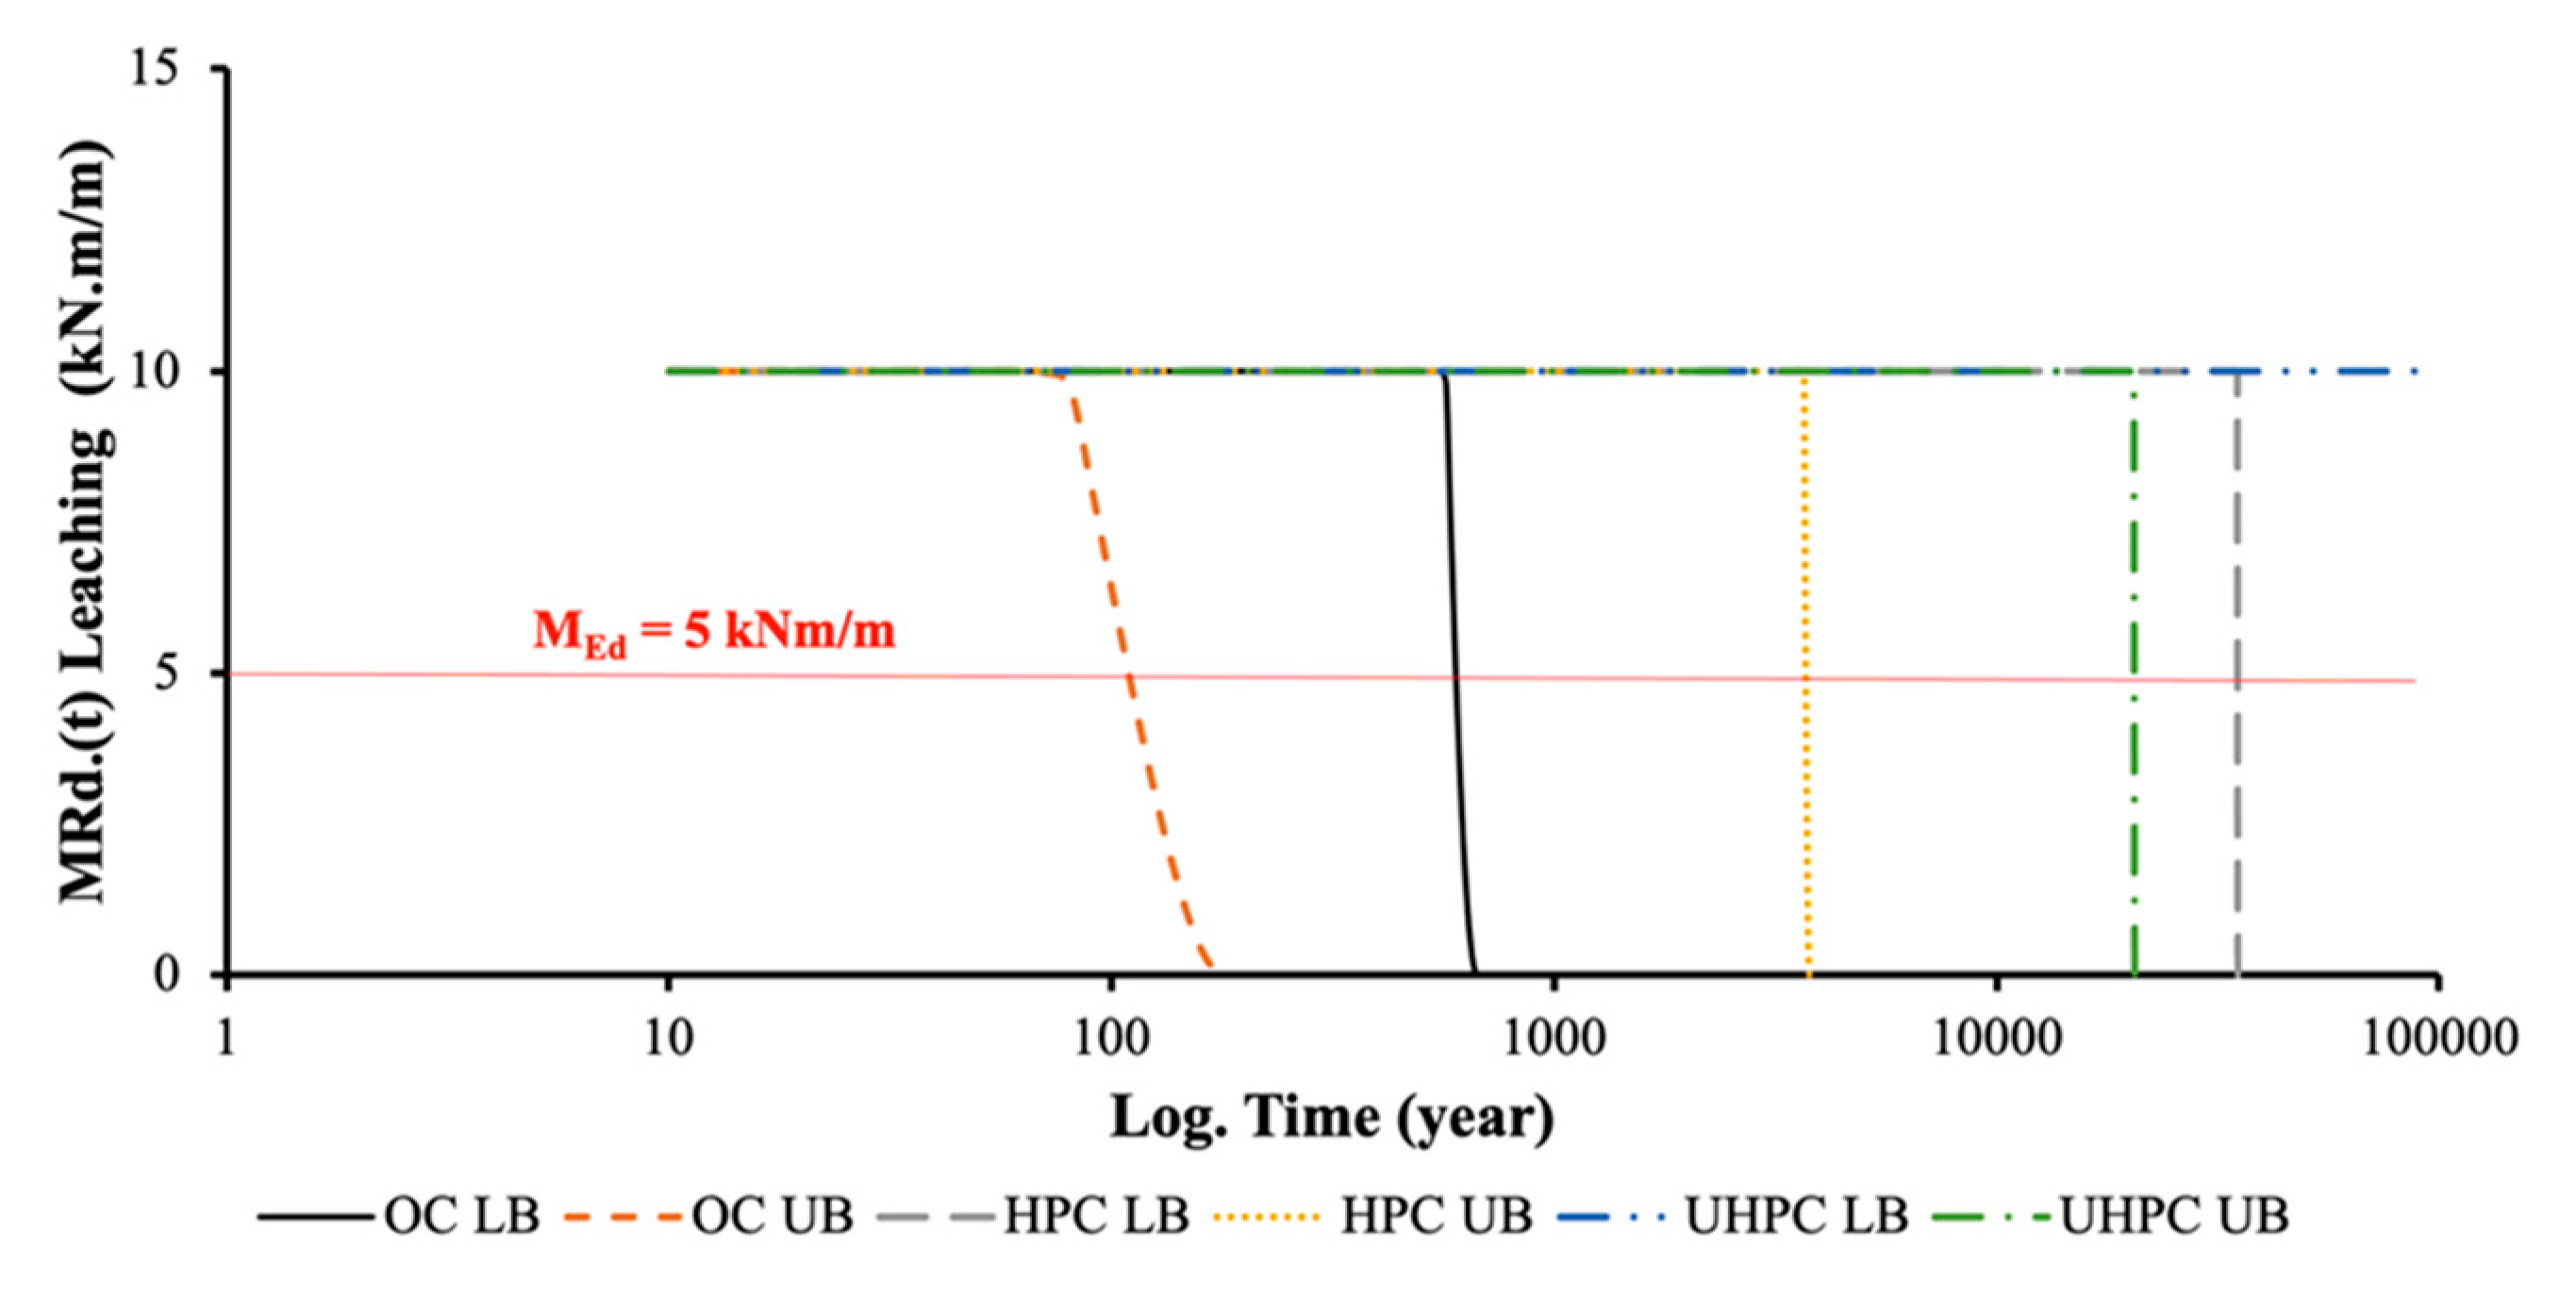
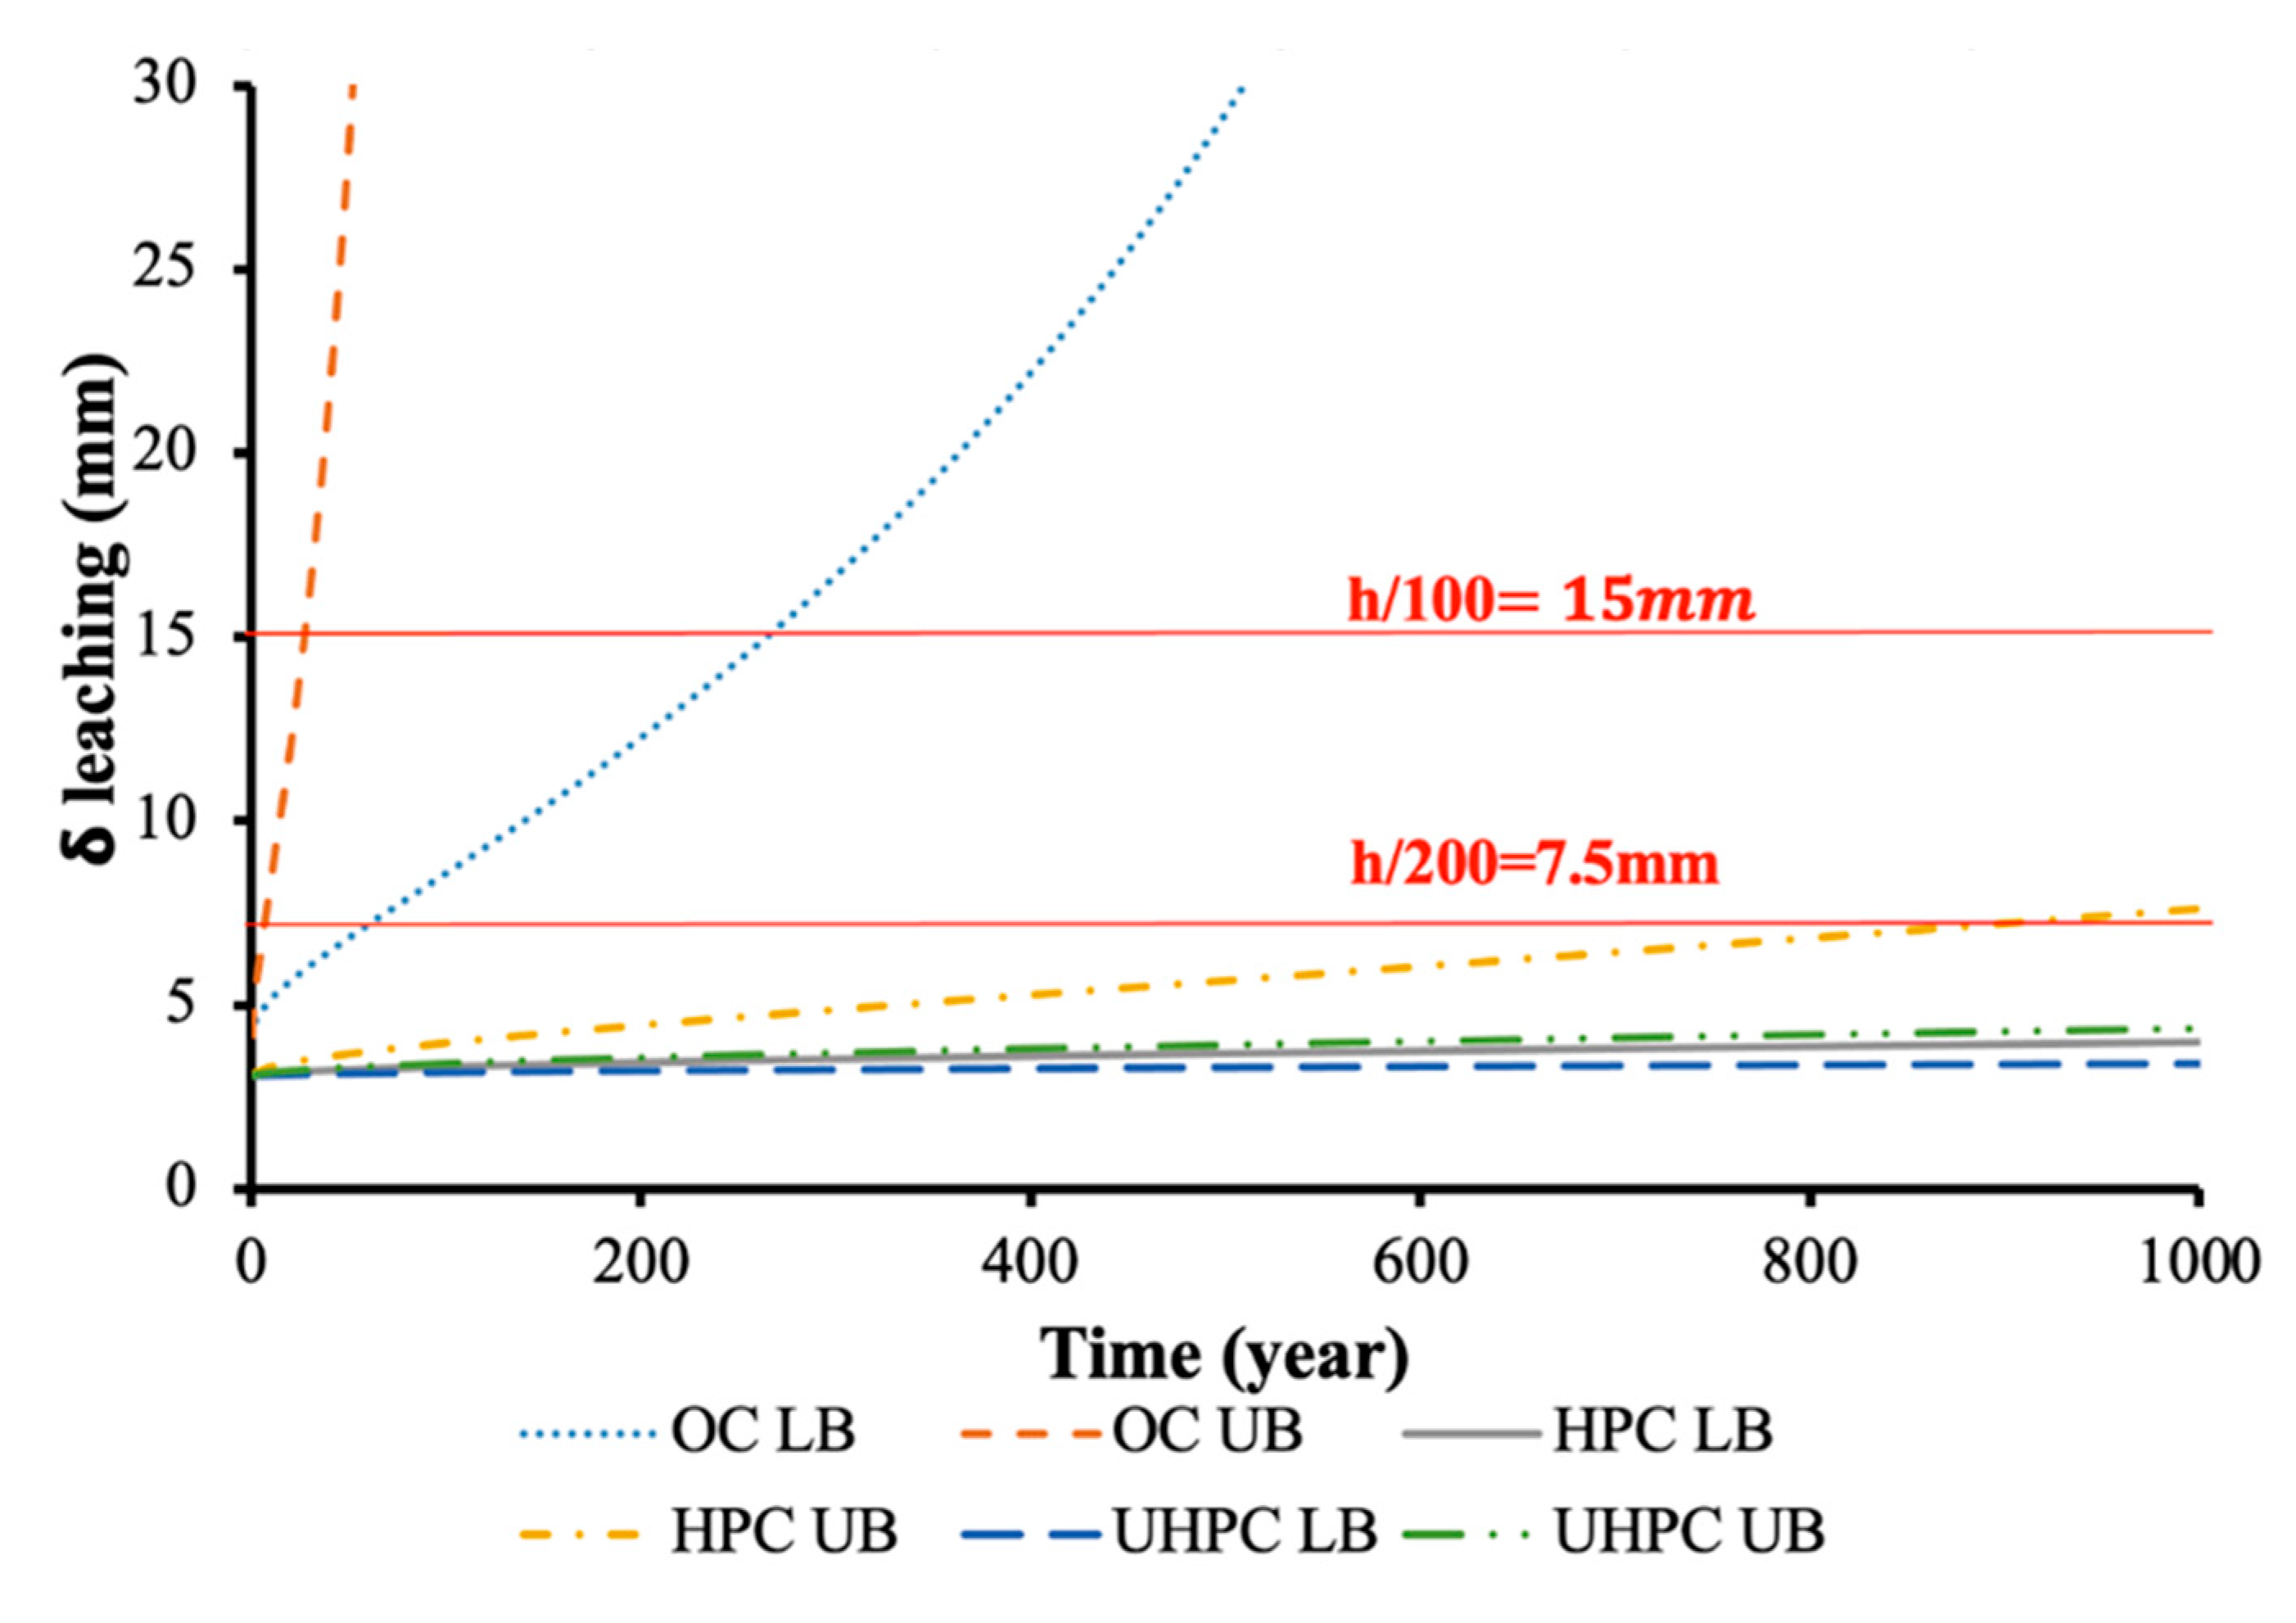
5.2. Acid Attack: Leaching and Erosion

The prediction of performance of concrete under chemical degradation is complex because of the numerous chemical reactions and variety of conditions potentially involved.
The high content of sulphate in the fluids can induce an expansion damage in the concrete as a consequence of the formation of new phases inside, as ettringite or gypsum. While the indicator to identify this risk of damage is the percentage of volume change along the exposure time, the “soluble” nature of the aforementioned products has also to be considered, since it leads to loss of concrete cross section in the form of leaching.
The main factors that affect the rate and severity of the sulphate attack are: the nature of the reaction products, the imperviousness of the matrix, the concentration and mobility of sulphates, nature of the accompanying cation, pH of the sulphate solution, the presence of other dissolved phases such as Cl, the temperature of the exposure, the C3A and Ca(OH)2 content of the cement and extend to which stresses resulting from expansive reaction [114,115]. Most standard tests are carried out by the immersion of specimens in alkaline sulphate solutions; however, the interpretation and quantification of results are difficult. The need for developing standardized methods for service life design of concrete resistance to sulphate attack is of relevant interest as pointed by Santhanam et al. [116]. Laboratory indicators of sulphate damage can be applied to structure monitoring in the field. Expansion data from different concrete compositions during 40 years in natural testing with specimens continuously submerged in a sulphate-rich environment are collected in [116,117]. Sulphate attack could be predicted as a function of w/c, duration of exposure and C3A content as shown in [118]. A safe region appears with the w/c ratio below 0.45 with C3A content lower than 8%. The time to failure is defined as the time at which the expansion exceeds the value of 0.5%. In Kurtis, K. et al., 2000 [117], the partial replacement of Portland cement by supplementary cementitious materials resulted in considerable improvements in the sulphate resistance of concretes. In many cases, the criteria of no-failure are defined as expansion ≤0.05–0.1% after 6 or 12 months of exposure. Besides, at higher temperatures (20 °C), the supplementary cementitious materials, particularly the fly ashes, greatly improved the resistance to external sulphate attack as compared to lower temperatures (5 °C) [119,120].
In a leaching process, due to the interaction of concrete with water, a dissolution of lime at different stages from the compounds in the cement matrix takes place, resulting in a permeability increase. In pure leaching, the process is very slow, except in very permeable concretes and flowing water. The presence of acids increases the rate of attack by reacting with or dissolving the basic constituents of hydrated cement [114]. The quality of the concretes is more important than the cement type or the presence of supplementary cementitious materials in resisting acid attack, though silica fume has provided some improvements [121].
The solubility of the lime will depend on the pH of the water and on the type of lime in the concrete, the more acid the water, the higher its ability to dissolve concrete.
The characteristics and time process depend on the permeability of concrete and on the pressure gradient of water in the concrete structure. It also depends on whether erosion occurs or not. Two leaching processes are analyzed as possible to occur in the case study pilot herein considered:
(1)
Surface leaching with no erosion and no water pressure gradient: In dense concrete, the reaction only occurs on the surface, so that a dissolution process occurs as a moving boundary and is diffusion controlled [122]. In this case, the thickness of the dissolved zone grows with the square-root of time.
(2)
Surface leaching with erosion: If the water is flowing along the surface at high speed and if it brings with it sand and other erosive particles, the dissolved and weakened surface layer can be eroded. When this occurs the leaching process does no longer feature a linear dependence with time in log-scale [122].
Models have been developed for the leaching of calcium ions by water even in case of UHPC [123]. Also for external sulphate attack/decalcification [124], w/c ratio was found to have a major influence on the kinetics of the degradation, emphasizing the interest of using low w/c ratios to increase the durability of cement based materials to chemical attack.
Regarding the acid-induced concrete leaching, diffusion 1st Fick law will be used to predicted the leached lost depth of concrete as a rate of mass loss as shown in Equations (5) and (6) below.
x c r i t = 2 × D × a s m s × a t × ( c s * c m ) × t = a t   without   erosion
x c r i t = 2 × D × a s m s × a t × ( c s * c m ) × t = a   t   +   k e   t   with   erosion
where:
  • D—diffusion coefficient of the gel layer.
  • a s a t —ratio of volume of soluble constituents to the total volume.
  • ms—mass of soluble matter [g] of CaO per cm3 of concrete.
  • cs—Ca(HCO3)2 concentration, or highest concentration of Ca2+ ions, in the solution at the face of intact concrete (g/cm3).
  • cm—Ca(HCO3)2 concentration, or highest concentration of Ca2+ ions, in the solution unaffected by the concrete (g/cm3).
  • ke—the erosion coefficient (mm d−1).
Calibration of leaching and erosion kinetic parameters is at a much more embryonic stage than what is discussed above with reference to the chloride diffusion coefficient.
Alonso et al. [125] found more than 100% reduction of calcium leached in ground water (pH = 8) for UHPC as compared to ordinary and high-performance concrete The depth altered by the water interaction varied from 100 µm in UHPC, 250 µm for HPC and 2 mm for the ordinary concrete, which correspond to the following values of DnsCa (cm2/s): UHPC from 5 to 3 × 10⁻¹¹, HPC from 1.2 to 0.5 × 10⁻¹⁰ and for OC from 2.5 to 1 × 10⁻¹⁰, between 3 and 30 months. From these results, values reported in Table 9 for the kinetic parameters have been evaluated, to be intended as upper and lower bounds for different types of concretes, and used as a reference to plot the evolution vs. time of both the aforementioned degradation phenomena (Figure 9 and Figure 10), which once again highlight the expected differences in performance for the different concretes assumed here as reference for this study.

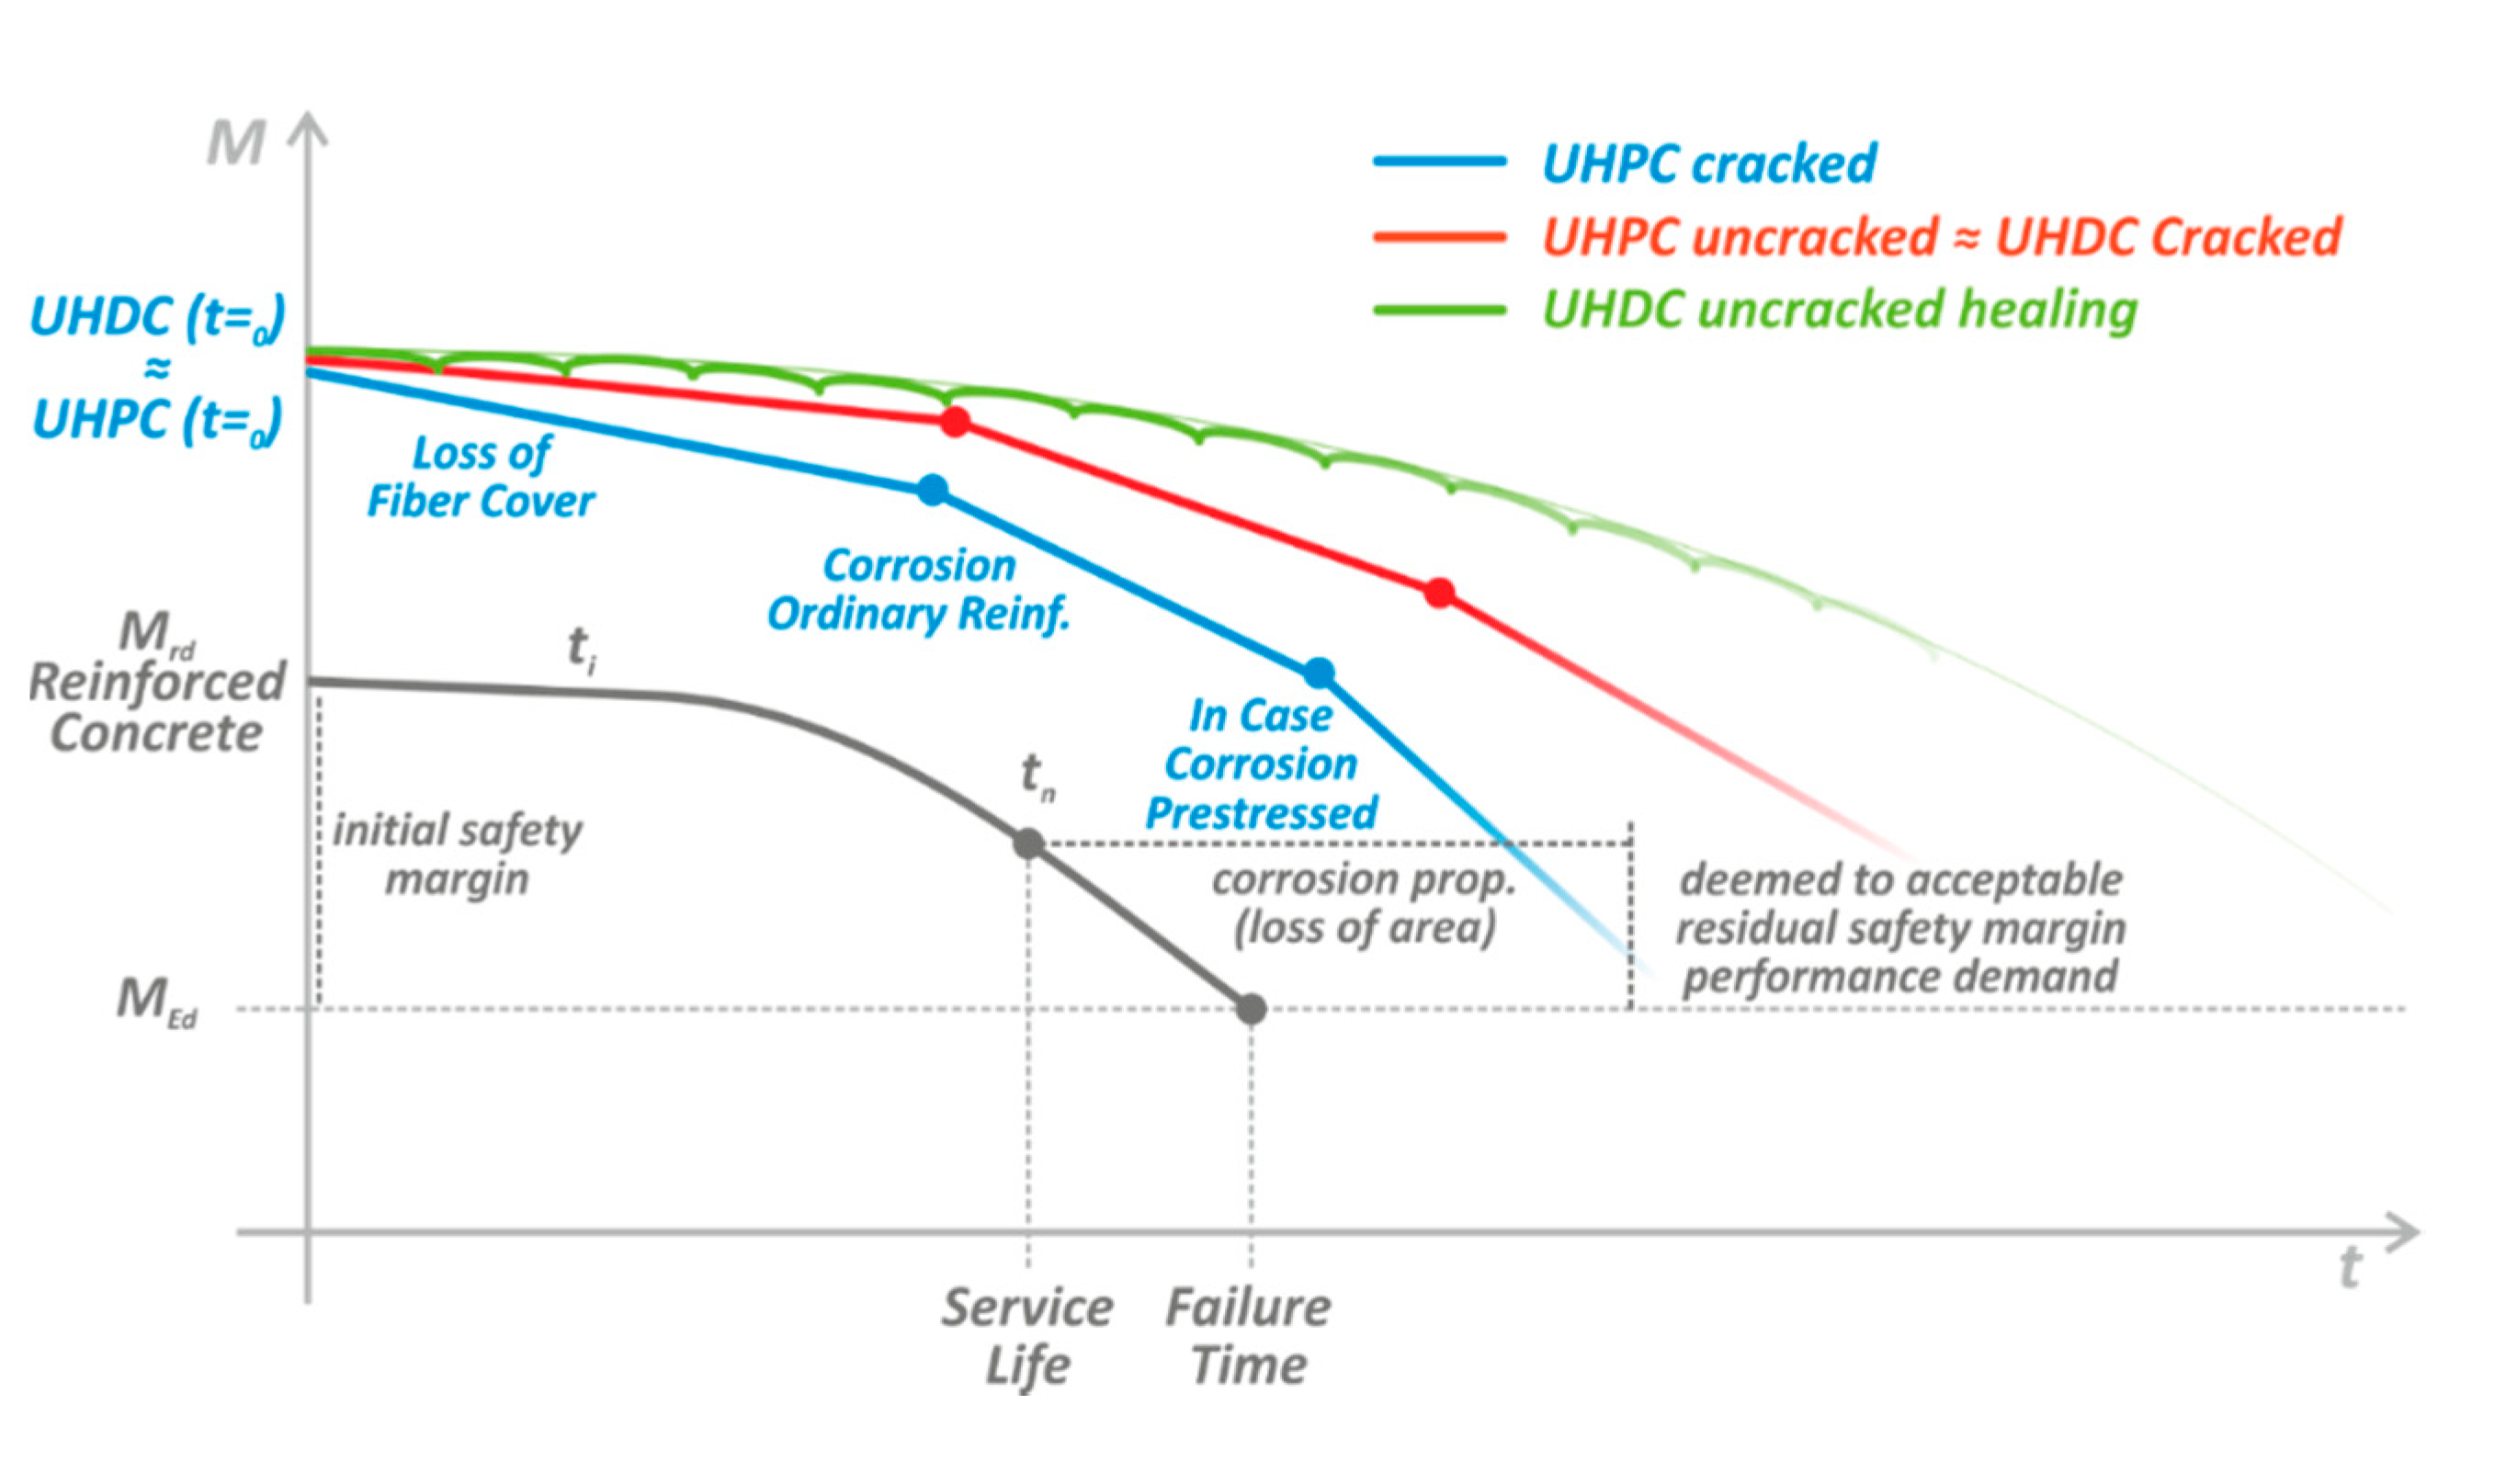
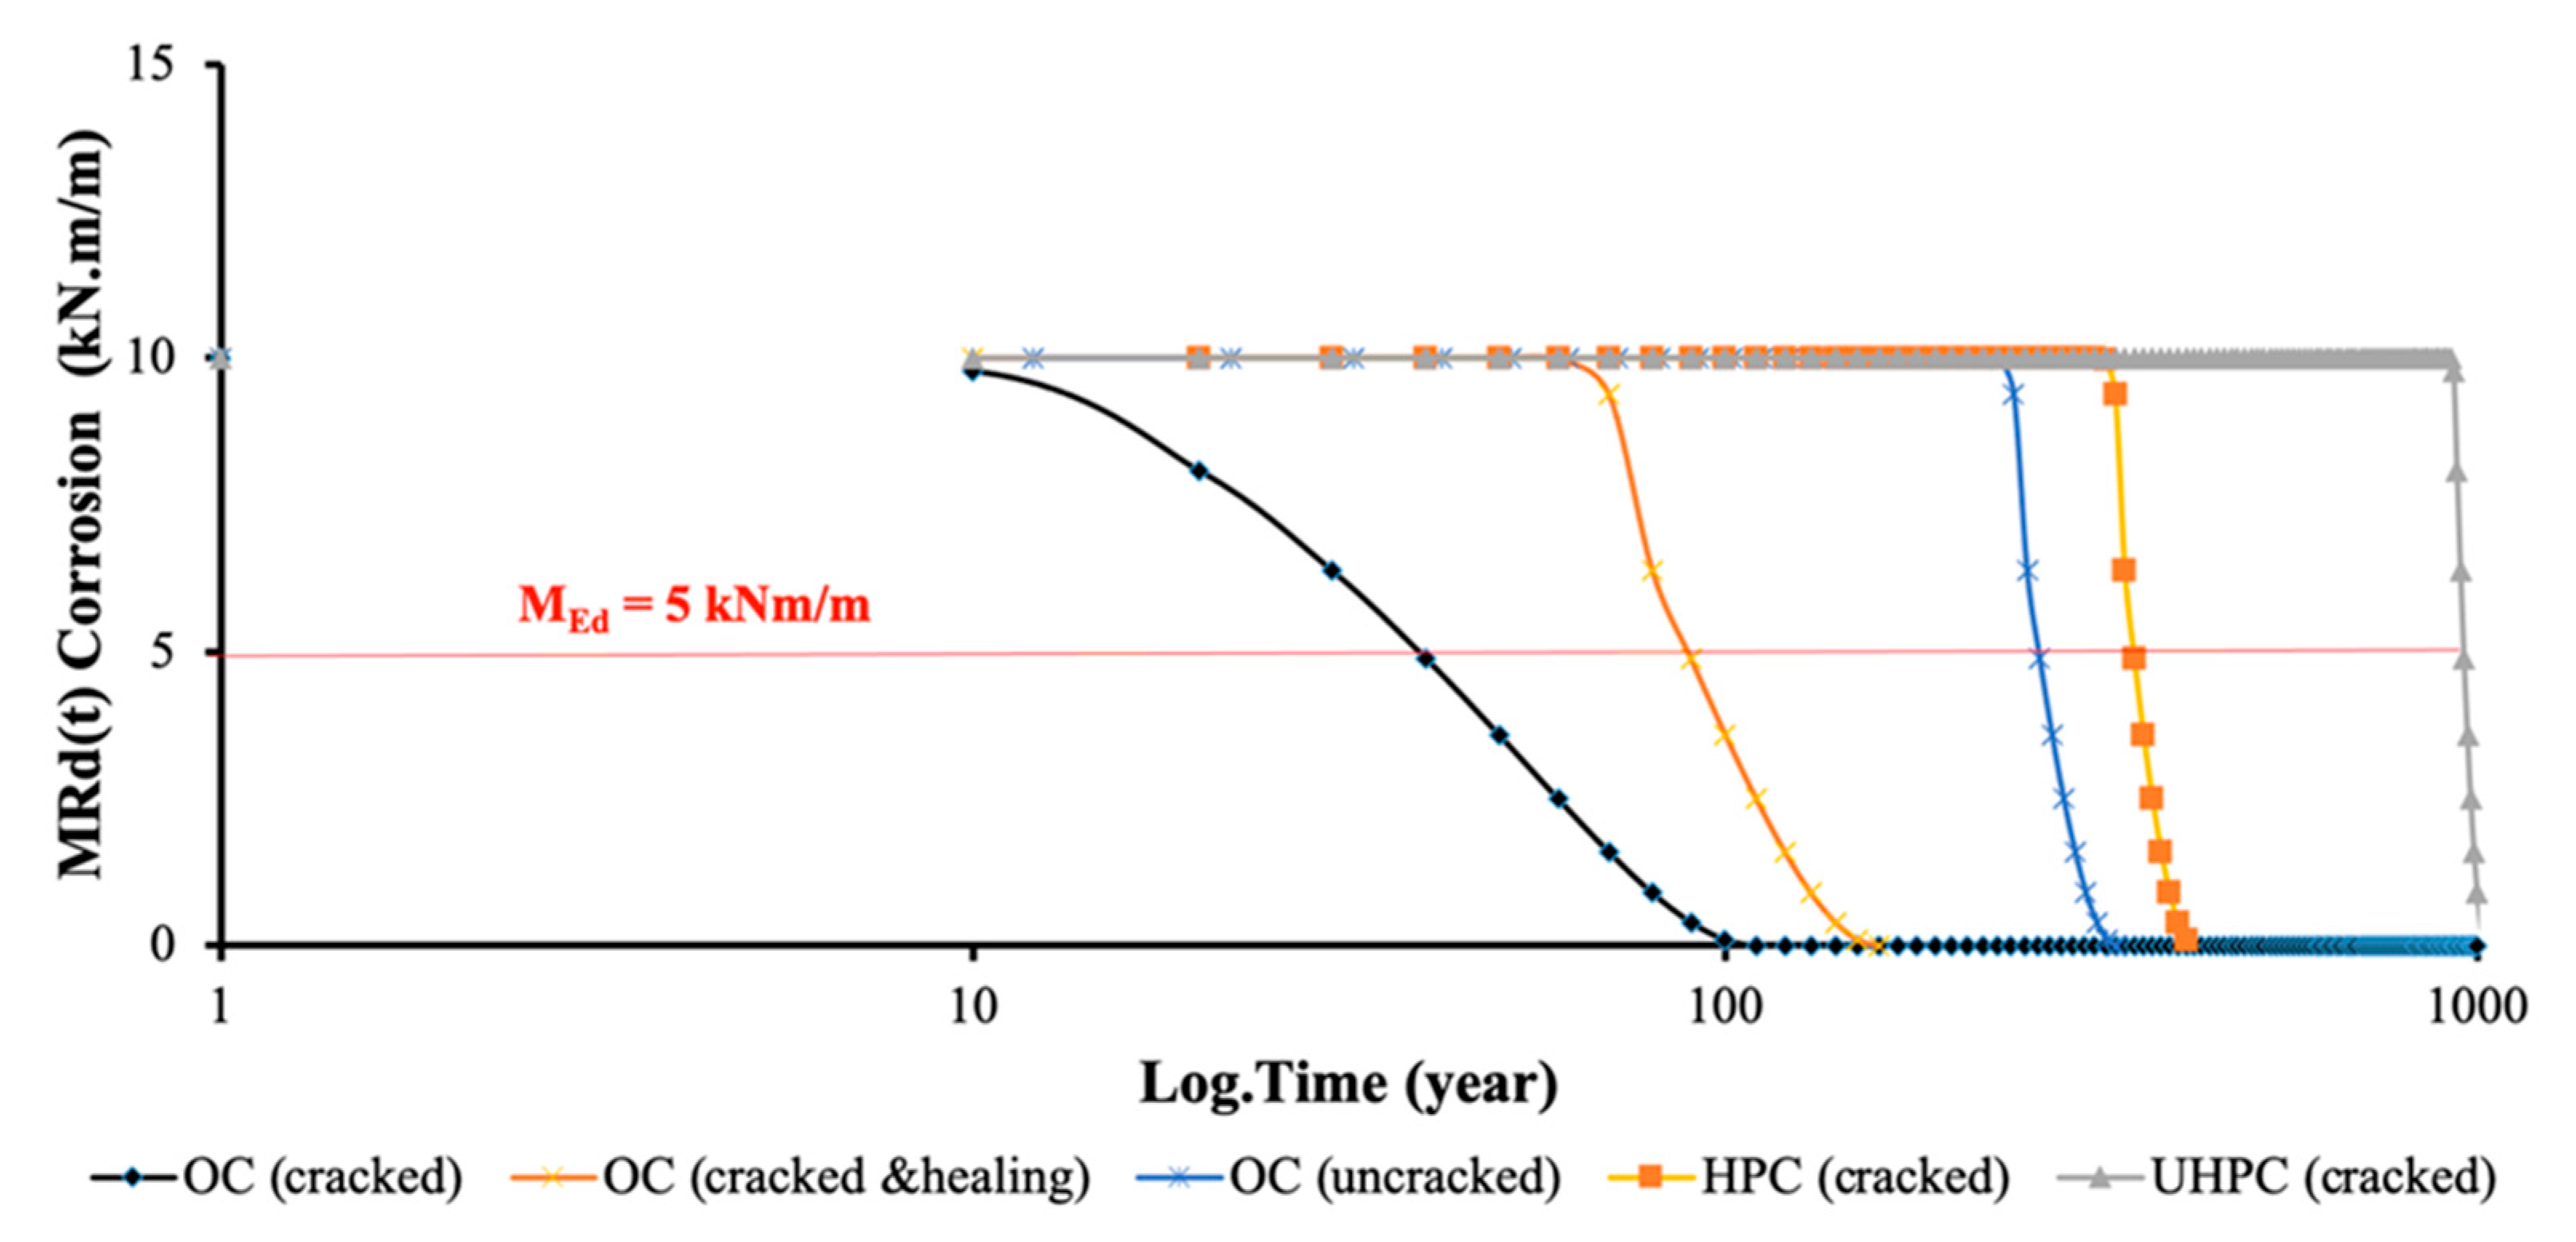
6. Structural Durability Assessment: Embedding Degradation Models into Structural Design Algorithms

Figure 11 illustrates the concept of the durability assessment-based design proposed and implemented in this study [63,64,65] to scale up from the material to structural level in terms of durability modelling and prediction. The x axis represents the life-time of the structure and the y axis represents the performance of the structure (resisting capacity). At time zero, the structure is designed to provide a resistance, e.g., MRd resistant bending moment, which is higher than the demanded capacity MEd, resulting from the design actions, by an initial safety margin. This is chosen by the designer complying with design codes and stakeholders demands. According to the deemed to satisfy approach which currently informs durability design in structural design codes [refs], in the aforementioned initial safety margin, the durability performance requirement based on the target structure service life is implicitly involved. However, this performance will decay over time up to a certain point when it will reach a level where it cannot be considered any longer acceptable. This level will be the limit of the service life of the structure. This limit does not coincide with the “physical” failure limit since the performance still has some margin to further degrade until reaching the design demanded performance. This additional time is, nevertheless, intended to put into force the necessary actions for repairing and retrofitting, in case, or proceed with safe demolition and, hopefully, recycling. The “practical” implementation of this conceptual approach may be straightforward for conventional reinforced concrete structures, for which well assessed design procedures are available, whereas it needs to be suitably contextualized in the case of Ultra-High-Performance Concrete structures, which, in the ReSHEALience project vision, is essential in order to quantify the benefits of UHPCs and spread their application to wider contexts, as it will be herein addressed.
With reference to the case study at issue, the action force on the tank walls is represented by the water pressure, from which the design bending moment is calculated at the fixed bottom edge of the wall, regarded as a cantilever element in cell 1 and 2. The height of the wall is 1.5 m, whereas the tank filling height is set at 1.3m at service level state. The ULS partial safety coefficient for permanent design actions, γG, can be appropriately interpreted in terms of water level surcharge effect, as shown in Figure 12. The following values of the design bending moment are calculated:
At Serviceability Limit State, MEd = γ w h w 3 6 =10 kN/m3 × (1.3 m)3/6 = 3.7 kNm/m,
where γ w : water specific weight = 10 kN/m3.
At Ultimate Limit State, MEd = γ G γ w h w 3 6 = 1.35 × 10 kN/m3 × (1.3 m)3/6 = 5.1 kN/m,
where γ G : permanent load partial safety factor (wave surcharge effect).
If γ G = 1.35, ULS corresponds to a design water level = γ G 3   h w ≅ 1.45 m.

6.1. Cell 1–Ordinary Reinforced Concrete

The resistant moment capacity was calculated per 1.0 m segment of the wall based on the cross section and reinforcement details shown in Figure 13. With reference to design material properties obtainable from EN1992-1-1 [126] for C25/30 concrete and B500 steel (see also Section 4):
Mcracking,k ≅ 0.7 fcfm bh2/6 = 3.64 Nm/m ≅ MEk (SLS) = 3.7 kNm/m
MRd = 0.9d As fyd = 0.9 × 65 mm × 392.5 mm2 × 434 MPa = 10 kNm/m > MEd = 5.1 kNm/m
Taking into consideration the data available in Table 2, it can be observed that this basin will be subjected to continuously aggressive actions by chlorides and sulphates in the geothermal water. These exposure conditions and resulting degradation will have to be embedded in the calculation of the resistance capacity behavior of the basin wall. As already discussed in the previous section first, the chloride ions will have to penetrate the 30 mm concrete cover and reach at that level a critical content, as per Equations (1) and (2), able to initiate the corrosion of the reinforcement, which will henceforth start, proceeding, e.g., according to model in Equations (4) and (5).
The chloride diffusion characteristics of concrete will affect the time it takes for the chloride content to reach the concrete threshold at the cover level, whereas the resistant moment capacity will be affected by the velocity of corrosion of the reinforcement, which is assumed here independent of the type of concrete. This is a simplified assumption since, as reported by Hay and Ostertag (2020) [127], the buffering capacity and the corrosion products and kinetics are likely to be of different morphology for specimens made of 100% Portland cement concrete and with 50% fly ash or slag as cement replacement, as from accelerated corrosion test in chloride environment.
MRd (t) ≅ 0.9d As(t) fyd
where As(t) is calculated according to the corrosion model in Equations (4) and (5) [66,67,68].
A similar concept can be used to calculate the evolution of the resistant moment capacity in the case of leaching or erosion; the concrete degradation phenomenon only affects the concrete cover, which, being in the tension zone, does not enter into the calculation of the same resistant moment capacity. As a simplifying assumption, which springs from keeping uncoupled the chloride penetration and the sulphate-induced degradation phenomena, it is henceforth assumed that once the whole concrete cover is leached or eroded and the reinforcement is in direct contact with the water, the corrosion starts, evolving as above and likewise affecting the resistant moment capacity of the cross section. The predicted evolution of the resistant moment capacity of the basin wall cross section is shown in Figure 14, Figure 15 and Figure 16 for the different types of hypothesized concrete and service state (cracked-uncracked-cracked healing). It is worth remarking that the UHPC curves in all Figure 14, Figure 15 and Figure 16 refer to a case where ordinary reinforcement is anyway present in a matrix which has the same uncracked durability parameters of a UHPC but where the likely presence of dispersed fiber reinforcement is not taken into account. Besides the effects of the different types of concrete, and the higher benefits of using UHPC, the faster degradation in the case of erosion mechanisms is evident. Moreover, the role of the concrete cover in guaranteeing the protection is evident, since, once the corrosion mechanism starts, the degradation of the resisting moment proceeds faster, as compared to the “performance retention time” guaranteed during the penetration of the aggressive substances.
The Serviceability Limit State (SLS) evolution with time has been evaluated based on the concrete and steel stresses at the service load under the applied exposures. With reference to design material properties obtainable from EN1992-1-1 [126] for C25/30 concrete and B500 steel:
Mcracking,k ≅ 0.7 fcfm bh2/6 = 3.64 Nm/m ≅ MEk (SLS) = 3.7 kNm/m
which means that the cracked cross section assumption has to be realistically employed.
From the force equilibrium, the depth of the compressed concrete is obtained, then using the moment at the SLS to obtain the corresponding stresses of concrete and steel. The same procedure of steel corrosion described previously can be implemented to anticipate the performance of the structures under the chloride, and leaching and erosion as shown in Figure 17 and Figure 18, respectively.
1 2 σ c b x σ s A s = 1 2 σ c b x α E σ c A s d x x = 0   F o r c e   e q u i l i b r i u m σ c = M E d ( S L S ) [ b x 3 3 + α E A s ( d s ) 2 ] x   <   0.6   f c k   =   15   MPa   ( 0.6   f c k )   M o m e n t   e q u i l i b r i u m σ s = α E σ c d x x   <   250   MPa   ( a c c o u n t i n g   f o r   a   s i m p l i f i e d   i n d i r e c t   c h e c k   o f   t h e   c r a c k   w i d t h )
Besides the already highlighted differences in the kinetics of the degradation mechanisms, the shorter time required to reach the maximum allowable stress in the steel is evident, which confirms the importance of an appropriate, and likely more explicit, crack width verification also extended to the whole service life span of the structure.

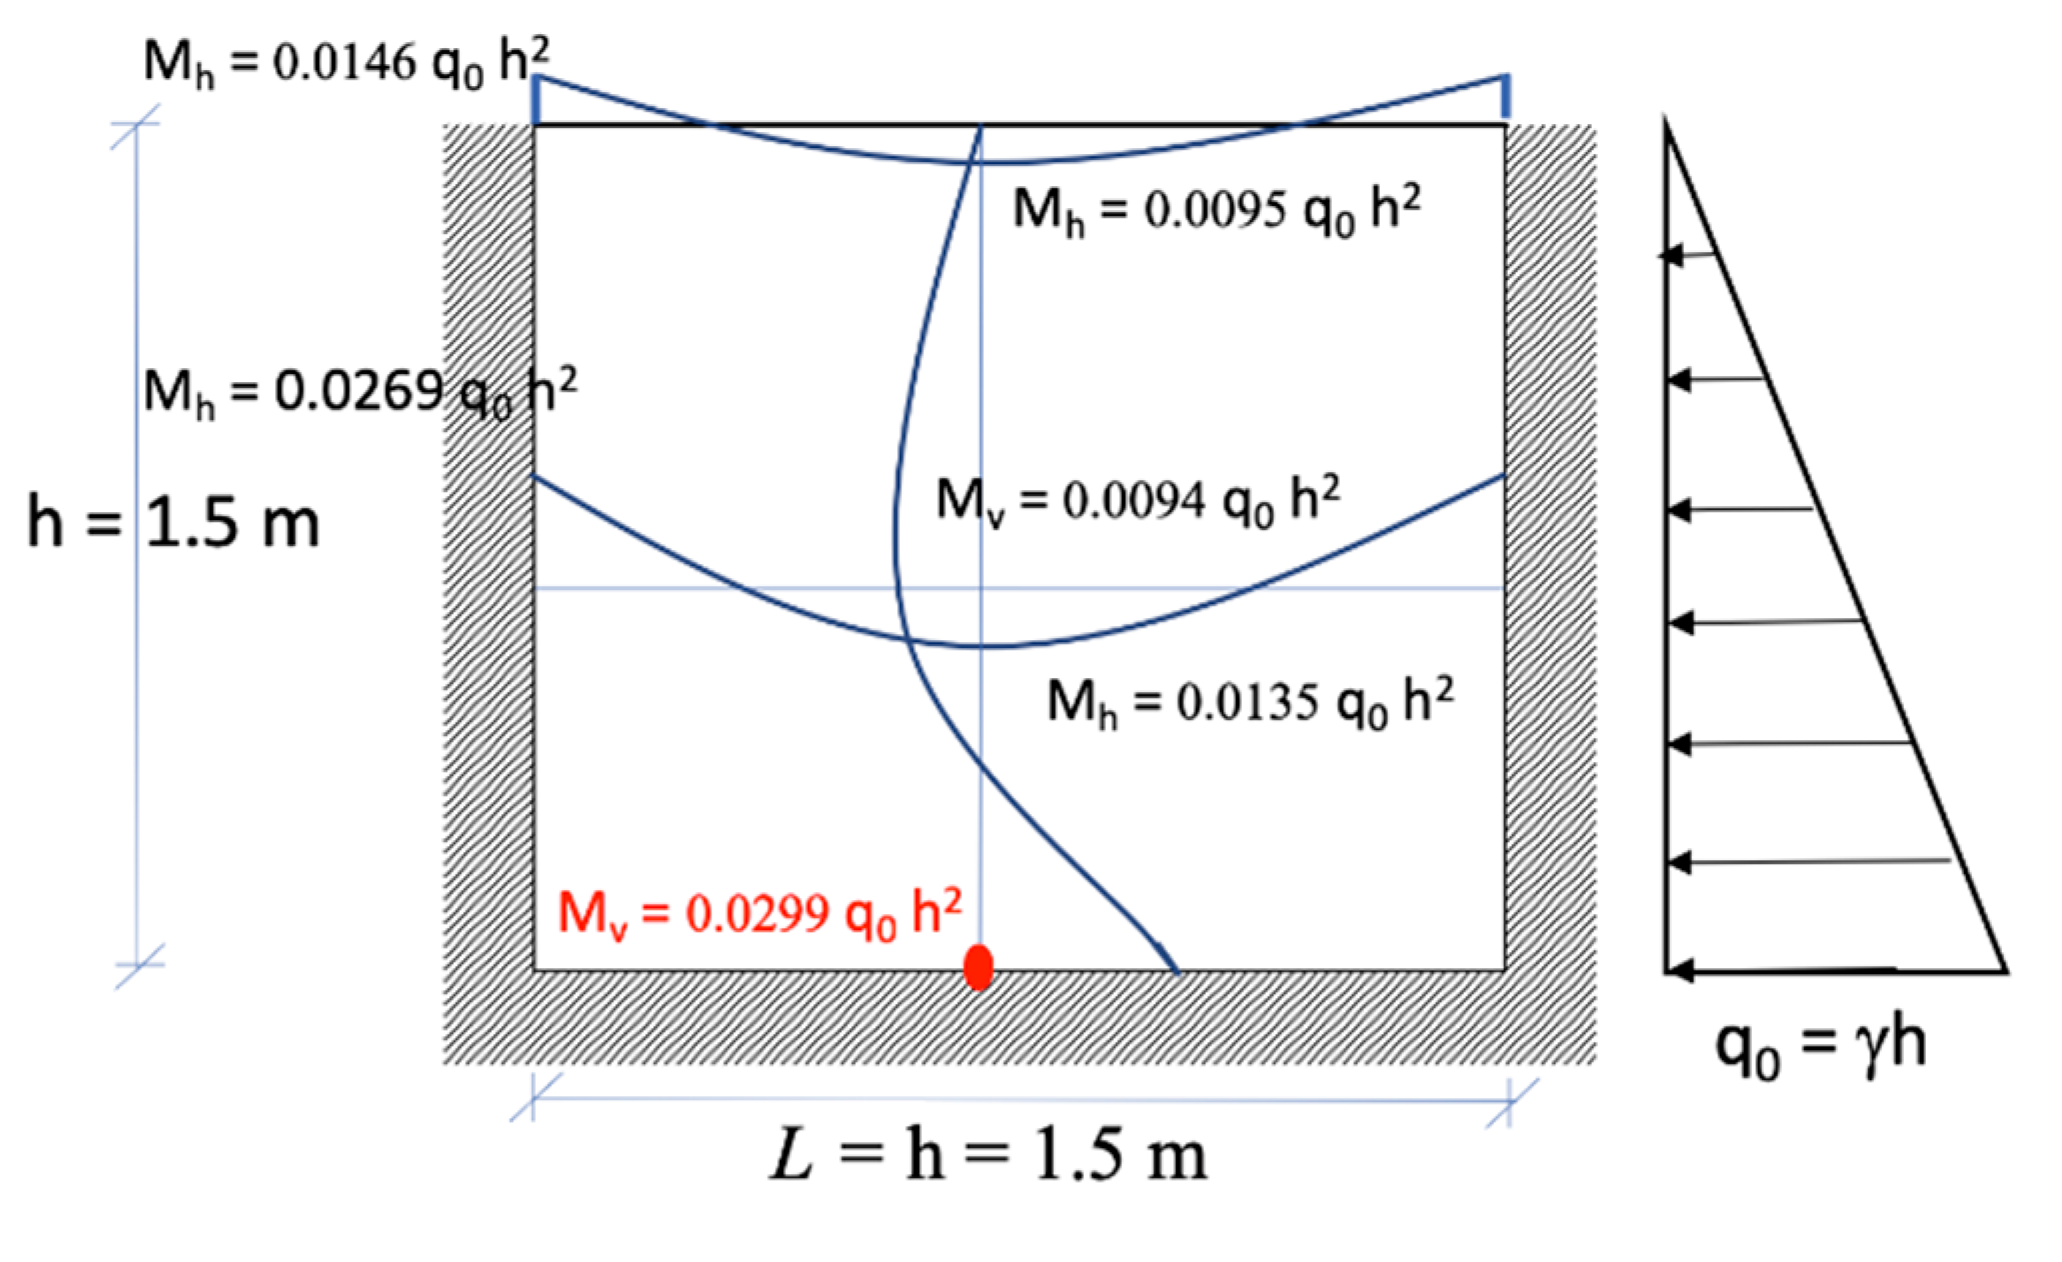
6.2. Cell 2–UHPC (Cantilever Wall Scheme)

In order to proceed with the evaluation of the evolution over time of the structural performance of the second basin, which consists of 60-mm-thick UHDC walls, with no ordinary reinforcement as described in Figure 2, first of all a suitable model for the calculation of the resistance moment capacity of a UHPC cross section, with no other reinforcement than fibers dispersed in the matrix, has to be introduced. With reference to Figure 19, which summarizes the prescriptions of current design codes and recommendations [52], two possible stress distributions can be assumed, elastic in compression and perfectly plastic in tension, or rigid in compression and perfectly plastic in tension. For the purpose of implementing the concrete degradation models described above, the perfectly plastic stress distribution will be assumed in this study, which results in easier but equally reliable calculations.
With reference to material properties described in Section 4 above, it is:
M R d   ( t 0 )   =   f t · b   h 2 2 =   5.6 N / mm 2 ( 1   m )   ( 60   mm ) 2 2   =   10.1   kNm / m
As far as the effects of the considered degradation mechanisms on the evolution with time of the resistant bending moment capacity, it is assumed that, as long as the content of chlorides reaches the critical value in the outmost layer of the tensile zone of the cross section, fibers do immediately corrode, because of their small diameter and their contribution on the resistant bending moment capacity is likewise immediately lost. The same holds for leaching and erosion due to sulphate attack, where progressive physical loss of the layers is experienced. It can be thus written:
MRd (t) = ½ fftU b (h − x(t))2 = ½ fftU b (h − xcrit (t))2 = ½ fftU b (h − a√t)2 = ½ fftU b (h − ket)2
The resulting moment capacity degradation curves are shown in Figure 20, Figure 21 and Figure 22 respectively, for chloride-induced corrosion, sulphate leaching and erosion.
The performance of the second basin (UHPC) at the serviceability limit state is performed for maximum deflection only:
Top   deflection   δ   =   q   H 4 15   E I ,   with   I ( t ) = b [ 60 m m x c r i t ( t ) ] 3 12 q   =   γ H b   with   γ = 10 kN m 3 ,   H   =   1.5   m   the   height   of   the   basin   wall ,   and   b   =   1.0   m .
Besides confirming once again the differences in the kinetics of the mechanisms, it clearly appears from the curves above that a structural solution such as the one herein hypothesized is only possible thanks to the very low chloride permeability and acid attack degradation coefficients obtained for HPC and UHPC, though, in the case of erosion, quite low service times have been computed, reasonably complying with the short life span and sever damage observed in real case studies. It is worth once again remarking that all the degradation curves have been obtained assuming that the outer layer of the structures, once penetrated by chlorides up to the critical concentration or leached/eroded by acids, is completely removed from the cross section as far as its contribution to the load bearing capacity is concerned. This assumption may be quite conservative in the case of high-performance fiber-reinforced cementitious materials, where a certain fiber network continuity also in severely damaged zone may anyway result into some capacity to maintain the tensile stress and strain capacity, and hence in a slower degradation of the flexural strength at the cross section level.
Figure 23, Figure 24 and Figure 25 show the evolution for the maximum deflection of the wall basin for different types of concrete and exposures. The faster and more severe degradation over time of the performance as far as serviceability limit states are concerned is clearly evident from the graphs, also as a consequence of the higher flexibility of the structure due to its quite thin cross section, which, as it already occurs, e.g., for steel structures, shifts the design governing mechanisms from ULS to SLS. This also highlights the need for more appropriate design tools that can effectively predict the cracked state, in terms of width and spacing, and its effects on the structural stiffness, in the stable multiple cracking phase of the behavior of the material, which would represent its state in the structural service scenario.

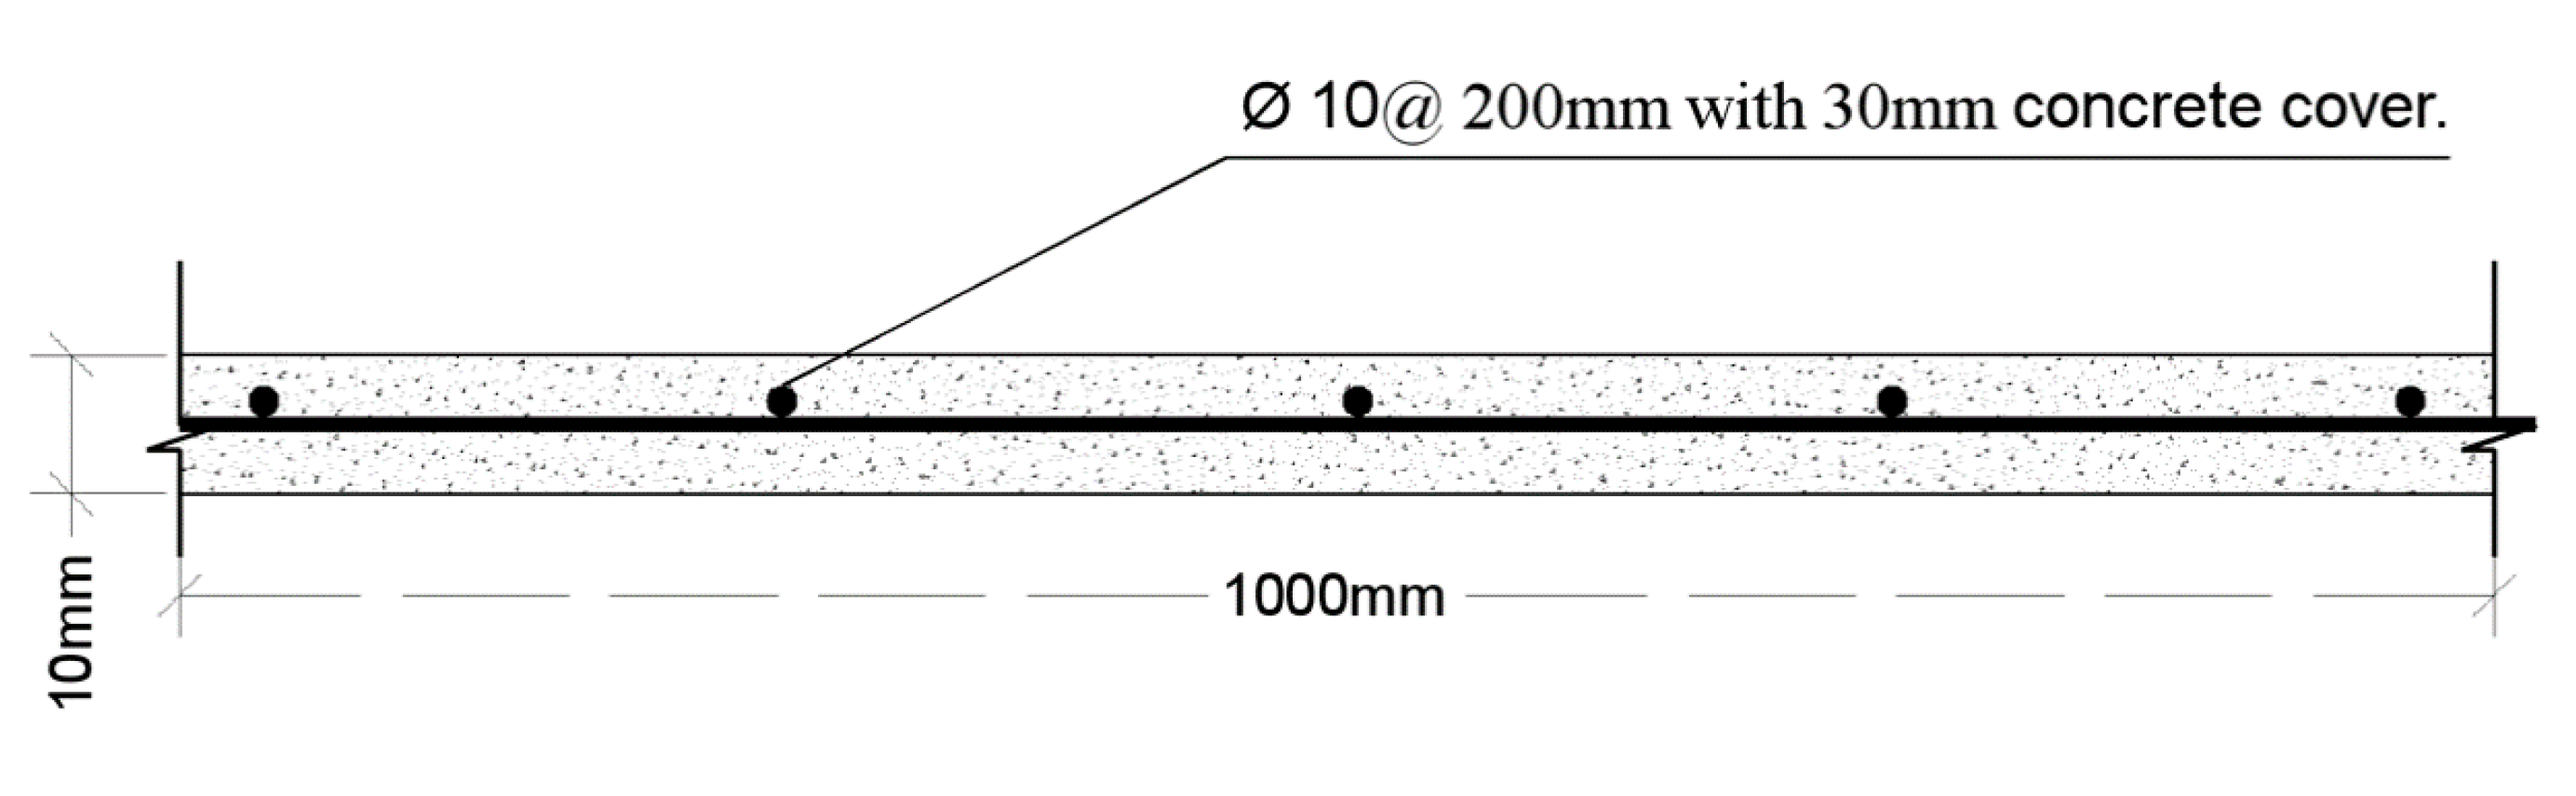
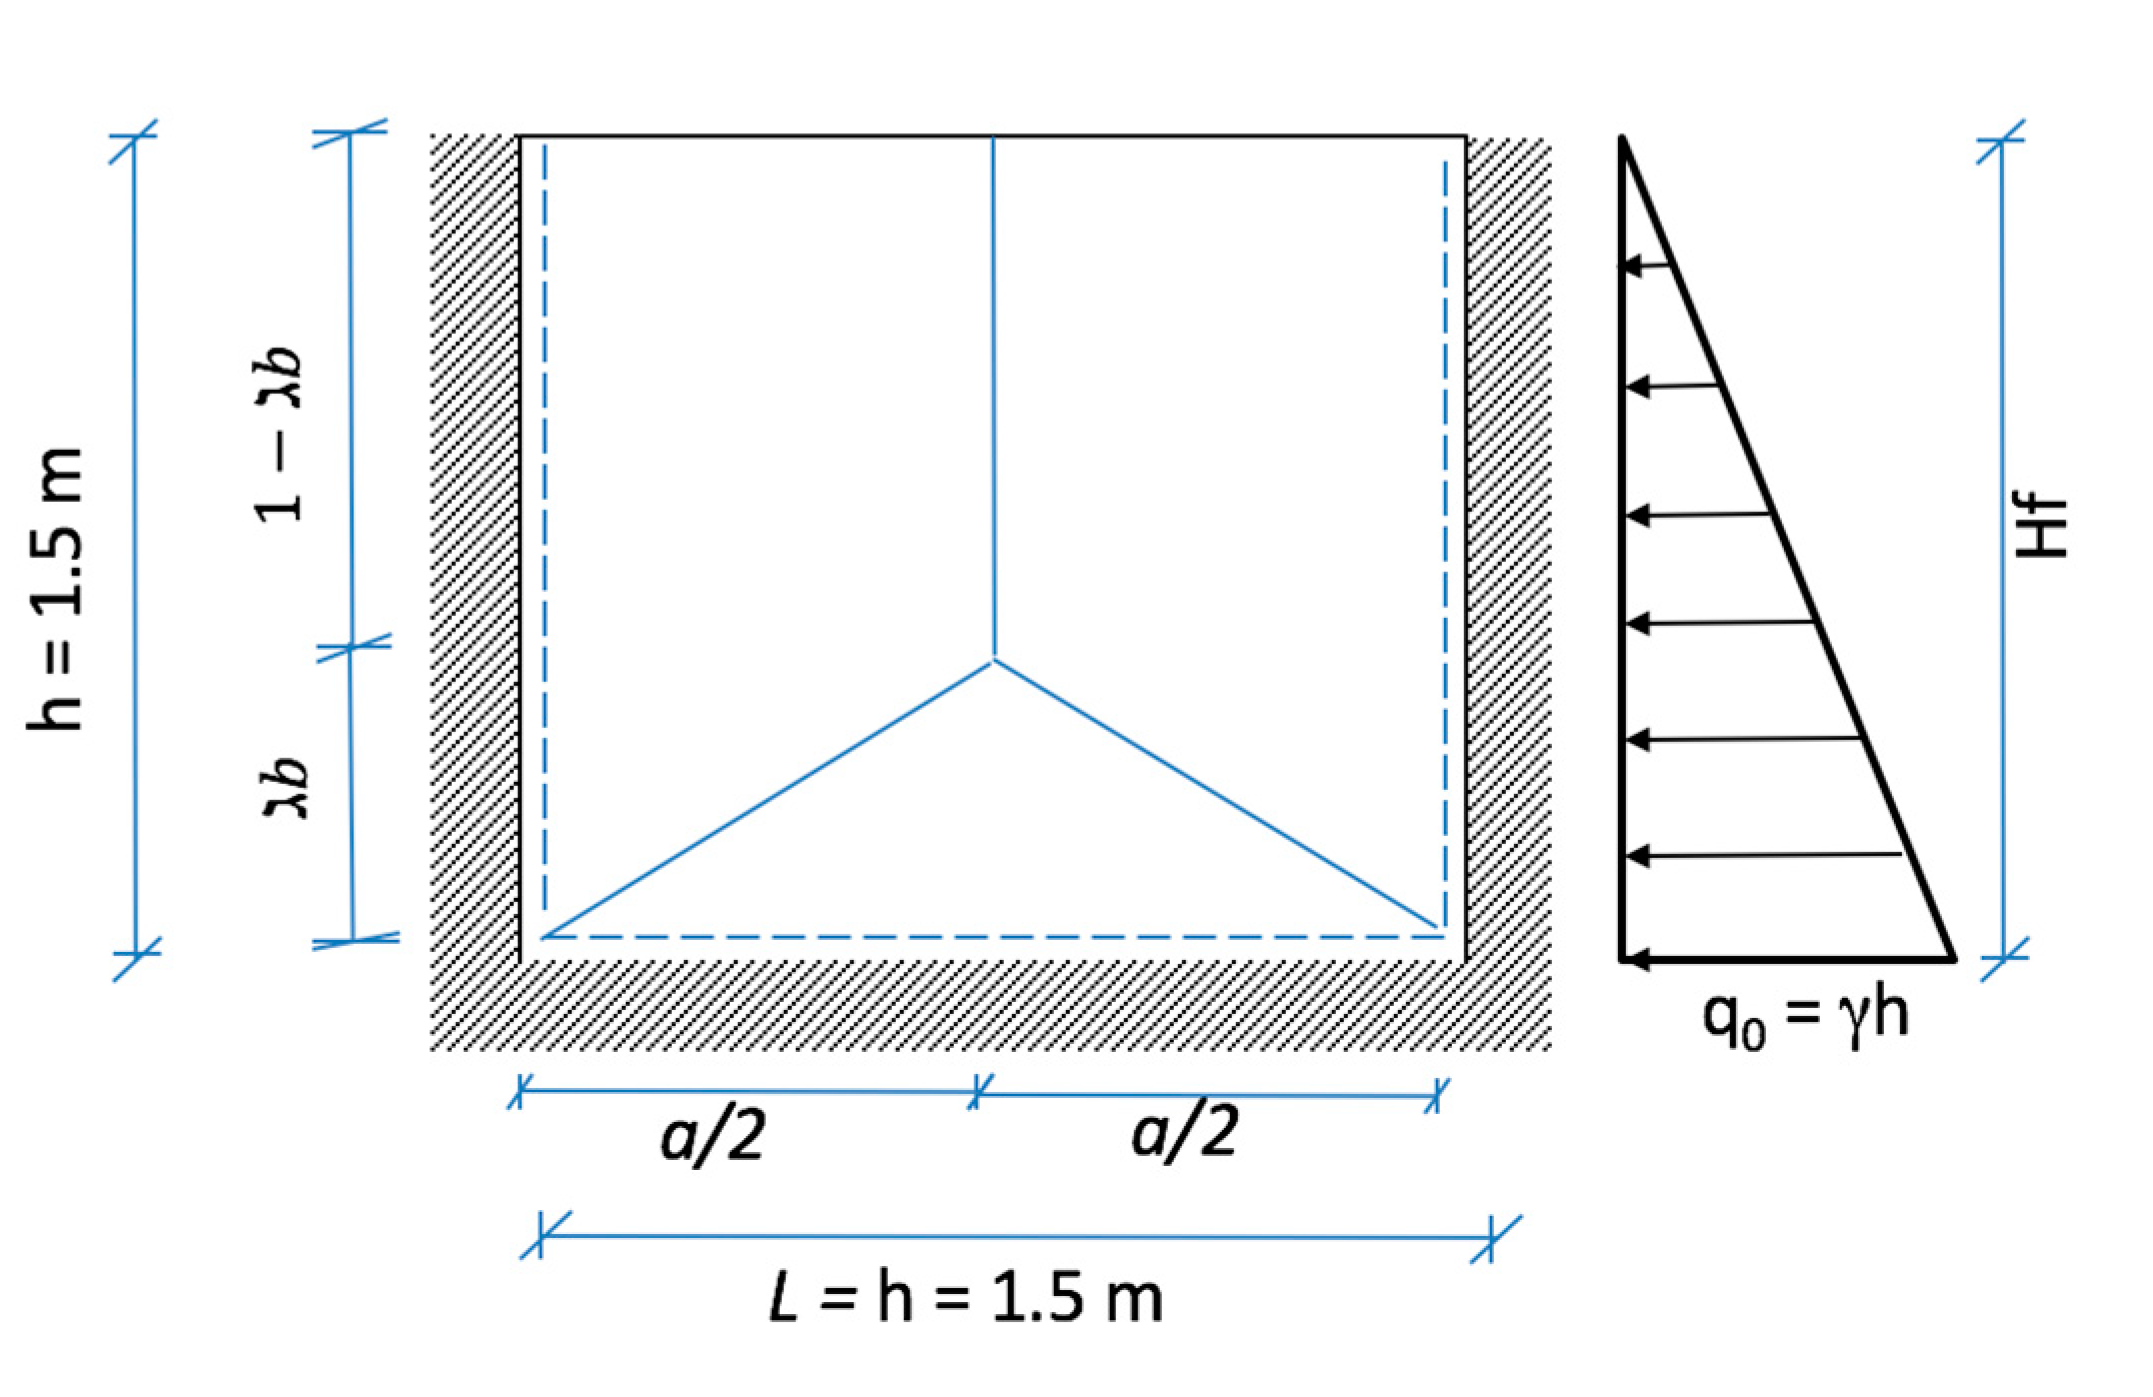
6.3. Cell 3: 30 mm Thick UHDC Slabs Supported by UHPC Cantilevers

For the last basin highlighted in light and dark green in Figure 1, precast slabs 30 mm thick were designed. The slabs, cast horizontally, are then lift vertically and fixed, through an on-site casting of UHPC, to the foundation along their bottom edge, and, along their sides, to buttress-like columns, by means of suitable UHPC dowel joints obtained through holes suitably left along the slab sides during their casting. The purpose of this solution, which really pushes to the boundary the use of UHPC materials, is to exploit the redistribution capacity of the strain-hardening fiber-reinforced material in a highly redundant structure, thus making possible, together with the structural optimization, a significant reduction in the used quantities of material and hence in the construction costs. Following the elastic plate theory [128], one can evaluate the two-way bending moments applied to the precast slab as designated in Figure 26 where the maximum bending value at the bottom of the slab is governing. Two types of analyses have been carried out for these slabs: sectional stress analysis, as for the second basin and yields line analysis as shown in Figure 27.
In the yields line analysis, a hydrostatic pressure of the water acting on the vertical wall is taken as the specific weight of the water γ as a function of the wall height, then the maximum height of the water (Hf) corresponding to the collapse mechanism shown in Figure 27 can be determined numerically for the following expression (as a function of unknown parameter λ).
H f = 12   M u λ a b ( a b . 1 λ + 2 b a + 4 λ b a ) + 3 b 2 + λ 2 b 4 ( 3 λ )
The function Hf(t) can be calculated by implementing MRd (t) in Equation (8).
The leaching degradation model have been implemented in the structural design algorithms, as above. The flexural moment degradation rates are plotted versus the time in Figure 28, whereas the ultimate height degradation rates (Hf), which are corresponded for the yield line mechanisms described in Figure 29, are plotted versus time.
The maximum deflection was evaluated over time as SLS, where the maximum deflection is considered at the middle of the panel and evaluated as illustrated below.
Max. deflection δ = 0.00097 qh4/D.
where D(t) = E [ 60 m m x c r i t ( t ) ] 3 12 ( 1 v 2 ) and q = γ H b with γ = 10   kN / m 3 , h = 1.5m the height of the basin wall, and b = 1.5 m, the width of the slab.
Figure 30 shows the evolution for the maximum deflection of the wall basin for HPC and UHPC.
A comparative analysis of the ULS vs. SLS behavior in the case of cell 2 (considered as statically determinate cantilever) and cell 3 (where the redundancy of the plate structure and its effects are considered not only on the stress redistribution capacity up to the ultimate state but also on the elastic deflection) clearly highlights the benefits of designing FRC and UHP(FR)C/UHDC structures in order to benefit from this redundancy also in terms of suitably slowing the degradation over time of the performance, also achieving a better balance between service state and failure.

7. Discussion and Conclusions

In this study, a Durability-Based Design approach has been formulated and applied to a pilot case study, consisting of a tank for water from a geothermal power plant, made of different concrete types and exposed to different degradation mechanisms. Ordinary concrete and ultra-high-performance concrete materials have been used in the design and construction of the pilot structure, which will be subjected to a 1.5 m maximum water height load, whereas the analyzed degradation mechanisms, which the structure is going to experience throughout its service life, include chloride-induced corrosion and acid erosion and leaching. The degradation effects have been implemented in the calculation of the flexural moment capacity of the basin walls, suitably calculated through sectional models and, in case, through yield line analysis. The final goal of the methodology is to allow the quantitative prediction of the expectable structure service life, meant as the time where, because of the anticipated degradation mechanism and kinetics, the required level of structural performance against the expected design actions is no longer satisfied.
Beyond the numerical details of the predicted service life values, which do actually strongly depend on the variability of the input data of the material “direct durability indicators”, the main novelty of the study stands in having incorporated a broader range of degradation mechanisms, including chloride-induced corrosion and acid attack, into the evaluation not only of the ultimate limit state capacity of the structure but also of its service state, which not seldom proved to govern not only the design of the structure but also the assessment of its end of life stage. This has included on the one hand the values to be taken into account of material performance direct durability indicators in the cracked state; on the other hand, the effects have been tentatively considered on the value of the same indicators of the crack self-sealing and material self-healing processes, as assessed through dedicated experimental investigations. This also represents a novel approach to pave the way towards consistent incorporation of self-healing benefits into durability-based design methods.
Moreover, if not even more important, to the authors’ knowledge, this study for the first time has attempted to apply the aforementioned service-life evaluation framework and approach to structures made of Ultra-High-Performance/Ultra-High-Durability Concrete (UHPC/UHDC). Besides confirming the expectable much better performance, in terms of significantly longer service life, of UHPC/UHDCs, the main conceptual advance of the performed work stands, in the authors’ opinion, in the different way in which the contribution of the tensile concrete has to be dealt with. The material paradigm shifts from a mere passive provider of protection against aggressive substances which may reach the reinforcement activating its corrosion process to an active player, also able to “self-govern” the evolution over time of its mechanical and durability properties and hence the structural durability performance, the latter being meant as the ability to maintain along its anticipated service life the intended level of performance against the target design actions.
While, on the one hand, such a conceptual framework needs to be validated against a suitable experimental testing and monitoring campaign of the pilot structure, which is on-going, the open issues are worth being highlighted; we were able to achieve this through the formulation and theoretical application of the approach presented in this study. The implemented degradation mechanisms for UHPC/UHDC materials have, as a matter of fact, relied on a quite simplistic assumption that, upon penetration of aggressive substances, the contribution of the attacked layers of material in the tensile zone has been progressively deleted from the calculation of the resistant bending moment capacity as well as from the contribution to the cross sectional and structural stiffness. While such an assumption is, though not realistic, still acceptable for ordinary reinforced concrete structures, where the material in the cover tensile zone is meant merely to provide protection to the reinforcement and its contribution hardly enters into formulae for the evaluation of the design performance, it can be overcautious in the case of UHPC/UHDCs, hindering its already evident benefits in terms of the enhancement of the structural durability and extension of the structural service life. This also affects life cycle analysis and cost evaluations, which are essential to truly appreciate the benefits of the aforementioned category of materials, overcoming the quite limiting and misleading concept of the actual cost of the material per cubic meter.
In this respect, a strong research need emerges of expanding the concept durability of the broad category under investigation to the evolution over time, under the intended structural service scenarios of their mechanical performance under tensile stresses, explicitly assessing, in this case, the persistence of the strain-hardening behavior and of its characteristic parameters, including strain capacity and crack spacing and width. Moreover, a detailed method is urgently needed for the calculation of crack width in the stable multiple crack propagation stage, which truly represents the real service scenarios for structures made of UHPC/UHDCs, and in the case retrofitted with them, so as to fully exploit the potential and the benefits obtainable from their capacity of smearing the damage state, otherwise localized into a single wider crack, into a set of tightly spaced narrow cracks, whose opening has by the way to be consistently predicted.
Figure 31 and Figure 32 finally summarize the main outputs of the application of the durability assessment-based design illustrated above in terms of predicted ultimate and serviceability “limit service-life” for each of the three basins that the case study structure herein investigated consists of. It can be clearly appreciated that the UHPC/UHDC materials can provide a substantial increase in the service life, with the 30-mm-thin precast elements, which also exploit, thanks to structural redundancy, the inborn stress redistribution capacity of fiber-reinforced materials, providing an even better performance as compared to the 60 mm monolithically cast in place one, thus representing an excellent solution to reduce the consumption of the material without compromising the structural integrity in terms of ultimate and serviceability limit state requirements and guaranteeing a much longer service life, with a positive impact on the life cycle cost and environment.

Author Contributions

Throughout the preparation of the manuscript M.L. and I.M. collected the data from the EGP power plant relevant for the degradation analysis and managed and supervised the pilot construction and monitoring; P.B. performed the analysis of the yield line mechanisms as well as conceived and designed the analysis tools and wrote Section 4 (materials and design action), L.F., who is also coordinator of the ReSHEALience Project in whose framework this work was performed, and S.A.-O. wrote the paper and performed the long term performance analysis as well as manuscript revisions. All authors have read and agreed to the published version of the manuscript.

Funding

The research activity reported in this paper has been performed in the framework of the ReSHEALience project (Rethinking coastal defence and Green-energy Service infrastructures through enHancEd-durAbiLity high-performance cement-based materials) which has received funding from the European Union’s Horizon 2020 research and innovation program under grant agreement No 760824. The information and views set out in this publication do not necessarily reflect the official opinion of the European Commission.

Conflicts of Interest

The authors declare no conflict of interest.

References

  1. Schmidt, M.; Fehling, E. (Eds.) Proceedings of the First International Symposium on Undefined Ultra High Performance Concrete (UHPC); kassel university press GmbH: Kassel, Germany, 2004. [Google Scholar]
  2. Fehling, E.; Schmidt, M.; Stuerwald, S. (Eds.) Proceedings of the Second International Symposium on Ultra High Performance Concrete; kassel university press GmbH: Kassel, Germany, 2008. [Google Scholar]
  3. Schmidt, M.; Fehling, E.; Glotzbach, C.; Fröhlich, S.; Piotrowski, S. (Eds.) Proceedings of the Third International Symposium on UHPC and Nanotechnology; kassel university press GmbH: Kassel, Germeny, 2012. [Google Scholar]
  4. Fehling, E.; Middendorf, B.; Thiemicke, J. Proceedings of the 4th International Symposium on Ultra-High Performance Concrete and High Performance Construction Materials; kassel university press GmbH: Kassel, Germeny, 2016. [Google Scholar]
  5. Abbas, S.; Nehdi, M.L.; Saleem, M.A. Ultra-High Performance Concrete: Mechanical Performance, Durability, Sustainability and Implementation Challenges. Int. J. Concr. Struct. Mater. 2016, 10, 271–295. [Google Scholar] [CrossRef] [Green Version]
  6. Shi, C.; Wang, D. (Eds.) Proceedings of the 1st International Conference on UHPC Materials and Structures; RILEM Pubs: Changsha, China, 2016; p. 631. [Google Scholar]
  7. Shi, C.; Chen, B. (Eds.) Proceedings of the 2nd International Conference on UHPC Materials and Structures (UHPC2018-China); RILEM Pubs: Fuzhou, China, 2018; p. 832. [Google Scholar]
  8. Eurocode 2: Design of Concrete Structures—Part 1: General Rules and Rules for Buildings (Together with UNITED Kingdom National Application Document). Available online: http://210.42.35.72/download/834f5d1e-c5d7-4bae-bec8-507fb2cab7f3.pdf (accessed on 21 September 2020).
  9. Matthews, S. CONREPNET: Performance-based approach to the remediation of reinforced concrete structures: Achieving durable repaired concrete structures. J. Build. Apprais. 2007, 3, 6–20. [Google Scholar] [CrossRef] [Green Version]
  10. Li, V.; Wu, H. Conditions for Pseudo Strain-Hardening in Fiber Reinforced Brittle Matrix Composites. Appl. Mech. Rev. Aug 1992, 45, 390–398. [Google Scholar] [CrossRef]
  11. Li, V.C.; Stang, H.; Krenchel, H. Micromechanics of crack bridging in fibre-reinforced concrete. Mater. Struct. 1993, 26, 486–494. [Google Scholar] [CrossRef]
  12. Li, V.C. On Engineered Cementitious Composites (ECC) A Review of the Material and Its Applications. J. Adv. Concr. Technol. 2003, 1, 215–230. [Google Scholar] [CrossRef] [Green Version]
  13. Naaman, A.E.; Reinhardt, H.W. Proposed classification of HPFRC composites based on their tensile response. Mater. Struct. Constr. 2006, 39, 547–555. [Google Scholar] [CrossRef]
  14. Baril, M.A.; Sorelli, L.; Réthoré, J.; Baby, F.; Toutlemonde, F.; Ferrara, L.; Bernardi, S.; Fafard, M. Effect of casting flow defects on the crack propagation in UHPFRC thin slabs by means of stereovision Digital Image Correlation. Constr. Build. Mater. 2016, 129, 182–192. [Google Scholar] [CrossRef]
  15. Di Prisco, M.; Ferrara, L.; Lamperti, M.G.L. Double edge wedge splitting (DEWS): An indirect tension test to identify post-cracking behaviour of fibre reinforced cementitious composites. Mater. Struct. Constr. 2013, 46, 1893–1918. [Google Scholar] [CrossRef]
  16. Ferrara, L.; Ozyurt, N.; Di Prisco, M. High mechanical performance of fibre reinforced cementitious composites: The role of “casting-flow induced” fibre orientation. Mater. Struct. Constr. 2011, 44, 109–128. [Google Scholar] [CrossRef]
  17. Ferrara, L.; Faifer, M.; Toscani, S. A magnetic method for non destructive monitoring of fiber dispersion and orientation in steel fiber reinforced cementitious composites-part 1: Method calibration. Mater. Struct. Constr. 2012, 45, 575–589. [Google Scholar] [CrossRef]
  18. Ferrara, L.; Faifer, M.; Muhaxheri, M.; Toscani, S. A magnetic method for non destructive monitoring of fiber dispersion and orientation in steel fiber reinforced cementitious composites. Part 2: Correlation to tensile fracture toughness. Mater. Struct. Constr. 2012, 45, 591–598. [Google Scholar] [CrossRef]
  19. Ferrara, L.; Cremonesi, M.; Faifer, M.; Toscani, S.; Sorelli, L.; Baril, M.A.; Réthoré, J.; Baby, F.; Toutlemonde, F.; Bernardi, S. Structural elements made with highly flowable UHPFRC: Correlating computational fluid dynamics (CFD) predictions and non-destructive survey of fiber dispersion with failure modes. Eng. Struct. 2017, 133, 151–171. [Google Scholar] [CrossRef]
  20. Ferrara, L.; Albertini, I.; Gettu, R.; Krelani, V.; Moscato, S.; Pirritano, F.; Flores, M.R.; Ros, P.S.; Theeda, S.M. Self Healing of cement based materials engineered through crystalline admixtures: Experimental results from a multinational university network. Spec. Publ. 2015, 305, 13.1–13.10. [Google Scholar]
  21. Ferrara, L.; Ferreira, S.R.; Krelani, V.; Torre, M.D.; Silva, F.; Filho, R.D.T. Natural fibres as promoters of autogeneous healing in HPFRCCS: Results from on-going Brazil-Italy cooperation. Spec. Publ. 2015, 305, 11.1–11.10. [Google Scholar]
  22. Zhang, Z.; Qian, S.; Ma, H. Investigating mechanical properties and self-healing behavior of micro-cracked ECC with different volume of fly ash. Constr. Build. Mater. 2014, 52, 17–23. [Google Scholar] [CrossRef]
  23. Şahmaran, M.; Li, V.C. Durability of mechanically loaded engineered cementitious composites under highly alkaline environments. Cem. Concr. Compos. 2008, 30, 72–81. [Google Scholar] [CrossRef]
  24. Lepech, M.D.; Li, V.C. Water permeability of engineered cementitious composites. Cem. Concr. Compos. 2009, 31, 744–753. [Google Scholar] [CrossRef]
  25. Plagué, T.; Desmettre, C.; Charron, J.P. Influence of fiber type and fiber orientation on cracking and permeability of reinforced concrete under tensile loading. Cem. Concr. Res. 2017, 94, 59–70. [Google Scholar] [CrossRef]
  26. Li, V.C.; Lim, Y.M.; Chan, Y.W. Feasibility study of a passive smart self-healing cementitious composite. Compos. Part B Eng. 1998, 29, 819–827. [Google Scholar] [CrossRef]
  27. Özbay, E.; Šahmaran, M.; Lachemi, M.; Yücel, H.E. Self-Healing of Microcracks in High-Volume Fly-Ash-Incorporated Engineered Cementitious Composites. ACI Mater. J. 2013, 110, 33–43. [Google Scholar]
  28. Kim, D.; Kang, S.; Ahn, T.-H. Mechanical Characterization of High-Performance Steel-Fiber Reinforced Cement Composites with Self-Healing Effect. Materials (Basel) 2014, 7, 508–526. [Google Scholar] [CrossRef] [Green Version]
  29. Ferrara, L. Tailoring the orientation of fibres in high performance fibre reinforced cementitious composites: Part 2—Correlation to mechanical properties and design implications. Int. J. Mater. Struct. Integr. 2015, 9, 92–107. [Google Scholar] [CrossRef]
  30. Ferrara, L. Tailoring the orientation of fibres in high performance fibre reinforced cementitious composites: Part 1—Experimental evidence, monitoring and prediction. Int. J. Mater. Struct. Integr. 2015, 9, 72–91. [Google Scholar] [CrossRef]
  31. Krelani, V.; Krelani, V.; Moretti, F. Autogenous healing on the recovery of mechanical performance of High Performance Fibre Reinforced Cementitious Composites (HPFRCCs): Part 2—Correlation between healing of mechanical performance and crack sealing. Cem. Concr. Compos. 2016, 73, 299–315. [Google Scholar] [CrossRef]
  32. Şahmaran, M.; Yildirim, G.; Noori, R.; Ozbay, E.; Lachemi, M. Repeatability and pervasiveness of self-healing in engineered cementitious composites. ACI Mater. J. 2015, 112, 513–522. [Google Scholar] [CrossRef] [Green Version]
  33. Sahmaran, M.; Li, M.; Li, V.C. Transport properties of engineered cementitious composites under chloride exposure. ACI Mater. J. 2007, 104, 604–611. [Google Scholar] [CrossRef]
  34. Siad, H.; Alyousif, A.; Keskin, O.K.; Keskin, S.B.; Lachemi, M.; Sahmaran, M.; Hossain, K.M.A. Influence of limestone powder on mechanical, physical and self-healing behavior of Engineered Cementitious Composites. Constr. Build. Mater. 2015, 99, 1–10. [Google Scholar] [CrossRef]
  35. Yildirim, G.; Keskin, Ö.K.; Keskin, S.B.I.; Şahmaran, M.; Lachemi, M. A review of intrinsic self-healing capability of engineered cementitious composites: Recovery of transport and mechanical properties. Constr. Build. Mater. 2015, 101, 10–21. [Google Scholar] [CrossRef]
  36. Yildirim, G.; Alyousif, A.; Şahmaran, M.; Lachemi, M. Assessing the self-healing capability of cementitious composites under increasing sustained loading. Adv. Cem. Res. 2015, 27, 581–592. [Google Scholar] [CrossRef]
  37. Qian, S.; Zhou, J.; de Rooij, M.R.; Schlangen, E.; Ye, G.; van Breugel, K. Self-healing behavior of strain hardening cementitious composites incorporating local waste materials. Cem. Concr. Compos. 2009, 31, 613–621. [Google Scholar] [CrossRef]
  38. Yildirim, G.; Sahmaran, M.; Ahmed, H.U. Influence of Hydrated Lime Addition on the Self-Healing Capability of High-Volume Fly Ash Incorporated Cementitious Composites. J. Mater. Civ. Eng. 2015, 27, 04014187. [Google Scholar] [CrossRef]
  39. Yildirim, G.; Aras, G.H.; Banyhussan, Q.S.; Şahmaran, M.; Lachemi, M. Estimating the self-healing capability of cementitious composites through non-destructive electrical-based monitoring. NDT E Int. 2015, 76, 26–37. [Google Scholar] [CrossRef]
  40. Yildirim, G.; Sahmaran, M.; Balcikanli, M.; Ozbay, E.; Lachemi, M. Influence of cracking and healing on the gas permeability of cementitious composites. Constr. Build. Mater. 2015, 85, 217–226. [Google Scholar] [CrossRef]
  41. Snoeck, D.; De Belie, N. Repeated Autogenous Healing in Strain-Hardening Cementitious Composites by Using Superabsorbent Polymers. J. Mater. Civ. Eng. 2016, 28, 04015086. [Google Scholar] [CrossRef] [Green Version]
  42. Cuenca, E.; Ferrara, L. Self-healing capacity of fiber reinforced cementitious composites. State of the art and perspectives. KSCE J. Civ. Eng. 2017, 21, 2777–2789. [Google Scholar] [CrossRef]
  43. Yang, Y.; Lepech, M.D.; Yang, E.H.; Li, V.C. Autogenous healing of engineered cementitious composites under wet-dry cycles. Cem. Concr. Res. 2009, 39, 382–390. [Google Scholar] [CrossRef]
  44. Yang, Y.; Yang, E.H.; Li, V.C. Autogenous healing of engineered cementitious composites at early age. Cem. Concr. Res. 2011, 41, 176–183. [Google Scholar] [CrossRef]
  45. Li, M.; Li, V.C. Cracking and healing of engineered cementitious composites under chloride environment. ACI Mater. J. 2011, 108, 333–340. [Google Scholar] [CrossRef]
  46. Nishiwaki, T.; Koda, M.; Yamada, M.; Mihashi, H.; Kikuta, T. Experimental Study on Self-Healing Capability of FRCC Using Different Types of Synthetic Fibers. J. Adv. Concr. Technol. 2012, 10, 195–206. [Google Scholar] [CrossRef] [Green Version]
  47. Nishiwaki, T.; Kwon, S.; Homma, D.; Yamada, M.; Mihashi, H. Self-Healing Capability of Fiber-Reinforced Cementitious Composites for Recovery of Watertightness and Mechanical Properties. Materials (Basel) 2014, 7, 2141–2154. [Google Scholar] [CrossRef] [Green Version]
  48. Wu, M.; Johannesson, B.; Geiker, M. A review: Self-healing in cementitious materials and engineered cementitious composite as a self-healing material. Constr. Build. Mater. 2012, 28, 571–583. [Google Scholar] [CrossRef]
  49. Ozbay, E.; Sahmaran, M.; Yucel, H.E.; Erdem, T.K.; Lachemi, M.; Li, V.C. Effect of Sustained Flexural Loading on Self-Healing of Engineered Cementitious Composites. J. Adv. Concr. Technol. 2013, 11, 167–179. [Google Scholar] [CrossRef] [Green Version]
  50. Qiu, F.-X.J.; He, S.; Wang, Q.; Su, H.; Yang, E.H.; Qiu, J.; He, S.; Wang, Q.; Su, H.; Yang, E.-H. Numerical Investigation of Factors Influencing the experimental Determination Of Concrete Fracture energy. In Proceedings of the 10th International Conference on Fracture Mechanics of Concrete and Concrete Structures Autogenous Healing of Fiber/Matrix Interface and Its Enhancement, Bayonne, France, 23–26 June 2019. [Google Scholar] [CrossRef]
  51. Graybeal, B. Design and Construction of Field-Cast UHPC Connections; No. FHWA-HRT-14-084; HRDI-40/10-14(750); Federal Highway Administration: Washington, DC, USA, 2014. [Google Scholar]
  52. Walraven, J. Fib model code for concrete structures 2010: Mastering challenges and encountering new ones. Struct. Concr. 2013, 14, 3–9. [Google Scholar] [CrossRef]
  53. Serna, P.; Navarro-Gregori, J.; Camacho, E. An inverse analysis method based on deflection to curvature transformation to determine the tensile properties of UHPFRC. Mater. Struct. Constr. 2015, 48, 3703–3718. [Google Scholar] [CrossRef]
  54. López, J.Á.; Serna, P.; Navarro-Gregori, J.; Coll, H. A simplified five-point inverse analysis method to determine the tensile properties of UHPFRC from unnotched four-point bending tests. Compos. Part B Eng. 2016, 91, 189–204. [Google Scholar] [CrossRef]
  55. BSI Standards Publication Concrete-Specification, Performance, Production and Conformity; Br.Stand 2013. Available online: https://www.academia.edu/40697042/BSI_Standards_Publication_Concrete_Specification_performance_production_and_conformity (accessed on 11 May 2020).
  56. National Addition to Eurocode 2-Design of Concrete Structures: Specific Rules for Ultra-High Performance Fibre-Reinforced Concrete (UHPFRC). Available online: https://www.diva-portal.org (accessed on 13 November 2020).
  57. Gowripalan, N.; Gilbert, R.I. Design Guidelines for Ductal Prestressed Concrete Beams; Design Guide; University of NSW: Sydney, Australia, 2000. [Google Scholar]
  58. Canadian Standards Association CSA A23.1/2 Annex S on Ultra-High Performance Concrete. Available online: https://www.concretefloors.ca/?page_id=708 (accessed on 13 November 2020).
  59. Schmidt, M.; Leutbecher, T.; Piotrowski, S.; Wiens, U. THE GERMAN GUIDELINE FOR ULTRA-HIGH PERFORMANCE CONCRETE. In Proceedings of the FGC-ACI-fib-RILEM Int. Symposium on Ultra-High Performance Fibre-Reinforced Concrete, Montpellier, France, 2–4 October 2017. [Google Scholar]
  60. Buttignol, T.E.T.; Sousa, J.L.A.O.; Bittencourt, T.N. Ultra High-Performance Fiber-Reinforced Concrete (UHPFRC): A review of material properties and design procedures. Rev. IBRACON Estrut. Mater. 2017, 10, 957–971. [Google Scholar] [CrossRef] [Green Version]
  61. BFUHP—Bétons Fibrés à Ultra Hautes Performances. Available online: https://ibeton.ch/recherrch/BFUHP/Default.asp (accessed on 13 November 2020).
  62. ReSHEALience. Available online: https://uhdc.eu/ (accessed on 21 September 2020).
  63. Biondini, F.; Bontempi, F.; Frangopol, D.M.; Malerba, P.G. Probabilistic Service Life Assessment and Maintenance Planning of Concrete Structures. J. Struct. Eng. 2006, 132, 810–825. [Google Scholar] [CrossRef]
  64. Biondini, F.; Bontempi, F.; Frangopol, D.M.; Malerba, P.G. Cellular Automata Approach to Durability Analysis of Concrete Structures in Aggressive Environments. J. Struct. Eng. 2004, 130, 1724–1737. [Google Scholar] [CrossRef] [Green Version]
  65. Biondini, F.; Frangopol, D.M. Life-cycle performance of deteriorating structural systems under uncertainty: Review. J. Struct. Eng. (United States) 2016, 142, F4016001. [Google Scholar] [CrossRef]
  66. Biondini, F.; Camnasio, E.; Palermo, A. Structure and Infrastructure Engineering Maintenance, Management, Life-Cycle Design and Performance Lifetime seismic performance of concrete bridges exposed to corrosion Lifetime seismic performance of concrete bridges exposed to corrosion. Taylor Fr. 2013, 10, 880–900. [Google Scholar] [CrossRef]
  67. Biondini, F.; Frangopol, D.M. Lifetime reliability-based optimization of reinforced concrete cross-sections under corrosion. Struct. Saf. 2009, 31, 483–489. [Google Scholar] [CrossRef]
  68. Biondini, F.; Vergani, M. Deteriorating beam finite element for nonlinear analysis of concrete structures under corrosion. Struct. Infrastruct. Eng. 2015, 11, 519–532. [Google Scholar] [CrossRef]
  69. Cuenca, E.; Criado, M.; Gimenez, M.; Alonso, M.C.; Ferrara, L. Durability of ultra-high performance fiber reinforced cementitious composites exposed to chemically aggressive environments: Up-grading to ultra-high durability concrete through nano-constituents. Cem. Concr. Compos. 2020. submitted. [Google Scholar]
  70. Cuenca, E.; Mezzena, A.; Ferrara, L. Synergy between crystalline admixtures and nano-constituents in enhancing autogenous healing capacity of cementitious composites under cracking and healing cycles in aggressive waters. Constr. Build. Mater. 2020, in press. [Google Scholar] [CrossRef]
  71. Cuenca, E.; D’Ambrosio, L.; Lizunov, D.; Tretjakov, A.; Volobujeva, O.; Ferrara, L. Mechanical properties and self-healing capacity of Ultra High Performance Fibre Reinforced Concrete with alumina nanofibers: Tailoring Ultra High Durability Concrete for aggressive exposure scenarios. Cem. Concr. Compos. 2020. submitted. [Google Scholar]
  72. Deze, E.G.; Cuenca, E.; Násner, M.A.; Iakovlev, M.; Sideria, S.; Sapalidis, A.; Borg, R.P.; Nanocellulose, L.F. Containing concretes: Evaluation of NC properties affecting UHDC & Development of mixing protocols. Mater. Today Proc. 2020, in press. [Google Scholar]
  73. DNVGL-ST-C502 Offshore Concrete Structures—DNV GL. Available online: https://oilgas.standards.dnvgl.com/download/dnvgl-st-c502-offshore-concrete-structures (accessed on 21 September 2020).
  74. Westendarp, A. ZTV-W LB 215 Aspekte zu Beton und Bauausführung. In Bundesanstalt fur Wasserbau (Hg.): Wasserbauwerke nach Neuer Norm; Bundesanstalt fur Wasserbau: Karlsruhe, Germany, 2004; pp. 19–25. [Google Scholar]
  75. Rilem, T.C. 178-TMC: “Testing and modelling chloride penetration in concrete”—Analysis of total chloride content in concrete. Mater. Struct. Constr. 2002, 35, 583–585. [Google Scholar] [CrossRef]
  76. Depth of Penetration of Water under Pressure, British Standards Institution. BS EN 12390-8:2019 Testing Hardened Concrete; Depth of Penetration of Water under Pressure, British Standards Institution—Publication Index|NBS: London, UK, 2019. [Google Scholar]
  77. Cuenca, E.; Tejedor, A.; Ferrara, L. A methodology to assess crack-sealing effectiveness of crystalline admixtures under repeated cracking-healing cycles. Constr. Build. Mater. 2018, 179, 619–632. [Google Scholar] [CrossRef]
  78. Cuenca, E.; Rigamonti, S.; Gastaldo Brac, E.M.; Ferrara, L. Crystalline admixture as healing promoter in concrete exposed to chloride-rich environments: An experimental study. ASCE J. Mater. Civ. Eng. 2020, in press. [Google Scholar] [CrossRef]
  79. Lo Monte, F.; Ferrara, L. Tensile behaviour identification in Ultra-High Performance Fibre Reinforced Cementitious Composites: Indirect tension tests and back-analysis of flexural test resylts. Mater. Struct. 2020, in press. [Google Scholar]
  80. Bamonte, P.; Al-Obaidi, S.; Animato, F.; Lo Monte, F.; Mazzantini, I.; Ferrara, L. An innovative design concept for aggressive water tanks with Ultra High Durability Concrete: Pilot material and structural validation by H2020 ReSHEALience project. Sustainability 2021. under review. [Google Scholar]
  81. Van Belleghem, B.; Van den Heede, P.; Van Tittelboom, K.; De Belie, N.D. Quantification of the service life extension and environmental benefit of Chloride Exposed Self-Healing Concrete. Materials (Basel) 2017, 10, 5. [Google Scholar] [CrossRef] [Green Version]
  82. Maes, M.; Snoeck, D.; De Belie, N. Chloride penetration in cracked mortar and the influence of autogenous crack healing. Constr. Build. Mater. 2016, 115, 114–124. [Google Scholar] [CrossRef]
  83. Darquennes, A.; Olivier, K.; Benboudjema, F.; Gagné, R. Self-healing at early-age, a way to improve the chloride resistance of blast-furnace slag cementitious materials. Constr. Build. Mater. 2016, 113, 1017–1028. [Google Scholar] [CrossRef]
  84. D3.2—Definition of Key Durability Parameters for Each Scenario—ReSHEALience. Available online: https://uhdc.eu/documentation/d3-2-definition-of-key-durability-parameters-for-each-scenario/ (accessed on 21 September 2020).
  85. Ann, K.Y.; Song, H.W. Chloride threshold level for corrosion of steel in concrete. Corros. Sci. 2007, 49, 4113–4133. [Google Scholar] [CrossRef]
  86. Angst, U.; Elsener, B.; Larsen, C.K.; Vennesland, Ø. Critical chloride content in reinforced concrete—A review. Cem. Concr. Res. 2009, 39, 1122–1138. [Google Scholar] [CrossRef]
  87. Alonso, M.C.; Sanchez, M. Analysis of the variability of chloride threshold values in the literature. Mater. Corros. 2009, 60, 631–637. [Google Scholar] [CrossRef]
  88. Angst, U.M.; Geiker, M.R.; Michel, A.; Gehlen, C.; Wong, H.; Isgor, O.B.; Elsener, B.; Hansson, C.M.; François, R.; Hornbostel, K.; et al. The steel–concrete interface. Mater. Struct. Constr. 2017, 50. [Google Scholar] [CrossRef]
  89. Shafikhani, M.; Chidiac, S.E. Quantification of concrete chloride diffusion coefficient—A critical review. Cem. Concr. Compos. 2019, 99, 225–250. [Google Scholar] [CrossRef]
  90. Djerbi, A.; Bonnet, S.; Khelidj, A.; Baroghel-bouny, V. Influence of traversing crack on chloride diffusion into concrete. Cem. Concr. Res. 2008, 38, 877–883. [Google Scholar] [CrossRef] [Green Version]
  91. Win, P.P.; Watanabe, M.; Machida, A. Penetration profile of chloride ion in cracked reinforced concrete. Cem. Concr. Res. 2004, 34, 1073–1079. [Google Scholar] [CrossRef]
  92. Konin, A.; François, R.; Arliguie, G. Penetration of chlorides in relation to the microcracking state into reinforced ordinary and high strength concrete. Mater. Struct. Constr. 1996, 31, 310–316. [Google Scholar] [CrossRef]
  93. Gowripalan, N.; Sirivivatnanon, V.; Lim, C.C. Chloride diffusivity of concrete cracked in flexure. Cem. Concr. Res. 2000, 30, 725–730. [Google Scholar] [CrossRef]
  94. Thomas, M.; Green, B.; O’Neal, E.; Perry, V.; Hayman, S.; Hossack, A. Marine performance of UHPC at Treat Island. In Proceedings of the 3rd International Symposium on UHPC and Nanotechnology for High Performance Construction Materials, Kassel, Germany, 7–9 March 2012. [Google Scholar]
  95. Ideker, J.H. ACI 201 ACI 201—Guide to Durable Concrete Guide to Durable Concrete. ACI Mater. J. 1991, 88, 544–582. [Google Scholar]
  96. Corrosion of Prestressing Steels. Available online: http://civilwares.free.fr/ACI/MCP04/2222r_01.pdf (accessed on 21 September 2020).
  97. ACI Committee 318. Building Code Requirements for Structural Concrete (ACI 318-08) and Commentary. Available online: http://dl.mycivil.ir/dozanani/ACI/ACI%20318-08%20Building%20Code%20Requirements%20for%20Structural%20Concrete%20(ACI%20318-08)%20and%20Commentary_MyCivil.ir.pdf (accessed on 21 September 2020).
  98. BS 8110. Available online: https://www.concretecentre.com/Codes/BS-8110.aspx (accessed on 21 September 2020).
  99. Critical Chloride Content in Reinforced Concrete. 2008. ISBN 9788253610764. Available online: www.coinweb.no (accessed on 21 September 2020).
  100. Hope, B.; Journal, A.I.-M. Chloride Corrosion Threshold in Concrete. 1987. Available online: concrete.org (accessed on 1 October 2020).
  101. Everett, L.; Treadaway, K. Deterioration due to Corrosion in Reinforced Concrete; Building research establishment: Watford, UK, 1980. [Google Scholar]
  102. Thomas, M. Chloride Thresholds in Marine Concrete; Elsevier: Amsterdam, The Netherlands, 1996. [Google Scholar]
  103. Hussain, S.; Journal, A.A.-G.-M. Chloride Threshold for Corrosion of Reinforcement in Concrete. 1996. Available online: concrete.org (accessed on 1 October 2020).
  104. Page, C.L.; Havdahl, J. Electrochemical monitoring of corrosion of steel in microsilica cement pastes. Mater. Struct. 1985, 18, 41–47. [Google Scholar] [CrossRef]
  105. Stratfull, R.F.; Jurkovich, W.J.; Spellman, D.L. Corrosion Testing of Bridge Decks. In Proceedings of the 54th Annual Meeting of the Transportation Research Board, Washington, DC, USA, 13–17 January 1975. [Google Scholar]
  106. Šavija, B.; Schlangen, E.; Pacheco, J.; Millar, S.; Eichler, T.; Wilsch, G. Chloride ingress in cracked concrete: A laser induced breakdown spectroscopy (LIBS) study. J. Adv. Concr. Technol. 2014, 12, 425–442. [Google Scholar] [CrossRef] [Green Version]
  107. Borg, R.P.; Cuenca, E.; Gastaldo Brac, E.M.; Ferrara, L. Crack sealing capacity in chloride-rich environments of mortars containing different cement substitutes and crystalline admixtures. J. Sustain. Cem. Mater. 2018, 7, 141–159. [Google Scholar] [CrossRef]
  108. Val, D.V.; Melchers, R.E. Reliability of Deteriorating RC Slab Bridges. J. Struct. Eng. 1997, 123, 1638–1644. [Google Scholar] [CrossRef]
  109. Vu, K.A.T.; Stewart, M.G. Structural reliability of concrete bridges including improved chloride-induced corrosion models. Struct. Saf. 2000, 22, 313–333. [Google Scholar] [CrossRef]
  110. Val, D.V.; Stewart, M.G. Life-cycle cost analysis of reinforced concrete structures in marine environments. Struct. Saf. 2003, 25, 343–362. [Google Scholar] [CrossRef]
  111. Marcos-Meson, V.; Michel, A.; Solgaard, A.; Fischer, G.; Edvardsen, C.; Skovhus, T.L. Corrosion resistance of steel fibre reinforced concrete—A literature review. Cem. Concr. Res. 2018, 103, 1–20. [Google Scholar] [CrossRef] [Green Version]
  112. Marcos-Meson, V.; Solgaard, A.; Fischer, G.; Edvardsen, C.; Michel, A. Pull-out behaviour of hooked-end steel fibres in cracked concrete exposed to wet-dry cycles of chlorides and carbon dioxide—Mechanical performance. Constr. Build. Mater. 2020, 240, 117764. [Google Scholar] [CrossRef]
  113. Homma, D.; Mihashi, H.; Nishiwaki, T. Self-Healing Capability of Fibre Reinforced Cementitious Composites. J. Adv. Concr. Technol. 2009, 7, 217–228. [Google Scholar] [CrossRef] [Green Version]
  114. Bensted, J.; Brough, A.; Composites, M.P. Chemical Degradation of Concrete. 2007. Available online: books.google.com (accessed on 1 October 2020).
  115. Menéndez, E.; Matschei, T.; Glasser, F.P. Sulfate attack of concrete. RILEM State Art Rep. 2013, 10, 7–74. [Google Scholar] [CrossRef]
  116. Santhanam, M.; Cohen, M.D.; Olek, J. Sulfate attack research—Whither now? Cem. Concr. Res. 2001, 31, 845–851. [Google Scholar] [CrossRef]
  117. Kurtis, K.E.; Monteiro, P.J.M.; Madanat, S.M. Empirical models to predict concrete expansion caused by sulfate attack. ACI Struct. J. 2000, 97, 156–161. [Google Scholar] [CrossRef]
  118. Monteiro, P.J.M.; Kurtis, K.E. Time to failure for concrete exposed to severe sulfate attack. Cem. Concr. Res. 2003, 33, 987–993. [Google Scholar] [CrossRef]
  119. Barcelo, L.; Gartner, E.; Barbarulo, R.; Hossack, A.; Ahani, R.; Thomas, M.; Hooton, D.; Brouard, E.; Delagrave, A.; Blair, B. A modified ASTM C1012 procedure for qualifying blended cements containing limestone and SCMs for use in sulfate-rich environments. Cem. Concr. Res. 2014, 63, 75–88. [Google Scholar] [CrossRef]
  120. Hossack, A.M.; Thomas, M.D.A. Evaluation of the effect of tricalcium aluminate content on the severity of sulfate attack in Portland cement and Portland limestone cement mortars. Cem. Concr. Compos. 2015, 56, 115–120. [Google Scholar] [CrossRef]
  121. De Belie, N.; De Coster, V.; Van Nieuwenburg, D. Use of fly ash or silica fume to increase the resistance of concrete to feed acids. Mag. Concr. Res. 1997, 49, 337–344. [Google Scholar] [CrossRef]
  122. Fagerlund, G. Contecvet a Validated Users Manual for Assessing the Residual Service Life of Concrete Structures Leaching of Concrete the leaching process. In Extrapolation of Deterioration; Effect on the Structural Stability; Report TVBM-3091; Division of Building Materials Lund Institute of Technology: Lund, Sweden, 2000. [Google Scholar]
  123. Matte, V.; Moranville, M.; Adenot, F.; Richet, C.; Torrenti, J.M. Simulated microstructure and transport properties of ultra-high performance cement-based materials. Cem. Concr. Res. 2000, 30, 1947–1954. [Google Scholar] [CrossRef]
  124. Maltais, Y.; Samson, E.; Marchand, J. Predicting the durability of Portland cement systems in aggressive environments—Laboratory validation. Cem. Concr. Res. 2004, 34, 1579–1589. [Google Scholar] [CrossRef]
  125. Alonso, C.; Castellote, M.; Llorente, I.; Andrade, C. Ground water leaching resistance of high and ultra high performance concretes in relation to the testing convection regime. Cem. Concr. Res. 2006, 36, 1583–1594. [Google Scholar] [CrossRef]
  126. CEN (European Committee for Standardization). EN 1992-1-1: Eurocode 2: Design of Concrete Structures—Part 1-1: General Rules and Rules for Buildings; European Committee for Standardization: Brussels, Belgium, 2004. [Google Scholar]
  127. Hay, R.; Ostertag, C.P. Acidification at rebar-concrete interface induced by accelerated corrosion test in aggressive chloride environment. Cem. Concr. Compos. 2020, 110, 103573. [Google Scholar] [CrossRef]
  128. Timoshenko, S.P.; Woinowsky-Krieger, S. Theory of Plates and Shells; McGraw-Hill: New York, NY, USA, 1959. [Google Scholar]
Figure 1. Conceptual approach of the proposed Durability Assessment-based Design (DAD).
Infrastructures 05 00102 g001
Figure 2. Schematic layout of a geothermal power plant basin.
Infrastructures 05 00102 g002
Figure 3. Pictures of the pilot basin, taken on 13 February 2020 (a) and on 4 August 2020 when a full load test was performed filling the three compartments (b).
Infrastructures 05 00102 g003
Figure 4. Image of geothermal tower cooling water rain.
Infrastructures 05 00102 g004
Figure 5. (a,b). Damaged reinforced concrete superstructures in geothermal cooling towers (c). Evidence of expansive products in a retrofitted beam.
Infrastructures 05 00102 g005
Figure 6. Schematic of the test set-up employed for 4-point bending tests on deep and thin beams (a) and for the Double Edge Wedge Splitting test (b).
Infrastructures 05 00102 g006
Figure 7. Maximum nominal stress in bending as a function of the Crack Opening Displacement for (a) Deep Beams (DB); and (b) Thin Beams (TB); tensile nominal stress vs. Crack Opening Displacement curves as obtained from DEWS tests (favorable (c) vs. unfavorable (d) alignment of the fibers).
Infrastructures 05 00102 g007
Figure 8. Penetration depth versus time for different type of concrete.
Infrastructures 05 00102 g008
Figure 9. Leaching depth versus time for different type of concrete.
Infrastructures 05 00102 g009
Figure 10. Erosion depth versus time for different type of concrete.
Infrastructures 05 00102 g010
Figure 11. Performance levels versus time for different types of concrete and stages.
Infrastructures 05 00102 g011
Figure 12. Load acting on the wall basin (a) at service limit state(SLS) level, and (b) at the ultimate limit state (ULS) level.
Infrastructures 05 00102 g012
Figure 13. Cross section of reinforced concrete wall.
Infrastructures 05 00102 g013
Figure 14. Evolution of the resistant bending moment capacity of basin walls in case of chloride-induced corrosion for different types of concrete and stages.
Infrastructures 05 00102 g014
Figure 15. Erosion degradation curves versus time for different types of concrete and stages.
Infrastructures 05 00102 g015
Figure 16. Leaching degradation curves versus time for different types of concrete and stages.
Infrastructures 05 00102 g016
Figure 17. Corrosion degradation curves versus time for steel and concrete stresses.
Infrastructures 05 00102 g017
Figure 18. Leaching and Erosion degradation curves versus time for steel and concrete stresses.
Infrastructures 05 00102 g018
Figure 19. UHDC cross section analysis and stress distributions.
Infrastructures 05 00102 g019
Figure 20. Corrosion degradation curves versus time for different types of concrete.
Infrastructures 05 00102 g020
Figure 21. Leaching degradation curves versus time for different types of concrete.
Infrastructures 05 00102 g021
Figure 22. Erosion degradation curves versus time for different types of concrete.
Infrastructures 05 00102 g022
Figure 23. Leaching degradation curves versus time for different types of concrete.
Infrastructures 05 00102 g023
Figure 24. Erosion degradation curves versus time for different types of concrete.
Infrastructures 05 00102 g024
Figure 25. Corrosion degradation curves versus time for different types of concrete.
Infrastructures 05 00102 g025
Figure 26. Structural analysis of panel as plate elements.
Infrastructures 05 00102 g026
Figure 27. Yield line analysis of the panel elements.
Infrastructures 05 00102 g027
Figure 28. Leaching degradation curves MRd, versus time for HPC and UHPC for a slab 30 mm thick.
Infrastructures 05 00102 g028
Figure 29. Leaching degradation curves (ultimate height of the water level) versus time for HPC and UHPC for a slab 30 mm thick.
Infrastructures 05 00102 g029
Figure 30. Leaching degradation curves (maximum deflection) versus time for HPC and UHPC for a slab 30 mm thick.
Infrastructures 05 00102 g030
Figure 31. Expected service life (year) based on the ultimate limit state (resisting moment MRd).
Infrastructures 05 00102 g031
Figure 32. Expected service life (year) based on the serviceability limit state (stresses for the first basin and deflection for second and third basins).
Infrastructures 05 00102 g032
Table 1. Major durability parameters in Ultra-High-Performance Concrete (UHPC) codes, standards, specifications and guides.
JurisdictionDocumentDurability ParameterValue(Recommended/Compulsory)
France [56]NF P 18 459Porosity to water≤9%
XP P 18 462Coefficient of diffusion of chlorides at 90 days≤0.5 × 10⁻¹² m2/s
XP P 18 463Permeability to gas at 90 days≤9.0 × 10⁻¹⁹ m2
Australia [57]“Design Guidelines for RPC
Prestressed Concrete Beams”
Matrix porosity5%
Minimum cover to tendons20 mm
Minimum spacing between adjacent tendonsMin (1.5∙φ; 20 mm)
Where φ = tendon diameter
Crack width1.5∙H∙(εb–0.00016)
Where H = section depth
εb = concrete strain
Canada [58]CSA A23.1—“Concrete materials and methods of concrete construction”Durability requirements3 levels for durability
Chloride ion penetrability-
Concrete cover-
Germany [59]German Guideline for Ultra-High Performance Concrete”w/c≤0.25
Spain [60]Spanish GuidelineEN requirements-
Swiss standards [61]BFUP (Bétons Fibers Ultra hautes Performance)Porosity to water2–5%
Permeability to Nitrogen1–5 × 10⁻²⁰ m2
Freeze and thaw
Residual module after 300 cycles
Loss of mass after 300 cycles
100%
<10 gm/m2
Abrasion Coefficient CNR1.3
Carbonation, penetration after 15 mmSeveral years
Permeability to Oxygen<10−9 m2
Coefficient of diffusion of chlorides2 × 10−14 m2/s
Table 2. Typical compositions of water in different geothermal power plants owned and operated by Enel Green Power—the pilot has been built in the Chiusdino plant (framed in red in the table).
PlantNuova San MartinoLe PrataVallesecolo Gr.1Bagnore 4Chiusdino
LocationLagoLagoLarderelloPiancastagnaioRadicondoli
Date06-mar-1812-gen-1727-mar-1726-gen-1707-lug-17
Typology kind of waterBlown down waterColumn C2 water inletColumn C2 water inletInjection waterCooling water tower inlet
TCon.d.19.316.019.9n.d.
pH−log [H+]7.077.087.996.496.9
CondµS/cm4.4306.4601.06024.2007.870
AlkMg/L
Hcl
3.0114.93.1n.d.
Alk ritMg/L
Hcl
1.8n.d.n.d.n.d.n.d.
O2 dissolvedMg/L0.1n.d.n.d.1.1n.d.
H2SMg/L0.40.2u.d.l0.31.5
SO42−Mg/L1.2232.29220210.0205.119
SO32−Mg/L77980u.d.l505325
S2O32−Mg/L26229u.d.l11.246
ClMg/L2131.12.62.81.0
Na+Mg/Ln.d.1.35270.9n.d.
Table 3. Prescriptions of liquid retaining and containment structures from EN 1992-part 3.
Tightness ClassRequirements for LeakageSpecific Requirements
0Some degree of leakage acceptable, or leakage of liquids irrelevant.Silos holding dry materials may generally be designed with this class.
1Leakage to be limited to a small amount. Some surface staining or damp patches acceptable.Any cracks expected to pass through the full thickness should be limited to wk1, Healing may be assumed if the expected range of strain under service condition is less than 150 × 10−6.
2Leakage to be minimal. Appearance not to be impaired bg.Cracks should not pass through the full width of a section, the design value of the depth of the compression zone should be at least xmin. xmin = min (50 mm or 0.2 h—h is the element thickness).
3No leakage permitted.
Table 4. Current design prescriptions for structures in XS/XA exposure conditions.
Maximum w/cMinimum Cement Content (kg/m3)Minimum Compressive Strength (N/mm2)Minimum Concrete Cover (mm)Maximum Crack Width (mm)
XS0.40–0.65300–40025/30 to 40/5025–750.1–0.4
XA0.45–0.6527540025/30 to 40/50-0.1–0.3
325
Table 5. Ultra-High-Durability Concrete (UHDC) mix. components and their proportions.
ConstituentsXA-CAXA-CA + ANFXA-CA-CNC
CEM I 52,5 R600600600
Slag500500500
Water200200200
Steel fibers Azichem Readymesh 200 ®120120120
Sand 0–2 mm982982982
Superplasticizer Glenium ACE 300 ®333333
Crystalline Admixture Penetron Admix ®4.84.84.8
Alumina nanofibers NAFEN ®*-0.25-
Cellulose nanofibrils Navitas ®*--0.15
* % by weight of cement.
Table 6. Maximum chloride content of concrete according to EN 206 [55].
Concrete UseChloride Content Class aMaximum Cl Content by Mass of Cement b %
Not containing steel reinforcement or other embedded metal with the exception of corrosion -resisting lifting devicesCl 1.01.00
Containing steel reinforcement or other embedded metalCl 0.200.20
Cl 0.40 c0.40
Containing prestressed steel reinforcement in direct contact with concreteCl 0.100.10
Cl 0.200.20
a For a specific concrete use, the class to be applied depends upon the provisions valid in the place of the use of the concrete. b Where additions are used and are taken into account for cement content, the chloride content is expressed as the percentage chloride ion by mass of cement plus total mass of additions that are taken into account. c Different chloride content classes may be permitted for concrete containing CEM III—cements according to provisions valid in the place of use.
Table 7. Exposure environment versus chloride concentration.
Exposure EnvironmentNaCl Concentration (g/L)
Baltic Sea3–8
Black Sea18.3–22.2
White Sea26–29.7
Atlantic Ocean33.5–37.4
Pacific Ocean34.5–36.7
Mediterranean Sea38.4–41.2
Red Sea50.8–58.5
Ontario Lake72
Caspian Sea126.7–185
Dead Sea192.2–260
Elton Lake265
Table 8. Critical chloride (%) content Ccrit from literature.
Soluble in WaterSoluble in Acid
ACI 201 [95](0.10 to 0.15)-
ACI 222 [96]-0.20
ACI 318 [97](0.15 to 0.30)0.20
BS 8110 [98]-0.40
Australian Standards [57]-0.60
RILEM [75]-0.40
Norway Standards [99]-0.60
Hope and Ip [100]-(0.10 to 0.20)
Everett and Treadaway [101]-0.40
Thomas [102]-0.50
Hussain, SE [103]-(0.18 to 1.2)
Page and Havdahl [104]0.541.00
R. F. Stratfull.et al [105]-0.15
Table 9. Leaching and erosion coefficients for different types of concrete.
UncrackedOrdinary ConcreteHigh-Performance ConcreteUltra-High Performance (Fiber-Reinforced) Concrete
Non-steady Ca leaching coefficient DnsCa (m2/s) (3 to 30 months)(2.5–1.0) × 10−10(1.2–0.5) × 10−10(5–3) × 10−11
Leached layer (mm)20.250.10
a (mm d−0.5)0.21–0.0670.026–0.00840.011–0.0034
Ke (mm d−1)0.022–0.0020.003–0.00030.0011–0.0001
Publisher’s Note: MDPI stays neutral with regard to jurisdictional claims in published maps and institutional affiliations.

