In Situ Pavement Monitoring: A Review

1
EIFFAGE Infrastructures GD—Research and Innovation Department, F-69964 Corbas Cedex, France
2
COSYS-LISIS, Université Gustav Eiffel, IFSTTAR, F-77454 Marne-la-Vallée, France
3
LPICM, CNRS, Ecole Polytechnique, Institut Polytechnique de Paris, route de Saclay, F-91128 Palaiseau, France
*
Author to whom correspondence should be addressed.
Infrastructures 2020, 5(2), 18; https://0-doi-org.brum.beds.ac.uk/10.3390/infrastructures5020018
Submission received: 16 December 2019
/
Revised: 24 January 2020
/
Accepted: 30 January 2020
/
Published: 7 February 2020
(This article belongs to the Special Issue SMARTI - Sustainable Multi-functional Automated Resilient Transport Infrastructure)
Abstract
:The assessment of pavement conditions and their evolution with time is a crucial component for the establishment of pavement quality management (QM) plans and the implementation of QM practices. An effective pavement management system (PMS) is based on pavement conditions data continuously collected along the lifetime of a road. These data are used to model the pavement response, evaluate its performances, and trigger the necessary maintenance actions when they do not meet previously defined performance indicators. In the last decades, pavement monitoring via embedded sensing technologies has attracted more and more attention. Indeed, the integration of sensors in the road pavement allows the assessment of the complete history of pavement conditions, starting from sensor installation. Once the technologies are stabilized, collecting this information is expected to help road managers to define more effective asset management plans. This paper first proposes an overview of the most used devices for pavement instrumentation, categorized according to the measured parameters. Then a review of some prominent instrumented sections is presented by focusing on the methodology used for data interpretation.
1. Introduction
Roads represent a key public asset, as they provide benefits to any country’s social and economic development. Like any physical asset, road infrastructures require preservation, maintenance, repair, and rehabilitation [1]. The implementation of pavement management systems (PMS) aims at operating, maintaining, upgrading, and expanding the pavement through cost-effective practices [2]. The establishment of PMS follows six main steps [3,4]:
- road network inventory, including road location, road geometry (width and length), and pavement typology;
- assessment of road conditions, namely surface roughness, texture, and skid resistance, as well as pavement mechanical properties;
- data interpretation and use of the predicting model to predict the rate of pavement deterioration with time due to traffic and climate conditions;
- definition of maintenance decision criteria, such as performance indicators that the pavement has to meet in order to ensure an adequate level of service; and
- scheduling of road maintenance actions.
Thus, having quality pavement conditions data is a key component of a PMS, as they are directly linked to the ability to provide accurate and reliable recommendations toward optimal pavement maintenance [5].
Nowadays, the two approaches generally adopted for pavement auscultation are the detection of pavement surface conditions and the assessment of its structural state. Surface conditions are usually investigated manually, by visual inspections, or automatically, through specially equipped vehicles, such as a pavement profiler scanner [6]. Pavement-bearing capacity can be calculated by measuring the vertical deflection under the falling weigh deflectometer (FWD) [7] through specific software. These ex-situ monitoring solutions enable a homogenous observation of the overall road network surface conditions, but they are time-consuming (especially in the post-processing phase) and tend to detect damages when they have already appeared. They require traffic flow disruption, are costly, and provide only punctual—at best, periodic (1 to 5 years)—information.
By contrast, in situ pavement monitoring designates solutions that allow continuous monitoring of the road health condition. These solutions rely on pavement instrumentation, namely integrating sensors within the road [8]. The goal is to allow an accurate measurement of pavement response (in terms of stress, strain, deflection, temperature, etc.) at different layers of the road structure. Such data, and its interpretation framework, is critical to assess the actual mechanical state of pavement and, thus, establish cost-effective asset management plans [9]. Compared to the above-mentioned methodologies for pavement investigation, the interest in this type of approaches relies on the fact that the use of embedded sensors allows remote and continuous supervision of multiple layers without any traffic disruption. They pave the way towards the so-called “smart road” [10].
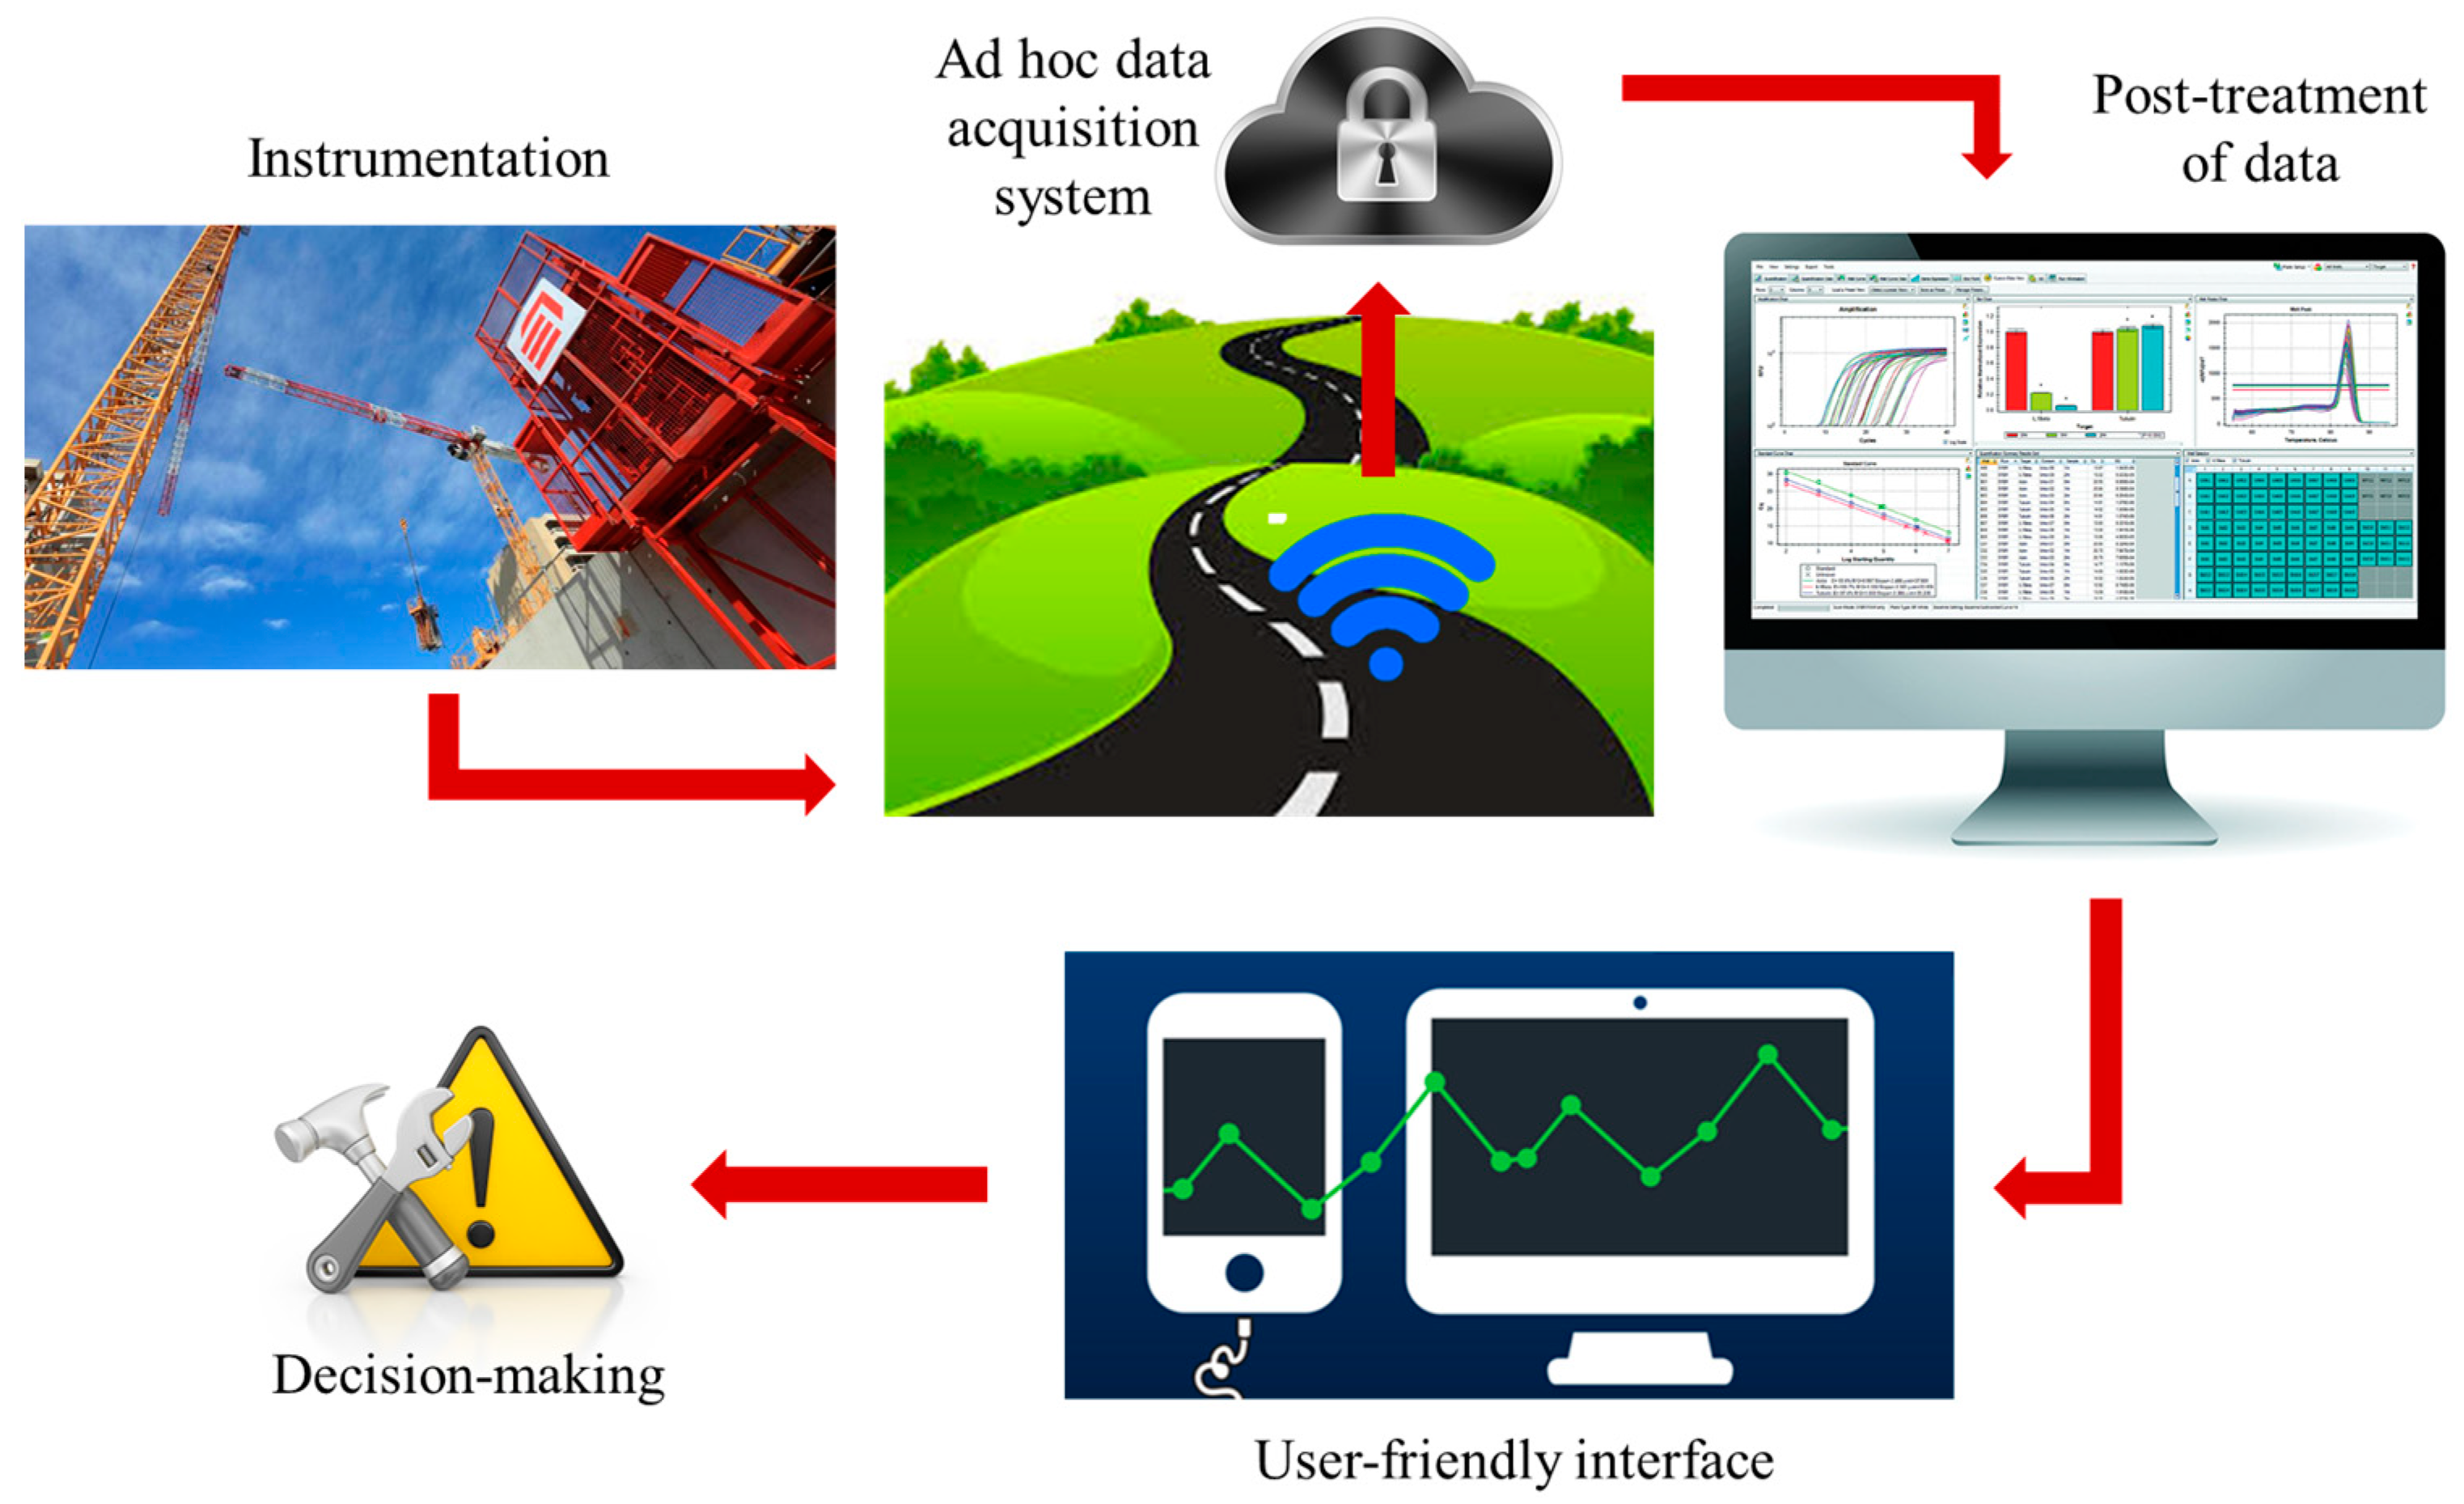
A complete monitoring system is composed of three main elements: embedded sensing devices connected to an ad hoc data acquisition system; post-treatment of possibly massive data coming from the sensors; and, finally, a user-friendly interface showing the overall road network conditions and alerting in case of maintenance need [4]. Thus, having a device that is compatible with the pavement itself is as important as developing a methodology for the inverse calculation of pavement mechanical performances. The final tool is designed as a support for decision-making on pavement maintenance actions (Figure 1) [1,11].
Considering the importance and the complexity of developing an operational in situ monitoring system for road pavement, a detailed review on instrumentation for pavement is presented. In Section 2, various transducers employed for in situ monitoring are presented. Section 3 is a review of several instrumented sections in view of providing insight into the inverse calculation strategies for road structure, as well as the decision support tools. Finally, some future trends are presented in Section 4.
2. Sensing Solutions
Instrumenting a road pavement to document its conditions’ evolution during service life can be challenging and expensive [12]. The type, number, and location of sensors depend on the physical parameters to measure, the road portion to monitor, and the type of measurement required (punctual or distributed). Thus, the attentive selection and correct installation of sensing devices are key prerequisites for collecting quality data; hence, for the success of an instrumentation project. In this section, the most used embeddable solutions for in situ road pavement monitoring are described by focusing on their operating principles, as well as their installation requirements.
2.1. Strain Measurements
Strain measurements of different layers of the pavement are of great interest as they can be used to analyze pavement response under moving loads with time, as well as to verify the assumptions made during the design phase [13]. By recording the strain evolution within the pavement over time, it could be possible to predict the occurring of fatigue or rutting phenomena. Repeated traffic loading causes high tensile strains at the bottom of the asphalt layers, leading to a global reduction of the pavement bearing capacity, known as fatigue. Repeated compression efforts due to vehicle passages can lead to rutting, which is characterized by a permanent deformation of the pavement [14].
2.1.1. Horizontal Asphalt Strain Gauges (H-gauges)
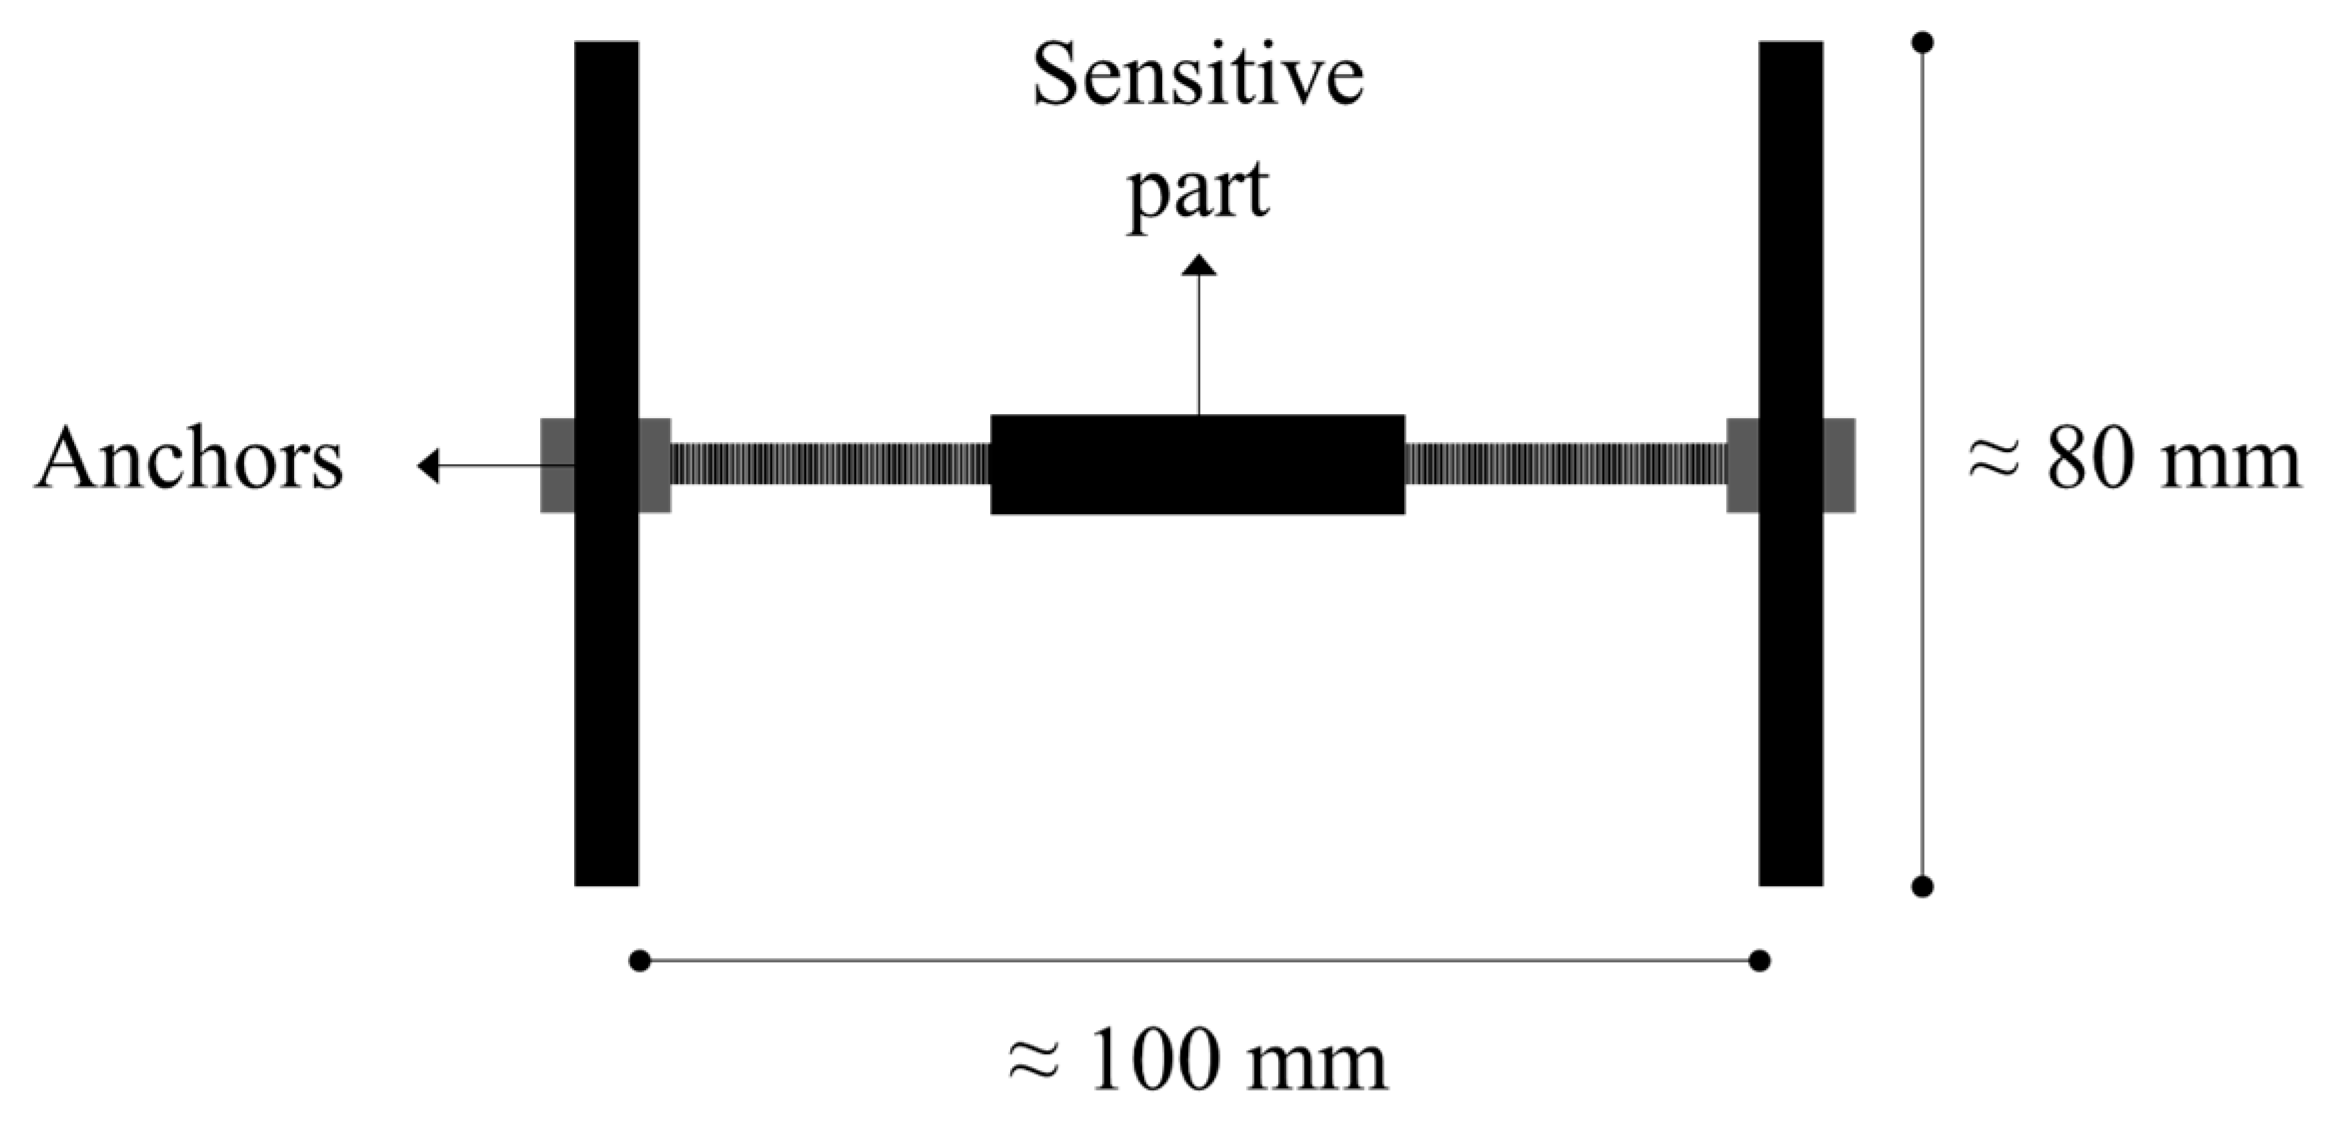
H-gauges are used to measure the magnitude of horizontal strains within pavement under dynamic loading. The H shape of these sensors enhances their anchor in the asphalt medium. The sensitive part is actually in the central bar, which is made of a given material and can contain from one to four active strain gauges connected in different configurations. Each edge of the central bar is connected to a metal strip. A schematic representation of a horizontal asphalt strain gauge is given in Figure 2. They are usually placed at the bottom of the bituminous layers, as this is the area where high tensile strains are concentrated and may give rise to fatigue crisis.
As the pavement experiences strain, the movement of the anchors produces an elongation in the central bar. The subsequent resistance variation of the strain gauges can be translated into strain thanks to the gauge factor (GF) that represents the sensor sensitivity to strain:
GF = (ΔR/R)/R
The H-gauges available on the market are waterproof and designed to withstand high temperatures and compaction loads associated with asphalt pavement construction procedures. In addition, their stiffness is of the same range of magnitude as the asphalt, thus permitting the measurement of the true strain within the pavement. Concerning the installation procedures, providers usually recommend to put some asphalt above and below the sensors before paving and compacting operations start. The purpose of this action is to protect the sensor itself and to guarantee bonding between the sensor and the surrounding structure, as well as longevity of the instrumentation [8]. Some of the strain transducers for asphalt pavement available on the market are summarized in Table 1, where their specifications are compared. The sensors can provide accurate measurements (resolution of about ±1 με) in a range that widely covers the level of strain and temperature felt by the pavement during the construction process, as well as service life. The cost can go from 300 € to 700 € per transducer.
2.1.2. Vertical Asphalt Strain Gauges
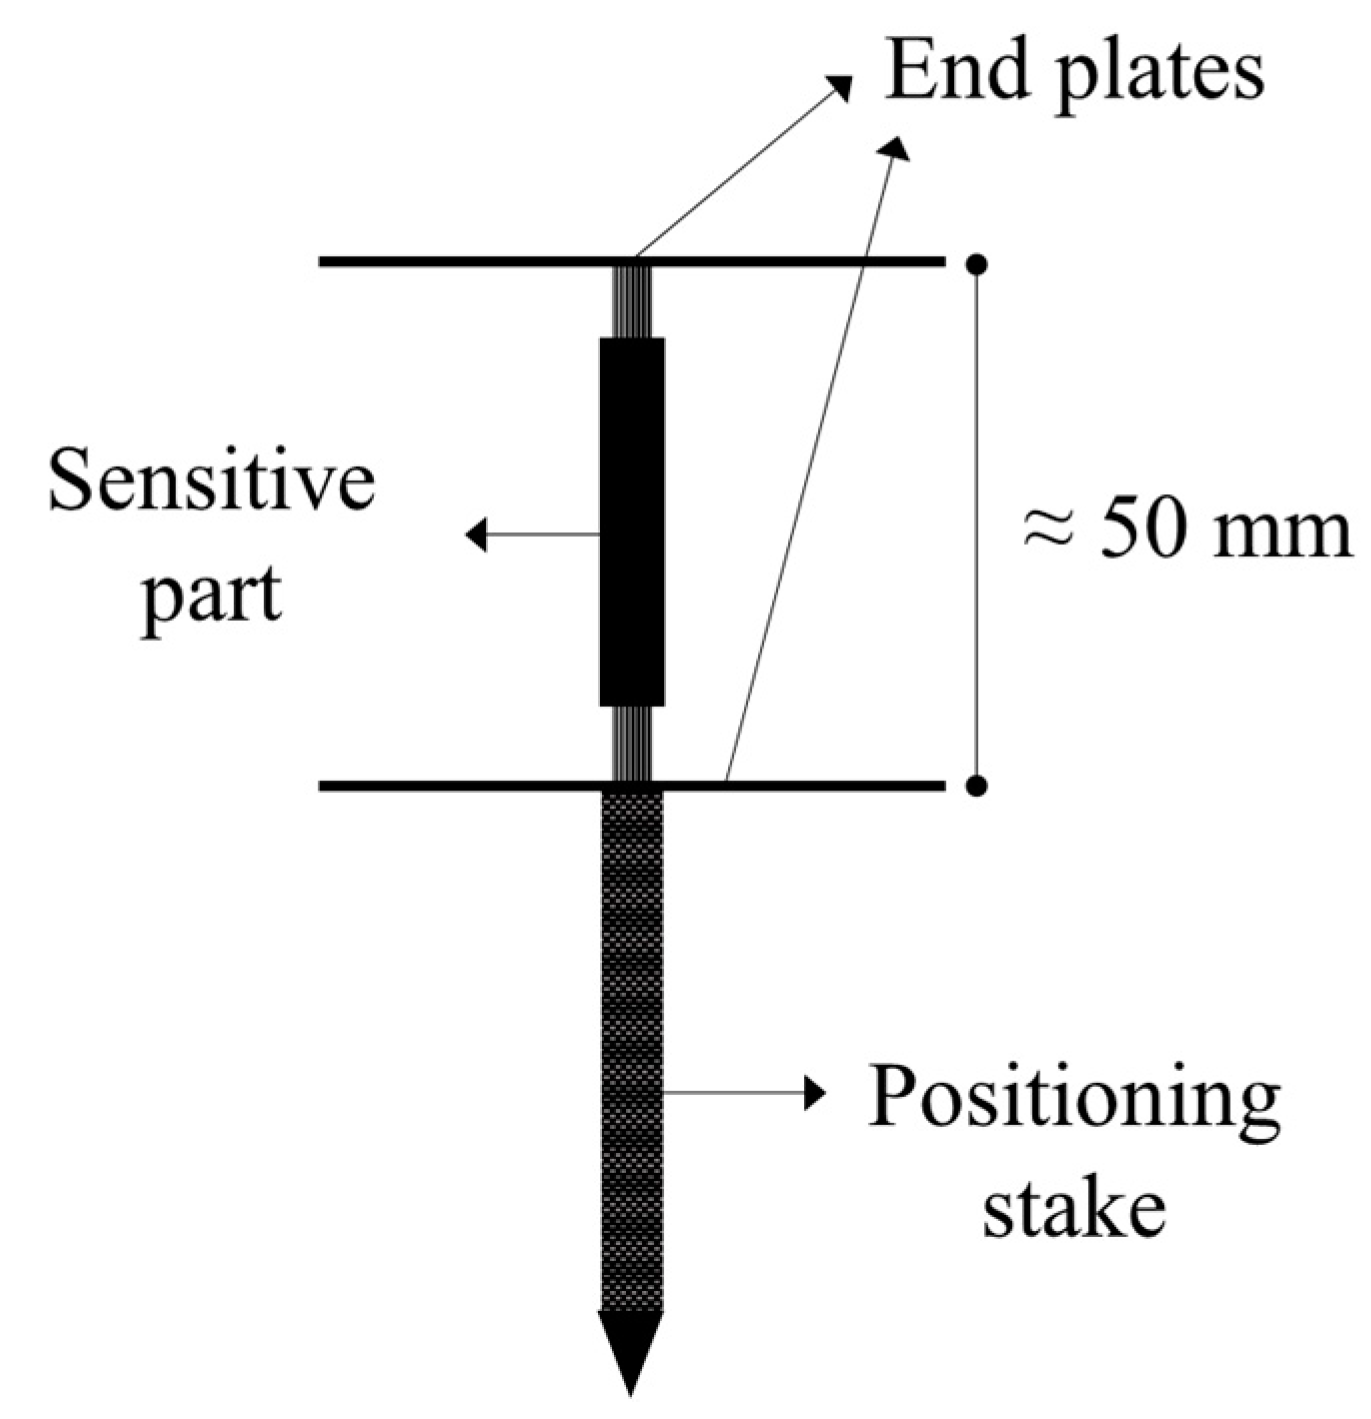
Similar to the H-gauges, the vertical asphalt strain gauges are composed of a sensitive part secured by two circular plates. The bottom plate has the function to keep the sensor in position, while the top plate transfers the load uniformly to the central bar. In addition, this type of sensor is equipped with a sharp stake to be inserted in the underlying layer. A scheme of a vertical asphalt strain gauge is given in Figure 3.
The operating principle and the compatibility with asphalt materials and construction phases are similar to the ones presented in the previous section [15]. Concerning the installation, it requires the drilling of a hole to accommodate the positioning stake. Sand binder mixtures are applied to fill the hole and cover the surroundings. Thereafter, the sensor is delicately pressed into the hole until contact between the bottom plate and the surface is attained. The providers generally suggest to first remove the top plate in order to apply the asphalt mix around the gauge and then replace it and cover the sensor with the mix. Then, it is possible to go forward with paving and compacting. Statistically, vertical asphalt strain gauges have a lower survival rate than H-gauges.
2.1.3. Fiber Optic Sensors (FOS)
A fiber optic sensor (FOS) is a device that uses an optical fiber connected to a light source as the sensing element to detect certain quantities. FOSs represent a valuable technology to obtain crucial information about the pavement conditions due to their small size, flexibility, embeddability, and immunity to electromagnetic interference [16]. In addition, FOSs allow high-precision (resolution of about ±1 με) local or distributed strain measurements.
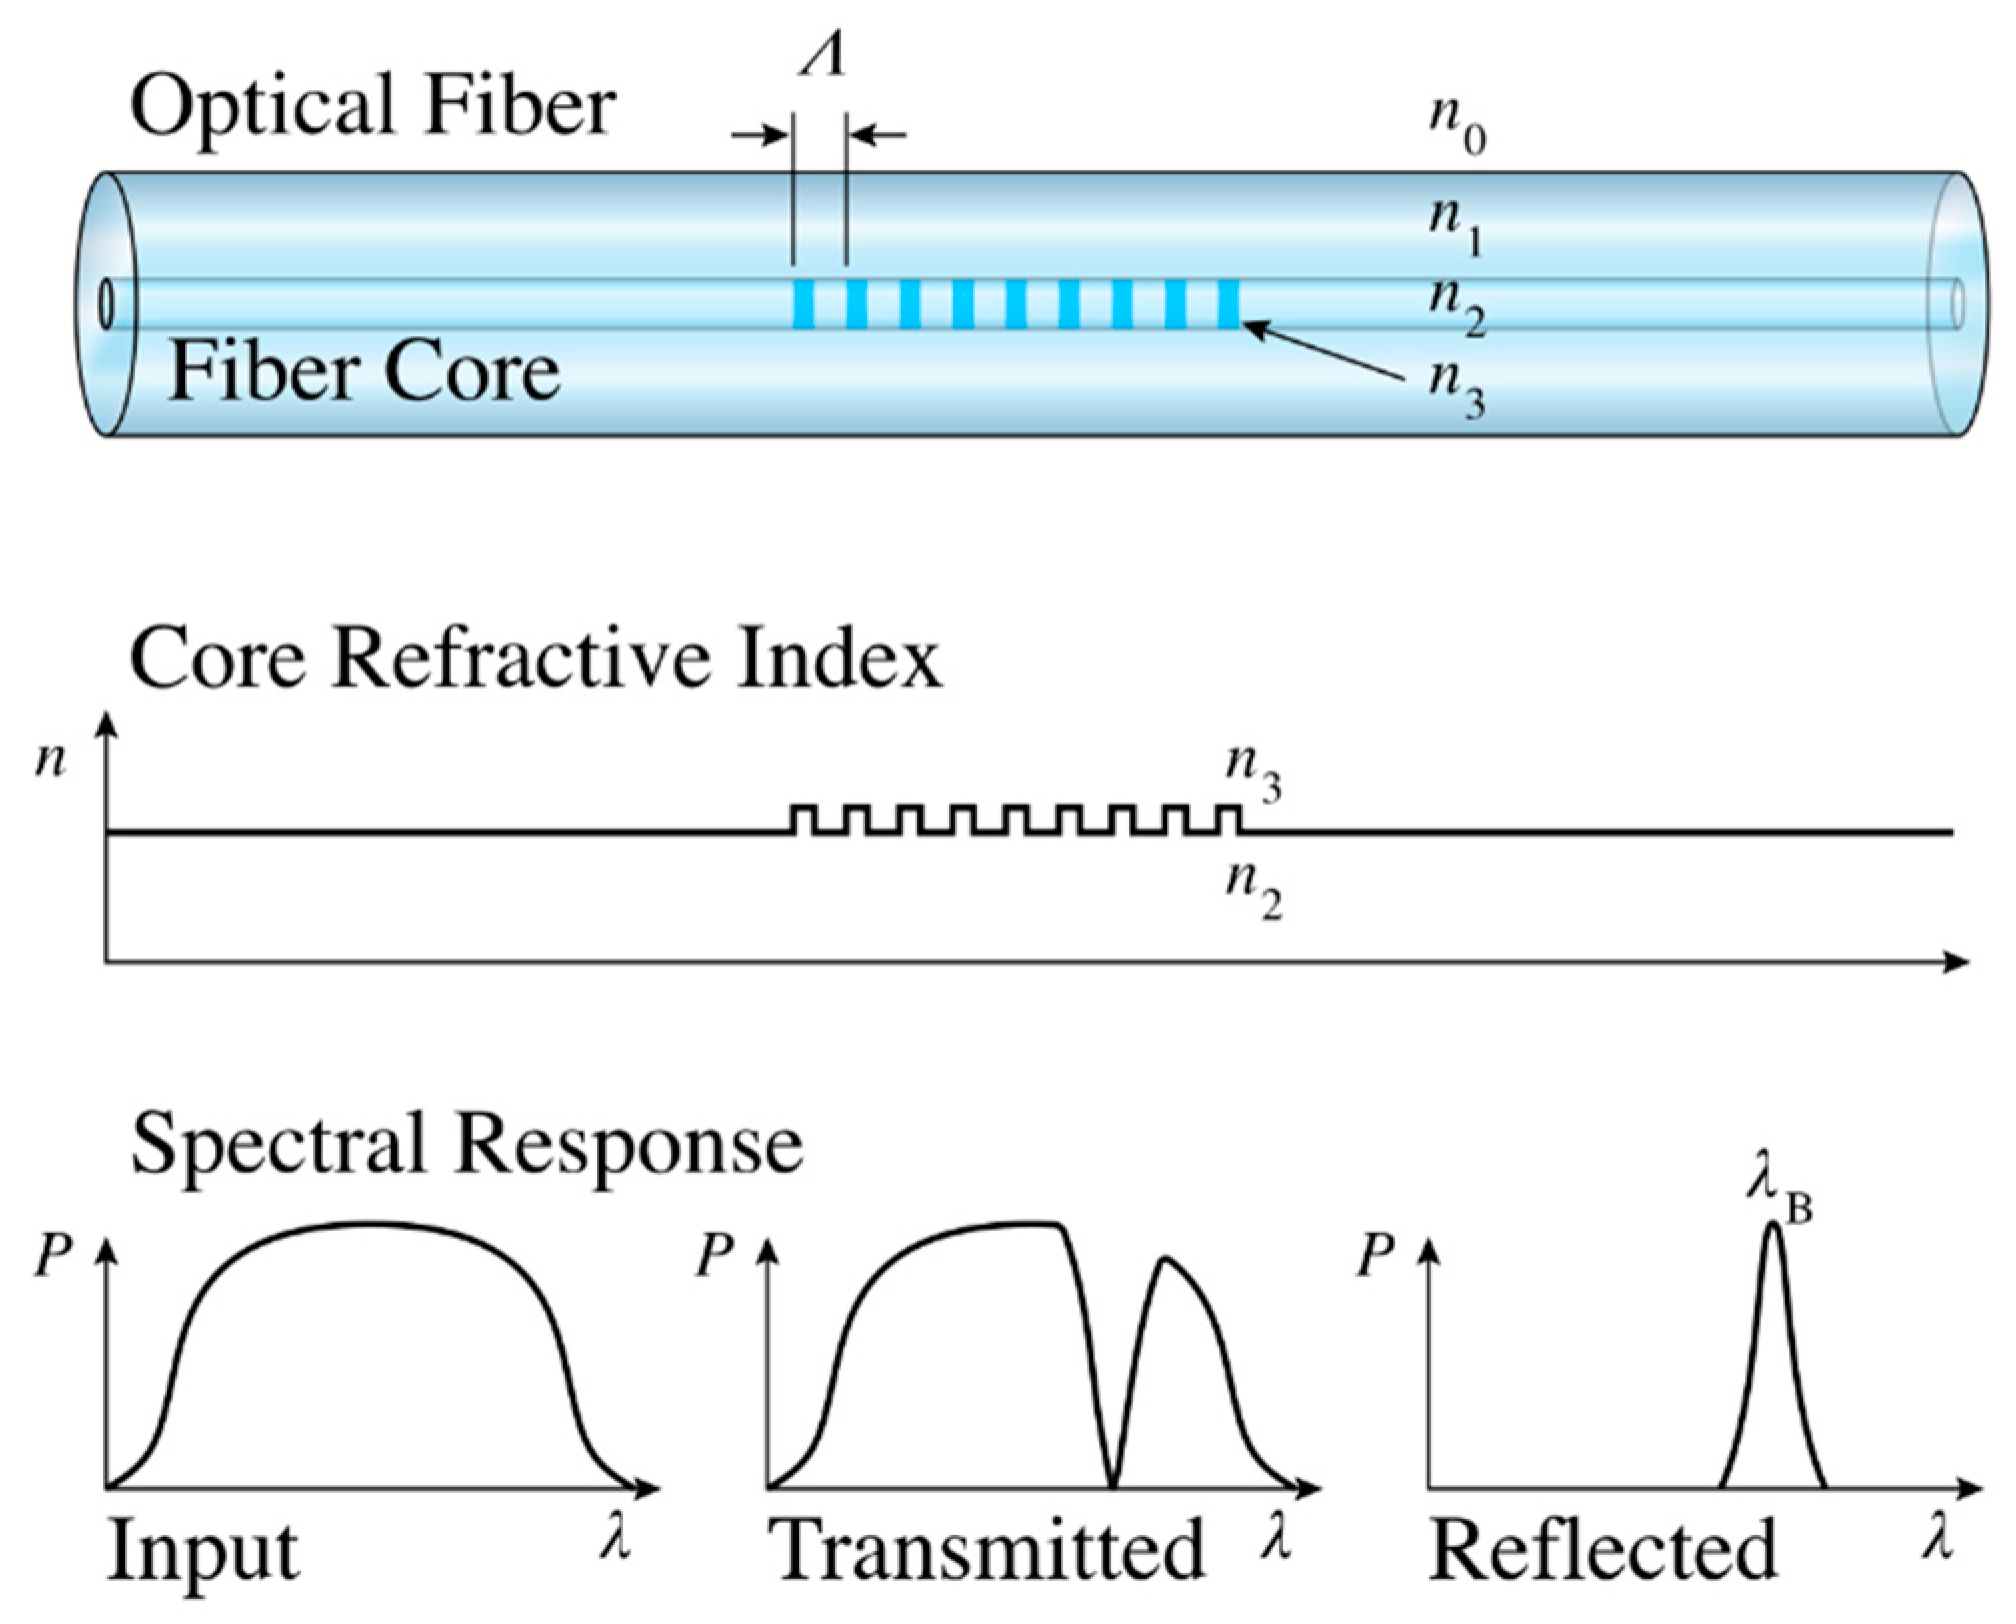
Several types of FOSs are available on the market. They can be classified according to the sensing configuration: discrete, quasi-distributed, and distributed. Discrete measurements use the extrinsic Fabry-Perot (FP) interferometer [17]. The sensor consists of two semi-reflecting parallel mirrors placed at a distance. The variation of this distance is related to the occurring of an event [18]. Fiber Bragg gratings (FBGs) can be used for quasi-distributed measurements [19]. FBGs are made by variating the refractive index of small portions of an optical fiber through an intense ultraviolet (UV) source, thus forming an interference pattern. This causes the reflection of a particular wavelength (called Bragg wavelength) and the transmission of all others. The application of strain produces a shift in the Bragg wavelength (Figure 4).
Distributed fiber optic (DFO) sensing technologies enable continuous, real-time measurements along the entire length of a fiber optic cable, with high spatial resolution (up to 1 mm). The functioning principle of these devices for strain-sensing applications is based on two main techniques: the Rayleigh scattering effect and Brillouin scattering effect [20]. What makes the difference between the two types is the relation between the measured strain and the change in optical properties of the scattered light [21]. In both cases, the latter is strain and temperature-dependent, which means that the strain measurement must be compensated for by temperature variations.
2.2. Deflection Measurements
Pavement deflection measurements are a mean of evaluating overall pavement conditions. Many features of a flexible pavement can be determined by measuring its deflection response to load. For example, this quantity can be used for the inverse calculation of the pavement structural layer stiffness and the subgrade resilient modulus.
The most popular sensors for deflection measurements are linear variable differential transformers (LVDTs), accelerometers, and geophones [9]. The last two are less intrusive than LVDTs, and they require the integration of the original signal.
2.2.1. LVDTs
LVDTs are used to measure the actual vertical deflection of road pavement. In practice, these devices convert the relative displacement from a mechanical reference into an output voltage. A reference rod has to be anchored at a sufficient depth so that the deflection of that point due to surface loading is negligible. Single-layer deflectometers (SLDs) can measure the deflection of a given layer of the pavement, while the most sophisticated multi-depth deflectometers (MDDs) can measure deflection at multiple points of the pavement structure. The installation of LVDTs requires the execution of a core for the rod placement and sealing before the installation of the LVDT and the upper plate. Finally, the plate needs to be protected through some asphalt [24,25]. These devices can provide highly accurate measurements, as their resolution is infinite.
2.2.2. Accelerometers
An accelerometer is a device that measures velocity change or rate in one or multiple directions. By integrating the accelerometer signal twice, it is possible to obtain the pavement deflection. These devices do not need a reference point, as acceleration is an absolute value that refers to the state of rest. Thus, they can be installed on the surface or embedded at any depth in the pavement.
On a practical level, an accelerometer measures the acceleration of a mass connected on a spring. Under motion, the mass is accelerated due to the force applied on the spring. The displacement of the mass is then proportional to the acceleration [26].
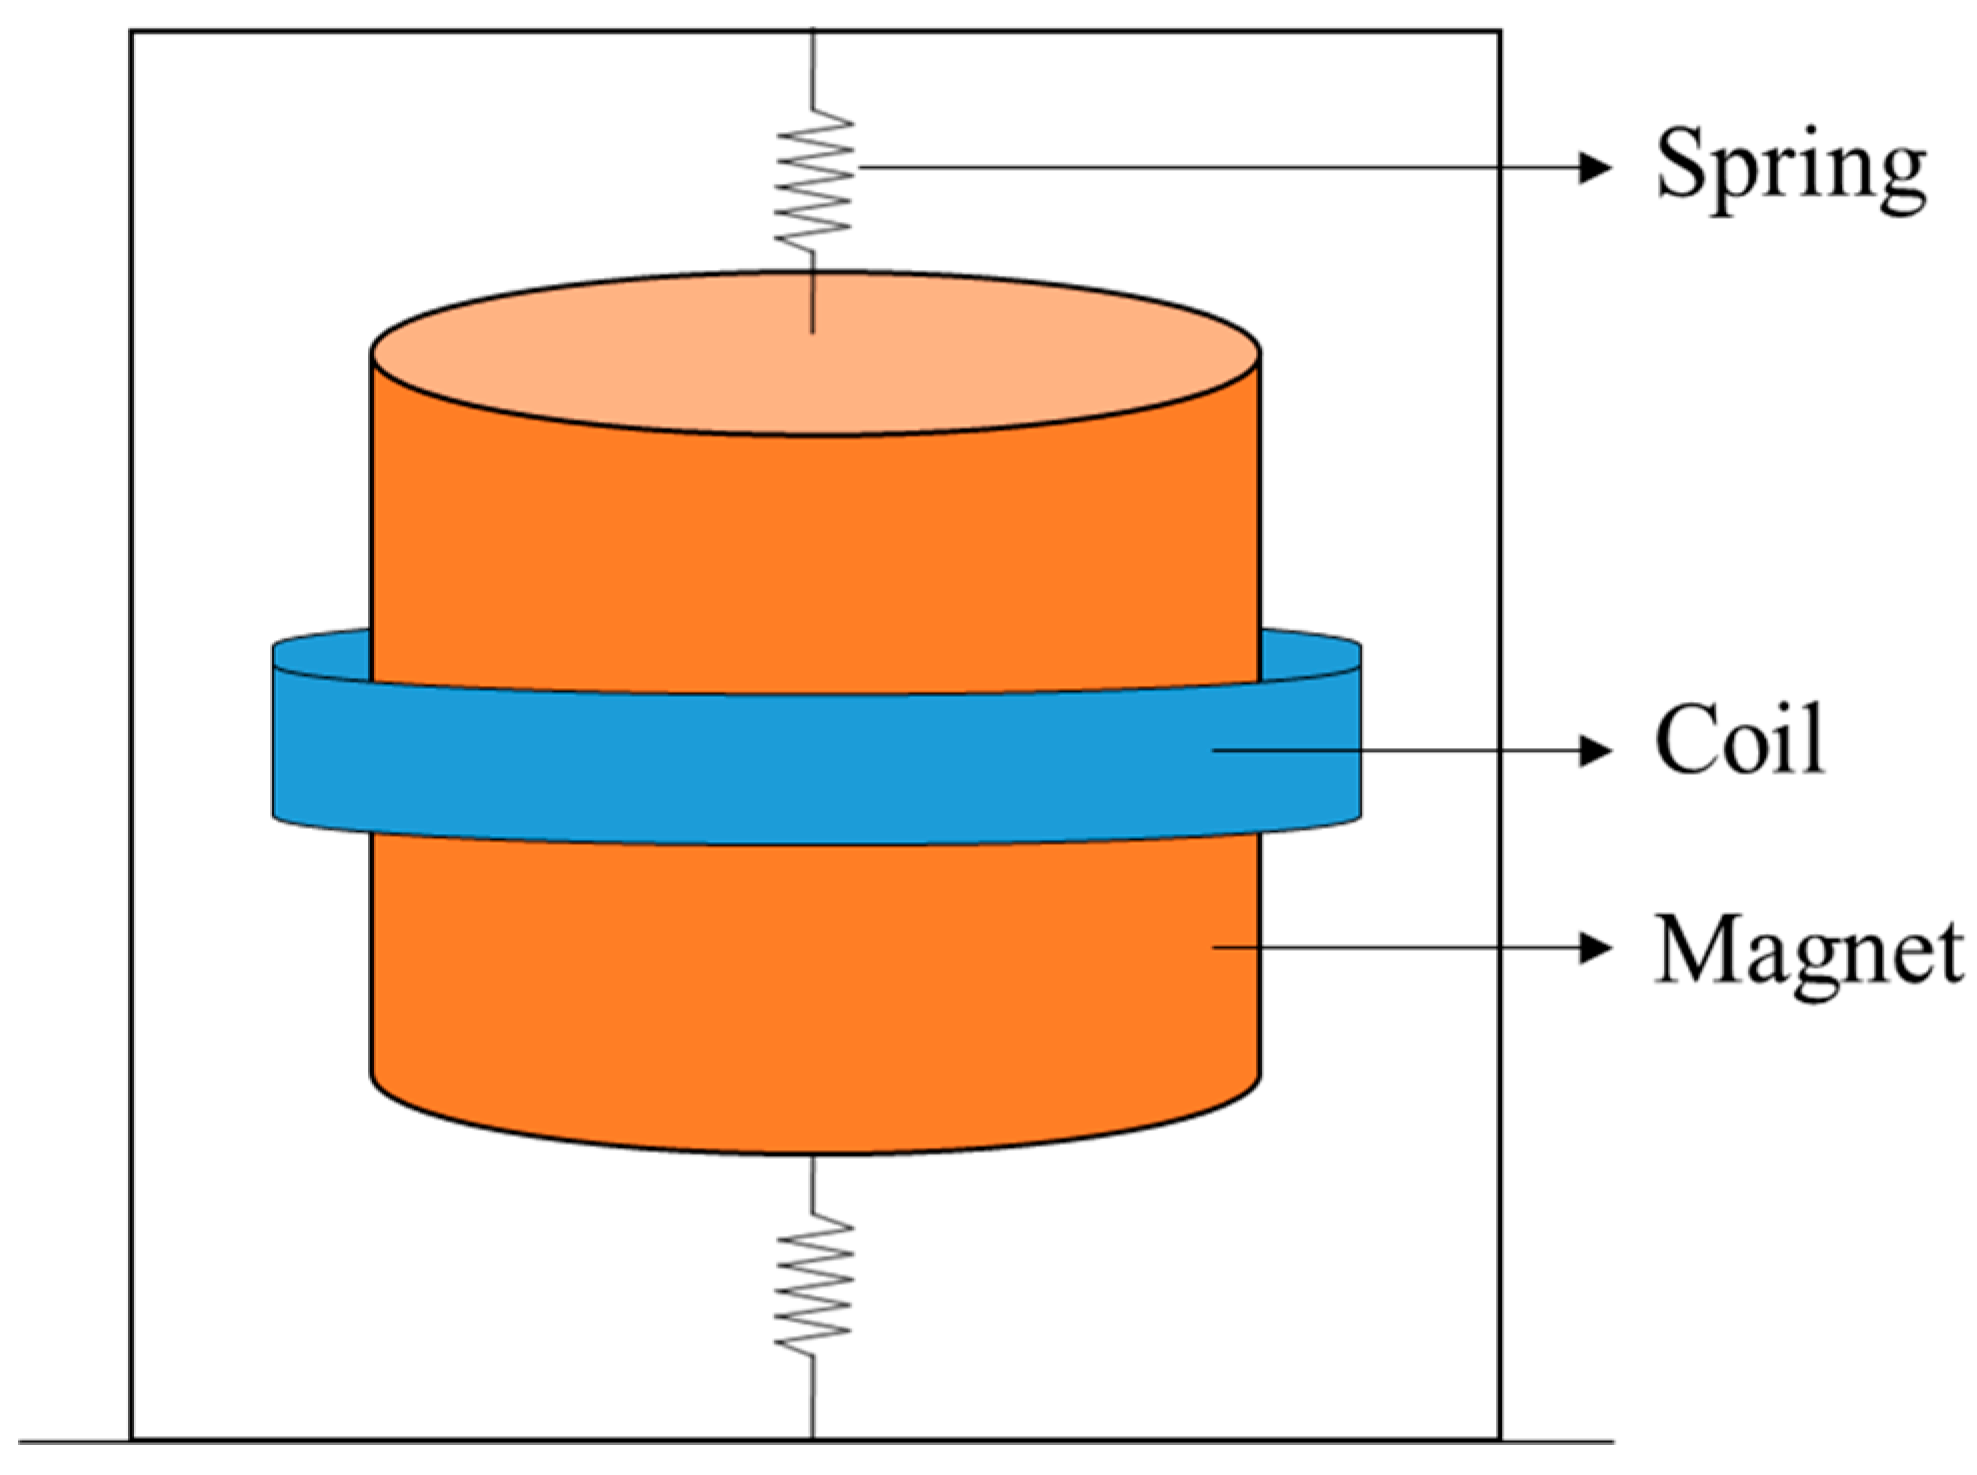
2.2.3. Geophones
Geophones are sensors that measure the displacement velocity of the pavement under moving loads. Thus, by integrating the signal once, it is possible to obtain the deflection response. The device is composed of a mass attached to a spring and surrounded by a coil. A movement of the geophone produces a relative movement between coil and magnet (Figure 5). Thus, a voltage is induced in the coil that is proportional to the displacement velocity measured by the geophone [27,28]. Geophones usually show a nonlinear response and an attenuation of the measured displacement amplitude under the natural frequency; thus, measurements are possible only above a minimum frequency [29].
Similar to accelerometers, these deflection sensors do not need any reference point, can be installed at any depth in the pavement structure, and can withstand the construction process phases.
2.3. Temperature Measurements
Due to the intrinsic viscoelasticity of bituminous materials [30], pavement response under loading depends on time and temperature. In fact, temperature measurements strongly affect pavement structural responses [31]. Therefore, both strain and displacement measurements need to be coupled with temperature measurements within the pavement for an accurate interpretation and modeling of its mechanical behavior.
The most common temperature sensors are described in the sections below. All of them can be placed at different depths in the pavement structure. The installation procedures require a coring (of a few millimeters) of the pavement layer for the insertion of the sensors that is then sealed with a resin in order to avoid the slipping off phenomenon.
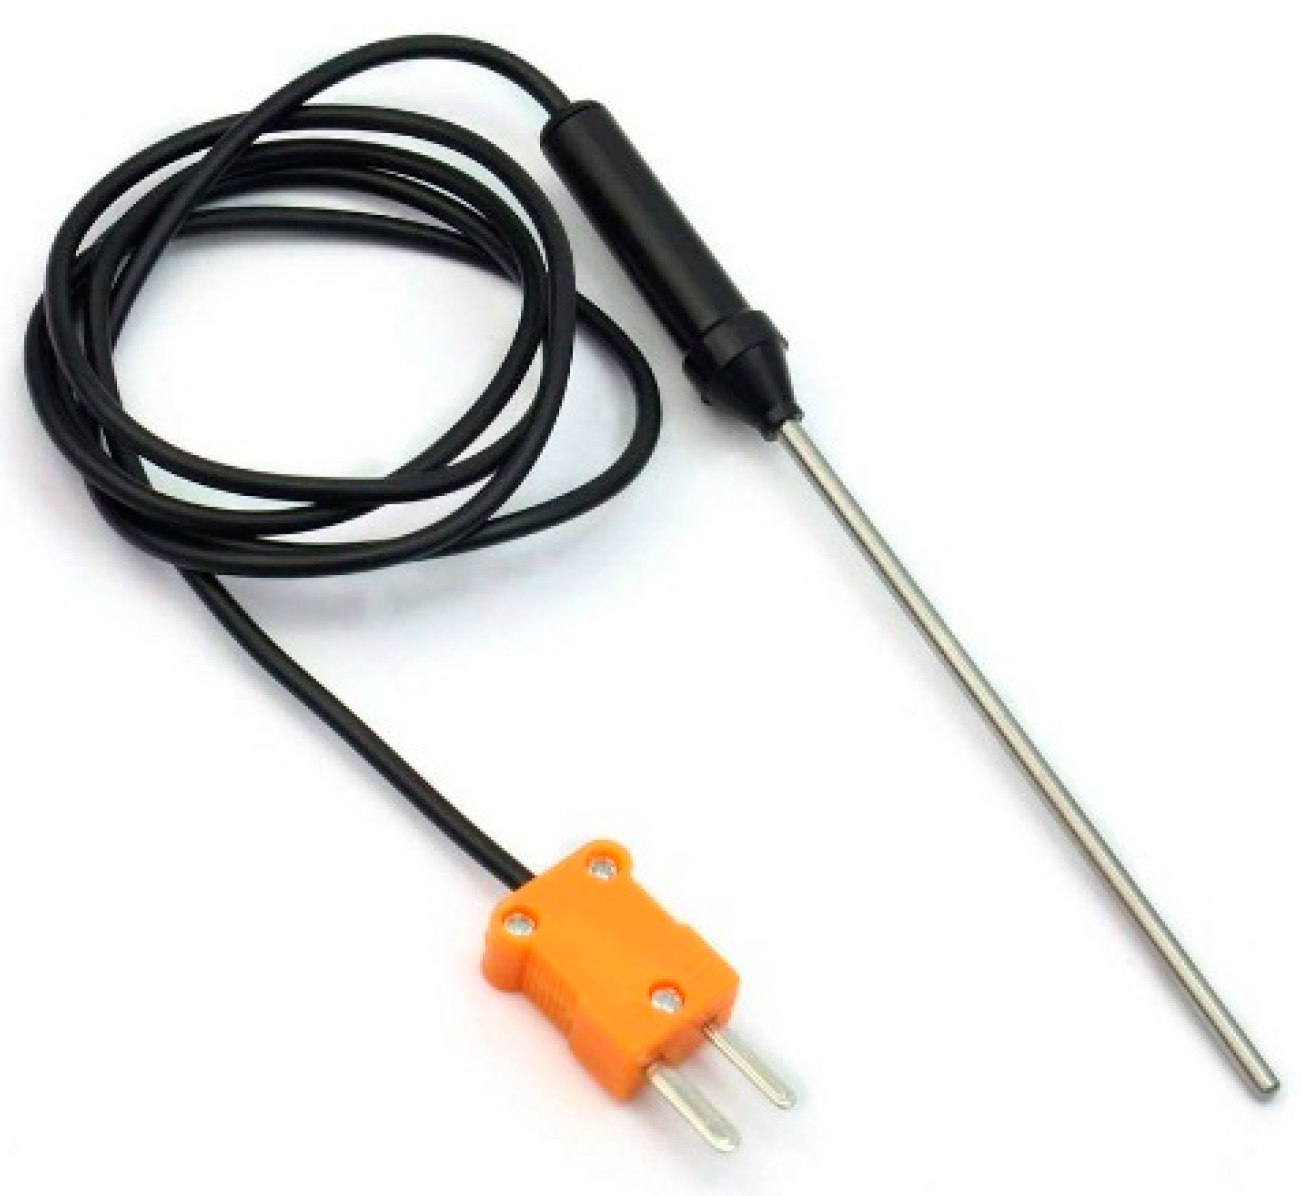
2.3.1. Thermocouples
Thermocouples are the most used probes for temperature measurements within pavement (Figure 6). Their operation is based on the Seebeck effect, based on the fact that the junction of two dissimilar metals yields a small voltage that varies with temperature. Thermocouple types K, E, or T can be used from subzero to very high temperatures, making them good candidate for embedding in the pavement, but they are less accurate than the following technologies (0.5 to 5 °C).
2.3.2. Resistance Temperature Detectors (RTDs)
RTDs are temperature-sensitive resistors. They usually consist of a fine wire (platinum, nickel, or copper) wrapped around a ceramic or glass core. The temperature range of use depends on the type of wire, but they can widely cover the temperature in the pavement during both construction and normal usage. In addition, they allow accurate (typically from 0.1 to 1 °C), stable, and repeatable measurements.
2.3.3. Thermistor Sensors
2.4. Moisture Measurements
It is demonstrated that an excess in moisture in the road structure results in the acceleration of pavement distress and, thus, speeds up the deterioration of the road-bearing capability. Therefore, there is a need to design and integrate drainage systems in the road that work efficiently during the lifetime of the pavement. To this respect, monitoring the moisture content at different depths in the road structure can give access to information concerning the drainage systems and document pavement mechanical conditions [33,34,35].
The most used probes for moisture content measurements are TDR probes, whose functioning principle is based on the time-domain reflectometry. An electric pulse is sent through a waveguide. Its progression through the waveguide is a function of the moisture content in the pavement. When it reaches the end of the waveguide, the pulse is reflected and detected by a receiver. The intensity of the pulse is thus related to the moisture content [33]. This device can measure between 0 and 100% water content, with an accuracy of 1%.
Concerning the installation procedures, the sensor has to be placed in a horizontal position.
2.5. Preassure Measurements
Pressure cells are used to measure the compressive stress in the road structure, notably in the unbound layers. The operating mode of these devices depends on their features. In fact, it is possible to distinguish mainly two types of pressure cells: hydraulic and diaphragm-based. The first consists of two steel plates configured in a way to form a cavity between them. This cavity is filled with a liquid. The induced liquid pressure is measured by strain gauges and is related to the applied load. The diaphragm cells are composed by a stiff ring that supports a diaphragm. The load application causes the deflection of the diaphragm that is measured by a strain gauge.
Concerning the installation, a procedure was suggested by Al-Qadi et al. [36]. Once the sensor is placed in the excavation of the unbound layer, its leveling needs to be checked in order for the sensor to be in the horizontal position. Finally, the sensor is covered with the material previously excavated before construction operations start.
3. Instrumented Sections
In this section, a review of several instrumented sections is proposed. In addition, it provides insights into the sensing approach, and it gives the opportunity to describe data treatment strategies [37].
3.1. The Virginia Smart Road
The Virginia Smart Road [36] can be considered as a pioneering instrumented road. It demonstrates the feasibility of an instrumentation measuring flexible pavement responses to loading, and it is the first example of an end-to-end system for pavement in situ monitoring.
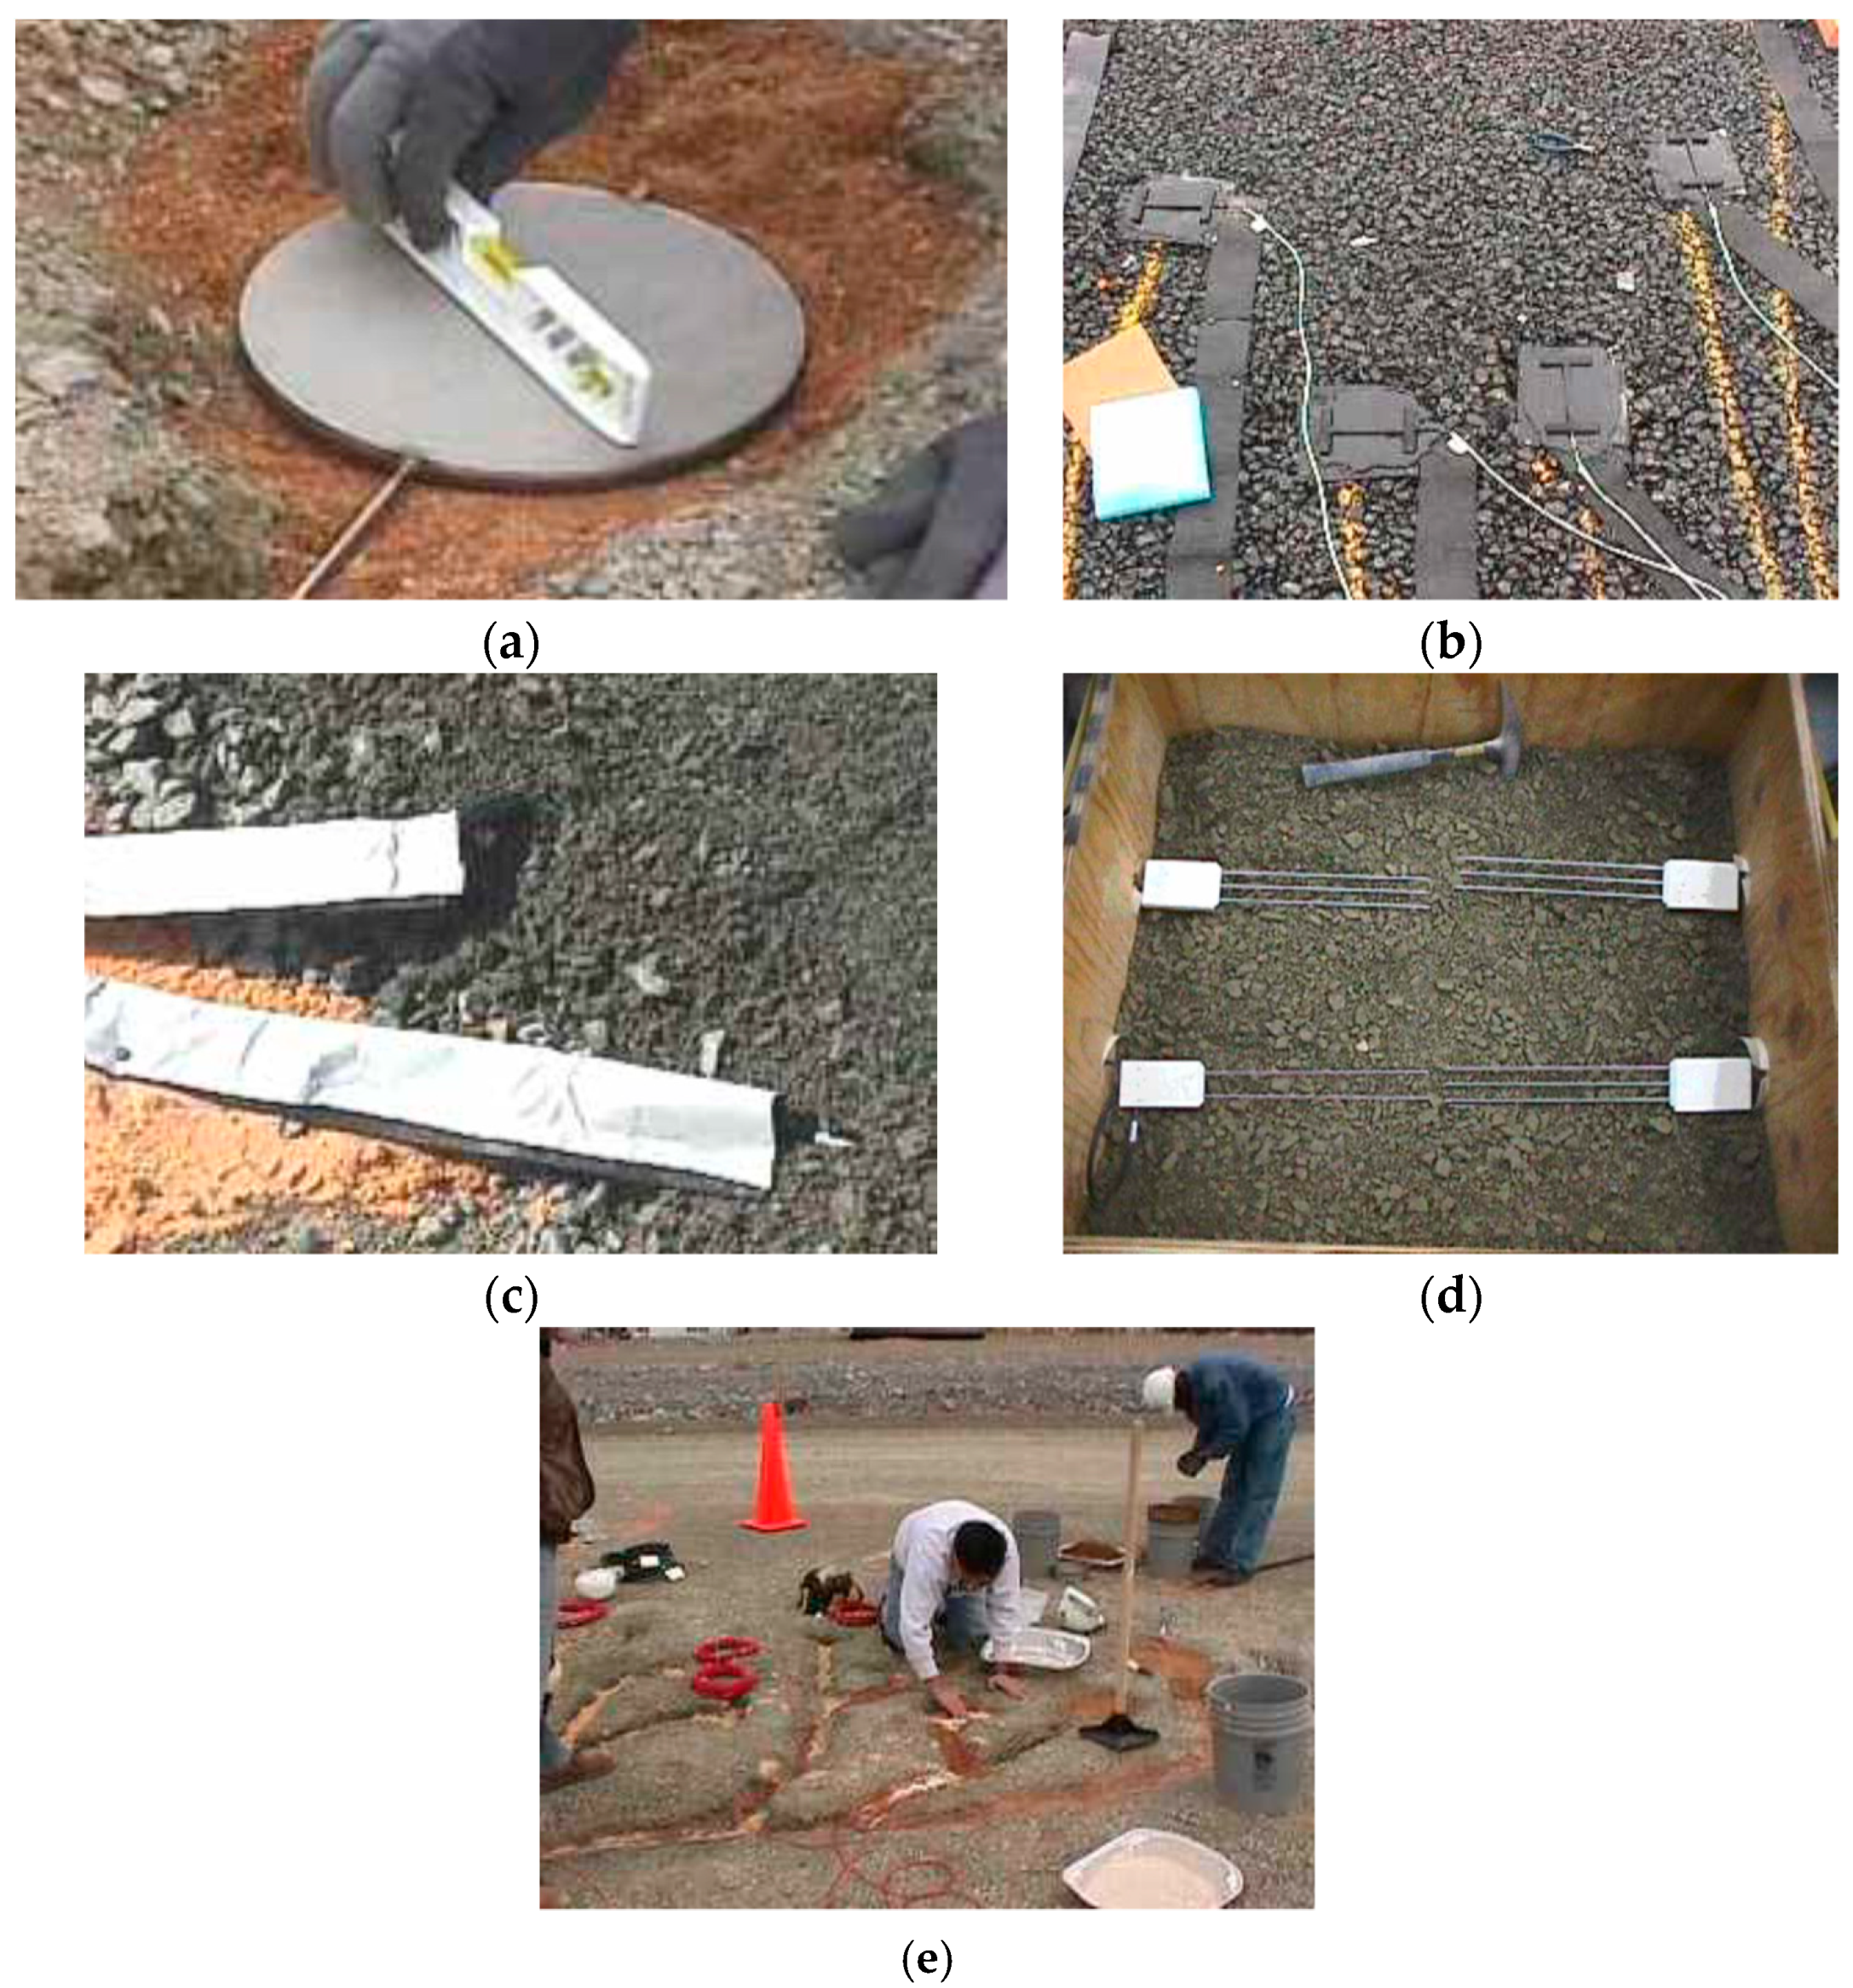
The project started in 1998 and ended in November 1999, it was conducted by the Virginia Department of Transportation. It consisted of the construction of a 3.2-km-long road. Over the entire length, 12 100-m-long sections were monitored by embedding different types of sensors at different depths. The instrumentation took place during the construction procedures. Strain gauges (H-shaped strain gauges and vibrating wire strain gauges), pressure cells, thermocouples, TDR probes, and resistivity probes were integrated (Figure 7). Rounding out the monitoring system, a data acquisition system and a developed software were deployed. The data acquisition system was composed of two Analog-to-Digital units, the DaqBook 200 for the acquisition of static data and the WaveBook 200 for the acquisition of dynamic data under moving loads. Three softwares were developed: SmartAcq for data acquisition, Smart Organizer for the management of raw data, and Smart Wave for post processing and displaying.
The acquisition performed during compaction shows that horizontal strains (longitudinal and transversal) are higher when vibrations were used. In addition, by analyzing in detail the signals acquired from the sensors, it was possible to determine the vibration frequency.
An experimental campaign with a truck of known loading was then carried out with the objective to study pavement responses under different loadings and environmental conditions. The pavement was loaded by performing several passages with three different tire pressures (724 kPa, 655 kPa, and 552 kPa); three different loading configurations; and four different speeds (8 km/h, 24 km/h, 40 km/h, and 72 km/h). Results indicated that the response in terms of strain was affected by temperature and speed. Finally, a finite element model was used to model the pavement behavior and to compare the experimental and numerical results. It was found that a viscoelastic calculation that takes into account the effective bonding conditions at the interfaces between road layers can better predict the pavement response.
3.2. Test Section in the State of Maine
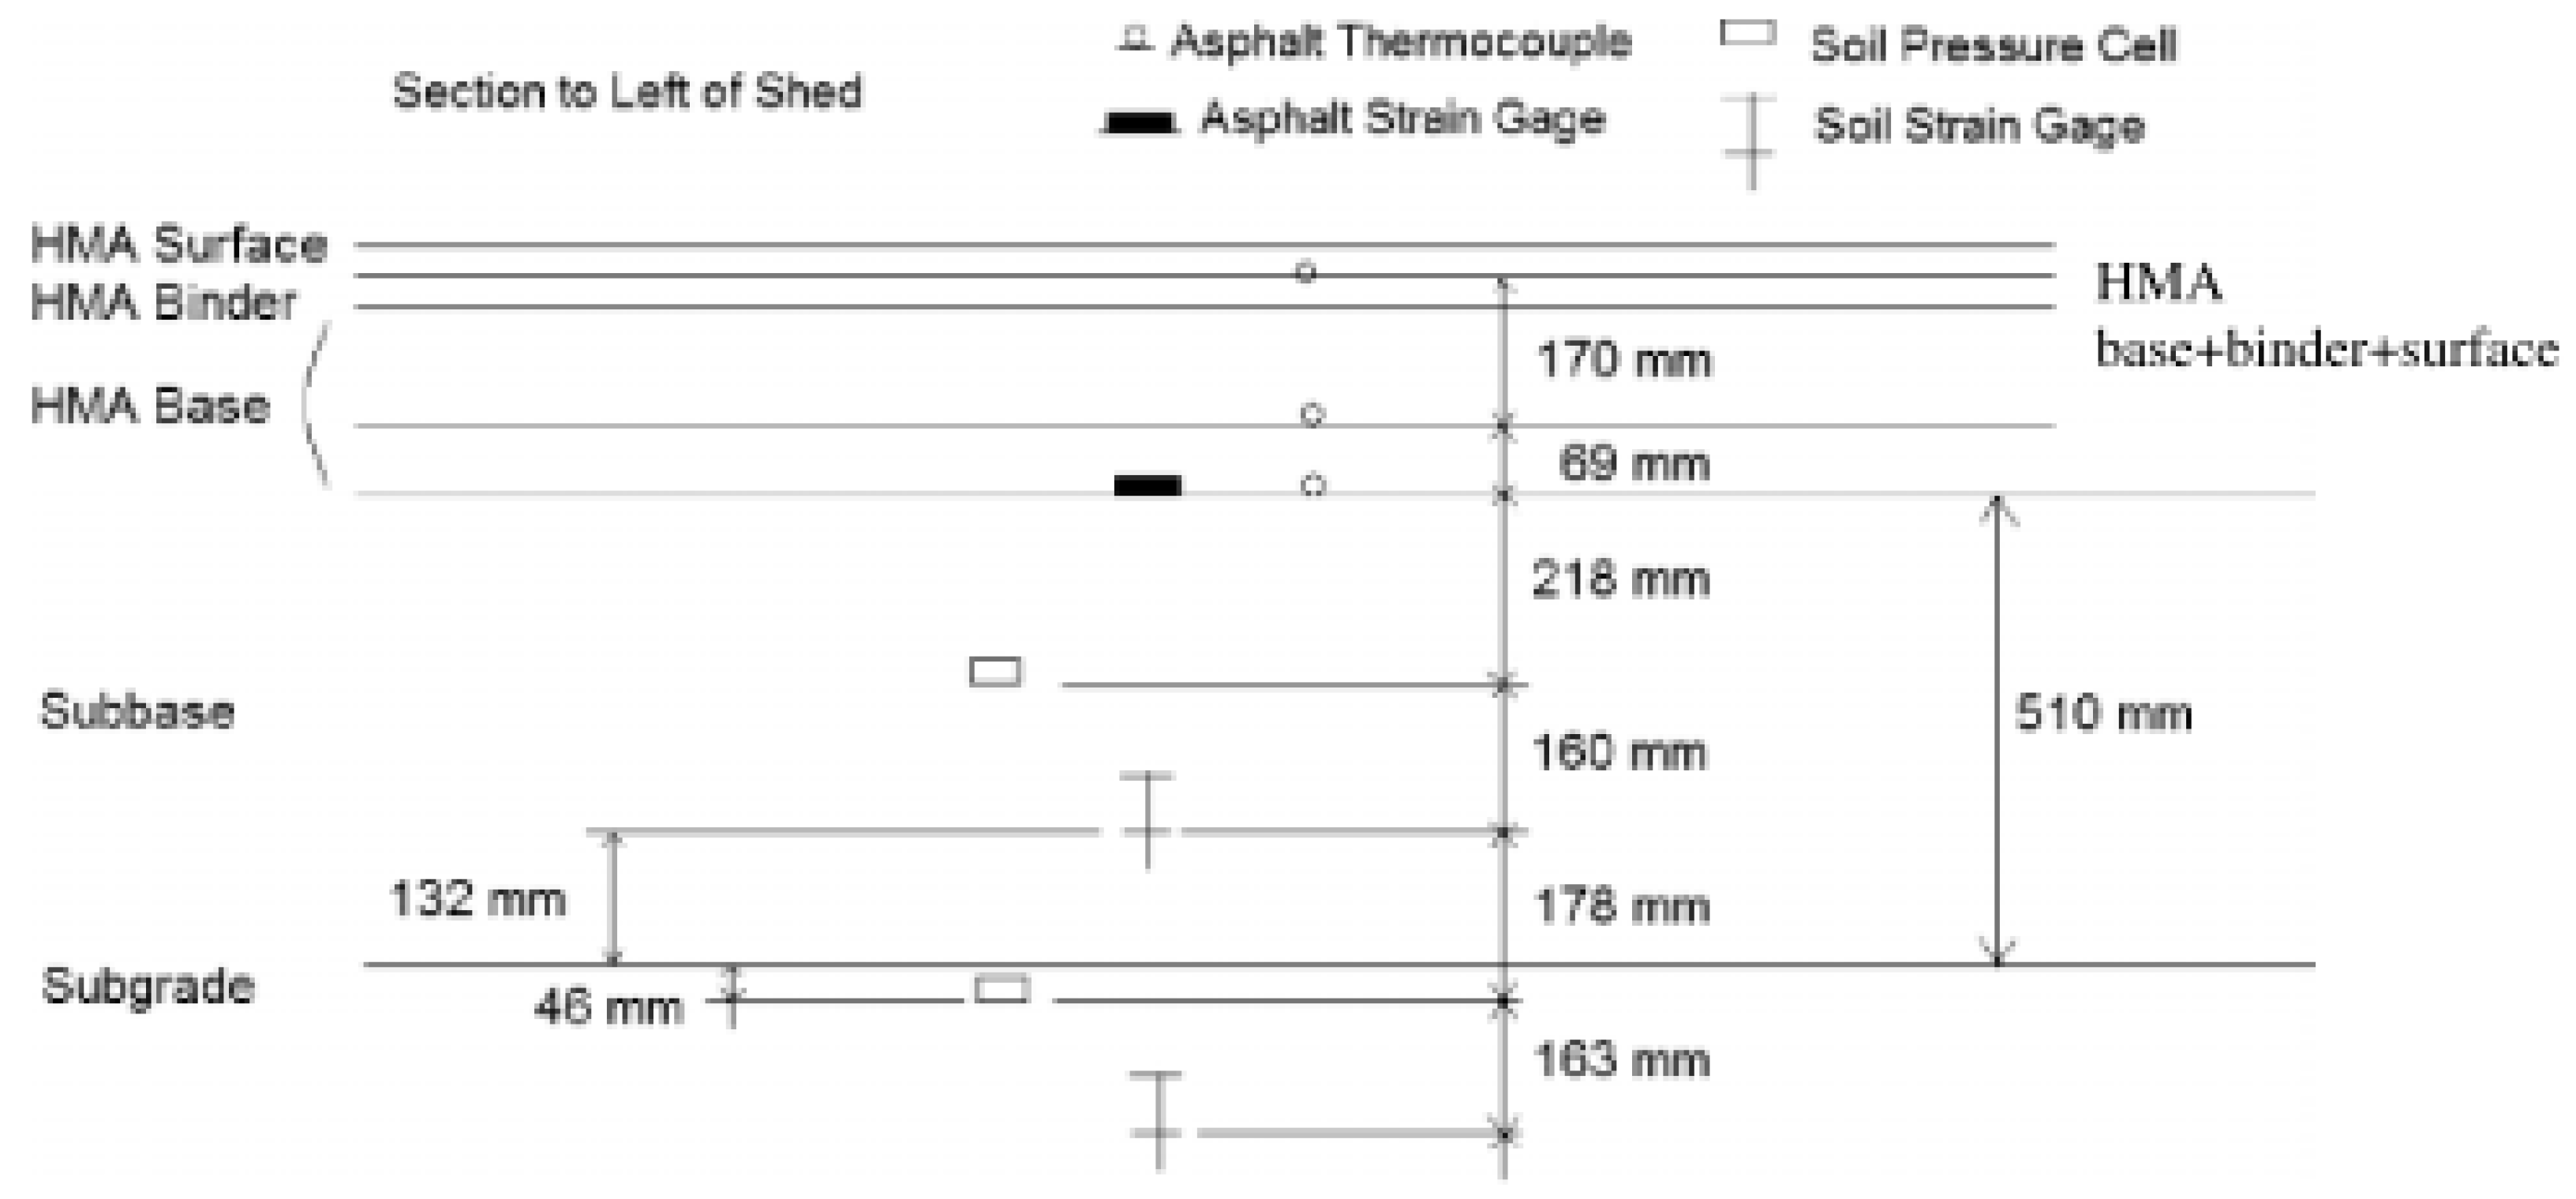
In 2005, the Maine Department of Transportation (DOT) built the first instrumented flexible pavement test section of the state of Maine [31]. The instrumentation took place during reconstruction work for a damaged road. The sensors installed were: 12 asphalt strain gauges, 6 asphalt thermocouples, 4 soil strain gauges, 4 soil pressure cells, 6 soil moisture gauges, 24 soil thermocouples, and 2 frost resistivity probes (Figure 8). Each type of sensor was connected to its own data acquisition system. The systems allowed both dynamic and static data collection.
This study proved that asphalt strain gauges installation is a very delicate process. In fact, among the 12 sensors embedded, 3 of them did not survive the construction phases.
A model for subsurface temperature prediction was developed on the basis of temperature data collected over 5 months.
Stress and strain data were collected by running several passages with a truck with a known axle load. Three loading cases were considered. Each case included truck passages at five different speeds carried out in a short-range temperature in order to determine speed and temperature effect on pavement response.
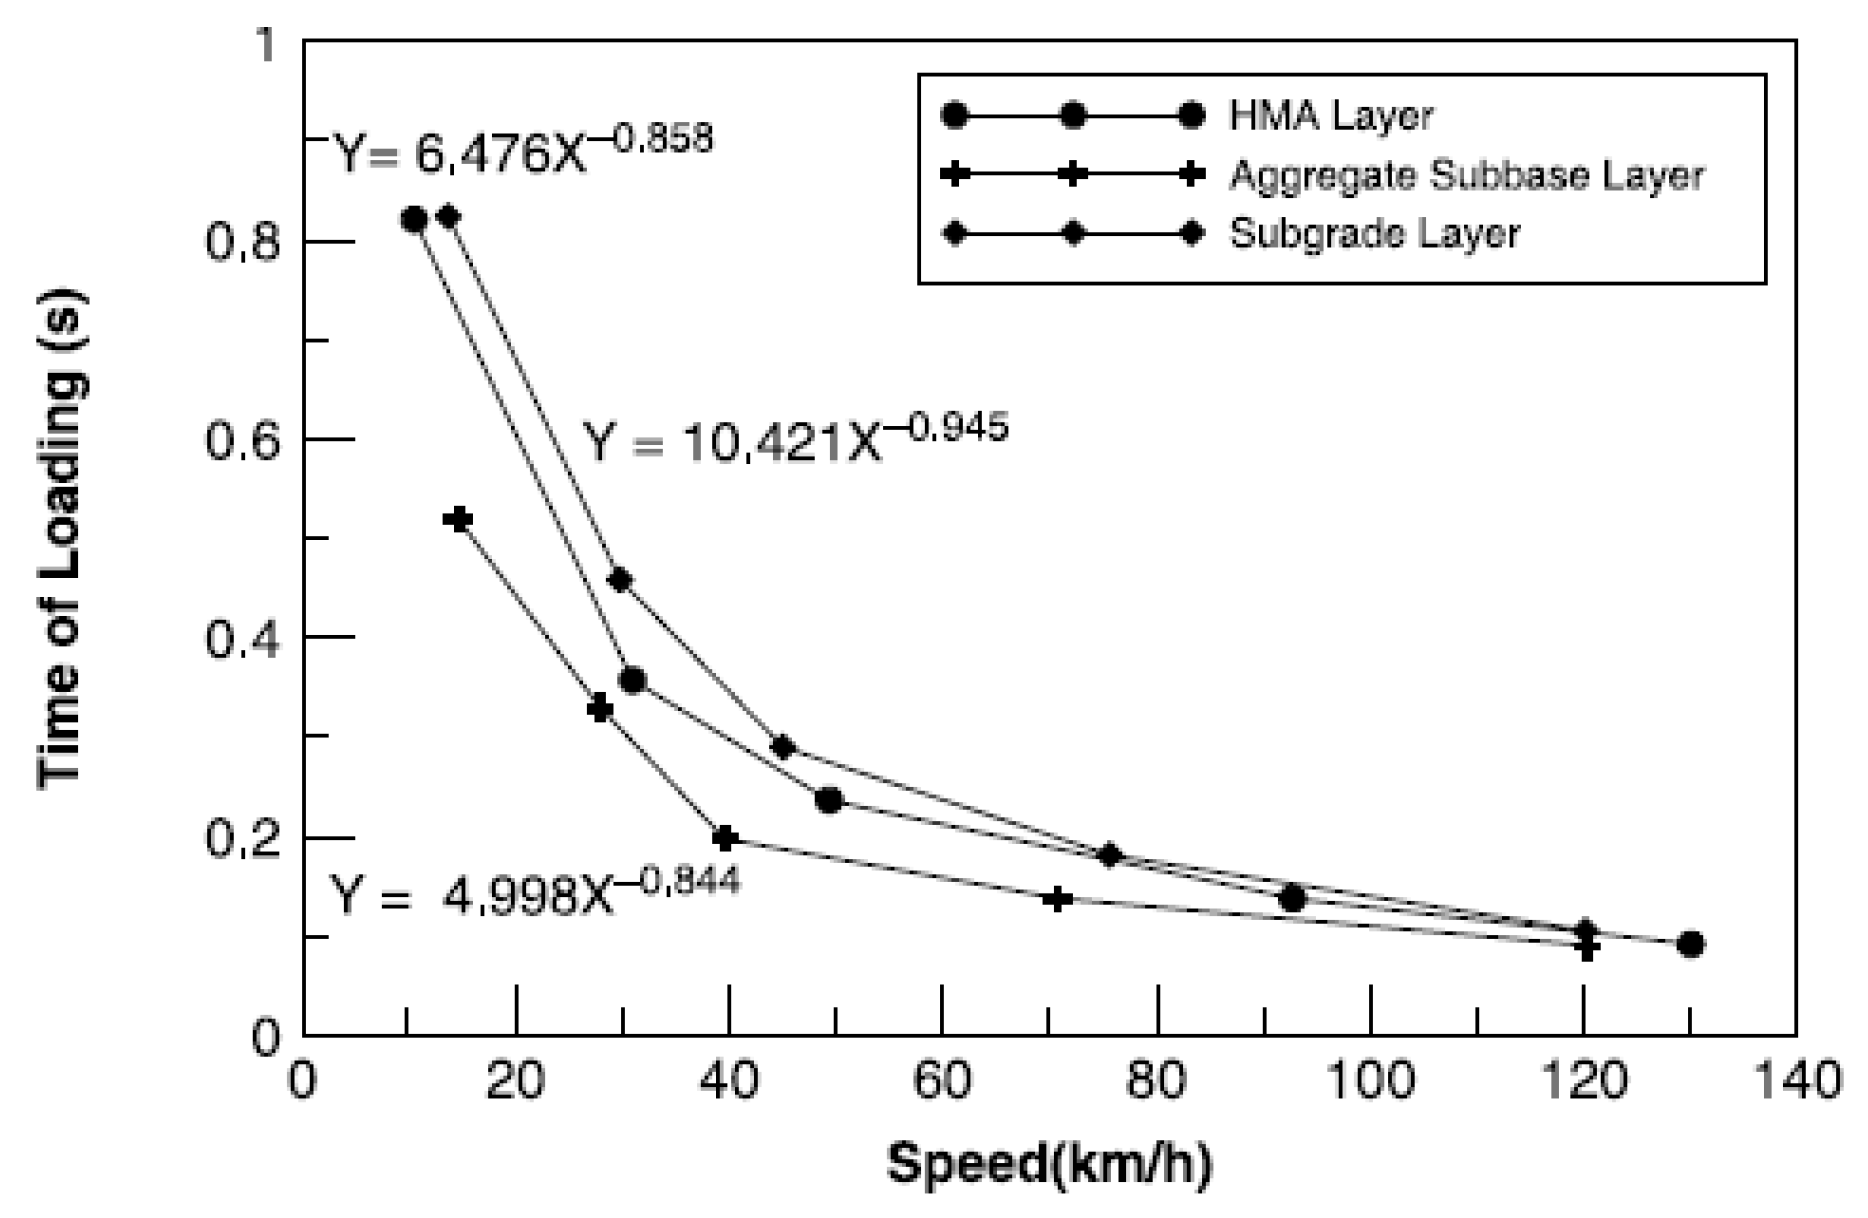
It was found that the time of loading (due to different speeds) does not vary at different depths (Figure 9), while speed variation has a significant impact on the measured strain. Finally, an elastic model (BISAR, [38]) was used to model the experimental campaign. A good match between experimental and numerical results was obtained for low temperatures and speeds.
3.3. State of Virginia: Instrumentation of Route 114 in Christiansburg
In the state of Virginia at the Virginia Tech Transportation Department, a monitoring system was developed for the instrumentation of the Virginia State Route 114 in 2011 during the implementation of maintenance activities [39]. The objective of this research project was the development of an inverse calculation methodology for weigh-in-motion (WIM), traffic classification, and monitoring of the pavement health conditions.
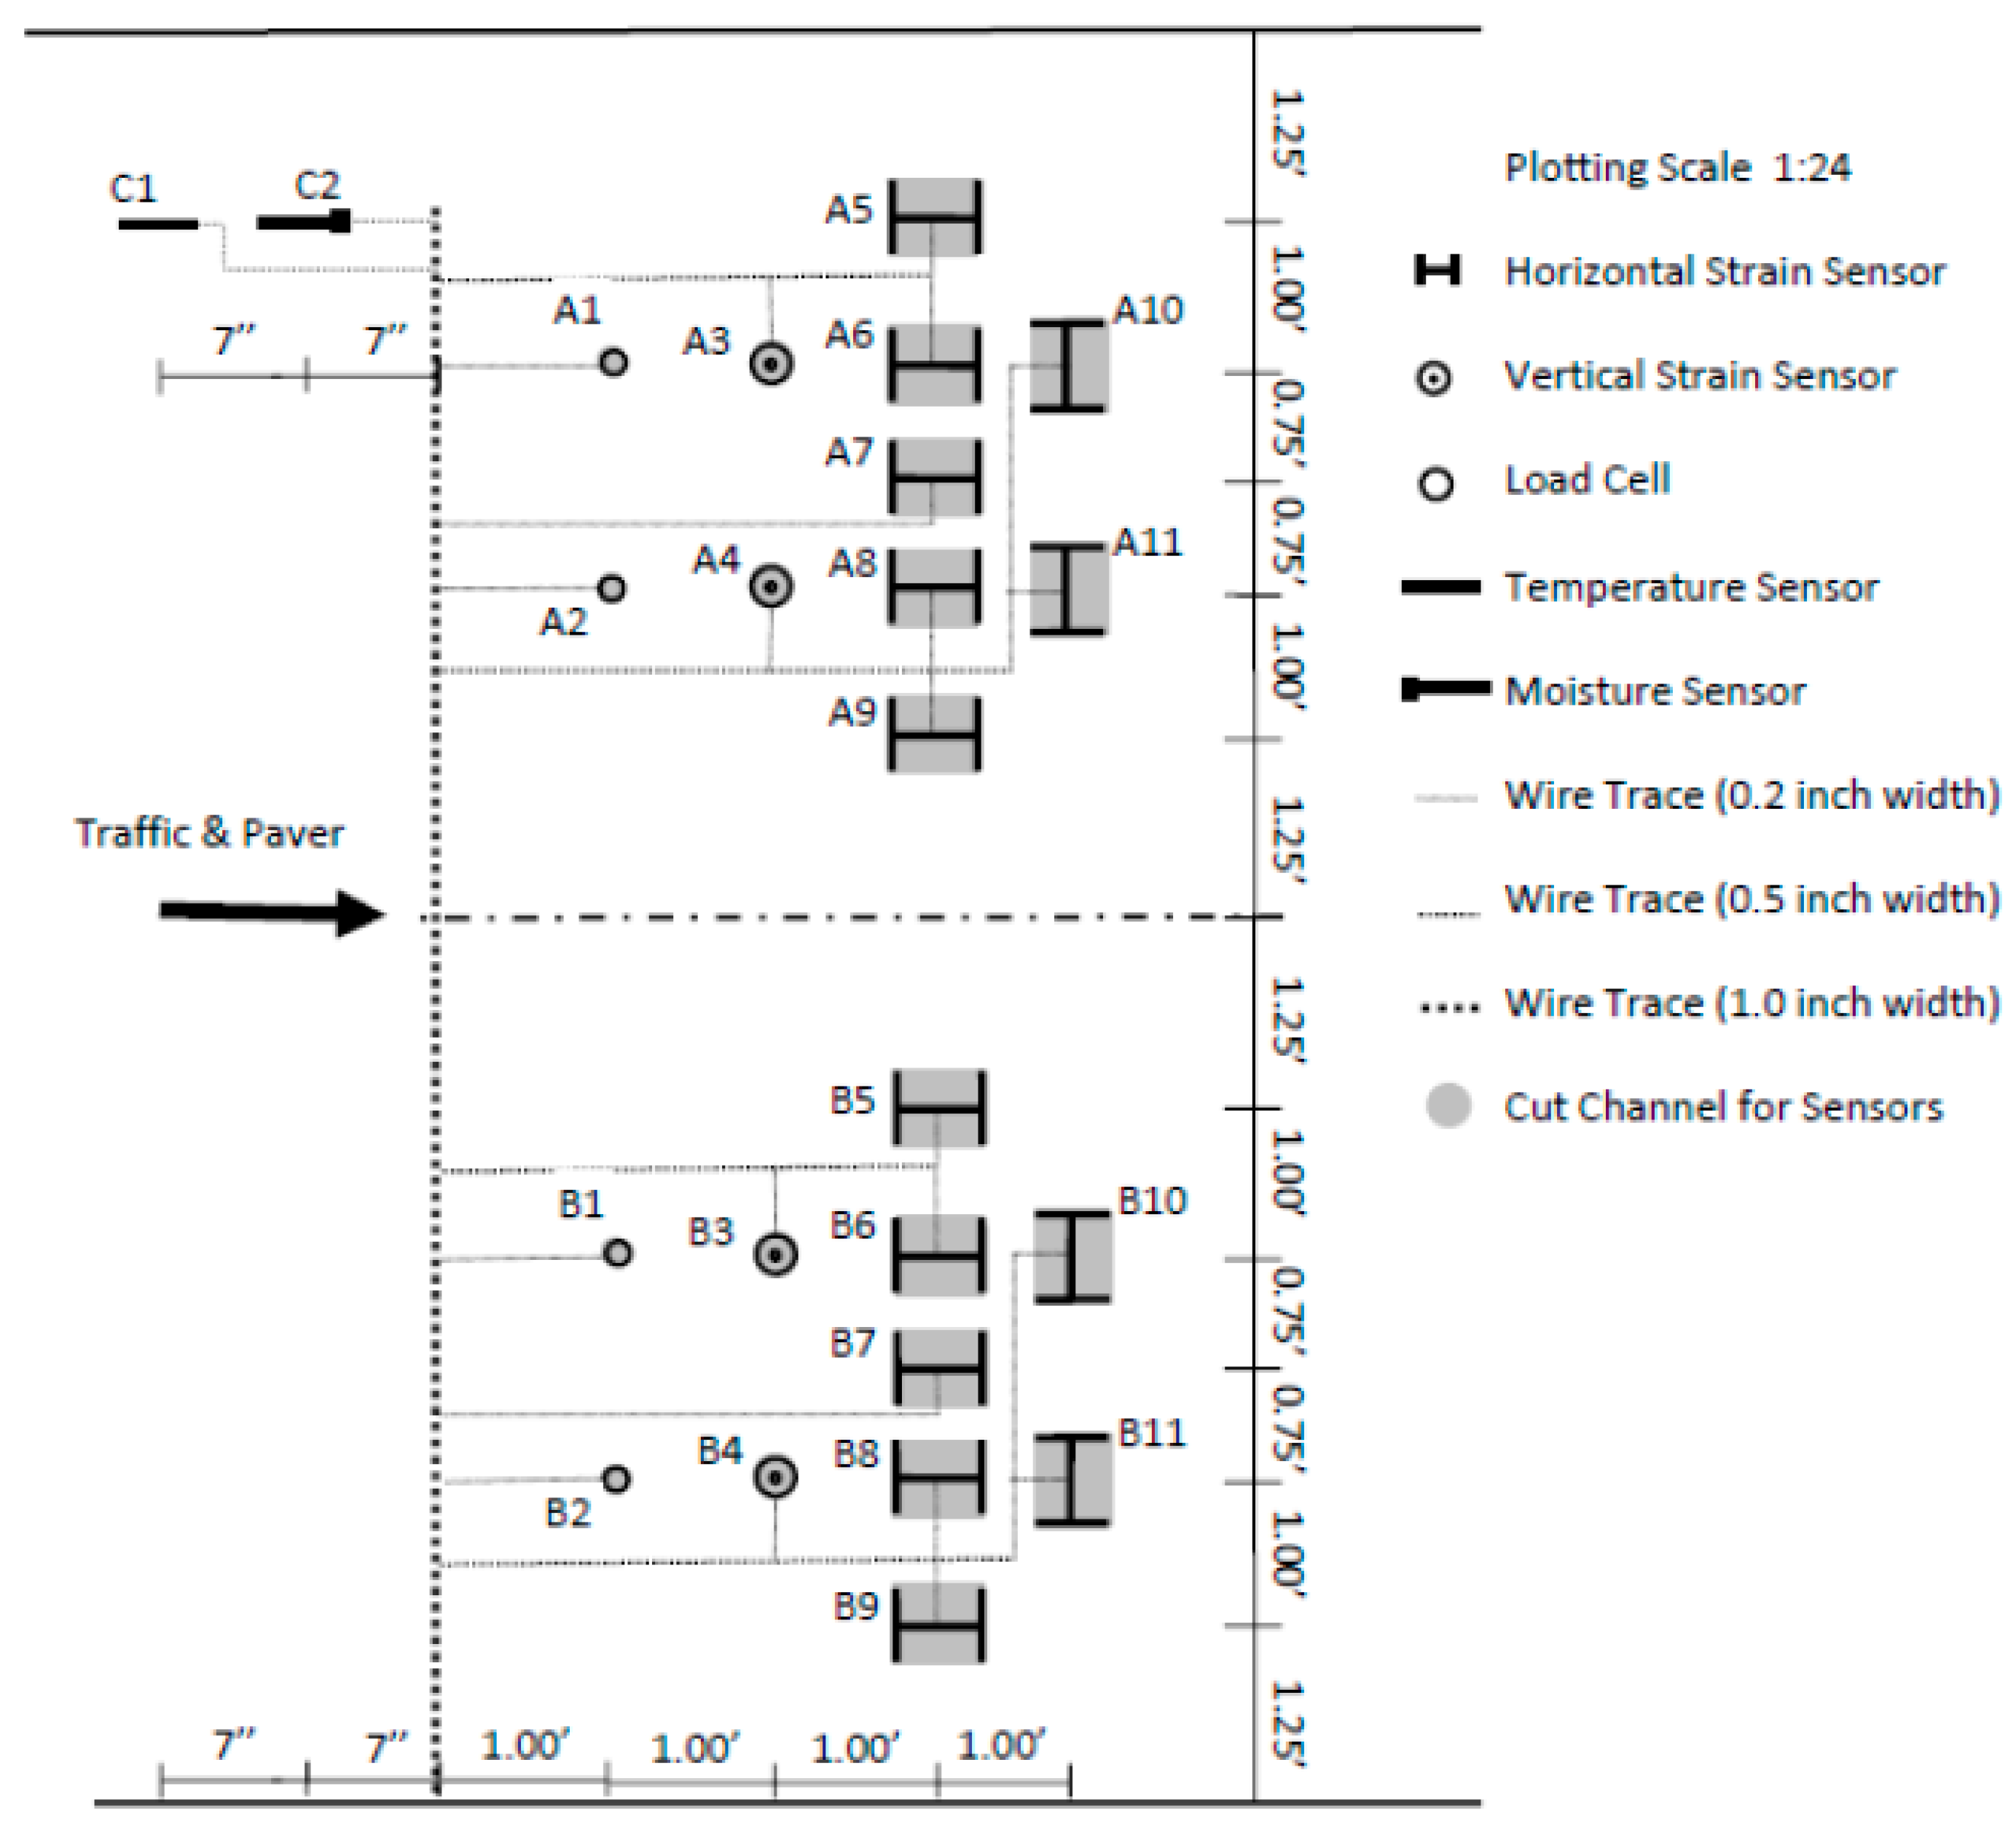
An array of sensors was deployed for this instrumentation campaign: horizontal and vertical asphalt strain gauges, soil pressure gauges, thermocouples, and soil moisture probes. In addition, a wireless data logger was used to collect data from the sensors and transfer them to a laptop. Figure 10 is a representation of the sensors’ positioning in the pavement. The authors placed 5 horizontal strain gauges in the longitudinal direction (with respect to traffic direction) in order to estimate vehicle wandering. Indeed, inverse calculation of pavement mechanical conditions requires knowledge of the applied load, as well as its position with respect to the sensors’ locations.
Finite element (FE) numerical simulations were performed with ABAQUS software in order to validate the correct functioning of commercial sensors after installation and for inverse calculation and prediction of distress. The initial objective was to determine the actual pavement modulus as the ratio between the measured vertical and horizontal strain. However, all the vertical asphalt strain gauges got damaged during construction. Therefore, the authors introduced the parameter Rzx:
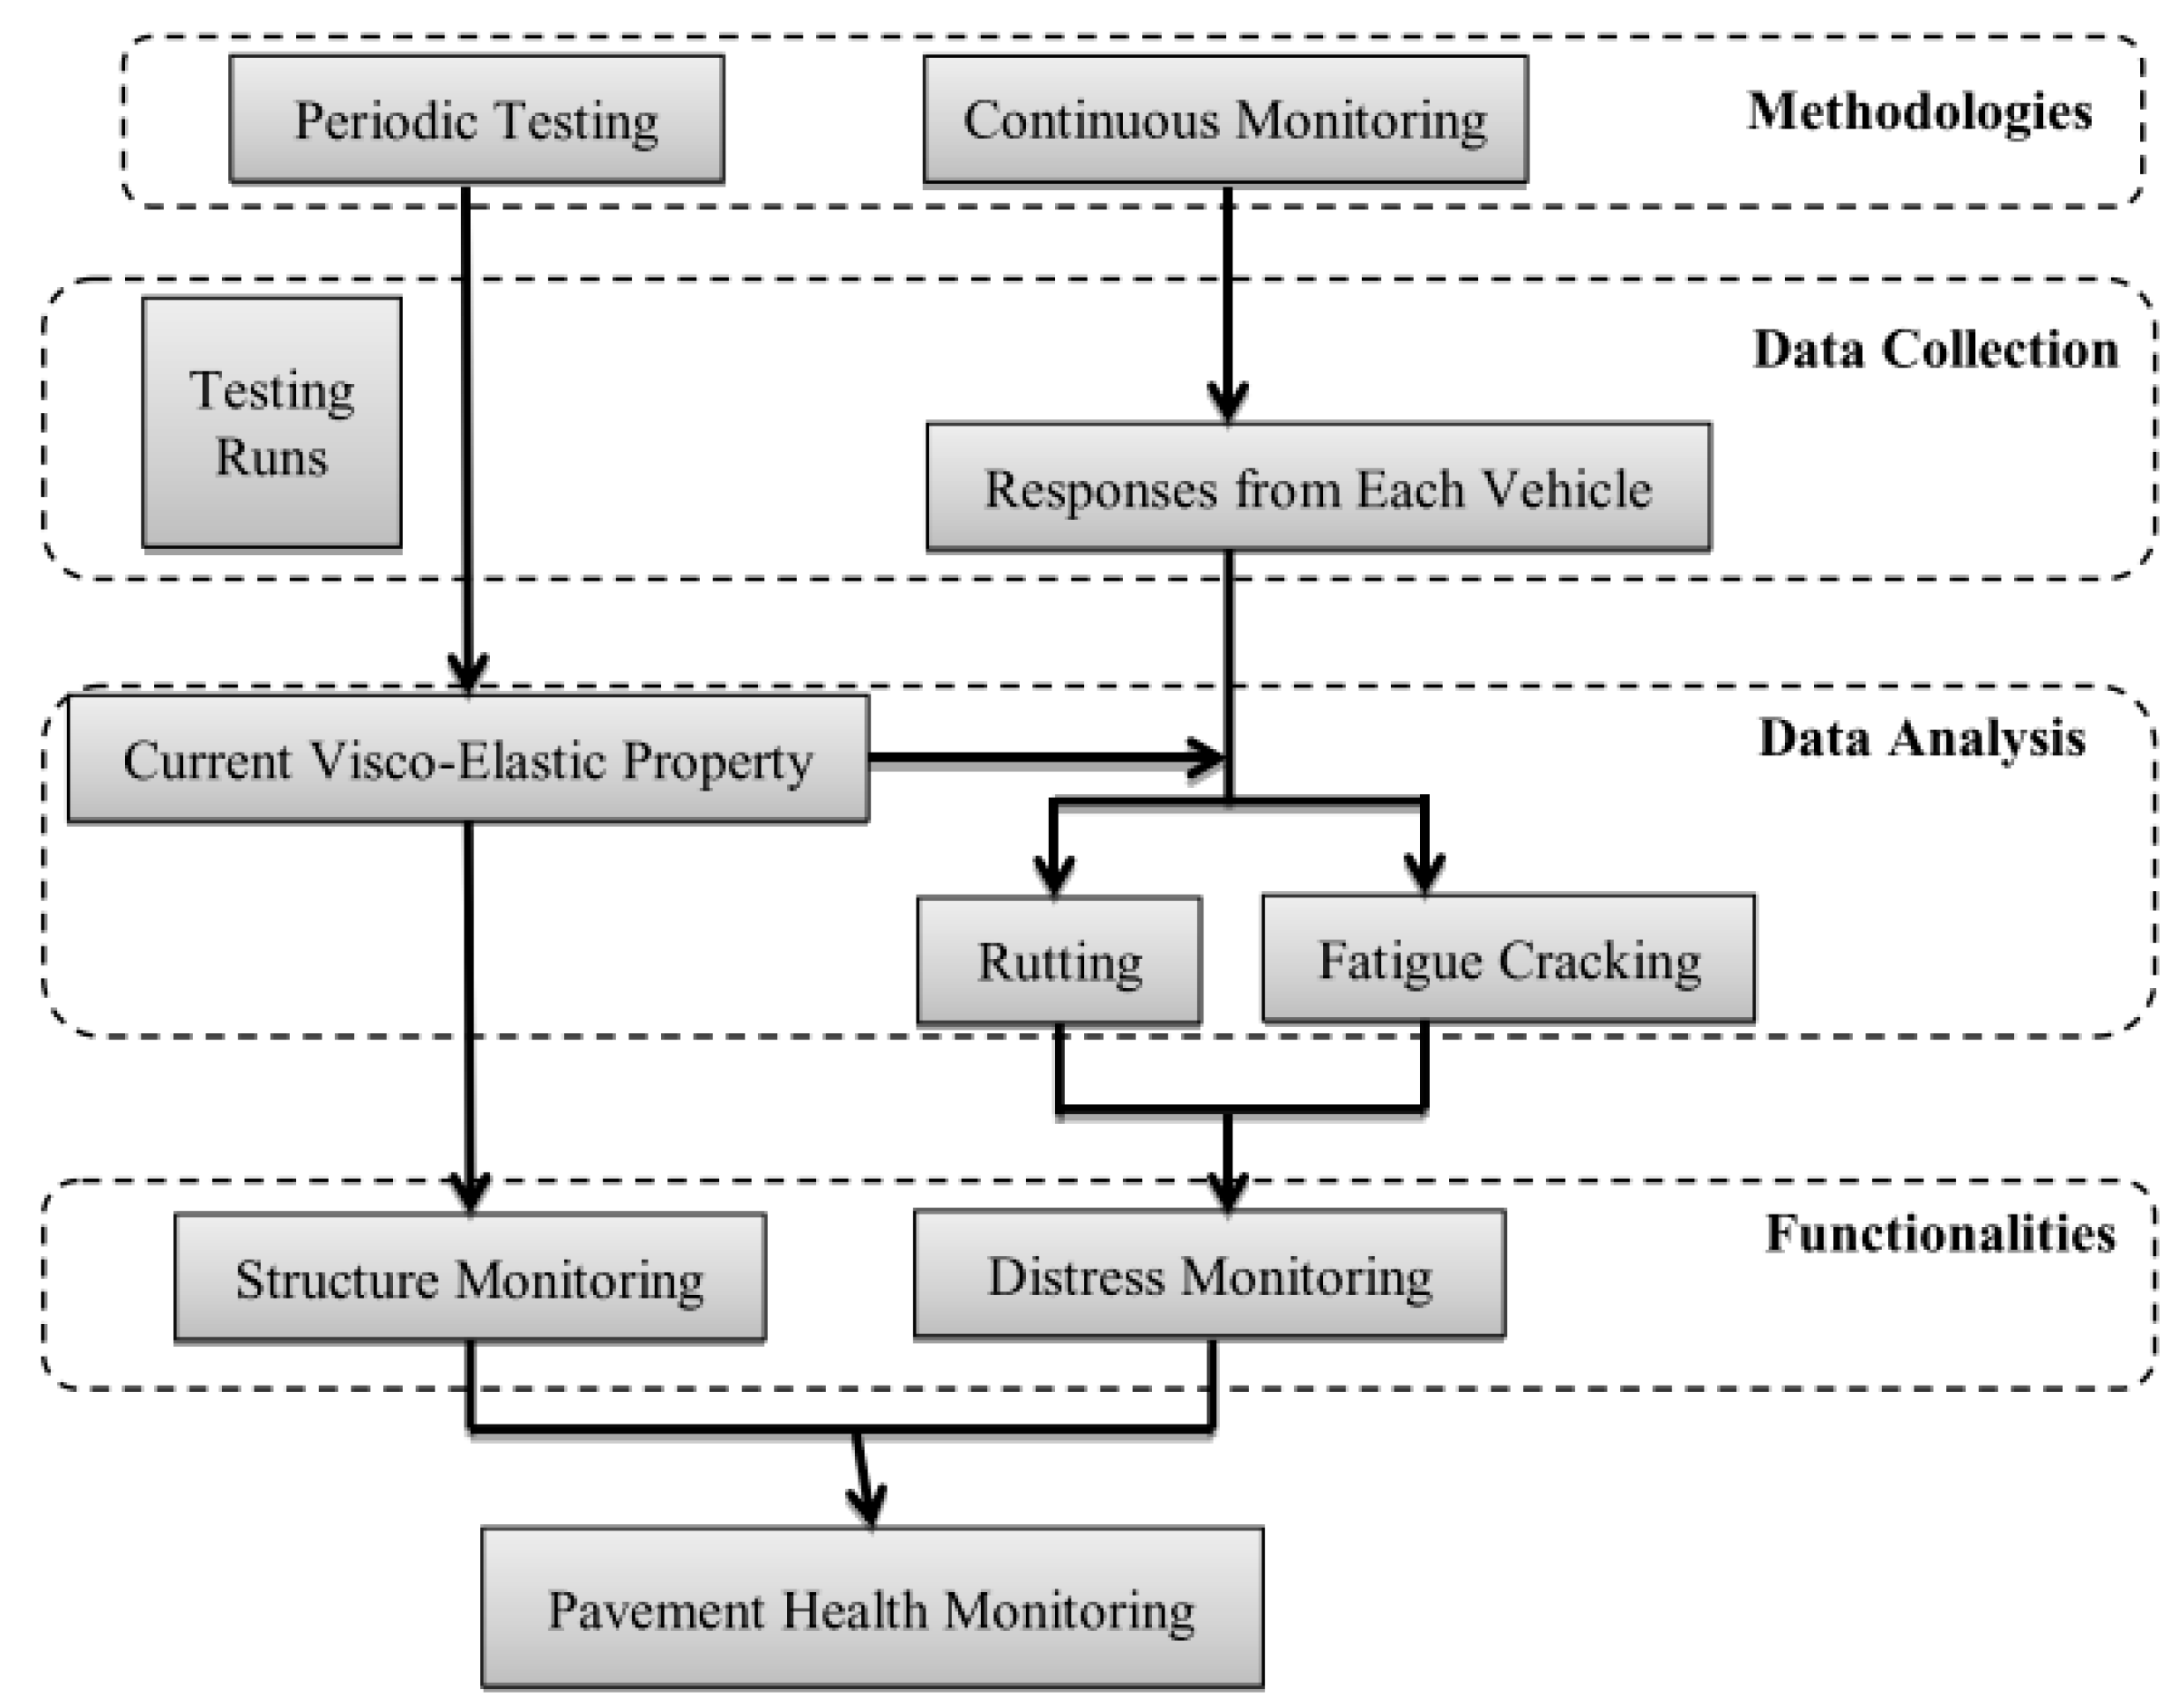
where σz is the measured vertical stress and εx is the measured longitudinal strain. By means of some FE calculations, the relation between Rzx and the pavement modulus was demonstrated; thus, Rzx was used for inverse calculation of the pavement’s current viscoelastic properties. This process was integrated in a health monitoring system proposed by the authors and represented in Figure 11. The system includes periodic testing with a known loading truck for the determination of the actual pavement mechanical properties’ thus, for structure monitoring. At the same time, these properties are implemented in the continuous monitoring section for fatigue cracking and rutting distress predictions, based on the Mechanistic-Empirical Pavement Design Guide (MEPDG) models [40].
Rzx = σz/εx
In addition, the instrumentation was exploited for WIM and traffic classification. In particular, FE modeling of the pavement deformation due to a passing wheel was performed through a bell-shaped Gaussian function, whose parameters were demonstrated to be related with wandering position, distance between wheels, width of tires, and axle loads. Finally, the signals from strain gauges were directly used to determine traffic volume and truck speed.
3.4. The Instrumentation of the A41N Highway in France
The instrumentation of the French highway A41N is part of a research project conducted in partnership between AREA, EIFFAGE Infrastructures, and the University of Lyon/ENTPE. The work was carried out in 2012 during some maintenance operations [41]. Two sections were instrumented with 47 strain gauges (horizontal and vertical asphalt strain gauges), 12 temperature probes, and 2 FBGs sensors. Sensors were located at different depths in the road structure so as to gain information about the wearing, base, and subbase course. The MGCplus data acquisition system provided by HBM was used with 5 acquisition modules. Measurements were acquired at 600 Hz.
An in situ campaign of measurements with a truck of known loading was carried out by performing passages at 3 different speeds (10 km/h, 50 km/h, and 90 km/h) and along 3 different trajectories (called “deltaD”) in order to assess structural pavement behavior.
Any loss of sensors was observed in this study. The analysis of data acquired during the experimental campaign showed that, in flexible pavements, measured strains were strongly impacted by vehicle speed, as well as by truck trajectory (Figure 12).
3.5. SMARTVIA®, the Smart Road
The Smartvia concept, developed by the Eurovia Research Center, aims at onsite pavement monitoring and is based on sensor integration, electronics for real-time acquisition and data storage, and data post-processing for interpretation of pavement response [42].
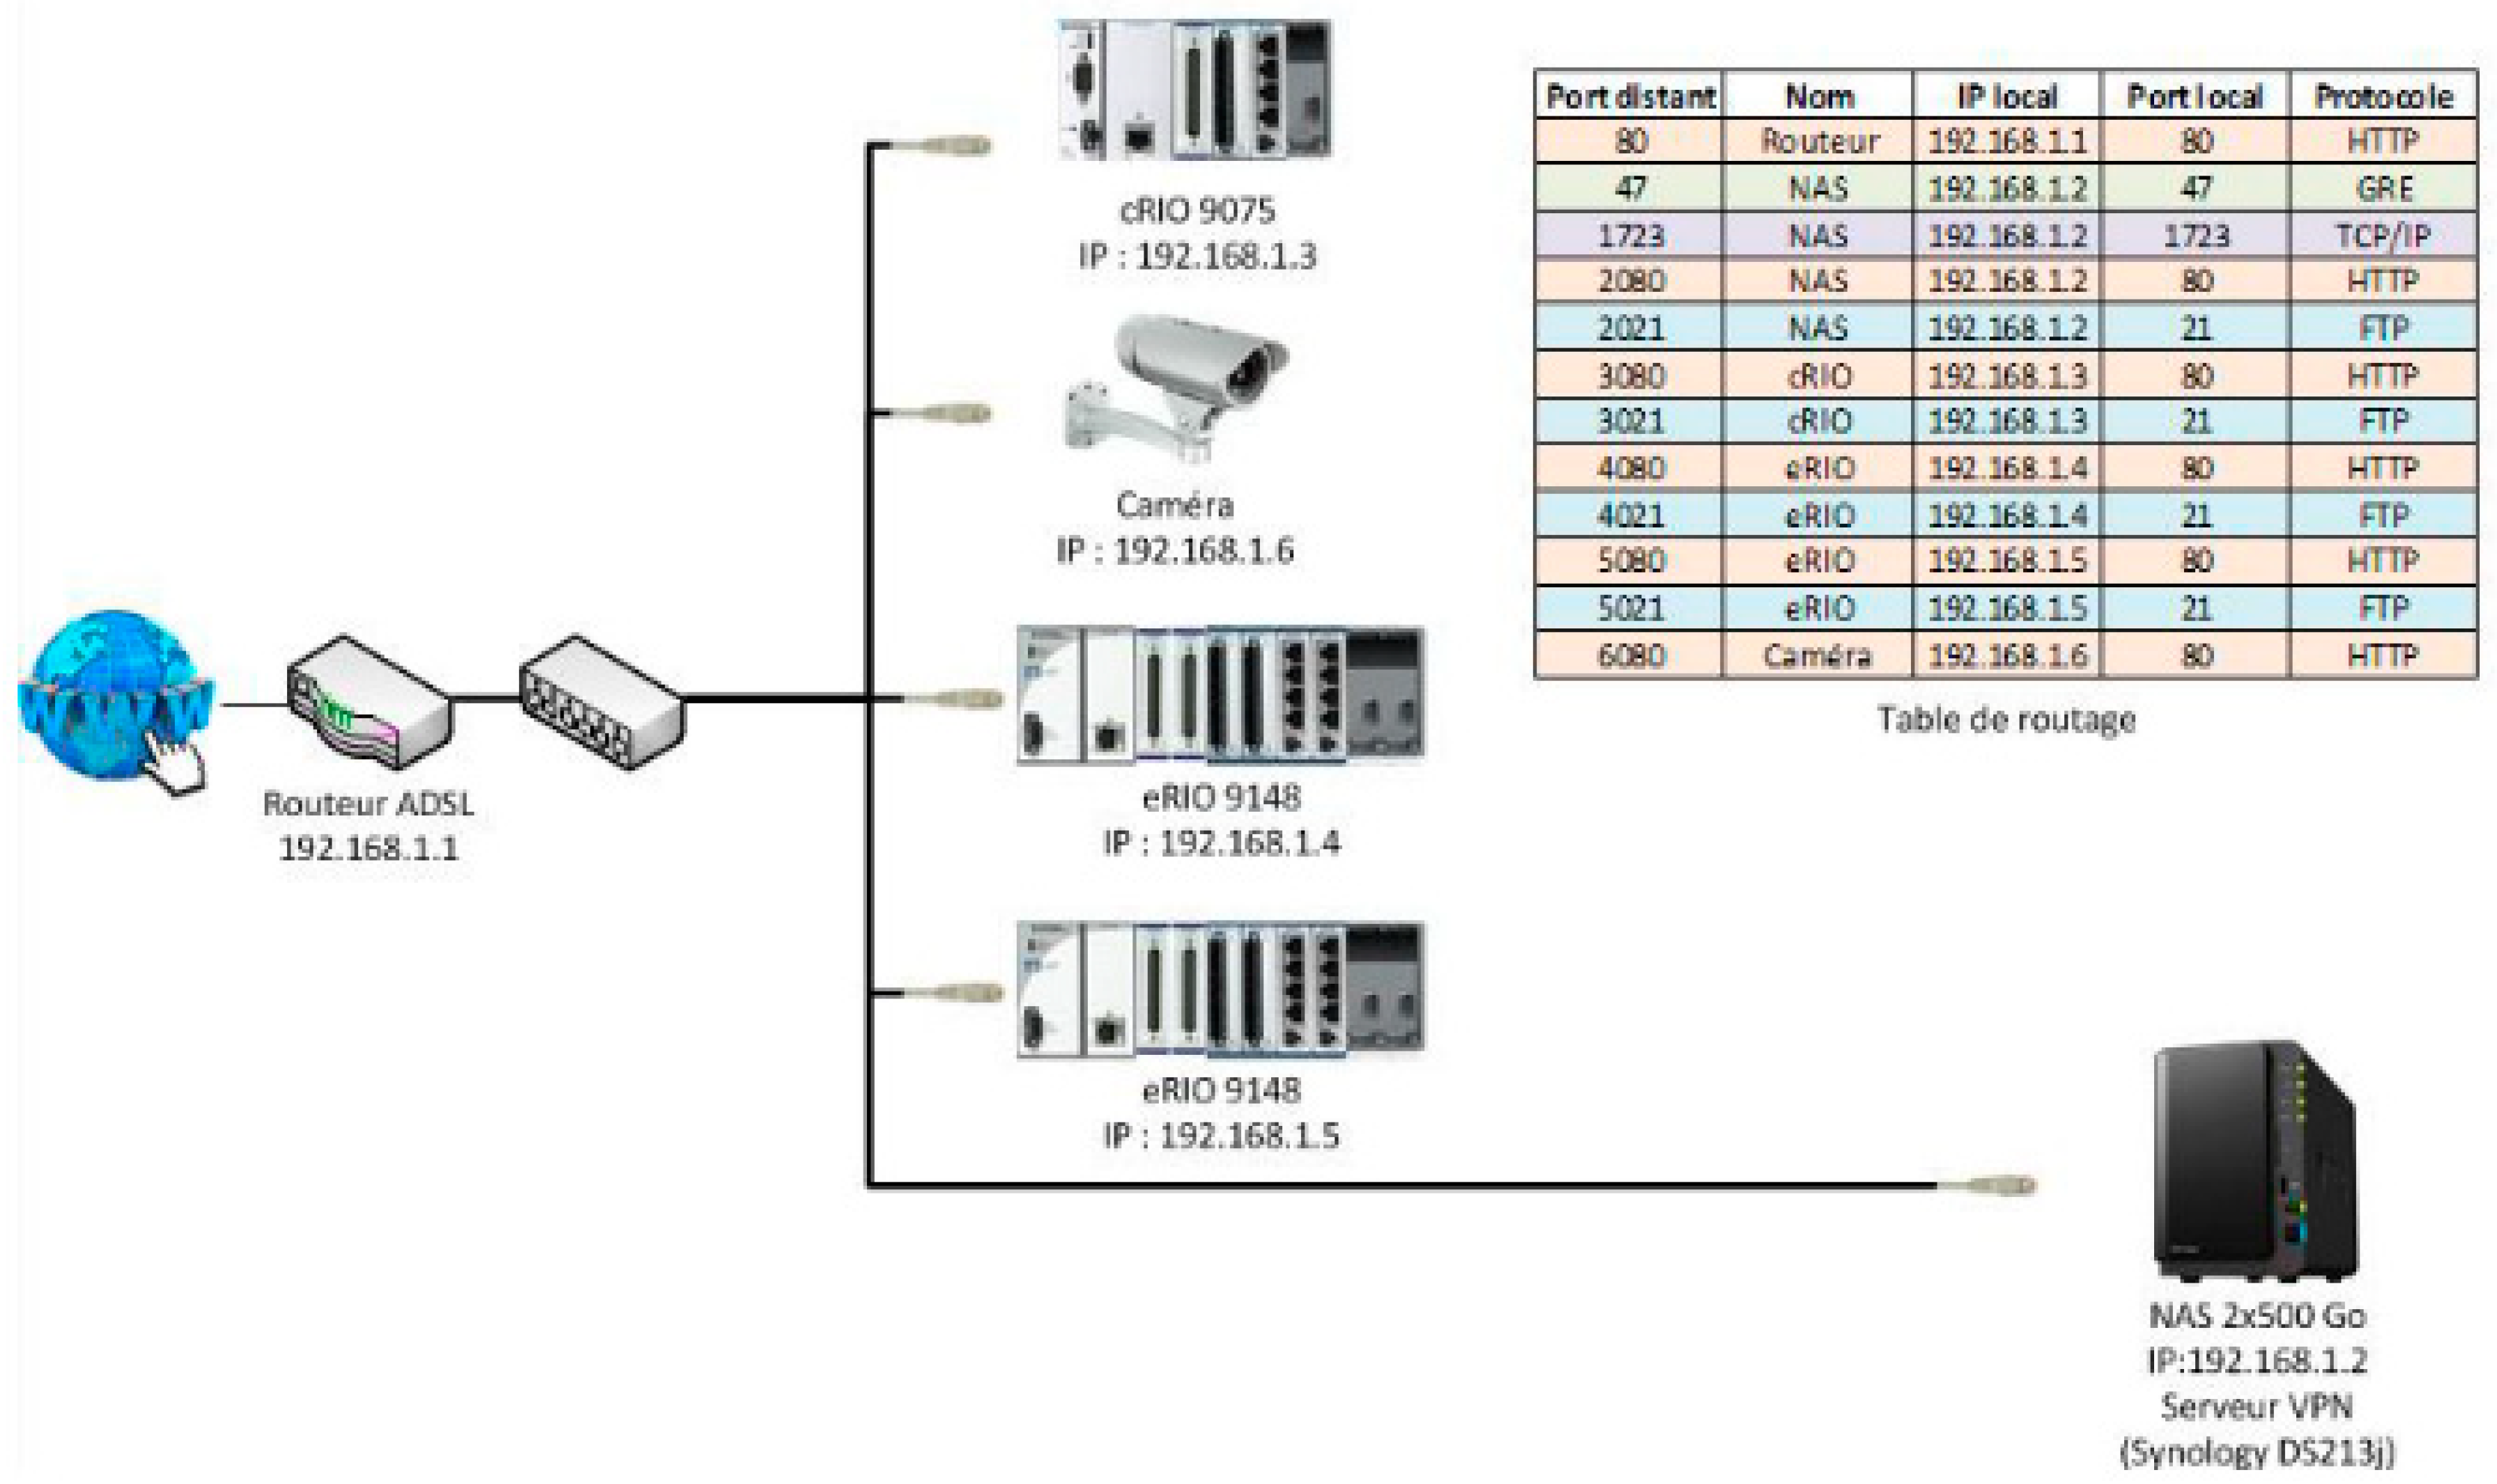
The first application in the field of this concept was performed in 2014 in the city of Lille (France), with the main objective to monitor the impact of trenches on new roads. The test section was composed of 7 instrumented nodes. A total of 98 sensing technologies were deployed: temperature sensors (PT100), strain gauges (H-gauges), moisture probes, and FBGs sensors. The data acquisition system (Figure 13) was composed by three data acquisition controllers. In addition, a digital camera was used for tracking every truck passing on the sensors. The data acquisition frequency was set 1 kHz and activated on event trigger.
Preliminary results documented the failure of almost all the H-gauges after 8 months due to corrosion, while a good feedback was obtained from the FBGs sensors.
3.6. Instrumented Section in China
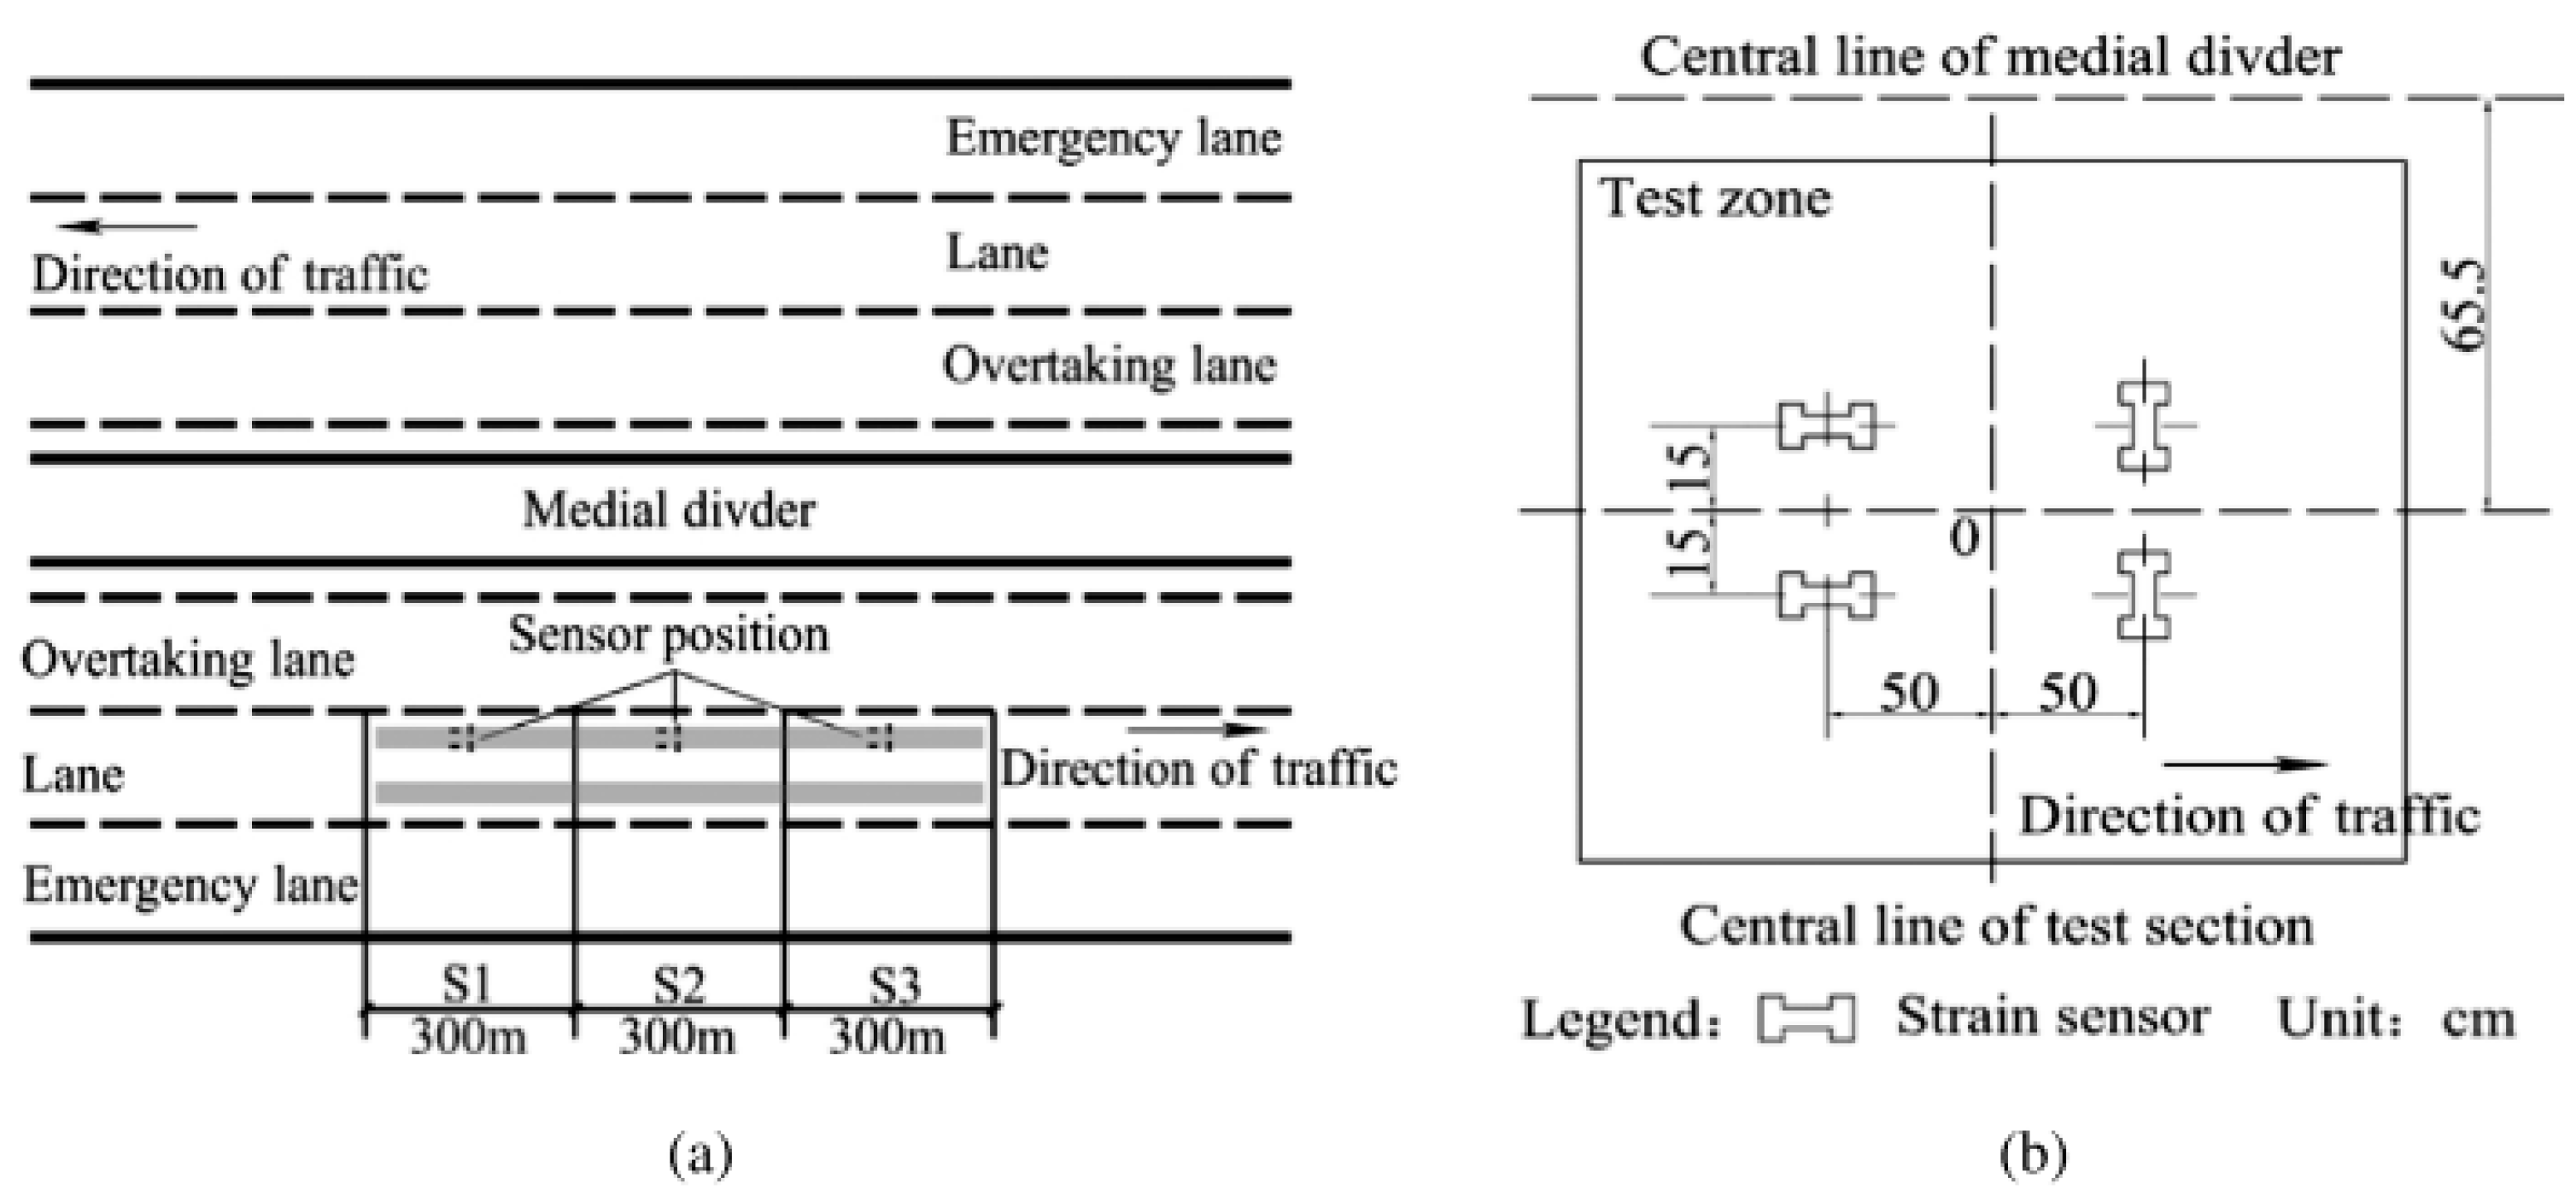
In order to investigate the strain response of asphalt pavement under different axle configurations, axle loads, speeds, and pavement temperatures, a 900-m-long road was instrumented in China [43]. A 4-lane and 2-way road was built using 3 types of pavement structures (semi-rigid, inverted, and compound asphalt pavement) for a length of 300 m each (Figure 14). Each section was instrumented with 4 asphalt strain gauges having 2 different orientations with respect to the traffic direction, as shown in Figure 14.
An experimental campaign was conducted with 2 trucks having different geometric configurations: single rear axle (truck 1) and tandem rear axle (truck 2). Three levels of axle loads were set: 98, 138, and 177 kN for truck 1 and 177, 255, and 334 kN for truck 2. Truck passages were conducted at three different temperatures (12, 21, and 43 °C) and two set of speeds:
- for the single axle load ≤ 138 kN and tandem axle axle load < 255 kN, 20, 40, 60, and 80 km/h and
- for the single axle load > 138 kN and tandem axle axle load ≥ 255 kN, 20, 30, 40, and 60 km/h.
Results showed how strain increases with increased axle load, decreases with the increase of speed, and increases with the rise of temperature. Thus, a combination of high loading and high temperatures could accelerate the occurrence of fatigue damage. In addition, the “truck 2” configuration generated higher strains than “truck 1”. Finally, a multivariate regression model was used to predict strain responses, and a good match between numerical and experimental results was found.
3.7. Monitoring of the Motorway A10 in France
A part of the highway A10 in France was instrumented during the rebuilding of the lane reserved for slow vehicles [44]. The objective of this project was to evaluate the moduli of the pavement layers and control their evolution with time.
Four sections (PR15+700, PR15+900, PR16+850, and PR17+100) were instrumented, with a total of 2 vertical ASGs and 5 horizontal ASGs per section. A fifth section (PR16+026) was instrumented with 2 geophones and 2 temperature probes. The pavement structures and the sensors layout are presented in Figure 15. A wireless data acquisition device, called PEGASE, was used for remote monitoring. The PEGASE device (developed by IFSTTAR and licenced by the company A3IP, France) permits data transfer from up to eight sensors (typically temperature and strain gauges in quarter, half, or full-bridge configuration) to a cloud-based supervisor and database (via 4G network) for further analyses. In addition, by integrating a low-power GPS receiver, the system allows accurate data dating and localization.
An experimental campaign with two reference trucks (deflectograph and five-axle semi-trailer with tridem real axle) was conducted, as detailed in Table 2.
Pavement calculations were performed to model the measurement campaign and inverse calculate the pavement moduli. The French software for pavement design, ALIZE, was used. It is based on the multilayer Brumister model [45]. Good agreement was found between numerical and experimental results. The moduli of the layers were calculated by fitting strain measurements within the pavement with the modeling data. This study also showed the good sensitivity and repeatability of geophone responses and suggested further investigation of this type of transducers for pavement monitoring.
3.8. Continuous Monitoring by Using Geophones and ASGs (French motorway)
During the reconstruction of the slow lane of a French motorway, instrumentation was set up for continuous monitoring based on the coupling of ASGs with geophones and temperature probes [46]. The pavement structure and the sensors layout are shown in Figure 16. The PEGASE Platform was used as the data acquisition system.
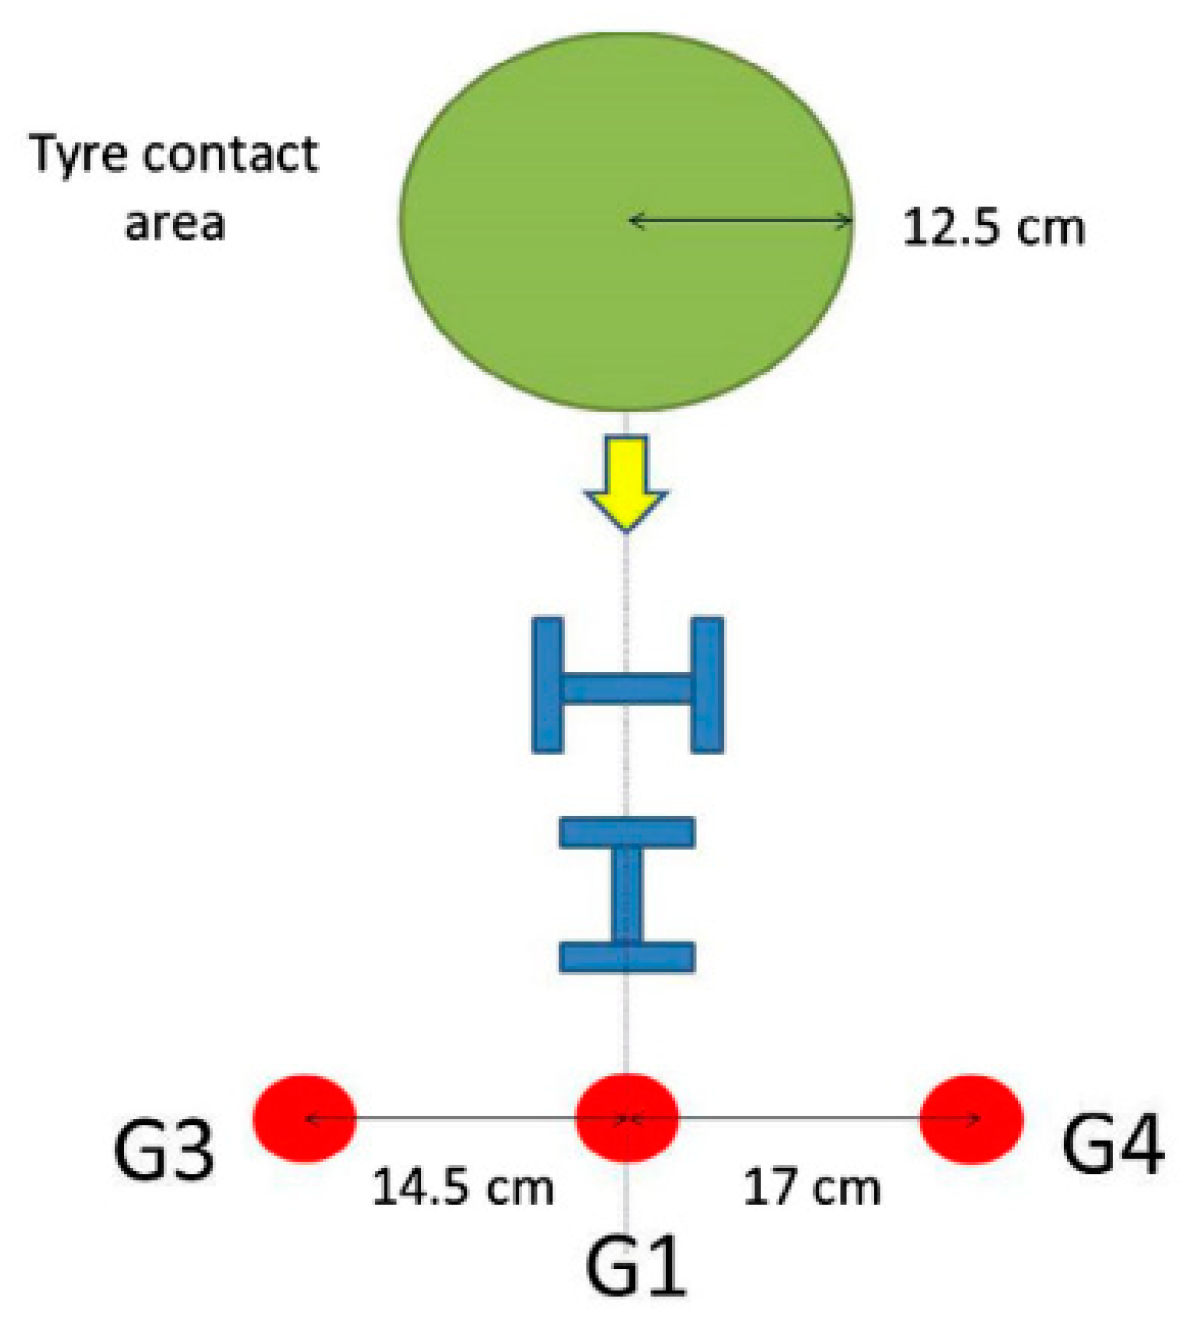
Due to the impossibility to close the lane and perform measurements with a known truck, the acquisition was carried out under real traffic. Measurements show high sensitivity of strains to vehicle type and wandering. Thus, the authors developed a methodology to select a signal associated to heavy traffic passing right above the strain sensors by analyzing the signal recorded by the geophones placed at different lateral positions (Figure 17). This showed the feasibility of pavement monitoring under real traffic.
Pavement calculations were performed by using the software ALIZE and Viscoroute© [47]. In the latter, the pavement was described as a multilayer structure. In addition, Viscoroute© allowed to account for the viscoelastic behavior of the asphalt materials through the Huet-Sayegh model [48,49]. Results highlighted the importance to take into account the viscoelastic properties of bituminous materials and to consider the interface contribution for a better prediction of the pavement response under loading at high temperatures.
4. Discussion and Future Trends
Pavement management systems provide decision-makers with adapted and cost-effective maintenance strategies according to the needs of the road network. Thus, the quality of data collected via the adopted monitoring technology is decisive in defining the right actions to take and, consequently, for appropriate money investments [50].
Road monitoring via embedded sensing technologies is considered a powerful tool for pavement auscultation. In fact, sensors embedded in the pavement allow remote and continuous control with a considerable saving of time and no traffic disruptions. At the same time, adapted data acquisition systems and well-defined strategies for the post-processing of data are required in order to enhance an instrumentation project.
Various sensing technologies for road instrumentation are available on the market. The most known and deployed are described in Section 2. They allow the assessment of pavement response under moving loads and due to climate changes in terms of stress, strain, deflection, temperature, and water content. Sensors are designed to be asphalt-compatible and provide very accurate measurements. However, feedbacks from real applications have shown some drawbacks, and the need pursue further research in this field. ASGs still present a great loss of sensors in the installation phase, with vertical ASGs having a survival rate lower than the horizontal ASGs. This is primarily due to high temperatures, as well as rolling and vibrations generated during compaction. These conditions represent a restriction for the use FOSs as well. Still, the latter seem to be less intrusive than ASGs, due to their smaller dimensions. In terms of sensing configurations, similarly to ASGs, FP and FBG technologies can provide local strain measurements in the road pavement. Thus, the three of them seem to be more appropriate for monitoring of specific road sections. DFO sensors are sensitive at each point of their length; thus, they can monitor strain across a big portion of the structure under investigation, with higher spatial resolution. Some studies also show the potentiality of geophones and accelerometers to measure pavement deflections, which can be used for inverse calculation of pavement moduli. These devices are less intrusive than LVTDs, but require a more complex data treatment process, as the signal has to be integrated.
Concerning the inverse calculation of pavement health conditions, the studies described in Section 3 show that the general strategy is based on a purely mechanical approach. Due to the complexity of asphalt materials, measurements within the pavement are affected by temperature, vehicle speed, and vehicle transverse position with respect to sensors’ locations. In addition, some studies have highlighted the fact that a viscoelastic model that takes into account the interface-effective bonding conditions can better predict pavement response under moving loads, especially at high temperatures.
Some innovative solutions that can overcome the aforementioned drawbacks are emerging and making their way in the field of pavement instrumentation. Alavi et al. [51] propose a smart-sensing technology based on the use of self-powered piezoelectric sensors that could be distributed in the pavement for continuous monitoring. Their methodology is based on relative damage; thus, there is no need to directly measure absolute strain in the pavement. In addition, they show an interest in the use of statistical techniques for data analysis. Lebental et al. [52] propose and approach the monitoring of construction materials that rely on the use of sensors based on nanomaterials. They demonstrate the embeddability of nanosensors, both in concrete and asphalt materials, and highlight the higher sensitivity of these devices with respect to traditional technologies.
5. Conclusions
Real-time, long-term monitoring of road infrastructures has a crucial role in pavement management systems. The assessment of the actual pavement health conditions enables us to plan appropriate and efficient maintenance actions leading to the improvement of road safety and the extension of their service lives.
This paper is a review of the most used sensing technologies for road pavement instrumentation, as well as the most significant instrumented sections and data interpretation frameworks. Several studies were analyzed and commented on. It emerged that the sensing technologies usually deployed in instrumentation projects were compatible with asphalt materials and could provide very accurate measurements. However, the sensor loss rate is still high, especially during construction process. This points to a lack of experience with respect to sensor robustness, as well as maintenance operations to take once these devices are embedded in the road pavement. The importance in developing a strategy for data interpretation has been proved. Finally, some future trends with regards to the development of lower cost and more asphalt-compatible solutions for long-term monitoring were presented.
Author Contributions
Writing—original draft preparation, M.B.; writing—review and editing, S.P., B.L., and J.V.R. All authors have read and agreed to the published version of the manuscript.
Funding
This research has received funding from the European Union’s Horizon 2020 Programme under the Marie Curie-Sklodowska Actions for research, technological development, and demonstration, grant n. 721493.
Conflicts of Interest
The authors declare no conflicts of interest. The funders had no role in the design of the study; in the collection, analyses, or interpretation of data; in the writing of the manuscript; or in the decision to publish the results.
References
- ERF Working Group on Road Asset Management. Road Asset Management—An ERF Position Paper for Maintaining and Improving a Sustainable and Efficient Road Network; European Union Road Federation: Brussels, Belgium, 2014. [Google Scholar]
- AASHTO. AASHTO Guidelines for Pavement Management Systems; American Association of State Highway and Transportation Officials: Washington, DC, USA, 1990. [Google Scholar]
- Wolters, A.; Zimmerman, K.; Schattler, K.; Rietgraf, A. Implementing Pavement Management Systems for Local Agencies; IDEALS: Rantoul, IL, USA, 2011. [Google Scholar]
- FHWA; AASHTO. AASHTO Transportation Asset Management Guide—A Focus on Implementation; American Association of State Highway and Transportation Officials: Washington, DC, USA, 2013. [Google Scholar]
- FHWA. Practical Guide for Quality Management of Pavement Condition Data Collection; Washington, DC, USA, 2013. FHWA: Washington, DC, USA, 2013. [Google Scholar]
- Li, X.; Goldberg, D.W. Toward a mobile crowdsensing system for road surface assessment. Comput. Environ. Urban Syst. 2018, 69, 51–62. [Google Scholar] [CrossRef]
- Elbagalati, O.; Elseifi, M.; Gaspard, K.; Zhang, Z. Development of the pavement structural health index based on falling weight deflectometer testing. Int. J. Pavement Eng. 2018, 19, 1–8. [Google Scholar] [CrossRef]
- Weinmann, T.L.; Lewis, A.E.; Tayabji, S.D. Pavement sensors used at accelerated pavement test facilities. In Proceedings of the Second International Conference on Accelerated Pavement Testing, Minneapolis, MS, USA, 26–29 September 2004; pp. 1–30. [Google Scholar]
- Tabatabaee, N.; Sebaaly, P. State-of-the-Art Pavement Instrumentation. Transp. Res. Rec. 1990, 246–256. [Google Scholar]
- Sun, L.; Zhao, H.; Tu, H.; Tian, Y. The Smart Road: Practice and Concept. Engineering 2018, 4, 436–437. [Google Scholar] [CrossRef]
- Cartier van Dissel, S. Compendium of Best Practices in Road Asset Management; CAREC Program: Mandaluyong City, Philippines, 2018; ISBN 9788578110796. [Google Scholar]
- Xue, W.; Wang, D.; Wang, L. A review and perspective about pavement monitoring. Int. J. Pavement Res. Technol. 2012, 5, 295–302. [Google Scholar]
- Selvaraj, S.I. Review on the Use of Instrumented Pavement Test Data in Validating Flexible Pavement Mechanistic Load Response Models. Procedia - Soc. Behav. Sci. 2012, 43, 819–831. [Google Scholar] [CrossRef] [Green Version]
- Moghaddam, T.B.; Karim, M.R.; Abdelaziz, M. A review on fatigue and rutting performance of asphalt mixes. Sci. Res. Essays 2011, 6, 670–682. [Google Scholar]
- Islam, R.; Tarefder, R.A. Field Measurement of Vertical Strain in Asphalt Concrete. Int. J. Sci. Eng. Res. 2013, 4, 1–6. [Google Scholar]
- Kara De Maeijer, P.; Luyckx, G.; Vuye, C.; Voet, E.; Van den bergh, W.; Vanlanduit, S.; Braspenninckx, J.; Stevens, N.; De Wolf, J. Fiber Optics Sensors in Asphalt Pavement: State-of-the-Art Review. Infrastructures 2019, 4, 36. [Google Scholar] [CrossRef] [Green Version]
- Rajibul Islam, M.; Mahmood Ali, M.; Lai, M.H.; Lim, K.S.; Ahmad, H. Chronology of fabry-perot interferometer fiber-optic sensors and their applications: A review. Sensors 2014, 14, 7451–7488. [Google Scholar] [CrossRef] [Green Version]
- Choquet, P.; Juneau, F.; Bessette, J. New generation of Fabry-Perot fiber optic sensors for monitoring of structures. In Proceedings of the SPIE’s 7th Annual International Symposium on Smart Structures and Materials, Newport Beach, CA, USA, 6–9 March 2000; Volume 3986. [Google Scholar] [CrossRef]
- Campanella, C.E.; Cuccovillo, A.; Campanella, C.; Yurt, A.; Passaro, V.M.N. Fibre Bragg Grating based strain sensors: Review of technology and applications. Sensors 2018, 18, 3115. [Google Scholar] [CrossRef] [PubMed] [Green Version]
- Bao, X.; Chen, L. Recent Progress in Distributed Fiber Optic Sensors. Sensors 2012, 12, 8601–8639. [Google Scholar] [CrossRef] [PubMed] [Green Version]
- Glisic, B. Distributed fiber optic sensing technologies and applications—An overview. In Proceedings of the Structural Health Monitoring Technologies 2011 at the ACI Fall 2011 Convention, Cincinnati, OH, USA, 16–20 October 2011; Volume 292. [Google Scholar]
- Chapeleau, X.; Blanc, J.; Hornych, P.; Gautier, J.L.; Carroget, J. Use of distributed fiber optic sensors to detect damage in a pavement. In Proceedings of the 7th European Workshop on Structural Health Monitoring (EWSHM 2014), Nantes, France, 8–11 July 2014; pp. 1847–1854. [Google Scholar]
- Imai, M.; Igarashi, Y.; Shibata, M.; Miura, S. Experimental study on strain and deformation monitoring of asphalt structures using embedded fiber optic sensor. J. Civ. Struct. Health Monit. 2014, 4, 209–220. [Google Scholar] [CrossRef]
- Joshi, S. Linear Variable Differential Transducer (LVDT) & Its Applications in Civil Engineering. Int. J. Transp. Eng. Technol. 2017, 3, 62. [Google Scholar]
- Saevarsdottir, T.; Erlingsson, S.; Carlsson, H. Instrumentation and performance modelling of heavy vehicle simulator tests. Int. J. Pavement Eng. 2016, 17, 148–165. [Google Scholar] [CrossRef]
- Levenberg, E. Inferring Pavement Properties using an Embedded Accelerometer. Int. J. Transp. Sci. Technol. 2012, 1, 229–246. [Google Scholar] [CrossRef] [Green Version]
- Nazarian, S.; Bush III, A.J. Determination of Deflection of Pavement Systems Using Velocity Transducers. Transp. Res. Rec. 1989, 1227, 147–158. [Google Scholar]
- Liu, P.; Otto, F.; Wang, D.; Oeser, M.; Balck, H. Measurement and evaluation on deterioration of asphalt pavements by geophones. Meas. J. Int. Meas. Confed. 2017, 109, 223–232. [Google Scholar] [CrossRef]
- Duong, N.S.; Blanc, J.; Hornych, P.; Menant, F.; Lefeuvre, Y.; Bouveret, B. Monitoring of pavement deflections using geophones. Int. J. Pavement Eng. 2018. [Google Scholar] [CrossRef]
- Di Benedetto, H.; Olard, F.; Sauzéat, C.; Delaporte, B. Linear viscoelastic behaviour of bituminous materials: From binders to mixes. Road Mater. Pavement Des. 2004, 5, 163–202. [Google Scholar] [CrossRef]
- Swett, L.; Mallick, R.B.; Humphrey, D.N. A study of temperature and traffic load related response in different layers in an instrumented flexible pavement. Int. J. Pavement Eng. 2008, 9, 303–316. [Google Scholar] [CrossRef]
- Sangiorgi, C.; Settimi, C.; Tataranni, P.; Lantieri, C.; Adomako, S. Thermal Analysis of Asphalt Concrete Pavements Heated with Amorphous Metal Technology. Adv. Mater. Sci. Eng. 2018, 2018. [Google Scholar] [CrossRef] [Green Version]
- Salour, F. Moisture Influence on Structural Behaviour of Pavements—Field and Laboratory Investigations. Ph.D. Thesis, KTH, Royal Institute of Technology School of Architecture and the Built Environment, Stockholm, Sweden, April 2015. [Google Scholar]
- Johnson, K. Pavement Moisture Measurement to Indicate Risk to Pavement Life; NZ Transport Agency: Wellington, New Zealand, 2017; ISBN 9781988512136.
- Fernandes, F.M.; Pais, J. Assessment of moisture in road pavements. In Proceedings of the 15th International Conference on Ground Penetrating Radar, Brussels, Belgium, 30 June–4 July 2014; pp. 909–912. [Google Scholar]
- Al-Qadi, I.L.; Loulizi, A.; Elseifi, M.; Lahouar, S. The Virginia Smart Road: The Impact of Pavement Instrumentation on Understanding Pavement Performance. In Proceedings of the Technology Sessions, AAPT 2004, Baton Rouge, LA, USA, 8–10 March 2004; pp. 427–465. [Google Scholar]
- Lakkavalli, V.; Cowe Falls, L. A Model for Real-Time Monitoring of Pavements. In Proceedings of the 7th International Conference on Managing Pavement Assets, Calgary, Alberta, Canada, 23–28 June 2008; pp. 1–13. [Google Scholar]
- De Jong, D.L. Computer Program BISAR. Layered Systems under Normal and Tangential Loads. 1979. Available online: http://ci.nii.ac.jp/naid/10015604117/en/ (accessed on 10 December 2019).
- Wang, L.; Xue, W.; Druta, C.; Wang, D. Integration of Structural Health Monitoring and Asset Management; Virginia Tech Transportation Institute—Center for Smart Infrastructure and Sensing Technology: Blacksburg, VA, USA, 2012. [Google Scholar]
- AASHTO. Mechanistic Empirical Pavement Design Guide: A Manual Practice; American Association of State Highway and Transportation Officials: Washington, DC, USA, 2008; ISBN 9781560514237. [Google Scholar]
- Gaborit, P.; Sauzéat, C.; Di Benedetto, H.; Pouget, S.; Olard, F.; Claude, A.; Monnet, A.J.; Audin, R.M.; Sauzéat, C.; Di Benedetto, H.; et al. Investigation of highway pavements using in-situ strain sensors. Int. Conf. Transp. Infrastruct. 2013, 28, 331. [Google Scholar]
- Pouteau, B.; Berrada, K.; Drouadaine, I. Smartvia concept: A 5 years feedback on standalone pavement structure monitoring. In Proceedings of the 6th Eurasphalt & Eurobitume Congress, Prague, Czech Republic, 1–3 June 2016. [Google Scholar]
- Ai, C.; Rahman, A.; Xiao, C.; Yang, E.; Qiu, Y. Analysis of measured strain response of asphalt pavements and relevant prediction models. Int. J. Pavement Eng. 2017, 18, 1089–1097. [Google Scholar] [CrossRef]
- Blanc, J.; Hornych, P.; Duong, N.S.; Blanchard, J.Y.; Nicollet, P. Monitoring of an experimental motorway section. Road Mater. Pavement Des. 2017, 20, 1–16. [Google Scholar] [CrossRef]
- Burmister, D.M. The General Theory of Stresses and Displacements in Layered Systems. I. J. Appl. Phys. 1945, 16, 89–94. [Google Scholar] [CrossRef]
- Duong, N.S.; Blanc, J.; Hornych, P.; Bouveret, B.; Carroget, J.; Le feuvre, Y. Continuous strain monitoring of an instrumented pavement section. Int. J. Pavement Eng. 2018, 8436, 1–16. [Google Scholar] [CrossRef]
- Chabot, A.; Chupin, O.; Deloffre, L.; Duhamel, D. ViscoRoute 2.0: A Tool for the Simulation of Moving Load Effects on Asphalt Pavement. Road Mater. Pavement Des. 2010, 11, 227–250. [Google Scholar] [CrossRef] [Green Version]
- Huet, C. Etude par une méthode d’impédance du comportement viscoélastique des matériaux hydrocarbonés. Ph.D. Thesis, Impr. Nationale, Paris, France, 1965. [Google Scholar]
- Sayegh, G. Contribution à l’étude des propriétés viscoélastiques des bitumes purs et des bétons bitumineux. Ph.D. Thesis, Université de Paris, Paris, France, 1966. [Google Scholar]
- Radopoulou, S.C.; Brilakis, I. Improving Road Asset Condition Monitoring. Transp. Res. Procedia 2016, 14, 3004–3012. [Google Scholar] [CrossRef] [Green Version]
- Alavi, A.H.; Hasni, H.; Lajnef, N.; Chatti, K. Continuous health monitoring of pavement systems using smart sensing technology. Constr. Build. Mater. 2016, 114, 719–736. [Google Scholar] [CrossRef]
- Lebental, B.; Ghaddab, B.; Michelis, F. Nanosensors for Embedded Monitoring of Construction Materials: The “2D Conformable” Route. In Nanotechnology in Construction; Springer: Cham, Switerland, 2015; pp. 383–388. [Google Scholar]
Figure 1.
Layout of the monitoring system.

Figure 2.
Schematics of an H-gauge.

Figure 3.
Schematics of a vertical asphalt strain gauge.

Figure 4.
Fiber Bragg grating (FBG) functioning principle.

Figure 5.
Geophone functioning principle.

Figure 6.
K-type thermocouple probe.

Figure 7.
Sensor installation. (a) Pressure cells, (b) H-shaped asphalt strain gauges, (c) thermocouples, (d) TDR probes, and (e) vibrating wire strain gauges (figures are reproduced from Al-Qadi et al. [36]).
Figure 7.
Sensor installation. (a) Pressure cells, (b) H-shaped asphalt strain gauges, (c) thermocouples, (d) TDR probes, and (e) vibrating wire strain gauges (figures are reproduced from Al-Qadi et al. [36]).

Figure 8.
Layout of the instrumented section in the state of Maine (figure is reproduced from Swett et al. [31]).
Figure 8.
Layout of the instrumented section in the state of Maine (figure is reproduced from Swett et al. [31]).

Figure 9.
Test section in the state of Maine. Time of loading as a function of speed at different depths in the pavement structure (figure is reproduced from Swett et al. [31]).
Figure 9.
Test section in the state of Maine. Time of loading as a function of speed at different depths in the pavement structure (figure is reproduced from Swett et al. [31]).

Figure 10.
Layout of the sensors in Route 114 (figure is reproduced from Wang et al. [39]).
Figure 10.
Layout of the sensors in Route 114 (figure is reproduced from Wang et al. [39]).

Figure 11.
Pavement monitoring system designed for Route 114 in Christiansburg (figure is reproduced from Wang et al. [39]).
Figure 11.
Pavement monitoring system designed for Route 114 in Christiansburg (figure is reproduced from Wang et al. [39]).

Figure 12.
Instrumentation of the A41N highway in France. (a) Longitudinal strain in the subbase course for different truck trajectories (V = 12 km/h, T = 20 °C) and (b) longitudinal strain in the subbase for different speed (same trajectory, T = 23 °C) (figures are reproduced from Gaborit et al. [41]).

Figure 13.
Architecture of the data acquisition system of SMARTVIA® (figure is reproduced from Pouteau et al. [42]).
Figure 13.
Architecture of the data acquisition system of SMARTVIA® (figure is reproduced from Pouteau et al. [42]).

Figure 14.
Instrumented section in China. (a) Layout of the instrumentation and (b) focus on the sensors (figures are reproduced from Ai et al. [43]).
Figure 14.
Instrumented section in China. (a) Layout of the instrumentation and (b) focus on the sensors (figures are reproduced from Ai et al. [43]).

Figure 15.
Road structure and sensors layout of the motorway A10 in France. (a) Sections PR15+700, PR15+900, PR16+850, and PR17+100 and (b) section PR16+026 (figure is reproduced from Blanc et al. [44]).
Figure 15.
Road structure and sensors layout of the motorway A10 in France. (a) Sections PR15+700, PR15+900, PR16+850, and PR17+100 and (b) section PR16+026 (figure is reproduced from Blanc et al. [44]).

Figure 16.
French motorway. (left) Pavement structure and (right) sensors layout. (figures are reproduced from Duong et al. [46]).
Figure 16.
French motorway. (left) Pavement structure and (right) sensors layout. (figures are reproduced from Duong et al. [46]).

Figure 17.
Lateral position of geophones G1, G3, and G4 installed on a French motorway (figures are reproduced from Duong et al. [46]).
Figure 17.
Lateral position of geophones G1, G3, and G4 installed on a French motorway (figures are reproduced from Duong et al. [46]).


Table 1.
Specifications of some asphalt strain gauges (ASGs) available on the market.
| Dynatest PAST | CTL ASG | Jewell ASG – 3000 - HT | TML KM-100HAS | |
|---|---|---|---|---|
| Capacity | ±1500 με | ±1500 με | ±3000 με | ±5000 με |
| Temperature Range | −30 to 150 °C | −34 to 204 °C | −34 to 200 °C | −20 to 180 °C |
| Resistance | 120 | 350 | 350 | 350 |
| Circuit | Quarter bridge | Full bridge | Full bridge | Full bridge |
| Modulus | 2200 MPa | 2340 MPa | Not provided | 40 MPa |
Table 2.
Details of the experimental campaign conducted on motorway A10 in France [44].
Table 2.
Details of the experimental campaign conducted on motorway A10 in France [44].
| Date | Days after Opening to Traffic | T (°C) |
|---|---|---|
| 15/11/2011 | 29 | 2 to 12 |
| 23/04/2012 | 190 | 11 |
| 18/12/2012 | 429 | 11 |
| 18/02/2014 | 856 | 10 |
© 2020 by the authors. Licensee MDPI, Basel, Switzerland. This article is an open access article distributed under the terms and conditions of the Creative Commons Attribution (CC BY) license (http://creativecommons.org/licenses/by/4.0/).
Share and Cite
MDPI and ACS Style
Barriera, M.; Pouget, S.; Lebental, B.; Van Rompu, J. In Situ Pavement Monitoring: A Review. Infrastructures 2020, 5, 18. https://0-doi-org.brum.beds.ac.uk/10.3390/infrastructures5020018
AMA Style
Barriera M, Pouget S, Lebental B, Van Rompu J. In Situ Pavement Monitoring: A Review. Infrastructures. 2020; 5(2):18. https://0-doi-org.brum.beds.ac.uk/10.3390/infrastructures5020018
Chicago/Turabian StyleBarriera, Maria, Simon Pouget, Bérengère Lebental, and Julien Van Rompu. 2020. "In Situ Pavement Monitoring: A Review" Infrastructures 5, no. 2: 18. https://0-doi-org.brum.beds.ac.uk/10.3390/infrastructures5020018