Web-Based Architecture for Automating Quantity Surveying Construction Cost Calculation


1
Faculty of Computing and Information Technology, Sohar University, P.O. Box 44, Sohar PCI 311, Oman
2
Department of Computer Engineering, Al-Rafidain University College, P.O. Box 46036 Baghdad, Iraq
*
Author to whom correspondence should be addressed.
Infrastructures 2020, 5(6), 45; https://0-doi-org.brum.beds.ac.uk/10.3390/infrastructures5060045
Submission received: 26 April 2020
/
Revised: 28 May 2020
/
Accepted: 30 May 2020
/
Published: 1 June 2020
Abstract
:Quantity Surveying (QS) is a process concerned with controlling and managing the costs of construction projects. QS Measurement relies on sophisticated measurement rules that are understood by experienced practitioners. Traditional QS systems, such as standard paperwork, are time-consuming and only approximate the cost estimate. This paper aims to design and deploy a web-based framework for automating the cost estimation of concrete construction, using ASP.NET. It introduces a user-friendly interface, which ensures that the work is completed in the chronological order of the construction phases. The proposed QS framework offers a reliable and time-efficient estimation method, in comparison to other methods (i.e., human labor using paper or Excel), which was tested using real data and was validated by experts and consultant companies. Furthermore, it automated the reading of project information from construction maps, which reduced errors when estimating costs. It could also automatically determine the project location using Google Maps and could quickly guide the user to the location. The proposed QS framework automated the manual and Excel work of cost computing with an accuracy of 99%, reducing human calculation errors. It also effectively reduced the calculation time to only three days (compared to 114 days of manual work or 19 days of Excel work). The comparison result of the Quantity Surveyor’s average paid salary indicated that using web-based QS framework helps in reducing the cost estimation time and labor costs.
1. Introduction
Building Information Modeling (BIM) is a recent development that has attracted considerable interest. BIM offers many advantages, such as automatically creating quantity take-offs and cost estimation from a building’s digital model (i.e., a CAD Model) [1]. Quantity Surveying (QS) is the process concerned with controlling and managing the costs of construction projects. QS Measurement relies on sophisticated measurement rules that are understood by experienced practitioners. The quantity surveyor (QSr) is responsible for managing and controlling all phases of the contractual and financial issues of construction projects. Traditional QS methods, such as standard paperwork, are very time-consuming, the involved systems are not user-friendly, and the approximated costs are not very accurate. It is a time-consuming process for quantity surveyors using traditional techniques, such as manual estimation or semi-automatic estimation processes. Small- and medium-sized organizations cannot offer a full infrastructure, tools, or purchase expensive software [2]. Therefore, the QS profession faces enormous challenges and opportunities, especially in the area of accurate cost estimation and rapid quantitative take-off. Therefore, the development of modern automatic modeling for construction and efficient installation quantity surveying duties is a necessary and crucial task. The adoption of the latest information technologies in quantity surveying can increase productivity and improve communication between the higher management and the other parties in the project. Many obstacles can hinder the development of quantity survey systems, such as the high cost, difficulty of constructing a specialized software, and the lack of necessary infrastructure to implement the QS system [3]. The implementation of computer-aided and web-based tools for construction cost estimation helps to improve the estimator’s performance. The current estimation software and web-based systems include a large database that maintains the resource cost data, which can be updated at the beginning of estimation [4]. Moreover, the bill of quantities (BoQ) is a document used to identify the construction items and their costs, such as materials, plans, and labor, which could be integrated into it. The BoQ is a dynamic and collaborative knowledge-based process that evolves with various types of evidence. The current software used involves different types of data and formatting; therefore, the standardization of BoQ is of vital interest for producing efficient cost estimation activities [5].
2. Literature Survey
Many significant studies have reviewed the implementation of BIM and QS. Aibinu et al. surveyed 180 QS firms to understand the efforts made towards the use of BIM features by reviewing QS practices and cost consultants in Australia [6]. Their findings indicated that most work is done in computer-aided take-off with two-dimensional models for cost planning and bill of quantities. However, little experience with 3D models was reported for automating the extraction of quantities. Furthermore, particular BIM features were used by QS firms, due to several warnings about the safety of the 3D model design, the incompleteness of information in models, the cost of implementing BIM features, and the learning time required for adopting BIM features. Monteiro et al. examined the use of BIM input/output dynamic features for assessing quantity take-off, under constrained specifications. The results showed that it is possible to modify the take-off model for extracting quantities, based on the existing specifications for manual measurements and visualization features. Therefore, take-off specifications should be revised before considering BIM features, which would minimize its limitations [7]. Mirshokraei et al. proposed a web-based quality management (QM) prototype, which integrates the BIM–AR (augmented reality) technique to enhance the QM of structural elements on site. They offered a fully customizable and independent platform, which is easily modified depending on the user’s needs. Their prototype was tested and verified using a real-life case [8]. Liu et al. reviewed several research papers related to the implementation of BIM in infrastructure, green building, and facilities management (FM). They reviewed global BIM research studies during the period of 2004–2019, based on a scientometric analysis method, which presented invaluable information in the research field of BIM for researchers and practitioners, by visualizing the current development and highlighting future research requirements [9]. Sinclair et al. presented a comprehensive study that explained important details of the QS Tasks and the bill of quantities (BoQ) in detail [10]. However, the author did not deploy any software and did not consider the country-specific nuances and rules in setting the cost per building type. Martinez et al. investigated the integration of BIM technologies on different platforms. They found that suitable interoperability among the various investors of a building project is an important feature for enabling BIM, to provide a cost-effective solution [11]. Ashcraft et al. explored crucial parametric modeling, which is used to formulate the basic requirements of BIM practices. The study recorded the need for constructing efficient digital databases, demonstrating the structure of the construction fundamentals and their associations with other building components [12]. Wu et al. studied the relationships between scheduling, sequencing, and cost-estimating in the BIM model. They offered new features such as object-orientated modeling and adding fourth- and fifth-dimension interoperability to BIM duties [13]. Gee C. examined the opportunities and obstacles of the full execution of BIM tasks in implementing the quantity surveying occupation. Furthermore, they investigated the main differences that the BIM models could make to adequately ensure that the quantity surveying occupation was included [14]. Zima K. examined the benefits of the implementation of computerizing the bills of quantities (BoQ) in BIM, in order to reduce the fabrication of bill computation. The automatic production of a BoQ allows quantity surveyors to elaborate on the initial design phases of a building project, and quickly accomplish cost estimation [15]. Rabie et al. performed a comparison study on the parts and roles of QS in construction projects in Sweden and the U.K. They recognized that the quantity surveying roles and its association with the services used by engineers in different construction sites would help both the owner and the subcontractor [16]. Jiang, X. proposed useful information to describe the scheduling process and creation of cost estimates for the fourth dimension with BIM technology, considering the available resources, and exploring future improvement for the estimation of a fifth dimension. The results showed that, by linking BIM with quantity take-off, time and effort could be saved in estimating the cost of construction [17]. Wijayakumar et al. demonstrated that automated BIM tools could be fitted with the QS requirements. Their study examined the implementation of five different methods for the storage and exchange of BIM data, including data exchange using physical files and data sharing through the application interface, a central database, a federated database, and web services [18]. Marsh described a QS framework that contains critical factors for improving the quality of QS tasks, such as BIM maturity, definition benefits, barriers, adoption, business planning, organizational characteristics, organizational learning, and change management. Moreover, they recorded the current errors in the risks posed by Building BIM to the QS profession [19]. Choo et al. reviewed and analyzed several types of research papers related to BIM in Korea, based on certain research periods, using text-mining methods. Their work divided these papers into the periods of introduction, development, and adaptation. The results proved that the BIM can be developed in all fields, such as civil engineering, aviation, and shipping, associated with construction activities [20]. Biancardo et al. developed and applied a BIM system for road infrastructures. They created 3D road infrastructure models and a parametric spatial representation using BIM tools and the visual programming software. They also assessed the interoperability of extracting and exchanging information between these BIM tools and the software [21].
Our literature survey identified several gaps that should be taken into consideration and filled, such as:
- The absence of standard formatting for the storage and exchange of data;
- The absence of standardization in documented and reviewed pricing data;
- Different methods implemented in estimating and calculating the construction costs; and
- Insufficient information related to BIM models.
This paper aims to design and implement a web-based QS framework for automating the cost-estimation of concrete construction using visual studio (ASP.NET and SQL server). It introduces a user-friendly interface, which ensures that the work is completed in the chronological order of the construction phases.
3. Research Methodology
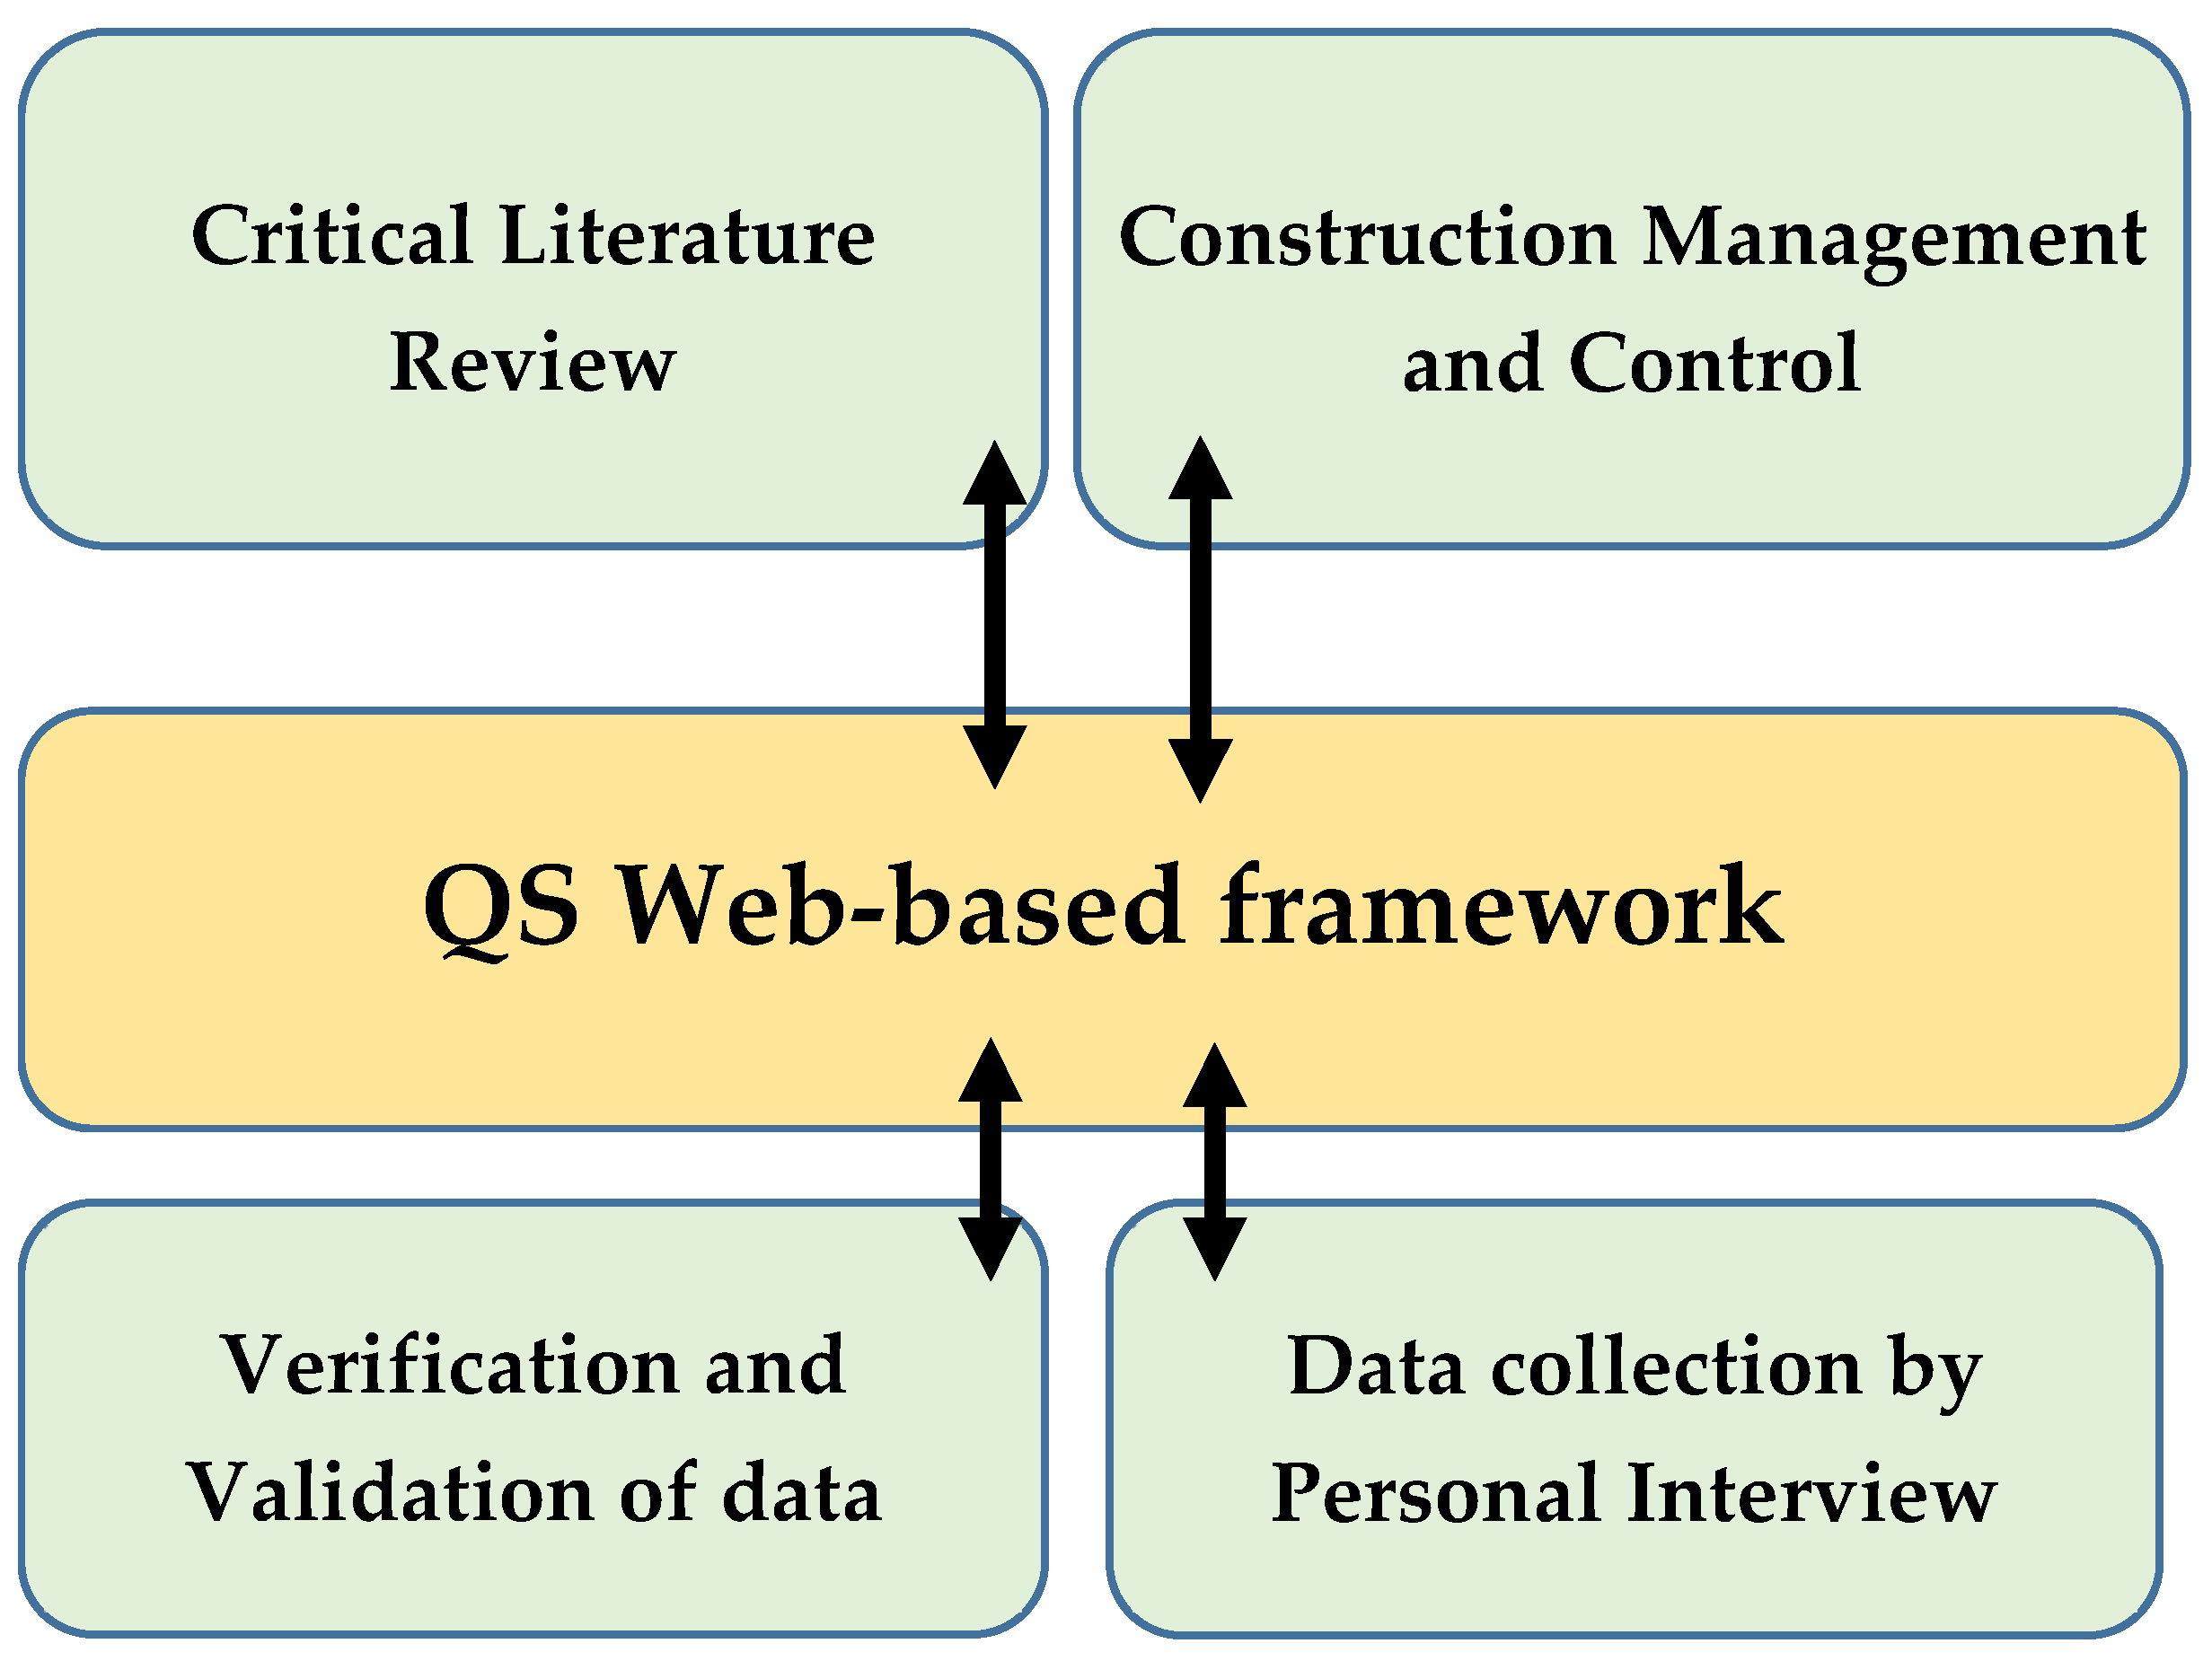
In this study, we design and develop a web-based QS framework for automating the cost estimation of concrete construction, using a waterfall methodology. A qualitative research method was deployed to achieve the objectives of this research and fill the gaps identified in the literature survey. The proposed framework used the results of the critical literature survey of previous studies to identify the gaps in implementation and analyze the impact of using BIM and QS features. In addition, data collected through personal interviews with specialists and engineer experts in the field were used to verify and validate the theoretical computation. The interactive relationship overview diagram of the proposed system is shown in Figure 1.
4. Features of Quantity Surveying (QS)
This section presents the main characteristics of QS and the current software for managing QS, which aims to reduce both the cost of facilities and the construction time. A quantity surveyor is a professional vested with the responsibility of obtaining better value projects for clients, through effective cost management. It is impossible to find a QS software that offers all of the necessary requirements and standards. Therefore, two main topics related to QS are discussed—cost estimation and the main software used.
4.1. QS Cost Estimation
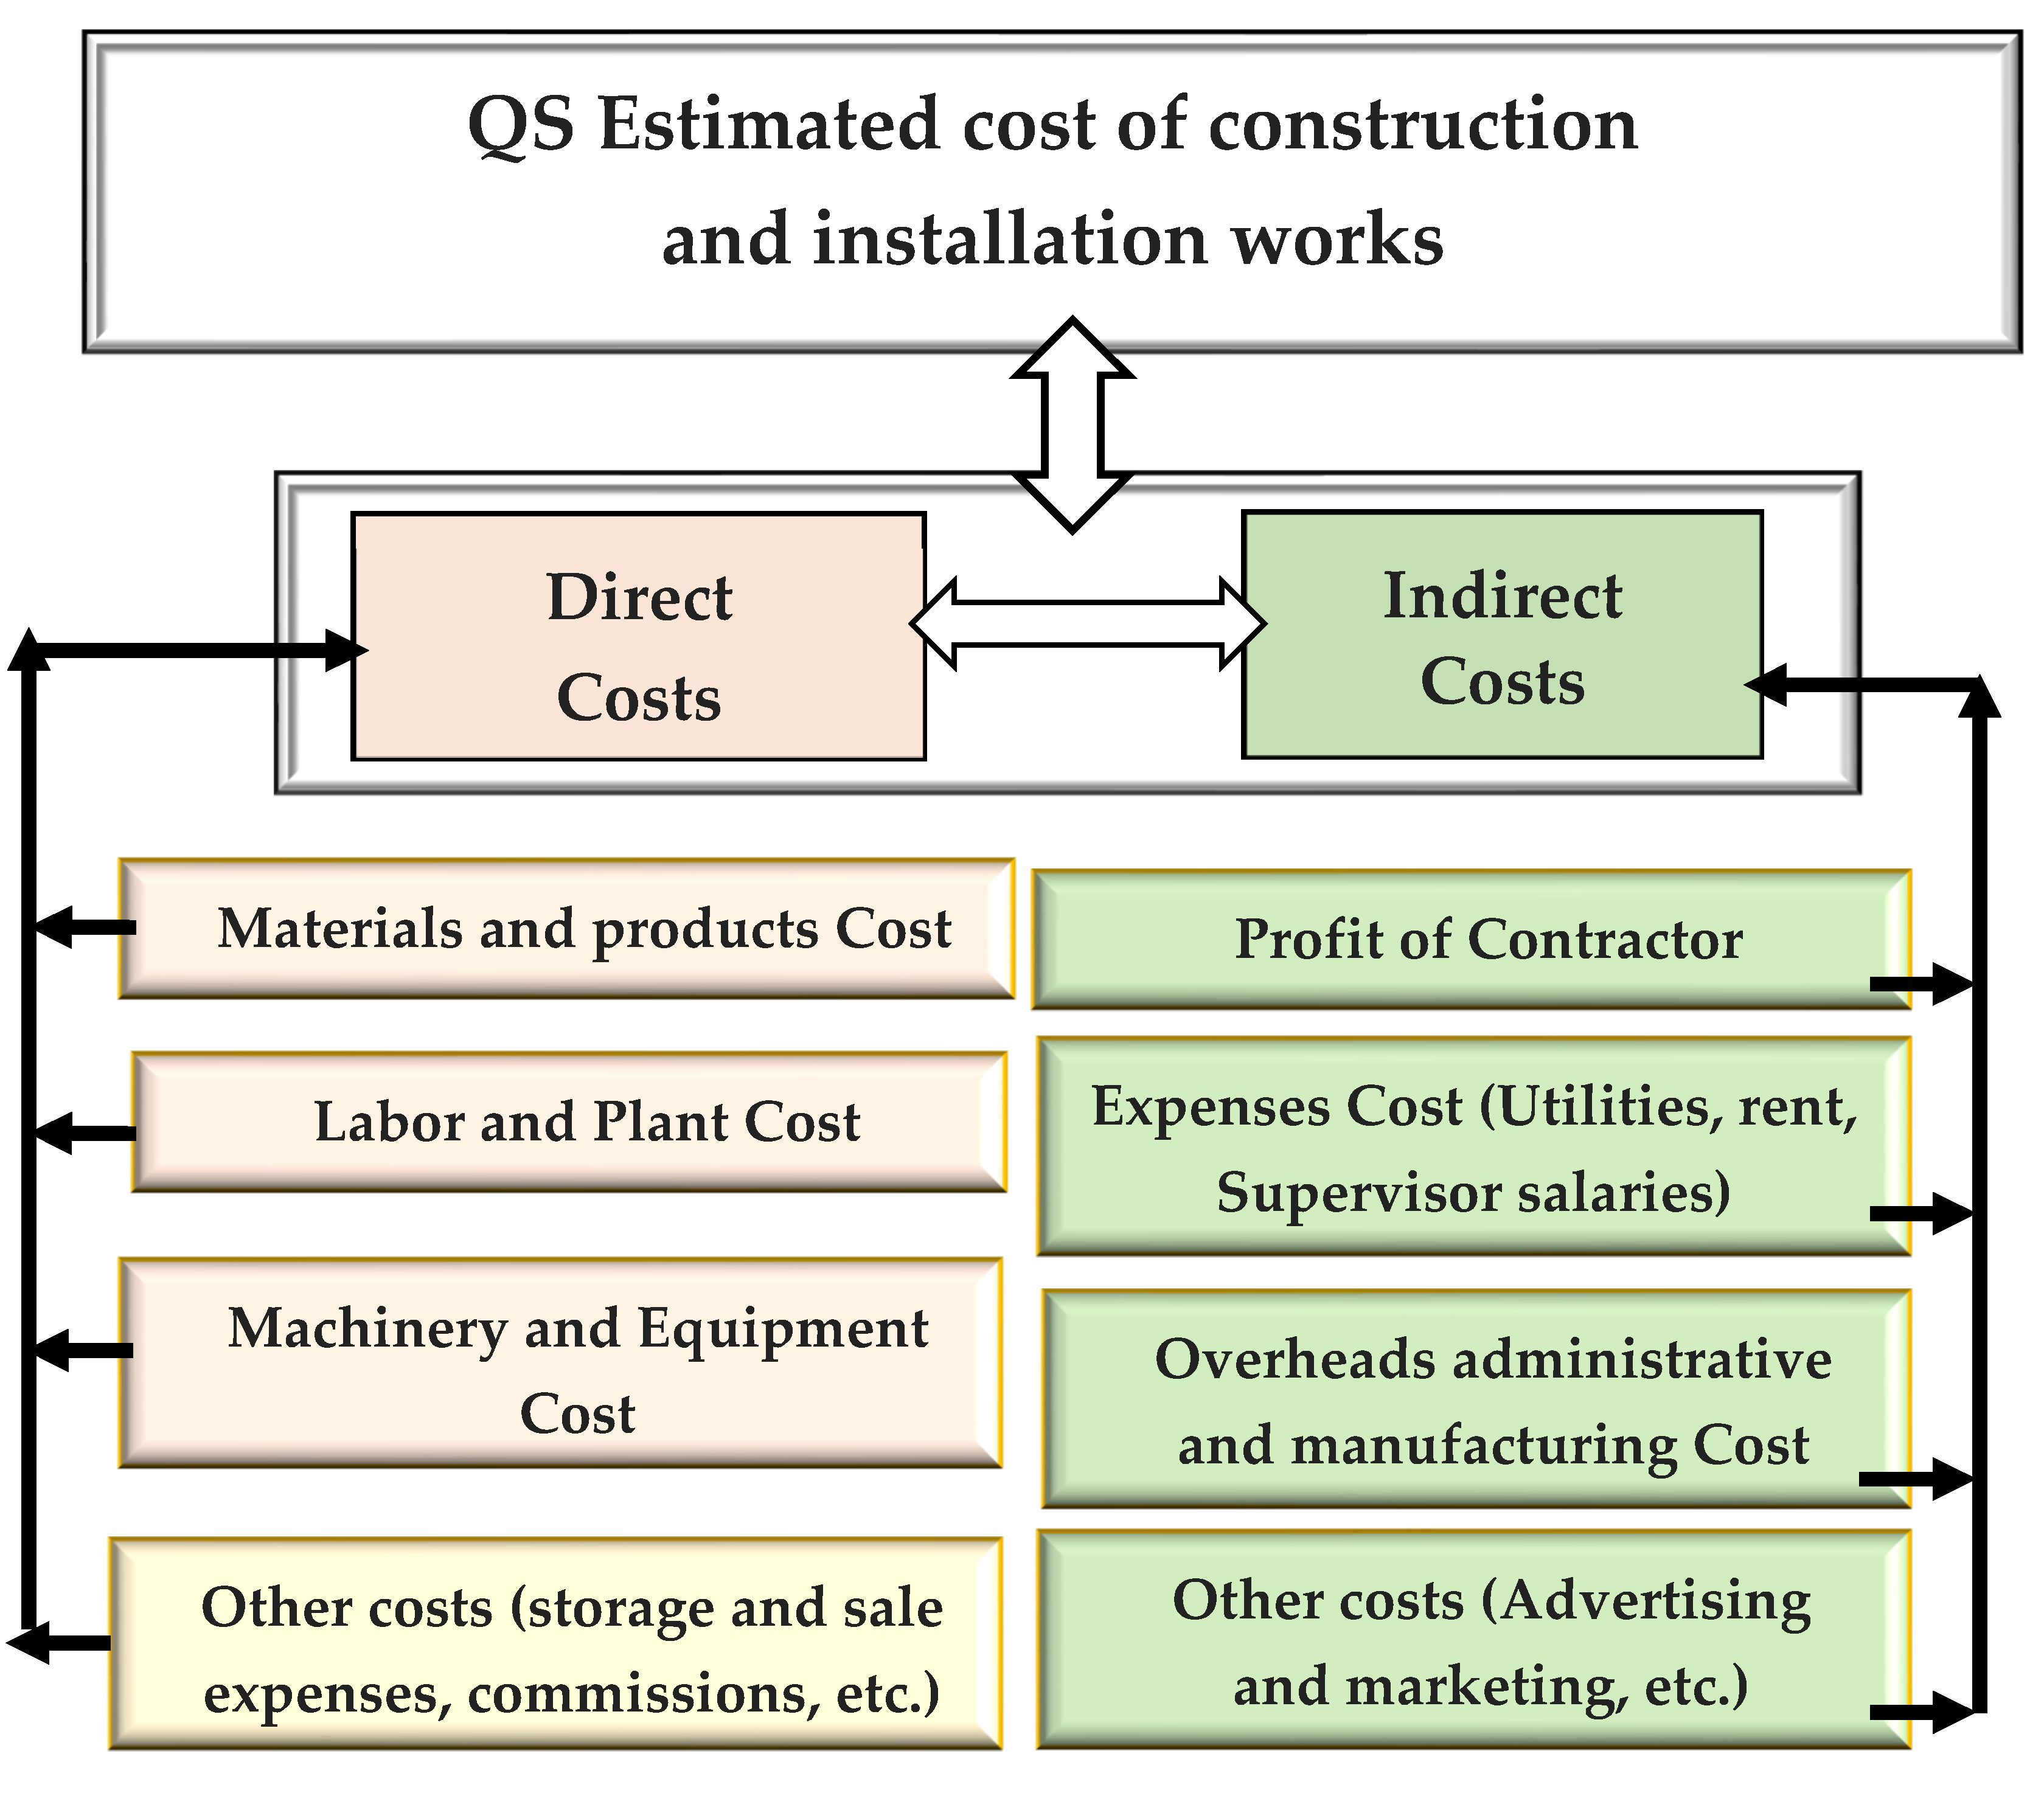
Estimating the quantities and calculating the initial costs are called conceptual estimates, which take place in the design and planning stages of the construction project. The process of cost estimation is closely linked to the take-off process, which can make cost estimation more automated and faster, with lower labor costs and with fewer errors [22]. A well-prepared take-off is essential for a successful cost estimation, as without recording the elements of the project, the cost estimate would be incomplete. There are many methods for cost estimation, some of which are traditional standards and are still used by quantity surveyors, such as the Excel, AutoCAD, and MS-Project software, and some are more modern, such as the Autodesk Revit, Estimator Xpress, and the Easy Builder PlanSwift software, which better met the current developments. Roy and Roger [23] described that modern market relations between the subjects of investment activity are inherent in a planned economy, as shown in Figure 2.
Quantity surveyors usually start with estimates that can be prepared based on the available information, such as items and approximate quantities [24]. Cost estimation requires calculating a variety of annual and quarterly indices. These indices are divided by type of building and structure, groups of materials, types of work and wages, and a system of land coefficients. In the absence of sufficient information to make these estimates, it is necessary to start estimating the basic shapes, such as the surface area, using the unit method. The unit method consists of calculating the total number of units in the construction and multiplying them by the price of each unit to give an approximate value. The cost of material resources in the QS estimated cost is called the estimated price of building materials, products, and structures. This determines the normal amount of direct costs in the cost of construction and installation works. Estimated prices for materials are used when compiling local estimates or local resource sheets. In accordance with the technology structure of investments on the side of capital investments and the current construction activity of construction organizations, the costs included in the estimated cost are divided into the following cost groups:
- Construction works (repair and construction);
- Installation work;
- The cost of purchasing equipment, furniture, inventory; and
- Other costs (design, survey, research, commissioning, equipment, and systems).
4.2. BIM and QS Software
Different actors and stages in the construction project have different requirements that should be facilitated by the software. The review of the existing research and calculations of BIM showed the existence of many design firms and software. Several reasons have led to a situation where the software is used not only in the design stage, but also in construction and management. The algorithm of QS calculation, in theory, should be universal for all purposes; however, unfortunately, QS producers typically orient their products to follow the standards of a particular need or country. Most QS programs have a huge number of features that allow QS users to create local, object, and summary reports, using various methods.
Several approaches were suggested for BIM-based cost estimating [25], following different methods, such as:
- Exporting building object quantities to an estimating software;
- Bridging the BIM tool directly with an estimating software; or
- Using BIM Quantity Take-Off (QTO).
- BIM-based Estimation faces many challenges, such as:
- Sub-standard BIM models and insufficient information;
- The data format and exchange; and
- Lack of standardization and pricing format.
Therefore, a standard format should be used for interaction with adjacent products and the migration of data between different formats. Thus, at present, many manufacturing companies are leading the BIM-QS Software market, such as Autodesk Revit, Autodesk Civil 3D, AutoCAD, AutoCAD Land Development Desktop, EstimatorXpress, EasyBuilder, and Planswift Pro. Table 1 shows a comparison of the selected software features.
The results in Table 1 indicate that most number of software is used for 2D and 3D modeling and visualization. Despite the lack of file format standardization, most of them offer to import/export data to other formats, such as image files or excel sheets.
Furthermore, several types of BIM-based QS software are used, such as Cost x, Cubicost, and Vico office [26]. These help to automate estimation take-off cost features, accurately and easily, supporting different platforms such as Windows, Mac, cloud-based SaaS, IOS, and Android. They offer a 3D view, measured dimension overlay, Electronic Plans, and Elevation Checking. These introduce a wide range of File Compatibility with other software, exporting formats such as CAD files, excel (*.CSV), images (JPGs, GIFs, or TIFs), and PDF files (*.pdf).
Web-based QS frameworks can offer customizable and standard user interfaces during construction activities. They offer suitable platforms to solve the absence of standardization in data formatting and documentation, which limits the performance of construction management. They can also help to deploy methods for integrating the BIM Quantities and Bills of Quantities, by offering standard planning cost and pricing formats.
Unfortunately, most companies do not offer open-source cost calculation solutions and they use different file formats, which is considered to be one of the crucial issues in the functionality of such software. However, the main calculation features can be reviewed by the user, in order to judge the ease and accuracy of calculations. Table 2 presents a comparison of different cost-estimation applications.
5. Proposed System Design and Development
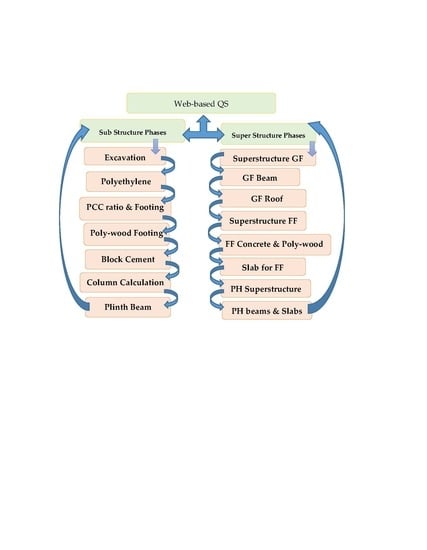
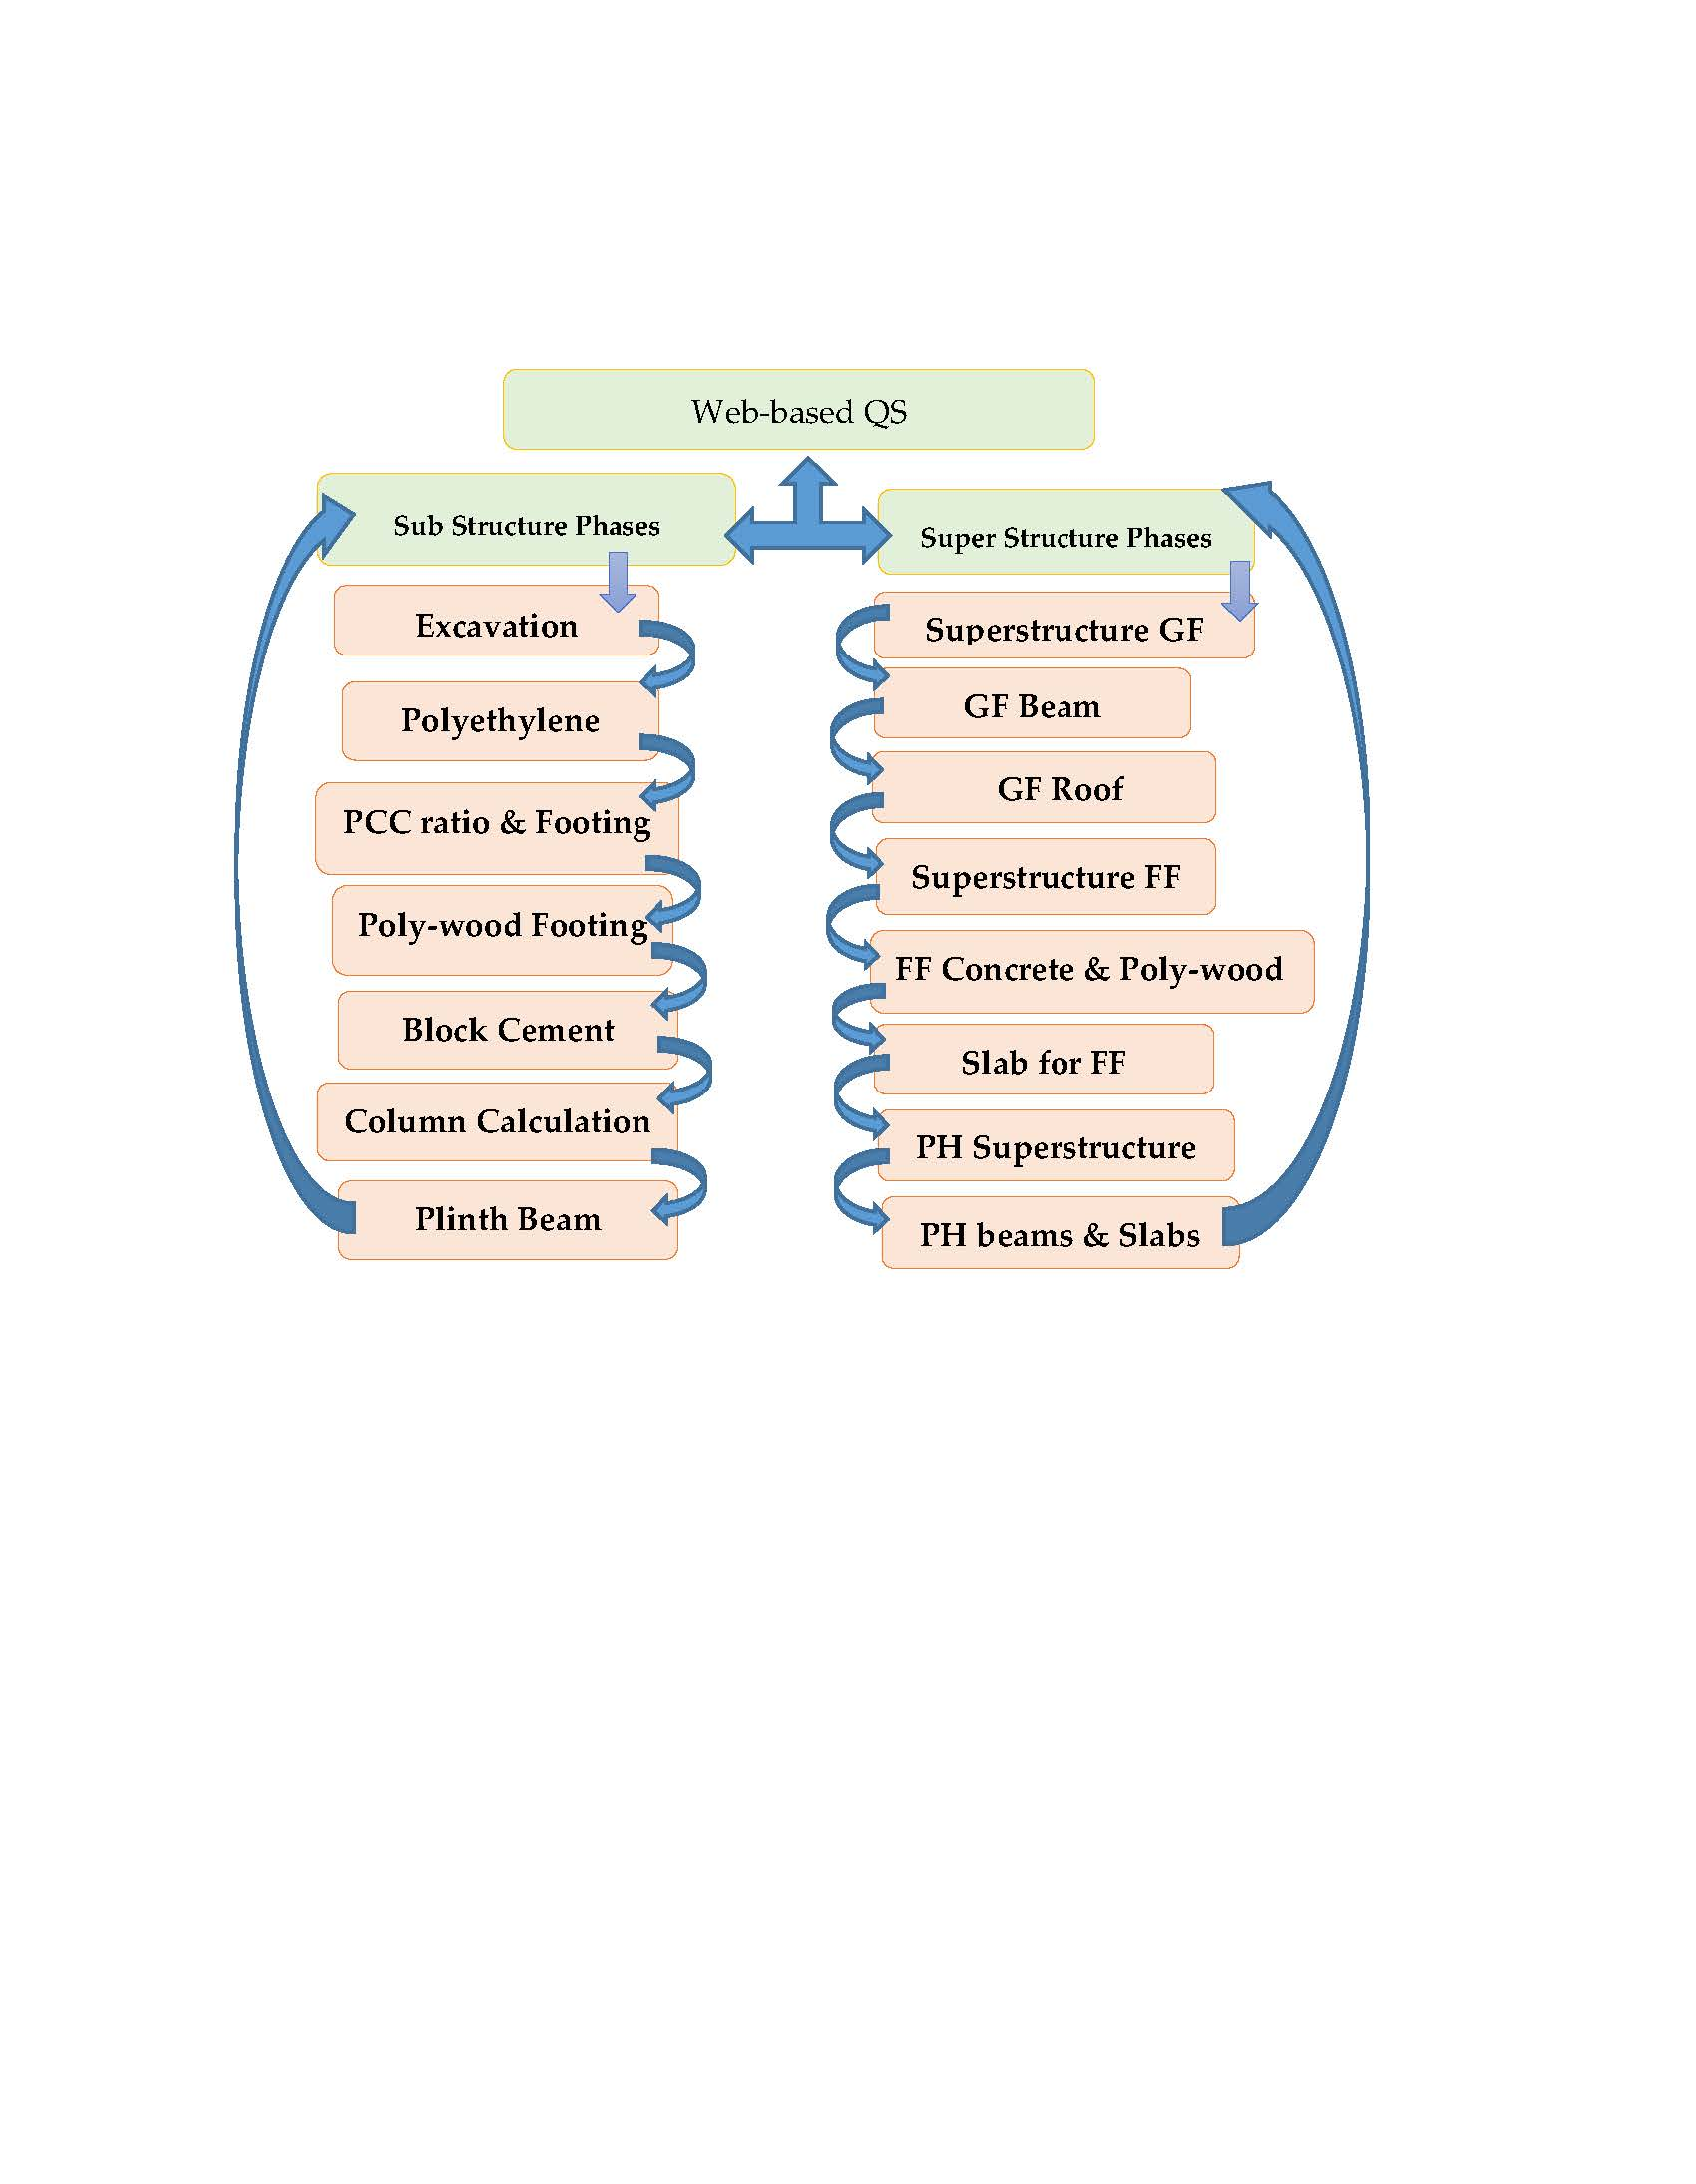
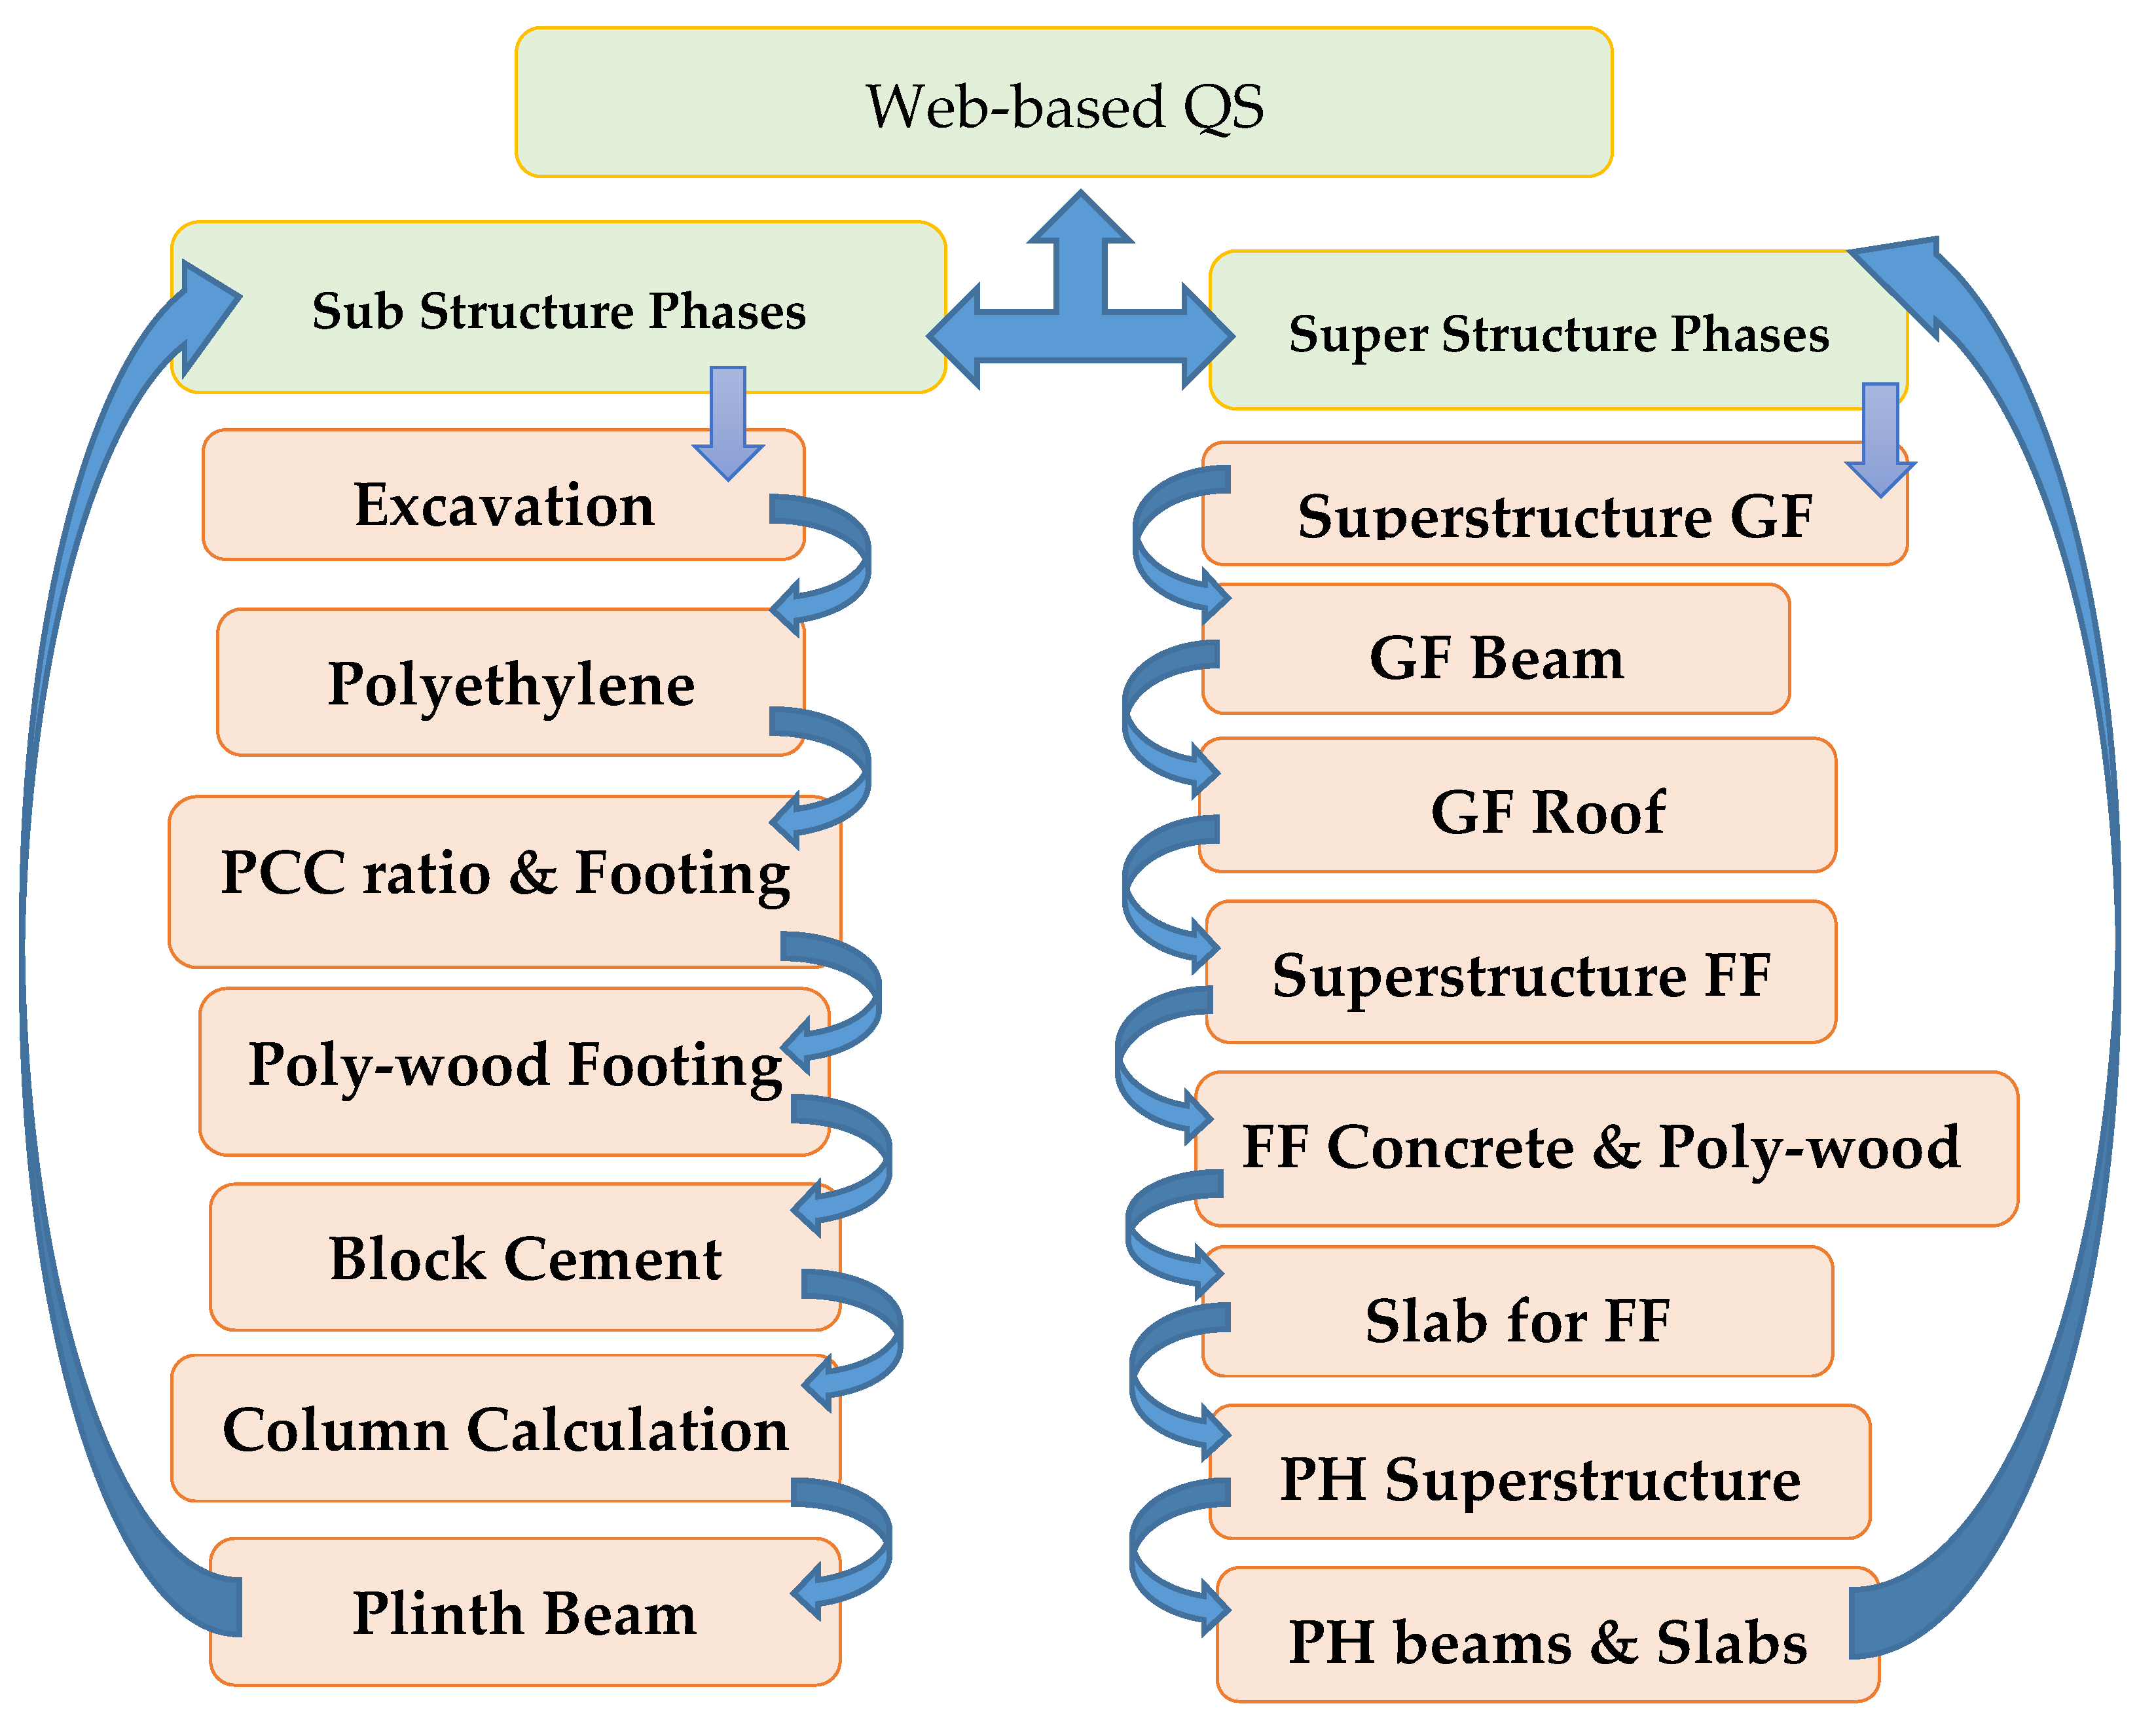
For the proposed framework, we developed and designed a web-based QS framework for automating the cost estimation of concrete construction, using a waterfall methodology. The Visual Studio. Net developer platform was used for developing and deploying the proposed framework using ASP.Net and the C# programming language. Figure 3 presents the phase interactions of the proposed framework, which consists of two main phases—cost calculation of the sub-structure activities (such as excavation, polyethylene, plain cement concrete (PCC) ratio and footing, poly-wood footing, block cement, column calculation, and plinth beam) as well as cost calculation of the super-structure activities (such as super-structure ground floor (GF), GF beam, GF roof slab, super-structure first floor (FF), FF concrete and poly-wood, slab for FF, PH (acidity or alkalinity) level of super-structure, and the PH level of the beams and slabs). A qualitative research method was deployed to achieve the objectives of this research and fill the gaps identified by the literature survey.
We used the results of the critical literature survey of previous studies to identify the gaps in implementation and to analyze the impact of using BIM and QS features. In addition, data collection through personal interviews with specialists and engineer experts in the field was carried out to verify and validate the theoretical computation. The phase interactions of the proposed framework are shown in Figure 3.
5.1. Database and Class Diagram
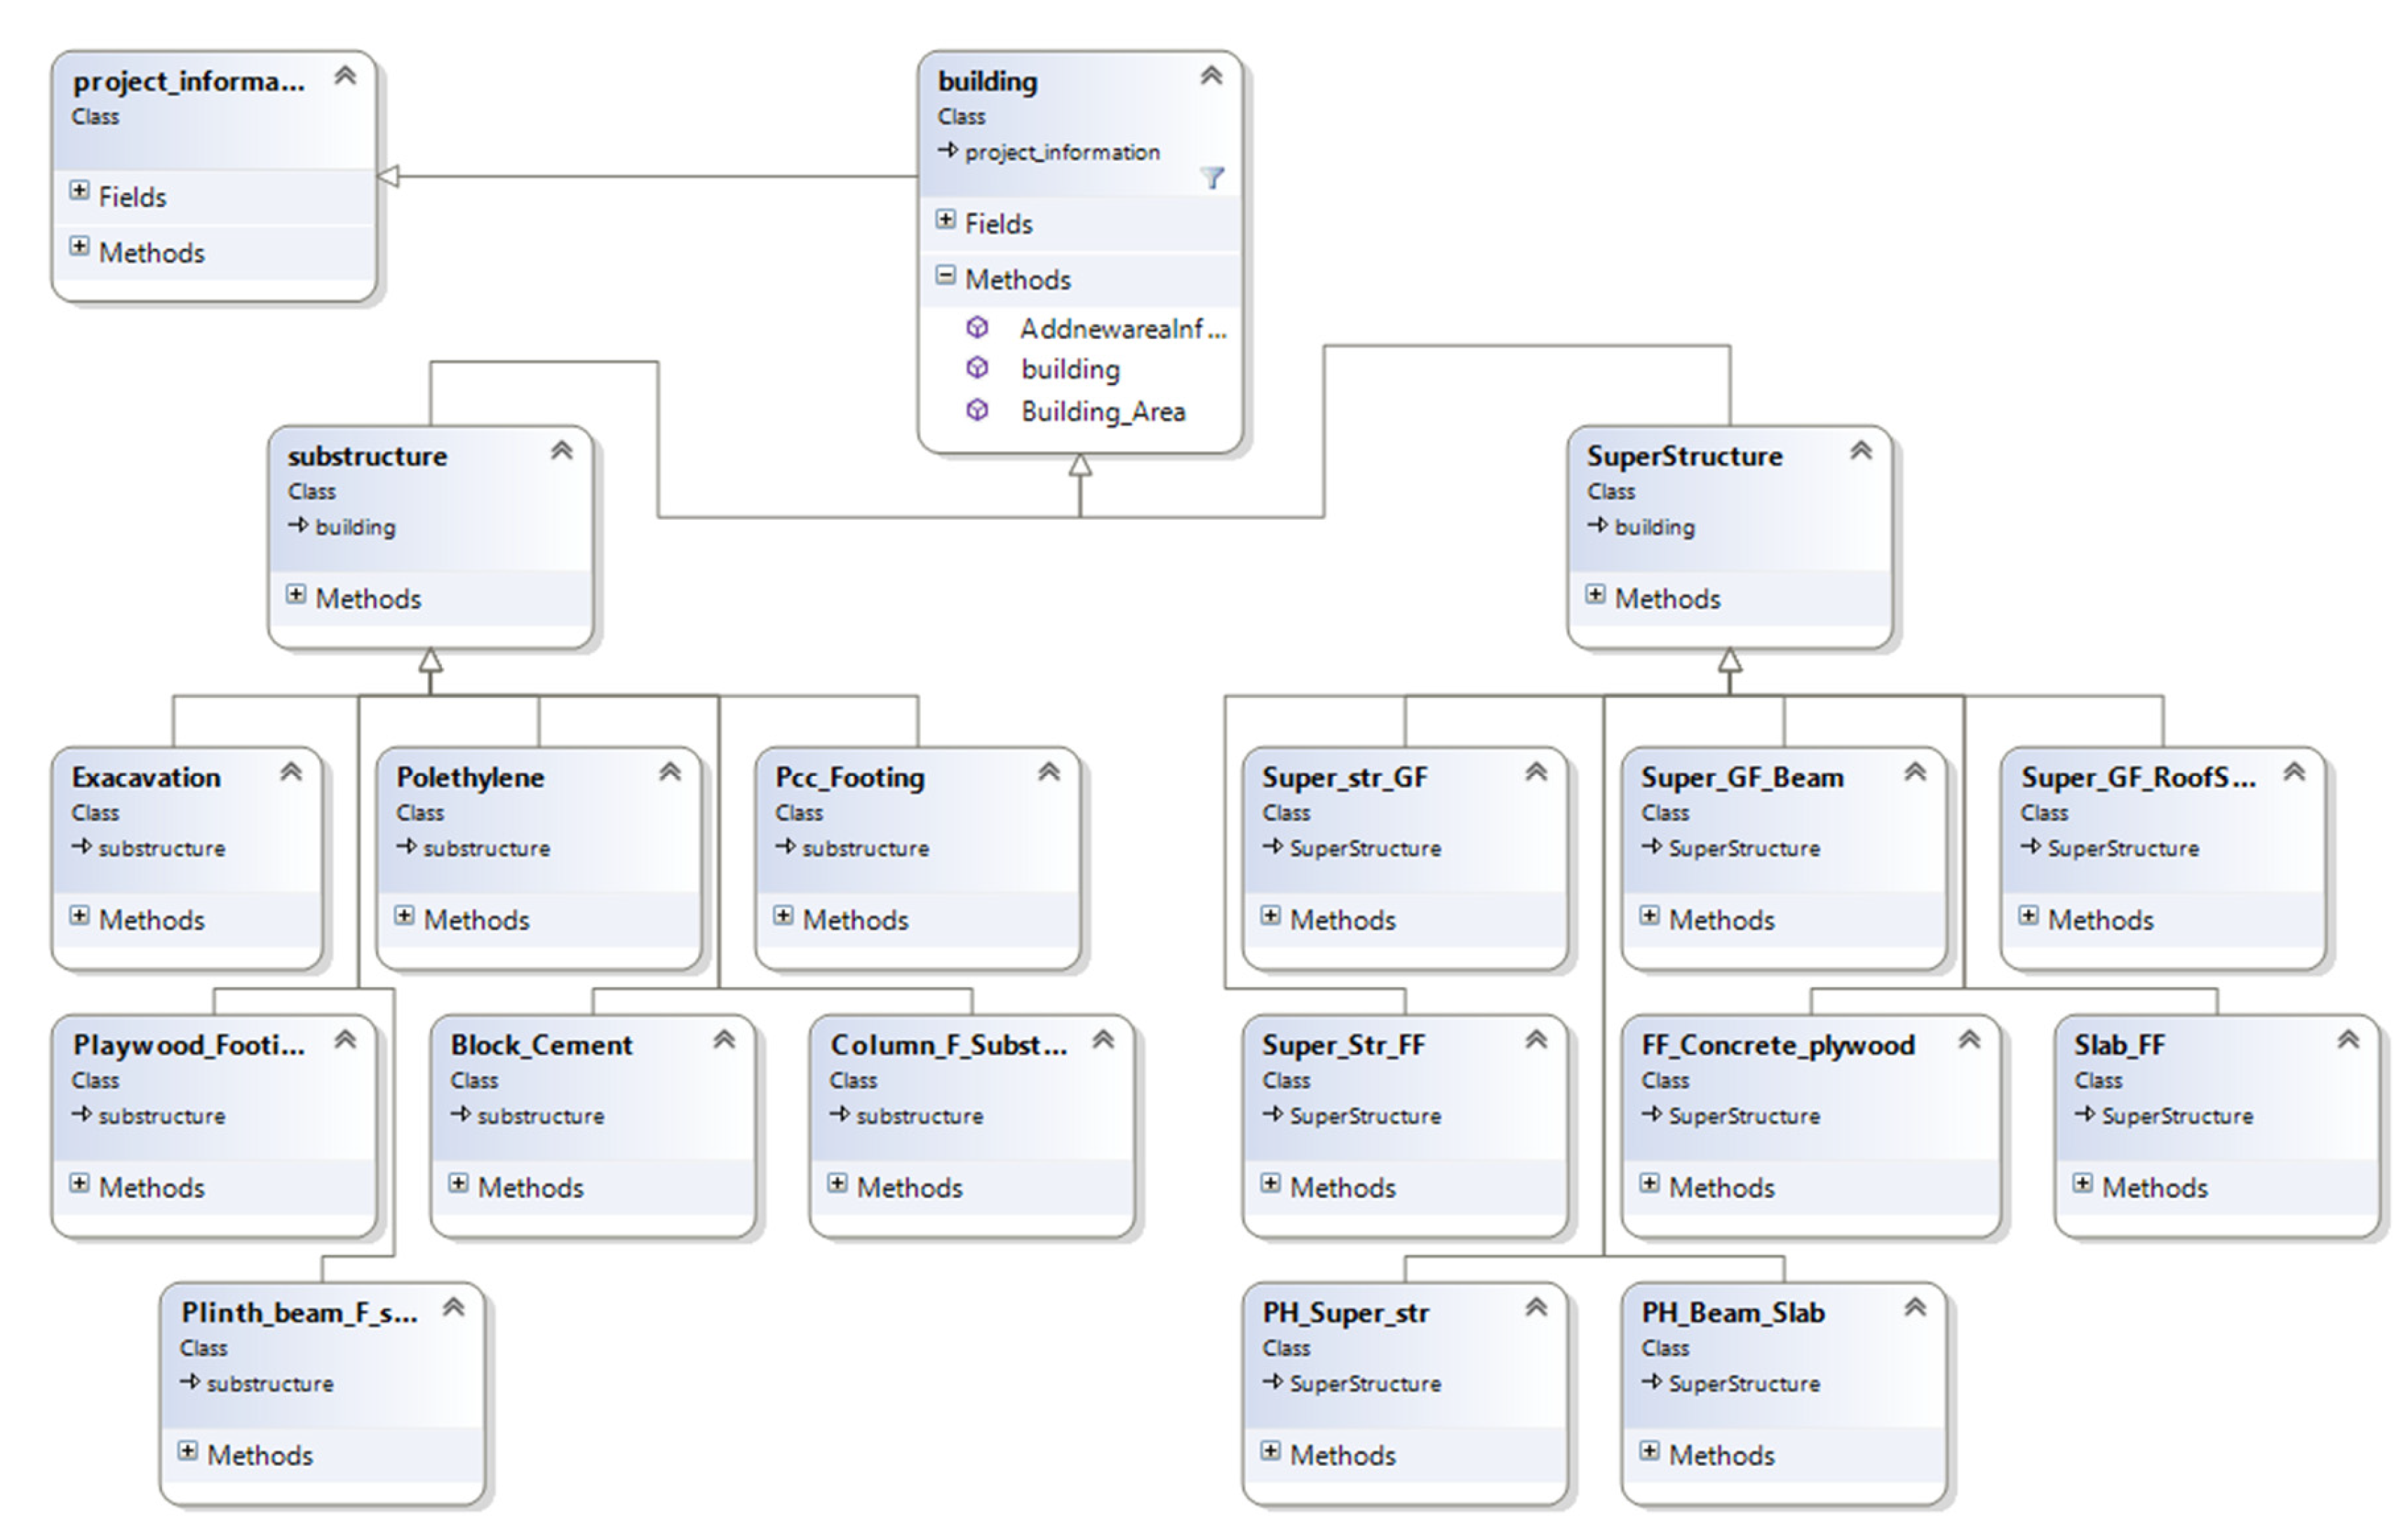
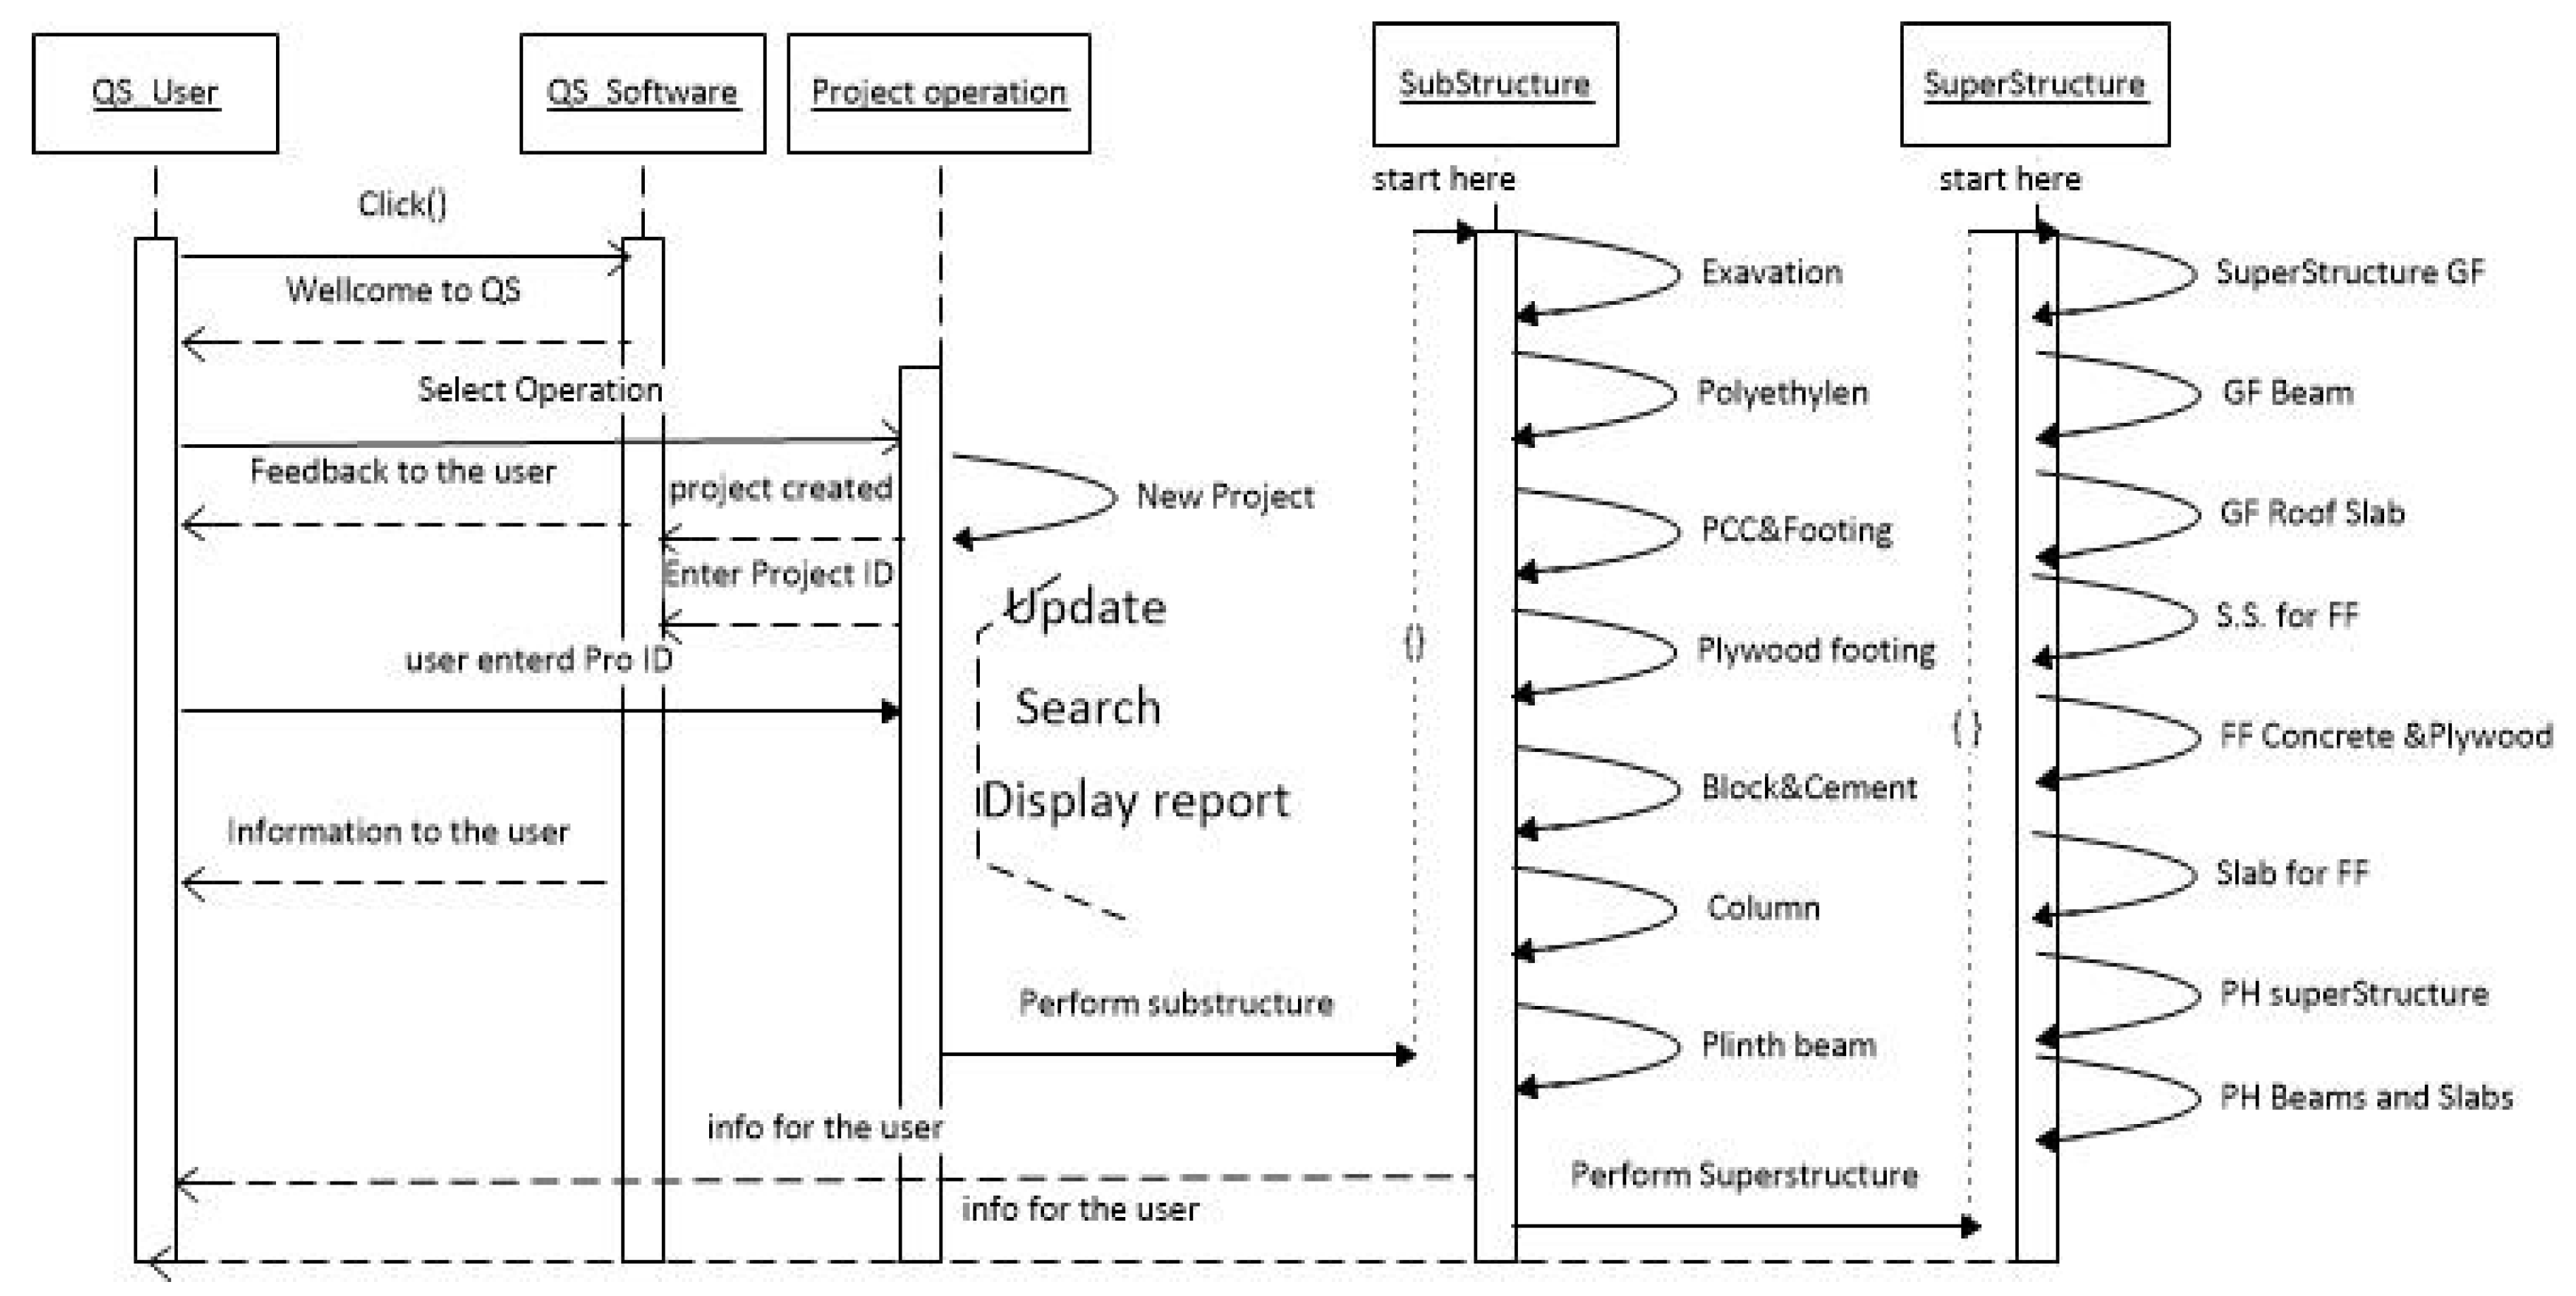
An SQL Server was used as a database management system for creating and manipulating the database design for the proposed system. Figure 4 depicts the class diagram and Figure 5 shows the sequence diagram of the proposed framework.
The proposed web-based QS architecture consists of several tables for managing and controlling the attributes and operations of construction cost estimating. The SQL Server was used to create the database schema for the proposed system, which consisted of 14 tables for deploying the functional requirements. The attributes and operations of the structure of the proposed system are described by the class diagram shown in Figure 4, which shows the system classes and the relationships among objects; for example, the project information can involve several buildings, and the (sub-structure and super-structure) information of each building is necessary. Furthermore, Figure 5 illustrates the sequence diagrams to identify the interactions and collaborations among the system objects. It visually depicts the order of the interaction scenario of the functional requirements by the actors (QS user, QS software, etc.), in order to represent the time of the function and what messages are sent or received.
5.2. Software Functionalities Requirements
The system should calculate the required resources (volume and prices), which are essential for the sub- and super-structure of the building. It also performs the CRUD operations (create, read, update, and delete) using a database. All equations were validated by experts and consultants, verifying the standard format and calculations. The main non-functional and functional requirements of the proposed framework are described in Table 3 and Table 4, respectively.
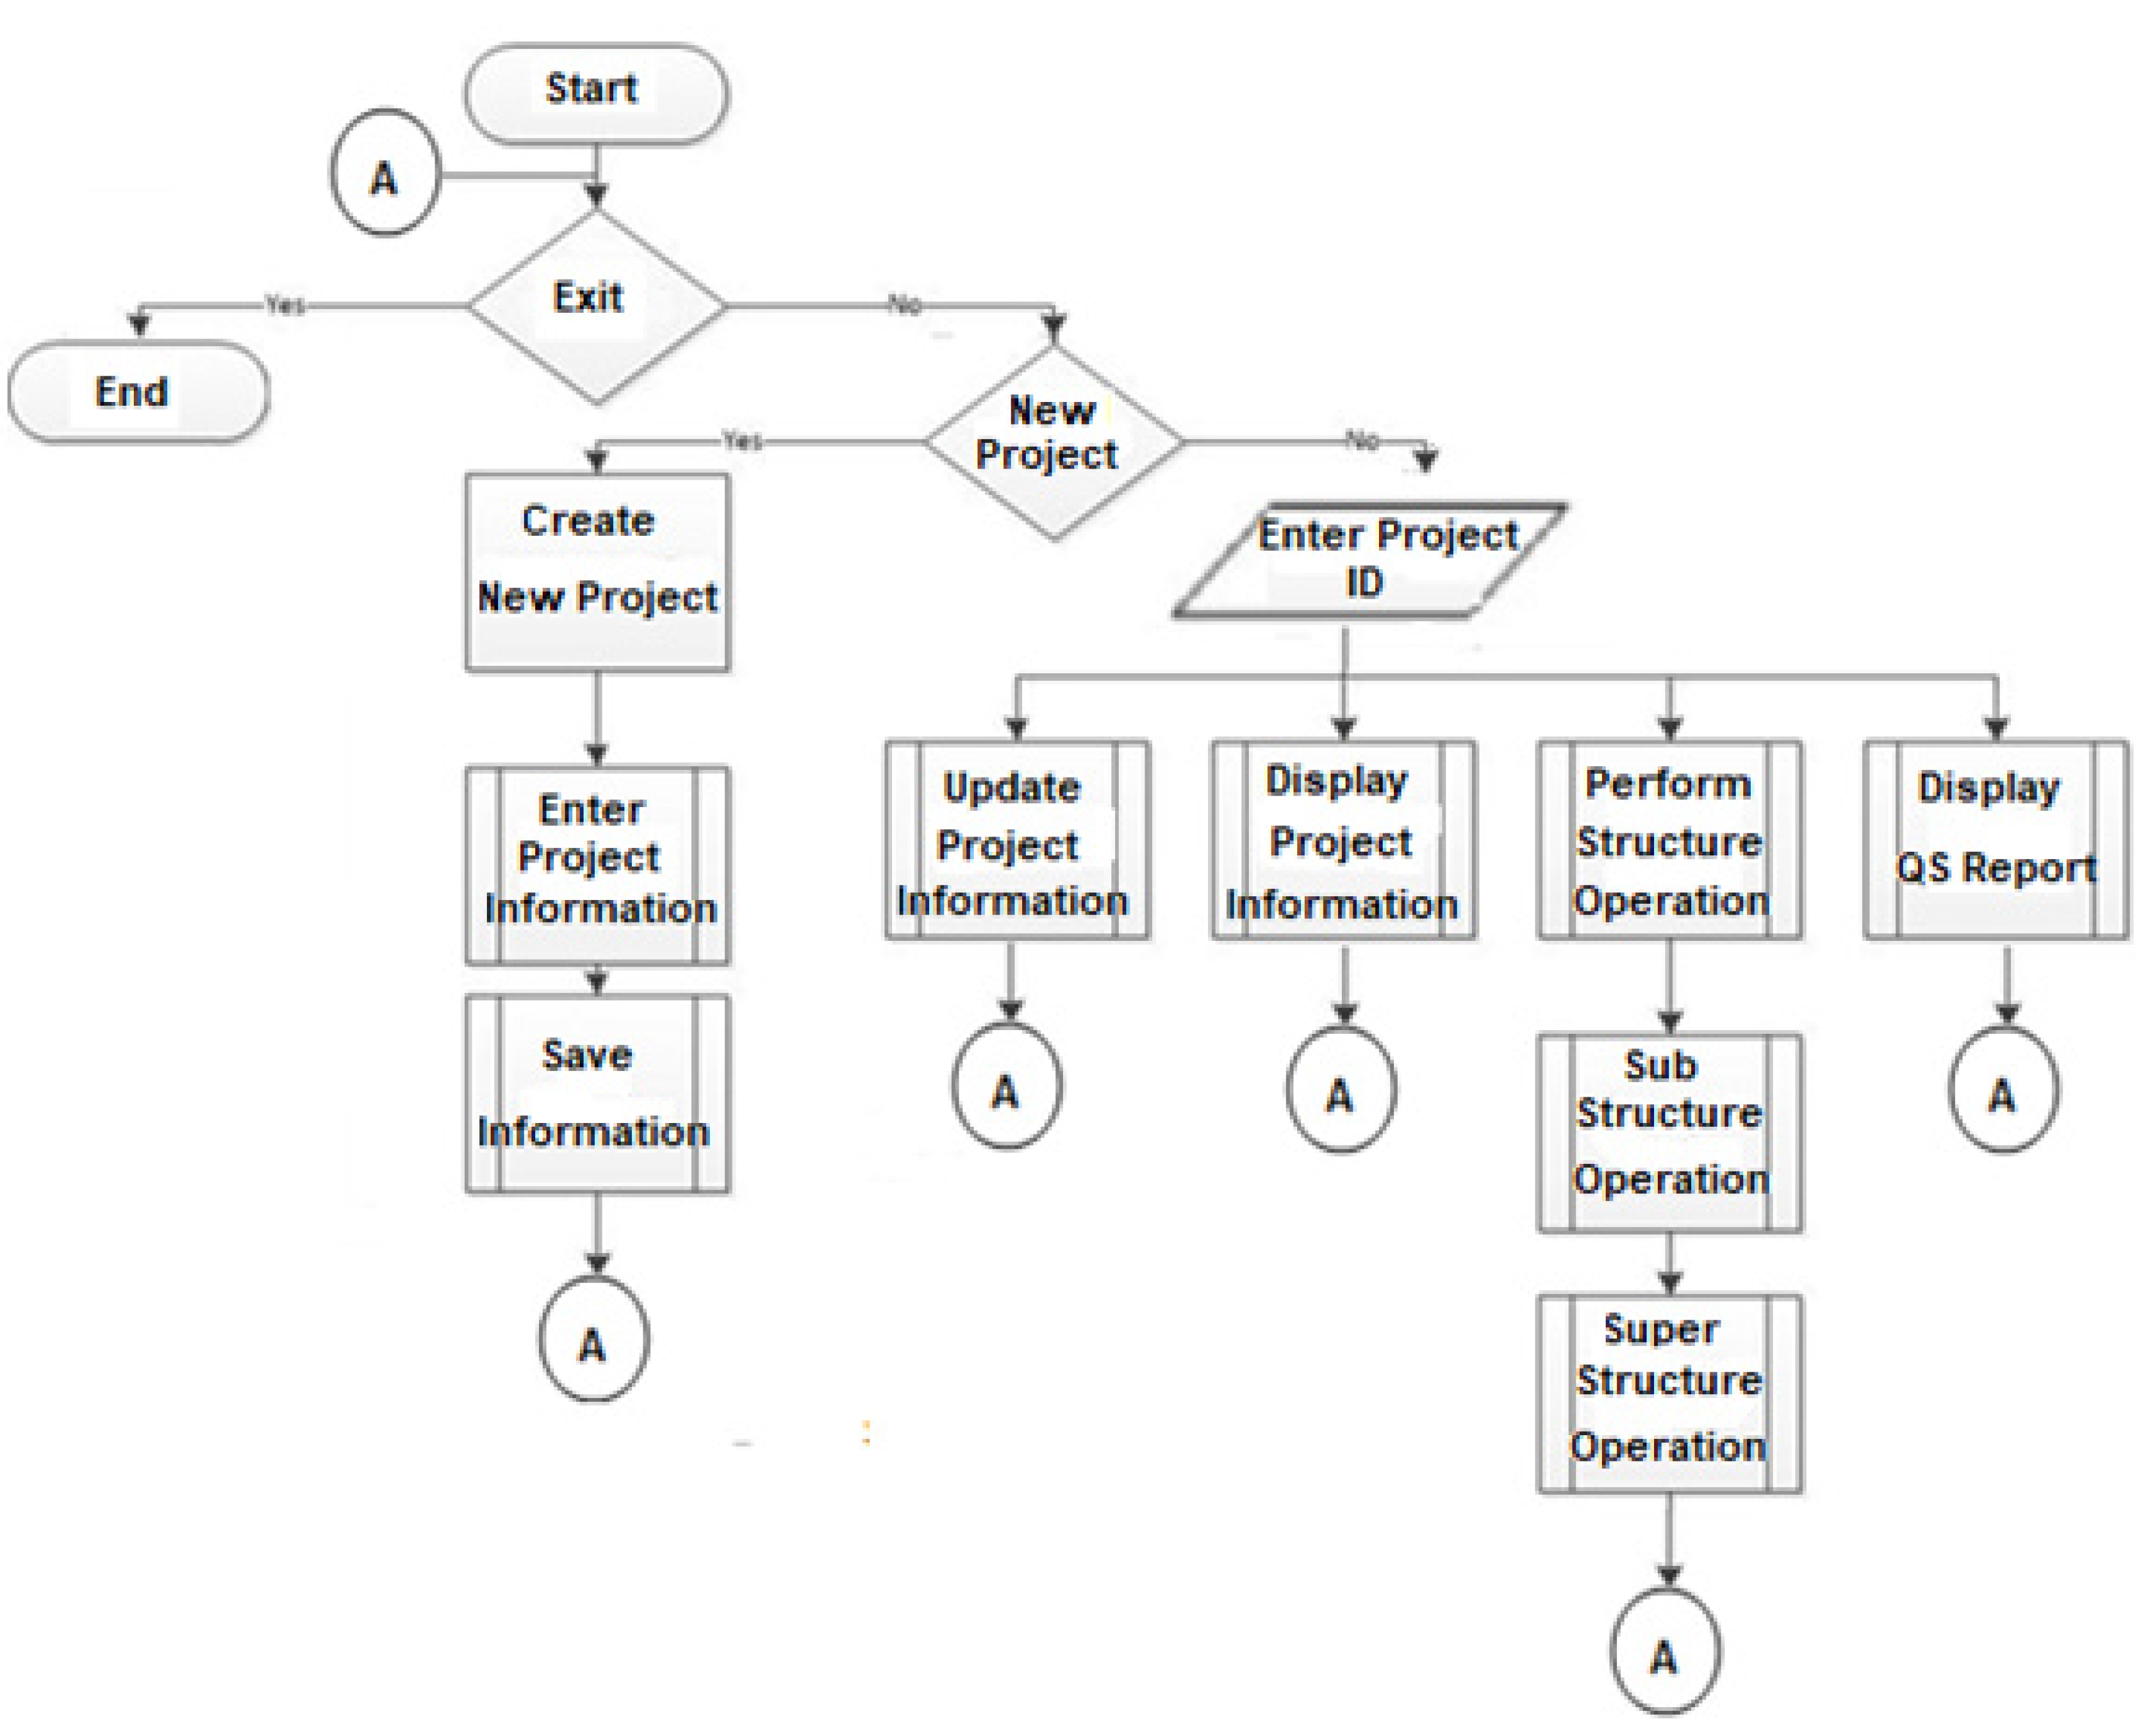
Figure 6 illustrates the flowchart of proposed framework, which demonstrates the execution of the QS operations.
5.3. Results of the Proposed System Demonstration
The proposed web-based framework was implemented using the Visual. Net developer platform and was programmed using ASP.Net and the C# programming language. The proposed framework demonstrated and deployed more than 200 calculation equations for automating QS activities. The framework consists of more than 50 user-friendly web pages, which demonstrate the QS activities sequentially, starting from project registration to the QS report. Figure 6 shows the flowchart of implementation steps, which begins with the login webpage shown in Figure 7.
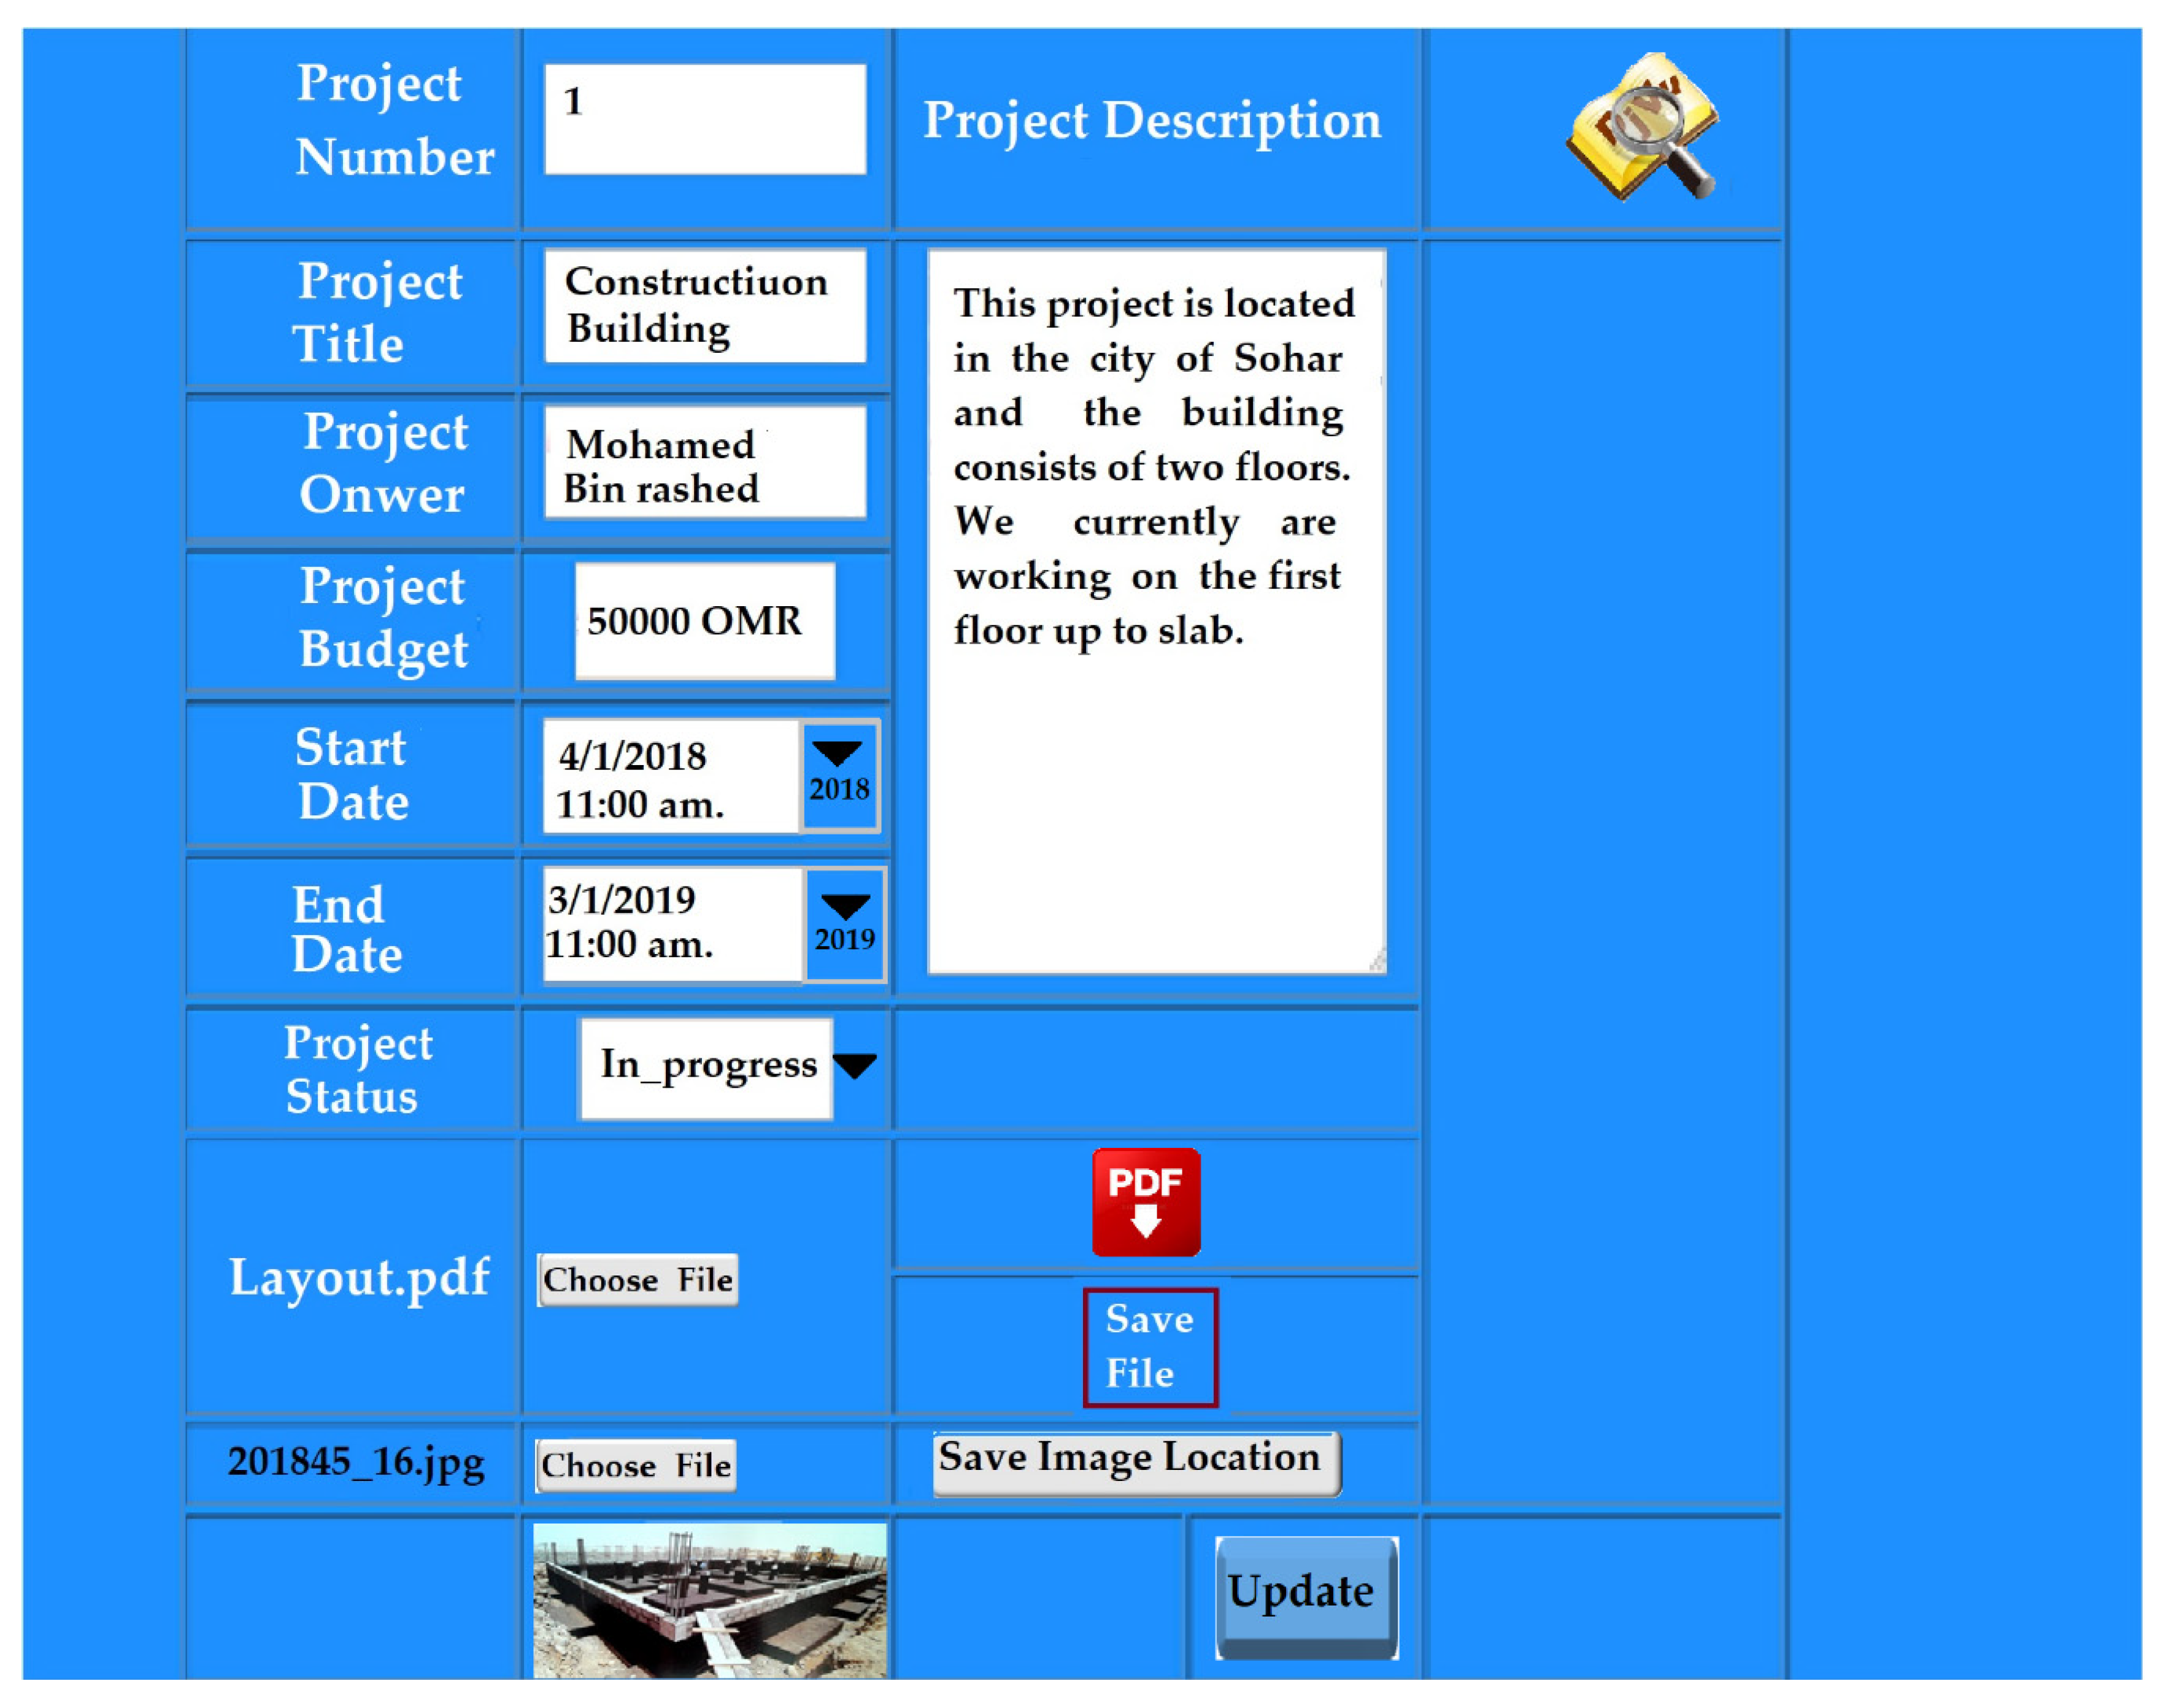
The authorized user has the choice to create a new project or update an old project. Therefore, the user should first create a new project using the project registration form shown in Figure 8, which asks the user to enter the project information (e.g., number, title, owner, budget, start date, end date, etc.) and then complete the other QS Tasks. The project information will be saved in the main database, in a table called “projectinfo”, which will help to create, read, update, and delete project information securely and quickly.
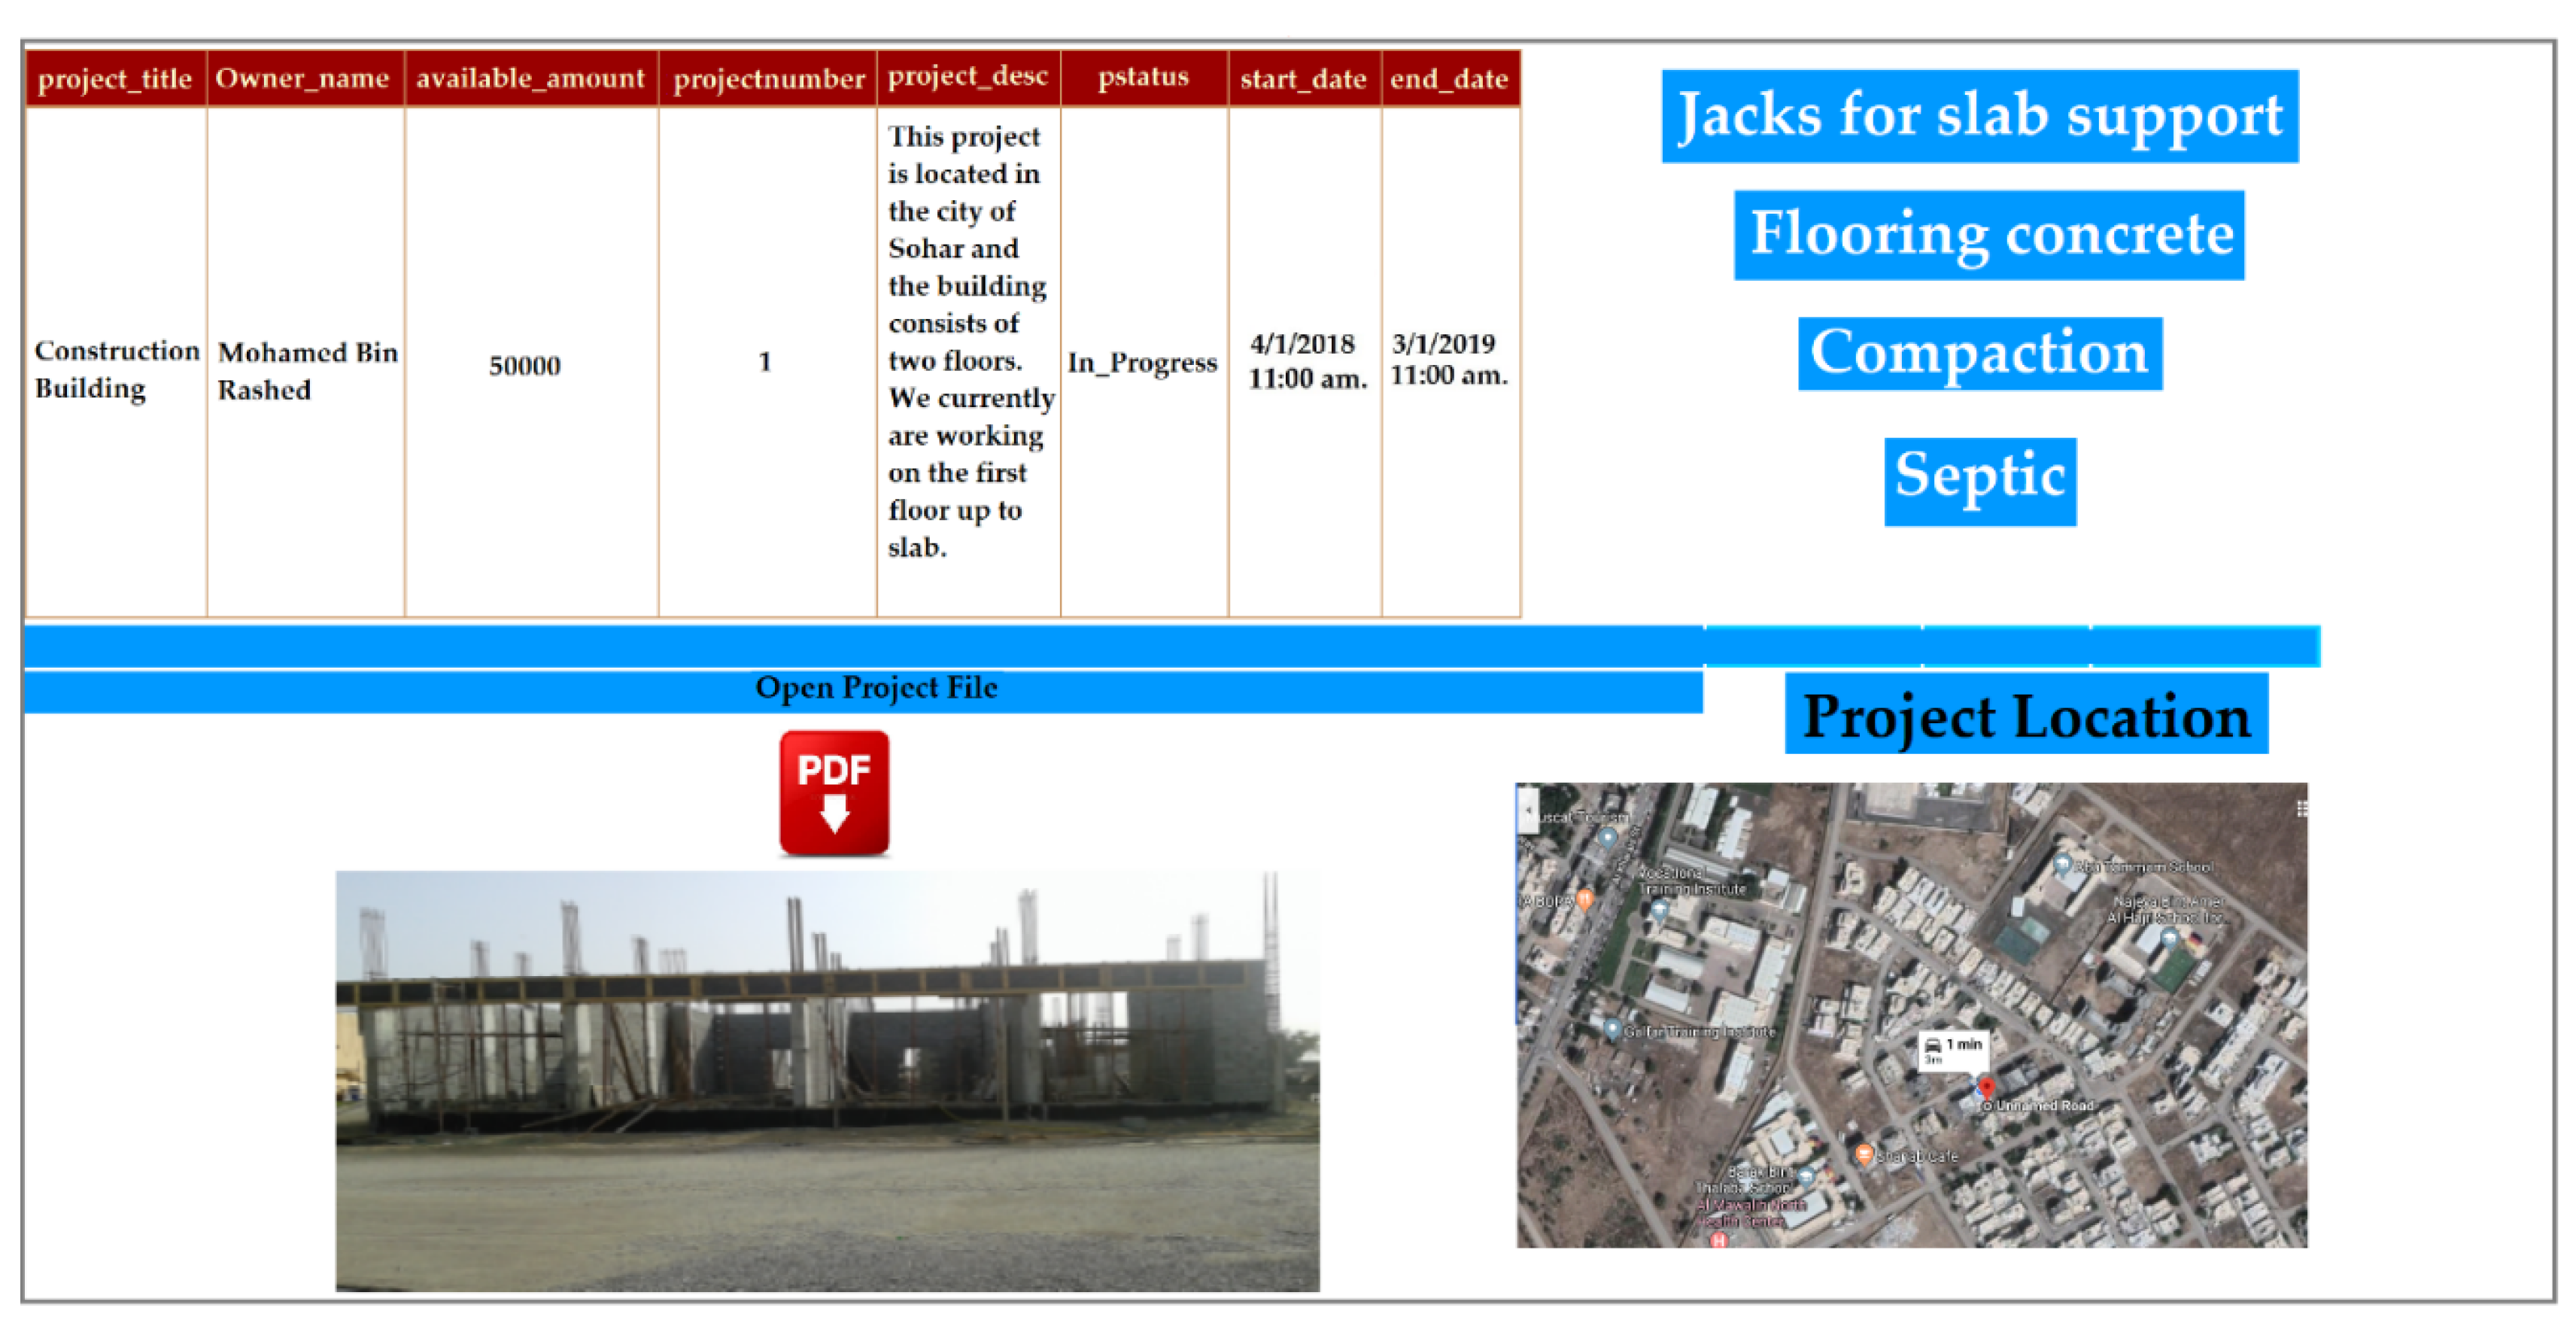
After the project information is recorded, basic operations and cost calculations can be performed. Figure 9 presents the project information webpage, which helps the user to start the cost calculations, automatically determine the project location, and can also guide the user to reach the location easily using Google Maps and other location facilities. The proposed QS system provides a chance for the user to enter the data manually, using the data entry control called “detail view”. The system can also automatically upload data files specified by the consultant during the data entry, in order to reduce data entry time and errors. The system automatically triggers the SQL script for uploading the datasheet, and the results for each operation are displayed automatically in the specific “grid view control”.
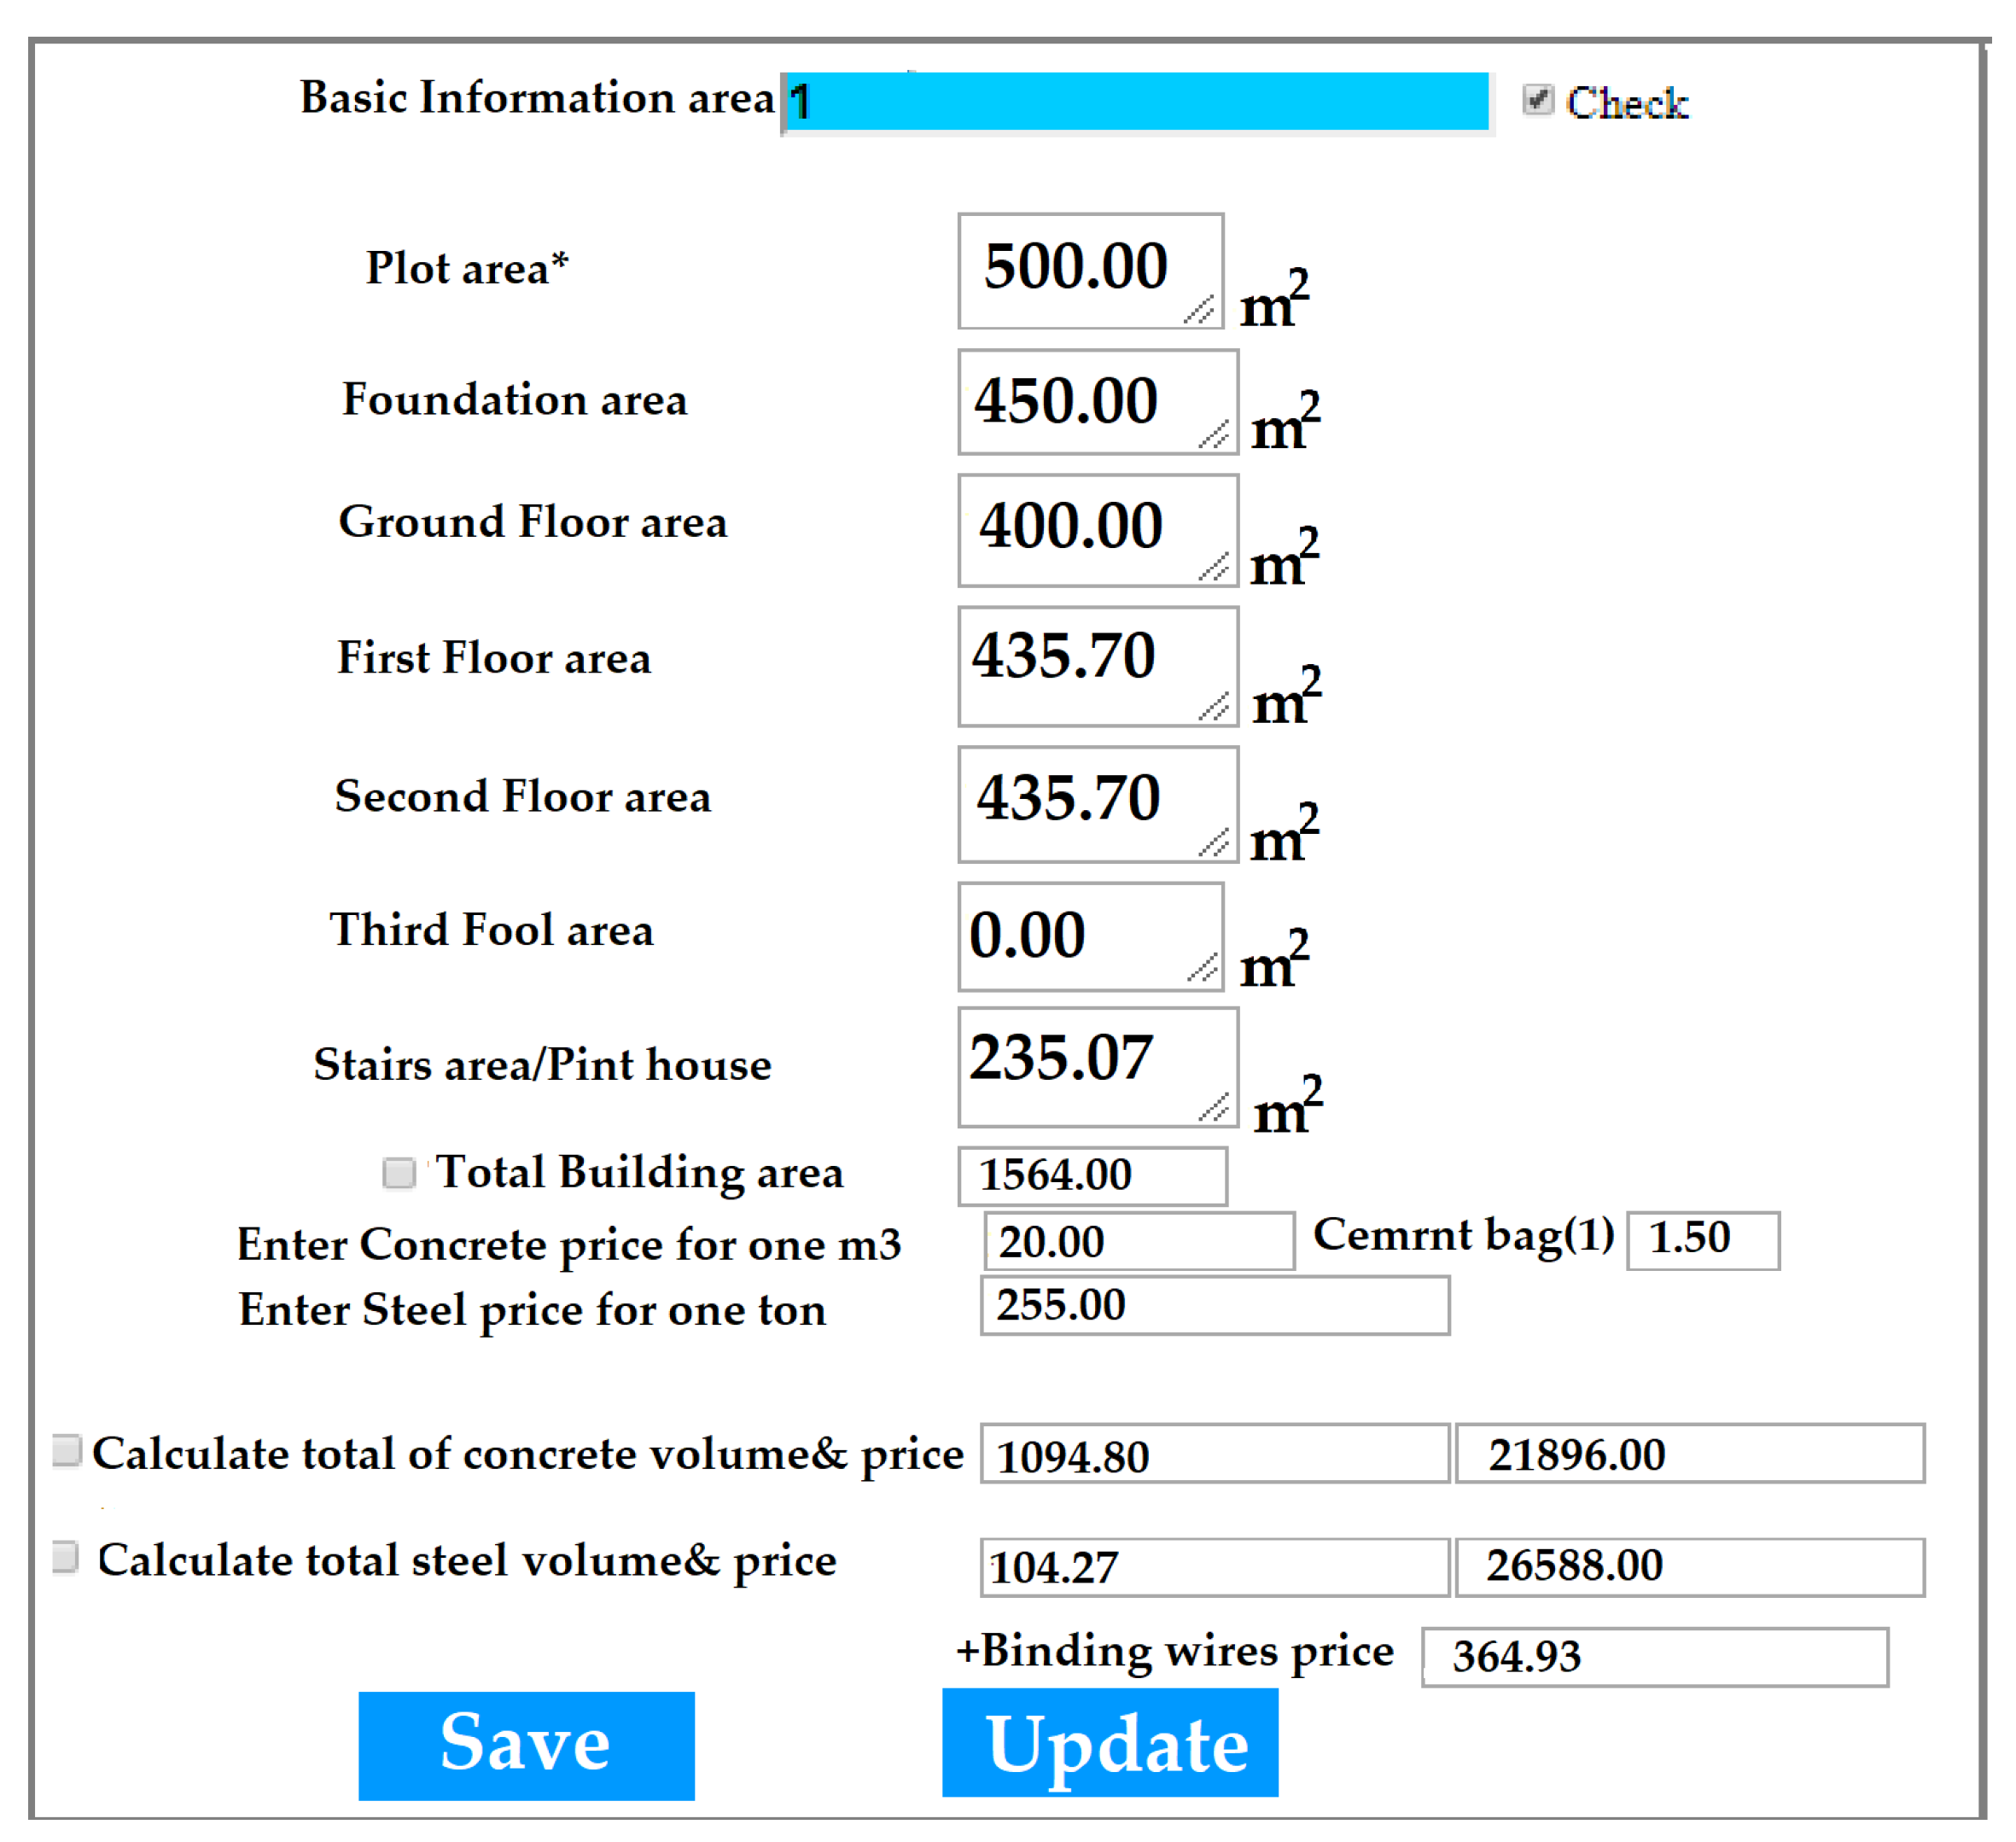
Figure 10 presents the project specification of a real test example, which was used to evaluate the computation results of the proposed system.
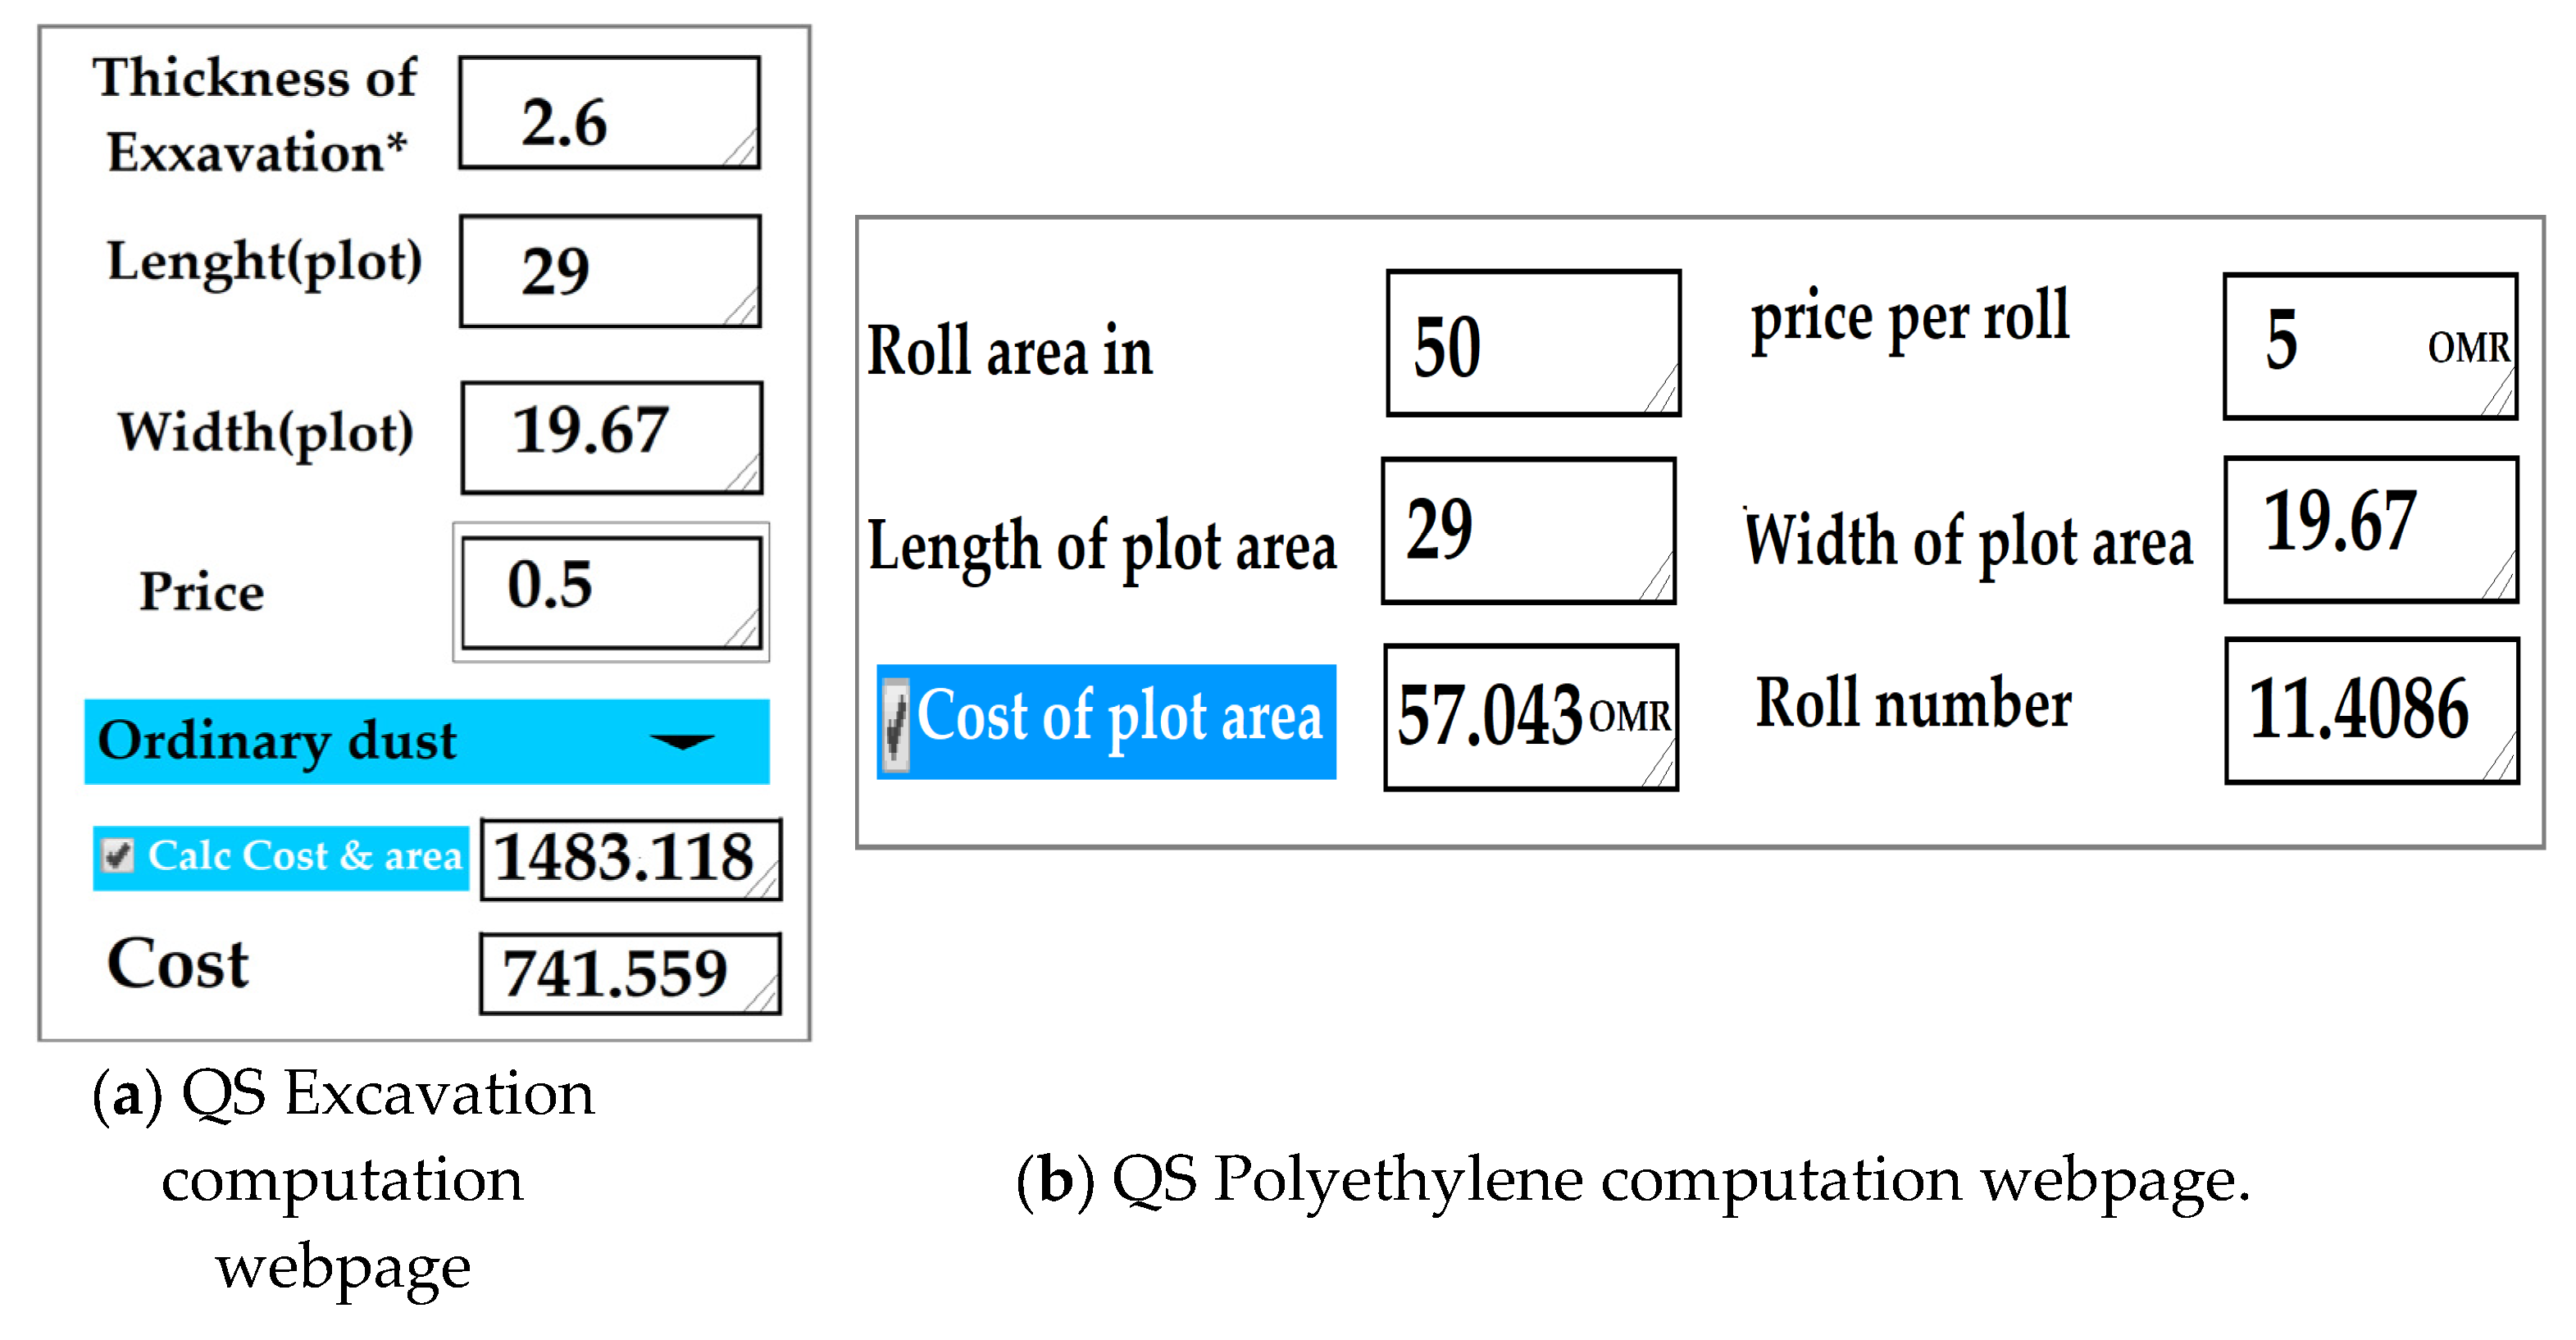
Figure 11 shows the details of computing the sub- and super-structure operations, which was determined by the QS engineers.
The excavation cost (Figure 11a) was calculated as the quantity of extracted soil, multiplied by the price of each cubic meter, which are determined by Equations (1) and (2), correspondingly:
where thickness is the amount of the quantity of extracted soil, length is the digging distance, and width is the width of the digging area.
where the unit cost is fixed, based on the local price (Oman = 0.5 Omani Rial; OMR).
Excavation-Volume = Thickness × Length × width,
Cost of excavation = Excavation-Volume × unit cost,
As a real test example (Figure 11a), with Excavation-Volume (2.6 × 29 × 19.69) equal to 1483.118, when multiplied by the unit cost (0.5), the resulting cost estimate was (741.559 OMR = 1926.20$).
The required high-density polyethylene pipes cost computation (Figure 11b) was calculated as in Equation (3):
where the foundation area is the result of multiplying the length by the width of the area to be computed, the roll area is 50 square meters, and roll price is 5 OMR per roll Therefore, the polyethylene cost (Figure 11b) was (29 × 19.69/50) ×5, which was equal to (57.043 OMR = 148.17$).
Cost of Polyethylene = ((Length × width)/Roll Area) × Roll price,
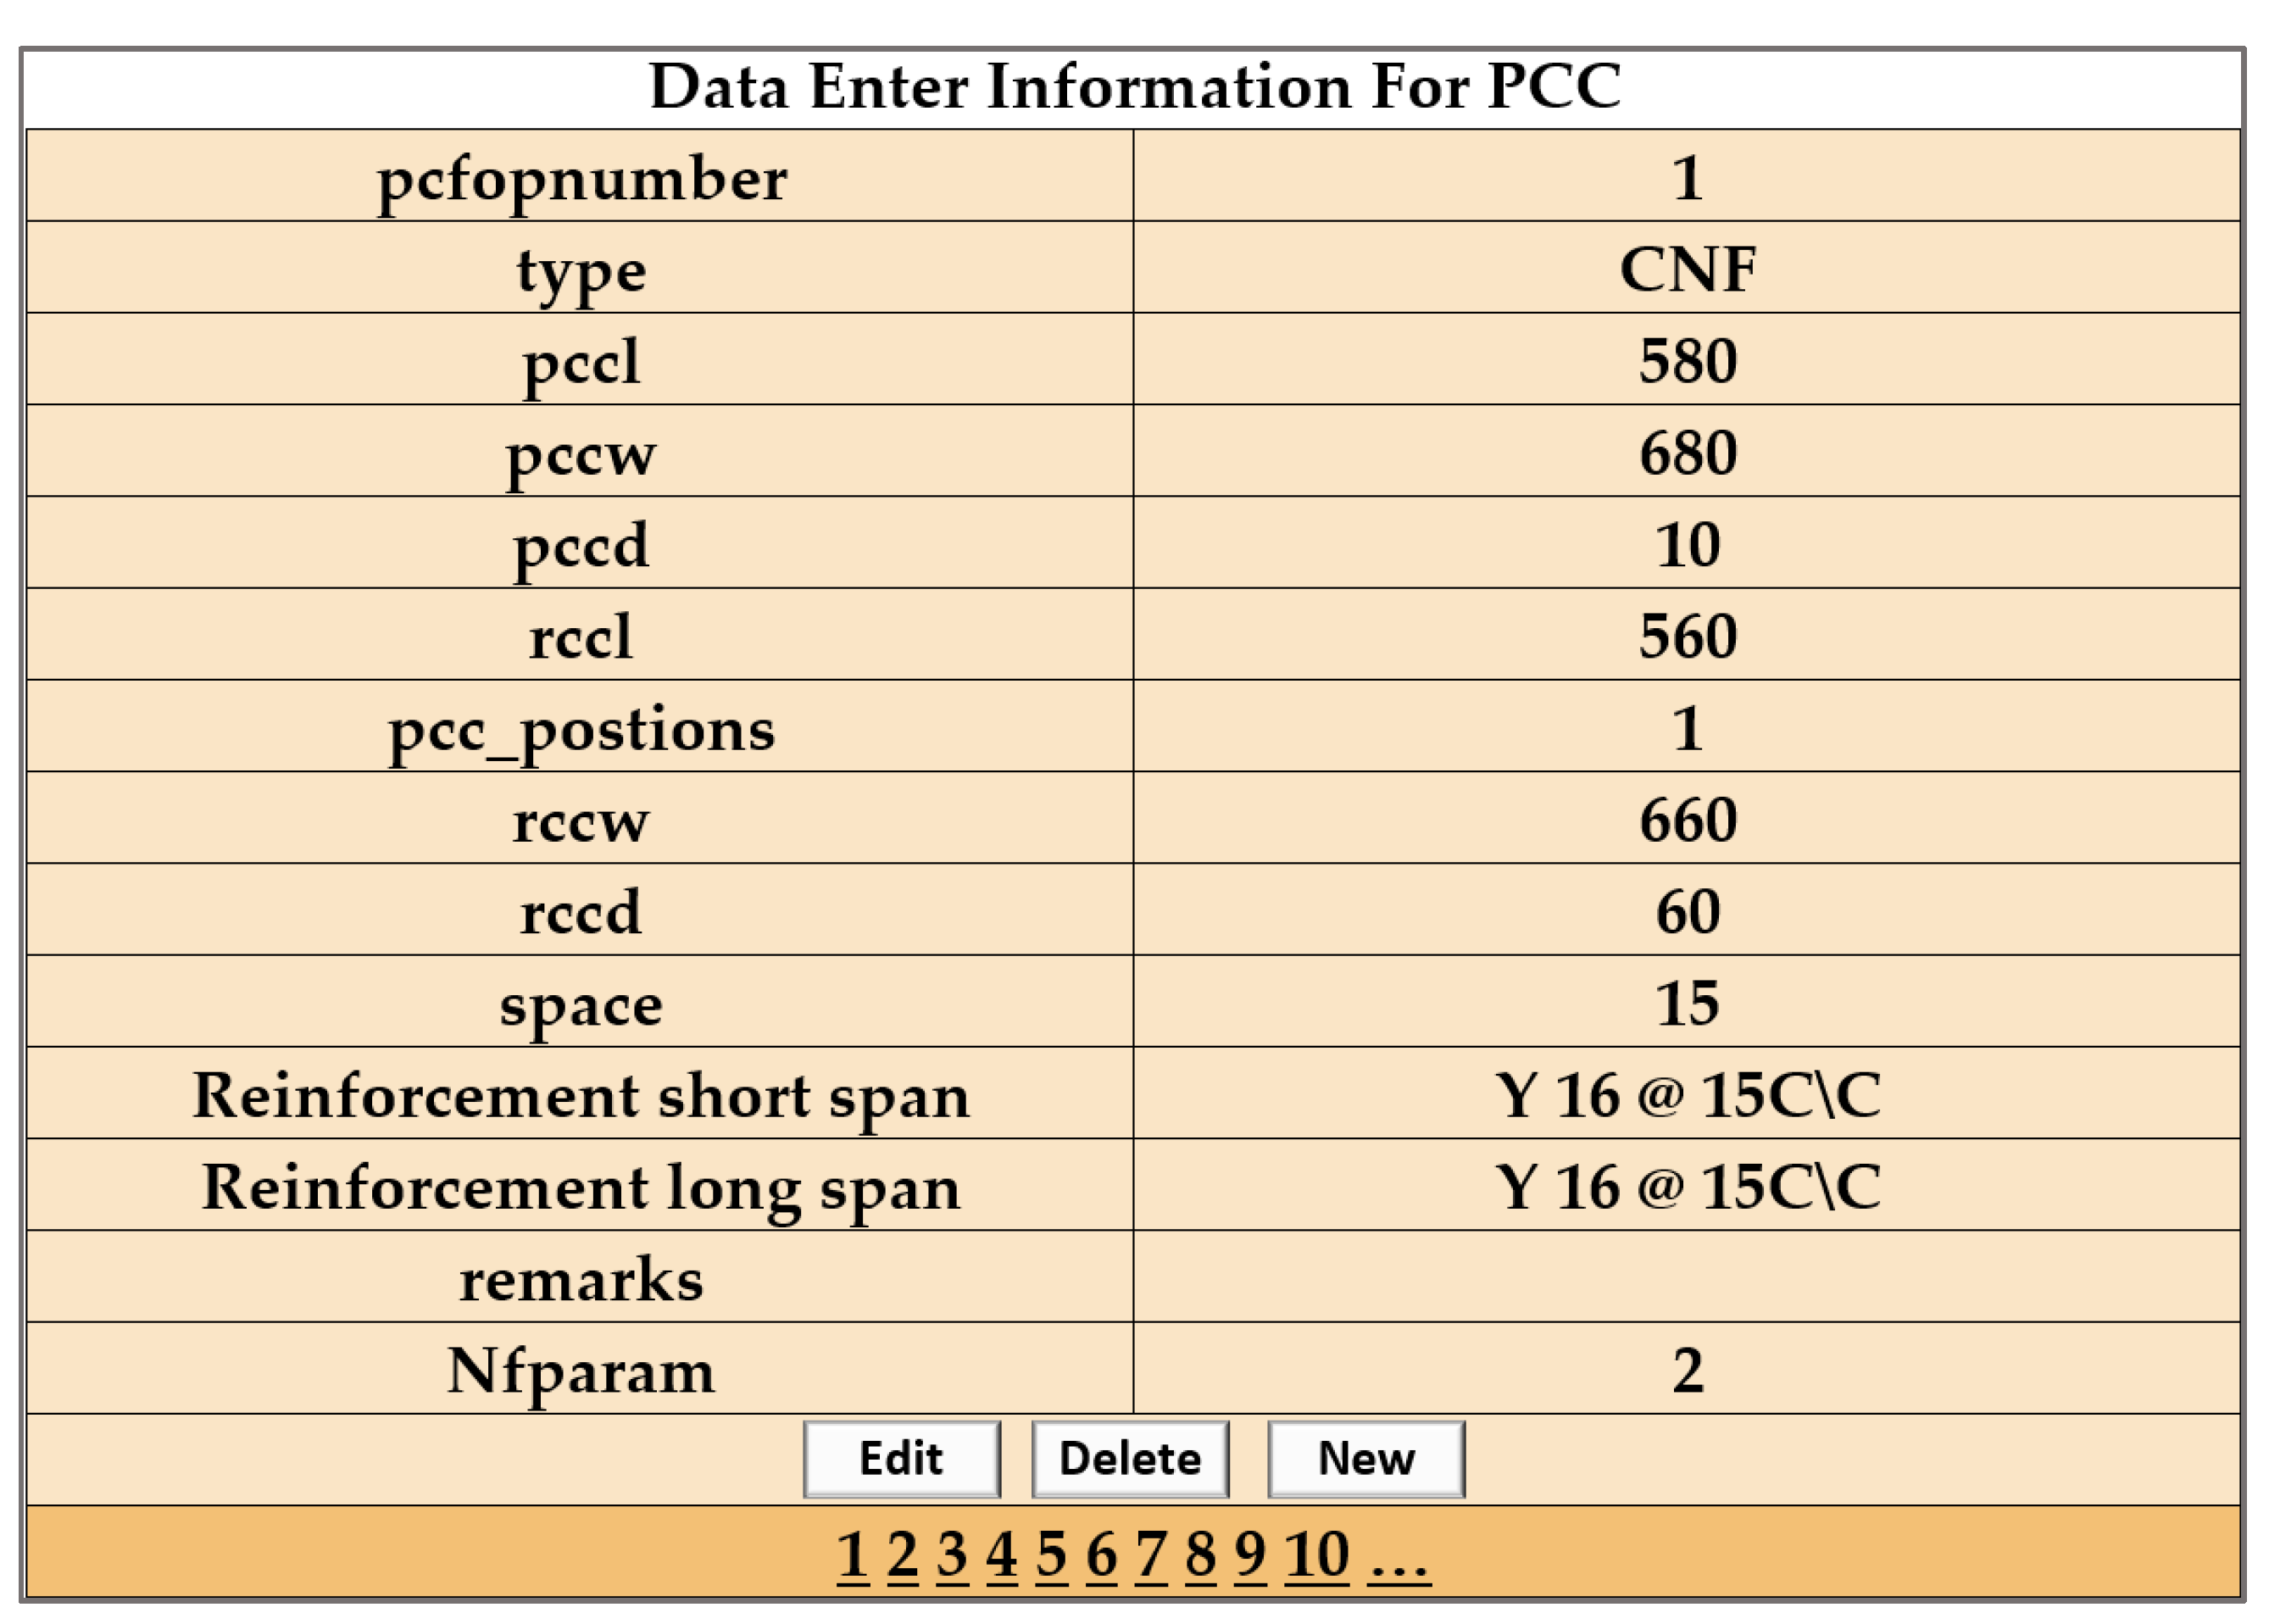
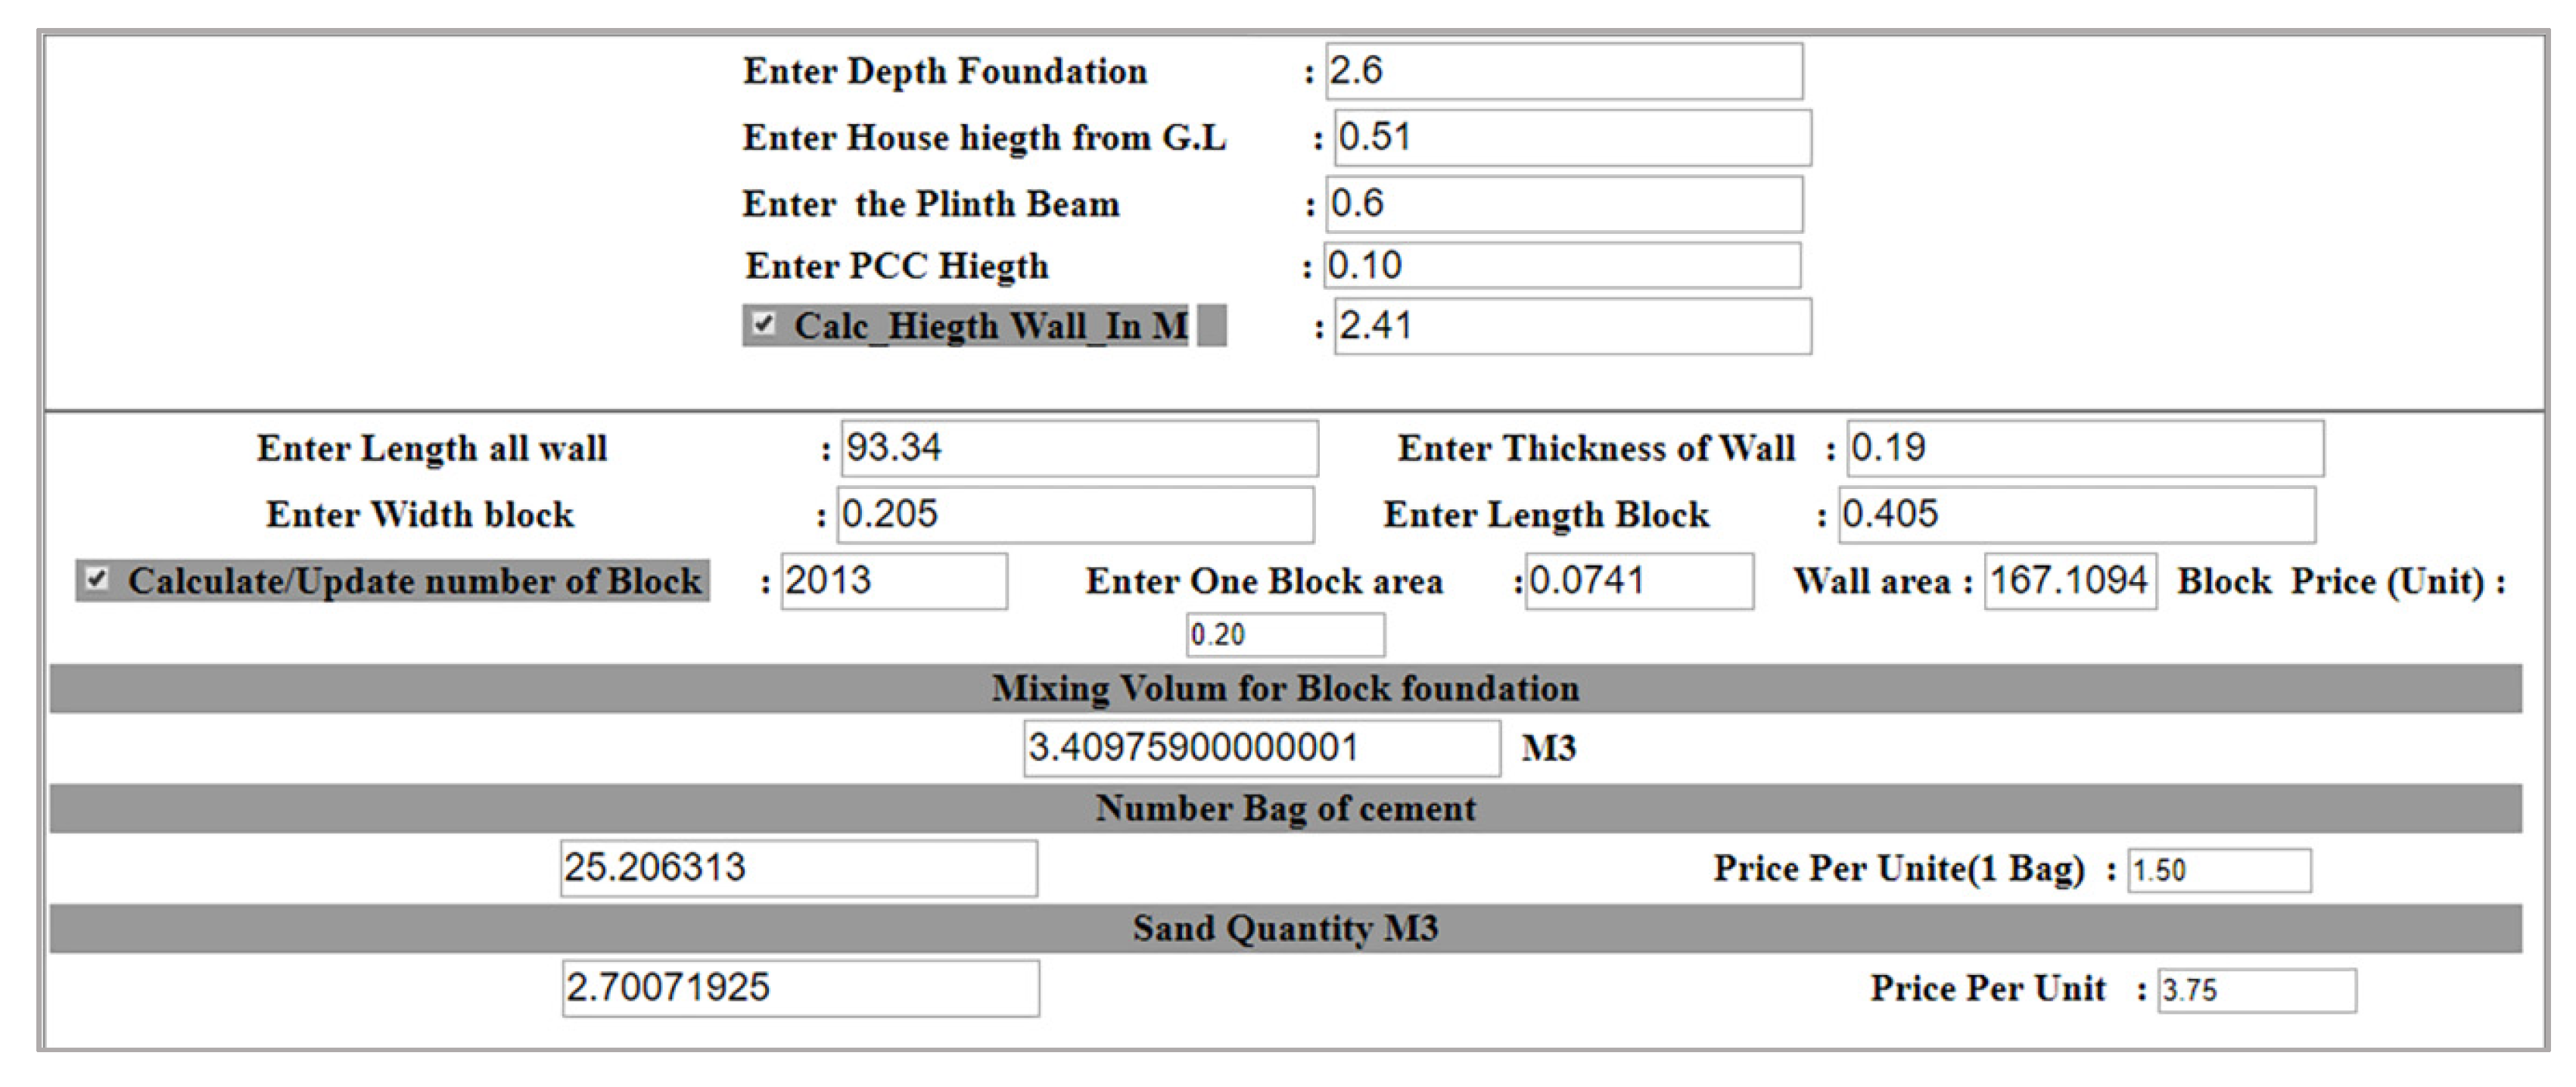
Figure 12 shows the webpage for the PCC calculation phases using real data, which were validated by manual calculations. Figure 13 shows the Block Information webpage, which was used for viewing, inputting, and updating the data.
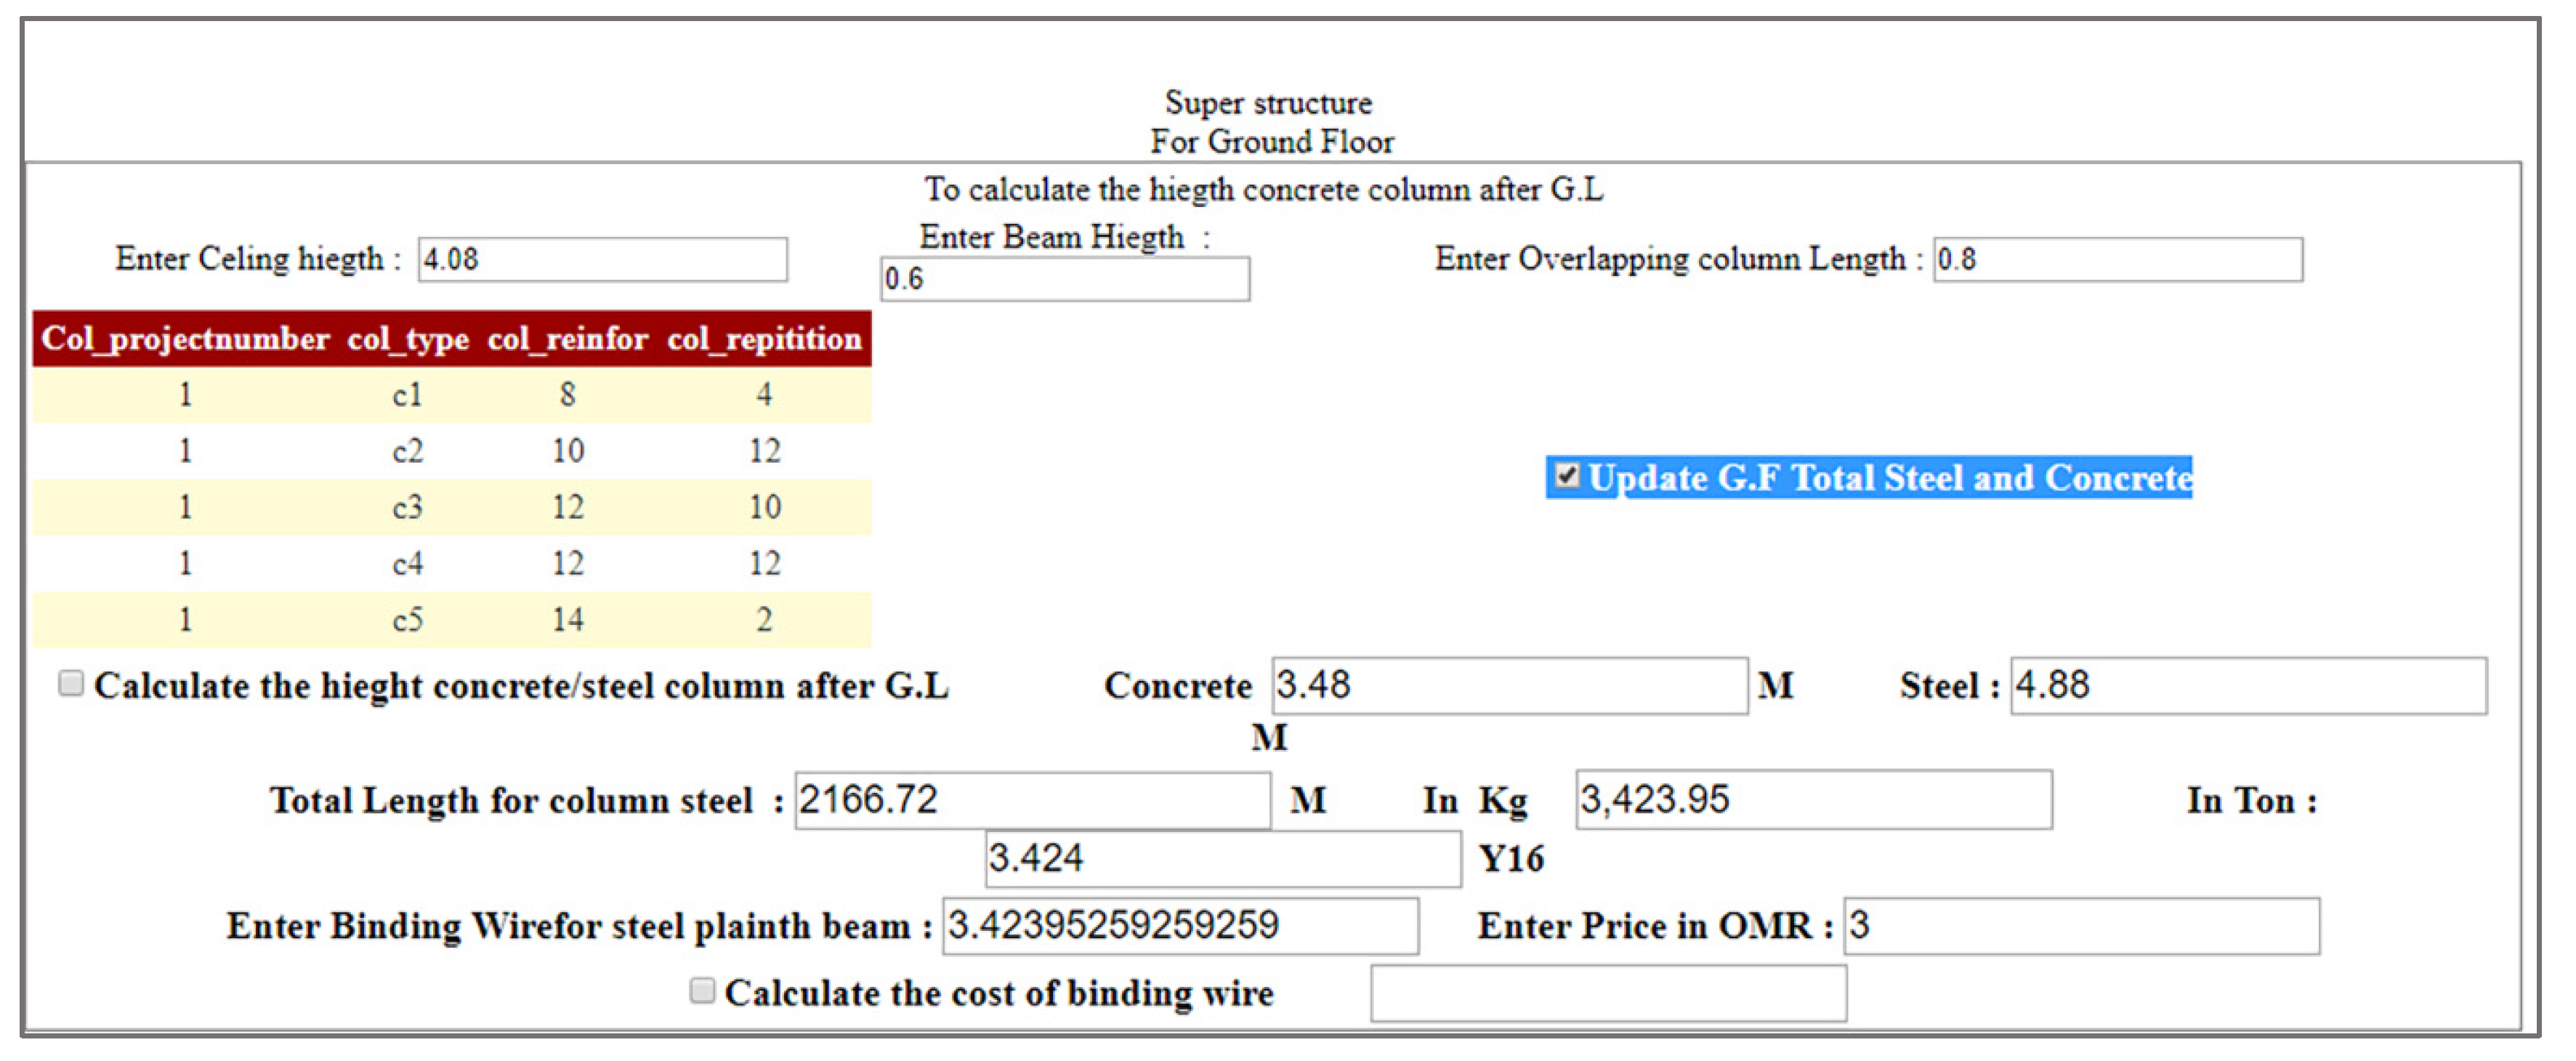
Figure 14 presents the ground floor steel and concrete calculation webpage, which was used for viewing and updating the calculated results.
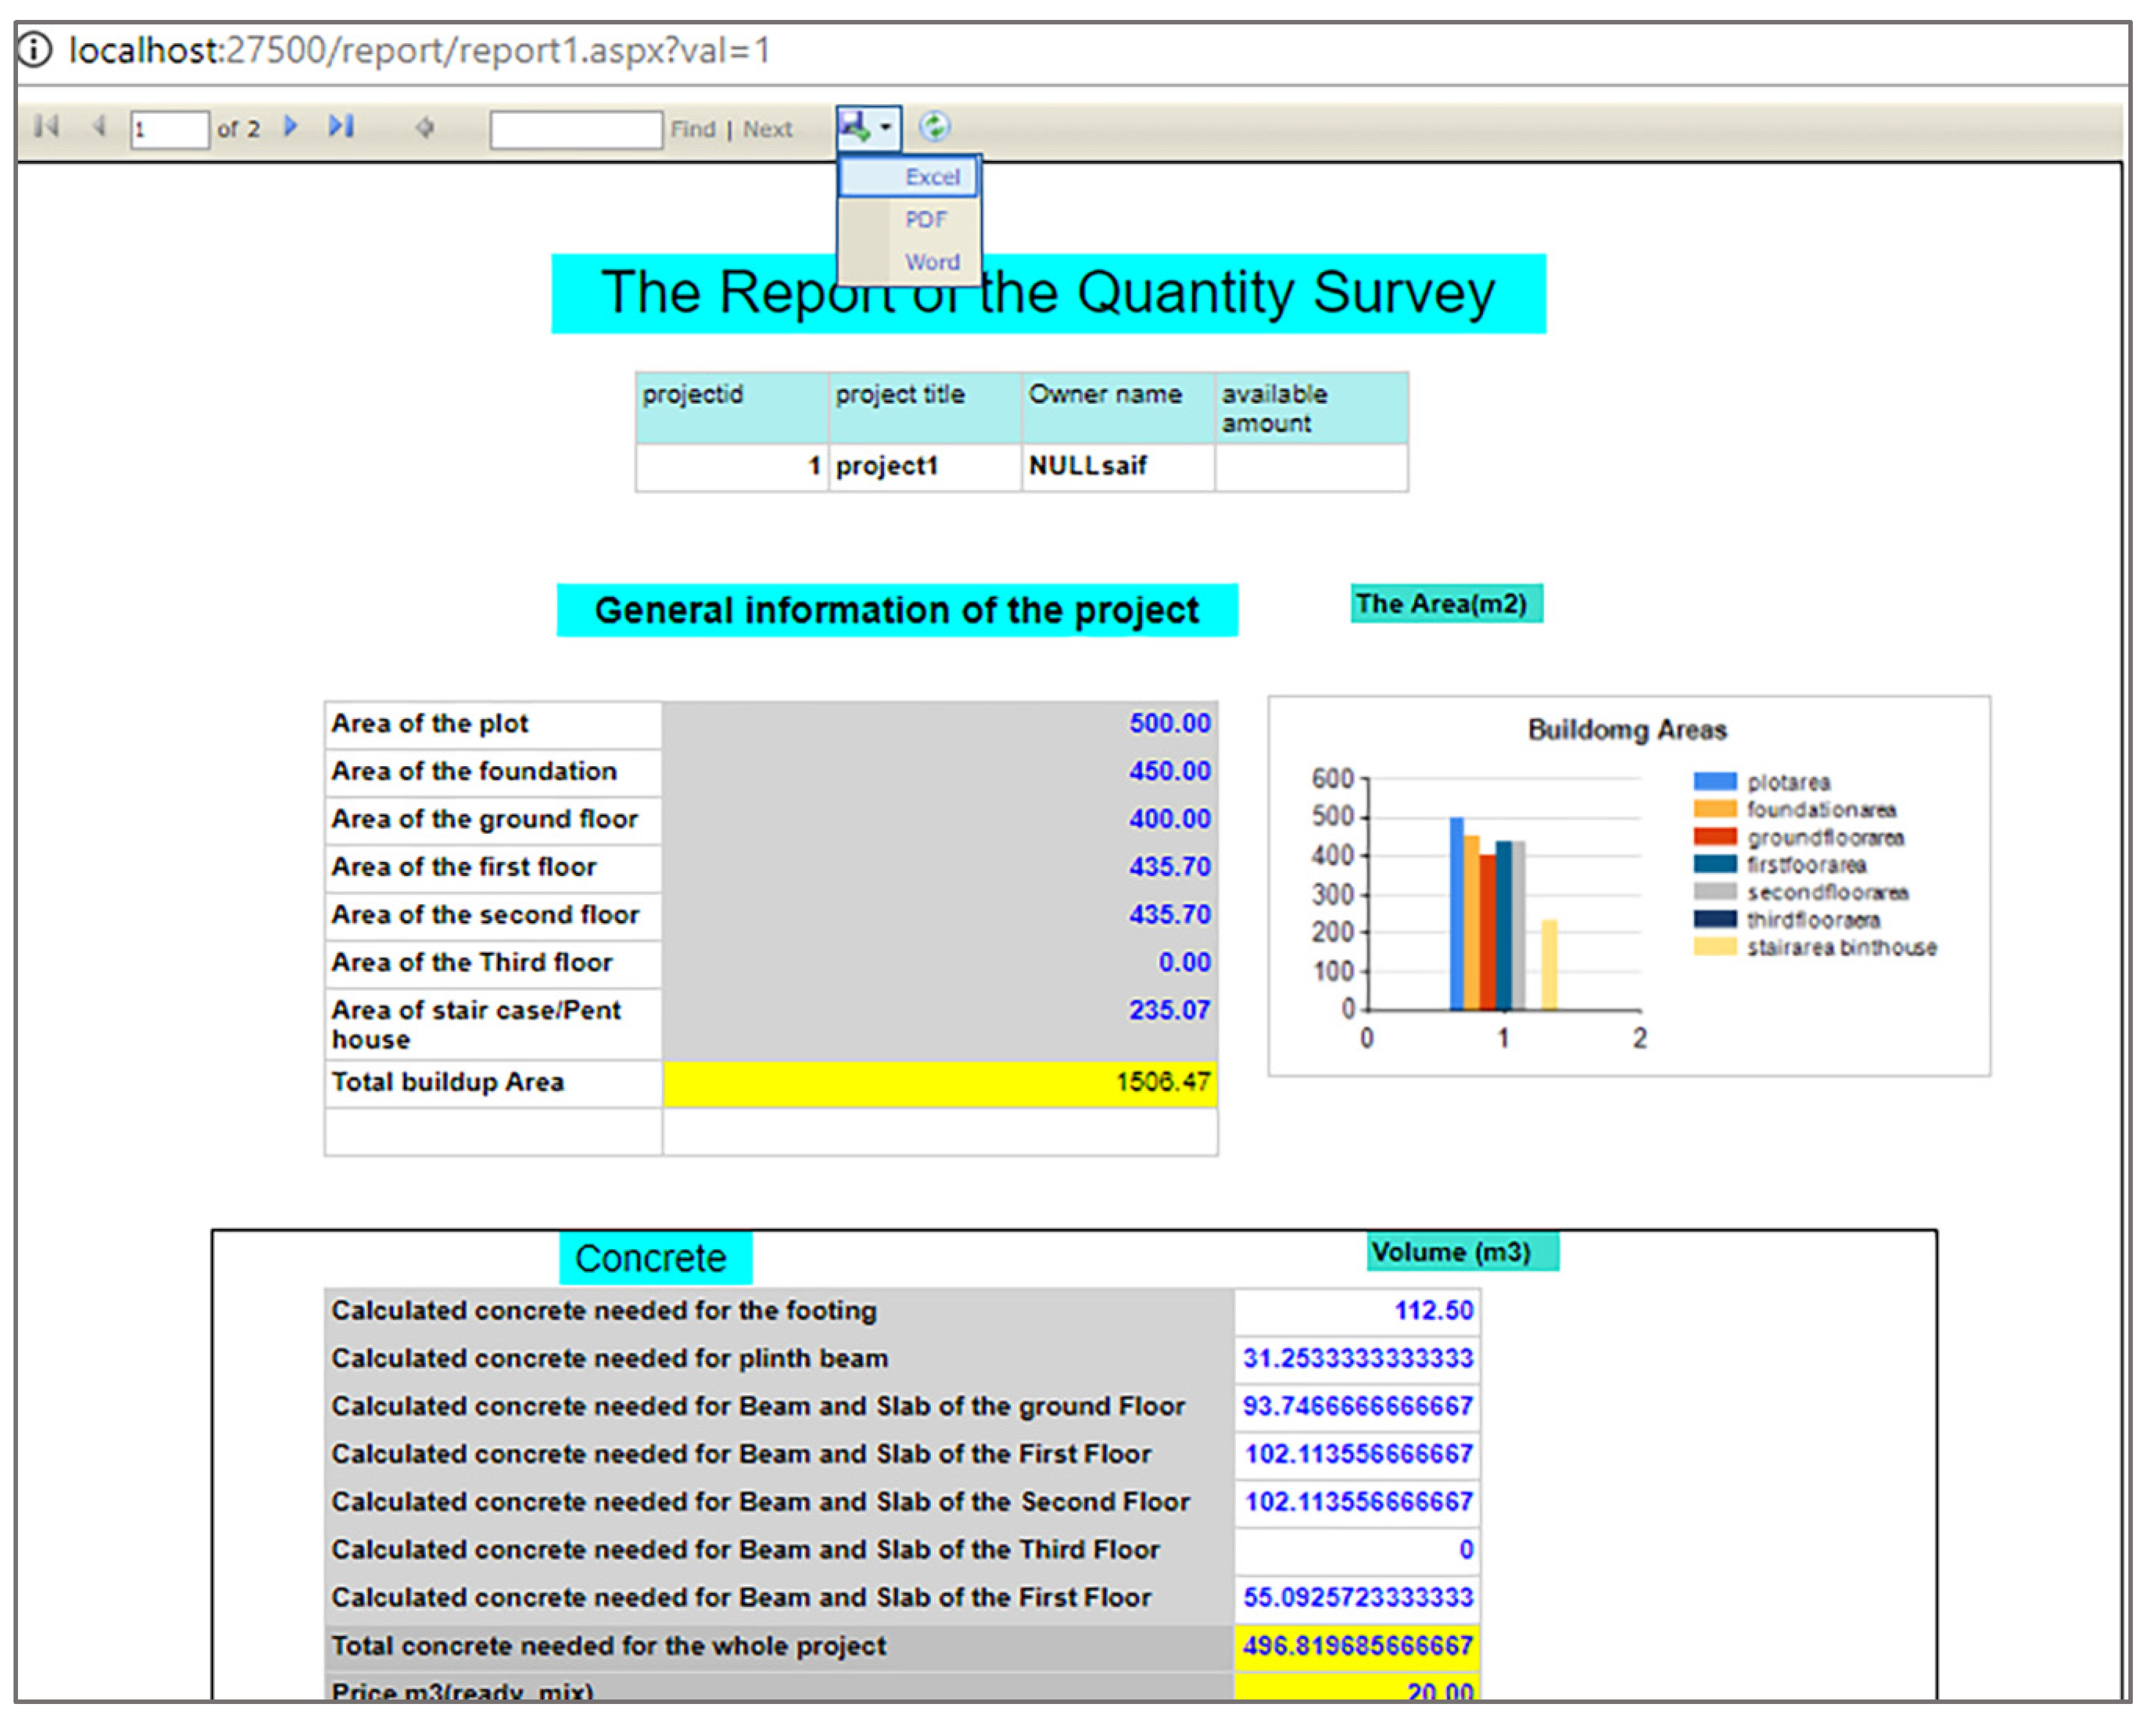
Figure 15 presents a sample of the QS reports, which can be exported in different formats, such as Excel sheet, acrobat reader file (.pdf), or word document. The report has all necessary information related to a project, offering a chart diagram and a summary of the cost estimation.
6. Discussion
The quantity surveyor is responsible for leading all phases of the contractual and financial issues of the construction projects. Traditional quantity surveying methods such as standard paperwork are very time-consuming, the systems are not user-friendly, and they only give an estimated cost. Therefore, the results were distributed into two main stages—the result of the critical analysis of surveyed work and the evaluation of results of the proposed framework. First, the results of the comparison of literature survey research were reviewed and analyzed. The comparison was made based on the features completed by each author. We classified the literature survey based on five categories, including traditional QS, QS professional tasks, public sector services, tender service, and modeling/visualization, as presented in Table 5.
The second part of the results was to compare the effects of the proposed QS framework with the results obtained from the standard paperwork and the Excel software. As mentioned in the implementation section, the proposed framework automated the QS activities and reduced the processing time (114 days in manual work and 19 days using excel sheets) to about three working days, as shown in Figure 16.
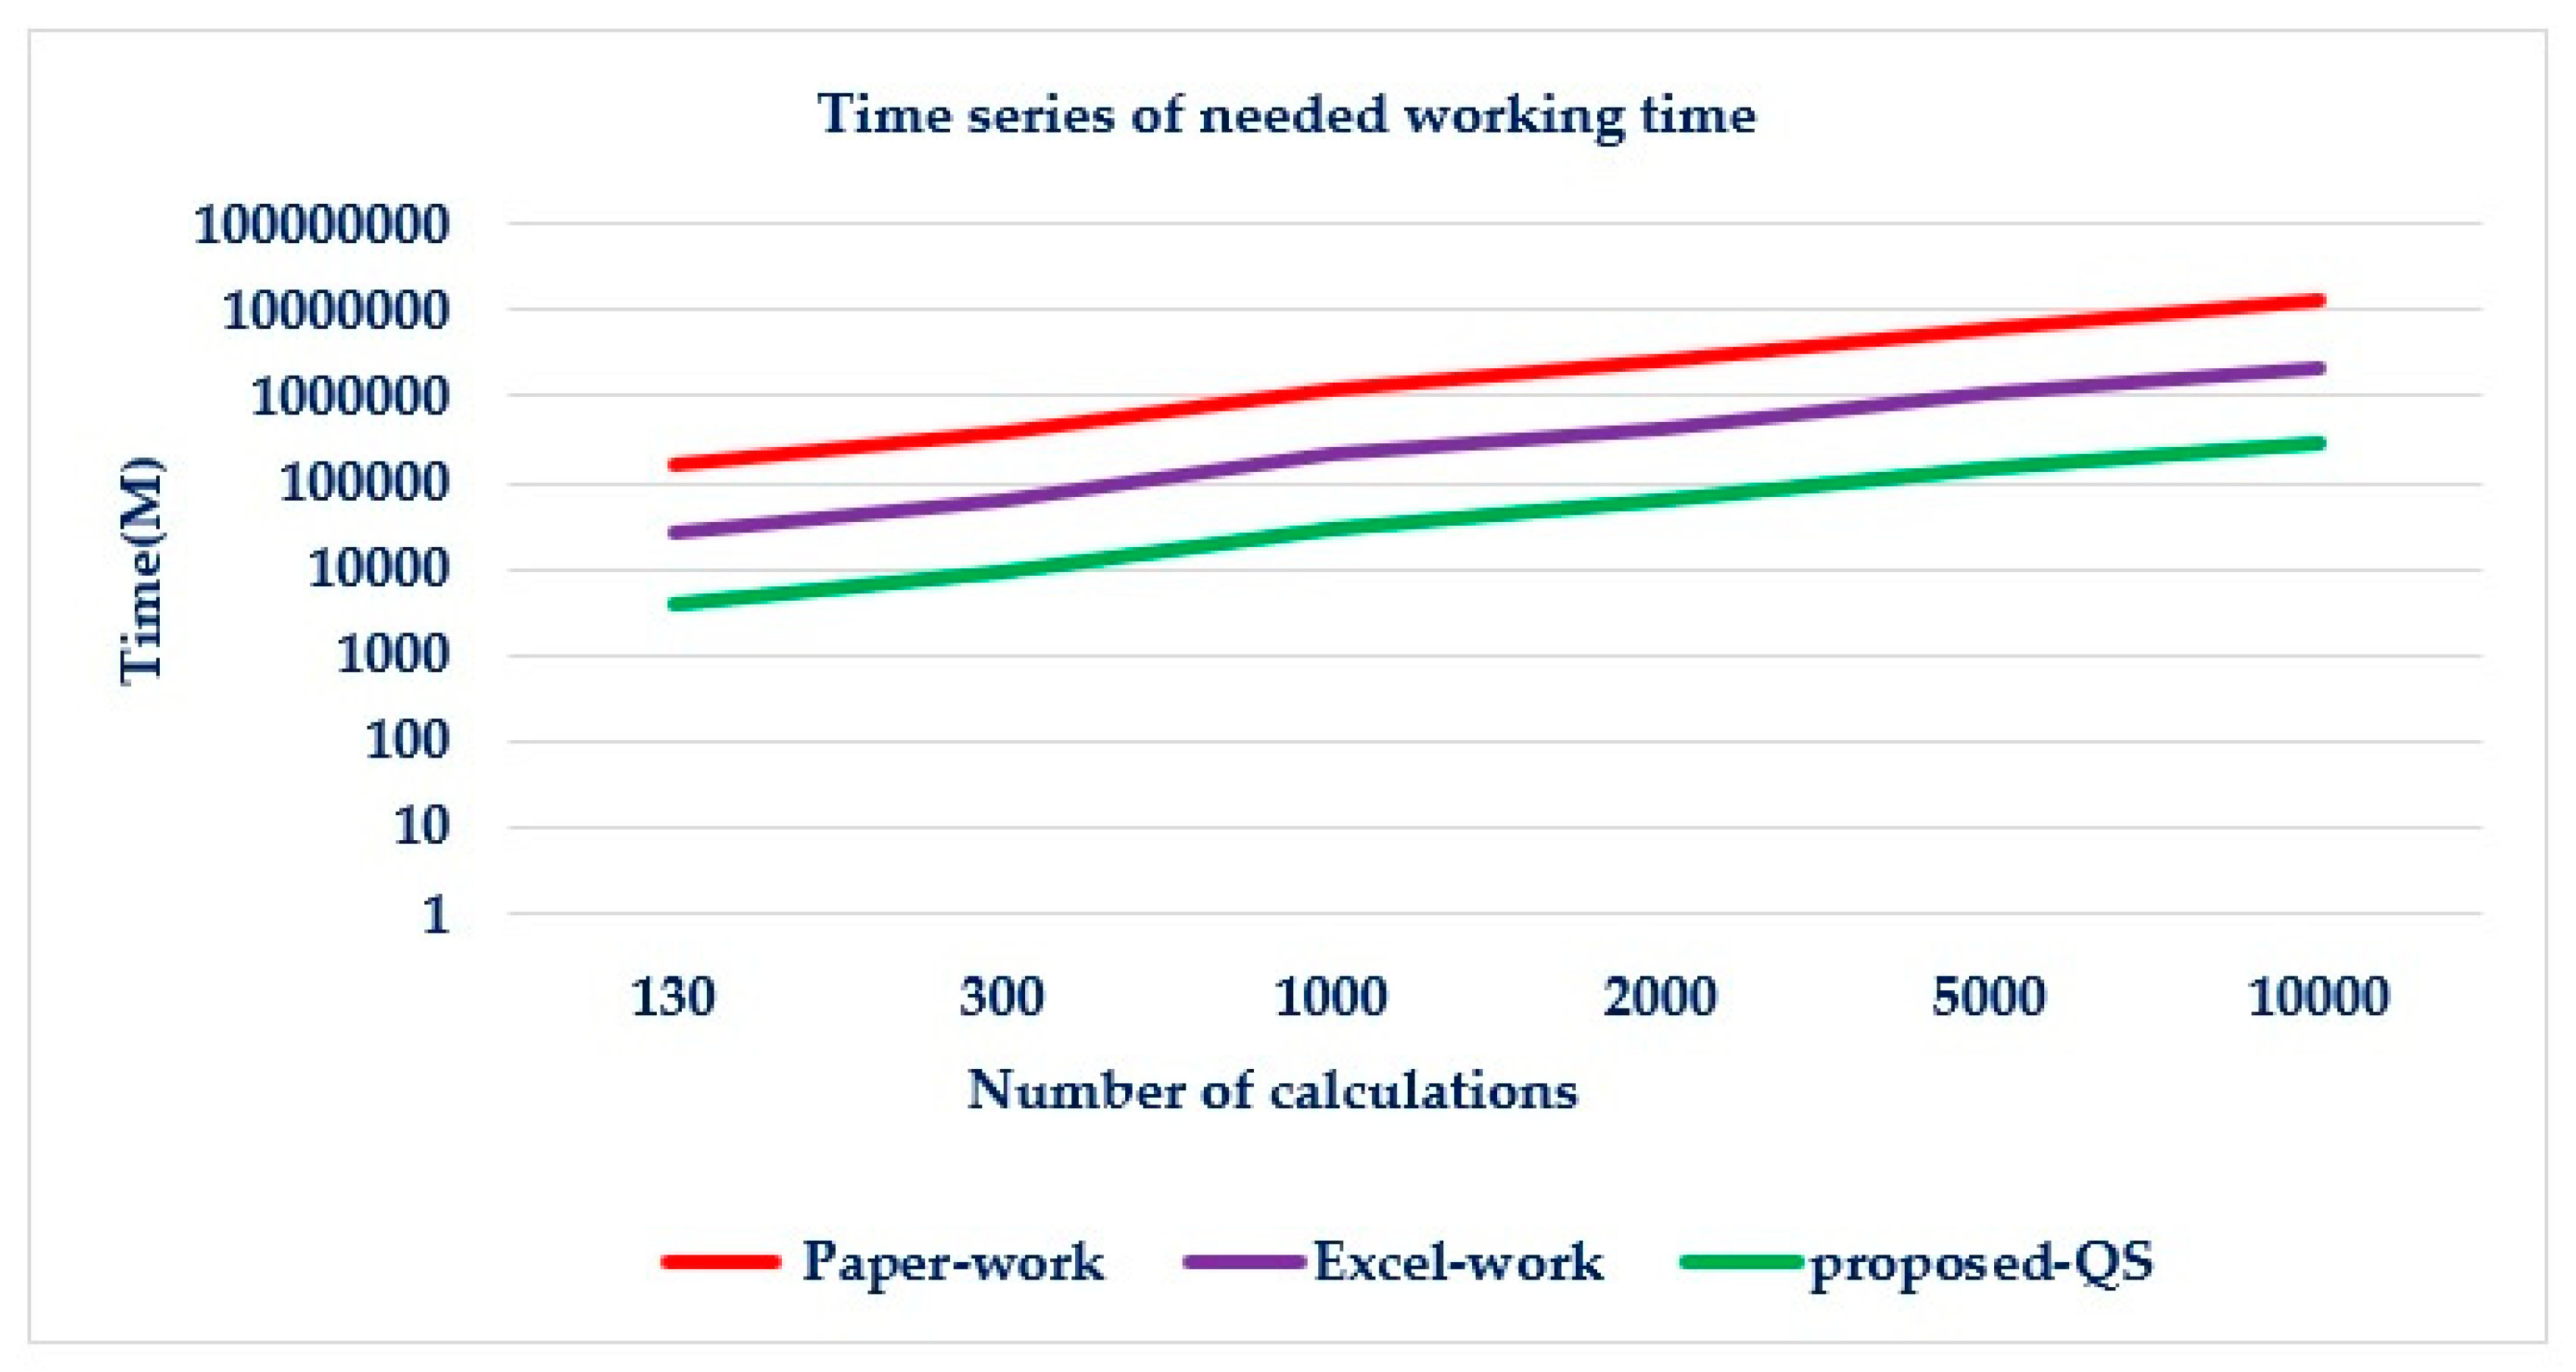
For evaluation purposes, we should implement and compute the three systems under the same conditions; therefore, real building data of a project located in Oman-Sohar was used, as shown in Figure 10. Different factors were used to evaluate the three systems including working time, use of database, security of data, automation of activities, reliability in keeping data safe, type of platform, and ease of updating data. For the sake of testing the performance in terms of working time, the building specification shown in Figure 10 was used. The computation of QS activities consisted of 130 pages of manual calculation. The filling and verification of each page needed about 21 h (1260 min) using paperwork, 3.5 h (210 min) using Excel work, and 0.5 h (30 min) using the proposed QS.
Therefore,
The time needed for paperwork was (130 × 1260 =) 163,800 min;
The time needed for excel work was (130 × 210 =) 27,300 min; and
The time needed for the proposed QS was (130 × 30 =) 3900 min.
Figure 17 shows the required working time for complementing the construction time of the three systems (paperwork, excel work, proposed QS), from which it was evident that the proposed system performed a large amount of computation, with less working time.
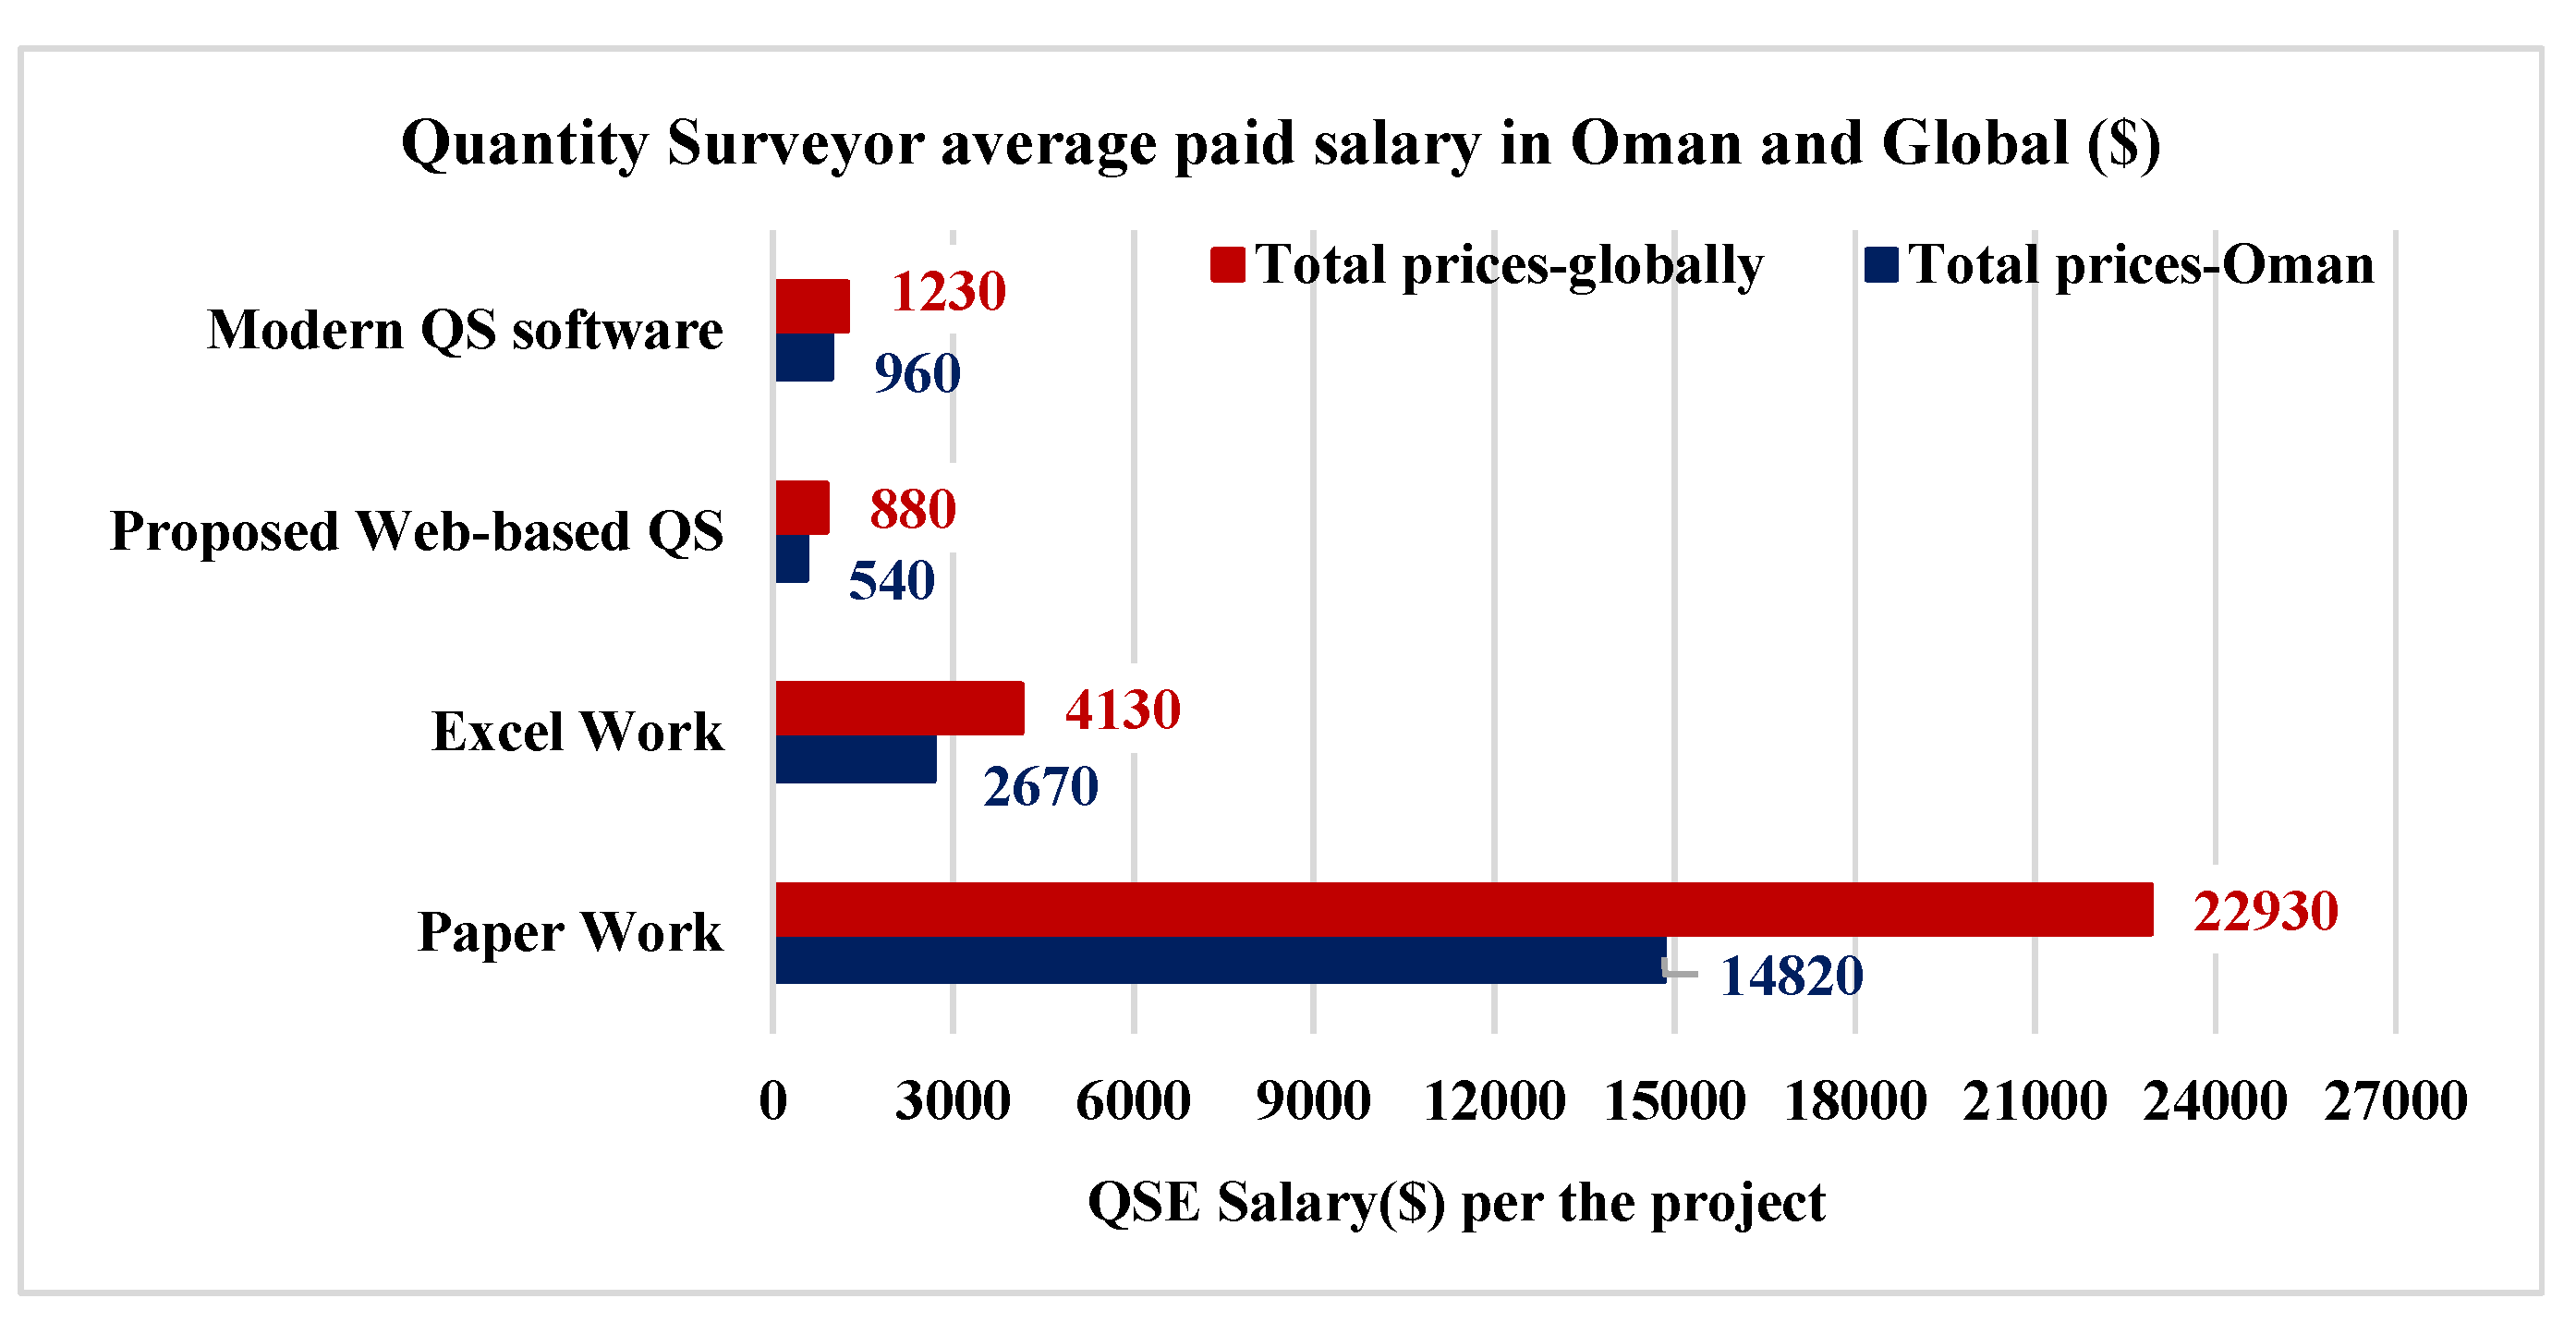
It is important to compare the precise calculation of the needed amount of work for the quantity surveyor experts (QSr). Table 6 presents the details related to the estimation of the amount of work for the QSr. The needed time for the project based on the different methods (paperwork, Excel work, proposed web-based QS, and the modern QS software) was 114, 19, 3, and 2, respectively. Furthermore, the average daily salary of a QSr in a small project in Oman was (50 OMR = 130$), and the average daily salary of a QSr globally was (79 OMR = 200$). Figure 18 shows the quantity surveyor’s average paid salary, both in Oman and globally, which indicates that the proposed framework required a lesser amount of paid salary.
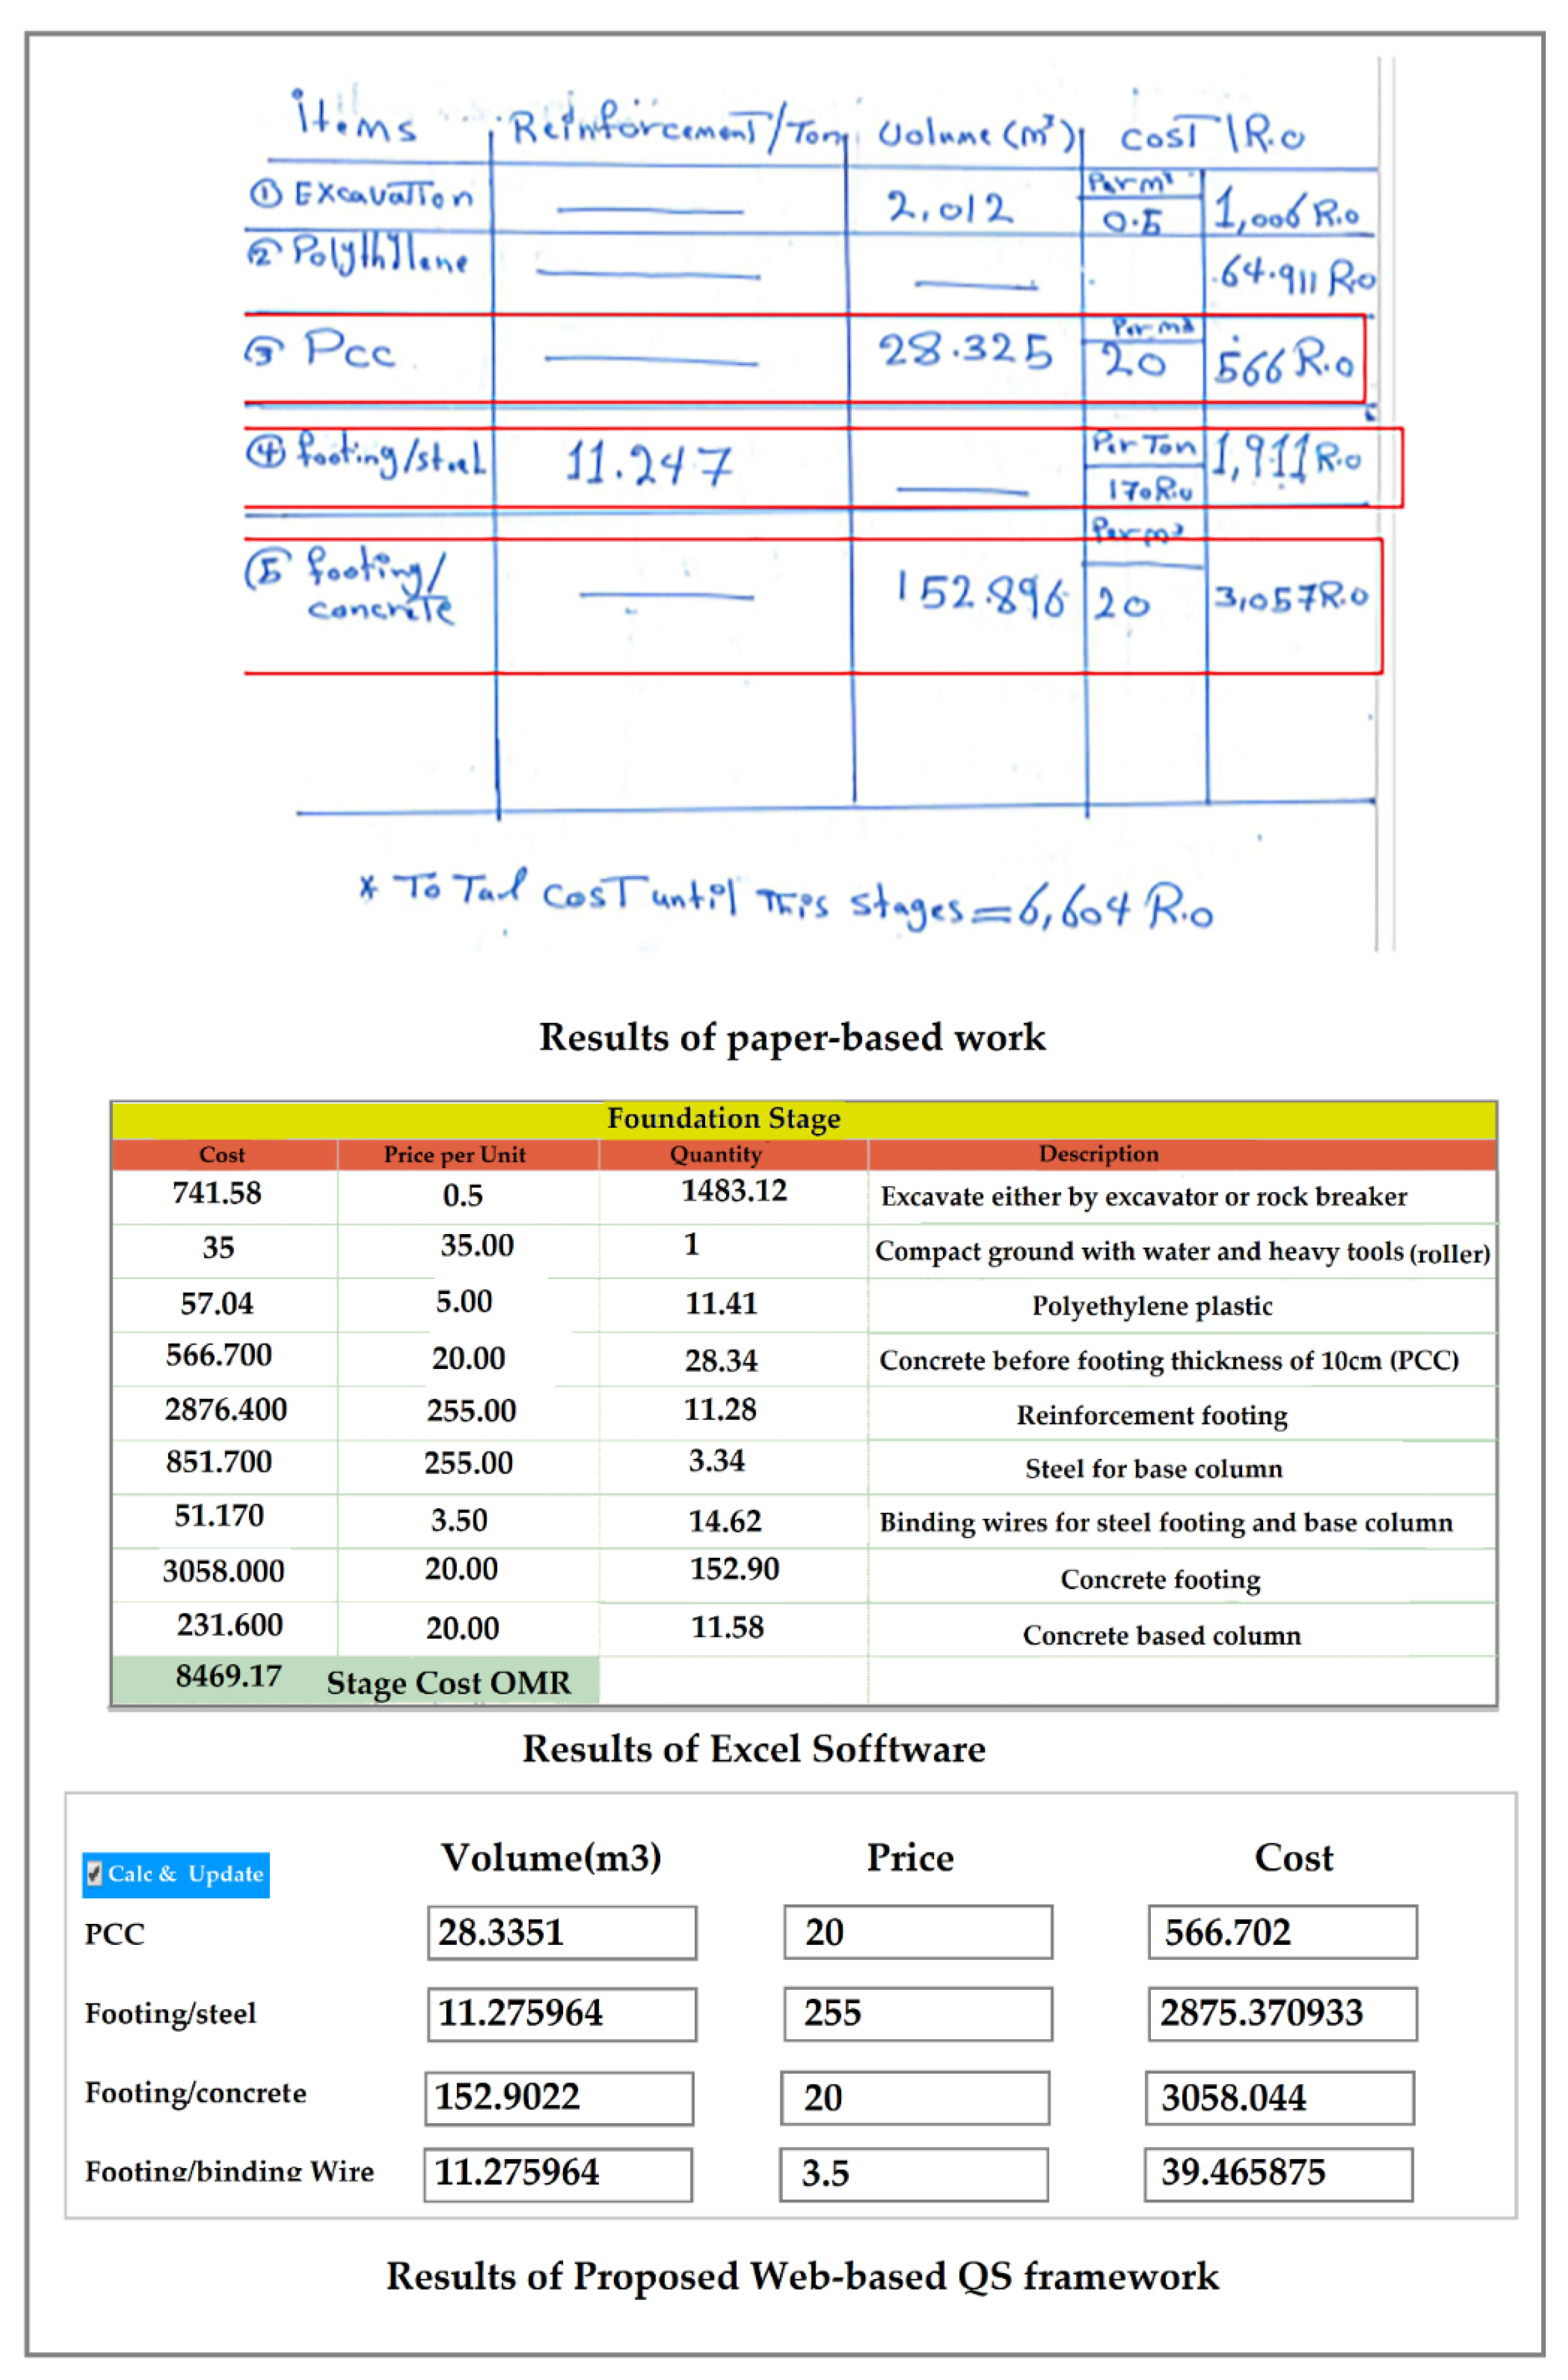
Figure 19 demonstrates an example of cost estimation calculation using different methods (paperwork, Excel work, and the proposed QS). The proposed QS framework estimates were fast, reliable, adaptable, and accurate, due to the fully automatic feeding of data. On the other hand, using the two other methods (paperwork or Excel work), human error might be introduced at any stage; for example, due to tiredness.
The use of a database management system helps to secure the project information from any unauthorized user. It also makes data access quick and easy, and available from anywhere. The proposed system could be accessed remotely, as it is a web-based framework, while access to data through traditional methods is limited to individual access from one location. There is also a high possibility of data damage in paper-based methods, due to circumstances such as rain or moisture. Therefore, the proposed system is more secure.
Table 7 presents the comparison results of four approaches (paperwork, Excel work, proposed QS, and the modern QS software), based on different factors. The results proved that the proposed web-based system has many advantages over the two traditional methods (Excel and paperwork), in terms of processing time, security, automation of work, error handling, and reporting. Moreover, if we compare the proposed framework with modern QS systems, it is cheaper and provides the same features.
7. Conclusions
The proposed web-based QS framework aims to automate quantity surveying duties and accurately estimate construction costs. The web-based architecture was implemented using ASP.NET and C# coding facilities for managing and calculating the costs of concrete construction project phases. Traditional QS methods, such as standard paperwork, are very time-consuming and only yield an approximate cost.
This work included both theoretical and practical aspects, which are needed to complete the project precisely, starting from system analysis and design, through to testing and validating the results.
The main contributions of the proposed web-based QS framework are:
- Automating the most-needed quantity surveying duties and accurately estimating the concrete construction cost of a project in a short time (less than 3 days). It also produces the needed report and information in different formats (i.e., Excel, pdf, or word).
- Implementing a web-based framework, such that the project manager can simultaneously monitor and obtain the required estimation prices in a short time, which is also constantly updated, depending on the new conditions.
- Deploying a database management system in the proposed framework, which has many advantages such as being able to search, manipulate, and archive data easily and implement more security, such that the data cannot be altered by any unauthorized person.
- The reliability and validity of the calculations, in comparison with other methods (i.e., human work using paper or Excel).
- Offering a user-friendly interface, which ensures that the work is completed in the chronological order of the phases by directing the QSr to complete the cost calculations step-by-step.
- Reading and importing the data of the project automatically from the construction maps, in order to lessen the errors if the user were to input the data manually. It can also automatically determine the project location using Google Maps and can easily guide the user to the location.
- All computation equations were validated and approved by experts and consultant companies. In addition, the results were tested on real project data and validated with the results of paperwork, Excel work, and by experts and consultant companies. The cost estimation was carried out in accordance with the reliable standard methods of the existing pricing system.
The goal of this work was to develop a web-based framework for automating the QS activities traditionally done by paperwork and to minimize the use of Excel work. Moreover, it solves the issues faced by QS engineers, minimizes the time required, and reduces the calculation errors when preparing the QS documents.
The limitation of this work was that more cost calculation methods need to be implemented, such as exporting cost calculation to take-off and bill of quantity software, and bridging the system tools directly with estimating software. This can be solved by support importing and exporting different file types. Furthermore, more cost calculation functions that help to fully automate the QS activities like cost calculations for other QS activities, such as finishing, electricity, plumbing, labor charge, and profit of the contractor, should be added. This can be solved by focusing on more integration between the function of the proposed system and the estimating software. For future work, deploying the framework to other platforms, such as cloud- or mobile-based platforms, would give more flexibility in the calculation of QS activities.
Author Contributions
The authors contributed equally in all sections of the article, like conceptualization, methodology, formal analysis, writing, reviewing, and editing. All authors have read and agreed to the published version of the manuscript.
Funding
This research received no external funding.
Conflicts of Interest
The authors declare no conflict of interest regarding the publication of this paper.
References
- Alrashed, I.; Kantamaneni, K. A 5D Building Information Model (BIM) for Potential Cost-Benefit Housing: A Case of Kingdom of Saudi Arabia (KSA). Infrastructures 2018, 3, 13. [Google Scholar] [CrossRef] [Green Version]
- Reizgevičius, M.; Ustinovičius, L.; Cibulskienė, D.; Kutut, V.; Nazarko, L. Promoting Sustainability through Investment in Building Information Modeling (BIM) Technologies: A Design Company Perspective. Sustainability 2018, 10, 600. [Google Scholar] [CrossRef] [Green Version]
- Adhikari, A.; Keung, C.W. The Impact of BIM on Quantity Surveyor’s Role: The Contractor Perspective. In Proceedings of the 11th International Cost Engineering Council (ICEC) World Congress and the 22nd Annual Pacific Association of Quantity Surveyors (PAQS) Conference (ICEC-PAQS Conference 2018), Sydney, Australia, 18–20 November 2018; pp. 345–361. [Google Scholar]
- Niknam, M.; Karshenas, S. A semantic web service approach to construction cost estimating. Comput. Civ. Eng. 2013, 2013, 484–491. [Google Scholar]
- Xu, S.; Liu, K.; Tang, L.C.; Li, W. A framework for integrating syntax, semantics and pragmatics for computer-aided professional practice: With application of costing in construction industry. Comput. Ind. 2016, 83, 28–45. [Google Scholar] [CrossRef]
- Aibinu, A.; Venkatesh, S. Status of BIM adoption and the BIM experience of cost consultants in Australia. J. Prof. Issues Eng. Educ. Pract. 2014, 140, 04013021. [Google Scholar] [CrossRef]
- Monteiro, A.; Martins, J.P. A survey on modeling guidelines for quantity webff-oriented BIM-based design. Autom. Constr. 2013, 35, 238–253. [Google Scholar] [CrossRef]
- Mirshokraei, M.; De Gaetani, C.I.; Migliaccio, F. A web-based BIM–AR quality management system for structural elements. Appl. Sci. 2019, 9, 3984. [Google Scholar] [CrossRef] [Green Version]
- Liu, Z.; Lu, Y.; Peh, L.C. A review and scientometric analysis of global Building Information Modeling (BIM) research in the Architecture, Engineering and Construction (AEC) industry. Buildings 2019, 9, 210. [Google Scholar] [CrossRef] [Green Version]
- Sinclair, N.; Artin, P.; Mulford, S. Construction Cost Data Workbook. In Proceedings of the Conference on the International Comparison Program, Washington, DC, USA, 11–14 March 2002; pp. 11–14. [Google Scholar]
- Martinez, M.; Scherer, R. eWork and eBusiness in Architecture, Engineering and Construction. In Proceedings of the ECPPM 2006: European Conference on Product and Process Modelling 2006 (ECPPM 2006), Valencia, Spain, 13–15 September 2006; CRC Press: Boca Raton, FL, USA, 2006. [Google Scholar]
- Ashcraft, H.W. Building information modeling: A framework for collaboration. Constr. Law 2008, 28, 5. [Google Scholar]
- Wu, S.; Greenwood, D.; Steel, G. Exploring the attributes of collaborative working in construction industry. Northumbr. Work. Pap. Ser. Interdisc. Stud. Built Virtual Environ. 2008, 1, 135–147. [Google Scholar]
- Gee, C. The Influence of Building Information Modelling on the Quantity Surveying Profession. Faculty of Engineering, Built Environment and Information Technology, Pretoria, South Africa, BSc (Hons) (Quantity Surveying), 2011. Available online: https://pdfs.semanticscholar.org/31b6/5ed8520611f1526d60ffcd0d147fde147711.pdf (accessed on 20 February 2020).
- Zima, K. Impact of information included in the BIM on preparation of Bill of Quantities. Procedia Eng. 2017, 208, 203–210. [Google Scholar] [CrossRef]
- Rabie, M.; Riad, H. Quantity Surveying Role in Construction Projects: A Comparison of Roles in Sweden and the UK. Available online: http://www.academia.edu/8906242/Quantity_surveying_role_in_Construction_Projects_-a_comparison_of_roles_in_Sweden_and_the_UK_Examensarbete_VT_2011 (accessed on 20 April 2020).
- Jiang, X. Developments in Cost Estimating and Scheduling in BIM Technology 2011. Civil Engineering Master’s Theses. Paper 20. Available online: http://hdl.handle.net/2047/d20002392 (accessed on 20 April 2020).
- Wijayakumar, M.; Jayasena, H.S. Automation of BIM Quantity Take-off to Suit QS’s Requirements. In Proceedings of the Second World Construction Symposium, Sri Lanka, Colombo, 14 June 2013; pp. 70–80. [Google Scholar]
- Marsh, D. Building Information Modelling (BIM) and the UK Quantity Surveying Organisation: A Framework for Value Creation. Ph.D. Thesis, Liverpool John Moores University, Liverpool, UK, 2017. [Google Scholar]
- Choo, S.; Park, H.; Kim, T.; Seo, J. Analysis of trends in Korean BIM research and technologies using text mining. Appl. Sci. 2019, 9, 4424. [Google Scholar] [CrossRef] [Green Version]
- Biancardo, S.A.; Capano, A.; Oliveira, S.G.; Tibaut, A. Integration of BIM and procedural modeling tools for road design. Infrastructures 2020, 5, 37. [Google Scholar] [CrossRef] [Green Version]
- Biolek, V.; Hanák, T. LCC estimation model: A construction material perspective. Buildings 2019, 9, 182. [Google Scholar] [CrossRef] [Green Version]
- Chudley, R.; Greeno, R. Building Construction Handbook, 10th ed.; Routledge Publishing Ltd.: Abingdon, UK, 2014; ISBN -13: 978–0415836388. [Google Scholar]
- Elhag, T.M.S.; Boussabaine, A.H.; Ballal, T.M.A. Critical determinants of construction tendering costs: Quantity surveyors’ standpoint. Int. J. Project Manag. 2005, 23, 538–545. [Google Scholar] [CrossRef]
- Wu, S.; Wood, G.; Ginige, K.; Jong, S.W. A technical review of BIM based cost estimating in UK quantity surveying practice, standards and tools. J. Inf. Technol. Constr. ITCon 2014, 19, 534–562. [Google Scholar]
- Ma, Z.; Liu, Z. Ontology-and freeware-based platform for rapid development of BIM applications with reasoning support. Autom. Constr. 2018, 90, 1–8. [Google Scholar] [CrossRef]
Figure 1.
Interactive relationship overview diagram of the proposed web-based quantity surveying (QS) system.
Figure 1.
Interactive relationship overview diagram of the proposed web-based quantity surveying (QS) system.

Figure 2.
The hierarchy of cost estimation of construction and installation.

Figure 3.
The phase interactions of the proposed web-based QS framework. FF—first floor, GF—ground floor, and PCC—plain cement concrete.
Figure 3.
The phase interactions of the proposed web-based QS framework. FF—first floor, GF—ground floor, and PCC—plain cement concrete.

Figure 4.
Class diagram of the proposed web-based QS framework.

Figure 5.
Sequence diagram of the proposed web-based QS framework.

Figure 6.
Flowchart of the proposed web-based QS framework.

Figure 7.
Project login webpage.

Figure 8.
New project registration webpage.

Figure 9.
Project review information webpage.

Figure 10.
The project specification (real test example).

Figure 11.
Excavation (a) and polyethylene (b) computation webpage.

Figure 12.
PCC calculation webpage.

Figure 13.
Block Information webpage.

Figure 14.
Ground floor steel and concrete calculation webpage.

Figure 15.
Sample QS report.

Figure 16.
Results of time needed based on paperwork, excel work, and the proposed QS framework.

Figure 17.
Necessary working time for the three systems (paperwork, excel work, proposed QS).

Figure 18.
Quantity surveyor average paid salary, in Oman and globally.

Figure 19.
An example of calculations using paperwork, Excel work, and the proposed QS framework.


Table 1.
Comparison of the selected software.
| Support Arabic Language | Digital Modelling | Extract to other Format | Report | Chart | License and Price | Business Size | Platform | |
|---|---|---|---|---|---|---|---|---|
| Autodesk Revit | No | 3D model | Excel sheet via API. | Yes | No | Free trial/ commercial | Large | Windows/Mac |
| Autodesk civil 3D | Yes | 3D model | MX data exported to a GENIO file | Yes | No | Free trial/ commercial | Large | Windows/Mac |
| AutoCAD | Yes | 2D (CAD) model | Bitmap (*.bmp), Block (*.dwg), Encapsulated PS | Yes | No | Free/commercial | Small/ Medium/Large | Windows/Mac |
| AutoCAD land development desktop | Yes | 2D and 3D | DXF Format, Ortho image (*.tif and*.txt) | No | No | Free/commercial | Medium/ Large | Windows |
| EstimatorXpress | Yes | 2D and 3D | Excel (.xls) | Yes | No | Free trail/commercial | Large | Windows/Mac |
| Easybuilder | No | 2D | Excel (.xls), SQL Query, *.gif | Yes | Yes | Free trail/commercial | Large | Windows |
| Planswift pro | Yes | 2D and 3D | Excel (.xls) | Yes | Yes | Free trail/commercial | Small/ Medium/Large | Cloud/Linux Windows/Mac/IOS |
Table 2.
Comparison of cost-estimation software.
| Costx | Cubicost | Vico Office | Proposed Web-Based | |
|---|---|---|---|---|
| Audience | Subcontractor companies, quantity surveyors, construction companies | Contractors, Home builder, QS consultant, Construction Companies | Construction Companies, Estimators, quantity surveyors | Construction Companies, Estimators, quantity surveyors |
| Company Size | Large and small | Large and small | Large and small | Medium and small |
| Open source Cost calculation | No | No | No | Yes |
| Cost Estimation Method | 3D Take-off | Bill of quantity take-off and cost estimation standards | Take-off | Cost Estimation standards |
| Number of work model at time. | Single model, and needs Cost XL | Cloud-based model SaaS | Single model | Single model, Multi-user |
| Model visualization | 2D, 3D | 2D, 3D | 2D, 3D, 4D | 2D |
Table 3.
Non-functional requirements.
| Non-Functional Requirements | |
|---|---|
| ● The system should improve the QS Service. ● The system should be available to all users from any location at any Date/Time. ● The system should provide better performance. ● The System should support new products and services. ● The system should provide stronger control. ● The system should reduce the human error, time, effort, and cost. | |
Table 4.
Functional Requirements
| Functional Requirements | |
|---|---|
| Concrete Calculation: | ● Store the General information of the project. ● Calculate concrete needed for the PCC. ● Calculate concrete needed for the footing. ● Calculate concrete needed for the column. ● Calculate concrete needed for plinth beam. ● Calculate concrete needed for Beam and Slab of the ground Floor. ● Calculate concrete needed for Beam and Slab of the First Floor. ● Calculate concrete needed for Beam and Slab of the second Floor. ● Calculate concrete needed for Beam and Slab of the Penthouse Floor. ● Calculate Total concrete needed for the whole project. |
| Cement Calculation: | ● Cement needed for blocks work. ● Cement needed for Columns (with the assumption that the columns will be done using site-mixed concrete). ● Cement needed for plaster work of all the walls in the project. ● Cement needed for tiles work (walls and floor). ● Total number of bags of cement needed for the whole project. |
| Blocks Calculation: | ● Calculate Hollow blocks needed for all the walls (40 × 20 cm). ● Calculated Full/Solid blocks needed for foundation walls (40 × 20 cm). |
| Steel Calculation: | ● Steel needed for the foundation, including the (footing + base_column + plinth_beam). ● Steel needed for ground floor (columns + beam + slab). ● Steel needed for first floor (columns + beam + slab). ● Steel needed for Penthouse floor (columns + beam + slab). ● Total Steel needed for the whole project. |
Table 5.
Proposed categories to differentiate the contribution in QS development among the related works.
Table 5.
Proposed categories to differentiate the contribution in QS development among the related works.
| Category 1 Traditional QS Services | Category 2 QS Professional Tasks | Category 3 Public Sector Services | Category 4 Tender Service | Category 5 Modeling/ Visualization |
|---|---|---|---|---|
| ● Cost estimating ● Cost planning ● Cost studies ● Measurement ● Valuation of construction work ● QS Preparation of final detailed BoQ | ● Provide procurement and contractual advice for the QS ● Monitoring Cost of QS (during project planning) | ● Provide project management service for government ● Time and budget ● Giving expert advice on contractual claims ● Measuring the cost of replacement of buildings damaged by hazard. | ● Recognize cost-risks in tender revenues ● Formulate tender reports ● Analyze total cost of the project | ● Using BIM to automate the Cost estimating ● Financial advisor ● Construction advisor ● generating square meter estimates ● generating cost estimates ● Using BIM Visualization: 3D, 4D, 5D |
Table 6.
Details related to the estimation of the amount of work for the QSr.
| Paper Work | Excel Work | Proposed Web-Based QS | Modern QS Software | |
|---|---|---|---|---|
| Salary (day)-Global | 200$ | 200$ | 200$ | 200$ |
| Salary (day)-Oman | 130$ | 130$ | 130$ | 130$ |
| Training fee | 0$ | 100$ | 100$ | 500$ |
| Annual rent fee | 0$ | 100$ | 50$ | 200$ |
| Time needed (day) | 114 | 19 | 3 | 2 |
| Total prices-Oman | 14820$ | 2670$ | 540$ | 960$ |
| Total prices-globally | 22930$ | 4130$ | 880$ | 1230$ |
Table 7.
Comparison results of paperwork, Excel work, modern QS software, and the proposed QS framework methods, based on different factors.
Table 7.
Comparison results of paperwork, Excel work, modern QS software, and the proposed QS framework methods, based on different factors.
| Method/ Factors | Paper Work | Excel Work | Proposed Web-Based QS | Modern QS Software |
|---|---|---|---|---|
| Process Time | Long time | Average | Short time | Short time |
| Use Database | No | No | Yes | Yes |
| Secure | No | Little | Yes | Yes |
| Automation of activities | No | Simi | Full automated | Full automated |
| Damage of data | Yes | Yes | No | No |
| Platform | Paper-based | Computer-based | Web-based | Web-based/Cloud-based/Mobile |
| Updating data | No | No | Yes | Yes |
| Reliability and validity | No | Low (human) | Yes | Yes |
| User Interface | N/A | difficult | Friendly | Friendly |
| Error in calculations | High (human) | Low (human) | Machine computation error | Machine computation error |
| Reports/archive | N/A | N/A | Yes | Yes |
| Price | High (expert human) | Low (one user) | Low (many users) | High (many users) |
| Staff training | No (expert human) | Low (expert human) | Low (expert human) | High (expert human) |
© 2020 by the authors. Licensee MDPI, Basel, Switzerland. This article is an open access article distributed under the terms and conditions of the Creative Commons Attribution (CC BY) license (http://creativecommons.org/licenses/by/4.0/).
Share and Cite
MDPI and ACS Style
Yousif, J.H.; N. Abdul Majeed, S.; J. I. Al Azzawi, F. Web-Based Architecture for Automating Quantity Surveying Construction Cost Calculation. Infrastructures 2020, 5, 45. https://0-doi-org.brum.beds.ac.uk/10.3390/infrastructures5060045
AMA Style
Yousif JH, N. Abdul Majeed S, J. I. Al Azzawi F. Web-Based Architecture for Automating Quantity Surveying Construction Cost Calculation. Infrastructures. 2020; 5(6):45. https://0-doi-org.brum.beds.ac.uk/10.3390/infrastructures5060045
Chicago/Turabian StyleYousif, Jabar H., Saif N. Abdul Majeed, and Fouad J. I. Al Azzawi. 2020. "Web-Based Architecture for Automating Quantity Surveying Construction Cost Calculation" Infrastructures 5, no. 6: 45. https://0-doi-org.brum.beds.ac.uk/10.3390/infrastructures5060045