
Chloride Induced Corrosion and Carbonation in 3D Printed Concrete


Department of Civil Engineering, Stellenbosch University, Stellenbosch 7600, South Africa
*
Author to whom correspondence should be addressed.
Infrastructures 2022, 7(1), 1; https://0-doi-org.brum.beds.ac.uk/10.3390/infrastructures7010001
Submission received: 1 December 2021
/
Revised: 17 December 2021
/
Accepted: 19 December 2021
/
Published: 21 December 2021
(This article belongs to the Special Issue Durability of Concrete Infrastructure)
Abstract
:The durability of reinforced concrete structures is dependent on the ability of the concrete cover to combat the ingress of chlorides and carbon dioxide in marine and urban environments. In recent years, interest in additive manufacturing, specifically referring to extrusion based three-dimensional concrete printing (3DCP), has been growing in the construction industry. Despite this being a promising technology that can save construction time, costs and resources, certain issues regarding the lack of fusion between subsequent printed layers have been brought to light. Research has shown that the lack of fusion at the interlayer regions can act as ingress pathways for corrosion contaminants, such as carbon dioxide and chloride aqueous solution, that can cause deterioration. This study investigates the interlayer bond strength (flexural strength) and durability performance of 3D printed concrete subjected to pass times between 0 and 30 min and compares the results to reference cast concrete of the same concrete mixture. The durability study includes Durability Index testing (oxygen permeability, water sorptivity and chloride conductivity index), accelerated concrete carbonation and chloride-induced corrosion. The results show that the cast samples outperform printed samples, yielding greater flexural strength and durability properties, and emphasize the importance of improving the 3DCP interfacial bond. Cast samples are shown to have randomly distributed, compact voids compared to the interconnected and elongated pores located at the interlayer regions of printed samples. In addition, printed samples yield lower interlayer bond strength and durability properties with an increase in pass time, which is attributed to surface moisture evaporation as well as the thixotropic behaviour of the concrete mixture. Good relationships between the mechanical strength and durability performance are also presented.
1. Introduction
Alexander and Beushausen [1] define the durability of a reinforced concrete (RC) structure as ‘The ability of a structure or component to withstand the design environment over the design life, without undue loss of serviceability or need for major repair’. The corrosion of the steel reinforcement is one of the major deterioration mechanisms that reduces structural service life.
The reinforcement of concrete structures is protected against corrosion by the concrete cover and the protective passive layer that forms owing to the alkaline nature of the concrete. RC structures in marine and urban environments are susceptible to chloride- and carbonation-induced corrosion. In marine environments, RC structures are exposed to chlorides, which penetrate the concrete cover, lower the pH of the concrete by forming hydrogen chloride (HCl) and destroy the protective passive layer [2]. Chloride-induced corrosion (CIC) is influenced by various factors. RC structures exposed to the tidal, splash and spray zone in coastal environments, in combination with abrasion, is much more prone to CIC compared to structures exposed to airborne salts with no direct contact with water [3]. Scott and Alexander [4] and Otieno et al. [5] reported that the binder type and cover depth influenced CIC. Both studies reported that an increased in cover depth from 20 to 40 mm resulted in a decrease in the corrosion rate. In addition, both studies also showed that the partial replacement of ordinary Portland cement with supplementary cementitious materials (SCM) such as fly ash, silica fume and ground granulated blast-furnace slag resulted in lower corrosion rates and better concrete quality attributed to the microstructure refinement and chloride binding ability of the SCM. RC Structures with lower w/b ratios are more susceptible to CIC [5,6]. The presence of cracks decreases the effect of the concrete cover and act as ingress pathways, leading to premature corrosion initiation and high corrosion rates [4,6,7,8]. Care should be taken in the durability design of infrastructure to limit chloride permeability [9].
A similar mechanism occurs in urban environments with high levels of carbon dioxide (CO2). The CO2 penetrates the concrete cover, reduces the hydroxide ion concentration by producing calcium carbonate, lowers the pH and destroys the protective passive layer. Once the passive layer is destroyed, the reinforcement is susceptible to corrosion if there is sufficient oxygen and moisture present [2]. Factors in the exposure environment, such as relative humidity (RH) and temperature, influence the concrete carbonation rate. The carbonation rate is at a maximum when the RH is between 50 and 75% [2], and an increase in temperature results in an increase in carbonation depth [10,11]. The cover quality heavily influences the concrete’s carbonation resistance. Lower cover quality with regards to higher w/b ratios [12] and air curing, as supposed to water curing [13], yields larger carbonation depths. The use of SCM is also known to reduce concrete carbonation resistance [12]. SCM silica content reacts with calcium hydroxide and water to form calcium silica hydrate. The consumption of calcium hydroxide reduces the alkalinity of the concrete making it more suspectable to carbonation [2]. The presence of cracks means they act as CO2 ingress pathways and reduces the concrete’s carbonation resistance [14].
Due to the importance of infrastructure reliability and longevity, the monitoring of the deterioration of actual infrastructure has been proposed, e.g., [15,16], to enable timeous repair for safety and longevity.
With the rise of additive manufacturing, specifically referring to 3DCP, more structures will be printed instead of using the traditional casting method. These 3DCP structures will be exposed to the same marine and urban environments as conventional cast structures and should be able to withstand contaminant exposure for a sufficient service life. Durability issues related to the intermixing capabilities of consecutive printed layers can result in the formation of cold joints, thus acting as ingress pathways for contaminants (chlorides, water and CO2) [17]. The pores in cast concrete are randomly disturbed whereas the voids at the interlayer region (IR) of printed concrete are elongated and interconnected, resulting in a more permeable microstructure, leaving the element more susceptible to durability issues [18,19,20].
A comprehensive review on the lack of fusion (LOF) in 3DCP by Kruger and van Zijl [19] investigated several publications regarding the mechanical performance and microstructure for 3DCP elements. The review reported four mechanisms responsible for LOF, namely insufficient surface moisture, air entrapment, thixotropic behavior and surface roughness. The most prominent reported mechanism was surface moisture evaporation, which is generally associated with a long pass time. The pass time refers to the duration of time between the deposition of subsequent printed layers. Kruger et al. [20] investigated the porosity of extrusion-based 3DCP, and µ-CT scans showed that an increase in pass time resulted in a distinctive IR of greater porosity. Furthermore, the increased interconnectivity of pores in the IR is of significance when it comes to the ingress of substances that may cause deterioration.
Only a few investigations on the durability and transport properties of 3DCP elements have been reported. Mohan et al. [21] hypothesized, based on the porous and permeable characteristics of the IR, that chlorides penetrate the IR via capillary sorption followed by diffusion through the bulk layers. Bran Anleu [22] conduced chloride ingress studies via capillary sorption and found that the chloride ingress was deeper at the IR for longer pass times. Van der Putten et al. [23] also reported greater chloride ingress at the IR for longer pass times and that chloride penetration into reference cast samples was lower and more uniform than in printed samples, owing to increased porosity at the IR. To date, only Wang et al. [24] reported on the carbonation of 3DCP elements, but only the carbonation depth at the layer center was measured. No data on the carbonation depths at the IR was reported. Bran Anleu [22] found that the curing procedure and pass time significantly influenced moisture penetration depth into 3D printed samples. No significant difference in moisture profiles for specimens prepared with 2 min and 24 h pass times, which were subsequently wet cured, was noticed. However, a sharp increase in moisture penetration depth was reported at the IR of 3DCP that was produced with a 24 h pass time and that was dry cured. Van der Putten et al. [25] reported a uniform water ingress profile in 3D printed samples with a small pass time (15 s).
The aim of this study is to characterize the durability performance, specifically regarding concrete carbonation and chloride-induced corrosion, of the 3DCP concrete mix design used at Stellenbosch University. 3DCP durability performance characterization is crucial in order to predict the service life of 3DCP structures. The interfaces in the layered structure of 3DCP are identified as regions in which the ingress of deleterious substances is potentially quickened, leading to the deterioration processes of chloride- and carbonation-induced corrosion of embedded steel. Interfacial bond is known to depend on the pass time, i.e., the time laps between successive layers are printed [19]. In this paper, the durability performance is characterized and a relationship between pass time, durability performance and the mechanical performance is explored.
2. Sample Preparation and Methodology
2.1. Experimental Parameters and Sample Specifications
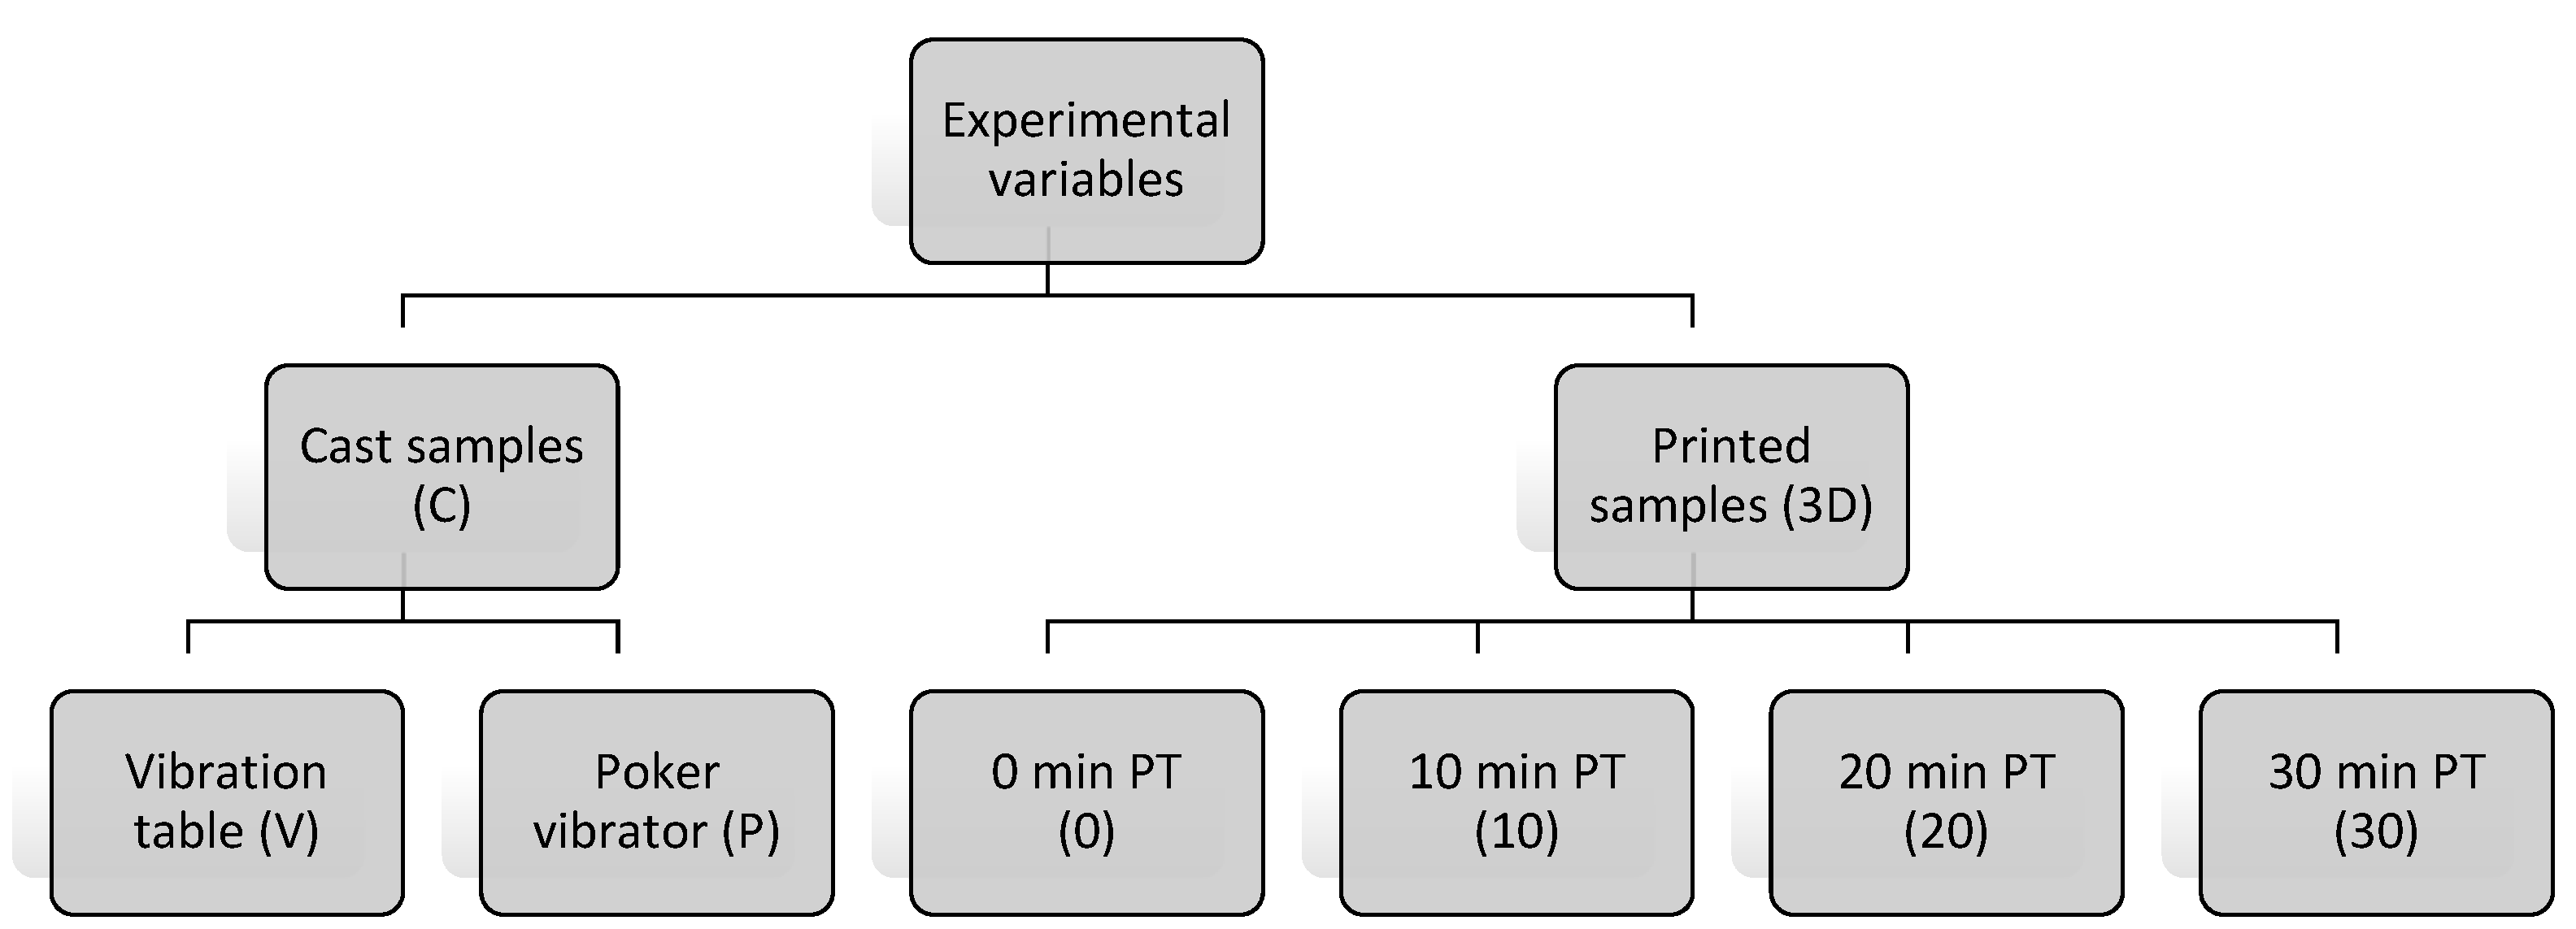
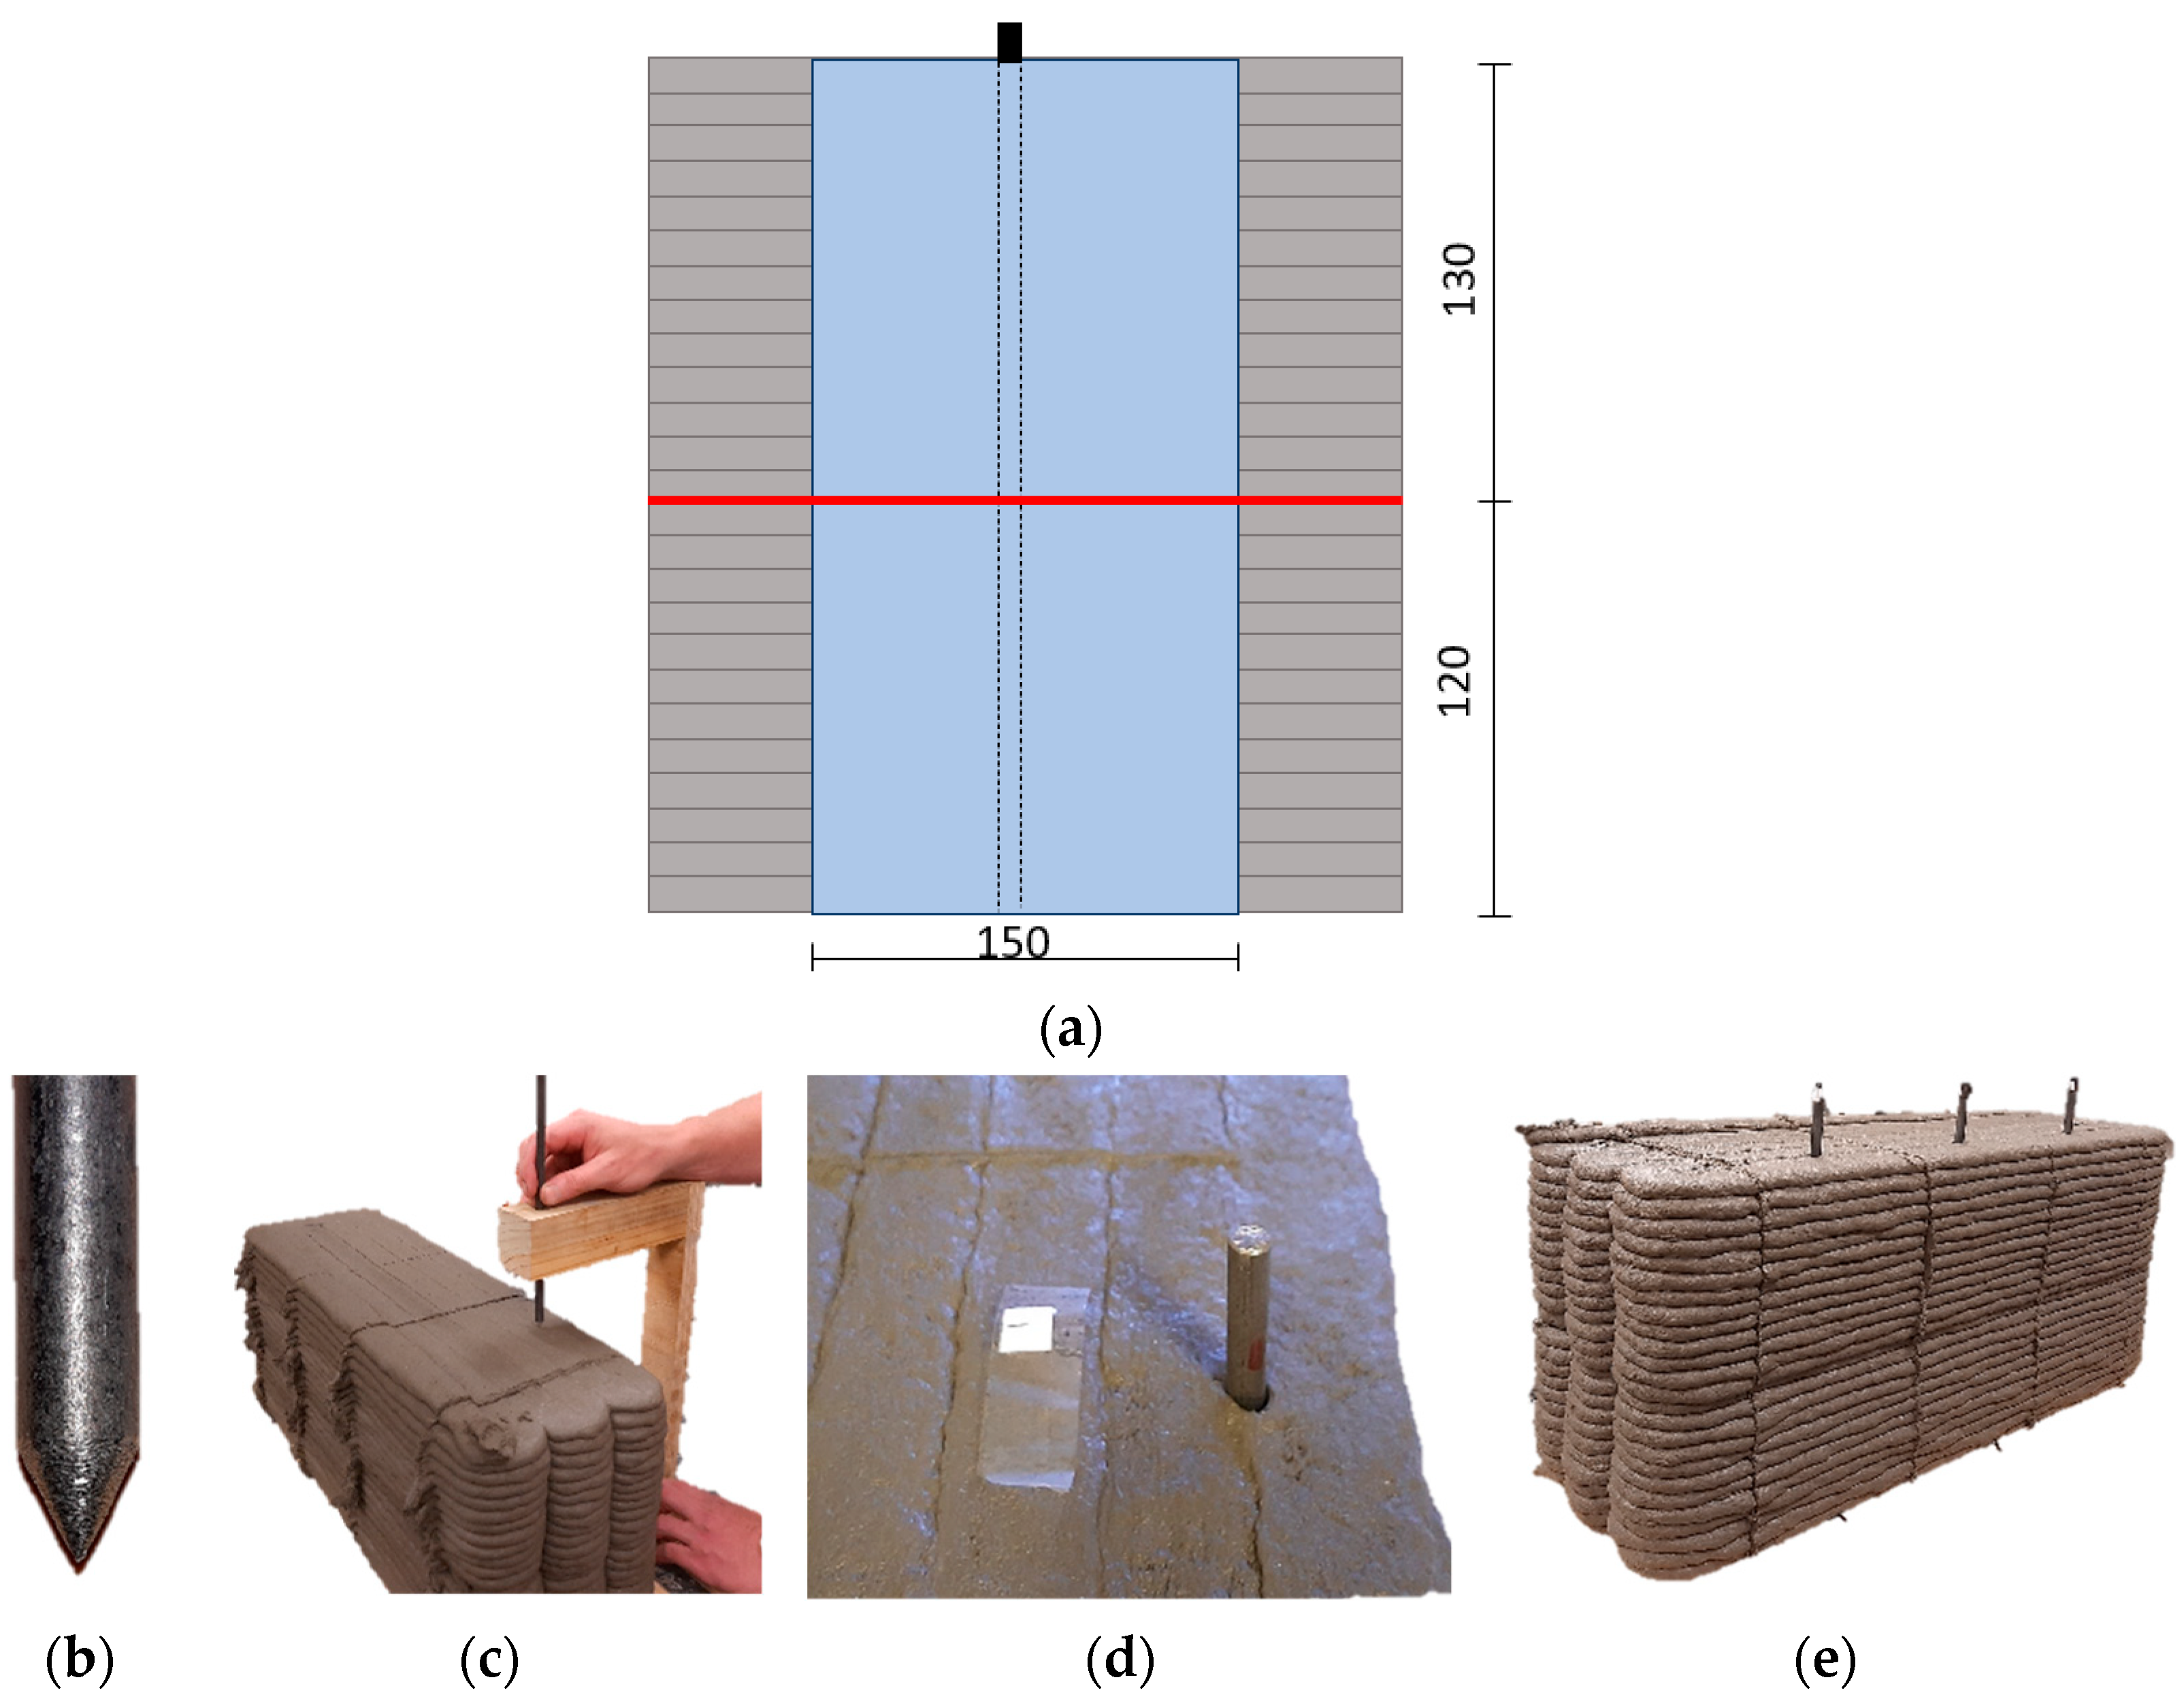
This study evaluates the performance of cast and printed samples. For the cast samples, two compaction methods are considered, namely table vibration and poker vibration. For printed samples, four pass times 0, 10, 20 and 30 min are investigated. The IR where the varied pass time is introduced is referred to as the critical layer (CL). Each printed sample has one CL present at its center. Figure 1 presents the experimental variables with the corresponding nomenclature in brackets. For example, 3D-20 corresponds to a printed sample (3D) with a 20 min pass time (20) at the CL and C-V corresponds to a cast sample (C) compacted with the vibration table (V). Table 1 provides a complete summary of the tests performed on the specific experimental variables, the number of samples tested as well as the sample sizes.
2.2. Materials and Mix Design
Table 2 presents the materials and mix design used in this study. The mix was optimized for appropriate 3D printability, with rheological parameters of the bi-linear thixotropy model proposed by Kruger et al. [26] characterized and listed in Table 3. A modified slump cone flow test [27,28] is customary for the quality control of printability at Stellenbosch University and presented a slump flow spread value of 150 mm.
2.3. Printing Parameters and Procedures
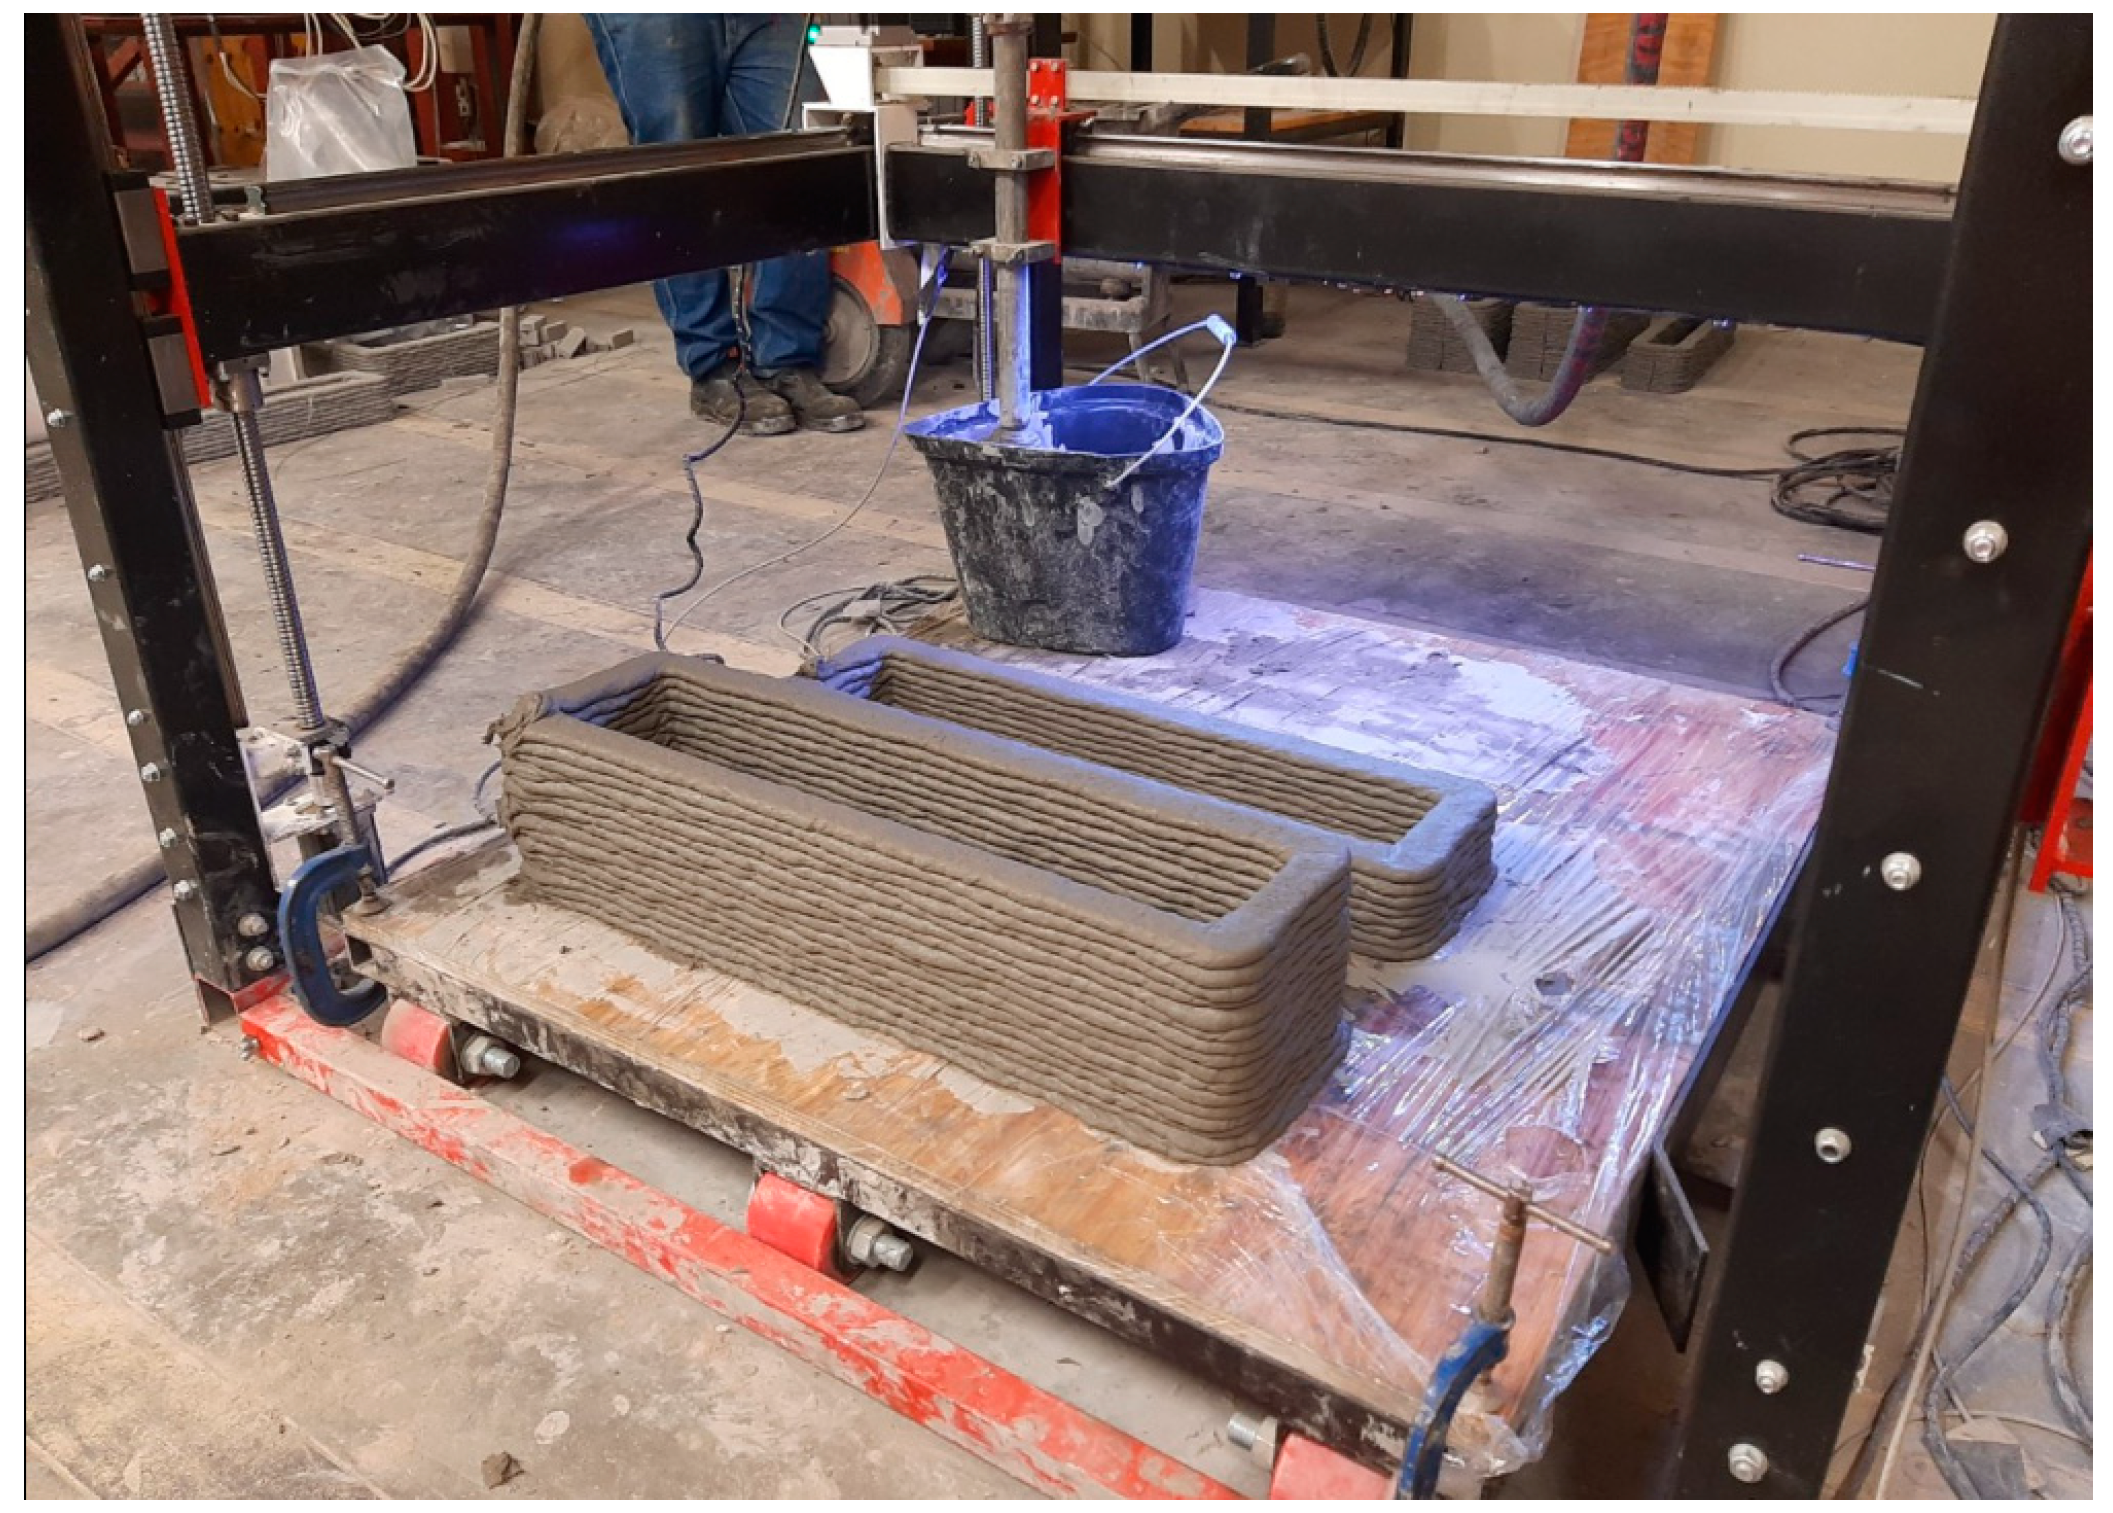
An industrial-grade gantry printer with a build volume of 1 m3 (shown in Figure 2) was used to produce 3DCP specimens. The printer is equipped with a 25 mm circular nozzle and operates in three translational degrees of freedom.
The printer was connected to a locally produced mortar pump, which was filled with concrete after mixing is completed in a 50 L pan mixer. The printer was primed with the concrete mixture, and printing commenced once a continuous filament, with no encapsulated air or tears was extruded at the nozzle. The printer parameters selected were a printing speed of 60 mm/s, a 10 mm layer height, and variable pumping frequency set to match the printer speed and concrete consistency in order to avoid under or over extrusion. These printer parameters produced a layer width of about 30 mm for all specimens except for samples where 40 mm was required. In the latter case, an increased pumping frequency successfully produced the required thickness while maintaining the 60 mm/s nozzle speed and 10 mm layer thickness. All the prints had a print path equal to or less than 3600 mm, which corresponds to a maximum pass time of 60 s. The CL was a single layer in each specimen which was produced by printing 50% of the sample height, whereafter the print was interrupted with the specific pass time (0, 10, 20, 30 min). Note that the 0 min pass time was produced by the standard continuous printing at the set printer parameters, which effectively has a 1-min pass time. To prevent variation in printed material quality, the concrete was continuously pumped during the pass time, extruded into a bucked and recycled. Once the pass time had elapsed, the top 50% of the sample was printed. During the entire printing procedure, a poker vibrator was used to assist with the pump feed into the printer pipe to re-agitate the concrete before extrusion.
2.4. Curing Procedure
The gantry printer was in a climate-controlled room set at a temperature of 23 ± 3 °C and RH of 65 ± 5%. After printing was completed, the samples were removed from the printer bed, but kept in this room for 28 days. The cast samples were also placed in this climate room directly after casting, demolded 1 day later and left in this climate for 28 days.
2.5. Flexural Strength
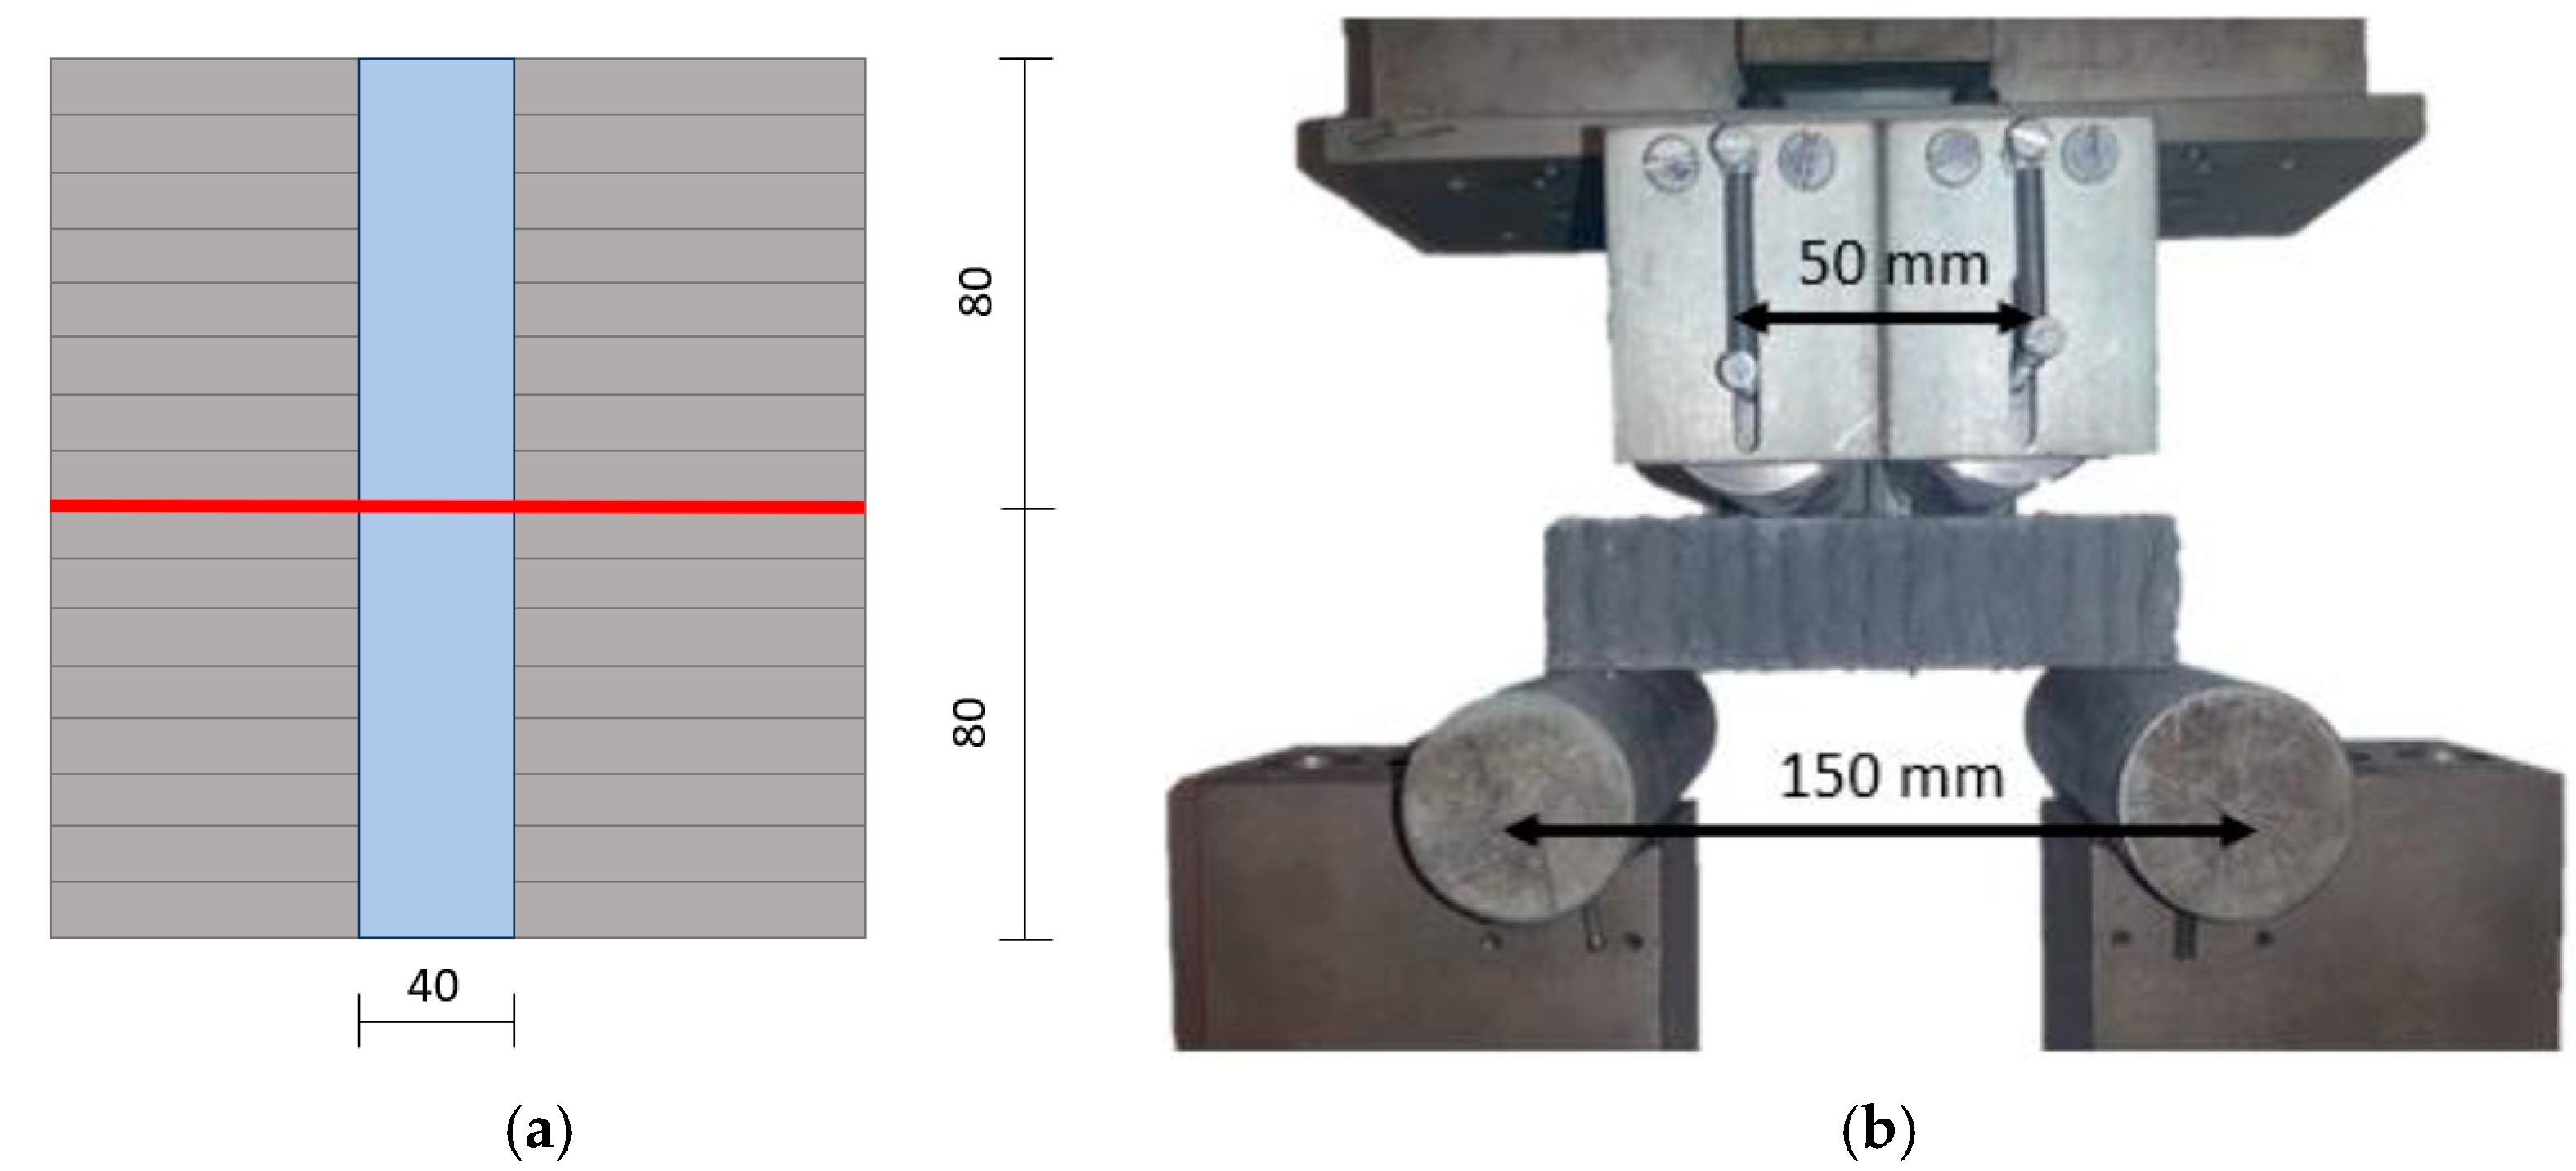
Four-point bending tests were performed on the cast and printed samples to determine the printed interlayer bond strength (IBS) in comparison with the cast flexural strength. The printed flexural samples were saw cut from one large printed specimen per pass time. After curing, smaller samples were saw cut from the large printed specimen and tested on the same day (Figure 3a). The cast samples were prepared by extruding the concrete through the printer pipe, into BS EN 196-1 [29] steel molds, followed by additional compaction with the vibration table as a reference. The load was applied, using displacement control at a rate of 0.25 mm/s, parallel to the IR (orientation O-III) and perpendicular to the casting direction for the printed and cast samples, respectively. The test was performed using a Zwick 250 Materials Testing Machine. The test setup is shown in Figure 3b.
2.6. Durability Index Tests
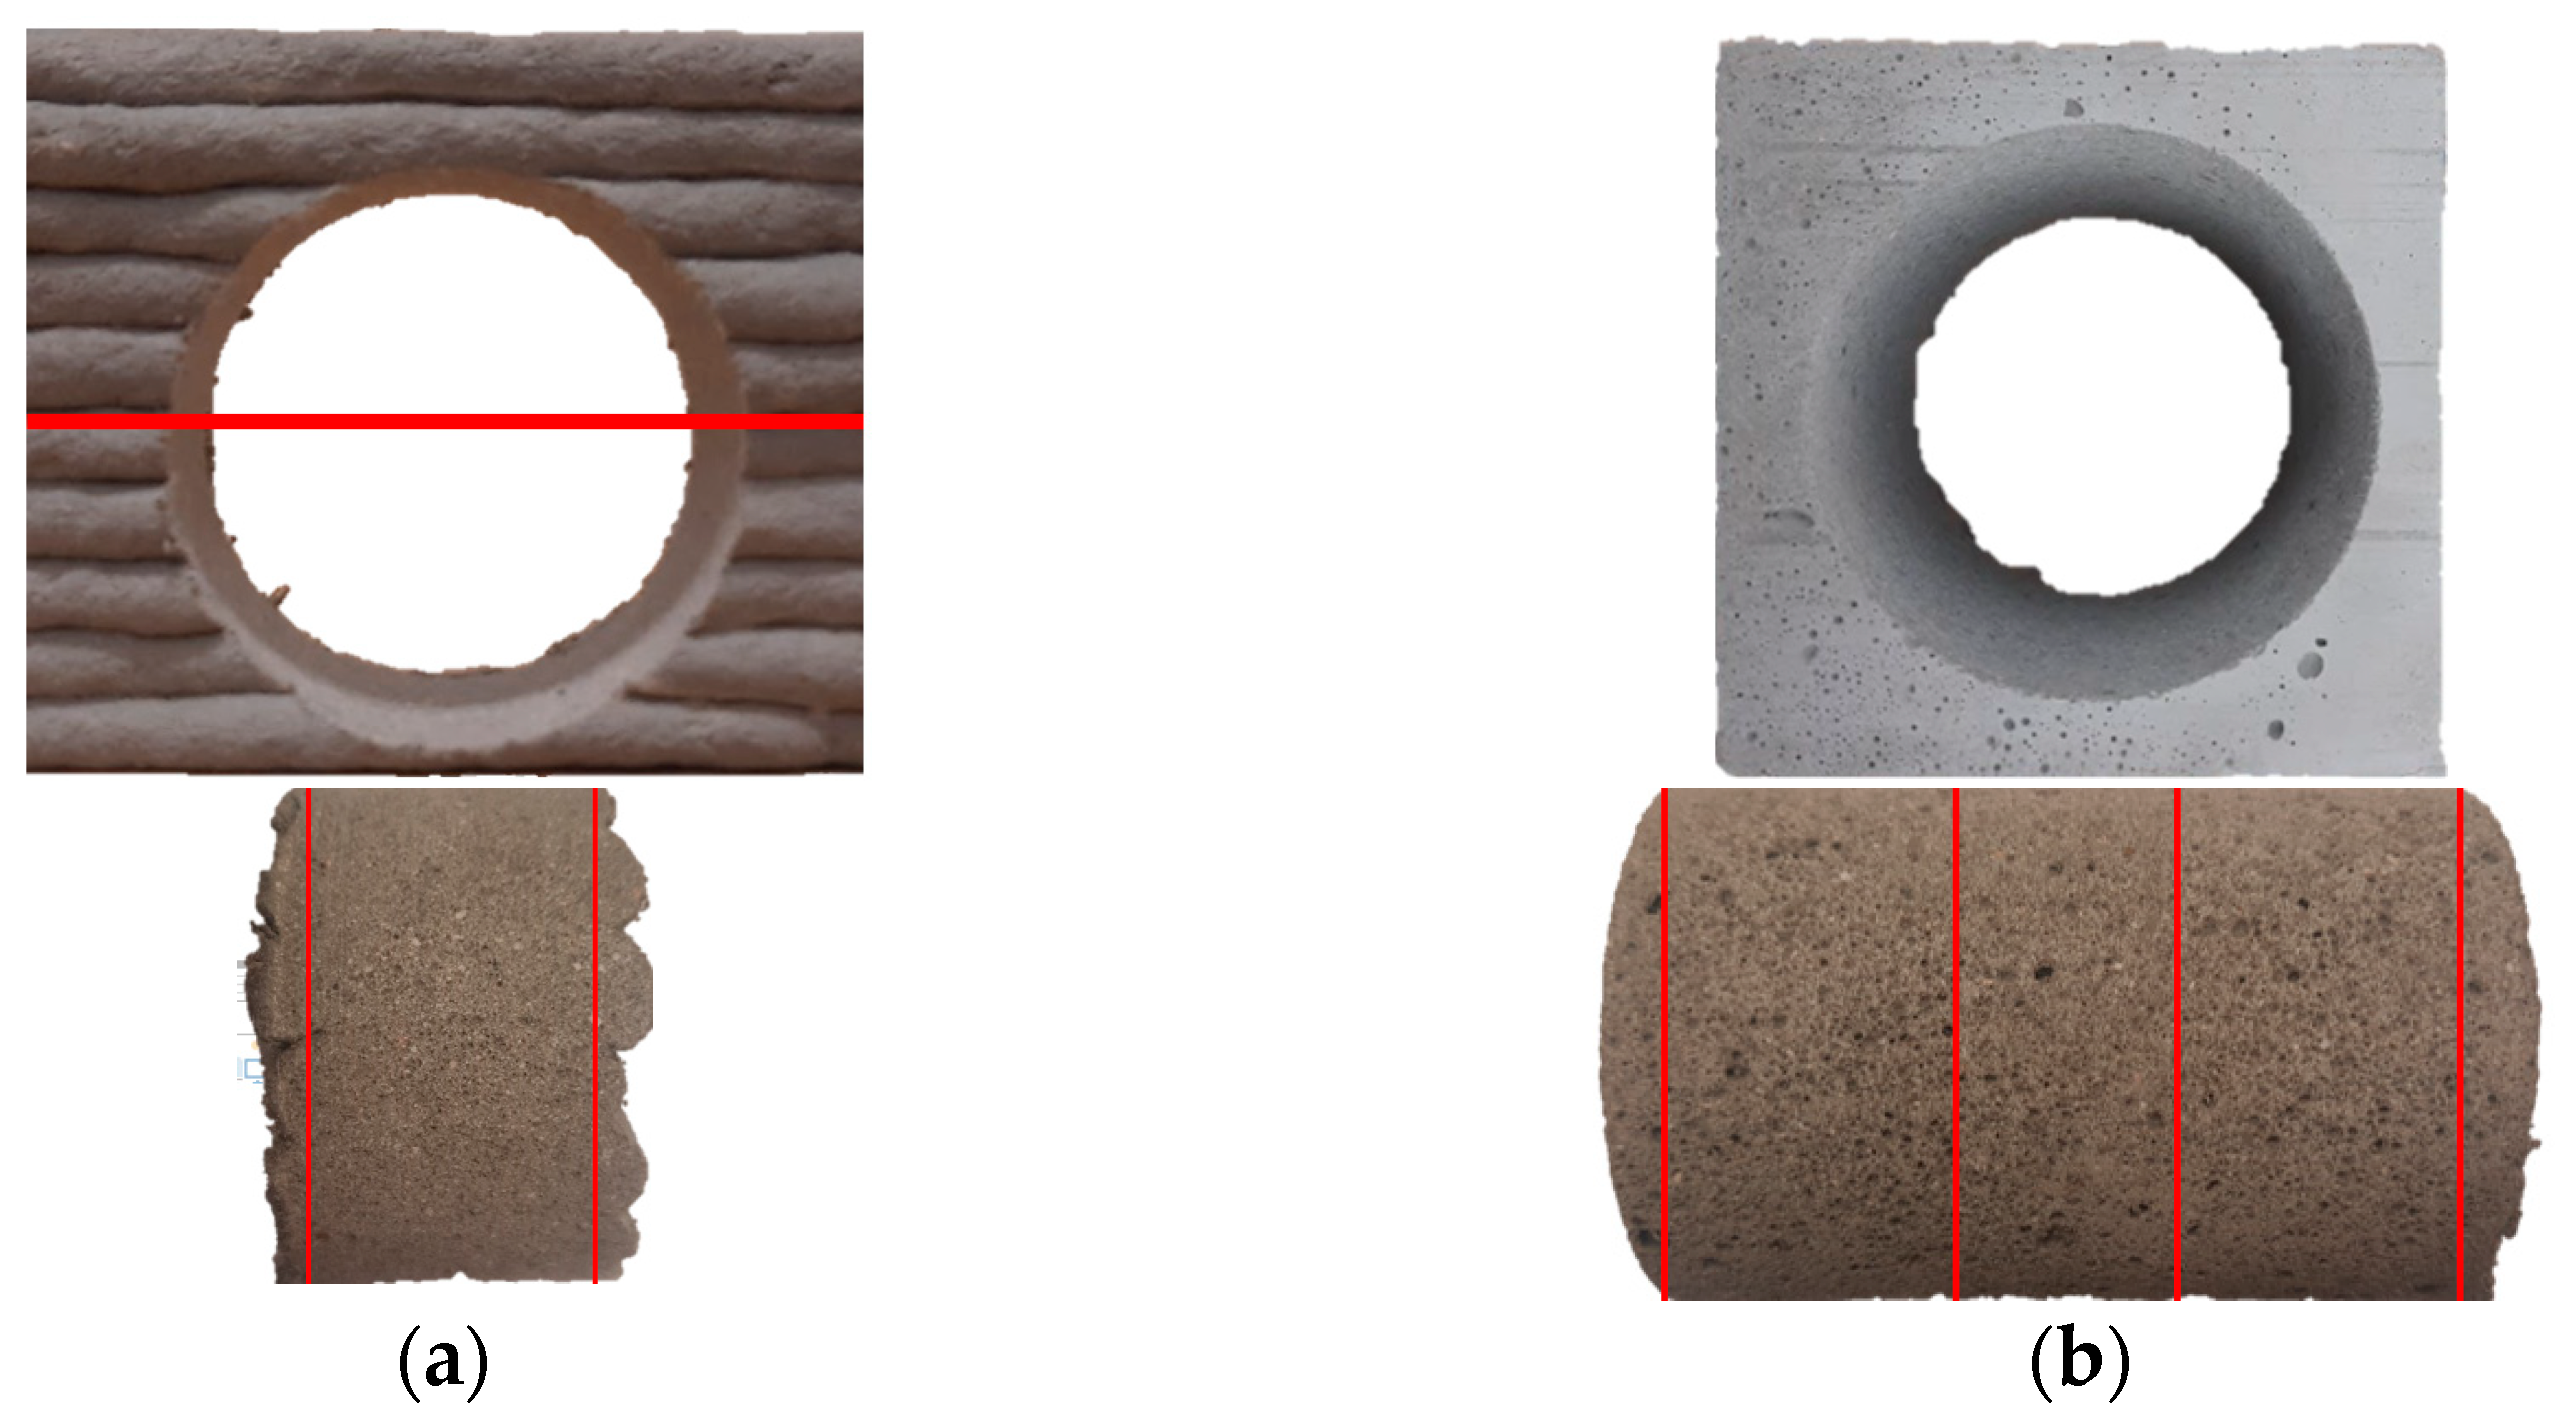
DI tests were performed on all the experimental variables. After curing, circular disks were extracted using a water core drill and cut to the desired thickness using a diamond blade saw. The printed disks were extracted from one large, printed specimen per pass time, as shown in Figure 4a. Care was taken when extracting the cores from the printed samples and the samples were cored perpendicular to the printing direction. The outer 5 mm of the cores were cut off to extract the disk, as indicated by the red lines in Figure 4a. The C-V and C-P disks were extracted from cubes (100 × 100 × 100 mm) and beams (100 × 100 × 600 mm), respectively (Figure 4b). The cores were extracted perpendicular to the casting direction. The outer 5 mm and inner 20 mm of the cores was removed to extract the disks from the core. The cutting lines are indicated in red in Figure 4b. The disks were then pre-conditioned in an oven at a constant temperature of 50 °C for 7 days, after which the three DI tests were performed. More detail on the conditioning and testing procedure can be found in the DI testing procedure manual [30]. The manual specifies that the samples should be placed in a desiccator for 2 to 4 h once they are removed from the oven and tested within 30 min once removed from the desiccator. All the samples were placed in a sealed desiccator after seven days of oven drying to maintain the moisture content of the sample. The desiccator was stored in the climate-controlled room (Section 2.4) and the samples were removed at the time of testing. The manual also states that the samples should soak in calcium hydroxide solution (Ca(OH)2) and sodium chloride (NaCl) solution for 18 ± 1 h after the vacuum is released. All the deviations in the testing procedure are listed in Table 4.
2.7. Accelerated Concrete Carbonation
Cubes were used for the ACC test. For the printed samples, cubes were extracted from one large printed specimen per pass time (Figure 5a,b). The cubes were extracted by cutting with a metal sheet 40 min after the completion of the 3D printing. The cast samples consisted of cast cubes (Figure 5c). The weight of the printed and cast samples during curing was monitored weekly. The average weight loss after four weeks was 0.0339% and 0.0296% per week for the cast and printed samples, respectively. After curing, the samples were coated with Sikadur 32N epoxy on four of the six sides for one-dimensional carbonation ingress. For the cast samples, carbonation was allowed perpendicular to the casting direction and for the printed samples the undulating horizontal layers were left uncoated for carbonation exposure (Figure 5c,b). The coated samples were placed in the carbonation chamber for 14 days of preconditioning at 65 ± 5% RH and 23 ± 3 °C, after which the CO2 was introduced.
ACC tests were performed on samples over a 12-week period. The testing conditions of the carbonation chamber were a temperature of 23 ± 2 °C, 65 ± 5% RH and CO2 concentration of 2 ± 0.1%.
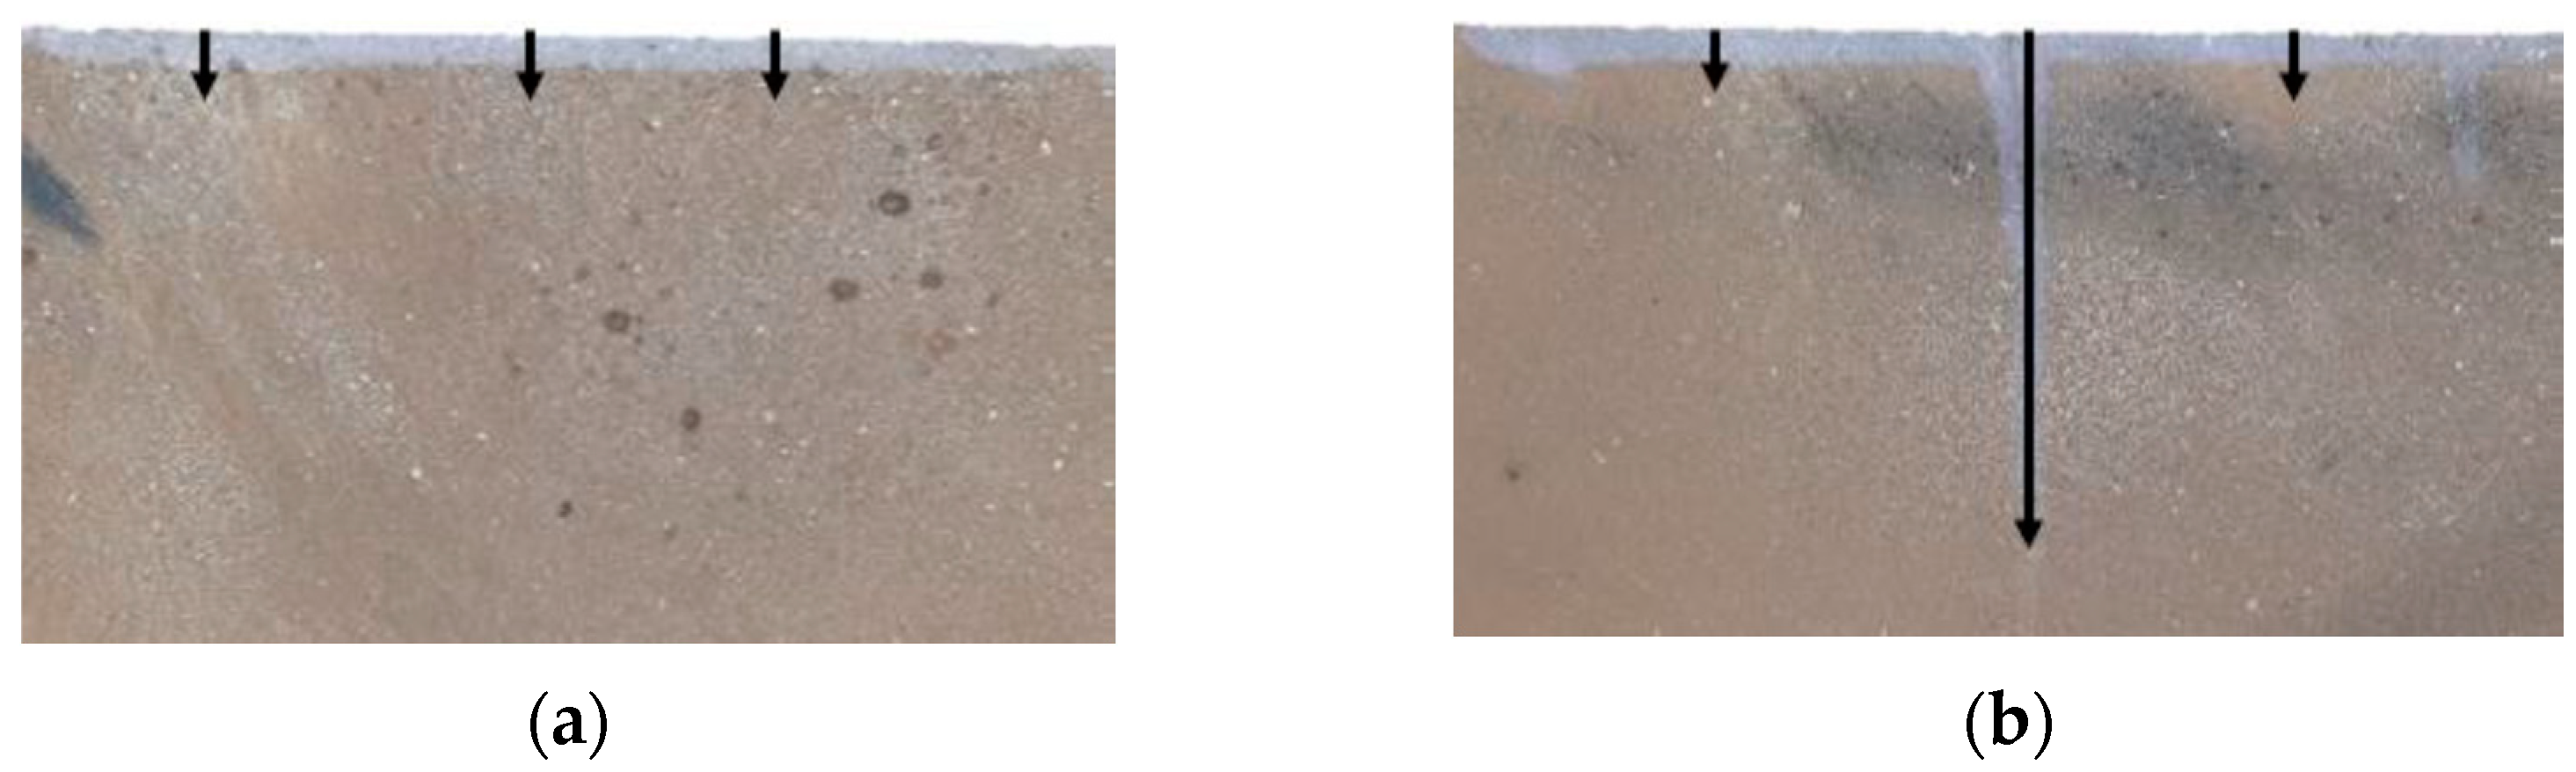
The carbonation depth inspections were conducted after 3, 6, 9 and 12 weeks of CO2 exposure. The samples were saw cut and sprayed with a solution of 1 g of phenolphthalein dissolved in 70 mL of ethanol and 30 mL of de-ionised water, as specified in BS 1881-210 [31]. Once the surface was dried, the carbonation depth was measured with a vernier calliper with 0.01 mm resolution—see Figure 6. The portion of the concrete with a pH > 9.0 (area not carbonated) results in the solution turning violet.
2.8. Chloride-Induced Corrosion
Beams were used for the CIC testing. Smaller beams were extracted from one large printed specimen per pass time. The beams were extracted by cutting with a metal sheet 40 min after the completion of the 3D printing. After cutting, the 8 mm reinforcement (R8) was inserted perpendicular to the IR using a wooden jig to guide its path. The reinforcement tip was sharpened to ease insertion—see Figure 7. Molds were used to prepare the cast beams.
After curing in the same climate room as all the other specimens, the uneven surface of the printed samples was saw cut to provide a uniform cover of 20 mm and an even surface for corrosion monitoring. The cast samples were grinded to provide a smooth surface, leaving a 20 mm steel cover.
The beams were fitted with a ponding basin (150 × 160 × 30 mm) on the 20 mm cover face in order to simulate CIC by utilizing a cyclic wetting and drying ponding cycle. A ponding cycle of two weeks (three days of wetting, followed by 11 days of drying) with a 5% sodium chloride (NaCl) aqueous solution was selected to simulate very severe chloride conditions in the marine tidal and splash zones [8,32]. Chloride ponding started at an age of 42 days and the test specimens were kept in the climate-controlled room for a test period of 18 weeks. Corrosion monitoring was performed using the GECOR-10 Sensor A, which is a potentiostat-galvanostat system that uses the galvanostatic pulse technique to measure corrosion intensity (Icorr), corrosion potential (Ecorr) and ohmic resistance (Rohm). Measurements were taken one day after the pond was drained (day four of the ponding cycle), and then seven days (day 11 of the ponding cycle) thereafter.
After the CCI testing completion, the beams were saw cut in half to inspect the chloride ingress. The freshly cut surface was sprayed with a 0.1 mole silver nitrate (AgNO3) solution, as specified in NT Build 443 [33]. The Ag-ions react with the free chlorides resulting in a precipitation of a grey/white colour. The chloride penetration depth was recorded using a vernier caliper with a 0.01 mm resolution (Figure 8). The region that has a dark color is “free” from chlorides. The rebar was also removed and inspected for corrosion.
3. Results
3.1. Flexural Strength
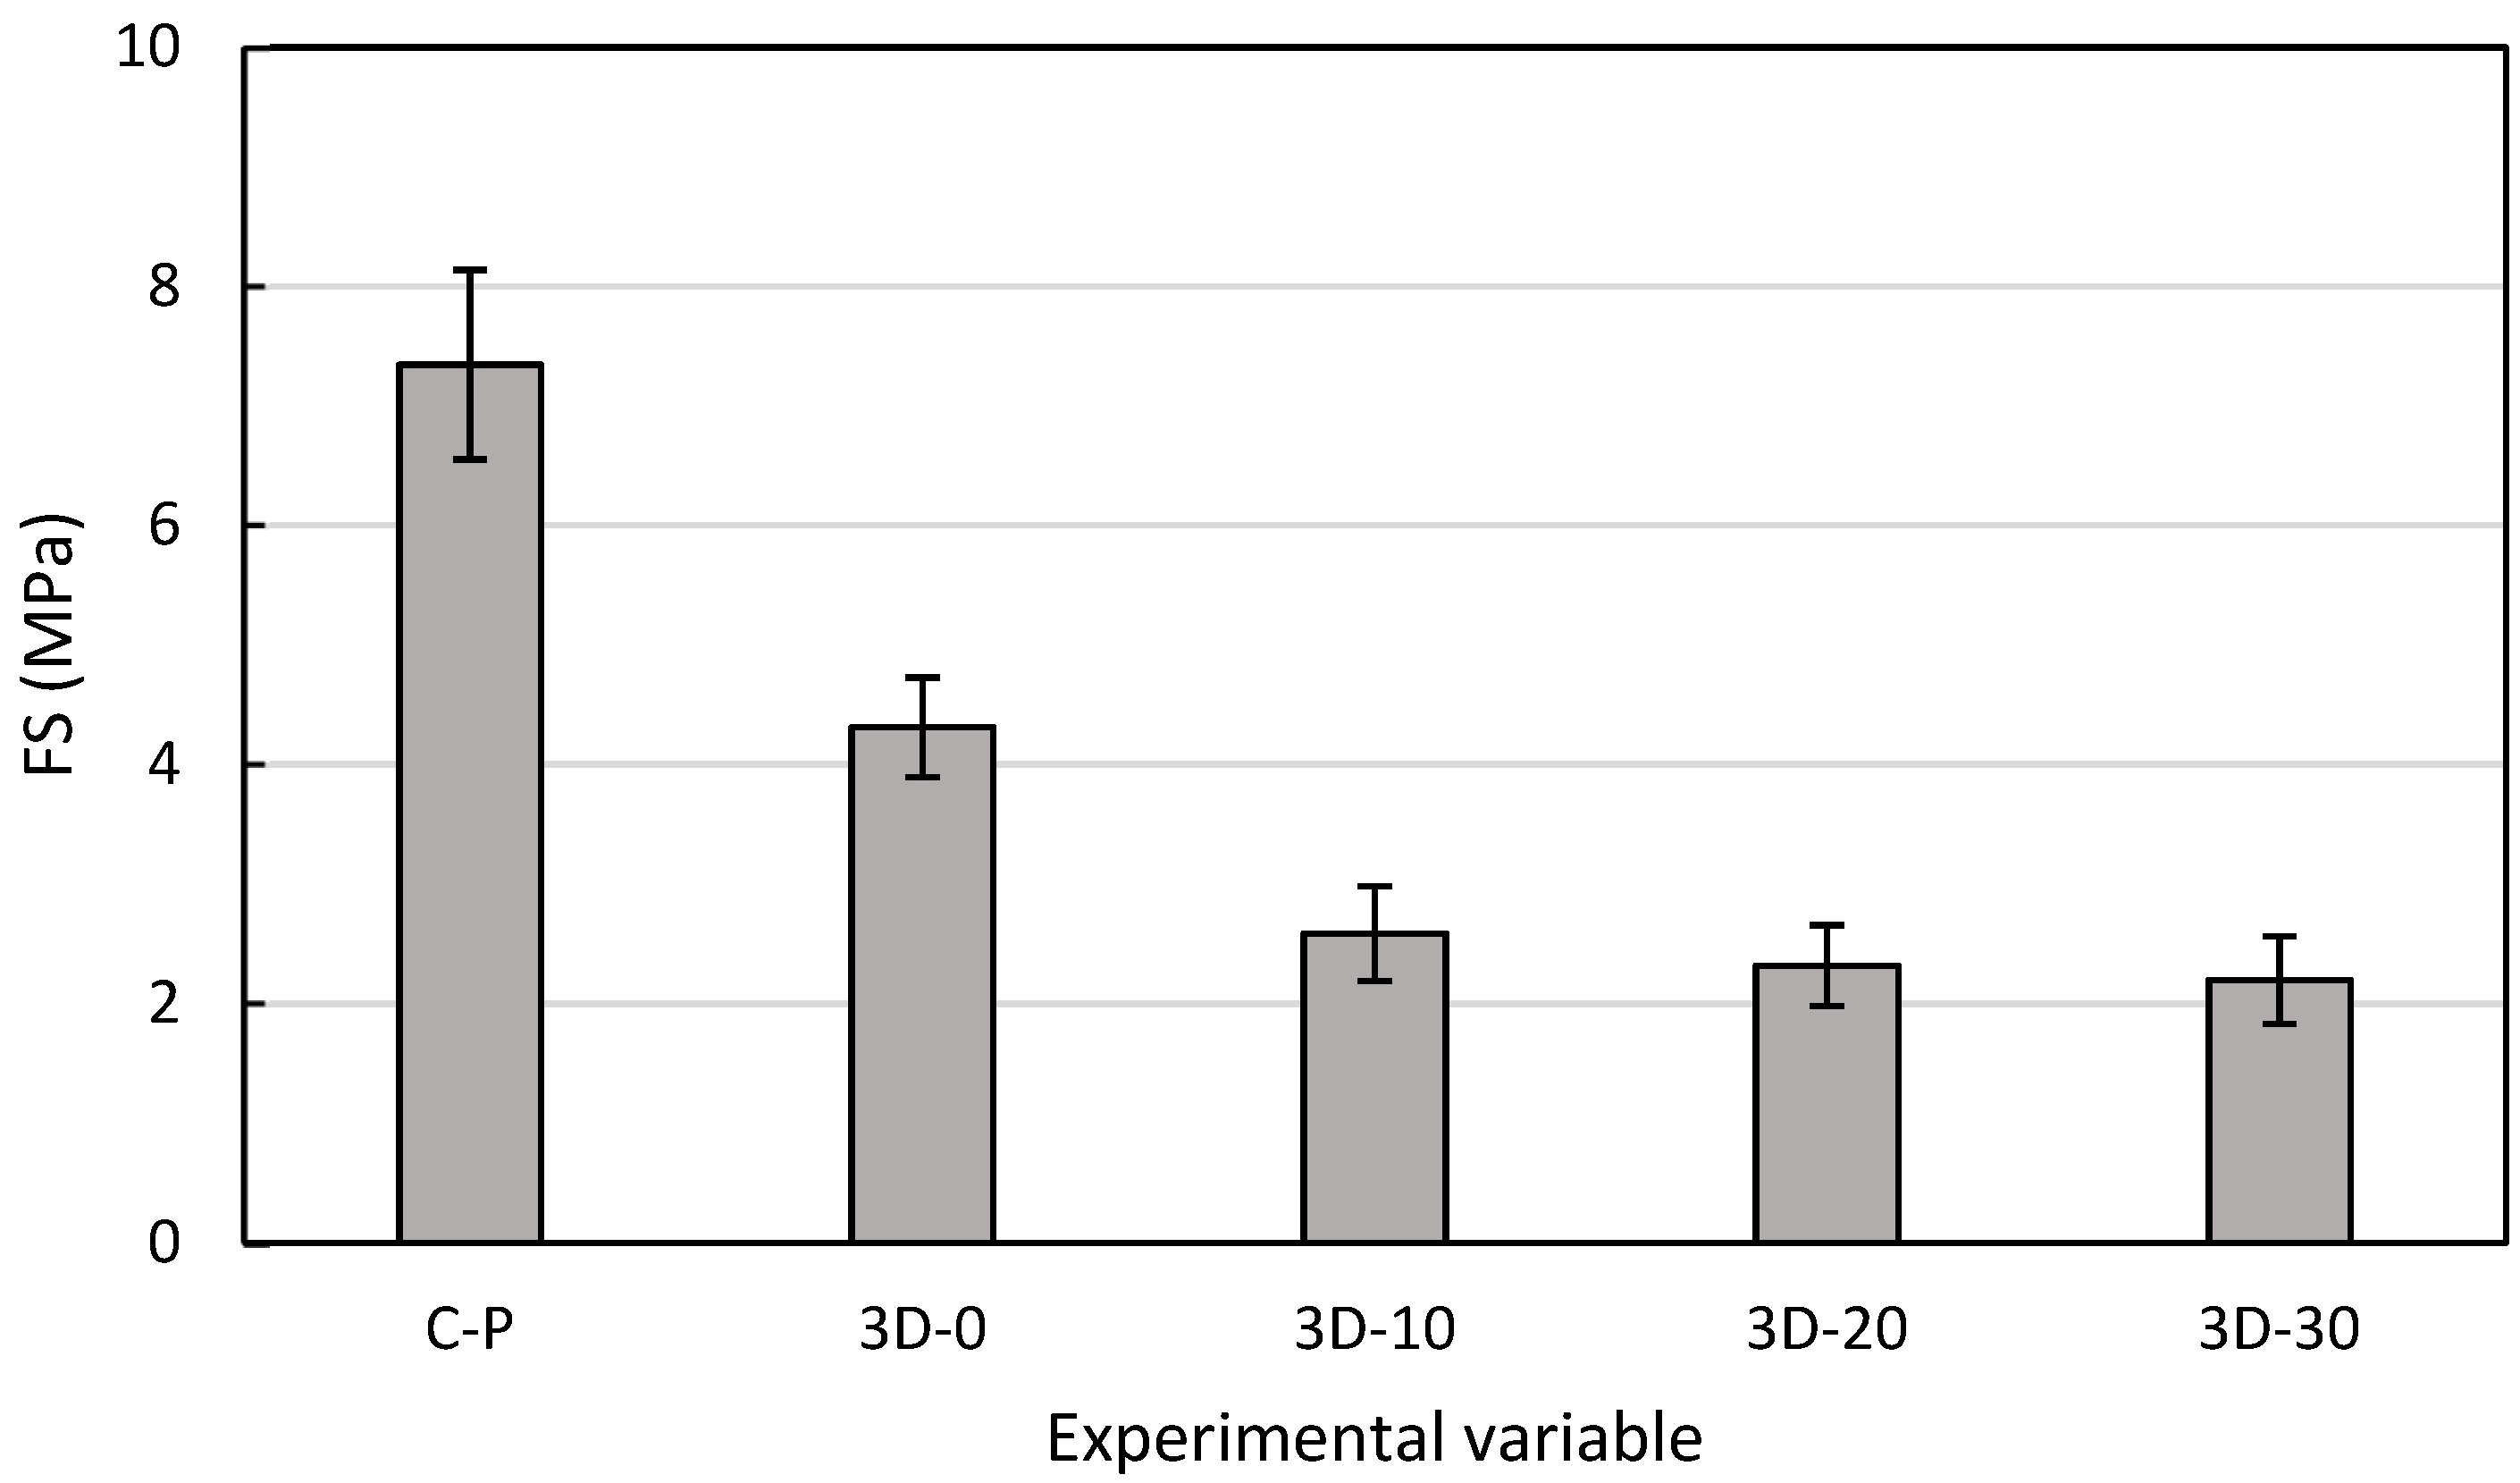
The flexural strength results are shown in Figure 9 and the error bars indicate ± one standard deviation. The C-P yielded the highest strength of 7.34 MP, owing to the dense concrete matrix provided by the high degree of compaction. The 3D-0 samples yielded a 4.31 MPa strength. The reduction in flexural strength compared to C-P is attributed to the inherent LOF present in the IR of printed samples. The voids in cast concrete are randomly distributed, whereas the voids located at the printed samples IR are smeared together in the printing direction, resulting in more elongated and interconnected voids [18,20]. The LOF at these IRs result in weak joints and facilitate failure. The introduction of pass times at the CL reduced IBS. The 3D-10, 3D-20 and 3D-30 yielded a flexural strength of 2.59, 2.32 and 2.20 MPa, respectively, and in all samples failure occurred at the location of the CL. The reduction in IBS with an increase in PT has been reported by various researchers [19]. The reduction is attributed to surface moisture evaporation and thixotropy. The longer the pass time, the more surface moisture evaporates from the printed layer, leaving behind a more dry, rigid and porous surface which has limited layer-intermixing capabilities for the second layer to be printed on. As the second layer is printed, water migrates from the new layer to the old layer through capillary absorption and causes air to be forced out of the old layer into the IR, where it is trapped. This is known as the moisture transfer/exchange phenomenon and causes an increase in porosity and permeability at the IR and bottom half of the top layer [19,34,35]. The chosen pass times are longer than trf, thus hindering the physical bond formation between subsequences printed layers during the re-flocculation period. Ongoing structuration also results in a more rigid surface for the subsequent layer to be printed on, which increases the LOF at the CL [19,26].
3.2. Durability Index Tests
3.2.1. Macro-Observations
Notable visual observations were made when the DI disks were prepared. The C-V samples showed small, randomly disturbed voids. These voids were not observed on C-P and 3D-0 samples owing to the high degree of compaction by the poker vibrator and concrete pumping. The PT was also short, allowing for a high degree of interlayer mixing upon extrusion. Visible LOF was present at the CL for the PT induced samples and became more distinct with an increase in PT. Figure 10a,b show the visible CL observed for the 3D-20 and 3D-30 samples, respectively.
3.2.2. Oxygen Permeability Index
The oxygen permeability index (OPI) and oxygen permeability (k) results are shown in Figure 11 and the error bars indicate ± one standard deviation. The C-P samples yielded the highest OPI (11.09) and were the least permeable, followed by the C-V samples that yielded an OPI of 10.43. A reduction in OPI was noted for the printed samples, compared to both cast samples which is attributed to the increase in porosity and pore interconnectivity present at the IR and CL. The 3D-0 yielded an OPI of 10.23. These C-P results correspond well with the results obtained by Moelich et al. [36]. The OPI for the 3D-0 is lower compared to Moelich et al. [36], owing to the fact that Moelich et al. [36] only cut one side of the printed sample which will result in pore blocking and thus a higher OPI. An increase in pass time resulted in a decrease in OPI and increase in k, owing to the LOF induced by the PT. The 3D-10, 3D-20 and 3D-30 yielded an OPI of 10.10, 9.99 and 9.97, respectively. The C-P, C-V, 3D-0 and 3D-10 all fall within the excellent durability class while the 3D-20 and 3D-30 fall within the good durability class [37].
3.2.3. Water Sorptivity Index
The sorptivity (S) and porosity (n) results are shown in Figure 12 and the error bars indicate ± one standard deviation. The cast samples yielded the lowest S and n values. The C-P yielded a S and n value of 4.09 mm/√h and 9.23%, respectively, while the C-V yielded a S and n value of 4.31 mm/√h and 16.39%, respectively. The printed samples yielded larger S and n results. The 3D-0, 3D-10, 3D-20 and 3D-30 samples yielded the S results 4.82, 5.42, 5.49 and 4.83 mm/√h, respectively. The sorptivity increased with an increase in PT from 0 to 20 min, which could be attributed to the LOF induced by the PT allowing for more water to an absorbed through the CL, similar to the results reported by Bran Anleu [22] which show an increase in capillary moisture uptake with an increase in PT for dry cured samples. This was not the case for the 3D-30 samples, which resulted in a deceased in S compared to the 3D-20 and 3D-30. The reason for the reduction is not clear. There was a notable increase in n with an increase in PT. The 3D-0, 3D-10, 3D-20 and 3D-30 samples yielded n results of 18.16, 18.48, 18.50 and 19.71%, respectively. All the experimental variables yielded S values lower than 6 mm/√h, which classifies all the samples to be in the excellent durability class [37].
3.2.4. Chloride Conductivity Index
The chloride conductivity (σ) and n results are shown in Figure 13 and the error bars indicate ± one standard deviation. The dense matrix and randomly distributed pores of the cast samples yielded the lowest σ and n values. The C-P and C-V samples yielded σ and n values of 0.46 and 0.82 mS/cm, and 3.32% and 6.15%, respectively, which are similar to the results reported by Moelich et al. [36]. The 3D-0 samples yielded higher σ (1.08 mS/cm) and n (7.88%) values compared to the cast samples. The increase in porosity and permeability at the IR acted as a pathway allowing for a large current to pass through the sample, thus yielding a higher σ value. As discussed in Section 2.6, the 3D-10 sample stayed in the NaCl solution for longer than the guidelines specify, which resulted in additional chloride binding that produces a lower σ value. Moelich et al. [36] reported much lower σ values, owing to the pore blocking that occurs by only cutting one face of the disk. The σ increased with an increase in pass time due to the LOF induced by the pass time. The 3D-10, 3D-20 and 3D-30 samples yielded σ values of 1.79, 1.90 and 2.05 mS/cm. The n was not very heavily influenced by the PT, but still yielded n higher than the cast samples. The C-P falls within the excellent durability class. The C-V and 3D-0 fall within the good durability class, while the 3D-10, 3D-20, and 3D-30 fall within the poor durability class [37].
3.2.5. Effectiveness of Durability Index Testing for Testing 3DCP Samples
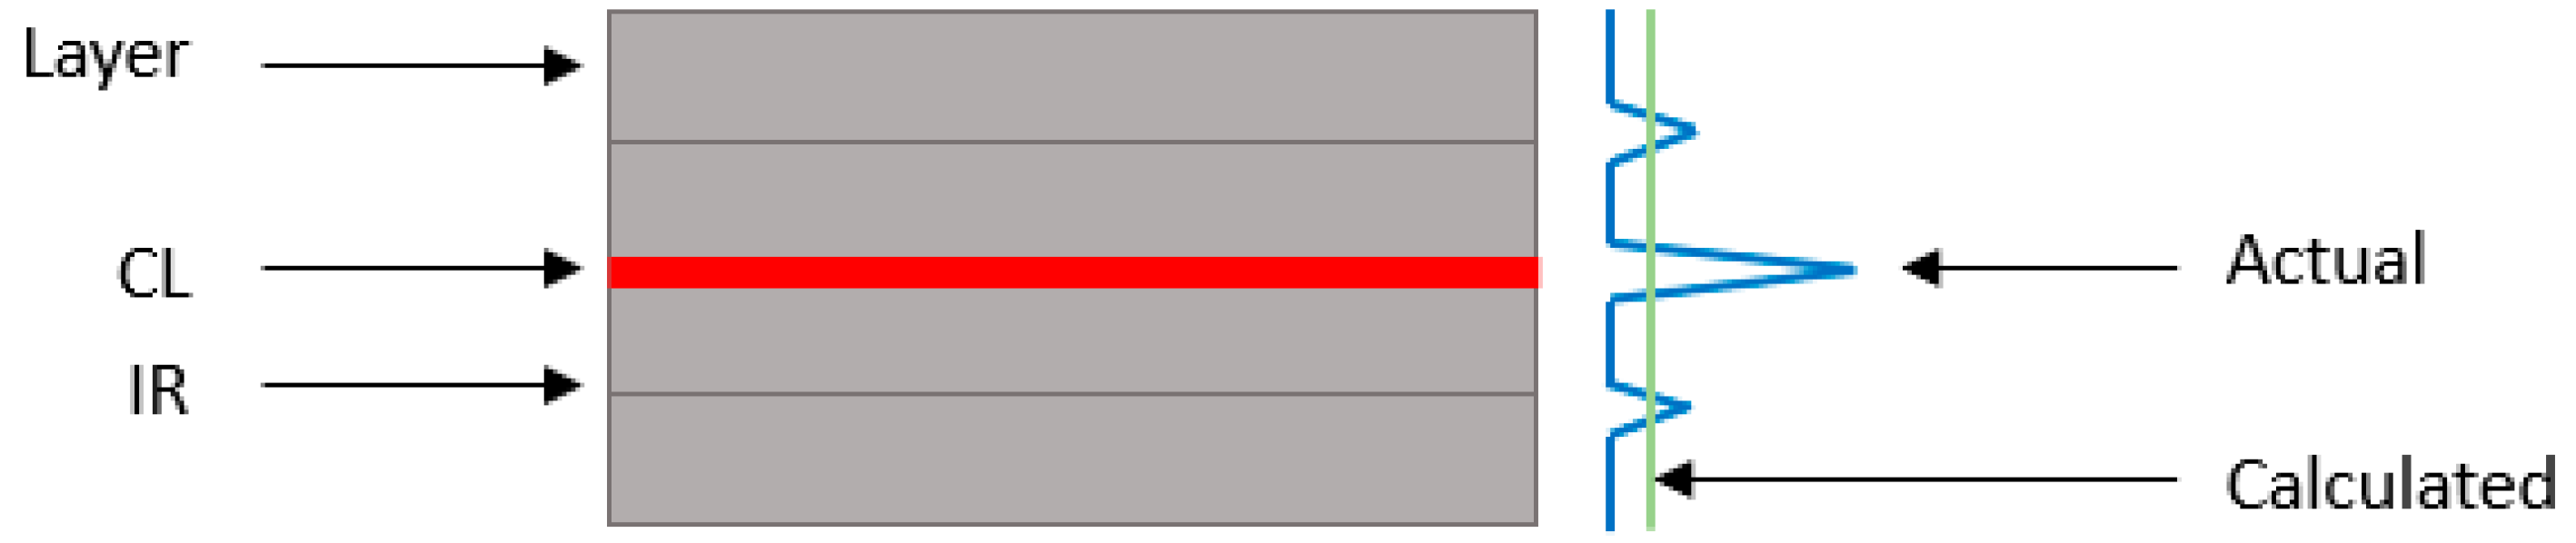
The interpretation of the DI results is based on cast samples that have no cracks and have a homogeneous microstructure across the sample. Thus, testing samples that have very non-homogenous microstructures across the height of the samples, in the case of printed samples (especially those with induced PTs), could underestimate the worst-case characteristics of the tested sample. This concept is illustrated in Figure 14. The results obtained from the DI testing in 3.2.2 to 3.2.4 is an average value for the entire sample as whole and does not indicate the exact DI value for the worst-case characteristics i.e., at the CL.
3.3. Accelerated Concrete Carbonation
3.3.1. Carbonation Rate
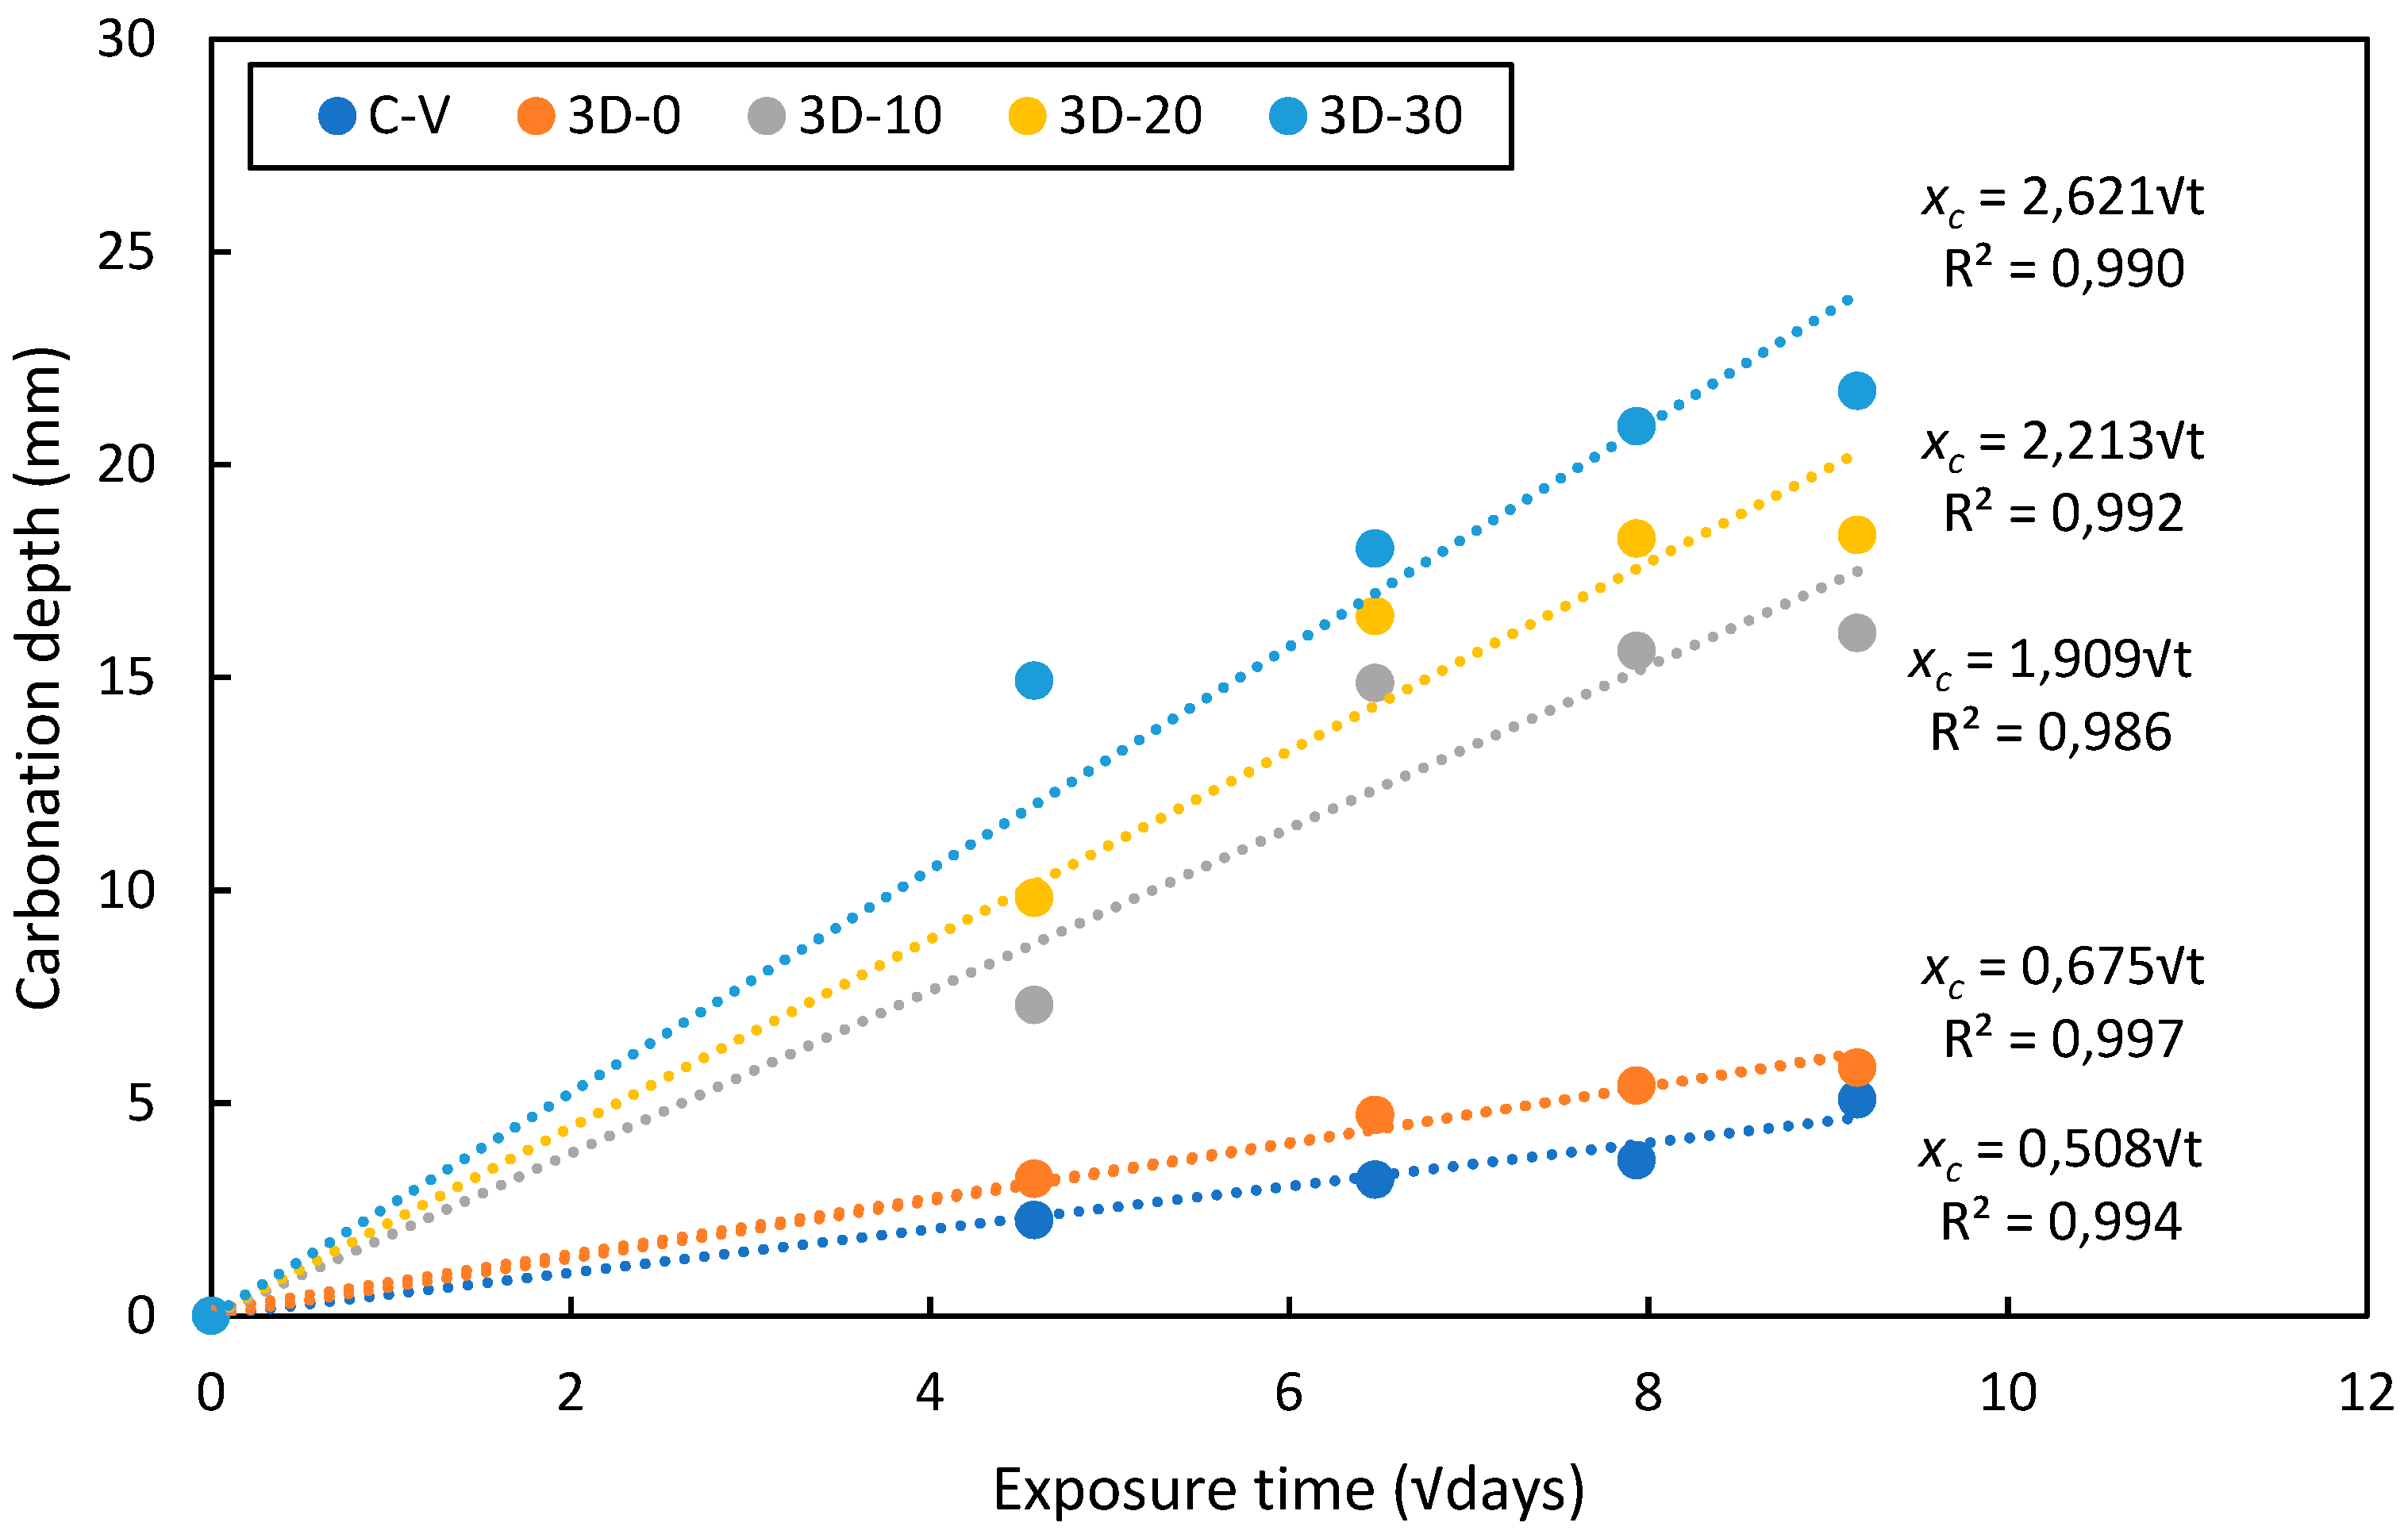
Figure 15 illustrates the progression of the carbonation depth against the square root of time. The C-V values plotted are the average carbonation depth of the cast sample. The 3D-0 is the average carbonation depth at the IRs. For the printed samples with induced PTs, the carbonation depth at the CL was used. It is known that the carbonation depth is proportional to the square root of time (Equation (1)), thus a liner regression line was fitted to each experimental variable’s recorded data [2]. It is also assumed that the carbonation depth at the start of the test was equal to zero [38]. The carbonation rate (A) is shown in Figure 15 and shows a good correlation with the experimental data (R2 equal and above 0.986).
where xc is the carbonation depth (mm), t is time (days) and A (mm/√day in this case).
3.3.2. Effect of the Interlayer Regions and Critical Layer on Concrete Carbonation
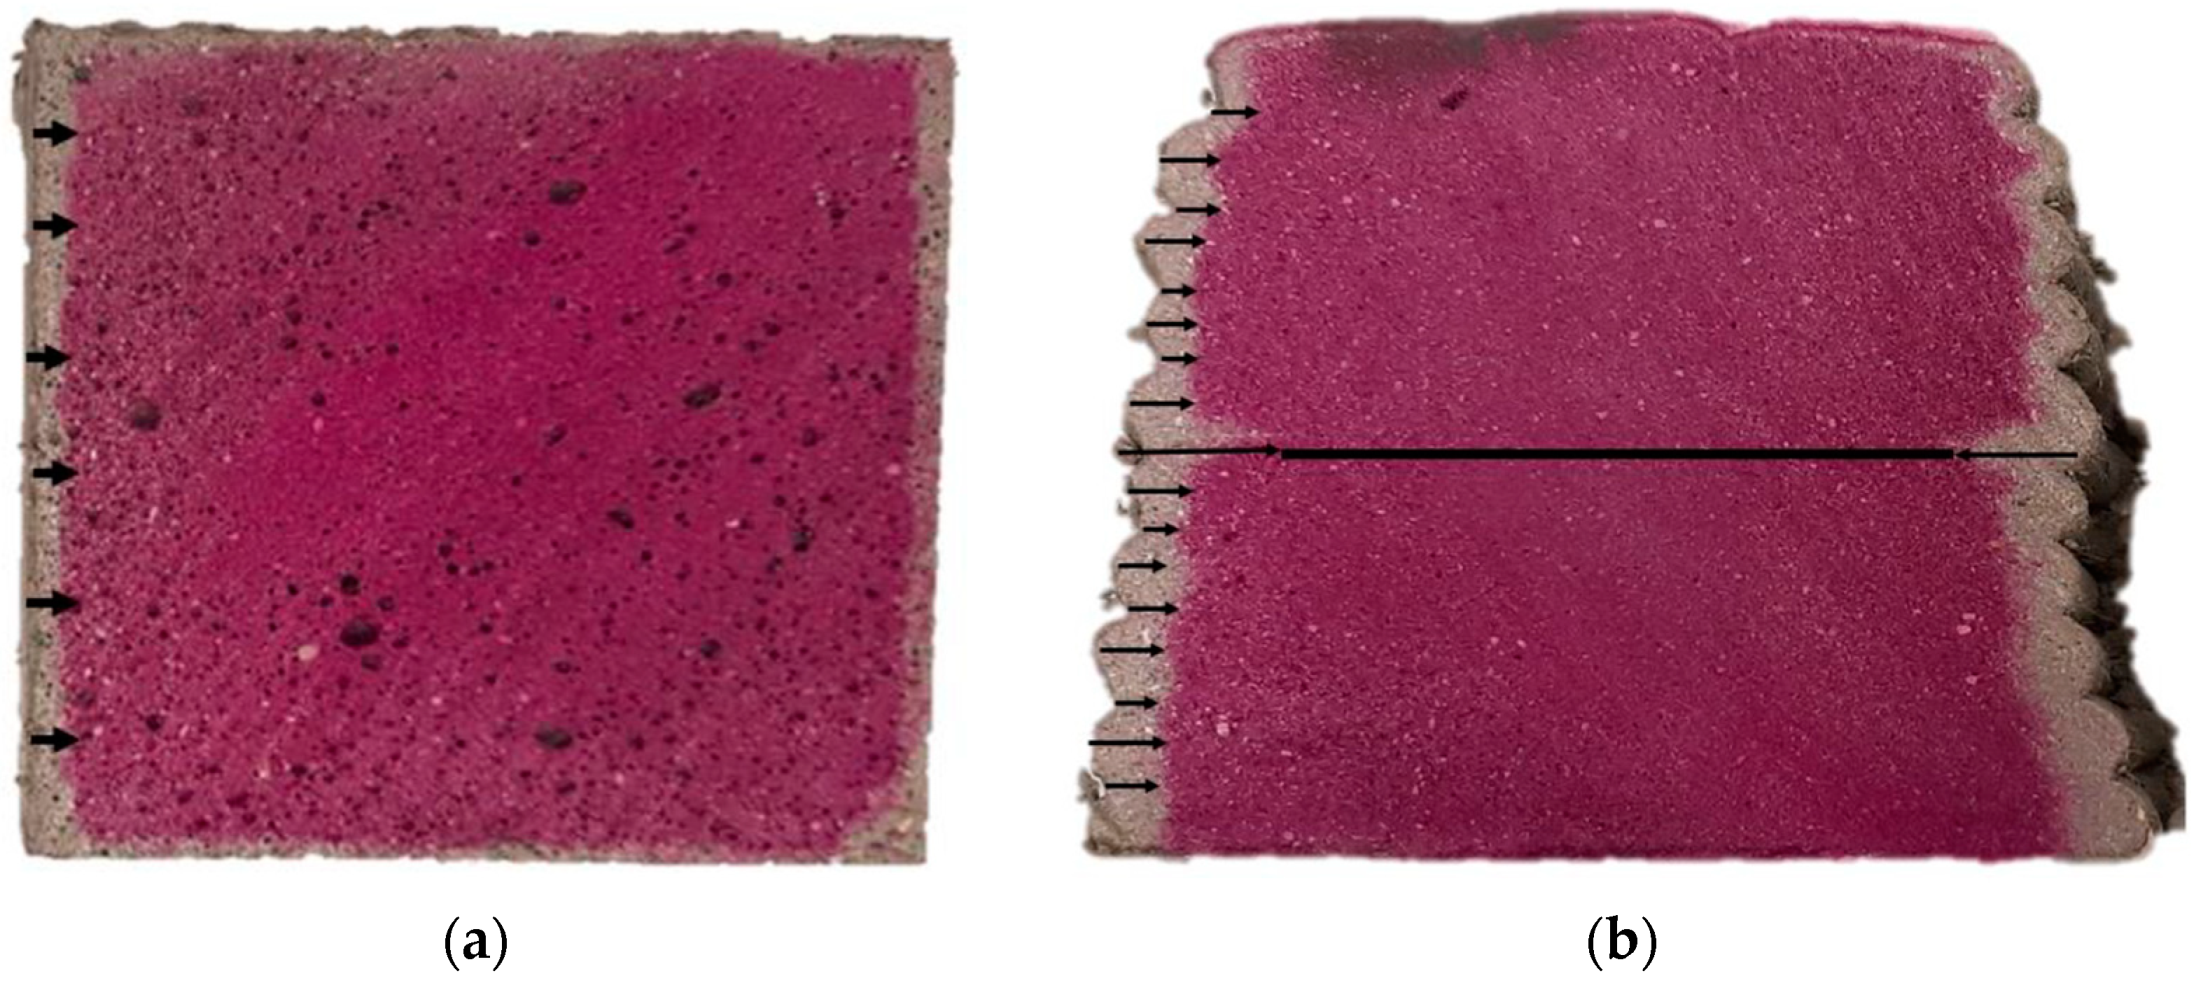
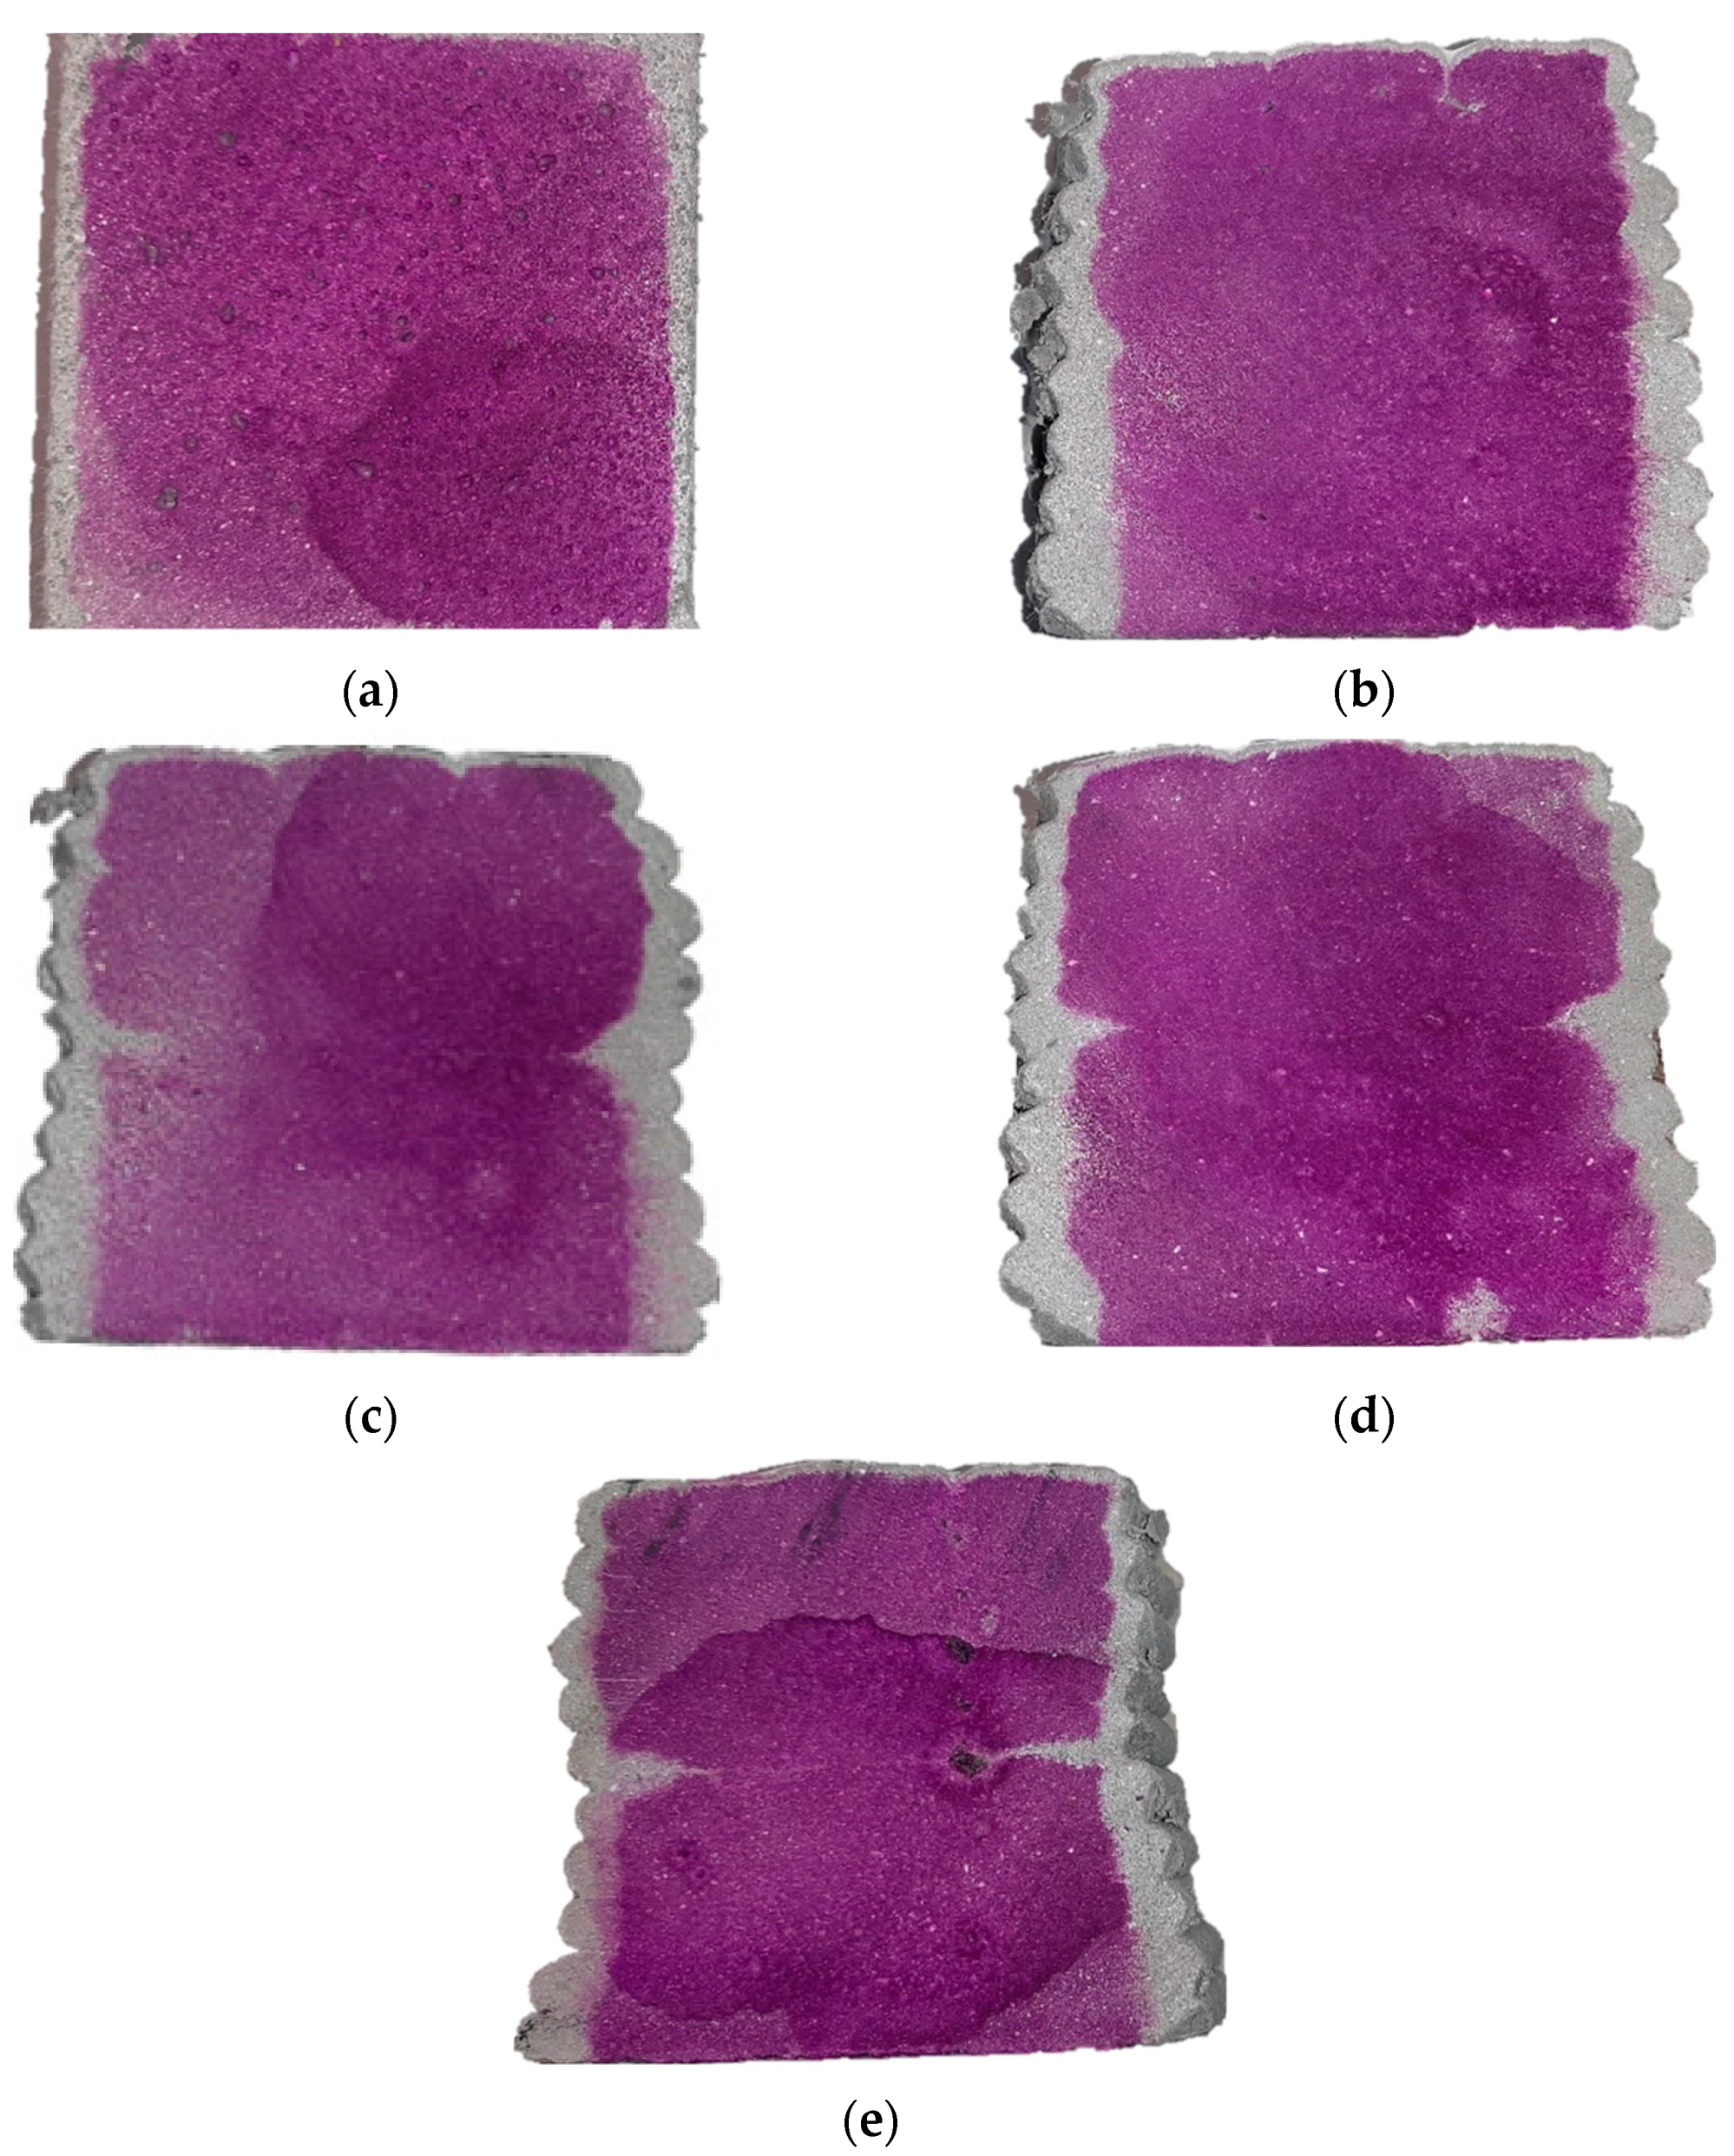
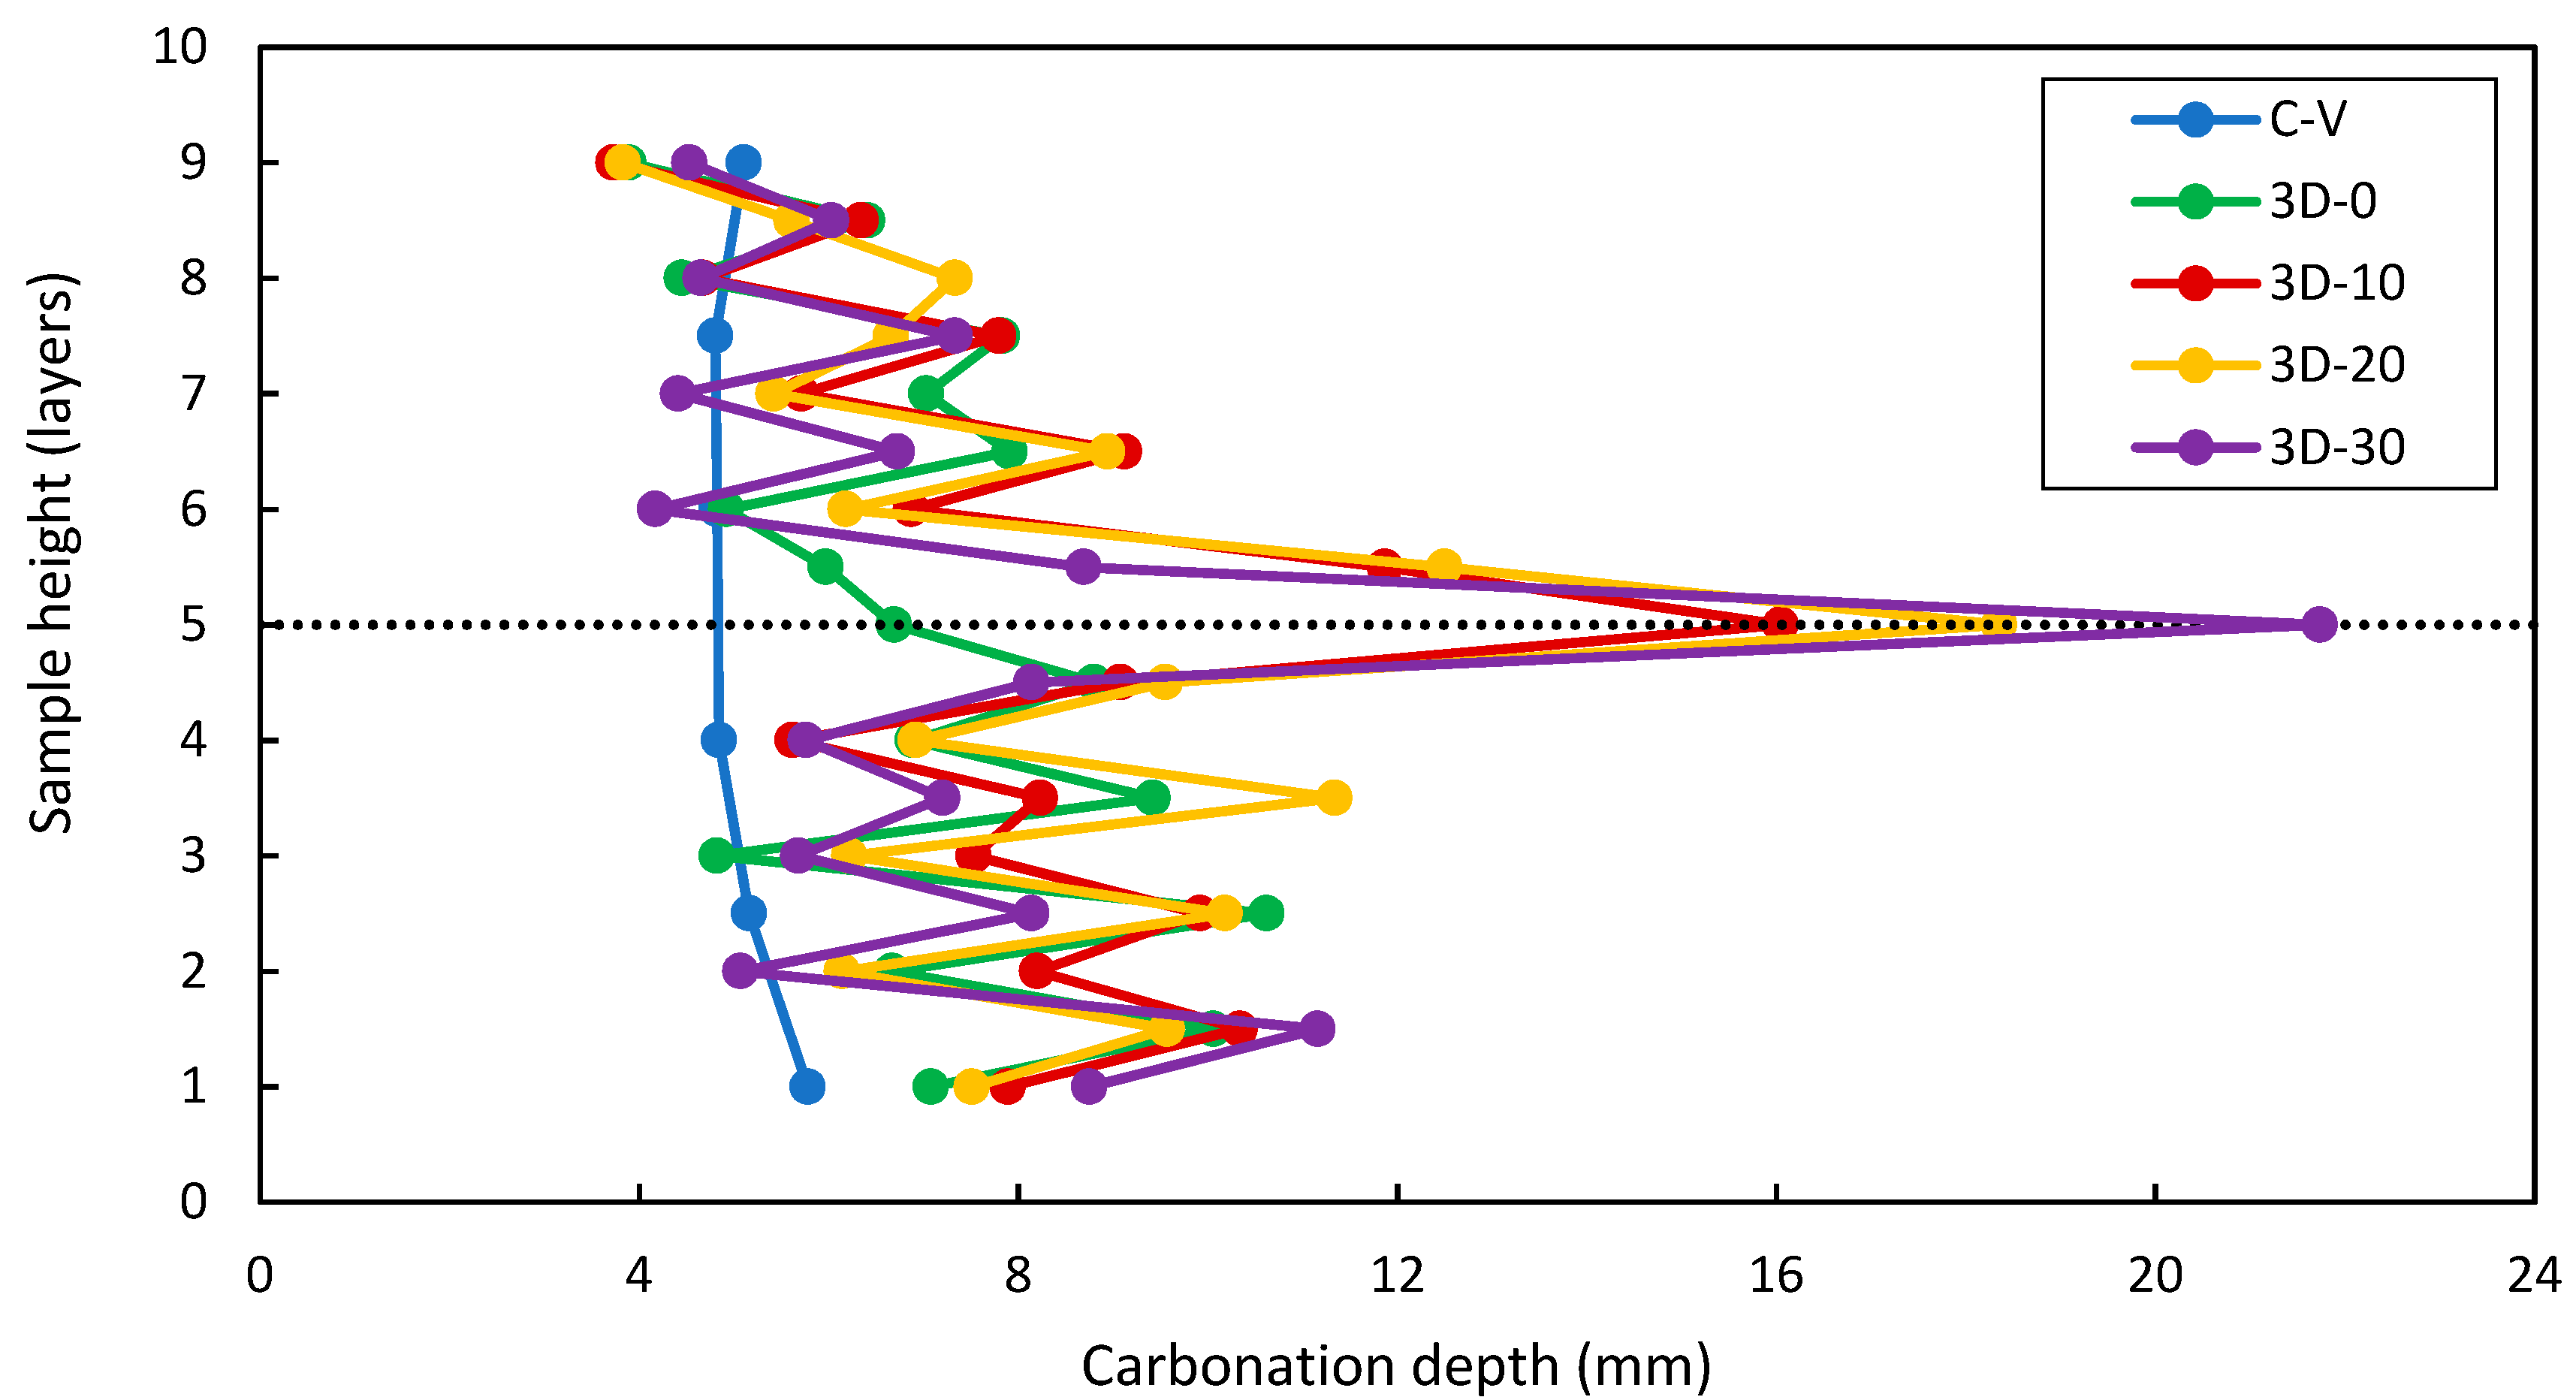
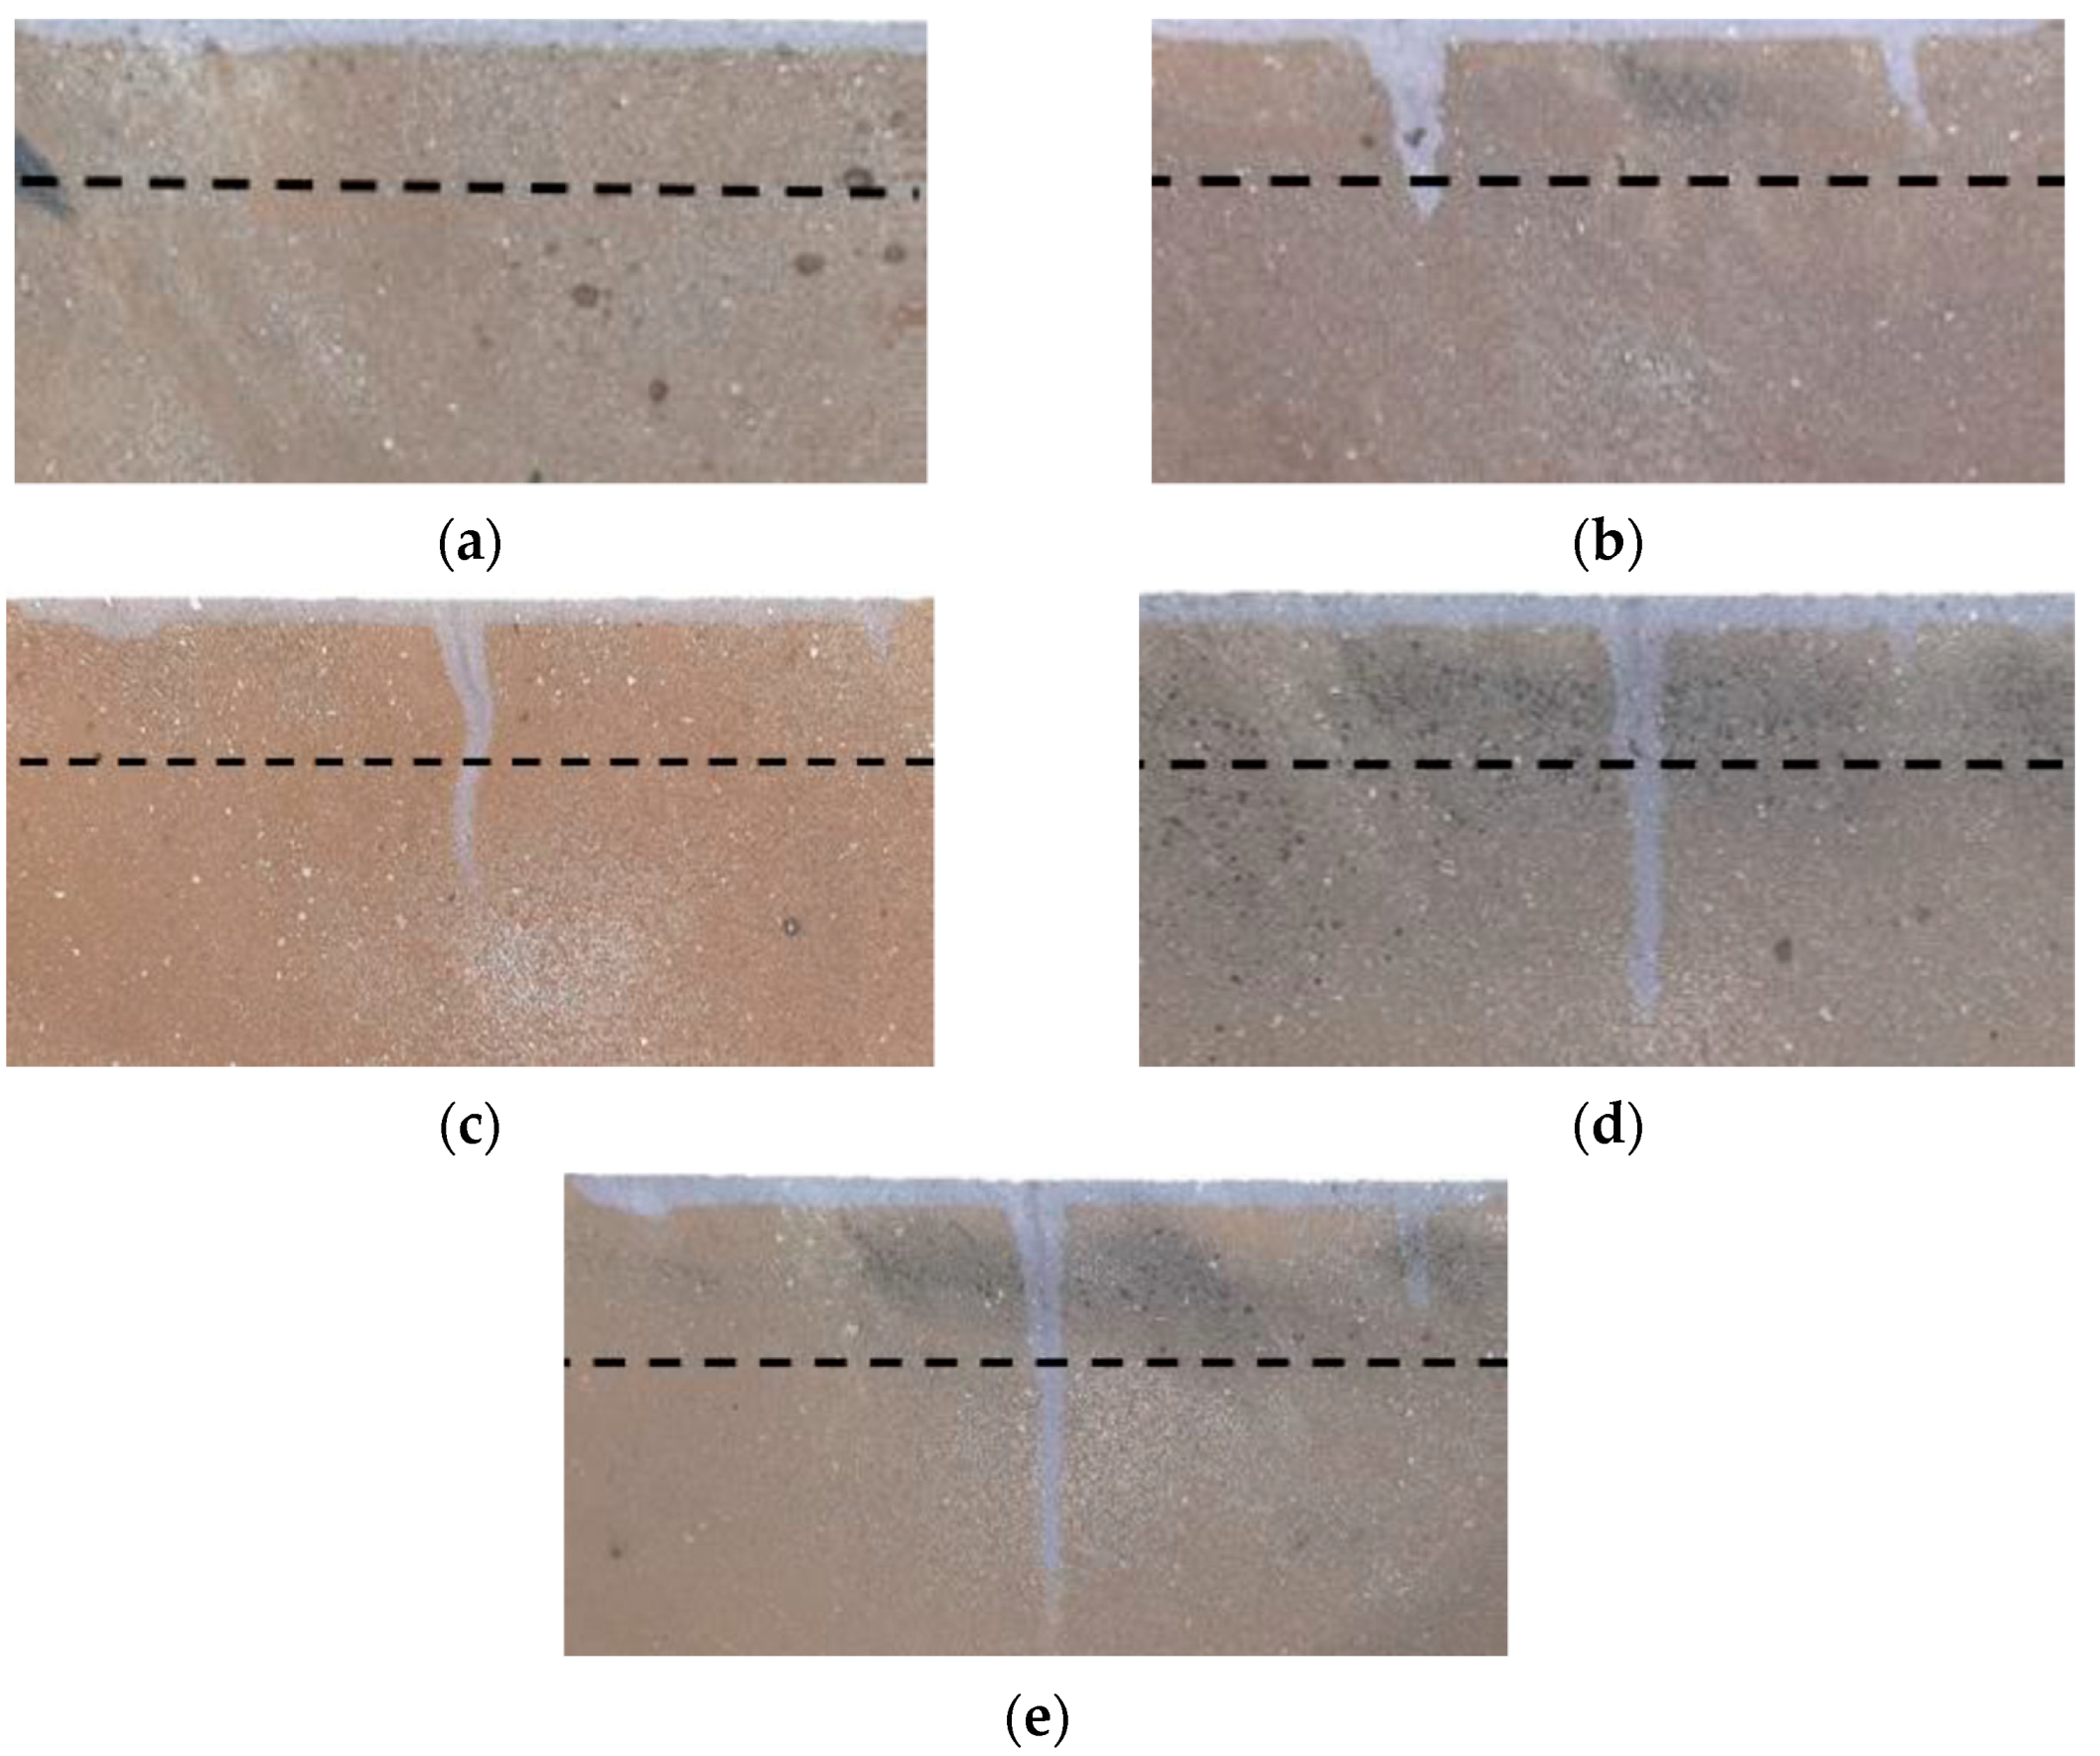
The 12-week carbonation front for each experimental variable is shown in Figure 16. The freshly cut surface was sprayed with a phenolphthalein indicator that turns violet in the areas which are not carbonated. The measured carbonation profiles after 12-weeks of ACC testing is also illustrated in Figure 17. The black dotted line indicates the CL. Figure 16 is a visual presentation of the carbonated samples, the carbonation front is standardised in Figure 17.
The carbonation front for the C-V (Figure 16a) was uniform across the section and recorded an average carbonation depth of 5.09 mm. The printed samples did not yield a unform carbonation front. The 3D-0 samples (Figure 16b) yielded greater carbonation depths at the IRs (5.83 mm) and A compared to the C-V samples, owing to the interconnected pores and increased permeability at the IRs that act as ingress pathways and function as cracks. These results are very similar to the results obtained by Carević and Ignjatović [14], where the carbonation depths at the cracks were greater than at the uncracked regions. For all the 3D samples, the carbonation depth at the IRs, excluding the carbonation depth at the CL, is less than at the intralayer (3.3.4 will elaborate more on this occurrence).
The influence of the PT at the CL on the carbonation depth is clear (Figure 16c–e and Figure 17). A sharp increase in the carbonation front and A was noticed at the CL, due to the LOF induced by the PT. The printed samples with induced PTs, 3D-10, 3D-20 and 3D-30, yielded CL carbonation depths of 16.05, 18.35 and 21.74 mm, respectively, owing to a higher degree of LOF associated with an increased in PT. The results show that the CL acts as ingress pathways, similar to the occurrence of concrete carbonation of cracked concrete [14]. Carević and Ignjatović [14] reported that the cracks act as ingress pathways and behaved as an additional exposed surface that allows CO2 ingress perpendicular to the crack wall, and this is similar to what was recorded for the PT induced samples where CO2 ingress was primary via the CL, followed by penetration perpendicular to the CL. The top region of the CL recorded greater carbonation depths than the lower regions, attributed to the porous layer matrix induced by water migration [19,34,35]. Carević and Ignjatović [14] also reported that larger crack widths result in greater carbonation depths, which corresponds well with the relationship between the LOF and carbonation depth. Larger PTs results in a higher degree of LOF, thus leading to greater carbonation depths.
3.3.3. Correlation between the Oxygen Permeability and Carbonation Rate
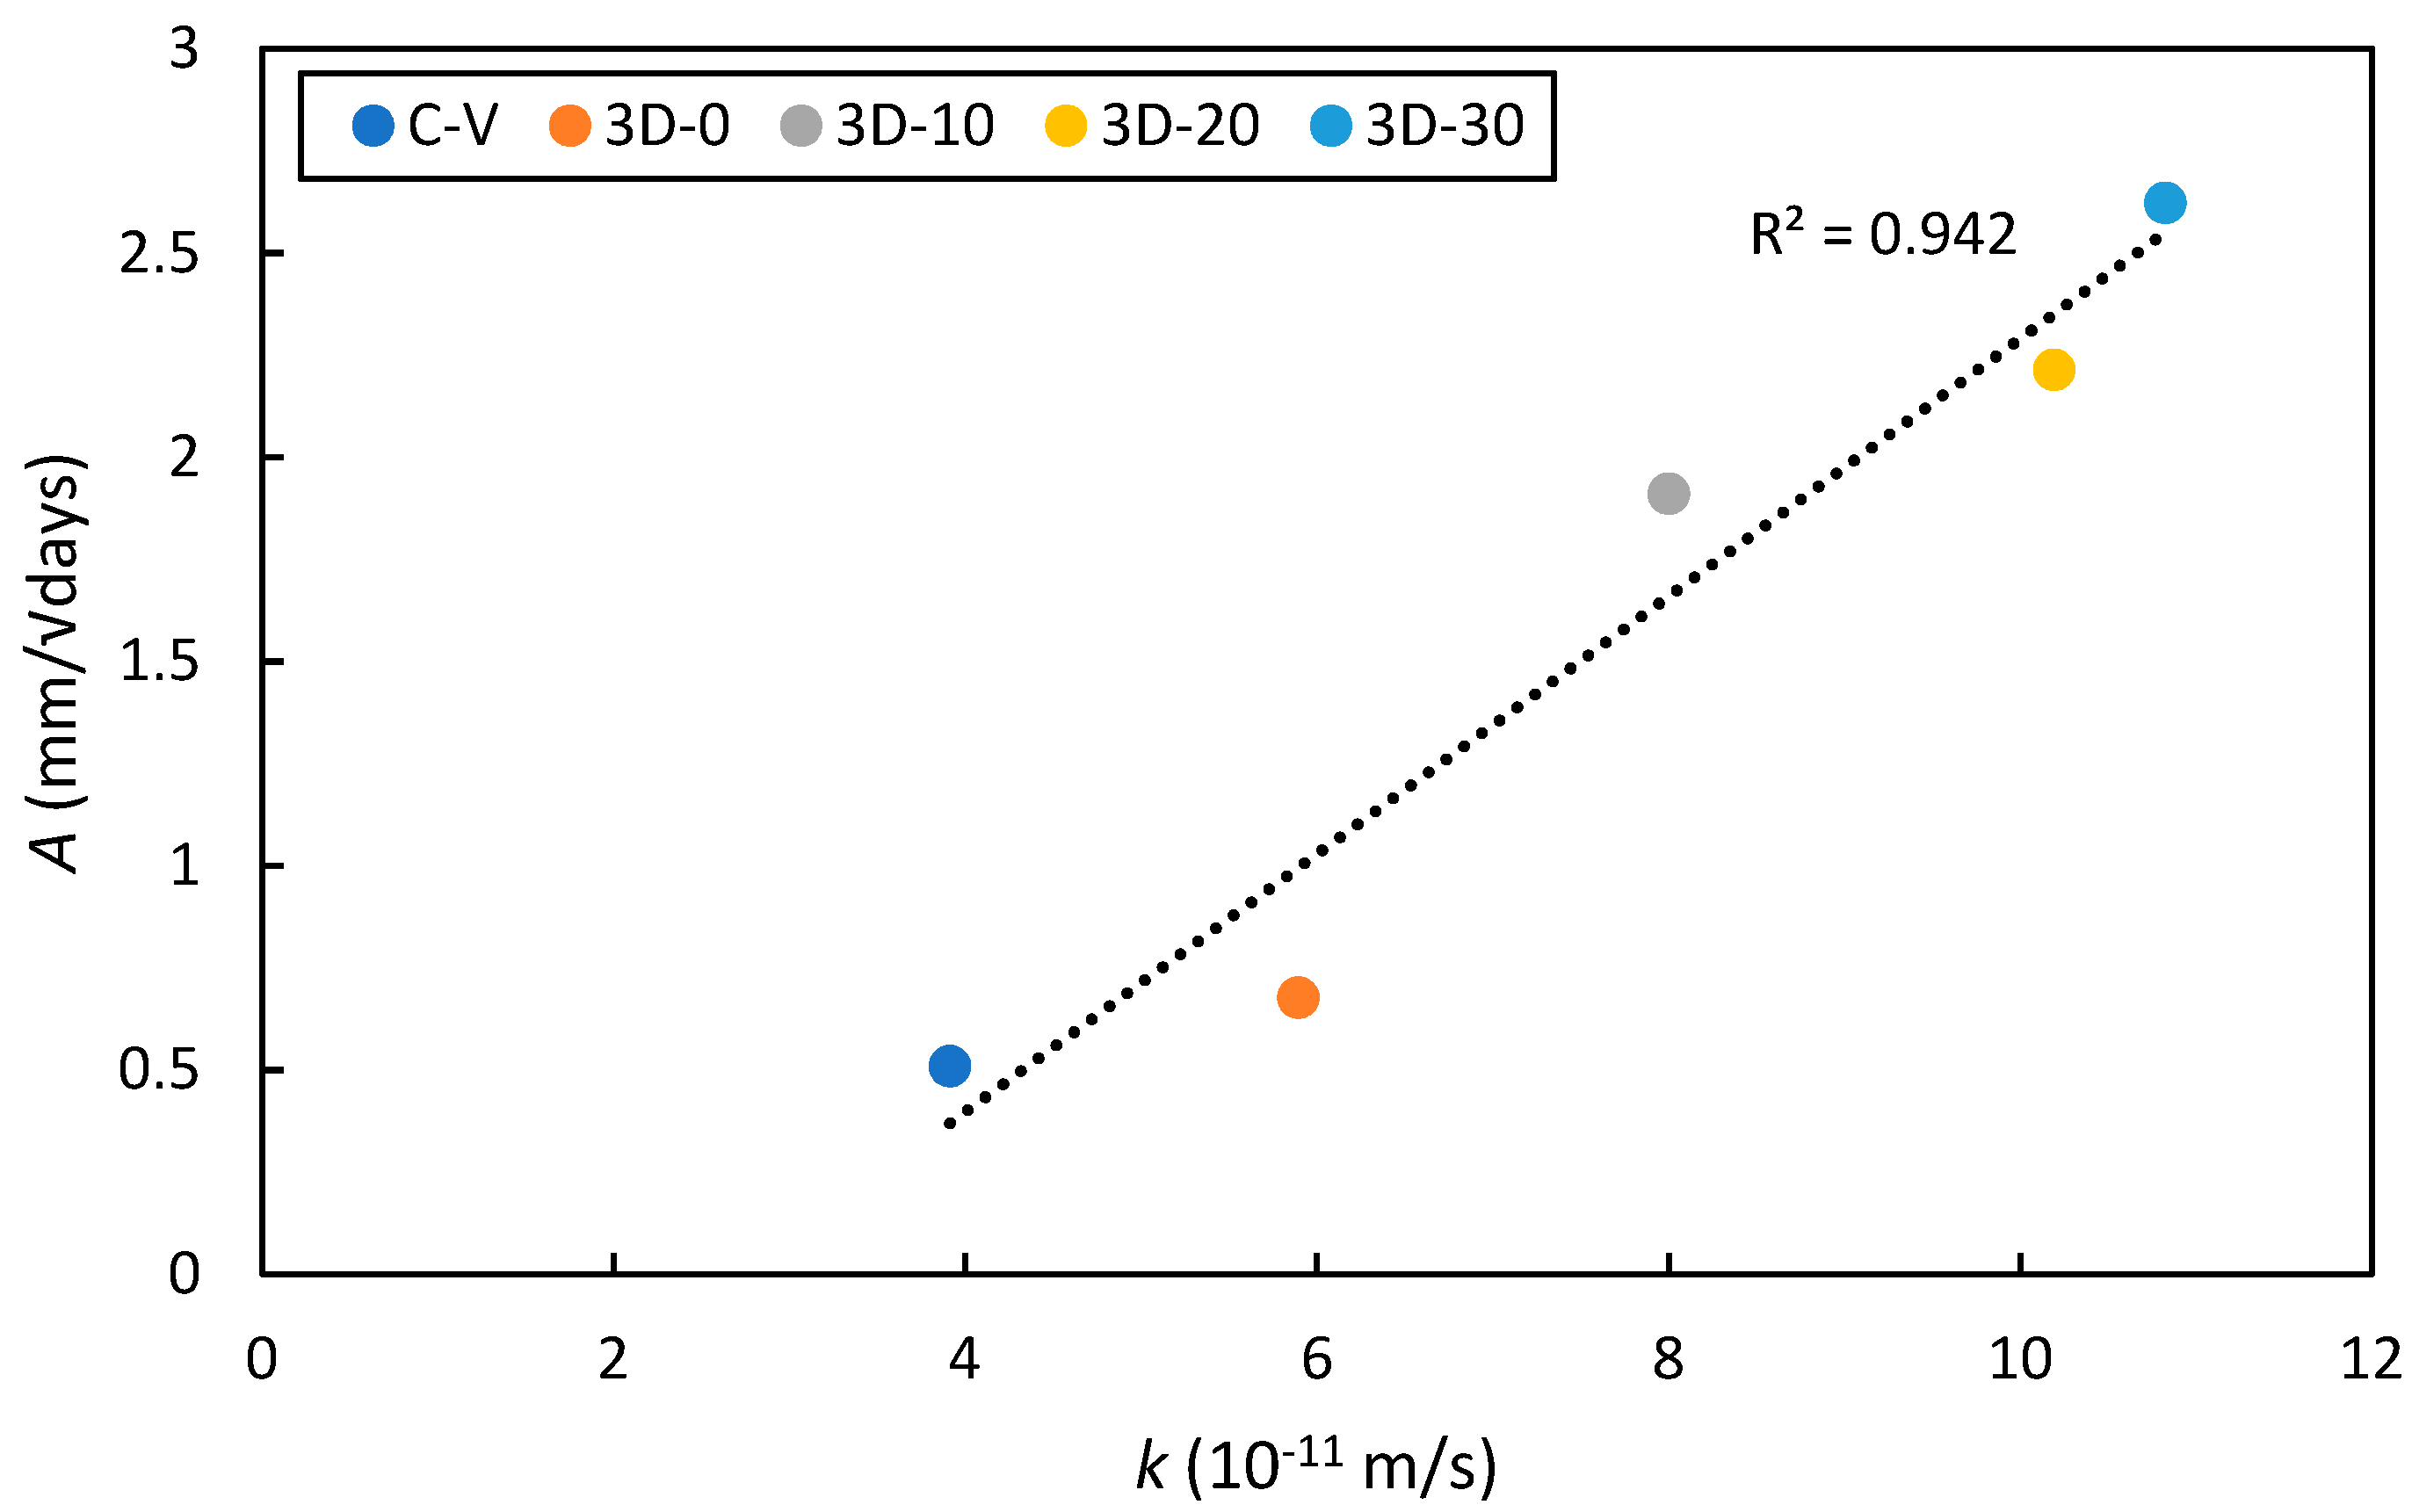
Good correlations between the carbonation depth and oxygen permeability have been established in the past [12,37]. Figure 18 shows the relationship between the k and the A for all the experimental variables. A good relationship between the k and the A is established (R2 of 0.942), showing that an increase in permeability results in greater carbonation depths.
3.3.4. Carbonation Depth at the Layer Compared to the Interlayer Region
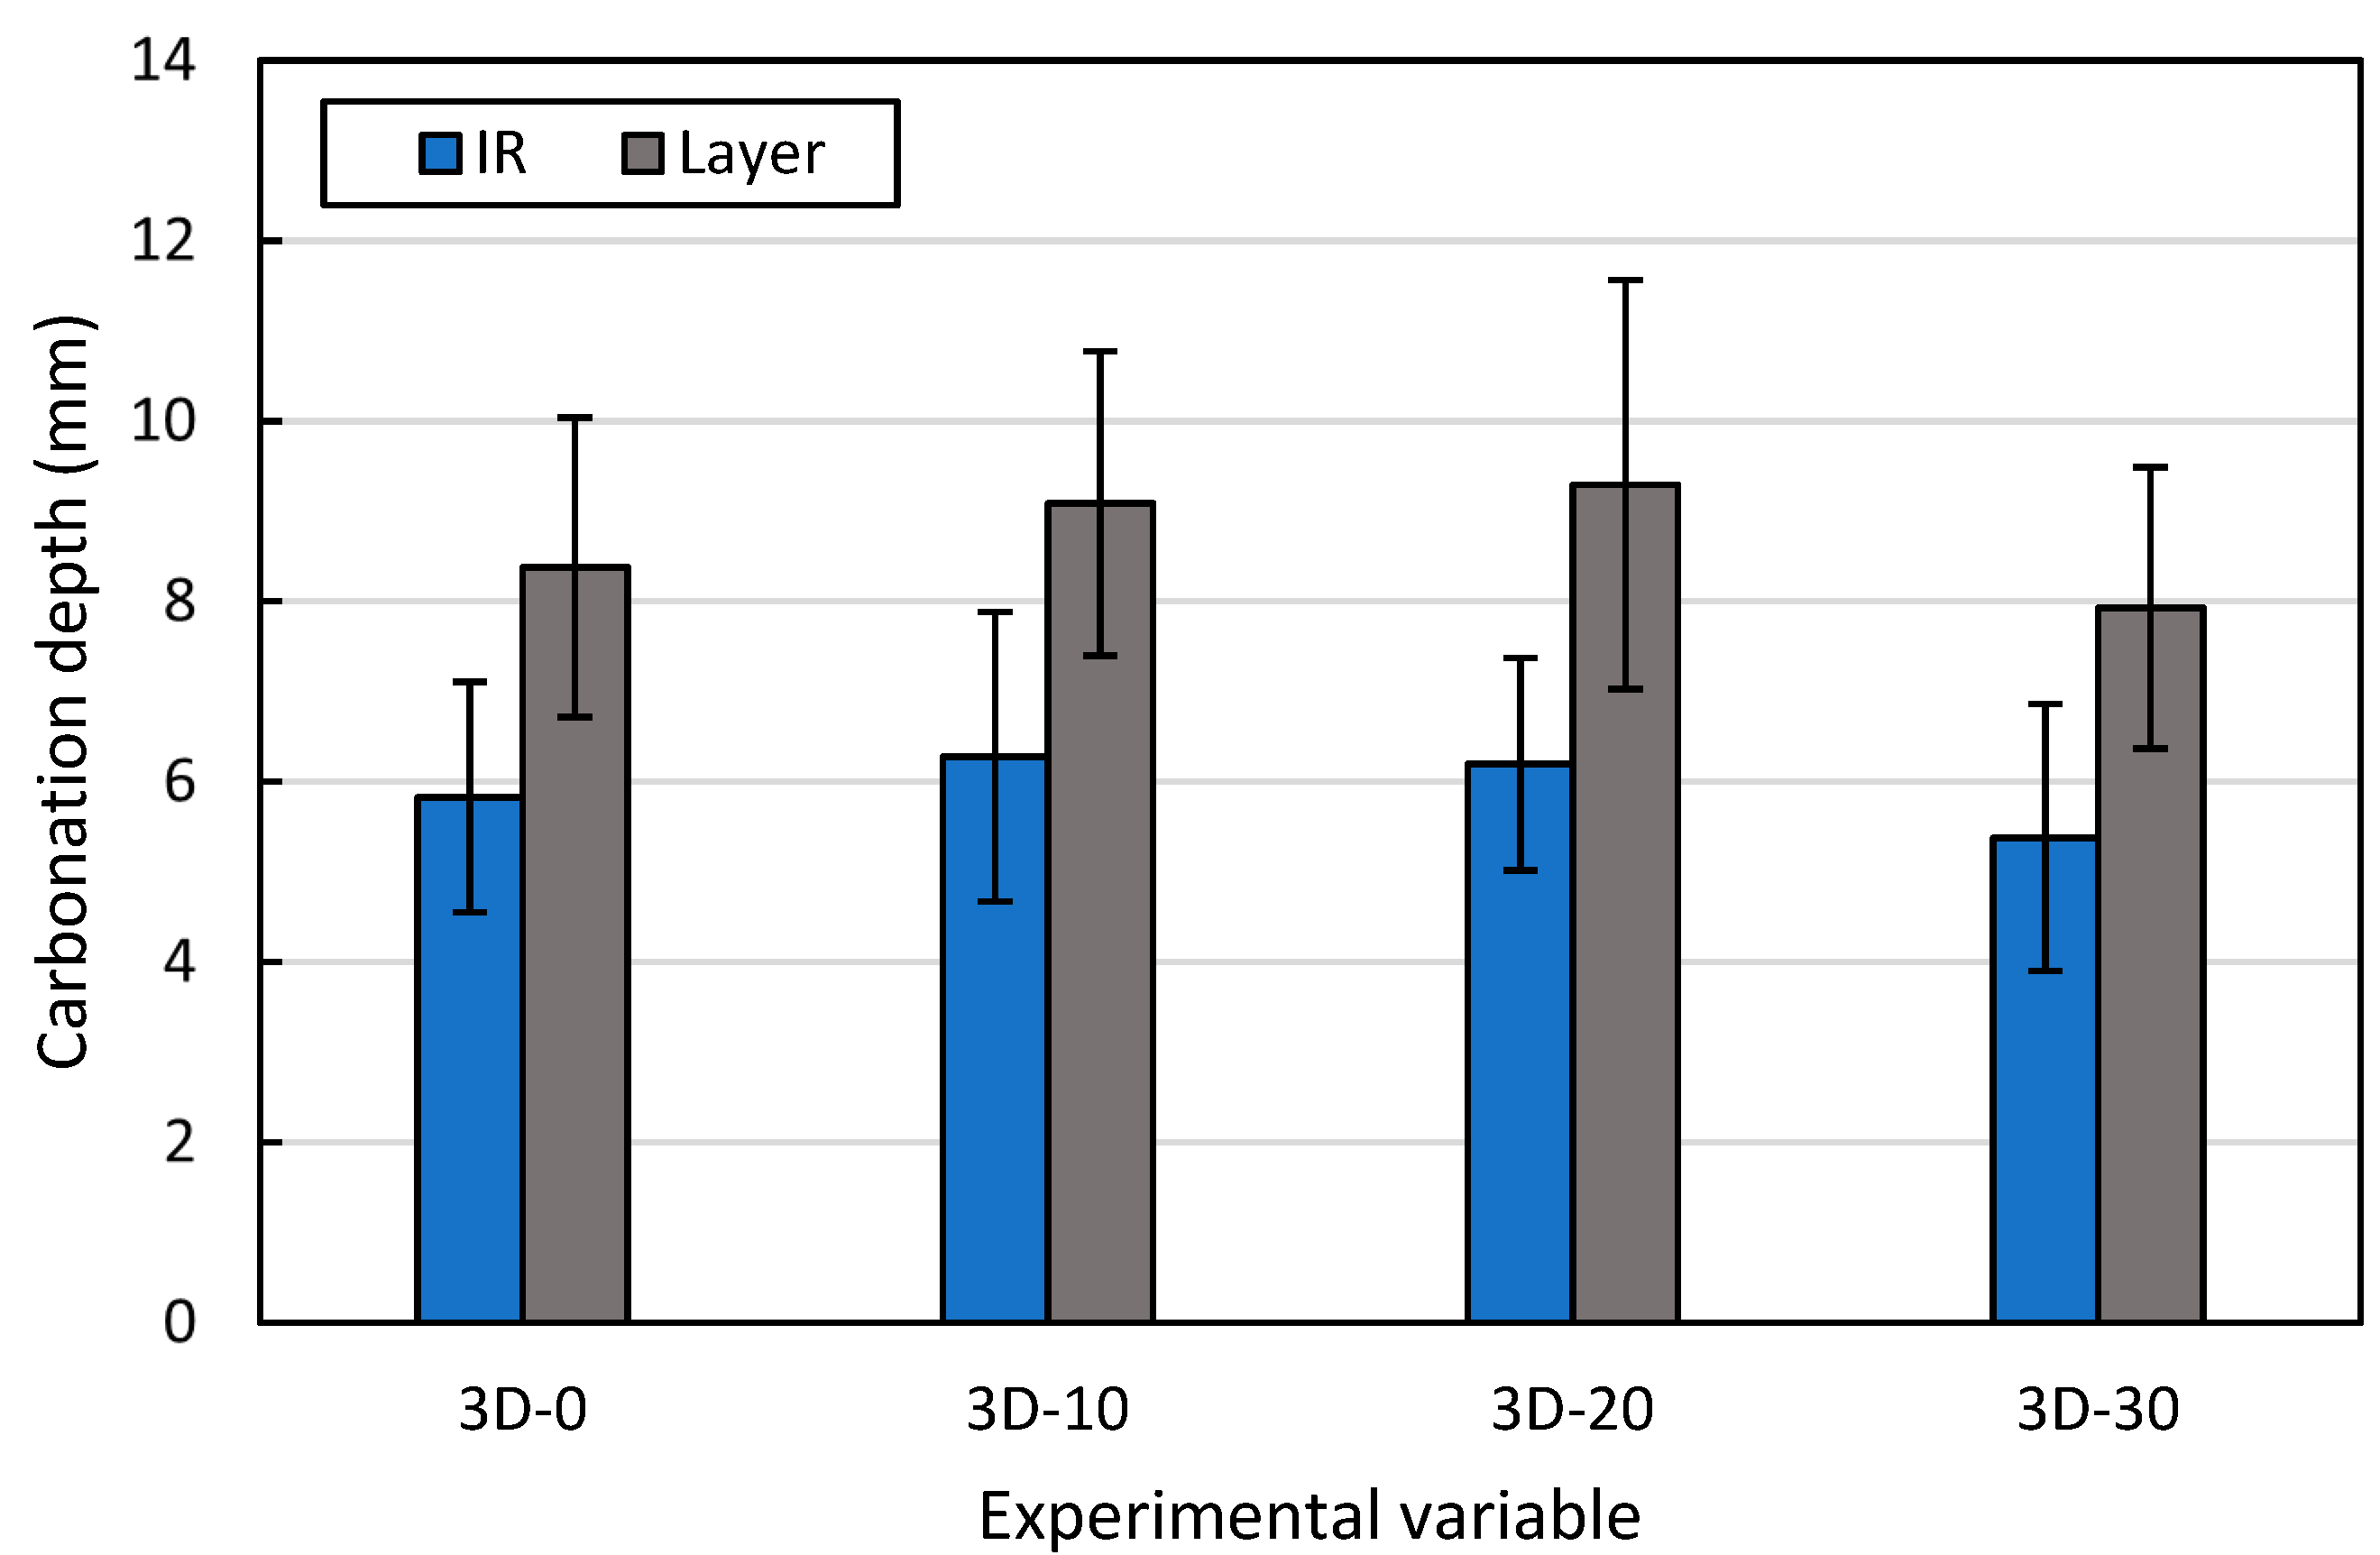
As noted from the visual observation in Figure 16, the carbonation depth at the layer was greater than the depth at the IRs (excluding the CL). Figure 19 shows the average 12-week carbonation depth at the IR and layer for each variable and the error bars indicate ± one standard deviation. In all cases, the carbonation depth is greater at the layers compared to the IRs, with an average carbonation depth of 5.92 and 8.67 mm for the IRs and intralayers, respectively. The difference is attributed to the increase in exposed surface area of the curved layer edges, allowing for more carbonation exposure and greater penetration, which is similar to the corner effects that occur in structures in urban environments [2].
3.4. Chloride Induced Corrosion
3.4.1. Chloride Penetration
The 18-week exposure, i.e., 9 cyclic wetting and drying cycles, chloride penetration profiles that best represent the three beams of each variable are shown in Figure 20. The black dashed line indicates the top of the reinforcement, i.e., at the cover depth of 20 mm. The C-V beams yielded a uniform chloride penetration profile and did not reach the reinforcement depth (Figure 20a). The 3D-0 beams yielded two distinctive chloride penetration spikes, that could be attributed to layer tearing that occurs during the printing procedure (Figure 20b). The average penetration depth for the worst layer tearing case was 25.67 mm. The printed samples, with induced PTs, yielded a sharp increase in chloride penetration depth at the CL. The penetration depth increased with an increased in PT due to the LOF induced by the pass time. The average CL penetration depth for the 3D-10 (Figure 20c), 3D-20 (Figure 20d) and 3D-30 (Figure 20e) beams were 40.86, 65.90 and 78.16 mm, respectively. Van der Putten et al. [23] also reported larger chloride penetration depths for printed samples with longer PTs. Layer tearing, between layers 17 and 18, was also noted at the 3D-20 and 3D-30 beams. From Figure 20b–e, it can be seen that the chloride first penetrated through torn layers and CLs, followed by horizontal penetration through the concrete matrix, which is similar to the case of cracked concrete as reported by Paul et al. [7]. All the beams yielded similar uniform chloride penetration depths at the regions where no layers were damaged, either at the CL or torn layers. The depths varied from 4.65 to 5.17 mm.
3.4.2. Corrosion Readings
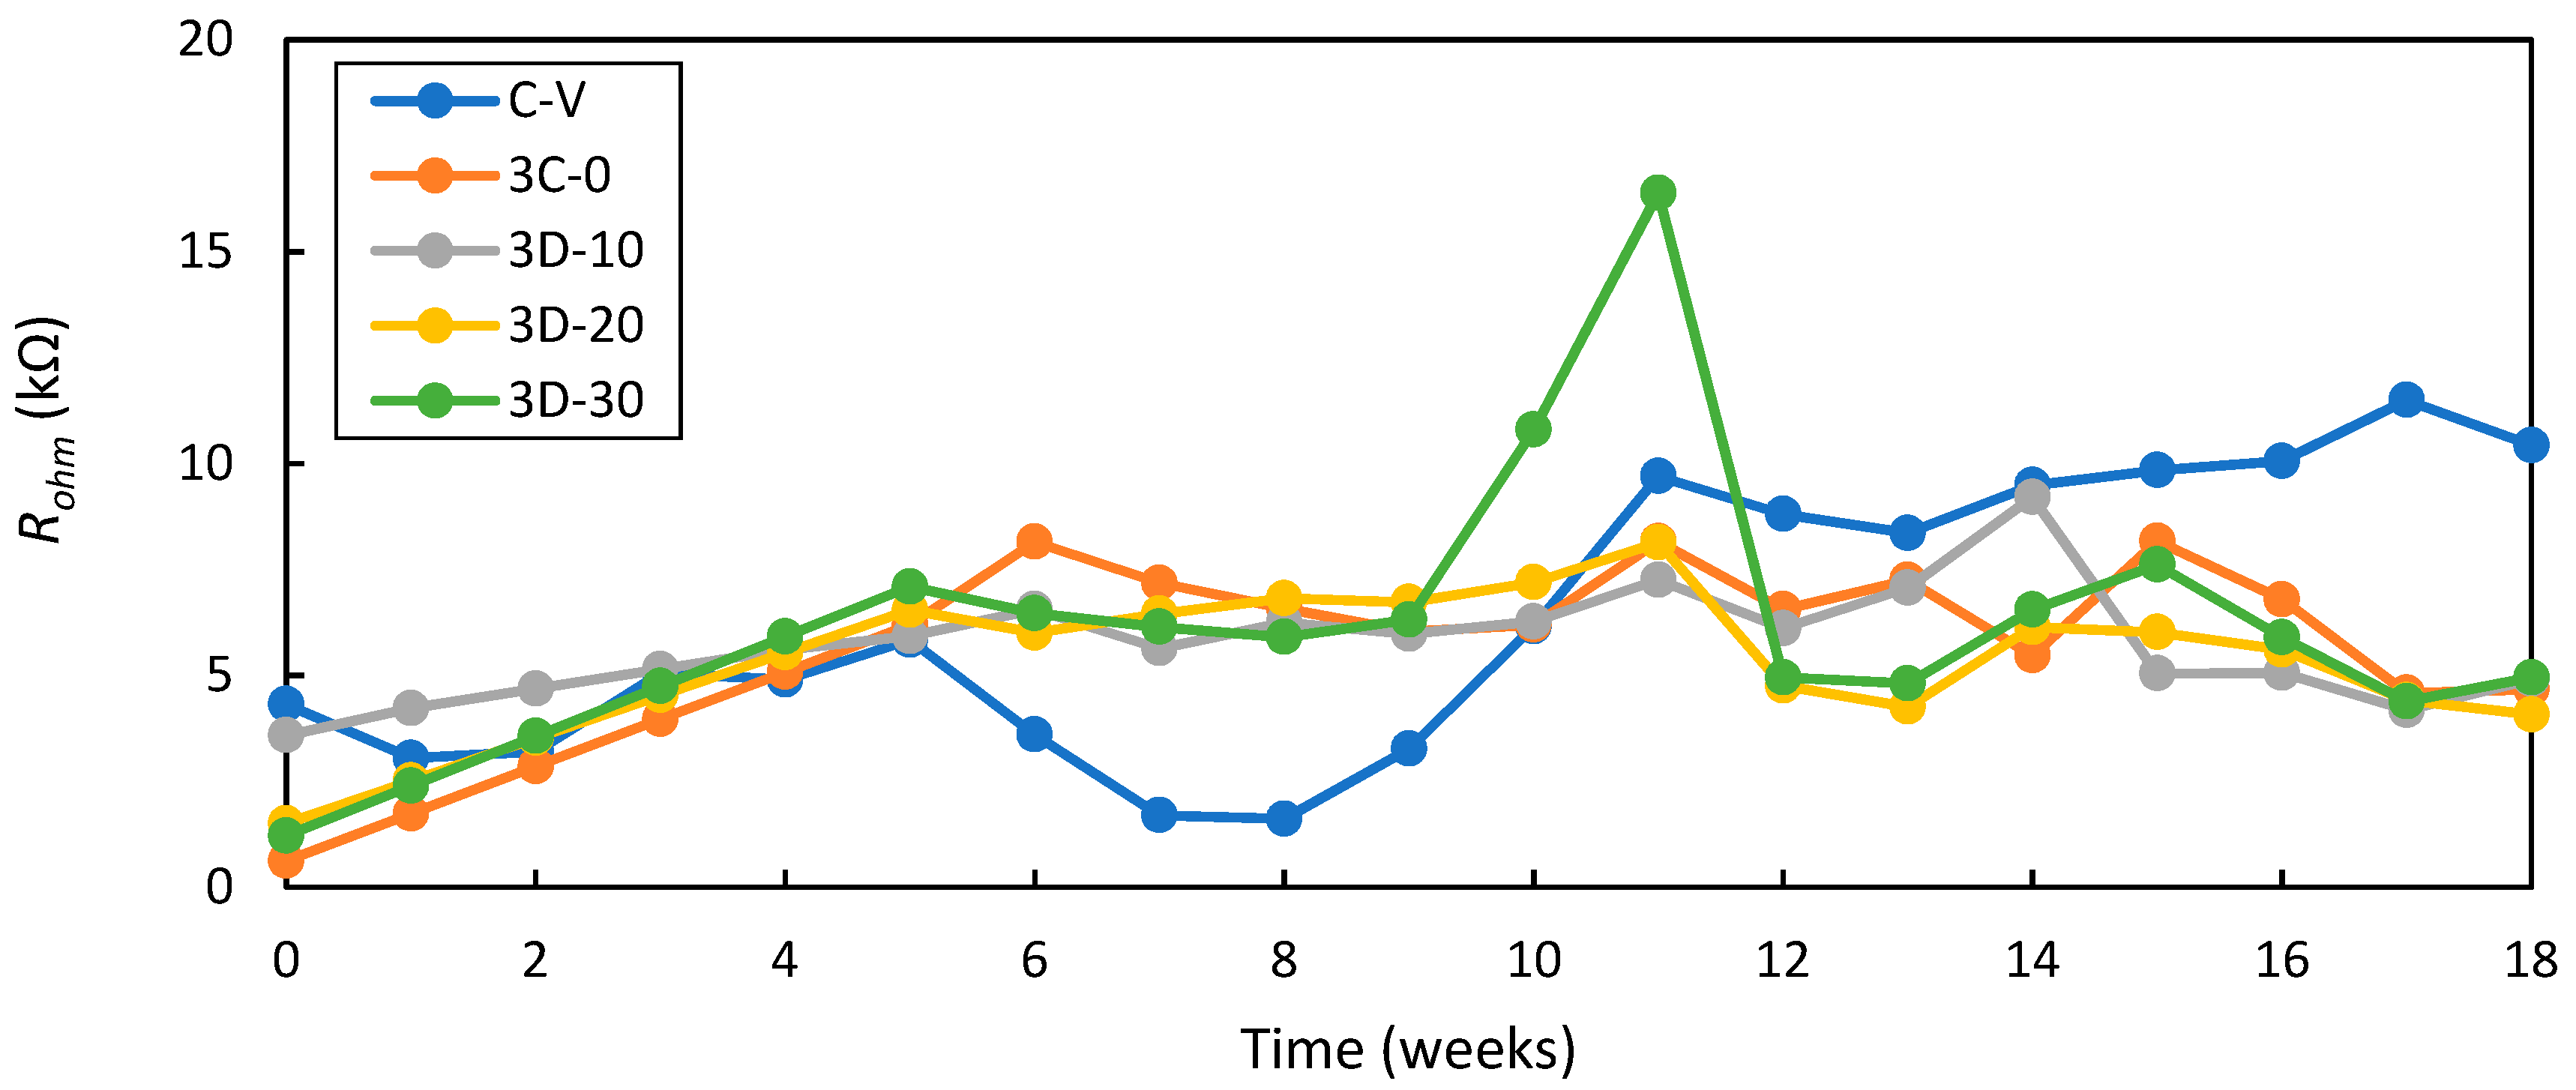
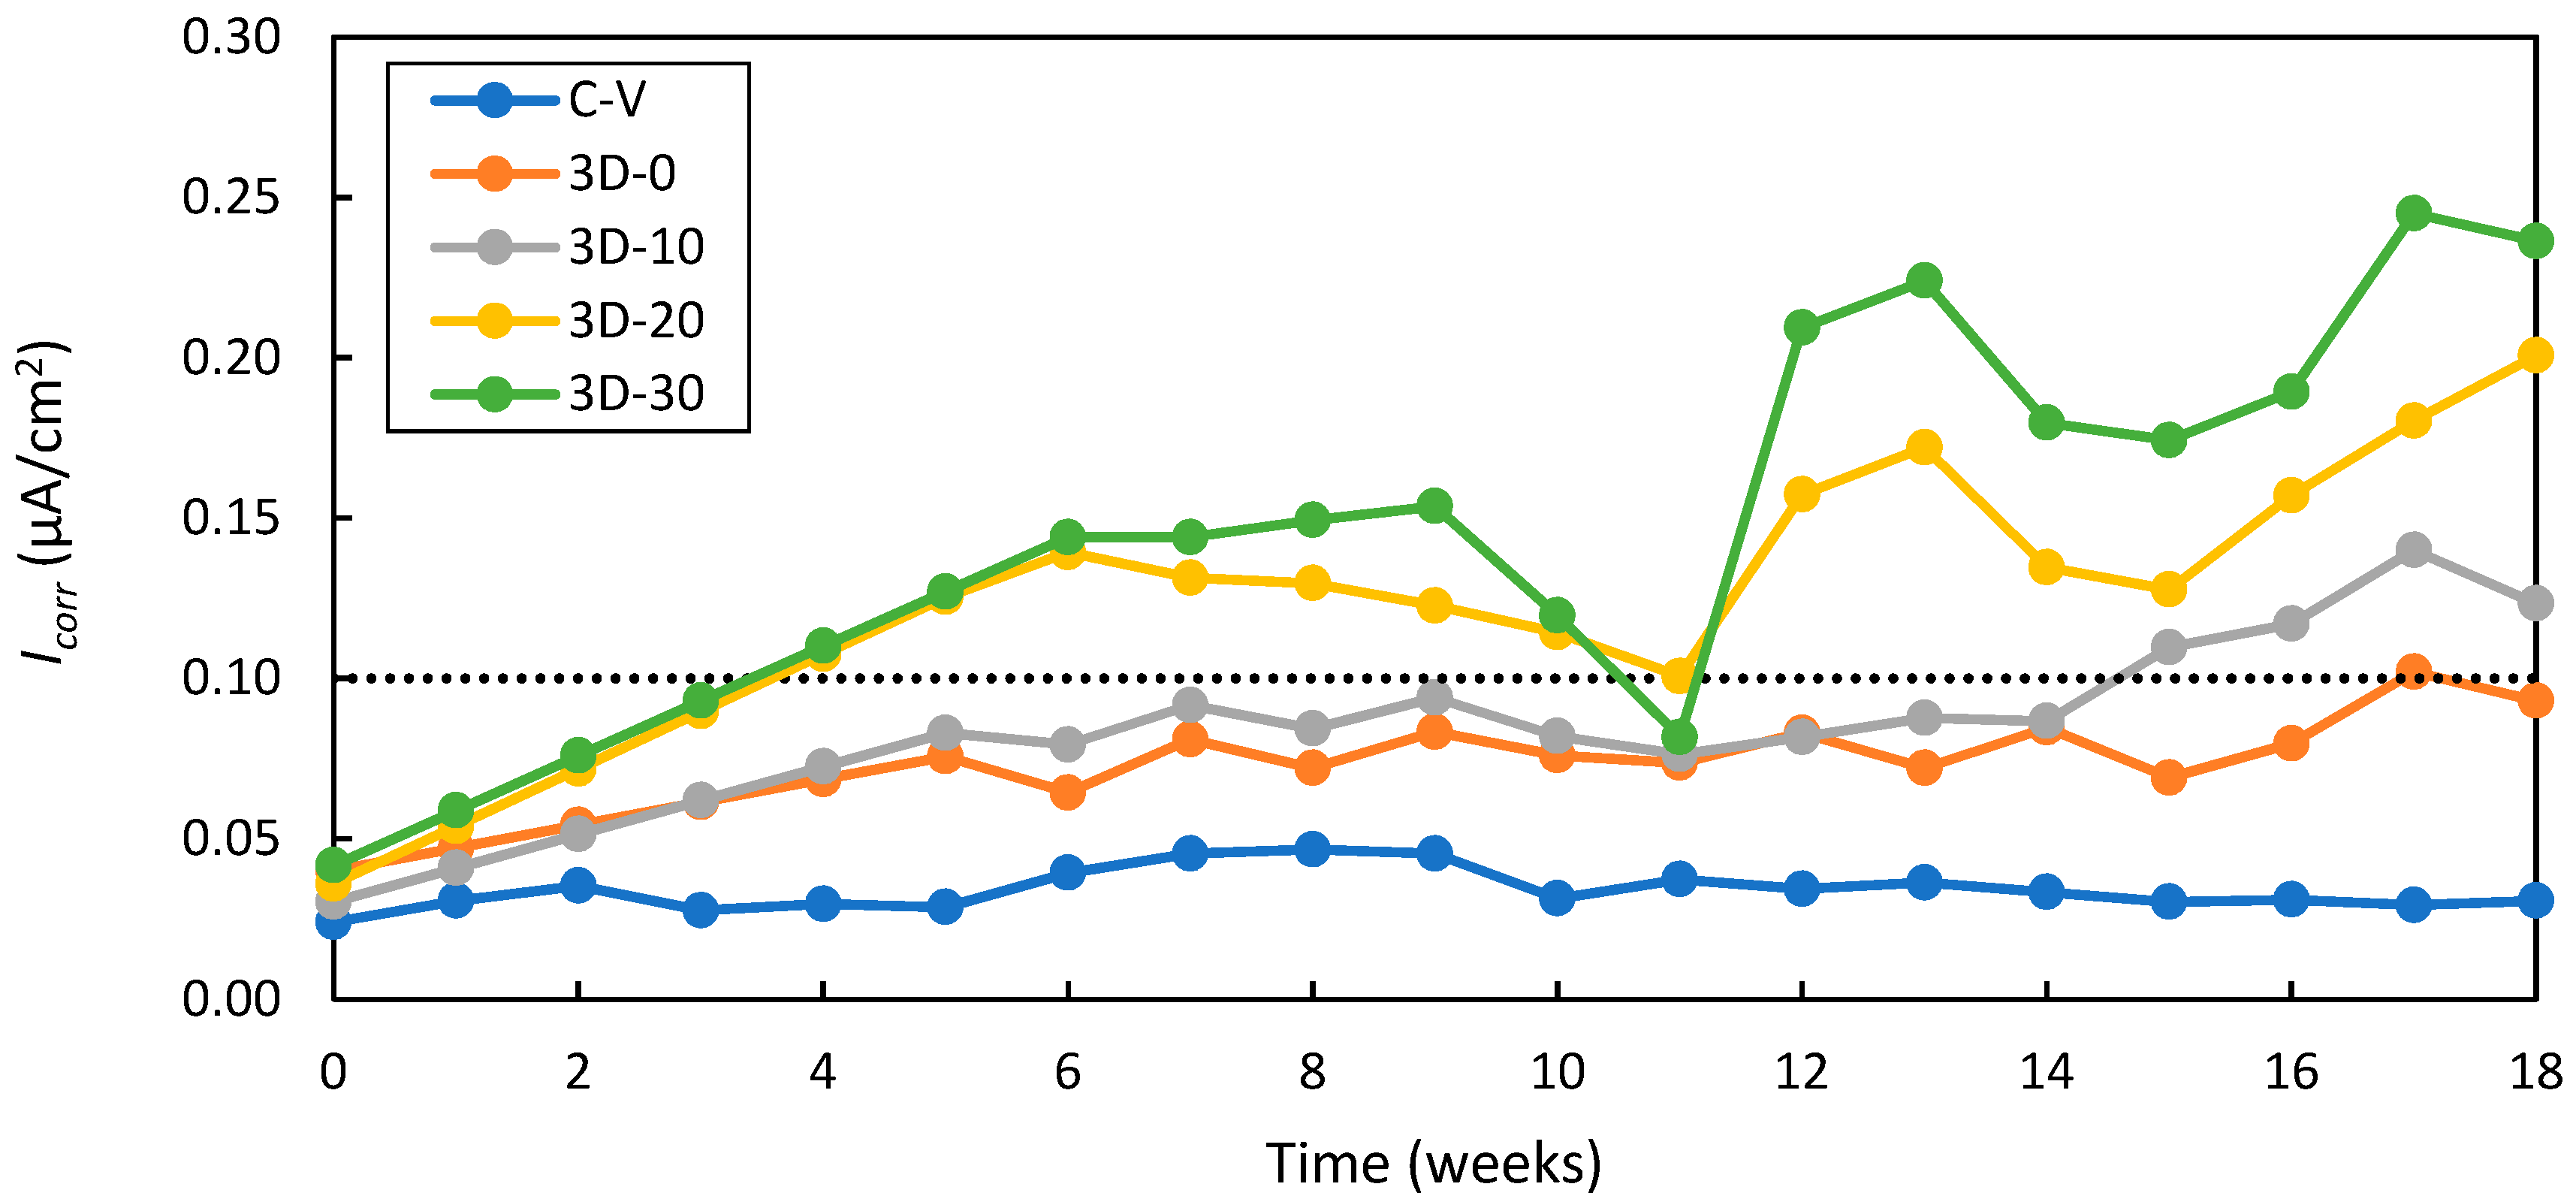
The Ecorr, Rohm and Icorr readings were taken during the duration of the 18-week exposure period. Only the Icorr results will be discussed in the paper; the Rohm results will be used to explain the fluctuations in Icorr readings. Additional information regarding the Ecorr, Rohm and Icorr results can be found in Malan [39]. The Rohm and Icorr time-development graphs are shown in Figure 21 and Figure 22, respectively. The dotted line in Figure 22 represents the transition from passive to active corrosion (0.1 µA/cm2) [40]. GECOR 10 measurements during weeks 1 to 4 could not be taken for the printed beams; thus, the values used in the graphs for weeks 1 to 4 were interpolated linearly using the Rohm and Icorr values before the test started (week 0) and in week 5. From Figure 21 and Figure 22, it can be seen that the Icorr is highly influenced by the Rohm owing to the high resistivity nature of blended cements. The increase in Icorr readings correspond well with a decrease in Rohm and vice-versa. The concrete resistivity has a greater impact on the Icorr readings than the oxygen availability, since all beams have a 20 mm cover and very low k at uncracked regions, the regions through which the oxygen for the cathodic reaction will be supplied [4,6].
3.4.3. Effect of the Printed Beams on the Time to Corrosion Initiation (ti)
The characteristics of the printed beams had an extensive impact on the ti, referring to the torn layer and the CL (Figure 22), compared to the C-V beams, which were still in a passive state of corrosion after the 18-weeks of CIC testing. The torn layer resulted in a premature ti of 17 weeks for the 3D-0 beams. The inclusion of PT also resulted in a reduction in ti’s when compared to the C-V and 3D-0 beams. The 3D-10, 3D-20 and 3D-30 beams yielded ti’s of 15, 5 and 5 weeks, respectively. Both the 3D-20 and 3D-30 beams could have reached an active corrosion state earlier than five weeks, but this could not be established due to not being able to take measurements.
The chloride penetration results discussed in 3.4.1 show that larger PTs result in deeper chloride penetration at the CL and at the torn layers. The LOF at these layers act as ingress pathways, allowing chlorides to reach the depth of the steel rods faster, reaching the chloride threshold quicker, and thus breaking down the passive protective layer and decreasing the ti. The C-V beams have randomly distributed voids compared to the interconnected pores of the printed beams. They are also less permeable and have lower porosity compared to the printed samples, which slows down chloride penetration and increases the ti (refer to the DI results in 3.2.4). The chloride penetration results in 3.4.1 also show that the chlorides are yet to reach the steel rods, thus explaining why the beams are still in a passive state of corrosion. Otieno et al. [6] also found that cracks reduced the ti and that cracked concrete reaches ti quicker compared to uncracked concrete. There is a good correlation between the ti and the σ results previously discussed in 3.2.4, showing that samples with higher σ values reach corrosion initiation more quickly.
3.4.4. Effect of the Printed Beams on the Overall Icorr
The characteristics of the printed beams had an extensive impact on the Icorr readings referring to the torn layer and the CL (Figure 22), compared to the C-V, which never reached an active stage of corrosion. The 3D-0 beams yielded higher Icorr readings compared to the C-V beams, owing the torn layer of the 3D-0 beam and the dense matrix combined with randomly distributed pores of the C-V beams. Figure 22 shows that an increase in PT results in an increase in Icorr. Longer PTs induces greater LOF, allowing chlorides to reach the reinforcement easier, similar to the function of cracks in cast concrete. The week 14 to 18 average Icorr values for the C-V, 3D-0, 3D-10, 3D-20 and 3D-30 beams were 0.031, 0.086, 0.115, 0.160 and 0.205 µA/cm2, respectively. Scott and Alexander [4], and Otieno et al. [5,6] all reported that an increase in crack width resulted in an increase in Icorr values. Otieno et al. [5,6] also reported that uncracked beams yielded lower Icorr readings compared to cracked beams.
3.4.5. Corrosion Inspection
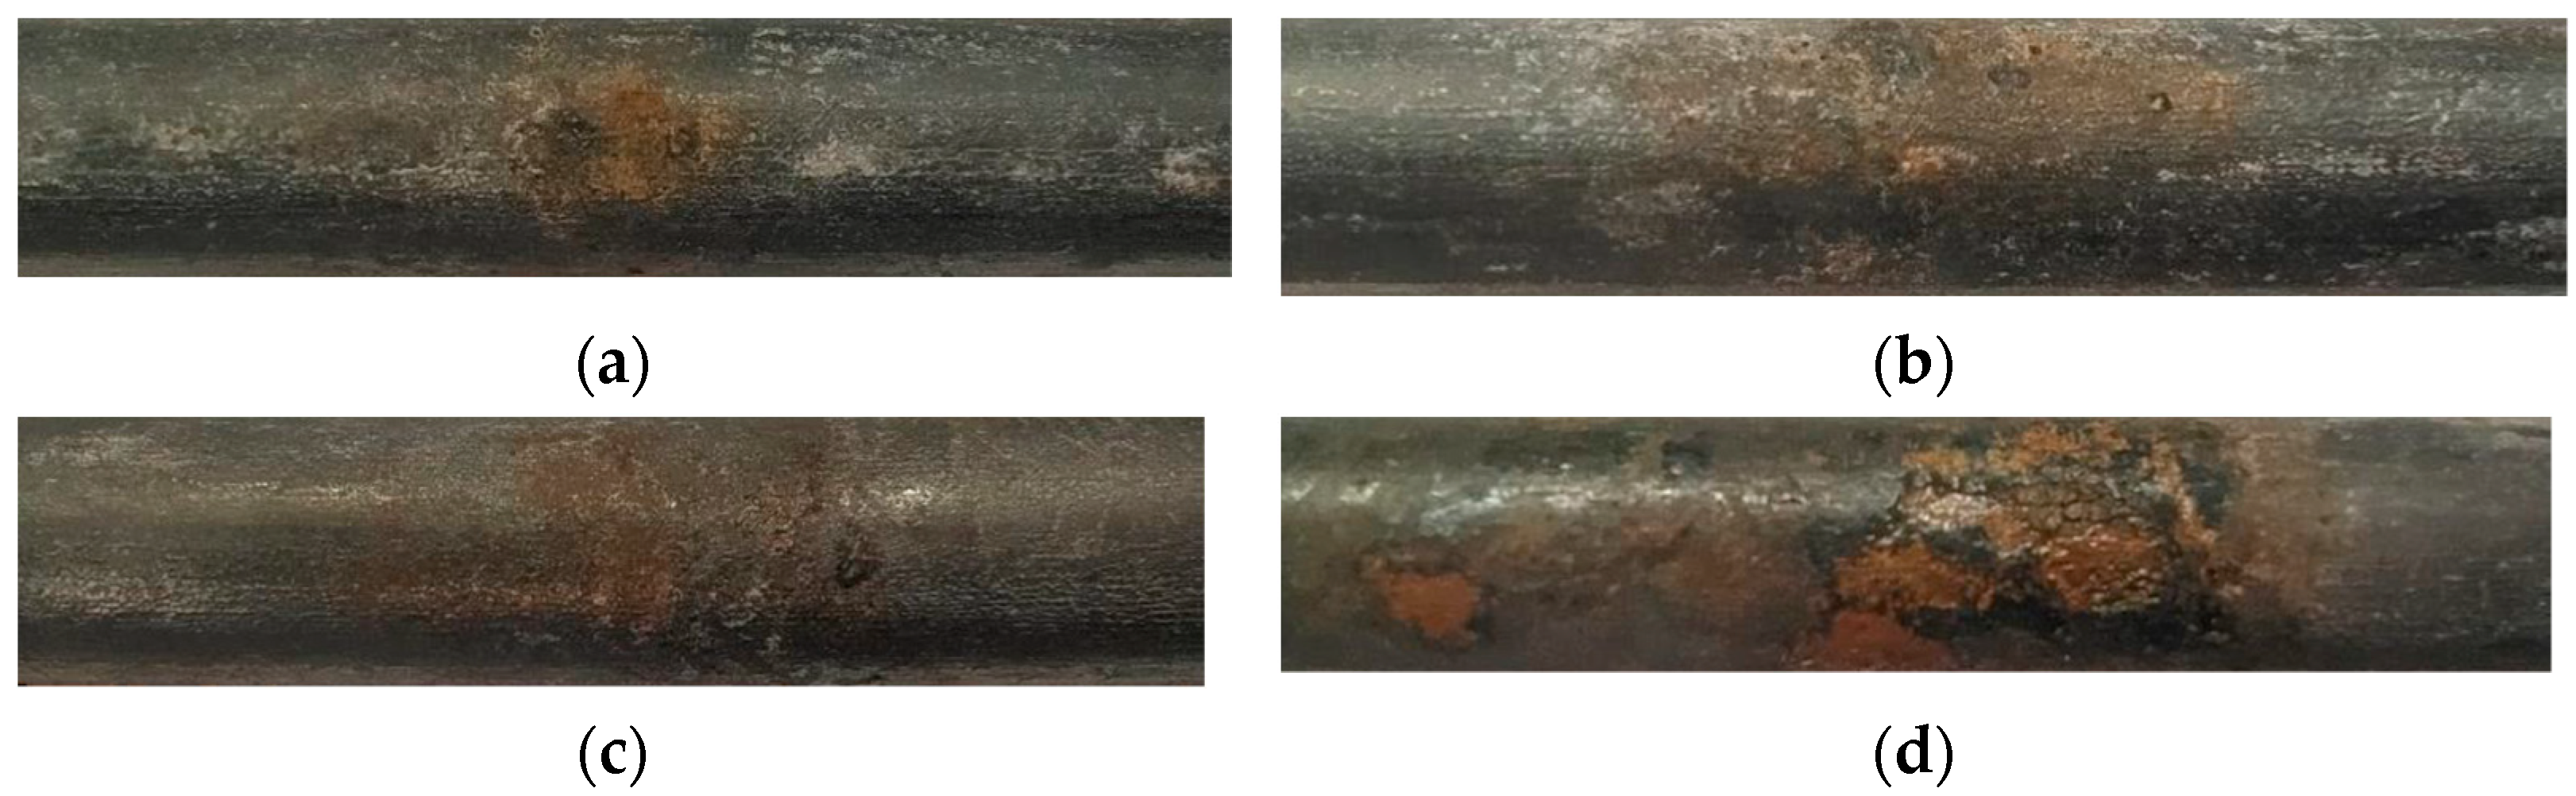
Upon inspection, the C-V steel rods did not show any sign of corrosion, which is to be expected since the chloride never reached the reinforcement level and were always in a passive estate of corrosion. All the printed beams experienced localized attack (pitting corrosion), shown in Figure 23. The pit formation was located at the torn layer and CL of the printed beams and the pitting corrosion damage increased with an increase in PT due to greater Icorr readings. In conjunction with chloride penetration profiles (Figure 20), the corrosion activity corresponds to the Region 3 crack pattern, as explained by van Zijl and Boshoff [41]. Region 3 corresponds to a region where the crack spacings are much larger than the chloride penetration width and the reinforcement has a high cathode to anode size ratio that results in pitting corroding, with macrocell corrosion being the dominant corrosion mechanism. The GECOR 10 instrument assumes and measures uniform corrosion and needs to multiply by a pitting factor in order to obtain the correct Icorr values if pitting occurs. Bezuidenhout and van Zijl [8] used a pitting factor ranging from 4 to as high as 10 depending on the level of distributed corrosion. With pitting corrosion being the dominant corrosion type present at the printed beams, the Icorr values measured is underestimated.
3.5. Relationship between Mechanical Strength and Durability Performance
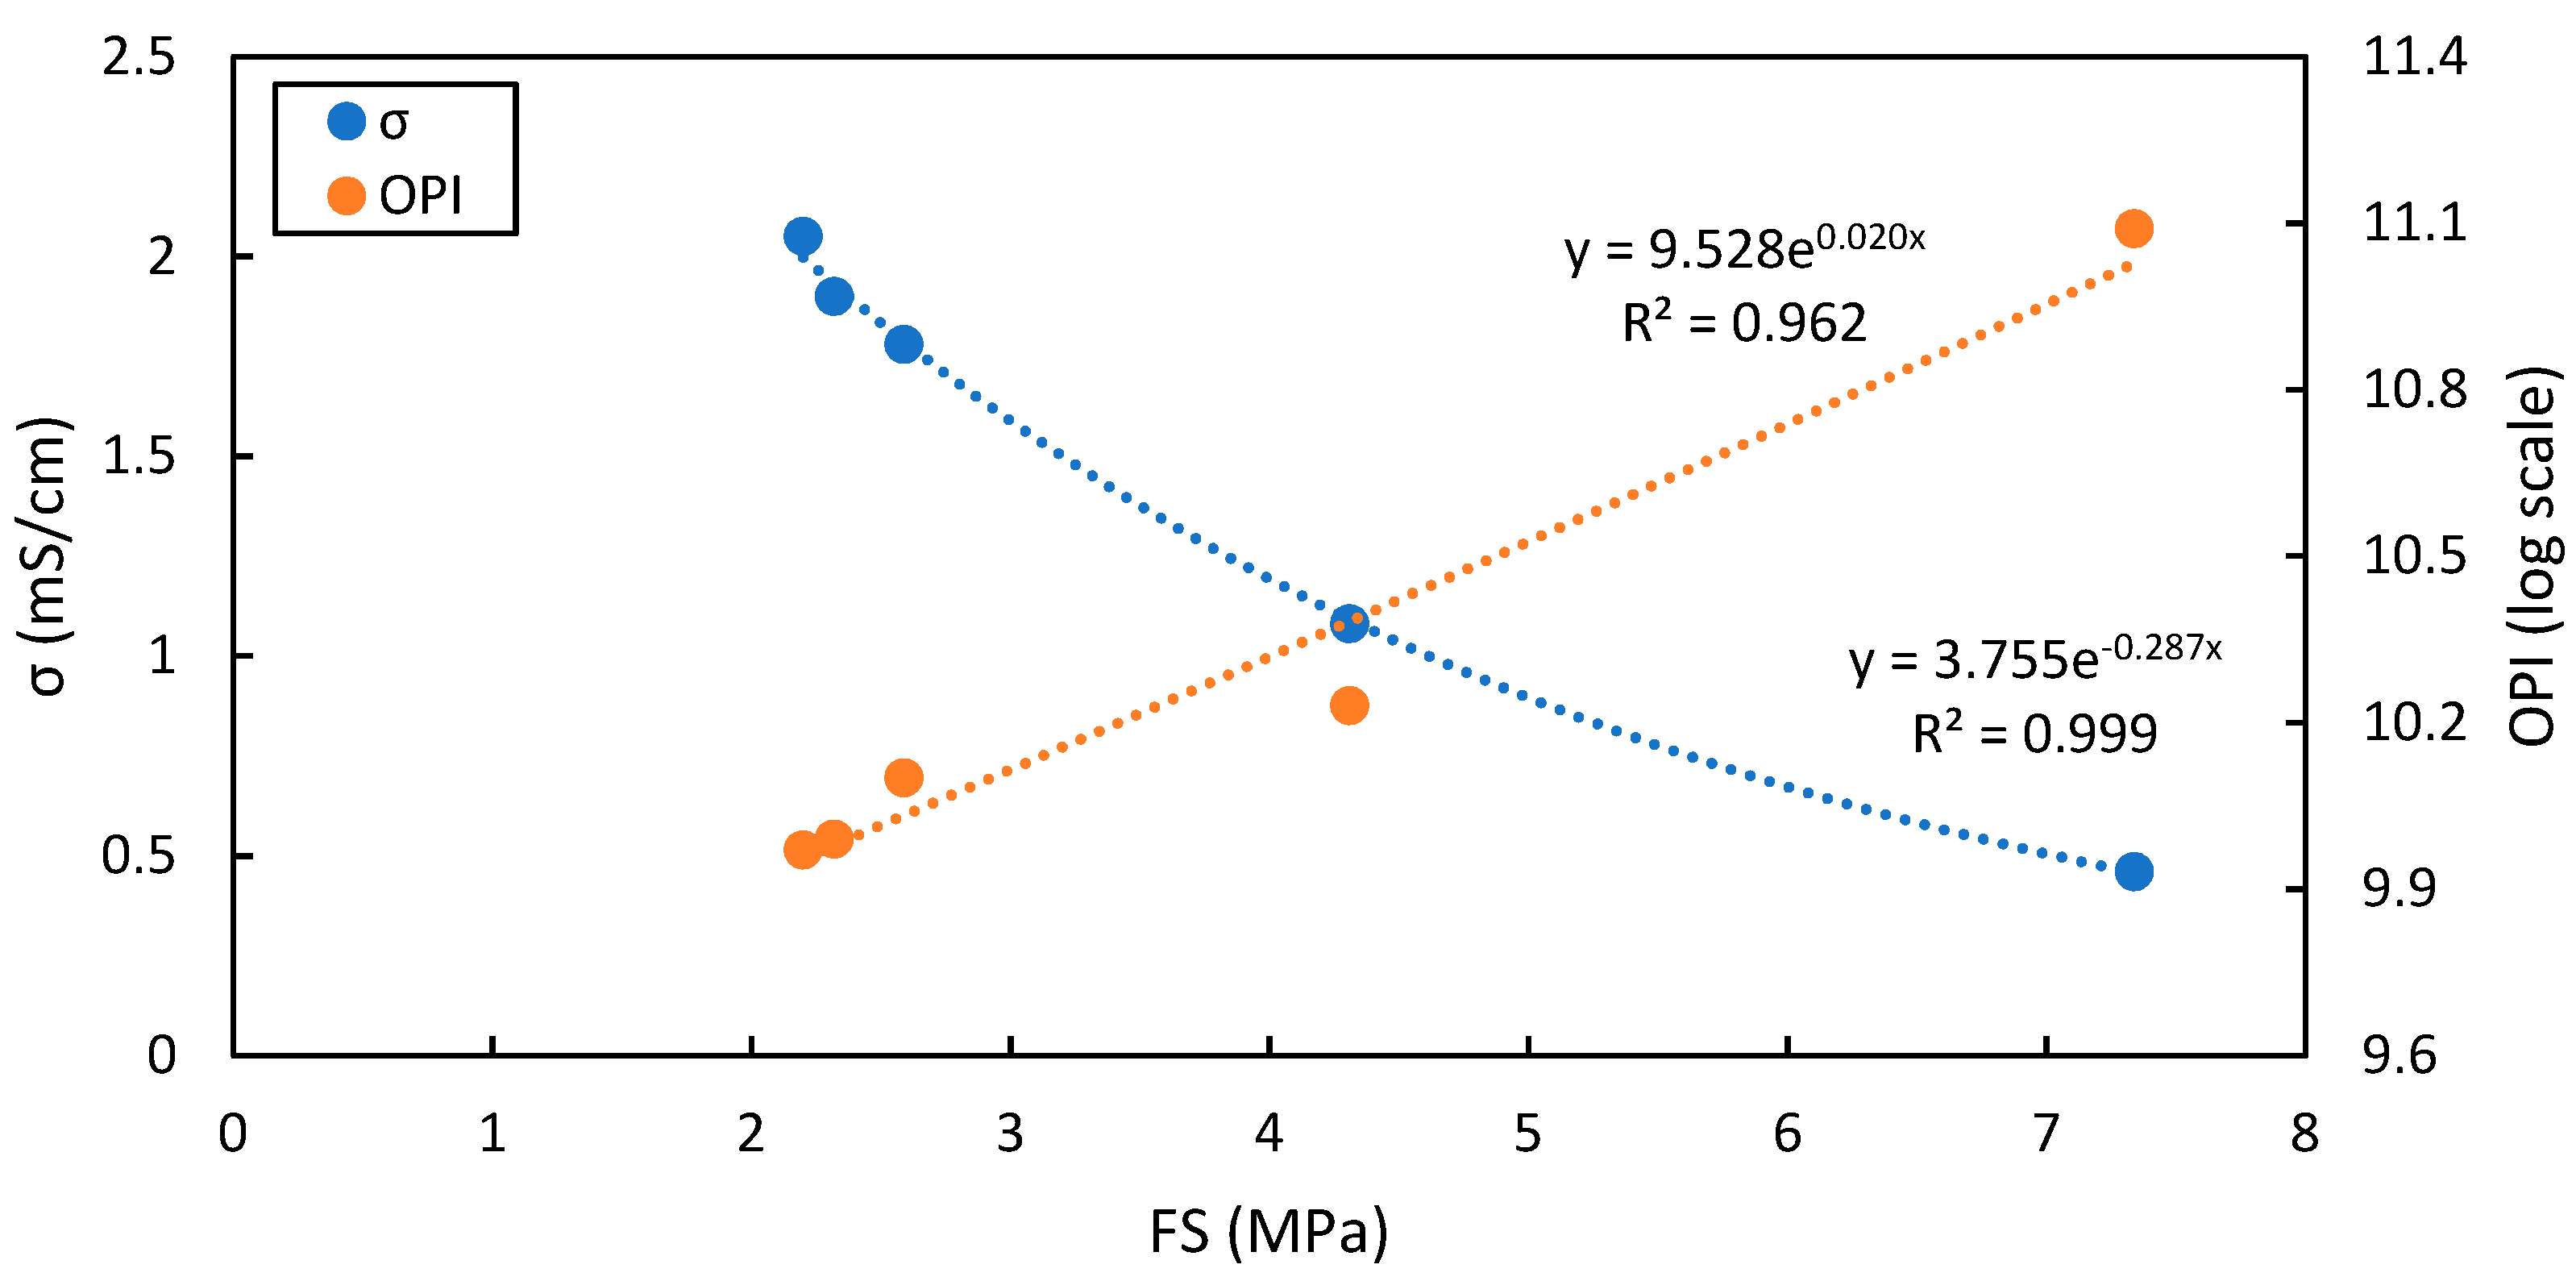
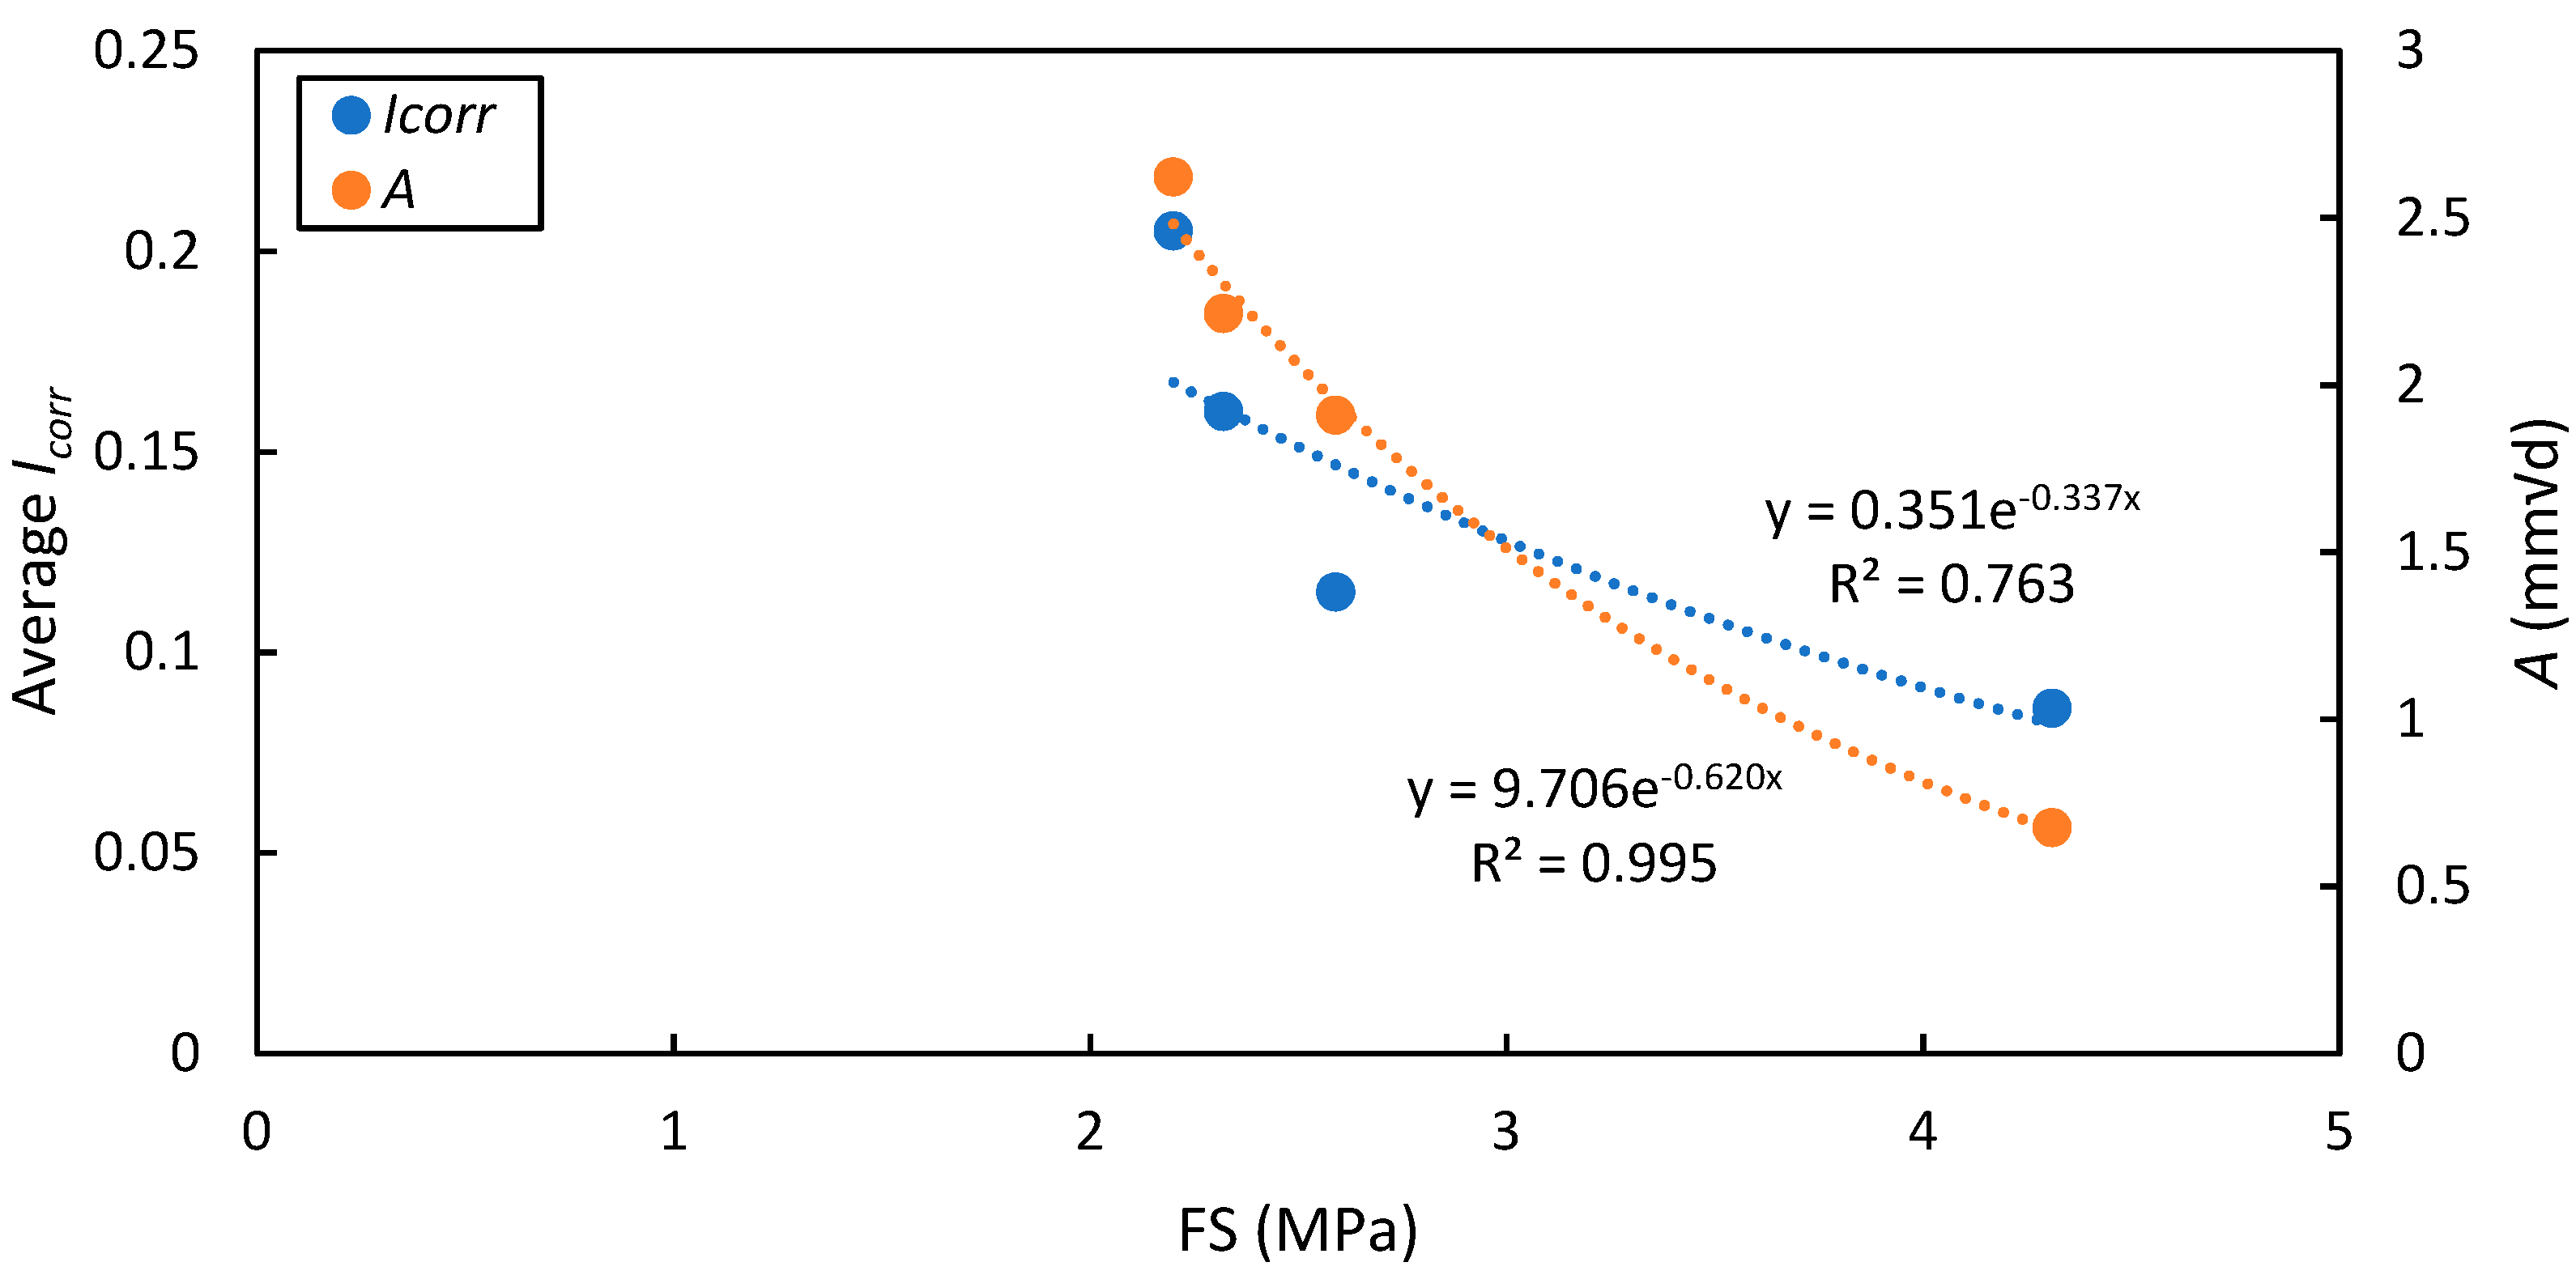
The mechanical performance, referring to IBS, is not a precise measurement of the concrete’s potential durability potential, but it does give an indication of the LOF present at the IRs that can result in durability issues. Figure 24 illustrates the correlation between the FS and the DI performance (σ and OPI) and considers all the printed samples and C-P. Good exponential relationships between the FS and the σ and OPI are established and yields a R2 of 0.998 and 0.963, thus indicating that a reduction in FS results in a reduction in DI results. Figure 25 shows the relationship between the FS and the CCI (average Icorr from week 14 to 18) and ACC (A) testing results. An exponential relationship (R2 of 0.987) between the FS and A is established, showing that a reduction in FS results in a greater A. An exponential relationship (R2 of 0.713) between the FS and Icorr is established, which shows that lower FS yields larger Icorr values. It should be noted that the Icorr values obtained from the 3D-0 beams were influenced by the torn layer, this leading to premature ti. If the printed element did not have torn layers, the recorded Icorr values would be lower and yield a different trend.
3.6. Recommended Pass Time
A pass time of less than ten minutes is recommended for the 3DCP material and printer parameters used. This is based on the observations for the printed case with a 60 s pass time compared with 11-, 21- and 31-min pass times. The mechanical performance (IBS) reduced with 39.9% when a 10 min PT was introduced. In the case of the Durability Index tests, the OPI remained in the excellent durability class up to a PT of 10 min, S remained in the excellent class for all PTs, and σ remained in the good durability class for a PT of 0 min, i.e., an actual 1 min pass time. The carbonation depth at the IRs remained within reasonable agreement of the average carbonation depth of the cast samples compacted with the vibration table (Figure 17). Uniform chloride penetration was observed, as opposed to chloride ingress up to and beyond the steel reinforcement, after 18 weeks of chloride exposure, i.e., 9 cyclic wetting and drying cycles (Figure 20). The Icorr measurements remained below 0.1 µA/cm2, i.e., a passive state of corrosion, for PTs below 10 min (Figure 22). The results underline the importance of interfacial improvement in 3DCP for mechanical resistance and durability performance. This remains the focus of the authors in continued work on physical, chemical and interlocking interfacial improvement.
4. Conclusions
The purpose of this study was to investigate the durability performance of 3D printed concrete with respect to concrete carbonation and chloride-induced corrosion. The effect of the IR and CL induced by several PTs were quantified and compared to cast concrete consisting of the same mix design. The following conclusions are drawn:
- The concrete mixes of high shearing strength and viscosity appropriate for 3D concrete printing used here are not well suited for standard casting and vibration for compaction. A poker vibrator was required to yield appropriately dense cubes for fair comparison of durability characteristics. Cubes compacted on a standard vibration table yielded comparatively porous matrices and lower durability indices (OPI, WSI and CCI).
- The interconnected pores in the interfacial regions of printed samples contribute to lower mechanical and durability performance compared to reference cast concrete. The printed samples yielded lower flexural strength and increased permeability (OPI), σ, n (WSI and CCI) and carbonation depths. Defects in the form of torn layers compromised the durability of the printed samples and resulted in premature corrosion initiation and greater Icorr. The regions that were not compromised by torn layers yielded uniform chloride penetration depths across the exposed area, with similar chloride penetration profiles and penetration depths compared to the cast beams.
- The increase in pass time reduces the mechanical and durability performance of printed specimens as a result of increased moisture evaporation and thixotropy, resulting in a more permeable and penetrable interfaces. The increase in PT resulted in lower flexural strength and increased permeability (OPI), σ, n (WSI results), carbonation depths, chloride penetration depths and Icorr measurements. No correlation between the S and n (CCI results) was found and the results were similar for all pass times.
- The CL induced by the pass time functions in the same manner as a crack in conventional concrete. The contaminants, referring to chlorides and CO2, first penetrate the cracks and then the concrete matrix via the crack faces. A longer pass time results in increased carbonation depths and corrosion rates, similar to cracked concrete where wider cracks result in larger carbonation depths and greater corrosion rate readings. Chloride penetrated deeper in the CL compared to the other 3DCP interfaces where no added pass time was applied, resulting in a localized, pitting corrosion at the position of the CL, ascribed to dominant macrocell corrosion.
- The increased surface area of the undulating layered face of the 3D concrete printed element, owing to the inherent nature of using a circular nozzle, can result in greater carbonation depths in the intralayer, despite the higher permeability in the IR.
- Layer tearing acts as ingress pathways for chlorides and can lead to premature corrosion initiation.
- Good correlations between the mechanical performance (flexural strength) and the durability performance (OPI, σ, ACC and CIC) have been established. The results show that a decrease in IBS indicates a decrease in durability performance. Even though the mechanical performance is not a direct measurement of potential durability performance, it does give a clear indication that the LOF at the IR can result in durability issues.
Author Contributions
Conceptualization, J.D.M., A.S.v.R. and G.P.A.G.v.Z.; data curation, J.D.M.; formal analysis, J.D.M.; funding acquisition, G.P.A.G.v.Z.; investigation, J.D.M.; methodology, J.D.M.; project administration, G.P.A.G.v.Z.; supervision, A.S.v.R. and G.P.A.G.v.Z.; validation, A.S.v.R. and G.P.A.G.v.Z.; visualization, J.D.M.; writing—original draft, J.D.M.; writing—review and editing, A.S.v.R. and G.P.A.G.v.Z. All authors have read and agreed to the published version of the manuscript.
Funding
This research received no external funding.
Data Availability Statement
The data presented in the paper, including an additional and complete dataset, can be found at Stellenbosch University’s research data basis, SUNScholar (https://scholar.sun.ac.za/) (Accessed: 20 December 2021). The master’s thesis is titled “Chloride induced corrosion and concrete carbonation of 3D printed concrete with reinforced connections” by J.D.M. Alternatively, contact the corresponding author, G.P.A.G.v.Z.
Acknowledgments
The authors would like to thank the University of Cape Town Concrete Material and Structural Engineering laboratory for their assistance with the durability index testing. The materials used in this study was provided by PPC, FerroAtlantica, Ash Resources, Chryso, Sika and SAPY.
Conflicts of Interest
The authors declare that they have no known competing financial interest or personal relationships that could have appeared to influence the work reported in this paper.
References
- Alexander, M.; Beushausen, H. Durability, service life prediction, and modelling for reinforced concrete structures—Review and critique. Cem. Concr. Res. 2019, 122, 17–29. [Google Scholar] [CrossRef]
- Richardson, M.G. Fundamentals of Durable Reinforced Concrete; Bentur, A., Mindess, S., Eds.; Spon Press: London, UK; New York, NY, USA, 2002. [Google Scholar]
- BS EN 206-1. Concrete. Specification, Performance, Production and Conformity; British Standard Institution: London, UK, 2000.
- Scott, A.; Alexander, M.G. The influence of binder type, cracking and cover on corrosion rates of steel in chloride-contaminated concrete. Mag. Concr. Res. 2007, 59, 495–505. [Google Scholar] [CrossRef]
- Otieno, M.; Beushausen, H.; Alexander, M. Chloride-induced corrosion of steel in cracked concrete—Part I: Experimental studies under accelerated and natural marine environments. Cem. Concr. Res. 2016, 79, 373–385. [Google Scholar] [CrossRef]
- Otieno, M.; Alexander, M.; Beushausen, H.-D. Corrosion in cracked and uncracked concrete—Influence of crack width, concrete quality and crack reopening. Mag. Concr. Res. 2010, 62, 393–404. [Google Scholar] [CrossRef]
- Paul, S.C.; van Zijl, G.P.; Babafemi, A.J.; Tan, M.J. Chloride ingress in cracked and uncracked SHCC under cyclic wetting-drying exposure. Constr. Build. Mater. 2016, 114, 232–240. [Google Scholar] [CrossRef]
- Bezuidenhout, S.R.; Van Zijl, G.P. Corrosion propagation in cracked reinforced concrete, toward determining residual service life. Struct. Concr. 2019, 20, 2183–2193. [Google Scholar] [CrossRef]
- Wang, T.; Nicolas, R.S.; Kashani, A.; Ngo, T. Sustainable utilisation of low-grade and contaminated waste glass fines as a partial sand replacement in structural concrete. Case Stud. Constr. Mater. 2021, 16, e00794. [Google Scholar] [CrossRef]
- Papadakis, V.G.; Vayenas, C.G.; Fardis, M.N. Fundamental Modeling and Experimental Investigation of Concrete Carbonation. ACI Mater. J. 1991, 88, 363–373. [Google Scholar] [CrossRef]
- Lu, C.-F.; Wang, W.; Li, Q.-T.; Hao, M.; Xu, Y. Effects of micro-environmental climate on the carbonation depth and the pH value in fly ash concrete. J. Clean. Prod. 2018, 181, 309–317. [Google Scholar] [CrossRef]
- Salvoldi, B.G.; Beushausen, H.; Alexander, M.G. Oxygen permeability of concrete and its relation to carbonation. Constr. Build. Mater. 2015, 85, 30–37. [Google Scholar] [CrossRef]
- Younsi, A.; Turcry, P.; Rozière, E.; Aït-Mokhtar, A.; Loukili, A. Performance-based design and carbonation of concrete with high fly ash content. Cem. Concr. Compos. 2011, 33, 993–1000. [Google Scholar] [CrossRef] [Green Version]
- Carević, V.; Ignjatović, I. Influence of loading cracks on the carbonation resistance of RC elements. Constr. Build. Mater. 2019, 227, 116583. [Google Scholar] [CrossRef]
- Thiyagarajan, K.; Kodagoda, S.; Ranasinghe, R.; Vitanage, D.; Iori, G. Robust Sensor Suite Combined with Predictive Analytics Enabled Anomaly Detection Model for Smart Monitoring of Concrete Sewer Pipe Surface Moisture Conditions. IEEE Sens. J. 2020, 20, 8232–8243. [Google Scholar] [CrossRef]
- Ams, M.; Ha, P.; Taheri, S.; Clark, S.; Withford, M.J.; Bustamante, H.; Gonzalez, J.; Vorreiter, L. Fibre optic temperature and humidity sensors for harsh wastewater environments. In Proceedings of the 2017 Eleventh International Conference on Sensing Technology (ICST), IEEE, Sydney, Australia, 4–6 December 2017; pp. 1–3. [Google Scholar]
- Stefanoni, M.; Angst, U.; Elsener, B. Corrosion Challenges and Opportunities in Digital Fabrication of Reinforced Concrete. RILEM Bookseries 2018, 19, 225–233. [Google Scholar] [CrossRef]
- Kim, D.; Lee, S.; Seo, H.; Choi, D. An Experimental Study on the Mechanical Properties of Concrete at Elevated Temperatures. J. Korean Soc. Hazard Mitig. 2018, 18, 127–135. [Google Scholar] [CrossRef]
- Kruger, J.; van Zijl, G. A compendious review on lack-of-fusion in digital concrete fabrication. Addit. Manuf. 2021, 37, 101654. [Google Scholar] [CrossRef]
- Kruger, J.; du Plessis, A.; van Zijl, G. An investigation into the porosity of extrusion-based 3D printed concrete. Addit. Manuf. 2021, 37, 101740. [Google Scholar] [CrossRef]
- Mohan, M.K.; Rahul, A.; De Schutter, G.; Van Tittelboom, K. Extrusion-based concrete 3D printing from a material perspective: A state-of-the-art review. Cem. Concr. Compos. 2021, 115, 103855. [Google Scholar] [CrossRef]
- Bran Anleu, P.C. Quantitative Micro XRF Mapping of Chlorides: Possibilities, Limitations, and Applications, from Cement to Digital Concrete. Doctoral Thesis, ETH Zurich, Zurich, Switzerland, 2018. [Google Scholar] [CrossRef]
- Van Der Putten, J.; De Volder, M.; Heede, P.V.D.; De Schutter, G.; Van Tittelboom, K. 3D Printing of Concrete: The Influence on Chloride Penetration. RILEM Bookseries 2020, 28, 500–507. [Google Scholar] [CrossRef]
- Wang, L.; Ma, H.; Li, Z.; Ma, G.; Guan, J. Cementitious composites blending with high belite sulfoaluminate and medium-heat Portland cements for largescale 3D printing. Addit. Manuf. 2021, 46, 102189. [Google Scholar] [CrossRef]
- Van Der Putten, J.; Azima, M.; Heede, P.V.D.; Van Mullem, T.; Snoeck, D.; Carminati, C.; Hovind, J.; Trtik, P.; De Schutter, G.; Van Tittelboom, K. Neutron radiography to study the water ingress via the interlayer of 3D printed cementitious materials for continuous layering. Constr. Build. Mater. 2020, 258, 119587. [Google Scholar] [CrossRef]
- Kruger, J.; Zeranka, S.; van Zijl, G. 3D concrete printing: A lower bound analytical model for buildability performance quantification. Autom. Constr. 2019, 106. [Google Scholar] [CrossRef]
- ASTM C230/C230M. Standard Specification for Flow Table for Use in Tests of Hydraulic Cement; American Society for Testing and Materials: West Conshohocken, PA, USA, 2014.
- Cho, S.; Kruger, J.; Bester, F.; Heever, M.V.D.; Van Rooyen, A.; Van Zijl, G. A Compendious Rheo-Mechanical Test for Printability Assessment of 3D Printable Concrete. In Proceedings of the RILEM Bookseries; Springer: Singapore, 2020; pp. 196–205. [Google Scholar]
- BS EN 196-1. Methods of Testing Cement. Part 1, Determination of Strength; British Standard Institution: London, UK, 2005.
- University of Cape Town; University of Witwatersrand. Durability Index Testing Procedure Manual; University of Cape Town: Cape Town, South Africa, 2018. [Google Scholar]
- BS 1881-210. BSI Standards Publication Testing Hardened Concrete Part 210: Determination of the Potential Carbonation Resistance of Method; BSI Standards Limited: London, UK, 2013.
- Mackechnie, J.R. Predictions of Reinforced Concrete Durability in the Marine Environment—Research Monograph 1; University of Cape Town, Department of Civil Engineering: Cape Town, South Africa, 2001. [Google Scholar]
- NT Build 443. Concrete, Hardend: Accelerated Chloride Penetration; NORDTEST: Espoo, Finland, 1995.
- Nerella, V.N.; Hempel, S.; Mechtcherine, V. Effects of layer-interface properties on mechanical performance of concrete elements produced by extrusion-based 3D-printing. Constr. Build. Mater. 2019, 205, 586–601. [Google Scholar] [CrossRef]
- Van Der Putten, J.; Deprez, M.; Cnudde, V.; De Schutter, G.; Van Tittelboom, K. Microstructural Characterization of 3D Printed Cementitious Materials. Materials 2019, 12, 2993. [Google Scholar] [CrossRef] [PubMed] [Green Version]
- Moelich, G.; Kruger, P.; Combrinck, R. The effect of restrained early age shrinkage on the interlayer bond and durability of 3D printed concrete. J. Build. Eng. 2021, 43, 102857. [Google Scholar] [CrossRef]
- Alexander, M.G.; Mackechnie, J.R.; Ballim, Y. Guide to the Use of Durability Indexes for Achieving Durability in Concrete Structures—Research Monograph 2; University of Cape Town, Department of Civil Engineering: Cape Town, South Africa, 1999. [Google Scholar]
- Otieno, M.; Ikotun, J.; Ballim, Y. Experimental investigations on the effect of concrete quality, exposure conditions and duration of initial moist curing on carbonation rate in concretes exposed to urban, inland environment. Constr. Build. Mater. 2020, 246, 118443. [Google Scholar] [CrossRef]
- Malan, J.D. Chloride Induced Corrosion and Concrete Carbonation of 3D Printed Concrete with Reinforced Connections. Master’s Thesis, Stellenbosch University, Stellenbosch, South Africa, 2022. [Google Scholar]
- Andrade, C.; Alonso, C. On-site measurements of corrosion rate of reinforcements. Constr. Build. Mater. 2001, 15, 141–145. [Google Scholar] [CrossRef]
- van Zijl, G.P.A.G.; Boshoff, W.P. The Effect of Crack Patterns on the Corrosion of Steel Reinforced SHCC. In Strain-Hardening Cement-Based Composites SHCC4; RILEM Bookseries; Springer: Dordrecht, The Netherlands, 2018; Volume 15, pp. 565–572. [Google Scholar] [CrossRef]
Figure 1.
Experimental variables.

Figure 2.
Stellenbosch University Gantry type 3D concrete printer of 1 m3 build volume.

Figure 3.
(a) Extraction of the 3D printed flexural strength sample (blue) with the CL indicated in red. (b) Four-point bending in the O-III orientation to determine the IBS.
Figure 3.
(a) Extraction of the 3D printed flexural strength sample (blue) with the CL indicated in red. (b) Four-point bending in the O-III orientation to determine the IBS.

Figure 4.
Extraction of 70 mm diameter DI test discs from (a) printed samples with the CL indicated in thick red, and (b) reference cast samples. Both printed and cast samples were saw-cut to 30 mm thickness, as indicated by thin red lines.
Figure 4.
Extraction of 70 mm diameter DI test discs from (a) printed samples with the CL indicated in thick red, and (b) reference cast samples. Both printed and cast samples were saw-cut to 30 mm thickness, as indicated by thin red lines.

Figure 5.
(a) Extraction of a 100 mm printed ACC specimen (CL indicated in red) producing (b) a printed cube, compared with (c) a reference cast specimen.
Figure 5.
(a) Extraction of a 100 mm printed ACC specimen (CL indicated in red) producing (b) a printed cube, compared with (c) a reference cast specimen.

Figure 6.
Carbonation depth measurement points (black arrows) for the (a) cast and (b) printed samples.
Figure 6.
Carbonation depth measurement points (black arrows) for the (a) cast and (b) printed samples.

Figure 7.
(a) Extraction of a printed CIC beam schematized, (red line indicating the CL), and subsequent placement of (b) a sharpened steel bar (c) with the aid of a jig, showing (d) final placement of a bar, and (e) several reinforced specimens.
Figure 7.
(a) Extraction of a printed CIC beam schematized, (red line indicating the CL), and subsequent placement of (b) a sharpened steel bar (c) with the aid of a jig, showing (d) final placement of a bar, and (e) several reinforced specimens.

Figure 8.
Chloride depth measurement points for the (a) cast and (b) printed samples.

Figure 9.
28-day Flexural strength of reference and 3DCP for each experimental pass time.

Figure 10.
Visible CL, indicated by the black arrow, present in the 3D-20 (a) and 3D-30 (b) DI samples.
Figure 10.
Visible CL, indicated by the black arrow, present in the 3D-20 (a) and 3D-30 (b) DI samples.

Figure 11.
OPI results.

Figure 12.
WSI results.

Figure 13.
CCI results.

Figure 14.
Illustration of the actual and calculated DI testing results.

Figure 15.
Carbonation depth progression over the 12-week ACC testing over the square root of time (√days).
Figure 15.
Carbonation depth progression over the 12-week ACC testing over the square root of time (√days).

Figure 16.
12-week carbonation front for the C-V (a), 3D-0 (b), 3D-10 (c), 3D-20 (d) and 3D-30 (e) samples.
Figure 16.
12-week carbonation front for the C-V (a), 3D-0 (b), 3D-10 (c), 3D-20 (d) and 3D-30 (e) samples.

Figure 17.
12-week carbonation front profile for all the experimental variables, where the CL is indicated by the black dotted line.
Figure 17.
12-week carbonation front profile for all the experimental variables, where the CL is indicated by the black dotted line.

Figure 18.
Correlation between the k and the A.

Figure 19.
12-week carbonation depth at the IRs compared to layers.

Figure 20.
Chloride penetration profile for the C-V (a), 3D-0 (b), 3D-10 (c), 3D-20 (d) and 3D-30 (e) beams, showing the 20 mm cover depth with the dashed line, after 18 weeks of chloride exposure (9 cyclic wetting and drying cycles).
Figure 20.
Chloride penetration profile for the C-V (a), 3D-0 (b), 3D-10 (c), 3D-20 (d) and 3D-30 (e) beams, showing the 20 mm cover depth with the dashed line, after 18 weeks of chloride exposure (9 cyclic wetting and drying cycles).

Figure 21.
Average Rohm time-development graph.

Figure 22.
Average Icorr time-development graph.

Figure 23.
Pit formation of the steel rods from the 3D-0 (a), 3D-10, (b), 3D-(20) (c) and 3D-30 (d) beams.
Figure 23.
Pit formation of the steel rods from the 3D-0 (a), 3D-10, (b), 3D-(20) (c) and 3D-30 (d) beams.

Figure 24.
Correlation between the FS and the DI performance (σ and OPI).

Figure 25.
Correlation between the FS and the accelerated durability performance testing (average Icorr and A).
Figure 25.
Correlation between the FS and the accelerated durability performance testing (average Icorr and A).


Table 1.
Experimental variable testing, samples amounts and sizes summary.
| Test | Variables Tested | Samples Tested/Variable | Sample Size (mm) |
|---|---|---|---|
| Flexural strength | C-P, 3D | 10 | Cast: 40 × 40 × 160 Printed: 30 × 40 × 160 |
| Durability index (DI) | C, 3D | 4 per DI test (12 in total) | Diameter: 70 Thickness: 30 |
| Accelerated concrete carbonation (ACC) | C-V, 3D | 4 | 100 × 100 × 100 |
| CIC | C-V, 3D | 3 | Cast: 150 × 150 × 250 Printed: 150 × 180 × 250 |
Table 2.
3DCP mix design.
| Material | Product | kg/m3 | Additional Information |
|---|---|---|---|
| Cement | PPC CEM II/A-L 52.5N | 521.4 | |
| Fly Ash | Durapozz | 161.2 | Class F fly ash |
| Silica Fume | FerroAtlantica Micro-Silica Fume | 81.1 | |
| Water | Municipal tap water | 235 | 0.45 w/c and 0.31 w/b |
| Sand | Malmesbury fine sand (a local natural sand) | 1229 | |
| Superplasticiser | Chryso Premia 310 | 7.637 | 1% by mass of binder |
| Viscosity modifying agent | Chryso Quad 20 | 2.291 | 0.3% by mass of binder |
| Fibre | SAPY Corefil 6 mm polypropylene fibre | 9 | 1% by volume |
Table 3.
3DCP rheological parameters.
| τS,i | τD,i | Rthix | Athix | τrf |
|---|---|---|---|---|
| 1223.8 Pa | 334.7 Pa | 1.72 Pa/s | 0.31 Pa/s | 410.8 s |
Table 4.
WSI and CCI testing deviations.
| Variable | Total Time Spent or Submerged in: | ||
|---|---|---|---|
| Desiccator | NaCl Solution | Ca(OH)2 Solution | |
| C-P | 3 days | - | - |
| C-V | 2 days | - | - |
| 3D-0 | - | 3 days | 3 days |
| 3D-10 | 2 days | - | - |
| 3D-20 | 1 day | - | - |
| 3D-30 | - | - | - |
Publisher’s Note: MDPI stays neutral with regard to jurisdictional claims in published maps and institutional affiliations. |
© 2021 by the authors. Licensee MDPI, Basel, Switzerland. This article is an open access article distributed under the terms and conditions of the Creative Commons Attribution (CC BY) license (https://creativecommons.org/licenses/by/4.0/).
Share and Cite
MDPI and ACS Style
Malan, J.D.; van Rooyen, A.S.; van Zijl, G.P.A.G. Chloride Induced Corrosion and Carbonation in 3D Printed Concrete. Infrastructures 2022, 7, 1. https://0-doi-org.brum.beds.ac.uk/10.3390/infrastructures7010001
AMA Style
Malan JD, van Rooyen AS, van Zijl GPAG. Chloride Induced Corrosion and Carbonation in 3D Printed Concrete. Infrastructures. 2022; 7(1):1. https://0-doi-org.brum.beds.ac.uk/10.3390/infrastructures7010001
Chicago/Turabian StyleMalan, Jean De’M, Algurnon Steve van Rooyen, and Gideon P. A. G. van Zijl. 2022. "Chloride Induced Corrosion and Carbonation in 3D Printed Concrete" Infrastructures 7, no. 1: 1. https://0-doi-org.brum.beds.ac.uk/10.3390/infrastructures7010001