Article

Performance Evaluation of a Hybrid PSO Enhanced ANFIS Model in Prediction of Traffic Flow of Vehicles on Freeways: Traffic Data Evidence from South Africa

by
Isaac Oyeyemi Olayode
1,*,
Alessandro Severino
2,
Lagouge Kwanda Tartibu
1,
Fabio Arena
3 and
Ziya Cakici
4
1
Department of Mechanical and Industrial Engineering, University of Johannesburg, Auckland Park, 2006, Cnr Kingsway & University Roads, P.O. Box 524, Johannesburg 2092, South Africa
2
Department of Civil Engineering and Architecture, University of Catania, 95123 Catania, Italy
3
Department of Informatics Engineering, University of Kore, 94100 Enna, Italy
4
Department of Civil Engineering, Izmir Democracy University, Üçkuyular, Gürsel Aksel Blv No:14, 35140 Izmir, Turkey
*
Author to whom correspondence should be addressed.
Submission received: 13 December 2021 / Accepted: 17 December 2021 / Published: 24 December 2021

Abstract

:
In the last few years, there has been a significant rise in the number of private vehicles ownership, migration of people from rural areas to urban cities, and the rise in the number of under-maintained freeways; all these have added to the perennial problem of traffic congestion. Traffic flow prediction has been recognized as the solution in alleviating and reducing the problem of traffic congestion. In this research, we developed an adaptive neuro-fuzzy inference system trained by particle swarm optimization (ANFIS-PSO) by performing an evaluative performance of the model through traffic flow modelling of vehicles on five freeways ( N 1 , N 3 , N 12 , N 14   and   N 17 ) using South Africa Transportation System as a case study. Six hundred and fifty (650) traffic data were collected using inductive loop detectors and video cameras from the five freeways. The traffic data used for developing these models comprises traffic volume, traffic density, speed of vehicles, time, and different types of vehicles. The traffic data were divided into 70% and 30% for the training and validation of the model. The model results show a positively correlated optimal performance between the inputs and the output with a regression value R 2   of 0.9978 and 0.9860 for the training and testing. The result of this research shows that the soft computing model ANFIS-PSO used in this research can model vehicular traffic flow on freeways. Furthermore, the evidence from this research suggests that the on-peak and off-peak hours are significant determinants of vehicular traffic flow on freeways. The modelling approach developed in this research will assist urban planners in developing practical ways to tackle traffic congestion and assist motorists and pedestrians in travel behaviour decision-making. Finally, the approach used in this study will assist transportation engineers in making constructive and safety dependent guidelines for drivers and pedestrians on freeways.

1. Introduction

The accurate prediction of vehicular traffic flow is significant in determining the present-day traffic flow of vehicles in the road transportation system. This has brought about the need for appropriate traffic flow information in the future [1]. A typical example is the concept of traffic flow; knowing the prediction of traffic flow of a specific road will assist road users in scheduling travel routes. This can go a long way in aiding motorists in their decision-making process regarding the shortest possible route to their destination. The art of knowing “when and where” traffic congestion is going to occur is significant in addressing road transportation problems, as this will make it easier for transportation engineers and urban planners to allocate transportation resources to freeways or road intersections that are prone to traffic congestions.
Thus, due to the significant advantage of traffic flow prediction on different applications in road transportation [2]. It has become a primary topic of research in the field of road transportation. Generally, traffic flow prediction makes knowing the next occurrence of traffic congestion easier considering the traffic flow knowledge and road users’ experiences extracted from chronological historical traffic data. The techniques of transmitting traffic data, collection of traffic data, traffic data mining, and storage have a significant effect on traffic flow prediction methods [3]. There are numerous conventional traffic prediction and forecasting techniques [4] that consist of temporal dependence, coupled with the HA, ARIMA model, Gaussian process-based, Kalman filtering model, VAR, etc.
However, the different types of dynamic variations of vehicular traffic flows and the consequences achieved by these methods remain subpar when compared to the efficiency and effectiveness of their traffic flow prediction. In addition, a drastic improvement in traffic flow prediction accuracy can lead to savings in finances for logistics and transportation companies [5,6,7,8,9,10]. In recent years deep learning methods [11] have torchlight some positive results when a dynamic prediction traffic flow model is applied.
In recent years, the services of intelligent cities are becoming more globally accepted and widely applied in curbing urban traffic congestion due to the growing and increasing problem of traffic congestion because of an increase in urban migration and ownership of private vehicles [12]. The words ‘smart city’ in [13] can be defined as the application of information and communication technologies in sensing, analysing, and integrating significant information from primary systems in the day-to-day operations of metropolitan cities.
However, smart cities can also create intelligent responses to various types of human needs regarding daily livelihood, protection of the environment, and public transportation safety coupled with urban facilities and commercial activities. In relation to smart urban cities, there is a rapid development of related innovative technologies such as the gradual expansion of the internet of things devices, a lot of things become measurable [14,15]. This has led to the availability of applicable traffic data for understanding the ecosystem of cities. Among the different types of important objectives of smart cities are the creation and development of intelligent transportation systems and Intelligent non-rural management systems. These are two of the primary objectives which are very important in influencing the livelihoods of pedestrians and motorists in future urban cities.
Intelligent transportation systems and advanced traffic management systems are essential in integrating information and communication when used in the field of road transportation to develop an integrated system that comprises people, roads, and vehicles. These two (2) systems comprise a significant, fully active, real-time, efficient, and effective Road transportation management architecture [16]. During the process of ATMSs and ITSs, it is a significant challenge to predict the next possible states of traffic flow with a high level of efficiency. Traffic prediction is a significant aspect of advanced traffic management systems (ATMs) and advanced traveller information systems (ATISs). The application of traffic data collection equipment such as inductive loop detectors used for detecting vehicles on freeways has been applied in intelligent transportation systems (ITS) for more than 20 years. During the early 1900s, the introduction of ITS, specifically some aspects of its primary components, was used in advanced traffic management systems (ATMs) [17].
Various transportation organizations have encouraged most federal and government management centres to be proactive in their responsibilities by constantly posting travel times of vehicles and traffic flow information, especially on vehicular incidents on the road, which in turn offer helpful information to pedestrians and motorists when making the right decisions when it comes to travelling route selection. This travel information will assist drivers when trying to avoid congested freeways, therefore offering significant travel capacity and assistance in traffic congestion management on freeways [18,19]. This is because traffic flow prediction assists in preventing traffic jams or traffic accidents and improves the traffic safety of pedestrians and motorists on the freeways.
In recent years, literature reviews by transportation researchers have always called traffic as flow due to its not-too-different characteristics compared to fluids. Therefore, traffic flow prediction involves predicting the next state, such as traffic volume, speed of vehicles, and traffic flow behaviour. This prediction is dependent on historical and real-life traffic flow data. The exponential increase in urbanization has drastically improved people’s livelihood. However, it has also led to severe traffic congestion [20], consequences of which are high rate of fuel consumption by vehicles on freeways due to longer travel times and high traffic density [21] and massive discharge of air pollutants causing climate change [22]. These environmental occurrences severely impact pedestrians’ and motorists’ health and life quality in cities. According to the investigations carried out by [23], discovered that transportation-related air pollution causes would likely increase the dangers of contracting allergies, which can further compound the symptoms, especially in subgroups exposed to health-related issues. Investigations [19] stated that vehicular traffic jams increase the likelihood of pedestrians and motorists having heart failure. Intelligent transportation management systems, such as advanced traffic management systems and intelligent transportation systems, can assist transportation researchers in tackling the effect of traffic congestions on urban dwellers.
Forecasting of traffic flow aids traffic engineers and urban planners in the management of road transportation networks and allocation of transportation resources, such as opening and closing of lanes of freeways, dynamic parking pricing [24], or adaptive traffic lights [25] in addition to high efficiency in the automation level [26]. Knowing about travel routes and traffic congestion is essential to motorists [22]. Some specific traffic devices will be efficient in calculating efficient travel routes and ensure a reduction in travel time. Having an insight into the rudiments of conceptual framework associated with the traffic flow of vehicles within smart metropolitan cities will make searching for vehicle parking space easier [27]. Furthermore, having these insights is good for information sourcing, especially for emerging innovative V2X-based traffic flow control systems [23], which could play a significant role in planning travel routes for driverless vehicles.

1.1. Research Motivations

This research combined an adaptive neuro-fuzzy inference system and particle swarm optimization (PSO). In continuance, we applied the proposed model on the South Africa transportation system, focusing on five major freeways connecting the Zimbabwean border to Cape Town’s city. The freeways were used as a major traffic data collection point due to the large traffic volume of vehicles and the inability of the South African Government to find lasting solutions to the perennial traffic congestion on these freeways. To the best of our knowledge, no previous study has focused on modelling traffic flow on freeways using ANFIS-PSO. Much uncertainty still exists between the combination of a heuristic and metaheuristic model in modelling and traffic flow prediction in Road transportation systems.
In addition, various related studies over the years have shown that predictive models such as artificial neural networks can be used to predict traffic flow [28,29,30]. These related studies concluded that the application of artificial neural network models is prone to exceptional positive outcomes compared to empirical studies [31]. Algorithms applying neural network models usually require learning variables like learning rate, the optimum number of nodes located in the hidden layer, and numbers of hidden layers. The neural network models and their predictive capacity could be impacted by elevated numbers of iterations training, leading to the overtraining of the neural network model. Another significant problem is the availability of the presence of local minima when applying a back-propagation neural network. In recent years, several studies have suggested the capabilities of neuro-fuzzy in evaluating a neural network model’s optimal architecture to establish the maximal output power of optimum parameters predictions during simulations [32].
Another significant research gap that this research explores is the large-scale urban traffic flow data which is difficult to understand and primarily impacted by three intricate features such as spatial and temporal dependencies, not excluding external determinants. Because of these determinants, traffic flow prediction of vehicles has become a significant issue leading to traffic congestion on freeways. However, different types of solutions have been proposed to predict vehicular traffic flow [33,34,35]. From a traffic data perspective, no metaheuristic model such as ANFIS-PSO has been used.

1.2. Resarch Contributions

  • This research provides an exciting opportunity to advance our knowledge of applying metaheuristics models in the traffic flow of vehicles on freeways.
  • This study offers some important insights on how to collect, divide, and use traffic data to model vehicles’ traffic flow.
  • This is the first study to undertake a comprehensive investigative analysis of the South Africa Road transportation system focusing on the country’s freeways.
  • Finally, this study makes a major contribution to research on traffic flow prediction by demonstrating how off-peak and on-peak are significant factors in predicting traffic flow.

1.3. Research Organization

The overall structure of the research takes the form of five sections, including this introductory section. An overview of related studies on various applications of PSO-ANFIS is presented in Section 2. The nature of data, location of the study, and the methodology used for the analysis performed in this paper are explained in detail in Section 3. The results and discussions are detailed in Section 4. Finally, the conclusion gives a summary and implication of this research, not excluding future recommendations.

2. Related Studies

In several traffic flow prediction literature, there have been several ways of applying short term prediction of traffic flow of vehicles, notable among them are regression models [36], the nearest neighbour technique (k-NN) [37], the Autoregressive Integrated Moving Average (ARIMA) model [38]. The discretization modelling technique—this type of modelling is applied to solve complicated and intricate nonlinear models problems [39], additionally machine learning methods such as support vector regression (SVR) [17], and neural networks (NN) [40]. In [41], several parametric and non-parametric machine learning algorithm models were compared in the literature. Machine learning algorithms such as neural networks, support vector regression, and random forest are usually applied, non-parametric models. Still, there is no single optimal technique that accurately predicts the traffic flow of vehicles at a freeway in real-time traffic occurrences that was proposed or developed. The primary problem associated with traffic flow prediction in the development of a predictive algorithm is the combination of efficiency and speed of computational modelling that can be applied for both long- and short-term traffic flow prediction issues. Several alternatives have been introduced for short- and long-term traffic flow predictions, such as regression models, nearest neighbour, ARIMA, discretization modelling approach, as an effective solution in solving complicated nonlinear models [39], and neural networks, which referred to as the best option [18,42,43,44].
In different types of literature reviews on traffic flow predictions, various artificial intelligence methods have been proposed and applied in different areas of road transportation. Notable among these AI methods are fuzzy logic, neural networks, neuro-fuzzy or optimization algorithms such as genetic algorithm (GA), particle swarm optimization (PSO), artificial bee colony (ABC) algorithm. These optimization algorithms have been applied in various areas of road transportation to address so many issues [45]. Fuzzy logic is an AI method that is very significant among all the AI methods, and it was created by Zadeh (1965). Fuzzy logic is a unique AI method, and it is different from any traditional set theory because it states that membership can only start and end at 0 and 1. When applying fuzzy logic, each member can be the property of a cluster in various membership degrees. There are different situations we have experienced in life that we are uncertain about the next step; the fuzzy inference system allows us to express situations that we are not 100% sure of by applying what we called fuzzy rules using decision-making techniques. Thus, the fuzzy inference system has been applied so many times to find solutions to many issues depending on their area of application [46].
Another important type of artificial intelligent method is the artificial neural network (ANN). Artificial neurons create ANN; they are known for modelling functions that are like the human brain. There is a need for a set of datasets to be trained and tested to model a system. This is known as artificial neural network learning with sample datasets. As soon as the ANN learning of the data is completed, an appropriate ANN model will be obtained. A test is carried out to validate the ANN model results by using datasets that were separated from the initial data that undergo ANN model training. The error is the difference between a real output obtained from the datasets and the predicted output obtained from the ANN model results. To clarify, it means that when the mean square error (MSE) is minimal, the more likely the ANN model will achieve an optimal result. But a significant disadvantage of using the ANN model is the inability to determine the parameters of the weights belonging to an ANN model [28,29,30].
Nevertheless, the artificial neural network model possesses various merits such as (1) ANN model learning applying samples, (2) classification of datasets, association, and pattern recognition capabilities, (3) working with inadequate information, therefore it has been widely applied in engineering applications [47]. Neuro-fuzzy can be defined as a hybrid artificial intelligence method that combines fuzzy logic and artificial neural networks. Over the years, various researchers have suggested different types of fuzzy logic; notable among them is the adaptive neuro-fuzzy inference system (ANFIS) discovered by Jang (1993). During ANFIS training and testing, there will be a combination of the model learning capability, relational structure of the artificial neural networks, and the decision-making process of the fuzzy logic. ANFIS undergoes a learning process by using samples trained datasets in artificial neural networks. This is the most fulfilling way an ANFIS model structure can be obtained for resolving any related issues. The ANFIS model results gotten are then tested using a sample of the datasets trained [48].
ANFIS has been applied in various research in engineering, such as in the student modelling technique [49], medical system [50], economic system [51], image processing and extraction of features [52], forecasting and predictions in transportation [53], system modelling [54], electrical and electronics systems [55]. Ref. [56] carried out an investigation in which they applied an ANFIS model for the investigation of fuzzy regression. Ref. [57] in their research examined ways to obtain a quantitative relationship between structure and activity by combining the ANFIS model and hybrid learning algorithms. An investigation by training a ANFIS model with a hybrid learning algorithm to determine the estimation of a battery state-of-charge was carried out by [58].
Hou et al. (2019) investigated traffic flow prediction by using a non-linear WNN technique and linear ARIMA method. They examined the outputs of these two methods and unified them by using fuzzy logic, which resulted in an efficient traffic flow prediction. They concluded that the hybridized method offered more appropriate stability, even when considering the turbulent conditions. Another significant finding was that the research results were found to be free of errors and have an optimal result. Ref. [59] investigate traffic flow prediction by using a deep learning-oriented model known as STANN for traffic flow prediction. They used temporal and spatial attention to determine the spatial dependencies that are in existence among temporal dependencies and road (freeway or road intersections) segments. They concluded that their model accurately predicted traffic flow with high accuracy, and the model also evaluated the exploitation of different types of resolutions of datasets.
Ref. [60] investigated traffic flow using an improved scheme that connects the high impact parameters of longer sequence times to the current timestep. These traffic flow parameters that possess an elevated impact were captured using the attention technique. Consequently, most of the datasets were stabilized from the normal range to achieve an accurate traffic flow prediction. They concluded that their results validate the implemented model’s advancement regarding predicting the short-term traffic flow of vehicles.
Ref. [61] investigated determining the prediction method that can combine the SVM approach and denoising type of model to improve traffic flow prediction accuracy. This approach applied the multi-step predictive methods coupled with different de-noising methods by using the vehicular traffic flow data from Minneapolis, USA. They concluded that the de-noising approach achieved an optimal performance compared to the predicted outcomes with the de-noising model. This method also offered some significant recommendations for using the appropriate de-noising technique for vehicular traffic flow prediction.
Ref. [62], the research used decomposed single dataset and divided them into different types of sub-datasets. These sub-datasets were distributed to different types of computational nodes. In there, they used learning methods and algorithms for computing the learning of the DBN framework. Furthermore, a “master-slave parallel computing structure” was modelled, in which the characteristic was trained using slave computing nodes that were moved during the research into the master computing node. The implication of their research showed a reduced time consumption of the proposed work compared with the conventional works.
A novel fuzzy-oriented model for traffic flow prediction was developed by [63]. This approach was developed based on the fuzzy technique and DRN method. In this research, there was an introduction of the fuzzy rules into the DL model to reduce the effect of the error of the datasets. Another significant result from this research is that the FDCN model was added to the methodology to improve the vehicular traffic flow prediction. The temporal and spatial correlation of traffic flow of vehicles was investigated.
In their research, the authors of [64] came up with a novel Dynamic-GRCNN that evaluates the spatio-temporal characteristics of traffic flow prediction of urban pedestrians. In addition, the approach used in this study applied the datasets comprising the historical flow of passengers. The long, medium and short-term historical traffic data of pedestrians were analysed during the training that comprises urban passenger traffic flow at different public transportation stations.
Research on the prediction of the vehicular traffic flow was carried out in [65] by introducing a model called DNN-BTF, which they applied to enhance the model’s optimal performance. The model analysed the temporal-spatial features, including the daily and weekly level of vehicular traffic flow. In addition, an attention-oriented method was developed that automatically analysed the importance of previous vehicular traffic flow. Another significance of their research is that RNN and CNN were applied for mining the temporal and spatial characteristics.
Ref. [66], researchers came up with a novel proposal of a STEF-Net technique that will accurately predict the demands of passengers via the combination of deep learning and fuzzy network. This approach can manage complex input dependencies such as spatial and temporal characteristics. A novel characteristic fusion technique with convolution followed by an attention layer was used to combine the neural networks into one, and a temporal relationship was kept for advanced modelling. They conclude that their model performs at an optimal level when compared to other methods.

3. Methodology

The methodological approaches used in this research is shown in Figure 1. Taking into consideration the research design, location of the research study and the model development.

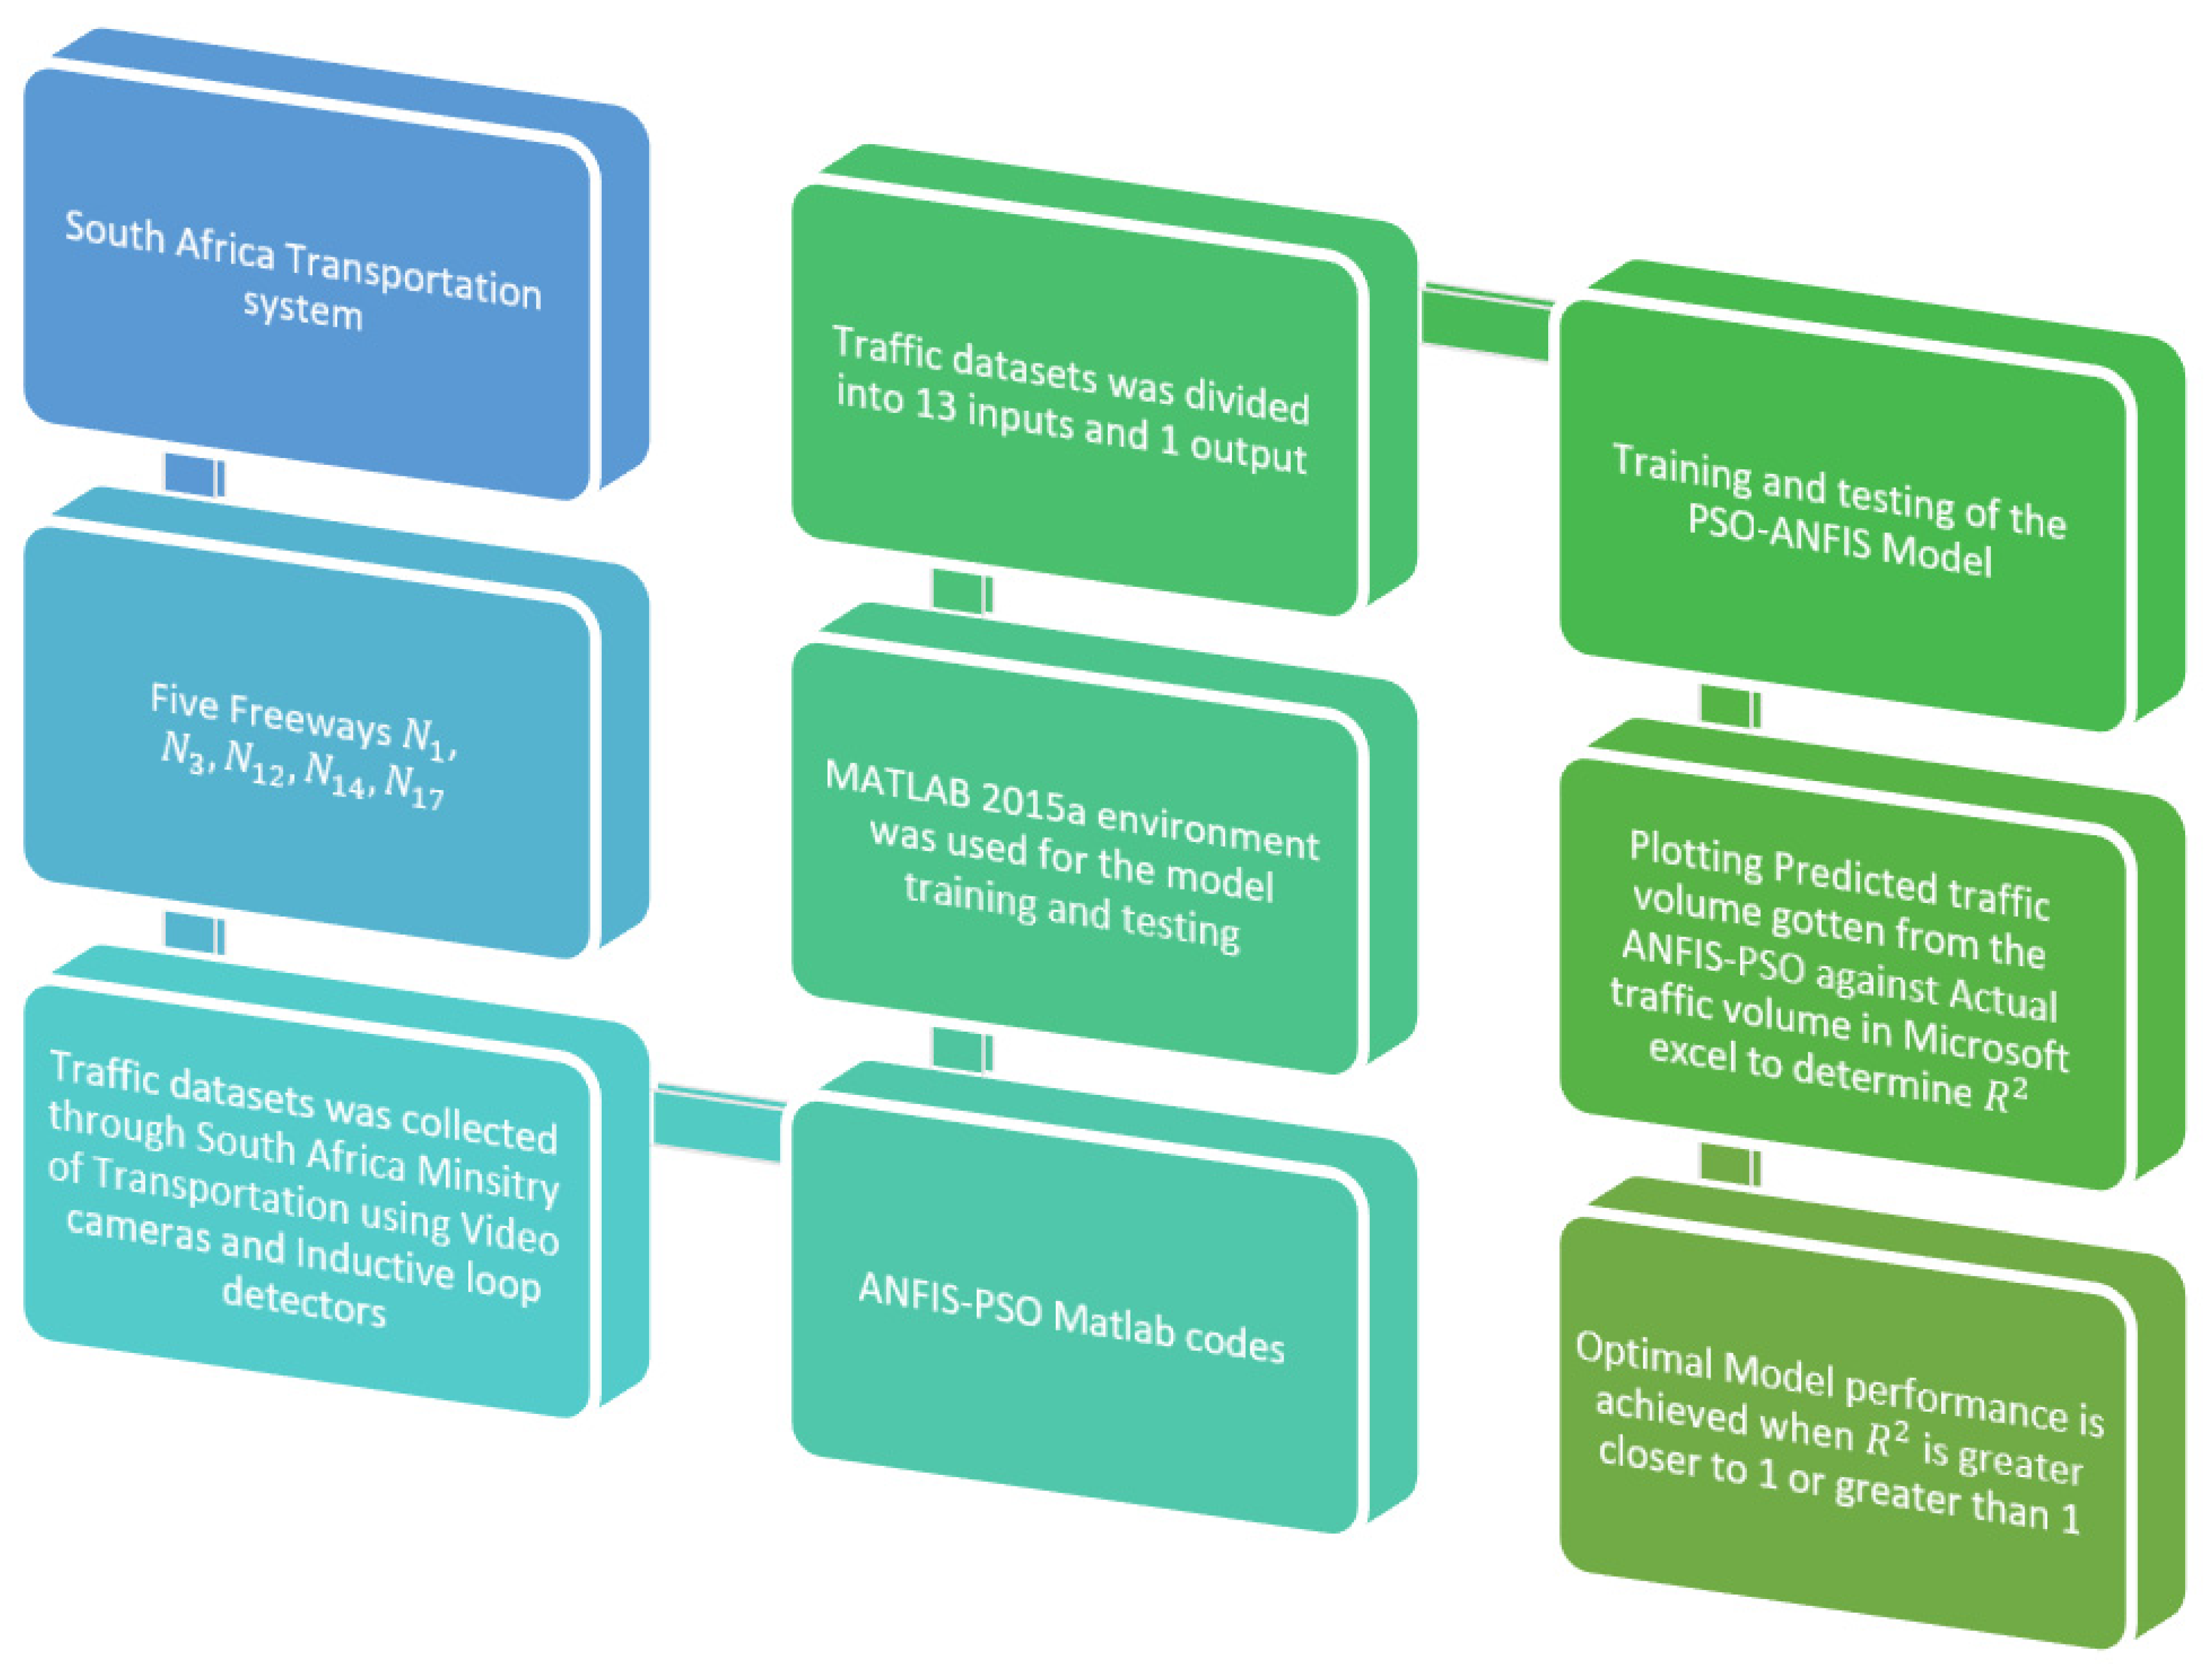
3.1. Research Design

This research demonstrates how traffic congestion problems can be addressed at freeways by carrying out an evaluative performance of ANFIS-PSO using traffic data collected at five congested freeways in South Africa. These five freeways are N 1 ,   N 3 , N 12 , N 14   and   N 17 and using the pattern of data collected at these freeways to understand the off-peak and on-peak periods of vehicular traffic flow on these freeways. This is achieved by applying a metaheuristic model such as ANFIS-PSO to understand traffic flow data patterns at these freeways.

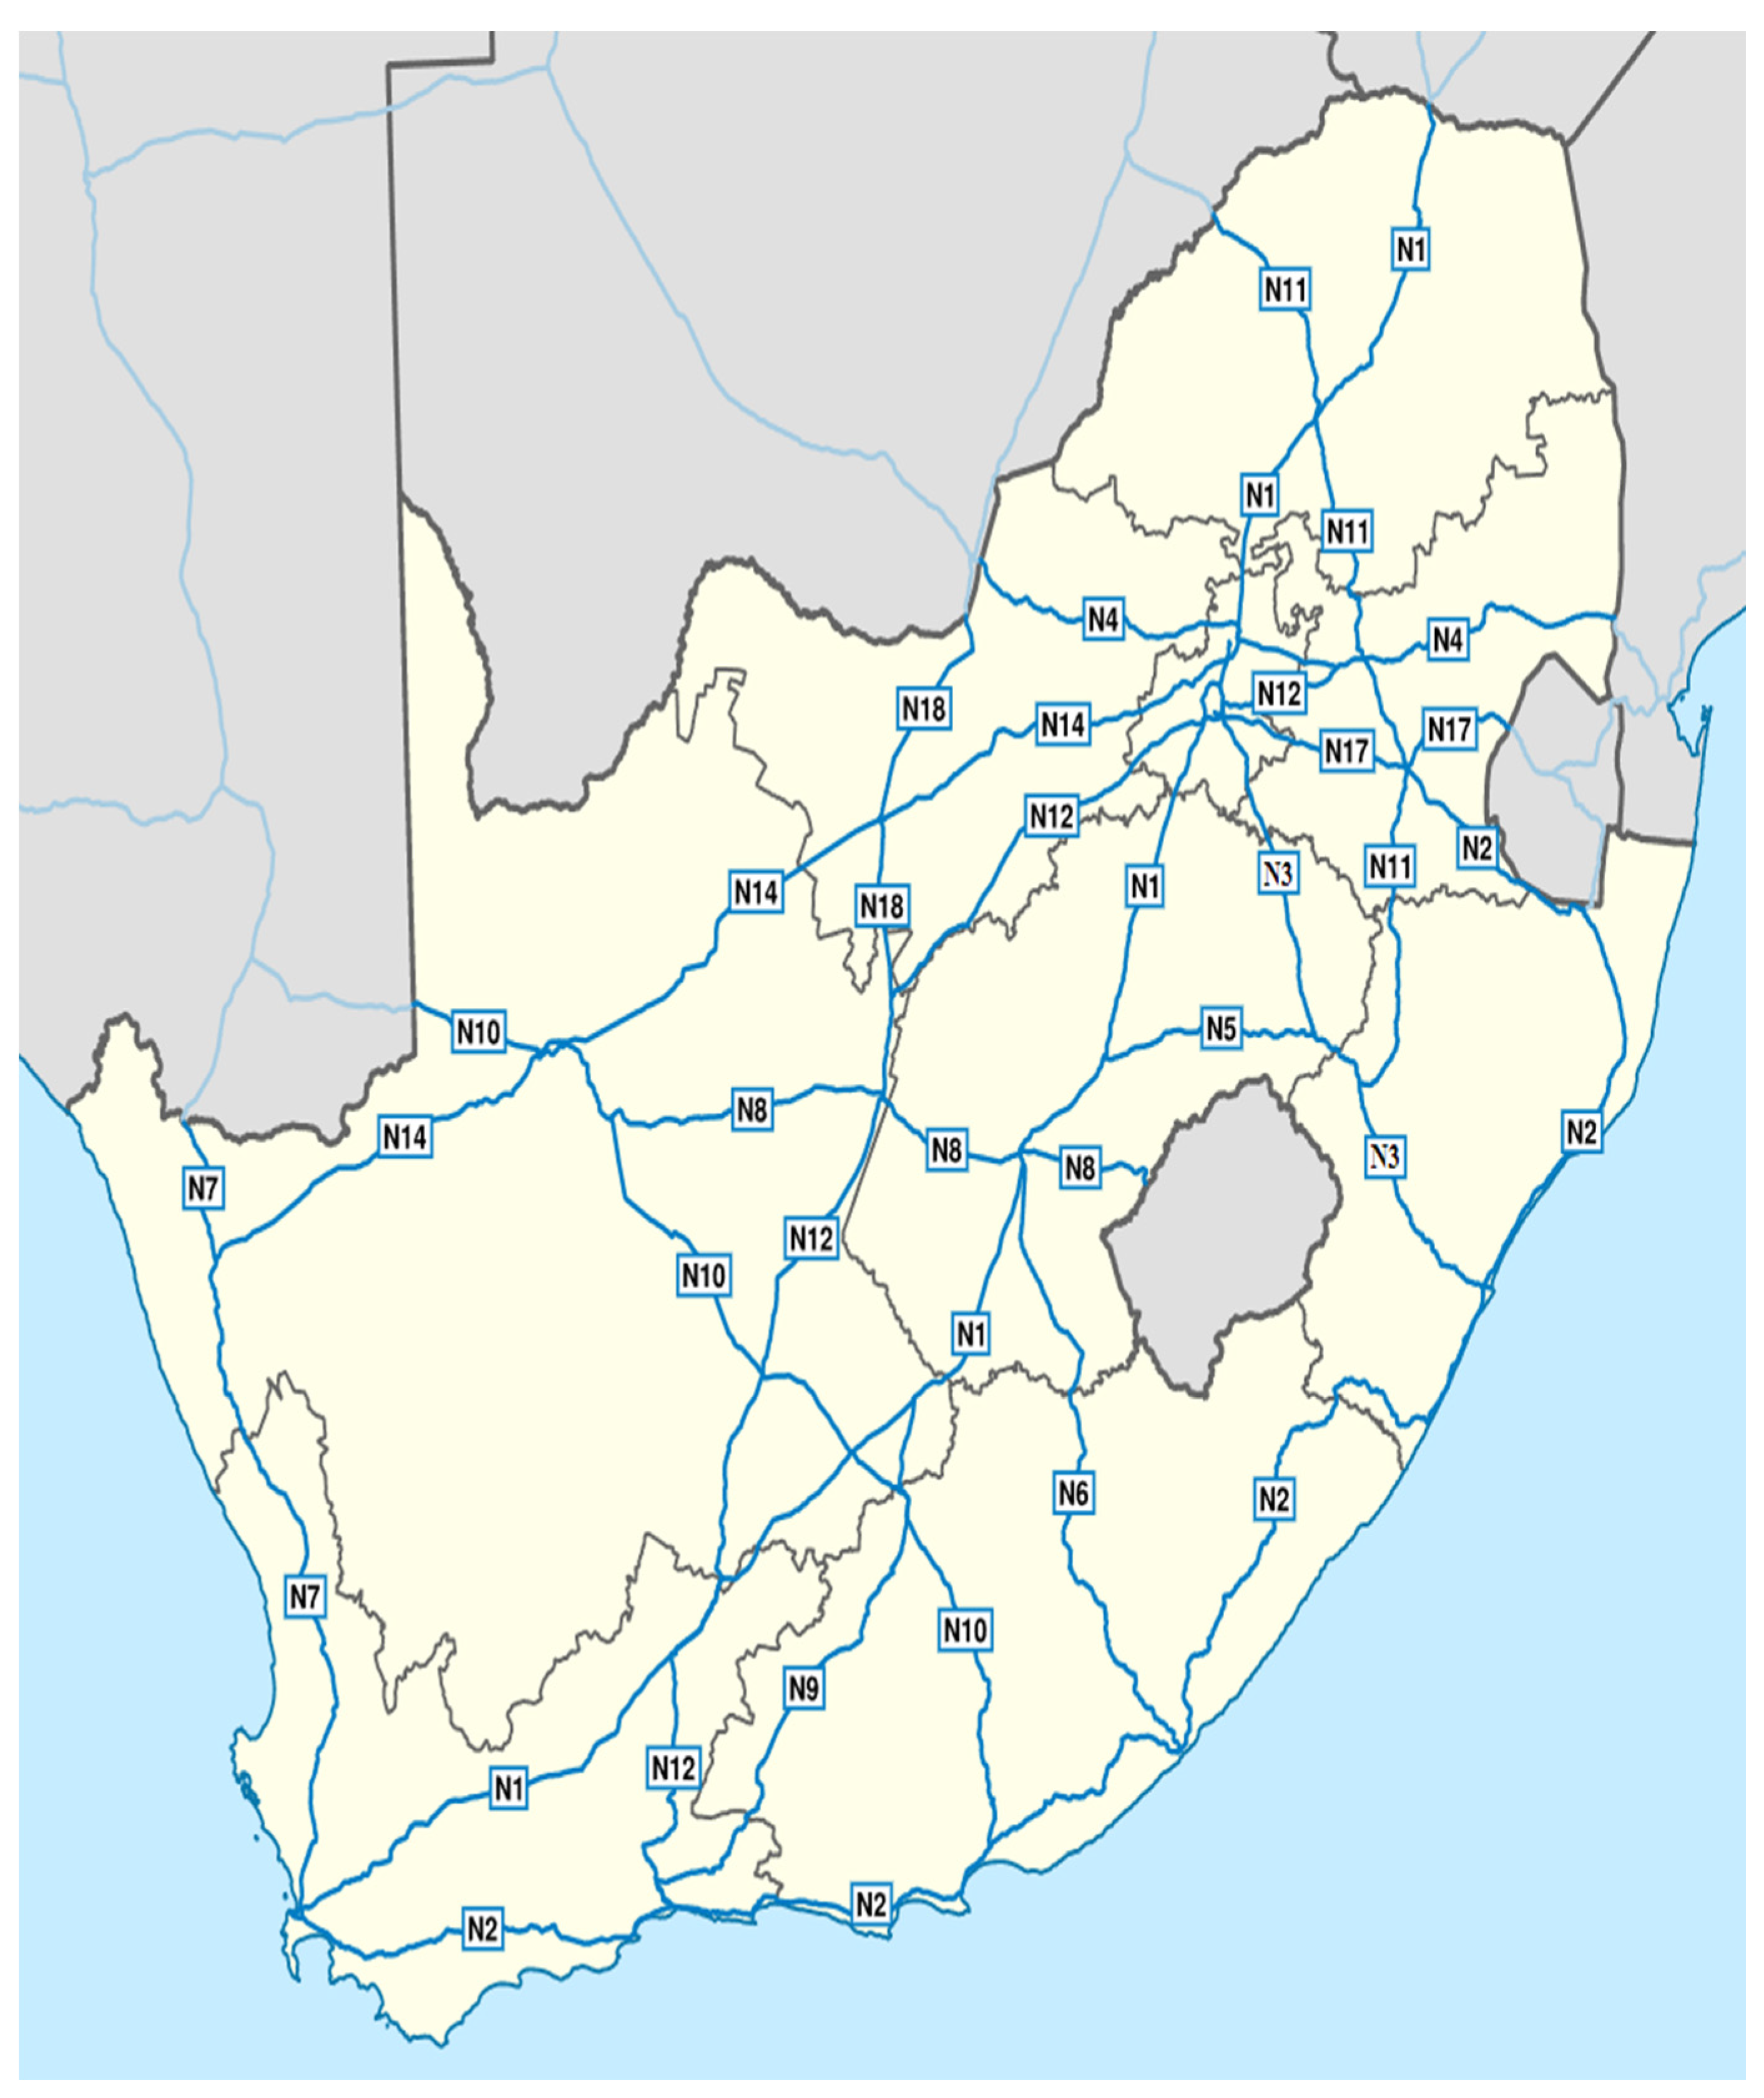
3.2. Location of the Research

The N1 freeway is a national route in the South Africa Road transportation system that linked the city of Capetown to the Beit bridge situated between South Africa and Zimbabwe. The N1 freeway is the first freeway in South Africa to create the first section of the popular Cape to Cairo Road. Before 1970, the N1 freeway was connected from the Beit Bridge to Colesberg and then connected to the present-day N9 freeway, leading to George. The section of the freeway from Cape Town to Colesberg was connected to the N9.
Immediately after the Vaal River in Gauteng Province, the N1 freeway extends towards the city of Johannesburg, through Vanderbijlpark and a toll plaza at Grasmere. In the suburbs of Johannesburg South, the N12 connects with the N1, and they are both connected northwards as one freeway for a few kilometres (passing through Soweto) up to the Diepkloof Interchange freeway, which is where the N12 freeway was divided off and connected to the Southern Bypass part of the Johannesburg Ring Road. From Johannesburg north of the Vaal River, the N1 freeway pavement type changes from a tarred road to concrete pavement. This is just before the freeway connects with the N12 freeway. The R553 Road is the in-city road just off-ramp between the two interchanges that connect to the N12, which signifies the genesis of the e-toll gates on the N1 freeway.
The N1 can be regarded as the Western Bypass portion of the same ring road, which passes through the western suburbs of the city of Johannesburg, and suburbs such as Roodepoort and Randburg before merging to the N3, which is linked to the eastern bypass section of the Johannesburg ring road which is connected to the road that leads to Durban capital of KwaZulu natal Province; in addition, the N3 is connected to the Johannesburg’s M1 freeway at the interchange called Buccleuch situated at the north-east part of Sandton. The city of Johannesburg is well known for its development in infrastructure and economic prowess. The city depends enormously on freeways such as the N1, N3, N12, N14, and N17 for its road transportation. The city is situated at a location that is about 1600 m above sea level. It is among the cities in South Africa that are not surrounded by any major bodies of water.
The combination of the N1, N3, and N12 freeways creates the Johannesburg Ring Road surrounding the city. The N14, on the other hand, is the freeway that linked West Rand with Pretoria and could likely be used to create an outer ring road in the future. The N17 freeway links the Johannesburg Central Business District (also known as the Joburg CBD) and Johannesburg South with a place called Springs on the East Rand of Johannesburg all the way to Mbombela, which is in Mpumalanga Province. In recent years the N1 freeway, which connects Johannesburg and Pretoria, is now becoming heavily congested. Reports stated that the freeway accommodates over 350,000 different types of vehicles a day, depending on the period of the day. The road is heavily congested during the on-peak periods, which are usually in the mornings. During the on-Peak period at night, people leave their place of work in Johannesburg to go to Pretoria or vice versa. Figure 2 shows the map overview of different types of freeways in South Africa Transportation System.

3.3. Traffic Data

Sampling can be defined as selecting a subcategory of a group of traffic data or objects from a large statistical population for easy evaluation and investigation of the entire traffic datasets. In this study, the traffic flow dataset was obtained from five freeways in the South Africa Road Transportation Network, known for their high traffic volume and traffic density. Six hundred and fifty (650) traffic flow datasets were selected for straightforward evaluation of the entire vehicular traffic flow information on these freeways.
The traffic datasets were extracted from the five freeways using handheld and mounted video cameras and inductive loop detectors. These video cameras were placed just beside the freeway every day from 15 July 2019 to 24 July 2019 to accurately capture the vehicles’ speed, time, and traffic density on the freeways. The freeways mount the video cameras in such a way that it does not interfere with the traffic flow activities occurring on the freeway at the time of collection. After observing the traffic flow on these freeways, we concluded that the vehicular traffic flow was fluid-like in nature due to the direction of traffic flow on each of the freeways that is Southbound. After the video recording for the traffic flow on each freeway, the recording was downloaded into a USB flash drive and played on a large screen monitor to display the desired information. It is important to note that the vehicles are divided into four categories according to the classification of vehicles by the South Africa Ministry of Road Transportation. This is shown in Figure 3 below. The features and data analysis of the traffic datasets used in this research of these freeways is tabulated in Table A1 and Table A2, that can be found in the Appendix A.
Then the following step was carried out by inserting the large volume of traffic data from the USB drive into a Microsoft excel for analytical evaluation. This was done by dividing the number of different categories of vehicles from the freeways with time (seconds)—see table below. The time taken by each type of vehicle to travel the length of each freeway was given an accuracy of 0.02 s to minimize the error. Some parameters have already been given from the traffic data collected from the freeways. These are the speed of the vehicles, the number of different classes of vehicles, and time are already given from the raw data collected from the freeway.
The inputs and outputs traffic flow variables used for the ANFIS-PSO model are the speed of the vehicles, traffic density of vehicles on the road, the traffic volume of vehicles, and different classes of vehicles. The Traffic data used for this research are categorized into 13 inputs and 1 output considering the traffic flow data and the ANFIS-PSO model for optimal performance of the model. These input and output variables approach was based on the approach used by [63]. The table below illustrates how the different traffic flow variables used in this study are categorized. We have 14 traffic flow variables, divided into 13 inputs and one output; they are shown in Table 1.
Preparation of the dataset is followed by structuring the architecture of the algorithms. MATLAB user interface tools and command-line functionality oversee the development, training, and testing of the ANFIS-PSO model. The 650 traffic datasets used in this research were obtained from five major freeways connecting from the Zimbabwean border to the Cape town road. These freeways are known to be among the busiest freeway in southern Africa. Table 2 shows how the traffic datasets were divided and used for the training and testing of the ANFIS-PSO model training and testing are shown in the Table 2.

3.4. Equipment Used in the Collection of Traffic Data

3.4.1. Inductive Loop Detector

An inductive-loop detection system comprises an inductive loop, which can be described as a coil of wire enshrined in the surface of a freeway and a detector found in the signal section and connects the inductive loop to the traffic signal controller. In a traffic situation on a freeway that occurs when a vehicle is driven just directly over the inductive loop, and it cuts via through the magnetic fluxes, there will be an effect called ferromagnetic effect, which is usually found in between steel belt tires and a small component of engines this will components causes an increment in the loop inductance. There is an effect called the eddy current effect, which is majorly caused by the combination of the more significant part of the vehicle’s chassis and body. They are against the magnetic field and therefore result in a decrease in loop inductance. The eddy current effect is usually greater than the ferromagnetic effect, with an overall reduction in loop inductance. Therefore, by evaluating the positive frequency change, the vehicle detector mechanism will detect the presence of a vehicle over a loop detector.

3.4.2. Video Cameras

Video cameras are usually installed close to traffic lights on freeways and signalized road intersections. Figure 4 shows how the image processing system from video camera captured movement of vehicular traffic flow on freeways. Video cameras comprise of a video image processing system also known as VIPS; this image processing system contains:
(a)
An image processing system can be defined as a video camera situated overhead at a position above the freeway that is used to capture real-time traffic flow images and video images of the traffic flow of vehicles.
(b)
Telecommunication system can be defined as advanced innovative and a telephone line that transfers images and video streams to the image processing system.
(c)
Image processing system such as a computer that processes frames of a video clip used for traffic data extraction on freeways.
Figure 4. Example of an Image processing System from Video Cameras. Reprinted with permission from ref. [64]. Published by Elsevier B.V.Copyright © 2016 Elsevier Ltd. All rights reserved.
Infrastructures 07 00002 g004
The picture in Figure 4 below illustrates a video camera installed at a freeway monitoring and supervising the traffic flow of vehicles. The righthand side shows a graphical image of the traffic flow of vehicles with different types of detection areas shown on the video screen. For example, when a vehicle moving at a maximum speed of 120 km/h enters the detection zone of where video cameras are installed on the freeway, the video image processing system (VIPS) switches ON; the switch remains ON until the vehicle is no longer in the vicinity of the detection zone, then the VIPS switches off.

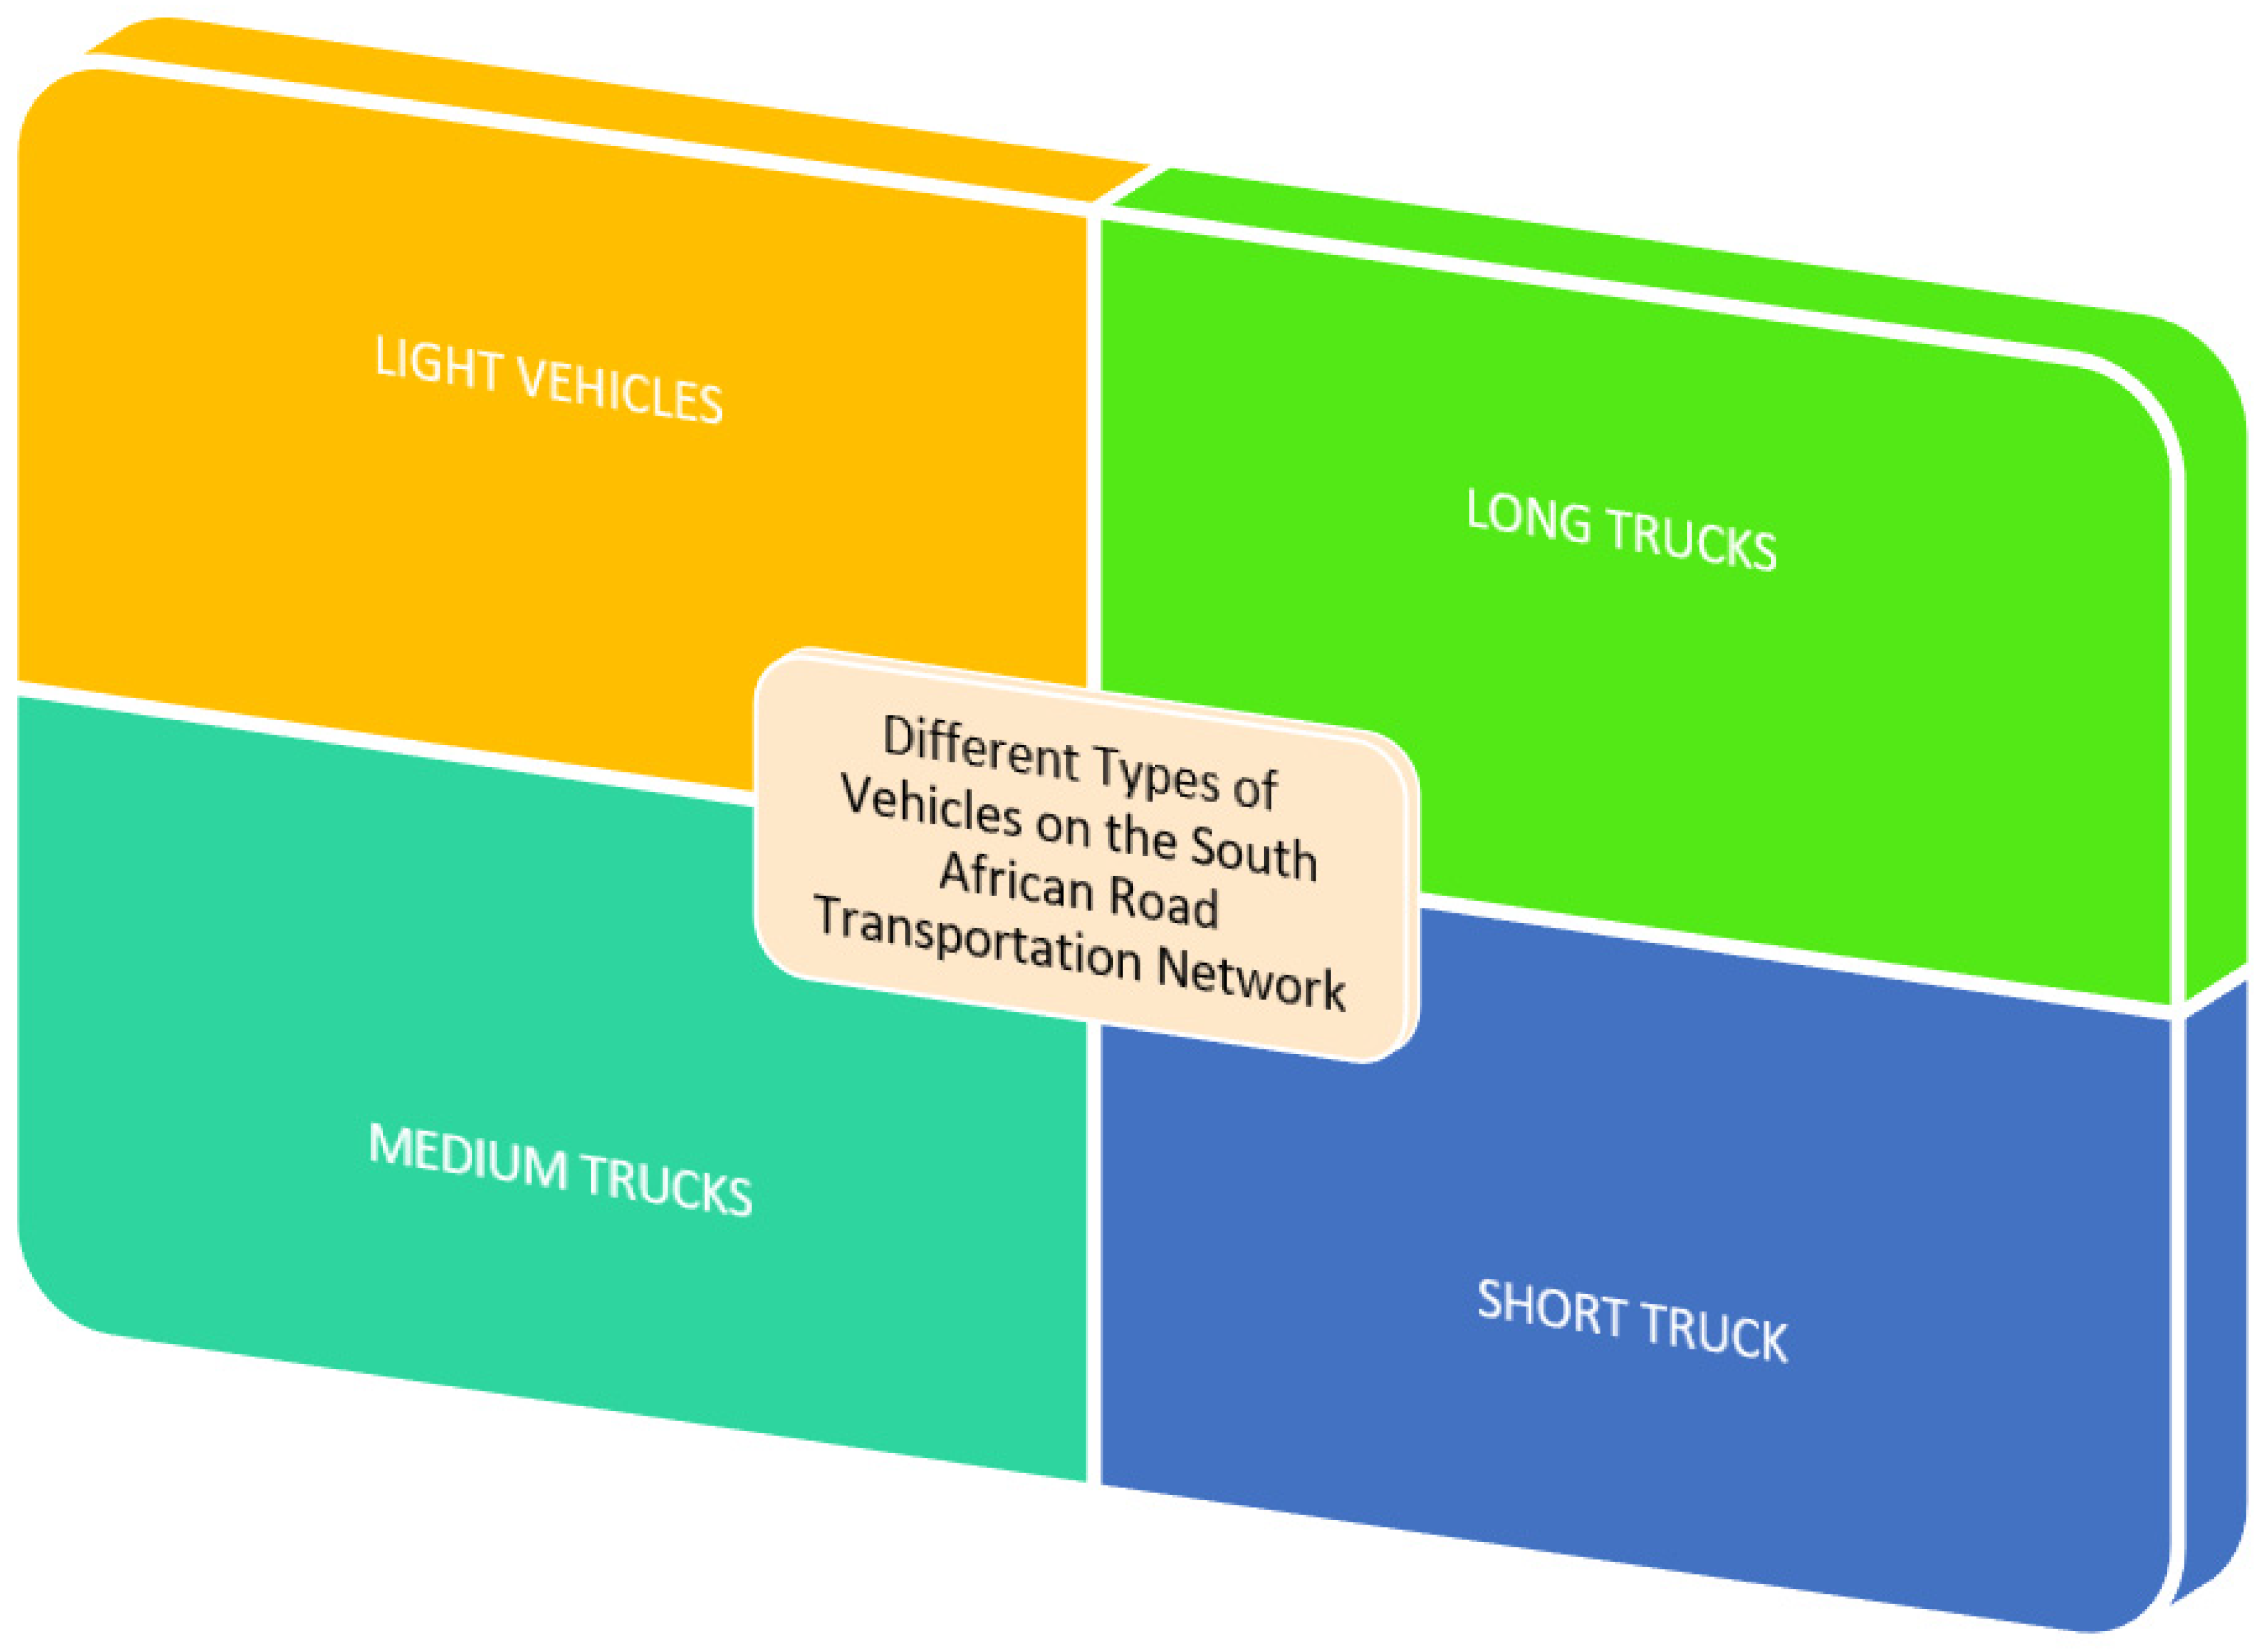
3.5. The Five Freeways Vehicular Traffic Flow

The bar charts shown in Figure A1, Figure A2, Figure A3, Figure A4 and Figure A5 in the Appendix A were used to illustrate the traffic volumes of vehicles on each freeway, considering their traffic volume, period of the day, and dates in which the traffic flow on these freeways was observed. One significant observation to make from these traffic flow graphs is that the period of the day and the traffic volume are major determinants in determining if there will be an off-peak or on-peak period during the day. A major example of this explanation is noticeable on each of the freeways is that between the time of 00:00:00–04:59:59, the freeways always experienced free-flowing traffic and slow building up of traffic congestion due to the period of the day, this is a period between the midnight and early morning. Another significant observation in the vehicular traffic flow on these freeways is that during 05:00:00–09:59:59 and 10:00:00–14:59:59, there is a gradual building up of traffic bottlenecks, and also a period of severe traffic congestions due to high traffic density of vehicles on the road, known as the on-peak period. Finally, these freeways’ traffic flow bar chart has shed light on how important it is that traffic flow variables such as traffic volumes, traffic density, and time of the day are significant factors in determining traffic flow prediction on freeways.

3.6. Model Development

Particle swarm optimization was created and developed by Kennedy and Eberhart [65]. This optimization method can be defined as an evolutionary applied computational technique capable of carrying out an optimization process on continuous and discontinued decision-making functionalities. In addition, particle swarm optimization might be stated as a biological and sociological behaviour in animals; for example, we have a flock of birds searching for their morning food [66]. Furthermore, particle swarm optimization is defined as a population-dependent search technique where each possible solution is named swarm, which indicates the particle of a population. In this technique, the position of a particle is constantly changing z i r in a search space that is multidimensional, until the particle position can achieve an optimal result or limit the computational results.
Previous related studies have displayed the efficiency and practicability of this technique that has been used for optimization usages [67]. The PSO technique has been applied in various optimization research to investigate its effectiveness [68]. A typical scenario is when we have an optimization problem containing D variables. A swarm of N particles is installed for particles to be dispensed in a position in the hyperspace combined with measurements of D variables. For this occurrence, it is important to note that the position of the particles is associated with a probable answer for the optimization problem. x and v are known as the direction of a particle and the speed of flight of the particle over a space solution.
Each of the individual x in the swarm population is scored using a scoring capability that acquires a wellness worth showcasing how long it is important to tackle the problem. P b e s t represents the subsequent position of particles. In addition, it is important to note that G b e s t indicates the index of the optimal particles amid particles in the swarm algorithm. Every particle possesses the ability to record its P b e s t and locate the most appropriate positions adhered to by all particles in the G b e s t . In summary, most particles that travel over the D particles dimensional solution space experienced improved guidelines required for new positions until the global optimum position is attained. The rules are shown below for stochastic and deterministic shows how the particle position and velocity are updated (Equations (1) and (2)):
v i ( t ) = w v i ( t 1 ) + ρ 1 ( X P b e s t i x i ( t ) ) + ρ 2 ( X G b e s t i x i ( t ) )
x i ( t ) = x i ( t 1 ) + v i ( t )
The x represents an inertia weight,
ρ 1 and ρ 2   represents the random variables.
The random variables are stated as ρ 1 = r 1 c 1 and ρ 2 = r 2 c 2 , with r 1 , r 2 , U ( 0 , 1 ) , and C 1 and C 2 represents the non-negative acceleration constants. The weights of the increment in the stochastic speed variables, which extends a particle to P b e s t and G b e s t are encouraged by the constant speeding of C 1 and C 2 . When there is a minute quality, a particle can stray away from the target output locales. However, enormous qualities caused a sudden creation of particles by targeting locales. In this research, with regards to the average practice in [69], both constants C 1 and C 2 are regarded as 2.0. The overall best possible amendment of dormancy x in Equation (2), which offers a harmonious relationship between the global situation and investigations that cause a decrease in the quantity of emphases, was required to find enough appropriate arrangement. In this research, a latency rectification capability known as the “idleness weight approach (IWA)” is applied [70]. During the application of IWA, the latency weight x is changed depending on the following relationship:
ω = ω m a x ω m a x ω m i n I t r m a x I t r
In Equation (3), ω m a x and ω m i n indicates the initial and final inertia weights. In addition, I t r m a x is also known as the maximum number of iterations compared to I t r , representing the current iteration number. In this research, the particle swarm optimization technique is applied to offer assistance in ANFIS-PSO modelling, especially when adjusting or fine-tuning the variables of the membership functions [70]. The significant advantage of applying the particle swarm optimization method is its friendly approach to computations in a particular size network framework. In this research, we used the triangular shape as the membership function due to its simplicity as compared to trapezoidal and Gaussian membership functions. The flowchart of the methodology used during the ANFIS-PSO modelling training and testing is shown in the Figure 5 [71]. The swarm that exists in the PSO is created by using the population of random results. Almost every likely solution is regarded as a particle. The position of a particle is represented by S ¯ i . Furthermore, a particle swarm travels via the problem space, and the velocity of the particle is represented by v ¯ i . At every timestep, an f function is evaluated depending on S ¯ i . which is used as an input. Every particle supervises the track of its optimal position related to the optimal fitness that it has obtained in a vector known as p ¯ i . The most appropriate position known by any neighbourhood member is monitored in p i g ¯ . For a worldwide type of particle swarm optimization, the most appropriate particle position in the overall population is indicated by p i g ¯ . In Figure 5 the step by step of how the ANFIS-PSO model was developed is illustrated.
Based on the velocities and positions of each particle that is changed depending upon the following relation, we used Equation (4) [35]:
S ¯ i ( t + 1 ) = S ¯ i ( t ) + v ¯ i ( t + 1 )
The application of PSO to construct an FS or determine the process of optimization of all non-attached parameters in a fuzzy system is explained by using the equation below [35],
R i :   if   x 1 ( k )   is   A i 1   And And   x n ( k )   is   A i n
Then u ( k ) is a i
  • where k is represented by the time step,
  • x 1 ( k ) , ,   x n ( k ) are known as the input parameters
  • u ( k ) indicates the system output parameter
  • A i j   represents the fuzzy sets
  • a i is known as the crisp variables
Immediately after creating the rule and process of initialization, the previous antecedent aspect variables can be selected. PSO does the job of searching for the optimal antecedent part variables. The size of the population in the PSO is synonymous to the P s . The overall performance of every particle is evaluated depending on the fuzzy systems it is trying to solve. The function used for evaluation f is stated as the error-index E ( t ) as explained above. Accordingly, f represents the individual best position p ¯ i for every particle and the global best particle p i g ¯ . and in the determination of the entire population.
The position and speed of each particle are re-arranged by Equations (4) and (5), individually. The overall learning guideline is carried out by using a predefined paradigm shift [35]. The primary PSO variables are stated in Table 3. These variables signify the population’s domain size, maximum iterations numbers, inertia and weight damping ratio, coefficient of personal learning, and coefficient of global learning. These variables are evaluated by using the trial-and-error approach and presenting the optimum parameters for this research.
During the ANFIS-PSO model training and testing, an extensive iteration was carried out in the MATLAB environment to achieve a suitable combination of the inputs and the outputs associated with the traffic dataset. The traffic flow variables used for the PSO-ANFIS training and testing were created from the traffic datasets by frequently training the traffic datasets, including 1000 iterations in the MATLAB environment, to achieve an almost perfect extensive integration of the PSO-ANFIS network. It is important to note that during the PSO-ANFIS model training, the training will only stop when the objective function of the hybrid model has been achieved. Some guidelines were adhered to during the ANFIS-PSO model training and testing:
  • ❖ 1000 maximum iteration must be achieved.
  • ❖ The model training run in the MATLAB environment will be stopped only when the objective functions don’t achieve the required parameter.
The following stages in Figure 6 were adhered to during the training and testing of the PSO-ANFIS model:

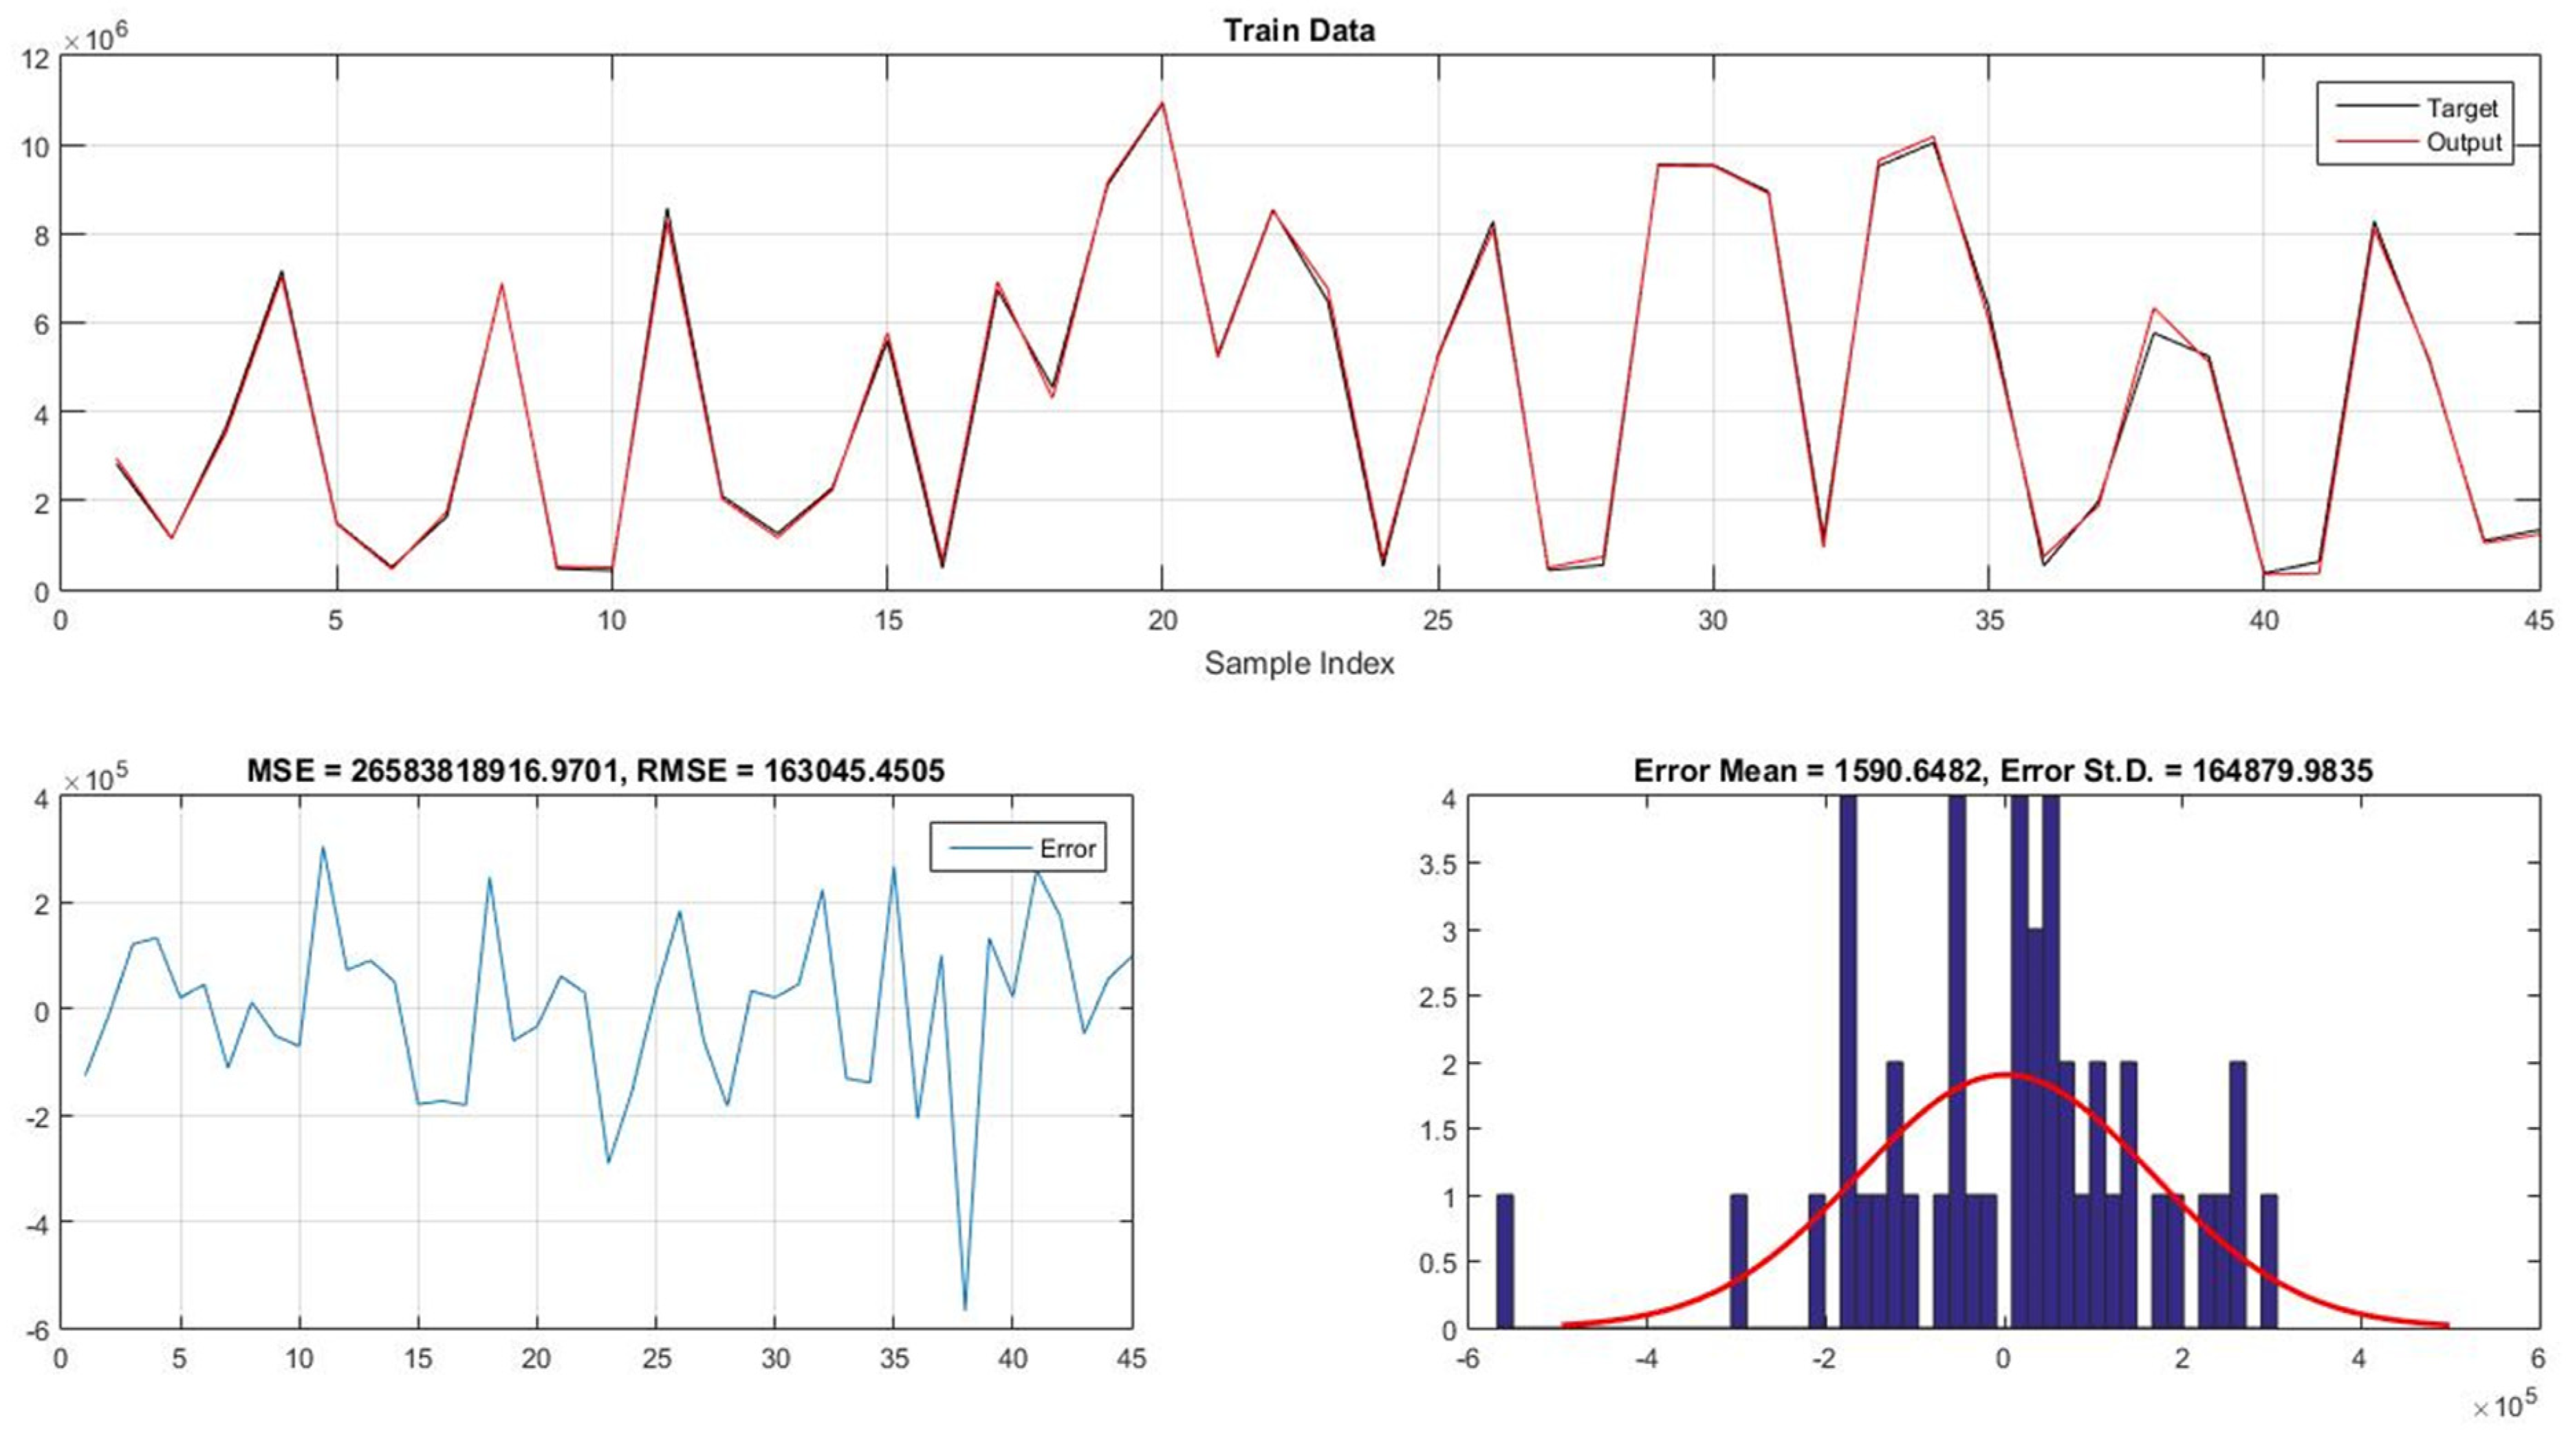
Performance Evaluation of ANFIS-PSO Model

To determine the efficiency of the ANFIS-PSO modelling approach, these criteria are applied are listed below.
  • Root Mean Square Error (RMSE)
R M S E = i = 1 n ( O i P i ) 2 n
2.
Determination of Coefficient ( R 2 )
R 2 = [ i = 1 n ( O i O ¯ i ) · ( P i P ¯ i ) ] 2 i = 1 n ( O i O ¯ i ) · i = 1 n ( P i P ¯ i )
where;
O i   i s   t h e   p r e d i c t e d   v a r i a b l e s   o f   t h e   v e h i c u l a r   t r a f f i c   f l o w P i   i s   t h e   m e a s u r e m e n t   p a r a m e t e r s   o f   t h e   f r e e w a y s   v e h i c u l a r   t r a f f i c   f l o w n = t h e   o v e r a l l   n u m b e r   o f   t h e   t r a f f i c   d a t a   u s e d   f o r   t e s t i n g   t h e   A N F I S P S O   m o d e l

4. Results and Discussions

The 650 traffic datasets obtained from the five busiest freeways on the South African Road Network were divided into 517 for the training of the ANFIS-PSO model and 133 for testing the optimal performance of the model as shown in Table 3. To achieve the best optimum performance, a trial-and-error approach was applied during the ANFIS-PSO model training and testing to find the optimal parameter for the number of population and number of iterations. The best optimal parameters for the performance training and testing of the ANFIS-PSO model of traffic flow is shown below
Figure 7 and Figure 8 below show the ANFIS-PSO model’s corresponding performance on the traffic flow of vehicles at the five-freeway using the South Africa traffic flow system as a case study. The results show a training and testing performance indices of R 2 value of 0.9978 and 0.9860 for both the training and testing performance of the ANFIS-PSO. It can be determined from the graphs shown in Figure 9 and Figure 10 that the ANFIS-PSO hybrid model results that the optimal training and testing performance was obtained by using 1000 number iterations and 50 population sizes and taking into consideration the inertia weight, the inertial damping ration and both the coefficient of personal and global learning. Another significance of the model results is that the ANFIS-PSO parameters significantly affect the prediction performance of the usage of the traffic datasets from the five freeways. Another significant observation from the ANFIS-PSO model results is that the accelerating parameters and mean square error are vital in evaluating the optimal performance of the model on the traffic data obtained from each freeway. It means that the lower the mean square error obtained during model training and testing, the more likely the model’s training and testing performance will reach optimum.
The single most interesting observation to emerge from the results is that when an ANFIS-PSO model contains the minimum mean square error and maximum correlation coefficient R 2 , it can be deduced that the model is superior. The result of this study suggests that the value of regression for the training and testing performance of the model for each of the five freeways suggests that the traffic flow parameters used for the inputs and output are well correlated. Overall, these results indicate that whenever the regression (R) value is closer to or approximately 1, it indicates an efficient linear relevance between the traffic flow inputs and target from the traffic data gotten from the South African freeways. The training and testing performance of the model was evaluated by plotting a graph in a Microsoft excel sheet using the actual traffic volume, and the predicted traffic volume gotten from the MATLAB environment immediately after the ANFIS-PSO model training and testing on the traffic data. The predicted traffic volume was plotted against the actual traffic volume to determine the regression value for the model training and testing.

5. Conclusions and Recommendations

The main goal of the current study was to determine the performance evaluation of the metaheuristic model (ANFIS-PSO) on the modelling of traffic flow at five major freeways using traffic flow data evidence from South Africa. In this research, a novel hybrid predictive approach was proposed to predict vehicular traffic flow at five major South African freeways. This predictive approach works depending on the combination of ANFIS and PSO. The application of this predictive model in this research has been adjudged based on the result of this research to be novel and efficient. The results show that the accuracy of the ANFIS-PSO is optimal enough to predict the optimum variables of freeway traffic flow. ANFIS–PSO is a soft computing approach that has displayed an acceptable learning and predictive strength during this research. The following was concluded based on the findings of this research.
  • The findings of this research suggest that, in general, the accuracy and effectiveness of the ANFIS-PSO model are suitable for predicting optimal performance parameters of traffic flow of vehicles at freeways.
  • The evidence from this study suggests that it is significant to understand and identify common features of vehicular traffic flow and how it affects the traffic volume of vehicles at major freeways.
  • This study has achieved the successful development of an adaptive neuro-fuzzy inference system optimized by particle swarm optimization for modelling vehicular traffic flow at freeways.
  • The second major finding was that the, from the results obtained during the ANFIS-PSO model training and testing of traffic datasets from each freeway, it could be deduced that there is an optimum performance of the ANFIS-PSO model. The effectiveness and efficiency of the ANFIS-PSO model are better than the conventional models well actuated and feed controller in different traffic flow conditions.
  • The Multiple regression analysis for both the ANFIS-PSO model training and testing (0.9978 and 0.9860) provides an excellent predictive approach compared to other predictive models. In congruence with past literature, in which various predictive models were used, the ANFIS-PSO model possesses a high predictability level. This result has proven that the ANFIS-PSO model can model the traffic flow of vehicles at freeways with high accuracy by creating an agglomeration of appropriate fuzzy rules and neuron weights. The most significant advantage of ANFIS-PSO over other models discovered in this research is the ability of the model to calculate suitable regression values for the input and output traffic variables, considering the membership functions associated with those variables.
  • In general, the results of this research have shown the ANFIS-PSO model’s capability to address the primary shortcoming of artificial neural networks without evaluating the structure of the network and the trapping of the local optimum performance.
  • This research extends our knowledge of metaheuristic models in predicting the traffic flow of vehicles at freeways. It also significantly adds to the growing body of literature regarding the combination of particle swarm optimization to existing heuristics models.

5.1. Recommendations

This study has exposed many research questions in need of further investigations:
  • It would be interesting to assess the impacts of COVID-19 on the traffic flow of vehicles using other metaheuristics models such as ANN-PSO and ANFIS-GA.
  • Further work needs to be done to establish whether other existing traffic flow variables can be used to model traffic flow using conventional and artificial intelligence models.
  • Further research needs to examine the links between traffic flow variables such as traffic volume, traffic density, speed, and time.
  • A natural progression of this work will be in exploring areas of determining and evaluating the feasibilities of traffic volume prediction using different types of swarm and evolutionary optimization algorithms
  • Finally, further research needs to explore the significance difference between application of spatiotemporal and metaheuristics models in the modelling of vehicular traffic flow using traffic data from road intersections or freeways.

5.2. Limitations

Although the research study has successfully demonstrated that the ANFIS-PSO model is capable of predicting the traffic flow of vehicles on freeways, it has certain limitations:
  • The number of traffic data used; it is always important when predicting to make use of a large volume of data to achieve optimal performance as much as possible.
  • During the traffic data collection, the traffic flow of vehicles might have been affected by extreme weather, vehicular accidents on the freeways, and other unforeseeable factors.

Author Contributions

Conceptualization, I.O.O.; Data curation, I.O.O., L.K.T.; Formal analysis, I.O.O., A.S., L.K.T., F.A. and Z.C.; Funding acquisition, A.S., L.K.T., F.A. and Z.C.; Investigation, I.O.O., A.S., L.K.T., F.A. and Z.C.; Methodology, I.O.O.; Resources, L.K.T.; Supervision, A.S.; Validation, I.O.O.; Visualization, I.O.O. and F.A.; Writing—original draft, I.O.O.; Writing—review & editing, I.O.O., A.S., F.A. and Z.C. All authors have read and agreed to the published version of the manuscript.

Funding

This research received no external funding.

Institutional Review Board Statement

Not applicable.

Informed Consent Statement

Not applicable.

Data Availability Statement

The traffic datasets used for this research study are available on reasonable request from the South Africa Ministry of Transportation and South African National Roads Agency Limited (SANRAL). The ANFIS-PSO codes used for this research can be found in https://yarpiz.com/319/ypfz104-evolutionary-anfis-training, accessed on 29 October 2021.

Conflicts of Interest

The authors declare no conflict of interest. The funders had no role in the design of the study; in the collection, analyses, or interpretation of data; in the writing of the manuscript, or in the decision to publish the results.

Appendix A

Table A1. Characteristics of the Five Freeways.
FreewaysDatesNumber of LanesLane DescriptionsTraffic Flow DirectionsNumber of VehiclesLongitudeType of PavementLatitudeLength (km)
01—Lane to JohannesburgSouthbound
02—Middle Lane to JohannesburgSouthbound
03—Lane to JohannesburgSouthbound
N 115 July 2019–24 July 2019404—On-Ramp joining N3Southbound21,097,15226.1669Asphalt29.09611940
05—lane from N1Southbound
06—Middle Lane from N1 Southbound
07—Lane from N1 (Polokwane)Southbound
01—Lane to Johannesburg Northbound
02—Middle Lane to JohannesburgNorthbound
N 3 15 July 2019–24 July 2019 303—Middle Lane to JohannesburgNorthbound12,240,26028.341483Asphalt−26.468419579
04—Lane to JohannesburgNorthbound
05—The Off-Ramp to R10 1N Southbound
N 1215 July 2019–24 July 2019 01—lane to JohannesburgSouthbound20,448,02329.227533Asphalt−25.9223411353
02—Middle Lane to JohannesburgSouthbound
03—Middle Lane to JohannesburgSouthbound
04—Lane to JohannesburgSouthbound
05—Off-Ramp to Ultra citySouthbound
06—Fastlane, Off-RampSouthbound
07—Off-Ramp to Samrand AvenueSouthbound
01—lane to JohannesburgSouthbound
02—Middle Lane to JohannesburgSouthbound
N 1415 July 2019–24 July 2019403—Middle Lane to JohannesburgSouthbound 16,051,12427.847201Asphalt−26.0336681195
04—Lane to JohannesburgSouthbound
05—Off-Ramp to R56 2Southbound
01—lane to JohannesburgSouthbound
02—Middle Lane to JohannesburgSouthbound
N 1715 July 2019–24 July 2019403—Middle Lane to JohannesburgSouthbound18,262,04830.9885Asphalt−26.2126330
04—Lane to JohannesburgSouthbound
05—Off-Ramp to New RoadSouthbound
Table A2. Sample of Vehicular Traffic flow datasets used for the Research.
Light Vehicle Long Truck Medium Truck Short Truck
Dates and Period of the DaySpeed (km/h)Number of Light VeiclesTime (s)Speed (km/h)Number of Long TrucksTime (s)Speed (km/h)Number of Medium TrucksTime (s)Speed (km/h)Number of Short TrucksTime (s)Traffic Density (Vehicles/km)Traffic Volume (Number of Vehicles/Time)
15 July 2019
11151438230874429892292829751276223574 868
26529,93448949197960591885917062554244215,416,190
310618,213245813083218527731595105627828366,882,973
410322,34425582321316852633089786527133997,996,735
5109307124481140319837034993962854821,163,614
16 July 2019
111112342378211531384353069554277205504,994
26028,84456552258833522067506563558642784,544,699
310724,793241833383108833229899143726438439,543,915
410322,57725481269318862583029891927034328,120,977
5110343224181162320849131595942785401,323,411
17 July 2019
111310052338584305914328610356256170425,123
27631,39242267225540702345208475837846586,666,994
310625,480243823763138733129799150326639569,737,896
410322,99925482299313872712989793227235008,284,089
51103736240821413138674303941082825801,431,353
18 July 2019
11131114232869530188312999465283186468,260
27431,06043065287582652405808375139846206,469,966
310625,977244833513118834529798152127040289,880,675
410323,05125481308319842583119587027834988,244,838
51103876240791523348370317971152706021,481,270
19 July 2019
11131296233848530987562989651281213531,622
25828,40869148283991492339816468663042303,682,757
310427,9702488138331785356305971522273431910,412,641
410224,08025681351316852573079891627036588,571,413
511053062408212631785723141011112608021,993,989
20 July 2019
11101853241848431182323219752269289710,172
211113,178232832133128514130710342125719935,135,566
310922,552237822053158920229610465625433748,544,563
410817,034241811723218612031010642624825366,335,493
5110571724079483248842298102712588402,103,922
21 July 2019
11101700244823631986223069721266254623,026
2113726623184112311856730710615624810862,821,822
311417,208227851113029513227911234023425426,737,959
411019,043236841283099312228111235023428067,167,665
5112394023685593068139327103652585861,490,162
22 July 2019
111312902318551304902929010053261203520,392
26431,00352554225806561888097160849645755,240,023
310723,657243824353158734630097146827037019,095,988
410322,29225681293317852563079883426833827,948,635
5110298924280138324818332293842834711,145,786
23 July 2019
111312582328412230888342949245288208522,734
26630,00750757219771582146627367345644455,280,114
310624,620245813513178632330597151627238309,350,828
410322,52225581282320862573069788627234218,063,400
5110329724081124317826531895832765101,259,688
24 July 2019
11131040233859230284413149349283175434,026
26629,98350959265630581996987569748144495,273,322
310625,084244813573198534030597147927438949,518,832
410323,04925481325318872613029793727435108,284,807
51103488240811573217974336951012775461,339,216
Figure A1. N1 Freeway.
Infrastructures 07 00002 g0a1
Figure A2. N3 Freeway.
Infrastructures 07 00002 g0a2
Figure A3. N12 freeway.
Infrastructures 07 00002 g0a3
Figure A4. N14 Freeway.
Infrastructures 07 00002 g0a4
Figure A5. N17 Freeway.
Infrastructures 07 00002 g0a5
Note
  • 1: 00:00:00–04:59:59 (Off-peak),
  • 2: 05:00:00–09:59:59 (On-peak)
  • 3: 10:00:00–14:59:59 (On-peak)
  • 4: 15:00:00–19:59:59 (On-peak)
  • 5: 20:00:00–23:59:59 (Off-peak).
Off-Peak; This is when the number of vehicles on the road is low, i.e., the traffic density is low, thereby allowing free-flowing traffic of vehicles on the freeway.
On-Peak; This is when the traffic volume is low due to a high traffic density. This period is usually the time that traffic congestion will likely occur on the freeway.

References

  1. Wang, W.; Zhang, H.; Li, T.; Guo, J.; Huang, W.; Wei, Y.; Cao, J. An interpretable model for short term traffic flow prediction. Math. Comput. Simul. 2020, 171, 264–278. [Google Scholar] [CrossRef]
  2. Deng, S.; Jia, S.; Chen, J. Exploring spatial-temporal relations via deep convolutional neural networks for traffic flow prediction with incomplete data. Appl. Soft Comput. 2019, 78, 712–721. [Google Scholar] [CrossRef]
  3. Emami, A.; Sarvi, M.; Bagloee, S.A. Short-term traffic flow prediction based on faded memory Kalman Filter fusing data from connected vehicles and Bluetooth sensors. Simul. Model. Pract. Theory 2020, 102, 102025. [Google Scholar] [CrossRef]
  4. Li, F.; Liao, S.S.; Cai, M. A new probability statistical model for traffic noise prediction on free flow roads and control flow roads. Transp. Res. Part D Transp. Environ. 2016, 49, 313–322. [Google Scholar] [CrossRef]
  5. Aramini, B.; Fan, J. Technique for myasthenia gravis: Subxiphoid approach. Thorac. Surg. Clin. 2019, 29, 195–202. [Google Scholar] [CrossRef] [PubMed]
  6. Candini, O.; Grisendi, G.; Foppiani, E.M.; Brogli, M.; Aramini, B.; Masciale, V.; Spano, C.; Petrachi, T.; Veronesi, E.; Conte, P.; et al. A novel 3D in vitro platform for pre-clinical investigations in drug testing, gene therapy, and immuno-oncology. Sci. Rep. 2019, 9, 7154. [Google Scholar] [CrossRef] [PubMed] [Green Version]
  7. Li, L.; Su, X.; Wang, Y.; Lin, Y.; Li, Z.; Li, Y. Robust causal dependence mining in big data network and its application to traffic flow predictions. Transp. Res. Part C Emerg. Technol. 2015, 58, 292–307. [Google Scholar] [CrossRef]
  8. Taghipour, A.; Frayret, J.-M. Negotiation-based coordination in supply chain: Model and discussion. In Proceedings of the 2010 IEEE International Conference on Systems, Man and Cybernetics, Istanbul, Turkey, 10–13 October 2010; pp. 1643–1649. [Google Scholar]
  9. Vosooghidizaji, M.; Taghipour, A.; Canel-Depitre, B. Supply chain coordination under information asymmetry: A review. Int. J. Prod. Res. 2020, 58, 1805–1834. [Google Scholar] [CrossRef]
  10. Shang, Q.; Lin, C.; Yang, Z.; Bing, Q.; Zhou, X. A hybrid short-term traffic flow prediction model based on singular spectrum analysis and kernel extreme learning machine. PLoS ONE 2016, 11, e0161259. [Google Scholar] [CrossRef] [PubMed]
  11. Li, W.; Wang, J.; Fan, R.; Zhang, Y.; Guo, Q.; Siddique, C.; Ban, X.J. Short-term traffic state prediction from latent structures: Accuracy vs. efficiency. Transp. Res. Part C Emerg. Technol. 2020, 111, 72–90. [Google Scholar] [CrossRef]
  12. Brockmann, D.; Hufnagel, L.; Geisel, T. The scaling laws of human travel. Nature 2006, 439, 462–465. [Google Scholar] [CrossRef]
  13. Qin, H.; Li, H.; Zhao, X. Development status of domestic and foreign smart city. Glob. Presence 2010, 9, 50–52. [Google Scholar]
  14. Ukaegbu, U.; Tartibu, L.; Laseinde, T.; Okwu, M.; Olayode, I. A deep learning algorithm for detection of potassium deficiency in a red grapevine and spraying actuation using a raspberry pi3. In Proceedings of the 2020 International Conference on Artificial Intelligence, Big Data, Computing and Data Communication Systems (icABCD), Durban, South Africa, 6–7 August 2020; pp. 1–6. [Google Scholar]
  15. Ukaegbu, U.F.; Tartibu, L.K.; Okwu, M.O.; Olayode, I.O. Development of a Light-Weight Unmanned Aerial Vehicle for Precision Agriculture. Sensors 2021, 21, 4417. [Google Scholar] [CrossRef] [PubMed]
  16. An, S.-H.; Lee, B.-H.; Shin, D.-R. A survey of intelligent transportation systems. In Proceedings of the 2011 Third International Conference on Computational Intelligence, Communication Systems and Networks, Bali, Indonesia, 26–28 July 2011; pp. 332–337. [Google Scholar]
  17. Castro-Neto, M.; Jeong, Y.-S.; Jeong, M.-K.; Han, L.D. Online-SVR for short-term traffic flow prediction under typical and atypical traffic conditions. Expert Syst. Appl. 2009, 36, 6164–6173. [Google Scholar] [CrossRef]
  18. Chen, H.; Rakha, H.A. Real-time travel time prediction using particle filtering with a non-explicit state-transition model. Transp. Res. Part C Emerg. Technol. 2014, 43, 112–126. [Google Scholar] [CrossRef]
  19. Severino, A.; Pappalardo, G.; Curto, S.; Trubia, S.; Olayode, I.O. Safety Evaluation of Flower Roundabout Considering Autonomous Vehicles Operation. Sustainability 2021, 13, 10120. [Google Scholar] [CrossRef]
  20. Al-Kadi, O.; Al-Kadi, O.; Al-Sayyed, R.; Alqatawna, J.F. Road scene analysis for determination of road traffic density. Front. Comput. Sci. 2014, 8, 619–628. [Google Scholar] [CrossRef]
  21. Chin, A.T. Containing air pollution and traffic congestion: Transport policy and the environment in Singapore. Atmos. Environ. 1996, 30, 787–801. [Google Scholar] [CrossRef]
  22. Rosenlund, M.; Forastiere, F.; Stafoggia, M.; Porta, D.; Perucci, M.; Ranzi, A.; Nussio, F.; Perucci, C.A. Comparison of regression models with land-use and emissions data to predict the spatial distribution of traffic-related air pollution in Rome. J. Expo. Sci. Environ. Epidemiol. 2008, 18, 192–199. [Google Scholar] [CrossRef] [Green Version]
  23. Krzyżanowski, M.; Kuna-Dibbert, B.; Schneider, J. Health Effects of Transport-Related Air Pollution; WHO Regional Office Europe: Copenhagen, Denmark, 2005. [Google Scholar]
  24. Qian, Z.S.; Rajagopal, R. Optimal dynamic parking pricing for morning commute considering expected cruising time. Transp. Res. Part C Emerg. Technol. 2014, 48, 468–490. [Google Scholar] [CrossRef]
  25. De Gier, J.; Garoni, T.M.; Rojas, O. Traffic flow on realistic road networks with adaptive traffic lights. J. Stat. Mech. Theory Exp. 2011, 2011, P04008. [Google Scholar] [CrossRef] [Green Version]
  26. Zhang, J.; Wang, F.-Y.; Wang, K.; Lin, W.-H.; Xu, X.; Chen, C. Data-driven intelligent transportation systems: A survey. IEEE Trans. Intell. Transp. Syst. 2011, 12, 1624–1639. [Google Scholar] [CrossRef]
  27. INRIX. Inrix Parking Solutions. 2017. Available online: http://www2.inrix.com/parking-solutions (accessed on 20 October 2021).
  28. Olayode, O.; Tartibu, L.; Okwu, M. Application of Artificial Intelligence in Traffic Control System of Non-Autonomous Vehicles at Signalized Road Intersection. Proc. CIRP 2020, 91, 194–200. [Google Scholar] [CrossRef]
  29. Isaac, O.O.; Tartibu, L.K.; Okwu, M.O. Prediction and Modelling of Traffic Flow of Human-Driven Vehicles at a Signalized Road Intersection Using Artificial Neural Network Model: A South Africa Road Transportation System Scenario. Transp. Eng. 2021, 6, 100095. [Google Scholar]
  30. Olayode, I.O.; Tartibu, L.K.; Okwu, M.O. Traffic Flow Prediction at Signalized Road Intersections: A Case of Markov Chain and Artificial Neural Network Model. In Proceedings of the 2021 IEEE 12th International Conference on Mechanical and Intelligent Manufacturing Technologies (ICMIMT), Cape Town, South Africa, 13–15 May 2021; pp. 287–292. [Google Scholar]
  31. Yang, X.; Yu, Q.; He, L.; Guo, T. The one-against-all partition based binary tree support vector machine algorithms for multi-class classification. Neurocomputing 2013, 113, 1–7. [Google Scholar] [CrossRef]
  32. Petković, D.; Ćojbašić, Ž.; Nikolić, V.; Shamshirband, S.; Kiah, M.L.M.; Anuar, N.B.; Wahab, A.W.A. Adaptive neuro-fuzzy maximal power extraction of wind turbine with continuously variable transmission. Energy 2014, 64, 868–874. [Google Scholar] [CrossRef]
  33. Deng, Y.; Ren, Z.; Kong, Y.; Bao, F.; Dai, Q. A hierarchical fused fuzzy deep neural network for data classification. IEEE Trans. Fuzzy Syst. 2016, 25, 1006–1012. [Google Scholar] [CrossRef]
  34. Chen, C.P.; Zhang, C.-Y.; Chen, L.; Gan, M. Fuzzy restricted Boltzmann machine for the enhancement of deep learning. IEEE Trans. Fuzzy Syst. 2015, 23, 2163–2173. [Google Scholar] [CrossRef]
  35. Olayode, I.O.; Tartibu, L.K.; Okwu, M.O.; Severino, A. Comparative Traffic Flow Prediction of a Heuristic ANN Model and a Hybrid ANN-PSO Model in the Traffic Flow Modelling of Vehicles at a Four-Way Signalized Road Intersection. Sustainability 2021, 13, 10704. [Google Scholar] [CrossRef]
  36. Liebig, T.; Piatkowski, N.; Bockermann, C.; Morik, K. Dynamic route planning with real-time traffic predictions. Inf. Syst. 2017, 64, 258–265. [Google Scholar] [CrossRef]
  37. Smith, B.L.; Williams, B.M.; Oswald, R.K. Comparison of parametric and nonparametric models for traffic flow forecasting. Transp. Res. Part C Emerg. Technol. 2002, 10, 303–321. [Google Scholar] [CrossRef]
  38. Chen, C.; Hu, J.; Meng, Q.; Zhang, Y. Short-time traffic flow prediction with ARIMA-GARCH model. In Proceedings of the 2011 IEEE Intelligent Vehicles Symposium (IV), Baden, Germany, 5–9 June 2011; pp. 607–612. [Google Scholar]
  39. Li, J.-Q. Discretization modeling, integer programming formulations and dynamic programming algorithms for robust traffic signal timing. Transp. Res. Part C Emerg. Technol. 2011, 19, 708–719. [Google Scholar] [CrossRef]
  40. Aifadopoulou, G.; Bratsas, C.; Koupidis, K.; Chatzopoulou, A.; Salanova, J.-M.; Tzenos, P. Short-Term Prediction of the Traffic Status in Urban Places Using Neural Network Models. In The 4th Conference on Sustainable Urban Mobility; Springer: Cham, Switzerland; Skiathos Island, Greece, 2018; pp. 181–188. [Google Scholar]
  41. Olayode, I.O.; Tartibu, L.K.; Okwu, M.O.; Ukaegbu, U.F. Development of a Hybrid Artificial Neural Network-Particle Swarm Optimization Model for the Modelling of Traffic Flow of Vehicles at Signalized Road Intersections. Appl. Sci. 2021, 11, 8387. [Google Scholar] [CrossRef]
  42. Vlahogianni, E.I.; Karlaftis, M.G.; Golias, J.C. Optimized and meta-optimized neural networks for short-term traffic flow prediction: A genetic approach. Transp. Res. Part C Emerg. Technol. 2005, 13, 211–234. [Google Scholar] [CrossRef]
  43. Nellore, K.; Hancke, G.P. A survey on urban traffic management system using wireless sensor networks. Sensors 2016, 16, 157. [Google Scholar] [CrossRef] [Green Version]
  44. Bratsas, C.; Koupidis, K.; Salanova, J.-M.; Giannakopoulos, K.; Kaloudis, A.; Aifadopoulou, G. A comparison of machine learning methods for the prediction of traffic speed in urban places. Sustainability 2020, 12, 142. [Google Scholar] [CrossRef] [Green Version]
  45. Barchi, A.C.; Ito, S.; Escaramboni, B.; de Oliva Neto, P.; Herculano, R.D.; Miranda, M.C.R.; Passalia, F.J.; Rocha, J.C.; Núñez, E.G.F. Artificial intelligence approach based on near-infrared spectral data for monitoring of solid-state fermentation. Process Biochem. 2016, 51, 1338–1347. [Google Scholar] [CrossRef] [Green Version]
  46. Adnan, M.M.; Sarkheyli, A.; Zain, A.M.; Haron, H. Fuzzy logic for modeling machining process: A review. Artif. Intell. Rev. 2015, 43, 345–379. [Google Scholar] [CrossRef]
  47. Almási, A.-D.; Woźniak, S.; Cristea, V.; Leblebici, Y.; Engbersen, T. Review of advances in neural networks: Neural design technology stack. Neurocomputing 2016, 174, 31–41. [Google Scholar] [CrossRef]
  48. Olayode, I.O.; Tartibu, L.K.; Okwu, M.O. Application of Fuzzy Mamdani Model for Effective Prediction of Traffic Flow of Vehicles at Signalized Road Intersections. In Proceedings of the 2021 IEEE 12th International Conference on Mechanical and Intelligent Manufacturing Technologies (ICMIMT), Cape Town, South Africa, 13–15 May 2021; pp. 219–224. [Google Scholar]
  49. Ali, M.; Ghatol, A. A neuro-fuzzy inference system for student modeling in web-based intelligent tutoring systems. In Proceedings of International Conference on Cognitive Systems; Citeseer: New Delphi, India, 2004; pp. 14–19. [Google Scholar]
  50. Khameneh, N.B.; Arabalibeik, H.; Salehian, P.; Setayeshi, S. Abnormal red blood cells detection using adaptive neuro-fuzzy system. In Medicine Meets Virtual Reality; IOS Press BV: Amsterdam, The Netherlands, 2012; pp. 30–34. [Google Scholar]
  51. Fang, H. Adaptive neurofuzzy inference system in the application of the financial crisis forecast. Int. J. Innov. Manag. Technol. 2012, 3, 250. [Google Scholar]
  52. Chakrapani, Y.; Soundararajan, K. Adaptive neuro-fuzzy inference system based fractal image compression. Int. J. Recent Trends Eng. 2009, 2, 47. [Google Scholar]
  53. Patil, S.; Mandal, S.; Hegde, A.; Alavandar, S. Neuro-fuzzy based approach for wave transmission prediction of horizontally interlaced multilayer moored floating pipe breakwater. Ocean Eng. 2011, 38, 186–196. [Google Scholar] [CrossRef]
  54. Topalov, A.V.; Kayacan, E.; Oniz, Y.; Kaynak, O. Adaptive neuro-fuzzy control with sliding mode learning algorithm: Application to antilock braking system. In Proceedings of the 2009 7th Asian Control Conference, Hong Kong, China, 27–29 August 2009; pp. 784–789. [Google Scholar]
  55. Dastranj, M.R.; Ebroahimi, E.; Changizi, M.; Sameni, E. Control DC motorspeed with adaptive neuro-fuzzy control (ANFIS). Aust. J. Basic Appl. Sci. 2011, 5, 1499–1504. [Google Scholar]
  56. Cheng, C.-B.; Lee, E. Applying fuzzy adaptive network to fuzzy regression analysis. Comput. Math. Appl. 1999, 38, 123–140. [Google Scholar] [CrossRef] [Green Version]
  57. Loukas, Y.L. Adaptive neuro-fuzzy inference system: An instant and architecture-free predictor for improved QSAR studies. J. Med. Chem. 2001, 44, 2772–2783. [Google Scholar] [CrossRef]
  58. Cai, C.; Du, D.; Liu, Z. Battery state-of-charge (SOC) estimation using adaptive neuro-fuzzy inference system (ANFIS). In The 12th IEEE International Conference on Fuzzy Systems, 2003, FUZZ’03, St. Louis, MO, USA, 25–28 May 2003; IEEE: Piscataway, NJ, USA, 2003; Volume 2, pp. 1068–1073. [Google Scholar]
  59. Do, L.N.; Vu, H.L.; Vo, B.Q.; Liu, Z.; Phung, D. An effective spatial-temporal attention based neural network for traffic flow prediction. Transp. Res. Part C Emerg. Technol. 2019, 108, 12–28. [Google Scholar] [CrossRef]
  60. Yang, B.; Sun, S.; Li, J.; Lin, X.; Tian, Y. Traffic flow prediction using LSTM with feature enhancement. Neurocomputing 2019, 332, 320–327. [Google Scholar] [CrossRef]
  61. Tang, J.; Chen, X.; Hu, Z.; Zong, F.; Han, C.; Li, L. Traffic flow prediction based on combination of support vector machine and data denoising schemes. Phys. A Stat. Mech. Appl. 2019, 534, 120642. [Google Scholar] [CrossRef]
  62. Zhao, L.; Zhou, Z.; Lu, H.; Fujita, H. Parallel computing method of deep belief networks and its application to traffic flow prediction. Knowl.-Based Syst. 2019, 163, 972–987. [Google Scholar] [CrossRef]
  63. Zaki, J.; Ali-Eldin, A.; Hussein, S.E.; Saraya, S.F.; Areed, F.F. Framework for Traffic Congestion Prediction. Int. J. Sci. Eng. Res. 2016, 7, 1205–1210. [Google Scholar]
  64. Chaulya, S.; Prasad, G. Mine transport surveillance and production management system. In Sensing and Monitoring Technologies for Mines and Hazardous Areas; Elsevier: Amsterdam, The Netherlands, 2016; pp. 87–160. [Google Scholar]
  65. Kennedy, J.; Eberhart, R. Particle swarm optimization. In Proceedings of the ICNN ‘95-International Conference on Neural Networks, Perth, WA, Australia, 27 November–1 December 1995. [Google Scholar] [CrossRef]
  66. Bashir, Z.; El-Hawary, M. Applying wavelets to short-term load forecasting using PSO-based neural networks. IEEE Trans. Power Syst. 2009, 24, 20–27. [Google Scholar] [CrossRef]
  67. Yu, W.; Li, X. Fuzzy identification using fuzzy neural networks with stable learning algorithms. IEEE Trans. Fuzzy Syst. 2004, 12, 411–420. [Google Scholar] [CrossRef]
  68. Yuan, X.; Wang, L.; Yuan, Y. Application of enhanced PSO approach to optimal scheduling of hydro system. Energy Convers. Manag. Res. News 2008, 49, 2966–2972. [Google Scholar] [CrossRef]
  69. Kennedy, J. The behavior of particles. In International Conference on Evolutionary Programming; Springer: San Diego, CA, USA, 25–27 March 1998; pp. 579–589. [Google Scholar]
  70. Shoorehdeli, M.A.; Teshnehlab, M.; Sedigh, A.K.; Khanesar, M.A. Identification using ANFIS with intelligent hybrid stable learning algorithm approaches and stability analysis of training methods. Appj. Soft Comput. 2009, 9, 833–850. [Google Scholar] [CrossRef]
  71. Basser, H.; Karami, H.; Shamshirband, S.; Akib, S.; Amirmojahedi, M.; Ahmad, R.; Jahangirzadeh, A.; Javidnia, H. Hybrid ANFIS–PSO approach for predicting optimum parameters of a protective spur dike. Appl. Soft Comput. 2015, 30, 642–649. [Google Scholar] [CrossRef]
Figure 1. Flowchart of Methodological Approaches used in this Research.
Infrastructures 07 00002 g001
Figure 2. The Freeways in South Africa Transportation System. Note. N 1 is Black Circle, N 3 is Light Green Circle, N 12 is Light Blue N 14 is Indigo, N 17   is   Yellow .
Infrastructures 07 00002 g002aInfrastructures 07 00002 g002b
Figure 3. The different categories of vehicles used in this study.
Infrastructures 07 00002 g003
Figure 5. The flowchart of the ANFIS-PSO model. Reprinted with permission from ref [71] Published by Elsevier B.V.Copyright © 2015 Elsevier Ltd. All rights reserved [71].
Infrastructures 07 00002 g005
Figure 6. Stages of the ANFIS-PSO training and testing.
Infrastructures 07 00002 g006
Figure 7. Comparison between the Actual South Africa Traffic volume versus the ANFIS-PSO Predicted traffic volume (Training).
Infrastructures 07 00002 g007
Figure 8. Comparison between the Actual South Africa Traffic volume versus the ANFIS-PSO Predicted traffic volume (Testing).
Infrastructures 07 00002 g008
Figure 9. The ANFIS-PSO model showing the training of the traffic dataset.
Infrastructures 07 00002 g009
Figure 10. The ANFIS-PSO model showing the testing of the traffic dataset.
Infrastructures 07 00002 g010
Table 1. Categorization of the traffic datasets into inputs and output.
Input VariablesOutput Variables
Traffic densityTraffic Volume
Number of light vehicles
The average speed of light vehicles
Time of day of light vehicles
The average speed of a long truck
Time of day of long truck
Number of long trucks
The average speed of a medium truck
Time of day of medium truck
Number of medium trucks
Number of short trucks
The average speed of a short truck
Time of day of short truck
Table 2. The Breakdown of the traffic datasets collected from the freeways used for the ANFIS-PSO model training and testing.
FreewaysTrainingTestingTotal
N 1 712596
N 3 10030130
N 12 9520115
N 14 10030130
N 17 15128179
517133650
Table 3. Features of the model parameters that was used in the ANFIS-PSO model training and testing.
Size of the PopulationMaximum Number of IterationsInertia WeightInertia Weight Damping RatioCoefficient of Personal LearningCoefficient of Global Learning
50100010.9912
Publisher’s Note: MDPI stays neutral with regard to jurisdictional claims in published maps and institutional affiliations.

