Article

Associations of Noise and Socioeconomic and -Demographic Status on Cardiovascular and Respiratory Diseases on Borough Level in a Large German City State

1
Institute for Health Services Research in Dermatology and Nursing (IVDP), University Medical Center Hamburg-Eppendorf (UKE), Martinistr. 52, 20246 Hamburg, Germany
2
Institute of Geography, University of Hamburg, Bundesstraße 55, 20146 Hamburg, Germany
3
Department of General and Interventional Cardiology, Hamburg University Heart Center (UHZ), Martinistr. 52, 20246 Hamburg, Germany
4
German Centre for Cardiovascular Research (DZHK) Partner Site Hamburg/Kiel/Lübeck, Oudenarder Straße 16, 13347 Berlin, Germany
*
Author to whom correspondence should be addressed.
Submission received: 22 June 2017 / Revised: 10 August 2017 / Accepted: 14 August 2017 / Published: 17 August 2017

Abstract

:
Worldwide, cardiovascular and respiratory diseases are increasing. Environmental noise and the socioeconomic and sociodemographic situation are important factors for the diseases. Using borough health claims data from 2011 in the city of Hamburg, ecological analyses with principal component analyses were conducted to describe the relationship of road traffic noise Lden (day, evening, and night) > 65 dB(A), physician density, and social deprivation with regional prevalence rates of heart failure and hypertension (n = 67 boroughs). Additionally, associations between the considered factors with borough prevalence rates of acute bronchitis and asthma in children up to 14 years old were analyzed. The multivariate regression analyses (ANCOVA) indicated that the socioeconomic and sociodemographic borough background might be associated with cardiovascular and respiratory diseases, showing the strongest association among hypertensive female patients with 9.90 percent (p < 0.0001) in the highest social deprivation category, when compared to the group of low social deprivation. However, associations between noise, physician density, and the respective health outcomes were negligible. Results will serve as a basis for further investigations. By using data from two surveys, future studies will focus on individual level data to assess the validity of our model, and to develop strategies to reduce the prevalence of cardiovascular and respiratory diseases.

1. Introduction

Cardiovascular diseases are estimated to be the most common cause of death and of disability-adjusted life years (DALYs) worldwide, where ischemic heart disease, stroke, and hypertension are the major diseases within this group [1,2]. Likewise, in Germany, where this study was conducted, ischemic heart disease is the leading cause of death and loss of healthy years of life [3]. According to the estimates of the Global Burden of Disease (GBD) study 2010, hypertension has—after unhealthy nutrition—the second highest impact on the disease burden in Germany [3].
Lower respiratory diseases as a group show a retrogressive trend in DALYs but are still the second leading cause for disability worldwide [2]. In Germany, the burden of lower and chronic respiratory diseases is the seventh most important cause of DALYs [3]. Among children, bronchitis is one of the most common acute diseases diagnosed, and asthma the most common chronic disease diagnosed [4,5,6].
Environmental noise, especially road traffic and aircraft noise in urban settings is considered to be relevant risk factors for adverse health effects, and several biological and epidemiological studies have shown the link between noise and different cardiovascular health outcomes [7,8,9,10,11]. Results from the KORA study (Cooperative health research in the Region of Augsburg) for instance showed a higher prevalence for hypertension with an increase in noise (odds ratio (OR) for a 10-dB(A) increase = 1.16 (95% CI: 1.00; 1.35) [7].
However, studies investigating and showing the relationship between noise, noise annoyance, and respiratory diseases such as asthma in children are rare, and their underlying mechanisms need to be further identified [12,13,14,15].
Additionally, it is suggested that health access as well as social services might influence specific health outcomes and that social and health services are more available in urban than they are in rural areas [16,17,18]. In a study conducted in three French regions, significant differences were found among geographic areas with greater access to primary care in Paris, along with income disparities in health access [17]. Moreover, individual sociodemographic and socioeconomic factors such as gender, age, educational and occupational background or income are suggested to be important risk factors for cardiovascular and respiratory diseases [7,19,20]. However, the use of single and highly correlated indicators for the economic and demographic situation reduces the available information and may imperfectly set the focus point on selected parameters.
Other studies focused on borough or metropolitan socioeconomic status, and showed associations between deprived areas and cardiovascular or respiratory health outcomes, such as hypertension or asthma [21,22,23]. Researchers from the Heinz Nixdorf Recall (HNR) Study used unemployment rates as area-level markers of socioeconomic status. Results showed that smoking, obesity, and low physical activity, used as response variables for cardiovascular risk factors were more common in deprived boroughs in Germany, even after adjusting for personal characteristics such as age, sex, or individual education [21].
Recently, a conceptual model emphasizing the importance of individual, societal, and environmental factors and their interactions, which are potentially associated with urban health was published by the authors [24].
The objective of this paper, being part of this interdisciplinary collaboration, was to investigate in a first step association between road traffic noise, physician density, socioeconomic and demographic risk factors, classified by a number of indicators as a Principal Component Analysis (PCA)-based score, and cardiovascular and respiratory disease on borough level in the city of Hamburg. Specifically, we used statistical modeling to assess the associations between road traffic noise > 65 decibel A (dB(A)), social deprivation, and physician density used as a surrogate parameter for health access on the age-adjusted prevalence rates of heart failure and hypertension. Additionally, the effect of potential associations between road traffic noise > 65 dB(A), social deprivation, and physician density on the prevalence rates of acute bronchitis and asthma in children aged 14 or younger was analyzed.

2. Materials and Methods

2.1. Study Area

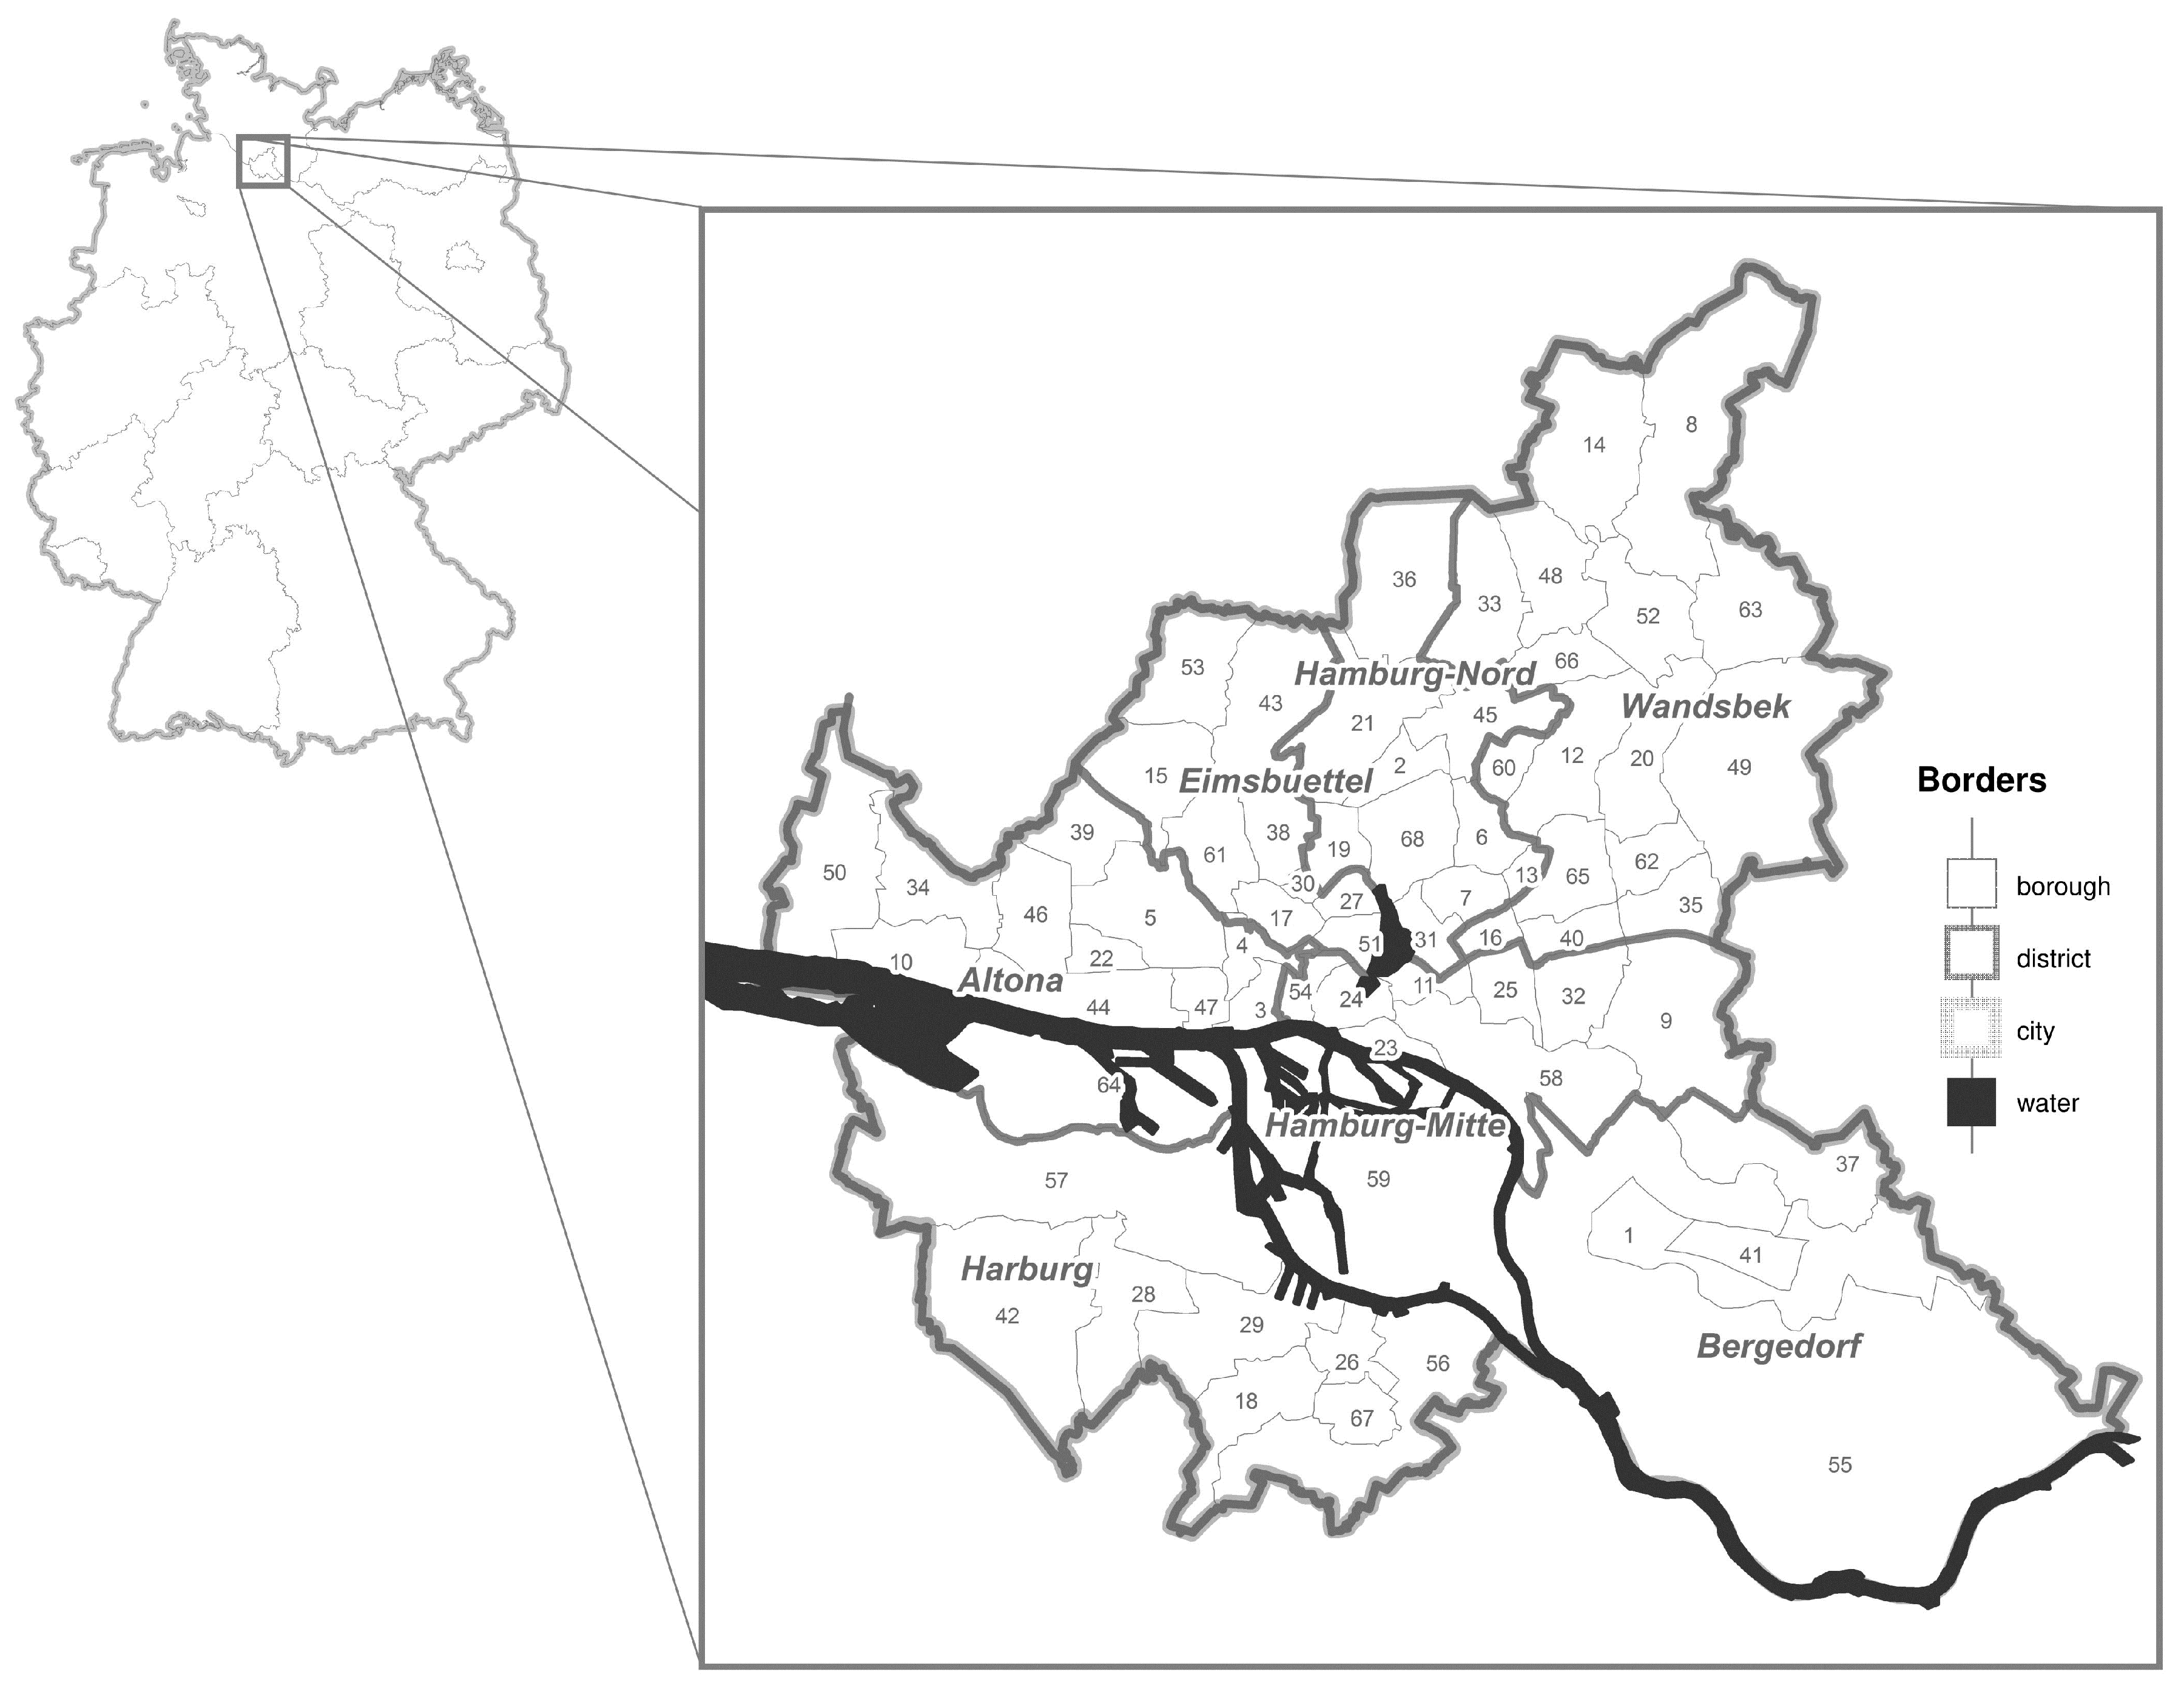
This study was conducted in the city state of Hamburg, in northern Germany. Hamburg consists of 104 boroughs and seven districts, and is the second biggest city in Germany with approximately 1.8 Million inhabitants [25].
The socioeconomic background shows a heterogeneous pattern and varies greatly among the boroughs, where boroughs with a better social structure and hence, for instance more income and lower unemployment rate can mostly be found in the district of Altona, or in the outer parts of Wandsbek. Contrarily, boroughs with a poorer social structure and hence, for instance lower income and higher unemployment rate are mostly located in the district of Hamburg-Mitte [25]. Due to a low prevalence of disease in some of the 104 boroughs in Hamburg and hence, low power, some of the adjacent boroughs with comparable socioeconomic and sociodemographic factors were aggregated to a total of 67, and used for all analyses (see Figure 1 below and Table A1 in the Appendix A). No data were available for the borough “Hafencity” [26].

2.2. Prevalence Rates of Cardiovascular and Respiratory Diseases

All of the disease prevalence rates (year 2011) were obtained from the Ministry for Health and Consumer Protection of the Free and Hanseatic City of Hamburg, and refer to the territory of the city state of Hamburg. Prevalence rates were computed by considering the care claims data from the public health care system of all statutory health insured patients, with at least one contact to a contract physician working in the ambulatory sector, as the population (N = 442.336) [26].
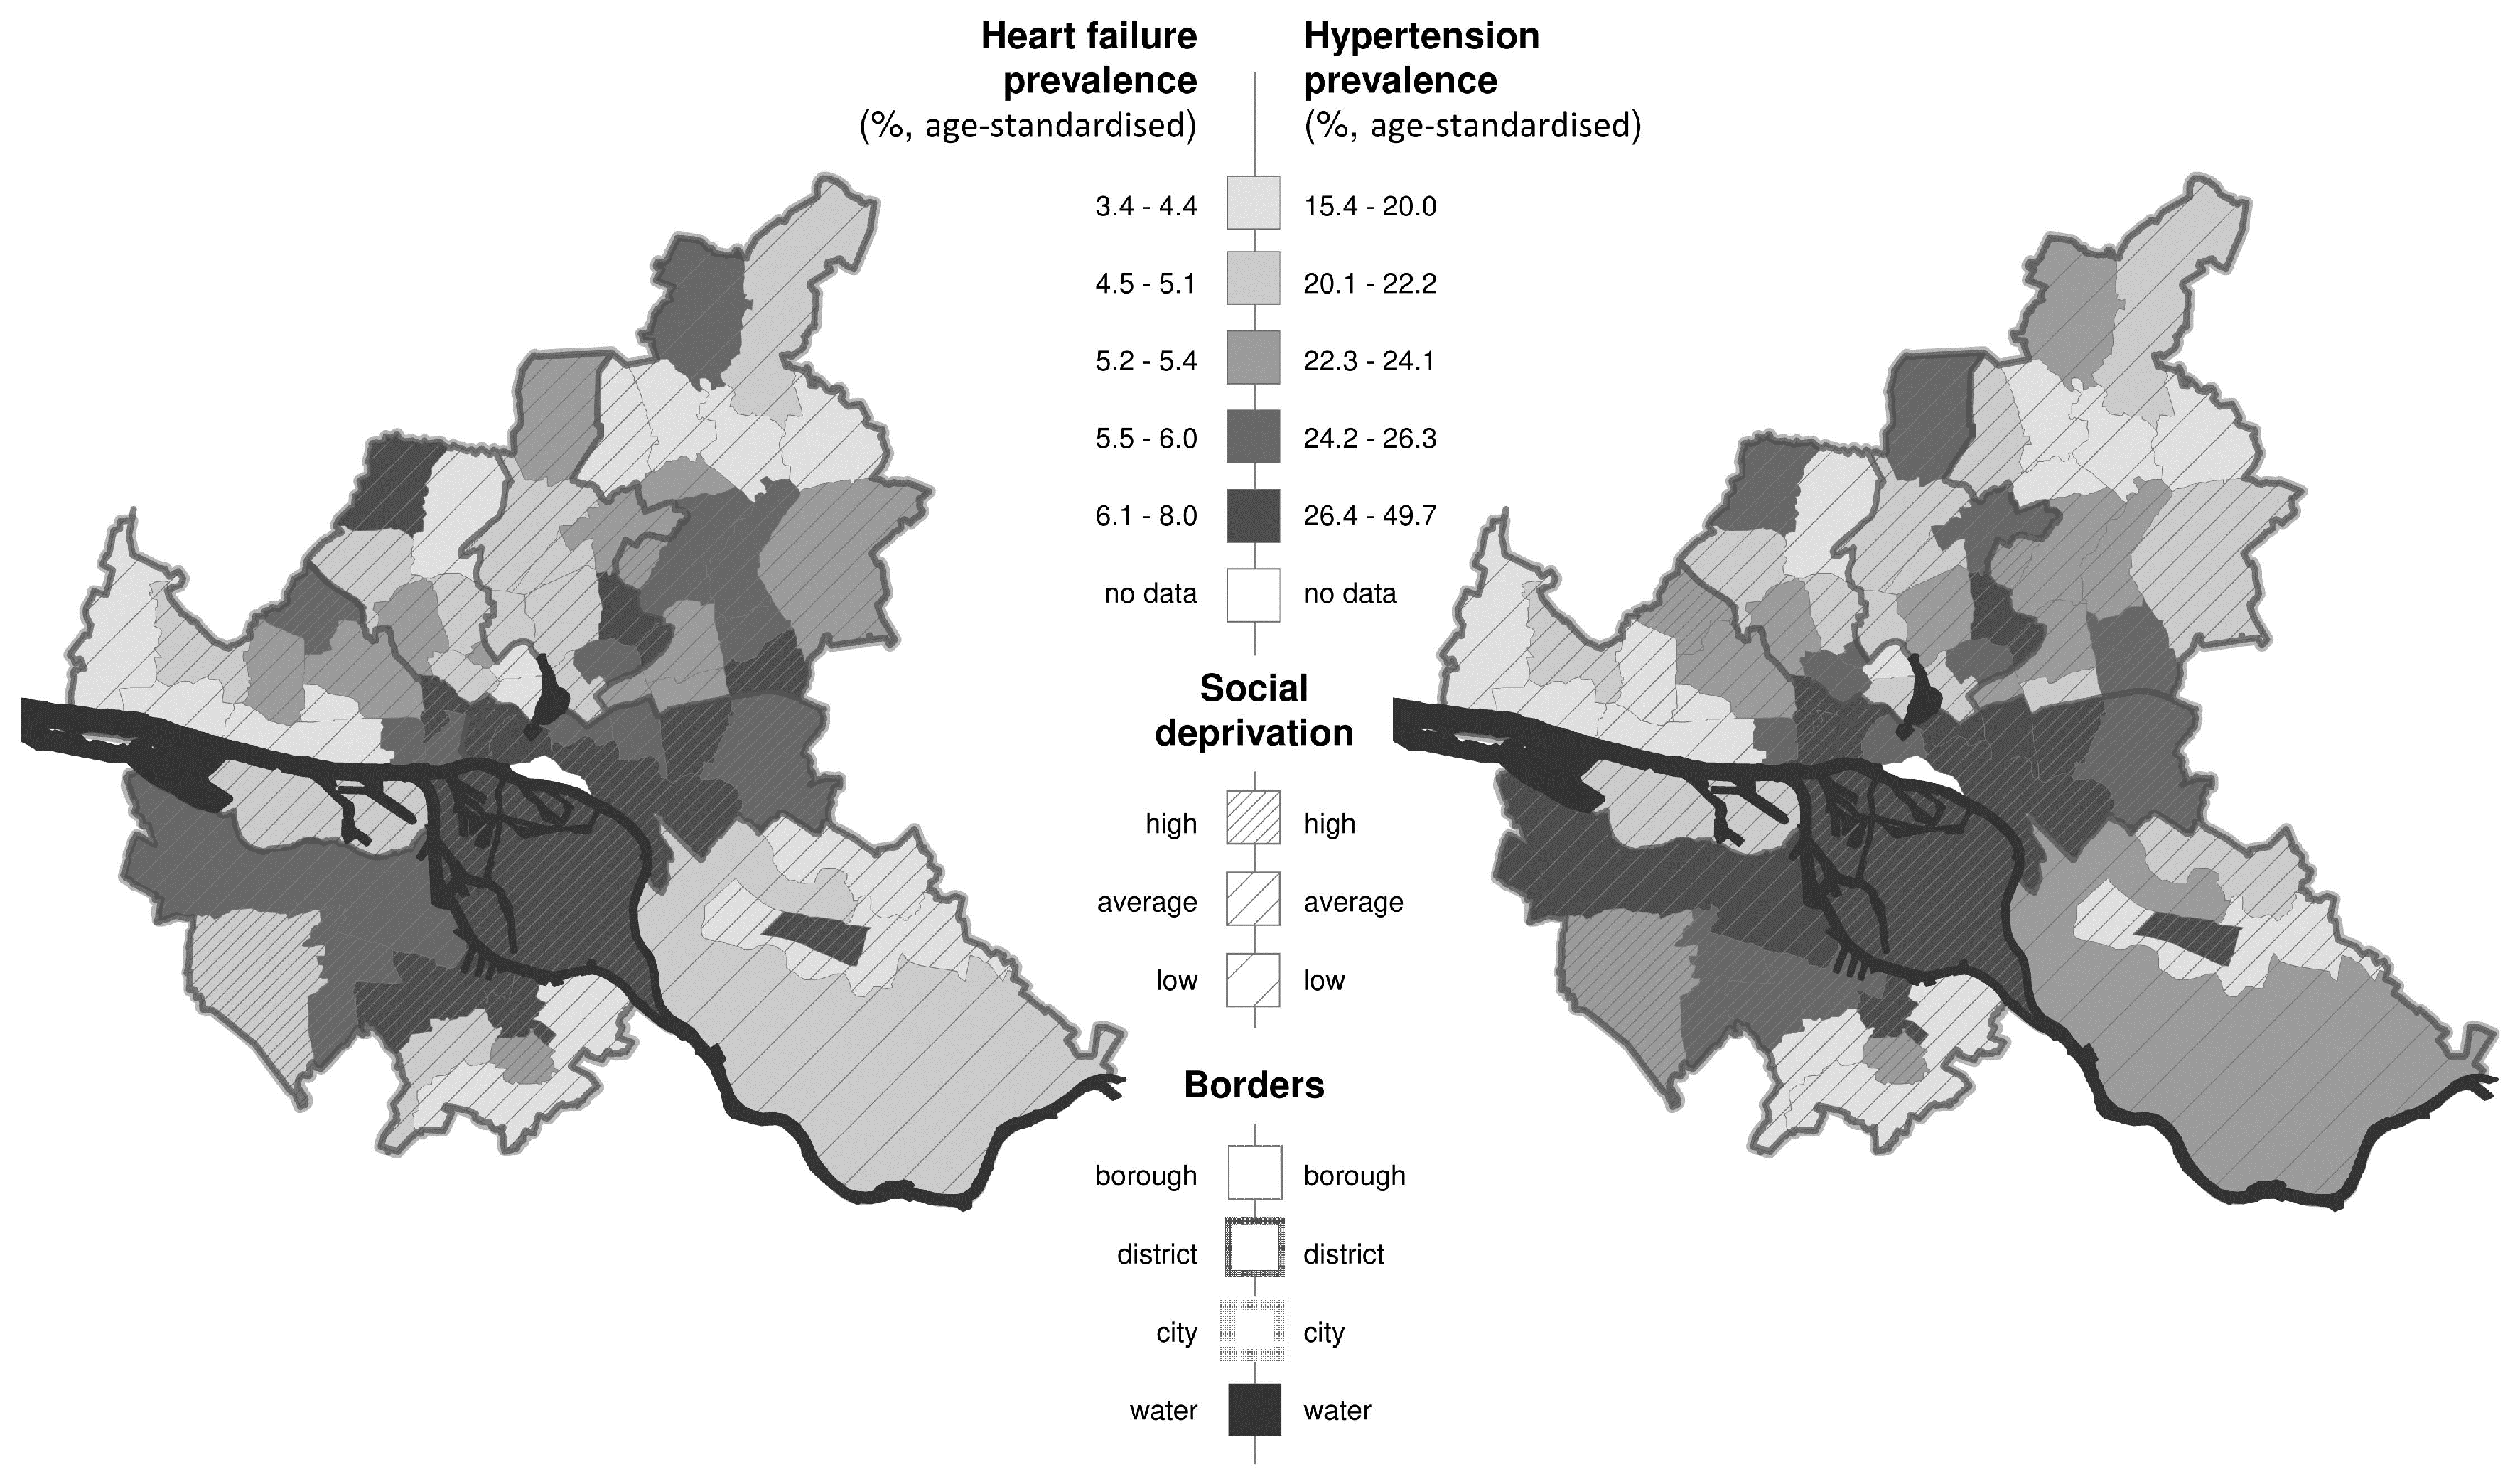
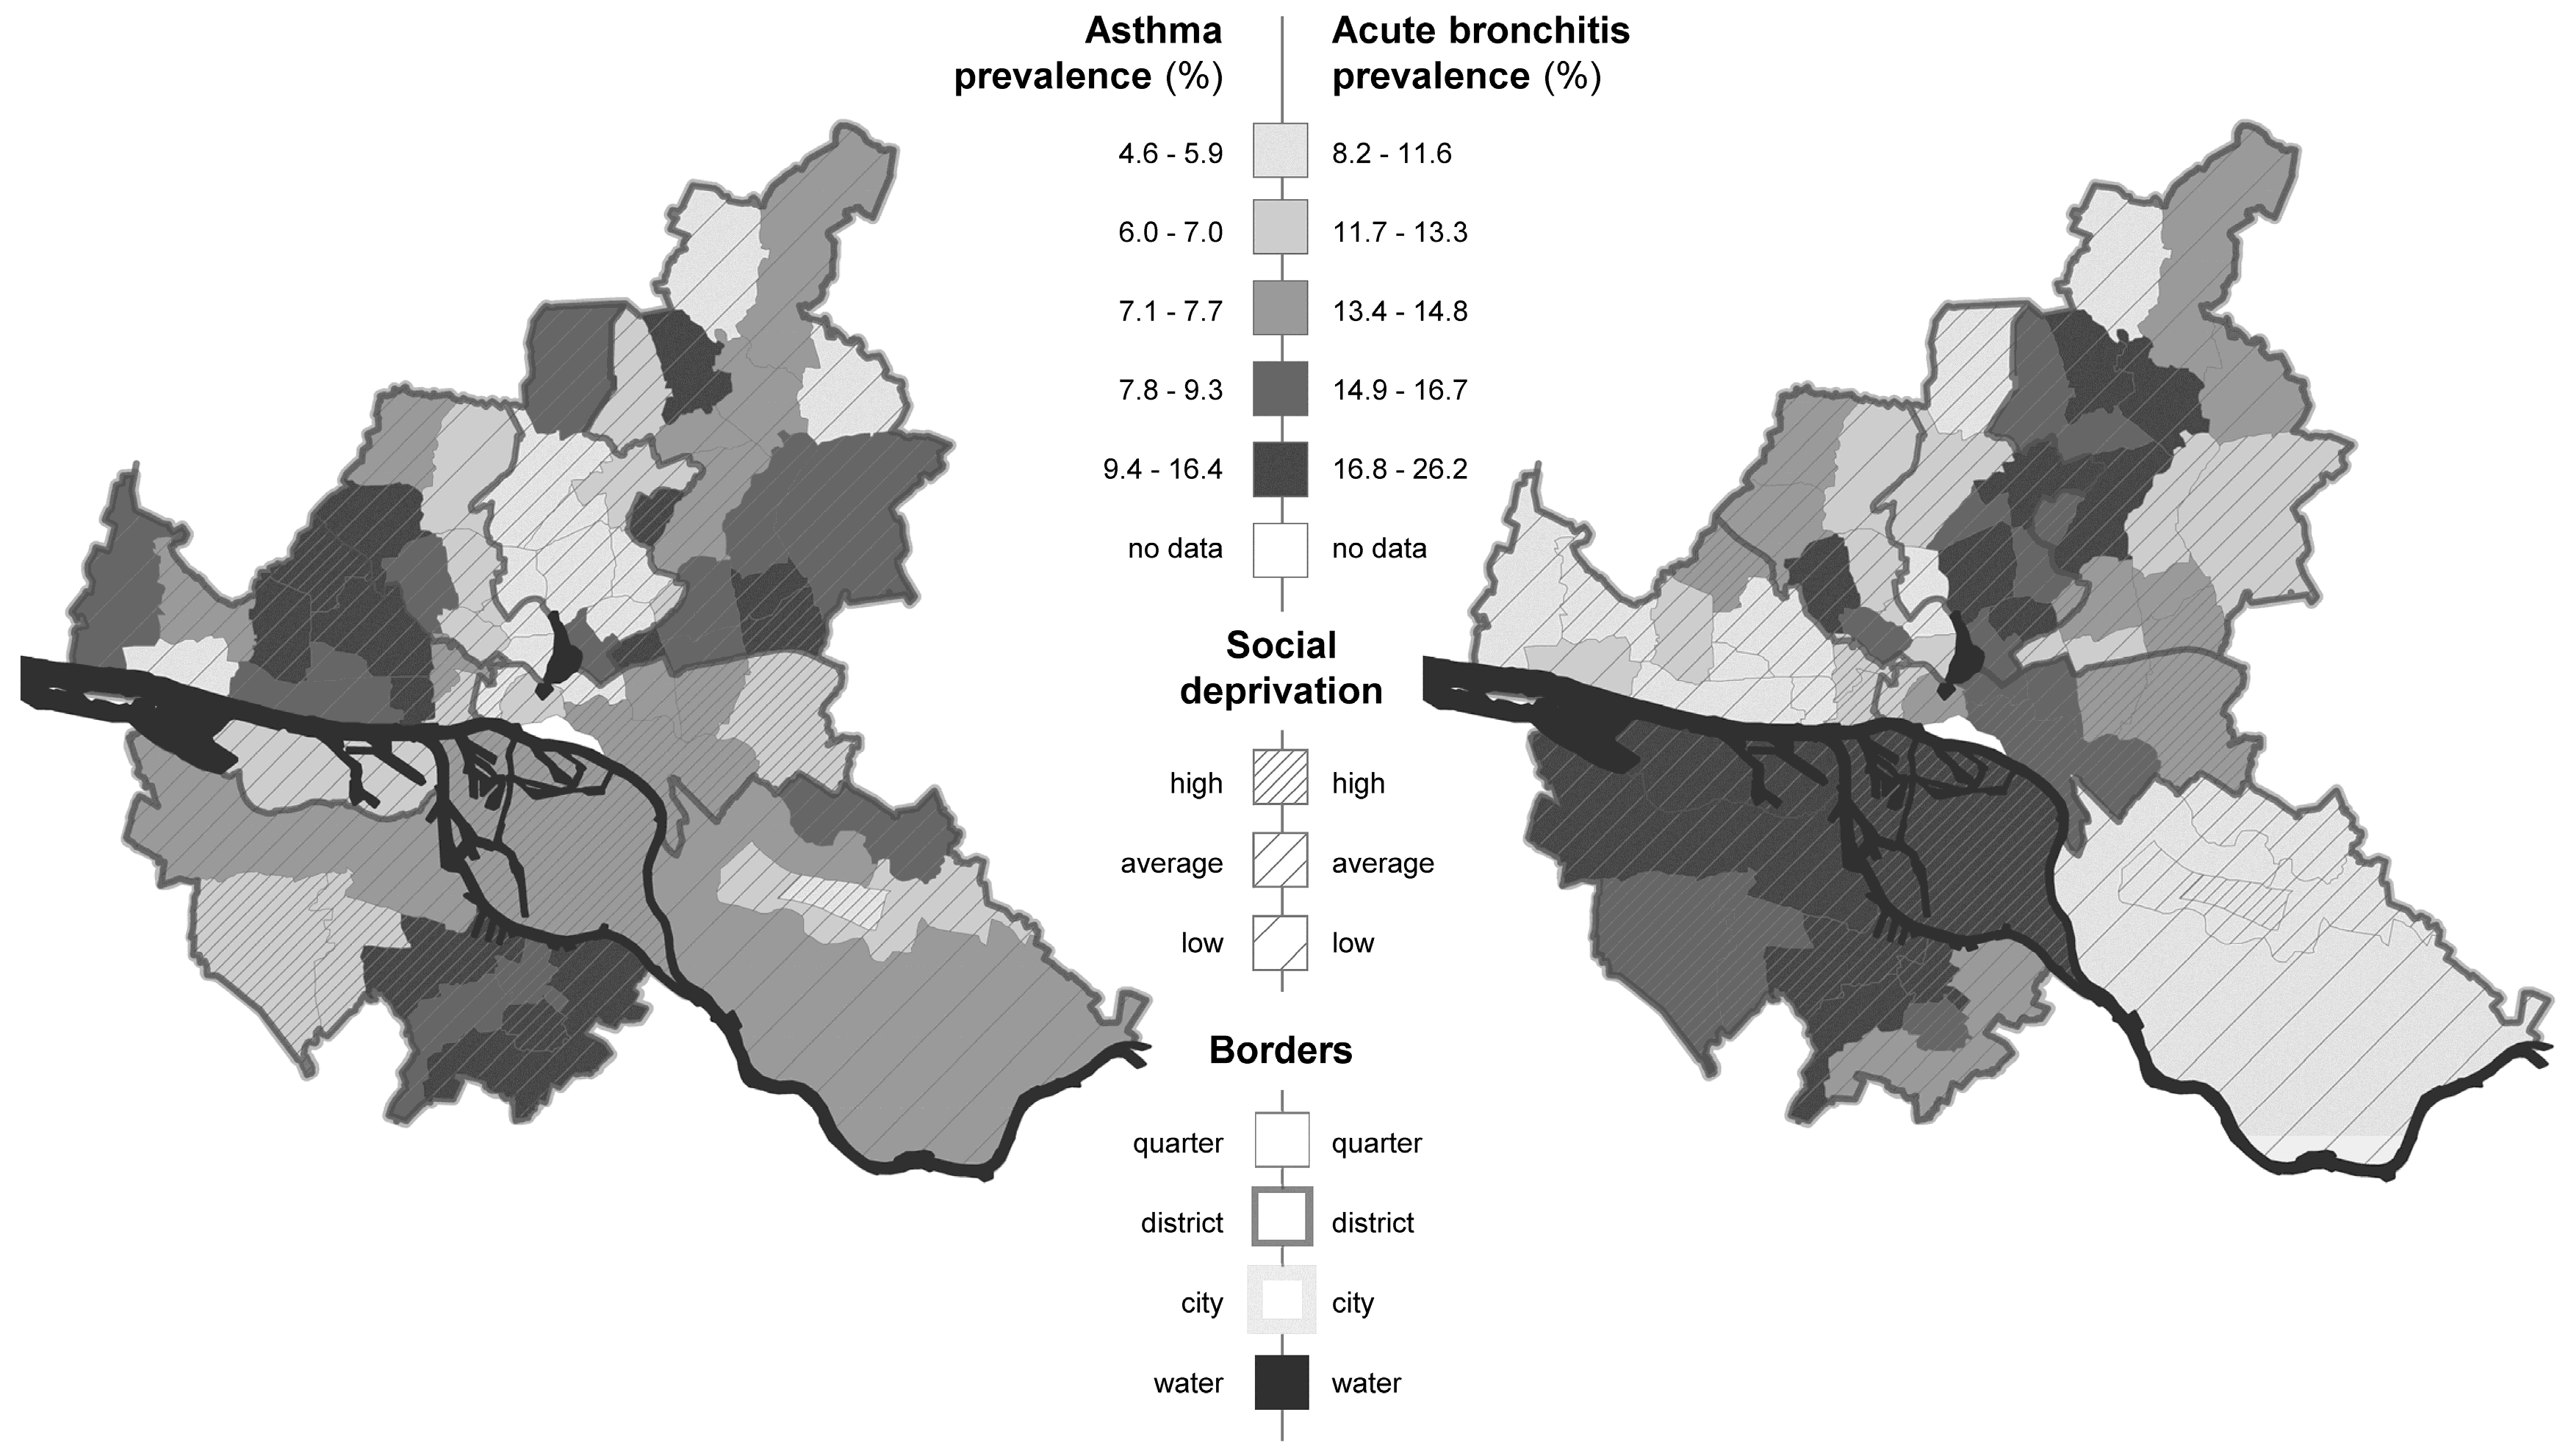
Prevalence was divided by borough and sex, respectively. Prevalence rates for heart failure (N = 73.230) and hypertension (N = 326.733) were available for the total population, the prevalence rates for acute bronchitis (N = 27.643) and asthma (N = 14.730) were obtained only for children up to 14 years of age.
The following ICD-10-codes (International Classification of Diseases) were used for the respective health outcome (Table 1) [26].
To account for potential geographical differences in age-distribution, we additionally calculated the age-standardized prevalence for heart failure and hypertension for each borough by using a weighting factor for every borough. This weighting factor was calculated by dividing the standard (average) population aged 65 and older for all Hamburg boroughs (standard population >65 years of age = 19.0% (micro census 2014)) divided by the population data >65 years of age for each borough, respectively [25].

2.3. Road Traffic Noise

Road traffic noise mapping was performed by the State Ministry for Urban Development and the Environment according to the guideline 34, BImSchV and the Directive 2002/49/EC in 2007 using the software LimA [27,28]. The grid width was 10 m × 10 m and the immission height was 4 m above ground level. The resulting areas with a road traffic noise level of Lden (day, evening, and night) > 65 dB(A) as a threshold for high exposure to noise [11] were the basis for our exposure analysis.
To determine the potentially affected population on the building block level, the road traffic noise map was overlayed with a population map, using the Geographical Information System ArcGIS 10.3.1 (Environmental System Research Institute (ESRI), Redlands, CA, USA). Population census data for 2013 on borough levels were obtained from the Statistical Office for Hamburg and Schleswig-Holstein [25]. As typically not all houses of one building block are located in the same distance to the road (as the main sound source) or do not even face the same road, not the entire building block is affected by Lden > 65 dB(A). For this reason, we calculated the percentage of each building block that is affected by Lden > 65 dB(A). The resulting fractions were subsequently transferred to the number of potentially affected residents per building block by multiplying the percentage that is effected by Lden > 65 dB(A) with the total amount of inhabitants.
Afterwards, the population data and the number of potentially affected residents by Lden > 65 dB(A) were aggregated to the 67 boroughs. The percentage of the affected residents per borough was then used for further analysis.

2.4. Socioeconomic and Sociodemographic Borough Characteristics

Information on social indicators on borough level were obtained from the Statistical Office for Hamburg and Schleswig-Holstein [25]. To classify a borough’s socioeconomic and sociodemographic situation and for the sake of the multivariable analysis, we used the variable “social deprivation”, which was obtained from a previously conducted PCA [26]. This variable was then used as a proxy measure for a borough´s socioeconomic and sociodemographic situation. The following data (data from 2012) indicating the socioeconomic and demographic borough characteristics were considered in the PCA (Table 2):
The factor of the PCA with the highest eigenvalue was used as the variable, which might sufficiently describe the social deprivation of a borough. The respective factor scores were categorized in subgroups where the lowest 25 percent of a borough according to the social deprivation were classified as low social deprivation, with the upper 25 percent as high social deprivation, and the rest as average social deprivation.
Additionally, data per borough describing the physician density per 1000 inhabitants used as a proxy measure for health access were obtained from the Statistical Office for Hamburg and Schleswig-Holstein [25], and used for the statistical analyses as a potential co-factor.

2.5. Statistical Modeling

Due to the expected sex-specific differences, all analyses were conducted for both sexes, separately. Additionally, and to account for the age dependency of the two health outcomes “heart failure” and “hypertension” we used in the age-adjusted overall prevalence rates for computations.
Afterwards, we modeled associations between the potential risk factors and the prevalence of heart failure, hypertension, acute bronchitis, and asthma by multivariate regression (ANCOVA) analyses (Analysis of Covariance), using the IBM SPSS Statistics 23 program. To account for both, categorical and continuous variables in one model, the ANCOVA model was chosen. The independent variables “proportion of borough area affected by noise > 65 dB(A)” and “physician density” were considered continuous and were scaled by units per 5 percent increase in borough area and per unit step of social deprivation (three groups: low, average, and high). The covariates in the ANCOVA model were examined for interactions, but none could be confirmed.
The criterion for inclusion of a determinant in the final model was set to a significance level of p ≤ 0.05. For a measure of association between a determinant and the respective prevalence, the regression coefficient (B) was calculated by using the respective estimated standardized regression parameter of the ANCOVA model, and, therefore, adjusted for all other determinants was included in the model. All estimates of the regression coefficients were complemented by a 95% confidence interval (CI) and a p-value. The adjusted R-squared (R2) was provided as a measure of overall goodness-of-fit of the statistical model.

3. Results

3.1. Prevalence Rates of Cardiovascular Diseases

Among males, the crude values of one-year prevalence for heart failure in all boroughs varied from 2.3 percent to 7.1 percent. Among females, the lowest crude prevalence for heart failure was seen with 2.4 percent in a borough in the southeastern parts, and the highest crude prevalence with 8.8 percent in a borough located in the north-eastern parts of Hamburg (Table A2 in the Appendix A, Figure 1). The age-standardized prevalence rates for heart failure ranged from 3.3 percent up to 8.8 percent among males, and from 3.5 percent to 7.6 percent among females.
Mapping of the age-adjusted overall prevalence for heart failure showed the highest prevalence rates in the boroughs clustered within the western and centrally located regions, as well as in the boroughs in the southwestern region. Lowest age-adjusted prevalence rates of heart failure were revealed in the southeastern and western parts of Hamburg, and in the northeastern boroughs (Figure 2). No major sex-specific differences could be detected, hence the maps were not divided by gender.
Crude prevalence rates for hypertension varied from 16.0 percent up to 28.4 percent among males, and from 14.4 percent to 30.6 percent among females. Considering the age-standardized prevalence rates, the lowest rates among males could be observed in a borough in the western parts of Hamburg with 14.6 percent, with the highest rates of 51.2 percent in a borough in the southeastern parts. Crude prevalence rates for hypertension among females ranged from 14.1 percent to 30.6 percent, considering the age-standardized prevalence rates there was a range from 15.8 percent to 48.4 percent.
Age-adjusted prevalence of hypertension indicated an equal pattern reporting that the highest prevalence rates clustered in the centrally located boroughs, in the western boroughs, and in the southwestern region. Lowest prevalence rates of hypertension were seen again in the southern, western, and northeastern parts of Hamburg (Figure 2). Again, no major sex-specific differences could be detected.

3.2. Prevalence Rates of Respiratory Diseases

Treatment prevalence rates for acute bronchitis among boys varied with a minimum of 8.9 percent, to a maximum of 26.7 percent; among girls we observed a range from 7.2 percent, up to 25.7 percent. Asthma prevalence rates among boys showed the lowest rates with 5.2 percent in a borough in the district Hamburg-Nord, the highest rates were recorded in a borough of the district Altona (19.8 percent). Among girls, prevalence rates varied from 3.4 percent to 12.9 percent (Table A2, Figure 1).
Mapping of prevalence rates for asthma among children aged up to 15 years of age showed the highest prevalence rates in the boroughs located in the northwestern parts, boroughs located in the eastern parts, and boroughs from the southern parts. The lowest prevalence rates of asthma were detected in the centrally located boroughs (Figure 3). Again, gender specific differences were negligible. Finally, prevalence rates for acute bronchitis among children up to 15 years of age indicated that the boroughs reporting the highest prevalence rates were clustered within the districts of Hamburg-Mitte and Harburg. Additionally, boroughs located in the northeastern part of Hamburg showed highest prevalence rates. Lowest prevalence rates for acute bronchitis were found within the southeastern region and among others in the district of Altona (Figure 3). Major sex-specific differences could not be determined.

3.3. Social Deprivation

The spatial results of the social deprivation per borough in the city of Hamburg obtained by the PCA are depicted in Figure 2 and Figure 3. The indicators describing the proportion of SGB II-benefit recipients and the proportion of unemployment showed that the highest positive correlations with the variable “social deprivation”, living space per inhabitant per m2, and proportion of high school students showed the highest negative correlations. The variable “social deprivation” showed similar patterns to the age-adjusted cardiovascular prevalence rates depicting the highest social deprivation in the centrally located boroughs of Hamburg-Mitte. Accordingly, these boroughs have high unemployment rates and a high proportion of SGB II-benefit recipients, and showed high age-adjusted prevalence rates for heart failure and hypertension. Contrarily, the lowest social deprivation, together with lowest age-adjusted prevalence rates for the cardiovascular endpoints could be found in the most western boroughs. Additionally, the most northeastern boroughs showed low deprivation values together with low prevalence rates (Figure 2). However, the pattern for the variable “social deprivation”, together with the respiratory prevalence rates coincided spatially less, showing for instance highly socially deprived areas in the southwestern parts of Hamburg with low prevalence rates for asthma but contrarily high social deprivation in the district Hamburg-Mitte, together with high prevalence rates for acute bronchitis (Figure 3).

3.4. Physician Density

Minimum physician density could be found with 0.2 percent in most borough-clusters in the south, as well as in the borough-cluster in the northeastern parts of Hamburg. A maximum with the highest physician density of 10.4 percent could be found in the central borough of Hamburg (Table 3).

3.5. Road Traffic Noise > 65 dB(A)

Boroughs with the lowest percentage of road traffic noise level of > 65 dB(A) per borough area, with 0.7 percent were centrally located. Boroughs with the highest proportion of areas affected by road traffic noise level of > 65 dB(A) where 10.1 percent could be detected in the industrialized borough-clusters in Hamburg-Mitte (Table 3).

3.6. Multivariate Regression Analyses

The results of the ANCOVA model showed that the variable “social deprivation” was a strong independent predictor for heart failure and hypertension. Among males and females, the risk for heart failure significantly increased from low social deprivation to high social deprivation to nearly 2.00 percent (95% CI 1.38, 2.59 and 95% CI 1.45, 2.50), respectively (Table 4).
The results for hypertension were even stronger, showing the highest associations of social deprivation among females, with 9.90 percent (95% CI 7.08, 12.66) in the highest social deprivation category, when compared to the reference group of low social deprivation (Table 5). The other two considered variables “physician density” as well as “proportion of borough area affected by noise > 65 dB(A)” did not show any significant association on both cardiovascular endpoints (Table 4 and Table 5). The final model for heart failure explained 40 percent among males (R2 = 0.40), and 48 percent among females (R2 = 0.48) of the variation of heart failure prevalence. For hypertension the respective R2 was 0.31 for the model computed for males, and R2 = 0.45 for females.
For the respiratory health outcomes, the trends for the independent variable “social deprivation” remained, but the results were less strong (Table 6 and Table 7). Living in a borough categorized as a high social deprivation borough was associated with a higher risk for acute bronchitis in childhood of 2.53 percent (males, 95% CI −0.16, 5.23) and 2.54 percent (females, 95% CI 0.02, 5.06), when compared to boroughs belonging to a low social deprivation group (Table 6). The variable “physician density” showed only marginal associations with the prevalence of acute bronchitis in both sexes. However, a noise level of > 65 dB(A) seemed to be associated with the occurrence of acute bronchitis among children, even though results did not reach statistical significance. With an increase of 5 percent of the proportion of borough area affected by noise > 65 dB(A), the prevalence of acute bronchitis was associated with a higher prevalence of 1.55 percent (95% CI −0.84, 3.94) among boys, and 2.00 percent (95% CI −0.23, 4.24) among girls. The R2 for the models were R2 = 0.04 and R2 = 0.08, respectively.
For asthma, the results did not show any significant association between any potential risk factor, and the model only explained 1.2 percent of the variation of asthma prevalence among boys (R2 = 0.012), and 0.4 percent among girls (R2 = 0.004). However, the trends for the variable “social deprivation”, showing a higher prevalence of asthma for children living in boroughs with higher social deprivation, remained. The results for the two variables “physician density” and “proportion of borough area affected by noise > 65 dB(A)” were negligible (Table 7).

4. Discussion

Cardiovascular and respiratory diseases induce a great amount of disease burden in most countries [1,2]. It is reported that such morbidity and mortality is associated with social and environmental factors [7,8,9,10,11]. This study was conducted to get the first possible insight in such an association based on large-scale, population-based urban data, which differentiates different spatial areas. The analysis conducted in the city of Hamburg indicated a strong association between the socioeconomic and sociodemographic background of a borough, classified by a PCA with the spatial prevalence of heart failure, hypertension, acute bronchitis, and asthma. Significantly higher prevalence rates for both age-standardized cardiovascular endpoints could be detected for boroughs classified as high social deprivation. For the respiratory health outcomes, the results were less strong but the trend showing higher prevalence among children in deprived boroughs remained. This is in agreement with previous reports on factors describing the social environment, such as deprived borough and cardiovascular and respiratory health outcomes, even after controlling for individual cofactors [21,22,23,30,31,32].
A PCA is a useful tool that reduces the complexity of correlated data, which can be easily collected and obtained as single indicator variables. On the contrary, the process of generalization leads to a loss of information, the criteria for the selection of variables for a PCA are not specified well, and the number of selected components is arbitrary. Whether a single principal component can sufficiently identify the socioeconomic and sociodemographic background is entirely dependent on the data, and the correlation matrix of the considered and included variables, their validity, and reliability [33]. However, the data which entered the PCA and was used in our study can assumed to be credible [25] and hence, should approximately reflect a borough´s socioeconomic and demographic background.
Besides the socioeconomic and sociodemographic borough background, > 65 years of age is suggested to be associated with rising cardiovascular prevalence rates [34].
We regarded the crude prevalence rates of heart failure and hypertension together with the age distribution > 65 years of age and the variable “social deprivation” (data not shown). Prevalence rates of heart failure and hypertension were higher the more people aged 65 or older lived in a borough, additionally accompanied by boroughs classified as low social deprived areas, and vice versa. Contrarily, by using the age-standardized prevalence rates for the two cardiovascular endpoints, we found a pattern showing high age-standardized prevalence rates together with high social deprived areas, and vice versa, emphasizing on one hand the importance of age among these diseases, and on the other side the potential association between the socioeconomic and sociodemographic borough background and specific health outcomes.
The variable “physician density” used as a surrogate parameter for health access revealed no significant associations on any of the health outcomes, and even contrary results could be observed. The fact that only data on a borough level were available might have limited our analyses and hence the interpretation of our results. However, even though it can be assumed that the physician density should be evenly distributed in a metropolis such as Hamburg, we found great differences among boroughs (ranging from 0.2 to 10.4 per 1000 inhabitants and borough) (Table 3). Nevertheless, it has to be noted that people do not always seek medical care close to their home address. Instead, they seek help at a specialist in another borough or go directly to the hospital. Additionally, diseases might be underdiagnosed in some certain groups of the population due to differences in seeking health care behavior. Hence, our results might be biased. In this context it should be noticed, that we only obtained data from statutory health insurance patients with at least one contact, to a contract physician working in the ambulatory sector. No data regarding the proportion and distribution of privately insured individuals or data from private practice were available, and the data considered in our study only capture a fraction of the estimated prevalence. However, it is suggested that approximately 10 to 20 percent of all individuals in Hamburg are privately insured [26] (additionally, please see Table A1 depicting the amount of the statutory health insured patients per borough). Therefore, our data should cover the largest amount of prevalence rates. Nevertheless, due to the high costs of the private insurance, mostly people above a certain income level can afford this status. Therefore, the results might be biased in areas with low social deprivation due to the lack of data from the privately insured population.
Contrary to many other studies [12,13,14,35,36,37], noise did not show any significant association with any cardiovascular or respiratory disease. Road traffic noise was transferred to the number of potentially affected residents per building block, and scaled in percent per borough. Certainly this does not reflect the real environment, or covers the real circumstances of noise exposure. Additionally, it was not possible to differentiate between residential buildings and non-residential buildings; therefore, a non-differential misclassification bias might have occurred and affected our results. Furthermore, individual factors describing the housing conditions, location of rooms, subjective noise annoyance, hearing problems, or length of residence are known to potentially influence cardio-respiratory disease [35,38,39]. Additionally, aircraft or industrial noise [10,40] is suggested to affect cardiovascular and respiratory disease and was, due to missing data, not considered in our study. Nevertheless, exposure to noise also occurs in many workplaces, and was associated with a number of cardiovascular diseases [41,42,43].
Exposure to gaseous (carbon monoxide, sulphur dioxide, nitrogen dioxide, ozone) and particulate (PM2.5 or PM10) air pollutants, which is higher in cities than in non-urban areas, has been associated with cardiovascular and respiratory disease morbidity and mortality. Several studies investigated short-term effects and found the strongest associations on the day of exposure, or one to three days after exposure [44,45]. Other studies investigated chronic and long-term exposure of air pollution and found a higher risk for all causes and cardiovascular and respiratory mortality [19,46,47]. In the KORA study, significant associations were found between PM2.5 and hypertension using noise as a covariate [7]. However, for this first investigation, no data on air pollution in the city of Hamburg were available.
It is hypothesized that asthma is less common in children or families where older siblings are present [48]. We therefore, conducted an analysis including the variable “number of family members”, which, additionally was identified as a second component from the PCA. This factor described the household size and number of children per family. However, inclusion of this variable in the ANCOVA model did not change the significance and magnitude of the associations of included variables with the respective prevalence (data not shown).
Furthermore, besides genetic disposition, family history, and previous atopic disease [49,50], individual behavioral factors such as smoking status including passive smoking, alcohol intake, or physical activity, awareness for diseases such as hypertension and factors describing the daily routine are discussed to be associated with the occurrence of different cardiovascular and respiratory health outcomes [7,23,35,36,37,51,52,53,54,55].
Another limitation of our study is the temporality: due to the fact that prevalence, not incidence data was examined, it cannot be determined if traffic noise exposure or social depravity preceded the diseases. While it is not discernible that the children afflicted with acute bronchitis or asthma may have moved due to their disease, poor health could also result in a loss of income and cause someone to move to more affordable housing, e.g., to areas with increased social deprivation or increased road traffic noise. Contrarily, families with a better socioeconomic situation might have moved to areas with less noise and less deprivation.
Our ecological study design has the advantage that a large number of large-scale, population-based aggregated data for the city of Hamburg could easily be obtained and analyzed, and the first potential associations could be found and discussed. So far, our first results coincide with other studies showing the potential importance of the socioeconomic and sociodemographic background of a borough, even though our ecological study design makes the results of this study difficult to interpret and potentially misleading.
To account for the above-discussed limitation of this first study;, we will conduct in a second step a case-control study, with the example of hypertensive patients as cases aimed at elucidating the potential individual risk factors together with environmental living and working conditions. Our control group will be obtained from the Hamburg City Health Study (HCHS), the largest local follow-up health study worldwide with an estimated number of 45,000 participants. This study just started in spring 2016, and will run for the coming 12 years. Additionally, noise data (traffic noise, aircraft noise, and industrial noise) as well as data about air pollution shall be selectively collected in the near living environment of participants, and considered in the upcoming studies to better analyze potential environmental covariates.

5. Conclusions

The herein presented first results suggest that the socioeconomic and sociodemographic urban borough background might be associated with variations in cardiovascular and respiratory diseases. A significantly higher prevalence for heart failure and hypertension was detected for boroughs classified as having high social deprivation. The results for asthma and acute bronchitis among children did not reach statistical significance, but the trend showing higher prevalence in deprived boroughs remained. Our study suggests that large-scale, population aggregated socioeconomic and demographic data, which were analyzed here and could easily be obtained, might be helpful to depict potential associations between a borough´s socioeconomic background and different health outcomes. However, no significant associations could be shown for potential risk factors such as noise or health access, suggesting that these co-factors need to be collected and analyzed on a smaller scale, such as an individual level. To get a better insight of theoretical associations between disease and environmental covariates [24], to improve our first findings and to develop strategies to reduce the prevalence of cardiovascular and respiratory disease, analyses on individual level using data from a case-control-study will be conducted in future.

Acknowledgments

We thank the Ministry for Health and Consumer Protection of the Free and Hanseatic City of Hamburg for providing the health data. The Central Research Institute of Ambulatory Health Care in Germany analyzed and provided disease prevalence rates and the results, which were obtained from Principal Component Analysis (PCA). Additionally, we would like to thank the Statistical Office for Hamburg and Schleswig-Holstein for the socioeconomic and sociodemographic data on the quarter level. The authors wish to thank Marie Christine Duval, Sara Tiedemann, and Mario Gehoff as part of the scientific communications team of the IVDP for copy editing. Finally, we thank the State Ministry for Urban Development and the Environment for the maps depicting noise. This contribution is based on the work of the research project “Cities in Change–Development of a multi-sectoral urban-development–impact model (UrbMod)”, a joint project of University of Hamburg, Hamburg University of Technology, University Medical Center Hamburg-Eppendorf, Institute of Coastal Research at Helmholtz Center Geesthacht, Max-Planck-Institute for Meteorology, and Hafen-City University, funded by the State of Hamburg.

Author Contributions

Anne Caroline Krefis, Jobst Augustin and Matthias Augustin conceived and designed the experiments; Anne Caroline Krefis and Jobst Augustin performed the experiments; Anne Caroline Krefis analyzed the data; Jobst Augustin, Myriam Albrecht and Anne Kis contributed materials/analysis tools; Anne Caroline Krefis, Annika Jagodzinski, Jobst Augustin, Matthias Augustin and Myriam Albrecht wrote the paper.

Conflicts of Interest

The authors declare no conflict of interest. The founding sponsors had no role in the design of the study; in the collection, analyses, or interpretation of data; in the writing of the manuscript, and in the decision to publish the results.

Appendix A

Table A1. List of all boroughs and borough clusters considered in the analysis including population size and the proportion of all statutory health insured patients, Hamburg, 2011.
Borough-IDBorough Population Size (n)Statutory Health Insured Persons (%)
1Allermöhe and Bergedorf33,54479.1
2Alsterdorf13,51172.6
3Altona-Altstadt27,12993.5
4Altona-Nord and Sternschanze29,37688.1
5Bahrenfeld26,48178.3
6Barmbek-Nord38,10486.3
7Barmbek-Süd31,93380.8
8Bergstedt and Wohldorf-Ohlstedt14,44172.4
9Billstedt69,26186.1
10Blankenese12,88464.2
11Borgfelde and St. Georg17,13183.7
12Bramfeld50,52084.2
13Dulsberg17,28288.3
14Duvenstedt and Lemsahl-Mellingstedt12,83570.1
15Eidelstedt30,682 86.1
16Eilbek20,60679.1
17Eimsbüttel55,29277.7
18Eißendorf23,60684.8
19Eppendorf and Hoheluft-Ost32,42870.0
20Farmsen-Berne33,43187.6
21Fuhlsbüttel and Groß Borstel19,99182.4
22Groß Flottbek10,62462.6
23Hafencity *--
24Hamburg Altstadt and Neustadt13,69181.7
25Hamm37,60779.0
26Harburg21,89273.1
27Harvestehude16,59751.3
28Hausbruch17,08582.9
29Heimfeld20,39279.2
30Hoheluft-West12,82572.5
31Hohenfelde and Uhlenhorst24,81479.3
32Horn37,88285.1
33Hummelsbüttel16,96681.0
34Iserbrook and Sülldorf19,84074.7
35Jenfeld24,66390.6
36Langenhorn41,73979.2
37Lohbrügge38,93384.9
38Lokstedt25,67374.4
39Lurup34,00681.2
40Marienthal12,31777.3
41Neuallermöhe23,53987.9
42Neugraben-Fischbek26,95385.0
43Niendorf39,80478.2
44Nienstedten and Othmarschen19,71065.8
45Ohlsdorf14,93774.6
46Osdorf25,30188.5
47Ottensen33,52076.5
48Poppenbüttel22,37775.6
49Rahlstedt86,96283.3
50Rissen14,86471.5
51Rotherbaum15,82066.2
52Sasel22,95971.0
53Schnelsen27,51280.8
54St. Pauli21,70475.1
55Borough cluster around Kirchwerder (Kirchwerder, Altengamme, Billwerder, Curslack, Moorfleet, Neuengamme, Ochsenwerder, Reitbrook, Spadenland, Tatenberg)25,03780.6
56Borough cluster around Marmstorf (Marmstorf, Langenbek, Neuland and Gut Moor, Rönneburg, Sinstorf)20,81179.1
57Borough cluster around Neuenfelde (Neuenfelde, Cranz, Francop, Moorburg and Altenwerder)660877.6
58Borough cluster around Rothenburgsort (Rothenburgsort, Billbrook, Hammerbrook)12,12388.1
59Borough cluster around Wilhelmsburg (Wilhelmsburg, Kleiner Grasbrook and Steinwerder, Veddel)56,89287.8
60Steilshoop19,30687.4
61Stellingen23,27289.2
62Tonndorf13,28278.7
63Volksdorf20,12673.5
64Waltershof and Finkenwerder11,70988.3
65Wandsbek32,64085.2
66Wellingsbuüttel10,09069.0
67Wilstorf16,05789.6
68Winterhude50,15273.2
* No data for the borough “Hafencity” was available.
Table A2. 1-year-prevalence rates (%) and age-standardized prevalence rates (%, in brackets) per borough-ID, Hamburg, Germany (2011) a.
Borough-IDHeart Failure bHypertension bAcute bronchitis cAsthma c
MaleFemaleMaleFemaleMaleFemaleMaleFemale
13.7 (3.4)4.2 (3.8)20.3 (18.4)21.0 (19.1)10.59.37.74.8
25.1 (4.8)5.5 (5.2)22.5 (21.3)22.2 (21.0)19.114.56.35.2
34.4 (6.4)3.9 (5.7)18.2 (26.5)17.9 (26.1)13.812.27.65.9
43.4 (6.6)3.1 (6.1)16.0 (31.3)15.2 (29.7)14.711.88.75.6
54.3 (5.4)4.0 (5.1)19.2 (24.2)18.5 (23.3)10.38.610.87.9
64.6 (6.1)4.9 (6.5)21.2 (27.8)21.8 (28.7)16.913.85.24.0
74.5 (5.3)4.7 (5.5)21.1 (24.9)20.7 (24.5)20.317.96.84.8
85.9 (5.1)5.1 (4.4)25.0 (21.4)23.3 (19.9)15.211.78.66.3
95.1 (5.4)5.2 (5.6)24.3 (25.9)25.1 (26.7)15.413.28.25.7
104.9 (3.3)5.3 (3.5)21.7 (14.6)23.6 (15.8)14.110.07.04.2
114.2 (5.8)4.6 (6.2)18.8 (25.6)20.7 (28.2)16.715.27.14.8
126.9 (5.8)6.6 (5.6)26.6 (22.5)26.3 (22.2)18.816.68.95.7
134.5 (6.8)4.6 (7.0)21.1 (32.0)23.6 (35.7)15.113.47.95.0
146.0 (6.2)4.8 (4.9)23.5 (24.0) 21.2 (21.7)11.79.96.84.6
156.1 (5.0)5.6 (4.6)25.8 (21.0)26.7 (21.7)16.912.812.26.2
164.6 (4.9)5.3 (5.7)21.4 (23.1)23.0 (24.9)13.111.011.28.2
173.5 (5.3)3.1 (4.8)17.6 (27.1)15.7 (24.2)17.014.17.95.7
185.6 (4.8)5.9 (5.1)22.5 (19.3)24.0 (20.6)21.218.710.27.3
193.8 (4.3)4.2 (4.6)19.3 (21.4)17.5 (19.4)13.28.95.73.6
206.1 (5.7)5.9 (5.5)25.6 (23.7)25.9 (24.0)13.413.09.06.4
215.2 (4.7)5.2 (4.6)24.9 (22.2)24.9 (22.2)12.612.26.84.7
224.8 (4.1)5.1 (4.4)22.1 (19.0)21.6 (18.6)8.98.79.87.5
23 d--------
244.5 (6.2)4.3 (5.8)19.3 (26.4)17.0 (23.3)15.112.07.75.6
254.7 (5.7)4.7 (5.7)21.2 (25.9)22.7 (27.8)18.014.57.96.1
264.6 (6.9)4.9 (7.4)19.8 (30.1)22.1 (33.4)24.120.311.66.9
274.2 (3.8)4.1 (3.7)21.1 (19.3)18.3 (16.7)13.110.17.23.6
285.5 (5.4)6.3 (6.2)24.1 (23.6)27.1 (26.6)17.814.88.25.5
295.4 (6.1)5.6 (6.3)22.3 (25.1)23.6 (26.6)19.220.011.17.6
303.5 (5.1)3.7 (5.3)18.3 (26.5)16.4 (23.8)15.710.37.05.4
314.4 (4.3)4.8 (4.7)20.5 (20.0)21.0 (20.4)16.914.19.37.2
325.3 (6.1)5.8 (6.5)23.9 (27.1)24.4 (27.6)15.112.38.46.2
335.6 (4.2)4.7 (3.6)27.9 (21.1)26.6 (20.1)14.716.18.15.2
345.6 (4.4)6.2 (4.9)25.5 (20.1)26.9 (21.2)11.910.29.24.9
355.6 (5.7)6.2 (6.4)24.7 (25.3)25.3 (26.0)13.414.711.69.4
365.6 (5.0)6.1 (5.4)26.5 (23.5)28.0 (24.8)9.27.210.66.1
374.5 (3.5)4.9 (3.8)27.0 (21.1)29.0 (22.6)10.310.69.56.2
385.5 (4.8)5.9 (5.2)23.3 (20.7)23.6 (20.9)13.810.98.25.6
395.7 (5.6)6.1 (6.0)22.3 (21.9)25.1 (24.6)15.813.519.812.9
406.4 (5.3)6.0 (5.0)24.8 (20.5)24.8 (20.5)12.013.112.26.4
412.3 (6.7)2.4 (6.9)17.7 (51.2)16.7 (48.4)9.37.37.24.4
425.9 (5.0)5.7 (4.8)26.4 (22.5)26.9 (23.0)17.413.67.84.7
436.3 (4.4)5.9 (4.1)27.7 (19.3)28.2 (19.6)13.311.08.45.1
444.6 (3.6)5.0 (3.9)21.9 (17.0)20.9 (16.2)10.18.09.56.2
454.7 (5.1)4.8 (5.2)22.2 (24.0)22.6 (24.4)19.516.68.04.4
466.0 (4.8)6.9 (5.5)23.3 (18.5) 25.1 (20.0)13.912.015.410.5
473.7 (5.6)3.7 (5.6)17.9 (26.7)16.9 (25.2)11.07.611.27.3
485.8 (3.3)6.1 (3.5)28.4 (16.3)27.9 (16.0)22.122.311.08.7
496.5 (5.2)6.8 (5.5)26.3 (21.2)26.6 (21.5)13.412.610.67.5
505.4 (3.3)5.9 (3.6)25.9 (15.8)26.2 (16.0)10.710.310.16.8
513.6 (4.6)3.4 (4.3)18.3 (23.1)16.1 (20.3)13.610.77.14.5
525.4 (4.1)4.8 (3.6)26.9 (20.3)24.9 (18.8)17.816.28.66.0
537.1 (6.5)6.6 (6.1)26.5 (24.5)26.0 (24.1)16.112.67.04.4
544.3 (8.8)3.5 (7.2)17.1 (34.8)14.4 (29.4)13.912.07.13.8
554.7 (4.6)4.4 (4.3)25.4 (24.9)23.9 (23.4)9.79.48.95.4
565.5 (4.3)5.3 (4.1)24.8 (19.3)25.2 (19.7)16.112.511.87.1
575.0 (5.7)5.0 (5.7)22.3 (25.6) 24.0 (27.6)20.615.59.75.3
584.2 (6.3)4.1 (6.1)19.8 (29.5)20.5 (30.6)15.717.47.76.4
595.8 (8.1)5.4 (7.6)20.8 (29.3)21.4 (30.3)26.725.78.86.5
605.4 (5.4)5.4 (5.4)23.5 (23.5)24.6 (24.6)17.813.411.17.7
615.7 (5.2)5.9 (5.3)25.5 (23.0)26.0 (23.5)18.715.59.97.0
626.1 (5.9)5.8 (5.6)25.3 (24.8)27.1 (26.5)13.913.912.36.7
635.6 (4.1)5.9 (4.4)26.6 (19.6)24.8 (18.3)14.113.26.84.7
644.6 (4.5)5.0 (4.8)22.2 (21.5)23.5 (22.7)19.414.68.65.0
655.4 (5.0)6.0 (5.6)23.8 (22.0)25.0 (23.2)14.612.09.76.4
666.8 (4.3)8.8 (5.7)26.4 (16.9)30.6 (19.7)19.114.59.25.0
675.8 (5.2)5.7 (5.1)24.8 (22.1)25.3 (22.6)16.014.112.97.6
684.0 (5.0)4.1 (5.1)18.8 (23.5)18.0 (22.5)23.620.56.23.4
a treatment prevalence in percent. Population are all statutory health insured patients, with at least one contact to a contract physician working in the ambulatory sector per year. In brackets are the age-standardized prevalence rates, which were used for statistical modeling; b all age-groups; c children aged 0–14; d no data available for the district “Hafencity”.

References

  1. Murray, C.J.L.; Lopez, A.D. The Global Burden of Disease: A Comprehensive Assessment of Mortality and Disability from Diseases, Injuries, and Risk Factors in 1990 and Projected to 2020; Harvard School of Public Health: Boston, MA, USA, 1996. [Google Scholar]
  2. Murray, C.J.L.; Vos, T.; Lozano, R.; Naghavi, M.; Flaxman, A.D.; Michaud, C.; Ezzati, M.; Shibuya, K.; Salomon, J.A.; Abdalla, S.; et al. Disability-adjusted life years (DALYs) for 291 diseases and injuries in 21 regions, 1990–2010: A systematic analysis for the Global Burden of Disease Study 2010. Lancet 2012, 380, 2197–2223. [Google Scholar] [CrossRef]
  3. Plass, D.; Vos, T.; Hornberg, C.; Scheidt-Nave, C.; Zeeb, H.; Krämer, A. Trends in Disease Burden in Germany. Results, Implications and Limitations of the Global Burden of Disease Study. Dtsch. Ärztebl. Int. 2014, 111, 629–638. [Google Scholar] [CrossRef] [PubMed]
  4. Asher, I.; Pearce, N. Global burden of asthma among children. Int. J. Tuberc. Lung Dis. 2014, 18, 1269–1278. [Google Scholar] [CrossRef] [PubMed]
  5. Pearce, N.; Ait-Khaled, N.; Beasley, R.; Mallol, J.; Keil, U.; Mitchell, E.; Robertson, C. Worldwide trends in the prevalence of asthma symptoms: Phase III of the International Study of Asthma and Allergies in Childhood (ISAAC). Thorax 2007, 62, 758–766. [Google Scholar] [CrossRef] [PubMed]
  6. Central Research Institute of Ambulatory Health Care (Germany). Die 50 Häufigsten ICD-10-Schlüsselnummern nach Fachgruppen aus dem ADT-Panel des Zentralinstituts. Available online: http://www.zi.de/cms/fileadmin/images/content/PDFs_alle/Die_50_h%C3%A4ufigsten_ICD-2015.pdf (accessed on 19 June 2017).
  7. Babisch, W.; Wolf, K.; Petz, M.; Heinrich, J.; Cyrys, J.; Peters, A. Associations between Traffic Noise, Particulate Air Pollution, Hypertension, and Isolated Systolic Hypertension in Adults: The KORA Study. Environ. Health Perspect. 2014, 122, 492–498. [Google Scholar] [CrossRef] [PubMed]
  8. Ising, H.; Babisch, W.; Kruppa, B. Noise-induced endocrine effects and cardiovascular risk. Noise Health 1999, 1, 37–48. [Google Scholar] [PubMed]
  9. Ising, H.; Braun, C. Acute and chronic endocrine effects of noise: Review of the research conducted at the Institute for Water, Soil and Air Hygiene. Noise Health 2000, 2, 7–24. [Google Scholar] [PubMed]
  10. Jarup, L.; Dudley, M.-L.; Babisch, W.; Houthuijs, D.; Kwekkeboom, J.; Swart, W.; Pershagen, G.; Bluhm, G.; Katsouyanni, K.; Charalambidis, A.; et al. Hypertension and Exposure to Noise Near Airports: The HYENA Study. Environ. Health Perspect. 2008, 116, 329–333. [Google Scholar] [CrossRef] [PubMed]
  11. Van Kempen, E.; Babisch, W. The quantitative relationship between road traffic noise and hypertension: A meta-analysis. J. Hypertens. 2012, 30, 1075–1086. [Google Scholar] [CrossRef] [PubMed]
  12. Bockelbrink, A.; Willich, S.N.; Dirzus, I.; Reich, A.; Lau, S.; Wahn, U.; Keil, T. Environmental Noise and Asthma in Children: Sex-Specific Differences. J. Asthma 2008, 45, 770–773. [Google Scholar] [CrossRef] [PubMed]
  13. Duhme, H.; Weiland, S.K.; Keil, U.; Kraemer, B.; Schmid, M.; Stender, M.; Chambless, L. The association between self-reported symptoms of asthma and allergic rhinitis and self-reported traffic density on street of residence in adolescents. Epidemiology 1996, 7, 578–582. [Google Scholar] [CrossRef] [PubMed]
  14. Ising, H.; Lange-Asschenfeldt, H.; Lieber, G.F.; Weinhold, H.; Eilts, M. Effects of long-term exposure to street traffic exhaust on the development of skin and respiratory tract diseases in children. Schriftenr. Ver. Wasser Boden Lufthyg. 2003, 112, 81–99. [Google Scholar]
  15. Cai, Y.; Zijlema, W.L.; Doiron, D.; Blangiardo, M.; Burton, P.R.; Fortier, I.; Gaye, A.; Gulliver, J.; de Hoogh, K.; Hveem, K.; et al. Ambient air pollution, traffic noise and adult prevalent asthma: A BioSHaRE approach. Eur. Respir. J. 2017, 49, 1502127. [Google Scholar] [CrossRef] [PubMed]
  16. Galea, S.; Freudenberg, N.; Vlahov, D. Cities and population health. Soc. Sci. Med. 2005, 60, 1017–1033. [Google Scholar] [CrossRef] [PubMed]
  17. Gusmano, M.K.; Weisz, D.; Rodwin, V.G.; Lang, J.; Qian, M.; Bocquier, A.; Moysan, V.; Verger, P. Disparities in access to health care in three French regions. Health Policy 2014, 114, 31–40. [Google Scholar] [CrossRef] [PubMed]
  18. Sørgaard, K.W.; Sandlund, M.; Heikkilä, J.; Hansson, L.; Vinding, H.R.; Bjarnason, O.; Bengtsson-tops, A.; Merinder, L.; Nilsson, L.; Middelboe, T. Schizophrenia and contact with health and social services: A Nordic multi-centre study. Nord. J. Psychiatry 2003, 57, 253–261. [Google Scholar] [CrossRef] [PubMed]
  19. Naess, O.; Nafstad, P.; Aamodt, G.; Claussen, B.; Rosland, P. Relation between Concentration of Air Pollution and Cause-Specific Mortality: Four-Year Exposures to Nitrogen Dioxide and Particulate Matter Pollutants in 470 Neighborhoods in Oslo, Norway. Am. J. Epidemiol. 2006, 165, 435–443. [Google Scholar] [CrossRef] [PubMed]
  20. Selander, J.; Nilsson, M.E.; Bluhm, G.; Rosenlund, M.; Lindqvist, M.; Nise, G.; Pershagen, G. Long-Term Exposure to Road Traffic Noise and Myocardial Infarction. Epidemiology 2009, 20, 272–279. [Google Scholar] [CrossRef] [PubMed]
  21. Dragano, N.; Bobak, M.; Wege, N.; Peasey, A.; Verde, P.E.; Kubinova, R.; Weyers, S.; Moebus, S.; Möhlenkamp, S.; Stang, A.; et al. Neighbourhood socioeconomic status and cardiovascular risk factors: A multilevel analysis of nine cities in the Czech Republic and Germany. BMC Public Health 2007, 7, 255. [Google Scholar] [CrossRef] [PubMed]
  22. Jones, A. Segregation and cardiovascular illness: The role of individual and metropolitan socioeconomic status. Health Place 2013, 22, 56–67. [Google Scholar] [CrossRef] [PubMed]
  23. Asher, M.; Stewart, A.W.; Mallol, J.; Montefort, S.; Lai, C.K.W.; Ait-Khaled, N.; Odhiambo, J. Which population level environmental factors are associated with asthma, rhinoconjunctivitis and eczema? Rev. Ecol. Anal. ISAAC Phase One Respir. Res. 2010, 11, 8. [Google Scholar] [CrossRef] [Green Version]
  24. Von Szombathely, M.; Albrecht, M.; Antanaskovic, D.; Augustin, J.; Augustin, M.; Bechtel, B.; Bürk, T.; Fischereit, J.; Grawe, D.; Hoffmann, P.; et al. A Conceptual Modeling Approach to Health-Related Urban Well-Being. Urban Sci. 2017, 1, 17. [Google Scholar] [CrossRef]
  25. Statistical Office for Hamburg and Schleswig-Holstein. Faltblatt Mikrozensus 2015, Der Mikrozensus auf einen Blick. Available online: http://www.statistik-nord.de/fileadmin/Dokumente/Faltbl%C3%A4tter/Faltblatt_Mikrozensus_2015.pdf (accessed on 26 November 2015).
  26. Erhart, M.; Hering, R.; Schulz, M.; Stillfried, D. Morbiditätsatlas Hamburg. Gutachten zum Kleinräumigen Versorgungsbedarf in Hamburg—Erstellt durch das Zentralinstitut für die Kassenärztliche Versorgung in Deutschland im Auftrag der Behörde für Gesundheit und Verbraucherschutz Hamburg. Available online: http://www.hamburg.de/contentblob/4133362/data/morbiditaetsatlas.pdf (accessed on 16 June 2016).
  27. Federal Ministry. Bekanntmachung der Vorläufigen Berechnungsverfahren für den Umgebungslärm nach § 5 Abs. 1 der Verordnung über die Lärmkartierung (34. BImSchV). Available online: http://www.umweltbundesamt.de/sites/default/files/medien/1/dokumente/bundesanzeiger_154a.pdf (accessed on 08 August 2017).
  28. Authority for Environment and Energy (Hamburg). Strategische Lärmkartierung: Lärmkarten. Hamburg: Authority for Environment and Energy (Hamburg), 2016. Available online: http://www.hamburg.de/laermkarten/ (accessed on 13 June 2016).
  29. Schulz, M.; Hering, R.; Erhart, M.; Graf von Stilfried, D. Räumliche Sozialstruktur und Realisierter Versorgungsbedarf (Poster Presentation); German Medical Science GMS Publishing House: Düsseldorf, Germany, 2013. [Google Scholar]
  30. Diez Roux, A.V.; Merkin, S.S.; Arnett, D.; Chambles, L.; Massing, M.; Nieto, F.J.; Sorlie, P.; Szklo, M.; Tyroler, H.A.; Watson, R.L. Neighborhood of Residence and Incidence of Coronary Heart Disease. N. Engl. J. Med. 2001, 345, 99–106. [Google Scholar] [CrossRef] [PubMed]
  31. Cagney, A.; Browning, C.R. Exploring Neighborhood-level Variation in Asthma and other Respiratory Diseases. The Contribution of Neighborhood Social Context. J. Gen. Intern. Med. 2004, 19, 229–236. [Google Scholar] [CrossRef] [PubMed]
  32. Almqvist, C.; Pershagen, G.; Wickman, M. Low socioeconomic status as a risk factor for asthma, rhinitis and sensitization at 4 years in a birth cohort. Clin. Exp. Allergy 2005, 35, 612–618. [Google Scholar] [CrossRef] [PubMed]
  33. Vyas, S.; Kumaranayake, L. Constructing socio-economic status indices: How to use principal components analysis. Health Policy Plan. 2006, 21, 459–468. [Google Scholar] [CrossRef] [PubMed]
  34. Li, Y.; Staessen, J.A.; Sheng, C.-S.; Huang, Q.-F.; O’Rourke, M.; Wang, J. Age dependency of peripheral and central systolic blood pressures: Cross-sectional and longitudinal observations in a Chinese population. Hypertens. Res. 2012, 35, 115–122. [Google Scholar] [CrossRef] [PubMed]
  35. Babisch, W.; Swart, W.; Houthuijs, D.; Selander, J.; Bluhm, G.; Pershagen, G.; Dimakopoulou, K.; Haralabidis, A.S.; Katsouyanni, K.; Davou, E.; et al. Exposure modifiers of the relationships of transportation noise with high blood pressure and noise annoyance. J. Acoust. Soc. Am. 2012, 132, 3788–3808. [Google Scholar] [CrossRef] [PubMed]
  36. Bodin, T.; Albin, M.; Ardö, J.; Stroh, E.; Östergren, P.-O.; Björk, J. Road traffic noise and hypertension: Results from a cross-sectional public health survey in southern Sweden. Environ. Health 2009, 8, 38. [Google Scholar] [CrossRef] [PubMed]
  37. Leon Bluhm, G.; Berglind, N.; Nordling, E.; Rosenlund, M. Road traffic noise and hypertension. Occup. Environ. Med. 2007, 64, 122–126. [Google Scholar] [CrossRef] [PubMed]
  38. Babisch, W.; Wolke, G.; Heinrich, J.; Straff, W. Road traffic noise and hypertension—Accounting for the location of rooms. Environ. Res. 2014, 133, 380–387. [Google Scholar] [CrossRef] [PubMed]
  39. Babisch, W.; Pershagen, G.; Selander, J.; Houthuijs, D.; Breugelmans, O.; Cadum, E.; Vigna-Taglianti, F.; Katsouyanni, K.; Haralabidis, A.S.; Dimakopoulou, K.; et al. Noise annoyance—A modifier of the association between noise level and cardiovascular health. Sci. Total Environ. 2013, 452–453, 50–57. [Google Scholar] [CrossRef] [PubMed]
  40. Floud, S.; Blangiardo, M.; Clark, C.; de Hoogh, K.; Babisch, W.; Houthuijs, D.; Vigna-Taglianti, F.; Katsouyanni, K.; Haralabidis, A.S.; Dimakopoulou, K.; et al. Exposure to aircraft and road traffic noise and associations with heart disease and stroke in six European countries: A cross-sectional study. Environ. Health 2013, 12, 89. [Google Scholar] [CrossRef] [PubMed]
  41. Chang, T.-Y.; Hwang, B.-F.; Liu, C.-S.; Chen, R.-Y.; Wang, V.-S.; Bao, B.-Y.; Lai, J.-S. Occupational Noise Exposure and Incident Hypertension in Men: A Prospective Cohort Study. Am. J. Epidemiol. 2013, 177, 818–825. [Google Scholar] [CrossRef] [PubMed]
  42. Sbihi, H.; Davies, H.W.; Demers, P.A. Hypertension in noise-exposed sawmill workers: A cohort study. Occup. Environ. Med. 2008, 65, 643–646. [Google Scholar] [CrossRef] [PubMed]
  43. Virkkunen, H.; Kauppinen, T.; Tenkanen, L. Long-term effect of occupational noise on the risk of coronary heart disease. Scand. J. Work Environ. Health 2005, 31, 291–299. [Google Scholar] [CrossRef] [PubMed]
  44. Dominici, F.; Peng, R.D.; Bell, M.L.; Pham, L.; McDermott, A.; Zeger, S.L.; Samet, J.M. Fine Particulate Air Pollution and Hospital Admission for Cardiovascular and Respiratory Diseases. JAMA 2006, 295, 1127–1134. [Google Scholar] [CrossRef] [PubMed]
  45. Faustini, A.; Stafoggia, M.; Berti, G.; Bisanti, L.; Chiusolo, M.; Cernigliaro, A.; Mallone, S.; Primerano, R.; Scarnato, C.; Simonato, L.; et al. The relationship between ambient particulate matter and respiratory mortality: a multi-city study in Italy. Eur. Respir. J. 2011, 38, 538–547. [Google Scholar] [CrossRef] [PubMed]
  46. Gehring, U.; Heinrich, J.; Krämer, U.; Grote, V.; Hochadel, M.; Sugiri, D.; Kraft, M.; Rauchfuss, K.; Eberwein, H.G.; Wichmann, H.-E. Long-Term Exposure to Ambient Air Pollution and Cardiopulmonary Mortality in Women. Epidemiology 2006, 17, 545–551. [Google Scholar] [CrossRef] [PubMed]
  47. Pope, C.A.; Burnett, R.T.; Thurston, G.D.; Thun, M.J.; Calle, E.E.; Krewski, D.; Godleski, J.J. Cardiovascular Mortality and Long-Term Exposure to Particulate Air Pollution: Epidemiological Evidence of General Pathophysiological Pathways of Disease. Circulation 2004, 109, 71–77. [Google Scholar] [CrossRef] [PubMed]
  48. Laußmann, D.; Haftenberger, M.; Langen, U.; Eis, D. Determinants of asthma among children and adolescents in Germany. Results of the German Health and Examination Survey for Children and Adolescents (KiGGS). Bundesgesundheitsblatt Gesundheitsforschung Gesundheitsschutz 2012, 55, 308–317. [Google Scholar] [CrossRef]
  49. Arnett, D.K.; Baird, A.E.; Barkley, R.A.; Basson, C.T.; Boerwinkle, E.; Ganesh, S.K.; Herrington, D.M.; Hong, Y.; Jaquish, C.; McDermott, D.A.; et al. Relevance of Genetics and Genomics for Prevention and Treatment of Cardiovascular Disease: A Scientific Statement From the American Heart Association Council on Epidemiology and Prevention, the Stroke Council, and the Functional Genomics and Translational Biology Interdisciplinary Working Group. Circulation 2007, 115, 2878–2901. [Google Scholar] [CrossRef] [PubMed]
  50. Burke, W.; Fesinmeyer, M.; Reed, K.; Hampson, L.; Carlsten, C. Family history as a predictor of asthma risk. Am. J. Prev. Med. 2003, 24, 160–169. [Google Scholar] [CrossRef]
  51. Samal, D.; Greisenegger, S.; Auff, E.; Lang, W.; Lalouschek, W. The Relation between Knowledge about Hypertension and Education in Hospitalized Patients with Stroke in Vienna. Stroke 2007, 38, 1304–1308. [Google Scholar] [CrossRef] [PubMed]
  52. Chow, C.K.; Teo, K.K.; Rangarajan, S.; Islam, S.; Gupta, R.; Avezum, A.; Bahonar, A.; Chifamba, J.; Dagenais, G.; Diaz, R.; et al. Prevalence, Awareness, Treatment, and Control of Hypertension in Rural and Urban Communities in High-, Middle-, and Low-Income Countries. JAMA 2013, 310, 959–968. [Google Scholar] [CrossRef] [PubMed]
  53. Mitchell, E.A.; Beasley, R.; Keil, U.; Montefort, S.; Odhiambo, J.; ISAAC Phase Three Study Group. The association between tobacco and the risk of asthma, rhinoconjunctivitis and eczema in children and adolescents: Analyses from Phase Three of the ISAAC programme. Thorax 2012, 67, 941–949. [Google Scholar] [CrossRef] [PubMed]
  54. Mitchell, E.A.; Beasley, R.; Björkstén, B.; Crane, J.; García-Marcos, L.; Keil, U.; ISAAC Phase Three Study Group. The association between BMI, vigorous physical activity and television viewing and the risk of symptoms of asthma, rhinoconjunctivitis and eczema in children and adolescents: ISAAC Phase Three. Clin. Exp. Allergy 2013, 43, 73–84. [Google Scholar] [CrossRef] [PubMed]
  55. Colley, J.R.; Holland, W.W.; Corkhill, R.T. Influence of passive smoking and parental phlegm on pneumonia and bronchitis in early childhood. Lancet 1974, 2, 1031–1034. [Google Scholar] [CrossRef]
Figure 1. Map depicting the city of Hamburg. Detailed information about the boroughs can be obtained from Table A1 in the Appendix A (Own depiction, data according to Erhart et al., 2013 [26] and the Statistical Office for Hamburg and Schleswig-Holstein, 2015 [25]).
Urbansci 01 00027 g001
Figure 2. Prevalence rates of heart failure and hypertension, and spatial distribution of the variable “social deprivation” per borough, Hamburg, Germany, 2011. Age-adjusted overall treatment prevalence, including both sexes. Population is all the statutory health insured patients, with at least one contact to a contract physician working in the ambulatory sector per year. Classification of prevalence rates was conducted using quantiles. The variable “social deprivation” was obtained from a previously conducted PCA [26,29].
Urbansci 01 00027 g002
Figure 3. Prevalence rates of asthma and acute bronchitis and spatial distribution of the variable “social deprivation” per borough, Hamburg, Germany, 2011. Treatment prevalence children aged 0–14 years, including both sex. Population are all statutory health insured patients, with at least one contact to a contract physician working in the ambulatory sector per year. Classification of prevalence rates was conducted using quantiles. The variable “social deprivation” was obtained from a previously conducted PCA [26,29].
Urbansci 01 00027 g003
Table 1. Classification of all health outcomes analyzed in this study by ICD-10 (International Classification of Diseases).
Heart FailureHypertensionAcute BronchitisAsthma
I11 Hypertensive heart diseaseI10 Essential (primary) hypertensionJ20 Acute bronchitisJ45 Asthma
I13 Hypertensive heart and chronic kidney diseaseI12 Hypertensive chronic kidney diseaseJ21 Acute bronchiolitisJ46 Status asthmaticus
I26 Pulmonary embolismI15 Secondary hypertensionJ22 Unspecified acute lower respiratory infection
I27 Other pulmonary heart diseasesI67.4 Hypertensive encephalopathy
I42 Cardiomyopathy
I43 Cardiomyopathy in diseases classified elsewhere
I50 Heart failure
I51.0–I51.7 Complications and ill-defined descriptions of heart disease
I09.2 Chronic rheumatic pericarditis
I31.0–I31.1 Chronic adhesive pericarditis/Chronic constrictive pericarditis
R57.0 Cardiogenic shock
T46.0 Poisoning by adverse effect of and underdosing of cardiac-stimulant glycosides and drugs of similar action
Table 2. Indicators considered for the Principal Component Analysis (PCA).
ItemUnitYear
SGB II-benefit recipients *Proportion of the total population (%)2012
SGB II-benefit recipients below 15 years of age * Proportion of the population below 15 years of age (%)2012
Households receiving benefits Proportion of all households (%)2012
Average income in €Per taxable person2007
High school students Proportion of all school students (%)2012/2013
Employees Proportion of all working age population (15 to 64 years of age in %)2012
Unemployed Proportion of all working age population (15 to 64 years of age in %)2012
Younger unemployed (15 to < 25 years of age) Proportion of the younger working age population (15 to < 25 years of age in %)2012
Older unemployed (55 to < 65 years of age) Proportion of the older working age population (55 to < 65 years of age in %)2012
Unemployed under the SGB II Proportion of all working age population (15 to 64 years of age in %)2012
Premature deaths Per 1000 inhabitants2012
Children and adolescents < 18 years of age Proportion of the total population (%)2012
Inhabitants > 64 years of age Proportion of the total population (%)2012
Foreign inhabitants Proportion of the total population (%)2012
Inhabitants with migration background Proportion of the total population2012
Children and adolescents < 18 years of age with migration background Proportion of the total population < 18 years of age2012
Mean number of people Per household 2012
Single-person household Proportion of all households (%)2012
Households with children Proportion of all households (%)2012
Households with single-parents Proportion of all households (%)2012
Human population density Per km22012
Immigrations beyond the border of the cityIn total2012
Emigrations beyond the border of the cityIn total2012
Difference between the in- and out-migrationsIn total2012
Living spacePer inhabitant per m22012
Social housingProportion of all flats (%)2012
* SGB II: Social Security Code, Book II (Sozialgesetzbuch, Buch II) [25].
Table 3. Physician density and proportion of borough area affected by noise > 65 dB(A), Hamburg, Germany.
DensityPhysician Density aProportion of Borough Area Affected by Noise > 65 dB(A) b
Minimum0.20.7
Median1.44.2
Maximum10.410.1
a Per 1000 inhabitants; b in percent.
Table 4. Associations of determinants on heart failure, Hamburg, Germany a.
Heart Failure fHeart Failure f
MaleFemale
DeterminantCoefficient B b95% Confidence Interval (CI)p-ValueCoefficient B b95% CIp-Value
Physician density c,d0.09−0.39; 0.570.7010.12−0.30; 0.530.576
Proportion of borough area affected by noise > 65 dB(A) c0.03−0.51; 0.570.9120.03−0.43; 0.500.887
Average social deprivation e1.190.69; 1.68<0.00011.060.64; 1.49<0.0001
High social deprivation e1.991.38; 2.59<0.00011.981.45; 2.50<0.0001
a Ancova model; b Mutually adjusted; c Unit = 5%; d per 1000 inhabitants; e Social deprivation classified by PCA: 3 categories: low social deprivation = the lowest 25% of boroughs, average social deprivation = 2674% of boroughs, high social deprivation = the upper 25% of boroughs; Reference: Low social deprivation; f age-adjusted prevalence rates were considered, all age groups.
Table 5. Associations of determinants on hypertension, Hamburg, Germany a.
Hypertension fHypertension f
MaleFemale
DeterminantCoefficient B b95% CIp-ValueCoefficient B b95% CIp-Value
Physician density c,d0.11−2.39; 2.620.928−0.52−2.72; 1.680.64
Proportion of borough area affected by noise > 65 dB(A) c−1.39−4.19; 1.420.327−0.9−3.36; 1.570.471
Average social deprivation e5.52.91; 8.08<0.00015.683.41; 7.95<0.0001
High social deprivation e8.735.56; 11.90<0.00019.97.08; 12.66<0.0001
a Ancova model; b Mutually adjusted; c Unit = 5%; d per 1,000 inhabitants; e Social deprivation classified by PCA: 3 categories: low social deprivation = the lowest 25% of boroughs, average social deprivation = 2674% of boroughs, and high social deprivation = the upper 25% of boroughs; Reference: Low social deprivation; f age-adjusted prevalence rates were considered, all age groups.
Table 6. Associations of determinants on acute bronchitis, Hamburg, Germany a.
Acute Bronchitis fAcute Bronchitis f
MaleFemale
DeterminantCoefficient B b95% CIp-ValueCoefficient B b95% CIp-Value
Physician density c,d0.46−1.67; 2.580.6710.05−1.95; 2.040.964
Proportion of borough area affected by noise > 65 dB(A) c1.55−0.84; 3.940.1992−0.23; 4.240.078
Average social deprivation e0.86−1.33; 3.060.4351.35−0.70; 3.410.193
High social deprivation e2.53−0.16; 5.230.0652.540.02; 5.060.048
a Ancova model; b Mutually adjusted; c Unit = 5%; d per 1,000 inhabitants; e Social deprivation classified by PCA: 3 categories: low social deprivation = the lowest 25% of boroughs, average social deprivation = 2674% of boroughs, and high social deprivation = the upper 25% of boroughs; Reference: Low social deprivation; f children aged 014 years.
Table 7. Associations of determinants on asthma, Hamburg, Germany a.
Asthma fAsthma f
MaleFemale
DeterminantCoefficient B b95% CIp-ValueCoefficient B b95% CIp-Value
Physician density c,d−0.57−1.95; 0.800.408−0.38−1.33; 0.570.432
Proportion of borough area affected by noise > 65 dB(A) c−0.01−1.55; 1.530.9910.22−0.85; 1.280.688
Average social deprivation e0.5−0.91; 1.920.480.55−0.43; 1.530.266
High social deprivation e1.08−0.66; 2.810.2210.86−0.35; 2.060.16
a Ancova model; b Mutually adjusted; c Unit = 5%; d per 1000 inhabitants; e Social deprivation classified by PCA: 3 categories: low social deprivation = the lowest 25% of boroughs, average social deprivation = 2674% of boroughs, and high social deprivation = the upper 25% of boroughs; Reference: Low social deprivation; f children aged 014 years.

