Review

A Critical Review of High and Very High-Resolution Remote Sensing Approaches for Detecting and Mapping Slums: Trends, Challenges and Emerging Opportunities

1
Department of Geography and Geoinformation Science, George Mason University, Fairfax, VA 22030, USA
2
Department of Computational and Data Sciences, George Mason University, Fairfax, VA 22030, USA
*
Author to whom correspondence should be addressed.
Submission received: 22 December 2017 / Revised: 15 January 2018 / Accepted: 19 January 2018 / Published: 24 January 2018

Abstract

:
Slums are a global urban challenge, with less developed countries being particularly impacted. To adequately detect and map them, data is needed on their location, spatial extent and evolution. High- and very high-resolution remote sensing imagery has emerged as an important source of data in this regard. The purpose of this paper is to critically review studies that have used such data to detect and map slums. Our analysis shows that while such studies have been increasing over time, they tend to be concentrated to a few geographical areas and often focus on the use of a single approach (e.g., image texture and object-based image analysis), thus limiting generalizability to understand slums, their population, and evolution within the global context. We argue that to develop a more comprehensive framework that can be used to detect and map slums, other emerging sourcing of geospatial data should be considered (e.g., volunteer geographic information) in conjunction with growing trends and advancements in technology (e.g., geosensor networks). Through such data integration and analysis we can then create a benchmark for determining the most suitable methods for mapping slums in a given locality, thus fostering the creation of new approaches to address this challenge.

1. Introduction

Within the last fifty years the human population has increasingly become more urbanized. Most of this urbanized growth has occurred in developing countries, which often lack the ability to provide the infrastructure and basic services necessary to absorb the influx of people to cities [1,2]. This has often resulted in an increase in poverty rates in developing countries, which is manifested in the proliferation and expansion of slums in urban areas [3]. The United Nations (UN) estimates this population to be about one billion people at present, and is projected to increase further to two billion by 2030 and three billion by 2050 if more effective measures are not put in place to manage slum populations. This estimate is based on a slum being classified as a household with one or more of the following deprivations: inadequate access to water, sanitation and other infrastructure, poor structural quality of housing, overcrowding and insecure residential status [4]. However, no standard definition yet exists for slums [5]. While the terms “slums” and “informal settlements” are often used interchangeably in the literature, the United Nations Human Settlement Programme views an informal settlement as one type of slum, especially where there is insecurity of tenure. In the context of this paper, we view both slums and informal settlements as being one in the same, that is, disadvantaged communities that continue to have large impact on the physical and economic landscapes. hile developing a universal consensus on what is a slum is challenging, this is compounded by the often lack of reliable up-to-date information on their location, spatial footprint, and evolution over time [6]. Part of the reason for a non-standardized definition is related to the heterogeneity of slum characteristics worldwide [7]. Another reason is that there is no common agreement between experts concerning what criteria should be used to define slums [8]. This has resulted in many slums not being mapped and thus, being invisible to the world. Maps of slums are important for several reasons, probably one of the most important being that if it does not exist on a map, governments may not be liable for the provision of infrastructure (e.g., roads) and services (e.g., water and sanitation) to these slums [6]. The Kibera slum in Nairobi, Kenya, for example, has had a long history of failed policies and inadequate provision and services on the part of government dating as far back as the early 1990s [9]. However, since the digital mapping of this slum in late 2009, there has been a vast improvement and increase in the number of government assisted programs and services provided to this slum [10]. Consequently, it is essential to devise novel adequate methodologies for slum mapping, which are not necessarily reliant on top-down government driven initiatives but also maps generated through a bottom-up process (e.g., slum dwellers mapping their own slums) as will be discussed in Section 5.3.
It is important to recognize that maps of slums serve a wide range of stakeholders, from slum dwellers to that of urban planners and policy makers. As a result, there is a need for slum maps at different spatial, temporal and thematic resolutions. While general maps of slums are important to United Nations agencies seeking to alleviate poverty under the Sustainable Development Goals [11], more detailed maps of slums may be useful for local governments wishing to improve access to infrastructure for slum dwellers. It is important to recognize that the data used for mapping slums needs to go beyond just delineating their boundaries, but should include a wide range of information products to address the needs of the different stakeholders.
Data used to study and map slums come from a variety of sources, one of which is remote sensing imagery collected from aerial and spaceborne platforms [12]. Remote sensing offers several advantages over traditional survey-based methods (e.g., census-based approaches) of mapping the growth of slums, for example, they provide a synoptic view with the ability to capture the situation on the ground in near real-time. Since the late 1990s high spatial resolution spaceborne imagery, with a resolution of one to four meters [13], over slum areas has allowed the collection of vast amounts of data on slums. Such data allows for the comparison of inter and intra heterogeneity between slums. Recently, the emergence of very high spatial (sub-meter [13]), spectral and temporal resolution imagery has provided new opportunities to study the urban landscape at a finer scale than ever before [14]. With this new data source, researchers can now refine their analysis from the scale of settlements to that of individual dwellings, providing a powerful tool for detecting and mapping slums, which can potentially lead to a deeper understanding of the emergence and evolution of slums. The increased interest and utilization of high- and very high-resolution (H/VH-R) imagery as a key source of information on slums has resulted in an increasing body of literature over the last two decades. This provides, for the first time, an opportunity to study and analyze the different approaches and methods that have been used to study slums using H/VH-R imagery.
Motivated by the need for a more systematic review of approaches used to study slums using H/VH-R imagery, a recent review of such methods applied to slums over the last 15 years by Kuffer et al. [15] has attempted to address this gap in slum research. That study provided a high-level overview of the state of the art methods, which have used characteristics of slums extracted from imagery, with a spatial resolution of 5 m or less, to identify and map slums. The approaches used in that study were evaluated at the global level, providing valuable insights on the frequency of such approaches and their reported accuracies in the literature. Given that the characteristics of slums, both physical and socio-economic, can vary from one location to the next, a more systematic analysis examining how such methods have been applied at a more local geographic level is required, which is the purpose of this paper. As we will discuss, such analysis can be used to better understand the role that location plays in determining the suitability of methods for different locations, which may be hidden in a global comparison of methods. For example, in their classification of methods, Kuffer et al. [15] showed that on average, approaches using machine learning, Object-based Image Analysis (OBIA) and pixel-based methods produced very similar accuracies, about 86%. In their review, studies using pixel-based approaches, in particular, showed the lowest amount of variation in reported accuracies compared to the other two methods. This would suggest that this method may be more suitable for identifying slums (i.e., lowest variability and high accuracy). However, the authors recommended otherwise, suggesting the use of machine learning over all other approaches. The large variability in reported accuracies in some methods could be due to a number of reasons, including, an examination of studies, which include very small versus very large geographic areas (leading to increase difficulty in classification), studies classifying very simple versus more complex landscapes, and variability in the complexity, training and calibration of the methods used to detect and map slums.
In this paper, we extend previous work that has used remote sensing data to study slums. Our objectives are twofold: (1) provide a more in depth geographic analysis of those approaches that have been applied to H/VH-R remote sensing imagery to study slums; and (2) for each approach, assess its applicability for studying the temporal evolution of slums at different growth stages. With respect to our first objective, this enables us to identify where H/VH-R imagery have been used to study slums, and in such instances, which approaches have been applied. In respect to our latter objective, this aspect of slums, although identified as an important research need in many studies, to date, there has been only few studies that have investigated the temporal growth of slums (e.g., [16,17]). Of such studies, none have assessed the applicability of approaches to the various growth stages of slums. This enables us to identify key commonalities in the study of slums from a H/VH-R imagery perspective along with identifying key emerging challenges and opportunities in this area of research, which we have also attempted to address in this paper for improving the detection and mapping of slums. With respect to opportunities, we discuss the important value added in combining remote sensing with auxiliary data, some of which can be captured from emerging sources of data such as volunteered geographic information (VGI) and unmanned aerial systems (UASs). Further, taking into account the increasing number of sensors and related technologies that continue to collect information on people, place and society on a daily basis, we discuss the important need to establish geosensors networks for improving the collection of information on slums. With the growth and advancement in imaging sensor technology, which increasingly provides greater spatial, spectral and temporal resolutions, the reliance on H/VH-R imagery for slum mapping is expected to increase. Consequently, the demand for identifying opportunities of using H/VH-R imagery and best practices for the study of slums is also expected to increase.
The remainder of this paper is structured as follows. In Section 2, characteristics of remote sensing data used for capturing slum information are examined with main emphasis on the use of remote sensing imagery to both augment and replace traditional sources of data where needed. Section 3 discusses the various stages in the temporal growth of slums while Section 4 reviews the most commonly used approaches for the analysis and mapping of slums using H/VH-R imagery. Section 5 discusses some of the challenges of using remote sensing data on its own for mapping slums. This section further looks at various opportunities for improving or supporting current approaches for the collection of information and mapping of slums. Finally, Section 6 provides a discussion and outlook for future research.

2. From Surveys to Remote Sensing Data in Slum Mapping

One of the most widely used tools for collecting information on slums has been the use of population and housing census surveys. In this approach, data is collected though surveys as a basis for deprivation or poverty mapping [18], with the purpose of using this information as an indication of slums [19]. Examples of such research using census data for studying slums include work by [20,21,22]. These types of surveys are not uncommon, and compared to other sources of data such as H/VH-R imagery, country-level census data is usually available for most countries [19].
However, there are several limitations with the use of census data, at least on its own, for detecting and mapping slums. First, the collection of census data is very labor intensive, time consuming and requires substantial financial resources [23]. Second, there often exist long temporal gaps between census data collection campaigns, typically 5 to 10-year intervals on average [24,25,26,27], with intervals extending to several decades in some cases [28,29]. Additionally, when the raw census data is collected, extended time (as much as three years in some instances [30] is needed to compile the data and make the information products available to users [31]. Given the highly dynamic nature of some slums (e.g., a growth rate upwards of 1000 persons per day in Dhaka, Bangladesh [32], the spatial information collected using such surveying methods may already be obsolete when released to users.
Third, census statistics are usually provided at the aggregated city or neighborhood level, failing to convey the fine-grained heterogeneity that is often present in slums [33]. These units of aggregation also vary in size and do not include information on housing density and quality [34], essential components for both spatially locating slums and discriminating them from their surroundings. Moreover, while remarkable strides have been made towards disaggregating census data to much higher spatial resolutions (e.g., [35]), only a few variables such as population counts have been examined.
Fourth, slum dwellers are often reluctant to take part in household surveys because of fear of being evicted by authorities once their location is known [36], or other misuses of such information against them [37,38]. Lastly, even when up-to-date census data does exist, a lack of rigorous quality control implemented in some countries often impacts the ability to rely on such data for mapping and developing policies necessary to reduce slum populations [39,40].
Motivated by these limitations, remote sensing has emerged as a feasible approach for the large-scale collection of slum information at a fine level of granularity. Remote sensing data is typically used alongside field data, which is used to both calibrate and validate this data [41]. Additionally, existing auxiliary datasets can be used for this purpose, for example, data on infrastructure, topography, soil, geology and vegetation, can serve as reference data for the validation of data extracted from remote sensing sources [42,43].
Remote sensing provides several advantages over census surveys for collecting information on slums. First, the cost of acquiring H/VH-R imagery has reduced substantially over the last decade [44]. This has been due to various factors, which include the increase in the number of H/VH-R imagery providers, advancements in sensor technology allowing for the collection of larger swaths of data, the growth of free imagery platforms such as Google Earth, and decreasing costs of computing equipment used for processing large amounts of data, among others. The economic efficiency of using high-resolution imagery to reduce field sampling has also been shown to have substantial cost savings [45]. These advantages are further enhanced by the digital format of current remote sensing imagery, which enables the direct application of semi and fully automated feature extraction algorithms, leading to further reduction in cost.
Besides cost, the ability of modern remote sensing systems to provide frequent systematic coverage over long periods of time enable longitudinal studies of slums. This overcomes the limitations of traditional survey-based data collection methods, which are often interrupted by access constraints (e.g., unsafe zones [46]), and the limited availability of survey staff and resources. In contrast, remote sensing systems are able to collect information at constant time intervals and at very high spatial resolutions. This systematic nature of remote sensing data is particularly important for the study of slums and their dynamics because of their rapid growth rates, which require much more frequent monitoring. Such monitoring capability is essential for measuring the impact and success of relief efforts, which in turn can inform policies aimed at improving the living conditions in slums. These benefits, taken together, makes remote sensing an invaluable and scalable solution for the collection of large amounts of information on slums.
Once data is collected and made available, it then becomes necessary to process it so that meaningful information and knowledge can be derived. As with other types of data, many approaches have been used to process remote sensing data. However, before reviewing the various H/VH-R remote sensing approaches used to study slums in Section 4, it is first important to understand the temporal stages of slum growth, since this information can be used to determine the most appropriate approaches to be used to identify and map slums.

3. Temporal Growth of Slums

The development of slums is not random process and research has shown that various factors (e.g., availability of land and jobs) influence where slums dwellers build [6]. This growth can take different forms depending the circumstances of the slum dweller (e.g., conflict or war leading to mass land invasions [47]), the various actors involved (e.g., politicians and land developers [48]) and historical land practices (e.g., segregation [49]) among others. Slum formation and growth can be modeled following one of three processes [50]: (1) incremental growth where the land is illegally occupied, (2) overnight invasions where the land is informally but legally occupied by residents, and (3) overnight invasions where the land is occupied illegally. The most common model used to study the growth of slums, however, has been the incremental growth model [51].
Many researchers have studied the growth of slums (e.g., [48,52,53,54,55,56]). Sliuzas [57] suggests that physical changes to the incremental growth of slums, as observed from H/VH-R remote sensing images, can be monitored at three distinct stages: infancy, consolidation and maturity. During the infancy stage, few dwellings have been built on the land. As dwellings continue to grow in number, an increase number of services are introduced, along with improvements to dwellings’ condition during the consolidation stage. At this point a settlement boundary begins to take shape. Further growth leads to the unsustainable densification of housing and increasing congestive conditions in slums. Growth at this maturity stage occurs at the expense of demolition. Vertical densification of slum dwellings may occur at this stage [58]. Moreover, it is also important to note that while slums in most cases have been known to develop from informal building practices, this development can also start from formal land development, which may become increasingly degraded over time [59]. It is, therefore, equally important to not only monitor the growth of slums, but to also to monitor the growth of different parts of cities that are likely to be transformed into slums in the future.
While studies have described the various stages in the growth of slums, very few studies have measured changes in such properties of slums over time using H/VH-R remote sensing imagery. As suggested by Kit and Lüdeke [17], this is in part related to the unique nature of slums, which means that the development of fully automated slum identification methods continues to be imperfect. Kuffer et al. [60] also suggests that the limited number of multitemporal studies on slums could be due to limitations with acquiring data on these settlements, as well as obtaining local knowledge to supplement this data overtime. This local knowledge is crucial and represents data that can be used to both validate the results of mapping approaches, as well as improving the collection of slum data over time [6]. Further, the non-standardized collection of slum data for different time periods can make the multitemporal physical comparison of slums difficult, or even unreliable in some cases. Added to this, the definition of what a slum is can also change over time [61], which makes it difficult to compare slums at different growth stages. Moreover, in places such as India where several definitions for slums exist [62], the choice of the most appropriate definition to be used may be linked to different issues altogether.
Having discussed the need for the consistent and frequent monitoring of slums using H/VH-R imagery in Section 2, and the need for monitoring their growth and evolution overtime in this section, the next section reviews key approaches that have been used to study the spatial properties of slums. We further examine the suitability of these approaches with respect to monitoring the different stages of slums growth.

4. Slum Mapping from Remote Sensing

Generally, key approaches for mapping slums from remote sensing data have been based on three processing steps:
  • Detection—this step includes methods that locate features of interest in an image and is usually the first stage in image classification.
  • Delineation—this step involves identifying the spatial extent of features.
  • Characterization—in this step, features of interest are labeled as belonging to a specific class.
In view of these steps, various approaches and techniques have been suggested to exploit remote sensing data for slum mapping. In a broader perspective, the wide variety of approaches that have been reported in the literature give rise to seven categories that can be identified based on the core principle that drive the mapping process: (1) multi-scale; (2) image texture analysis (3) landscape analysis; (4) object-based image analysis; (5) building feature extraction; (6) data mining; and (7) socioeconomic measures. Table 1 presents a summary of these various categories, along with some representative examples from the literature. Approaches discussed within each category are also examined with respect to the image properties they utilize to detect and map slums. Based on the advantages and limitations discussed in this section, we also outline areas of future work, which will serve as the basis for a research agenda that is presented in Section 6.

4.1. Multi-Scale Approaches

Multi-scale approaches utilize tools and techniques that can be used to discriminate features based on properties that emerge across different spatial scales. Common multi-scale methods used to analyze slums include fractal and lacunarity measures [81,82]. While fractals are concerned with measuring the geometrical complexity associated with the shape of a feature [83], lacunarity has mainly been used as a measure of internal heterogeneity, analyzing the size distribution of open spaces between features [68]. As it relates to slums, large fractal and lacunarity values suggest chaotic patterns of growth typical of many slums.
Galeon [84], for example, used fractal geometry to distinguish between slums, semi-formal and formal settlements in Quezon city in the Philippines. In that study, fractal measures gave poor results when distinguishing between slums and formal settlements. However, this measure provided better discrimination between slums and semi-formal settlements, with semi-formal settlements having higher fractal values than slums. In another study, Filho and Sobreira [63] compared two methods for deriving lacunarity, a box counting and a gliding box routine, for distinguishing between different socio-economic groups in Recife, Brazil. Socio-economic scores were determined from census data and ranged in value from 0 to 1, with higher values suggestive of a higher socio-economic standing. This study showed that the gliding box routine performed much better, with a classification accuracy of 80% compared to 50% when using the box counting algorithm.
The same researchers have also explored the combination of both fractal and lacunarity for distinguishing between slums and formal settlements in the cities of Campinas and Rio de Janiero in Brazil [81]. In that study, the authors used a box counting routine to extract lacunarity values for varying box sizes, with box sizes close to 100 m2 leading to convergence between slums and formal settlements, noting that higher lacunarity values were found to be associated with informal settlements. Other studies have additionally combined image preprocessing routines with lacunarity to help distinguish between formal and slum areas (e.g., [17,51]).
At the same time, several issues have been identified with the use of fractal geometry and lacunarity for studying slums. Concerning the calculation of fractal values, most methods apply a mono-fractal approach on only one image band [85]. These studies assume that a single fractal dimension can be used to characterize slum settlements. However, as Sun et al. [85] suggests, the scaling behavior of image properties in remote sensing imagery generally deviates from the assumption of a mono-fractal dimension. In the case of lacunarity, one issue is that the boundaries of slums do not regularly correspond to the grid cells used to extract lacunarity values. This method can therefore potentially misclassify or misidentify slums covering smaller areas [17]. In addition, the application of lacunarity at too coarse scale may result in loss of information at the transition zone between slums and non-slums. Further, because objects can vary both spatially and spectrally in high-resolution imagery [85], lacunarity values calculated for slums in one area may not be applicable to another location [86]. Finally, as for multi-scale approaches in general, much of the work in this area have focused on slums in large cities, where discrimination from other settlement types is more noticeable. Such discrimination, however, may not be present in the case of smaller cities in many developing countries where problems with urbanization is expected to be especially acute [64]. Given these limitations, we would argue, that more research is therefore needed to determine the suitability of multi-fractal approaches for studying slums, as not all features in a given scene exhibit the property of self-similarity [63]. Further, with respect to monitoring the growth of slums, multiscale approaches are more suitable for monitoring growth at the consolidation and maturity stages. This is especially the case since these approaches typically lose their multiscale characteristics with decreasing density of features at a local level [87].

4.2. Image Texture Analysis

Image texture represents a repeated variation of intensity and color that is directly portraying object structure and spatial arrangement in an image [88]. This analysis is often complex as image features tend to exhibit a scale-dependent behavior, leading to difficulties in the interpretation of results [89]. Texture measures can be extracted using several approaches, namely structural, statistical, model-based or transform methods [90]. Most methods of texture analysis applied to slums examined in the literature, however, have used structural and statistical approaches.
Structural approaches view image texture as a composition of well-defined primitives [91]. A widely-used method in this regard is mathematical morphology (MM). MM, which is based on set theory, uses a set of image operators (e.g., erosion and dilation) to extract features from an image based on the shape and size of quasi-homogeneous regions [92]. As it relates to slums, MM has largely been used to refine the outputs of processes used to extract features from binary images, such as the removal of trees, fences and other unwanted artifacts (e.g., [93,94]). Some work, albeit limited, has also applied MM to grayscale images as part of multi-scale applications within slums. An example of this is the use of the Differential Morphological Profile (DMP), which employs a combination of morphological operators and derivatives of the resulting morphological profile [95]. For instance, Pesaresi and Ehrlich [66] extracted DMP signatures for different building types from the Kibera slum and surrounding formal commercial and residential areas in Nairobi, Kenya from high-resolution imagery. This study showed that DMP signatures for slum dwellings were smaller (3 m) in comparison to formal settlements (8 m).
In contrast to structural approaches, statistical approaches focus on the spatial relationship and the intensity of pixels locally to uncover patterns between groups of pixels [91]. One of the most commonly used methods has been based on the Grey Level Co-occurrence Matrix (GLCM) as described by Haralick et al. [96]. For example, Kohli et al. [19] proposed GLCM texture measures (e.g., entropy, contrast, variance and the mean) for extracting slums at the settlement level since these measures are better able to detect the high density of dwellings typical to slums. In another study, Kuffer et al. [97] found that slums in Mumbai, India had much lower variance texture values compared to surrounding formal areas. In contrast to these studies, Stasolla and Gamba [65] suggested the use of several autocorrelation texture measures for discriminating slums and formal settlements using radar data. However, this study utilized only few classes for classifying the land use land cover, thus requiring additional research for evaluating the suitability of this approach in more complex urban environments. It is also worth noting that this study is one of only a few who exploited radar imagery for mapping slums (e.g., [98,99,100]).
Several limitations have been identified with the use of image texture analysis for detecting and mapping slums. First, with respect to structural approaches, using operations such as dilation in scenes where slum dwellings are located close together may hinder the ability to distinguish between individual dwellings. Second, the application of structural approaches typically involves scene-specific rules for extracting particular features of interest [101], therefore limiting the generalizability of such methods. Finally, the use of multi-scale approaches such as DMP often lack completeness, even in cases where auxiliary data, such as shadow footprints, are used [92].
Various issues have also been identified with the application of statistical texture measures when used to study slums. One issue is that texture measures extracted for slums tend to vary across different locations, even within the same slum. This can be explained by physical differences in slums, for example, size, shape, orientation and building materials used to construct dwellings [75,77,102], the shape [103] and size of windows used to extract texture, as well as the spatial resolution of the imagery [104]. Consequently, textural patterns extracted from one image may not be applicable to another image [105]. This is because image texture does not consider pixels independently, instead, groups of pixels, which form an objective pattern are used to distinguish different types of features. This makes texture analysis approaches suitable for extracting slums at their consolidation and maturity growth stages, wherein distinct clusters of pixels forming a settlement boundary is more observable compared to the infancy growth stage. Finally, many statistical texture measures extracted from remote sensing imagery have been found to correlated with each other [106], with the need to further explore other approaches and methods for deriving image texture.

4.3. Landscape Analysis

Quantitative landscape metrics have been used to analyze the spatial patterns of land cover, describing both their composition and configuration [107]. In such approaches, the main unit of structural analysis used is a patch, i.e., features made up of pixels regions that are adjacent to each other and have the same land cover. Kuffer et al. [67], for example, evaluated several landscape metrics in slums and their surrounding areas, with the overall goal of creating an unplanned settlement index (USI). Two study areas were chosen, New Delhi, India and Dar es Salaam, Tanzania. The results of that study showed that discriminating indicators for unplanned settlements varied in both study areas. In New Delhi, the most suitable metrics were mesh size, landscape division index, patch density, contagion, aggregation and Simpson’s evenness index. In the case of Dar es Salaam, the most suitable metrics were mean area, patch density, aggregation index and Shannon’s diversity index. Furthermore, a combination of those indicators using multi-criteria analysis showed that high USI values were associated with slums when compared to more formal areas. In the same vein, Owen [68] and Baud et al. [34] applied landscape metrics and found that vegetation was much more compact in slums compare to other formal areas.
Similar to other approaches discussed, landscape metrics also have several challenges when used to study slums. According to Mesev [108], landscape metrics are completely dependent on an initial spectral characterization of the remote sensing imagery. These metrics are also absent from the actual process of the characterization of homogeneous classes [109]. Such concerns mainly relate to the accuracy of extracting homogeneous classes that are used as input in landscape analysis. This is due to their dependence on the interpretation of images, which leads to subsequent changes in the results of analysis with variations in scale, spatial resolution, and differences in the dichotomous key used for deriving land cover classes. Another limitation with the use of landscape metrics is that, although a wide variety of metrics exist, many of these are correlated with each other [110,111]. Added to this, little guidance exists on the selection of the most effective landscape metrics for various applications (e.g., slum analysis), often leading to a process of trial- and-error in the choice of the most suitable landscape metrics for use [112]. These caveats with the use of landscape metrics suggest the need to further investigate the relationship between different metrics for the same land cover classes, with the goal of formalizing a set of best practices for selecting the most appropriate landscape metrics based on landscape suitability. Finally, with respect to the monitoring of slums, given their dependence on land cover information, landscape metrics are better suited for monitoring their consolidation and maturity growth stages.

4.4. Object-Based Image Analysis

In object-based image analysis (OBIA) an image is treated as being made up of a composition of objects. Properties such as size, shape, texture, relationship with neighboring objects [113], as well as various combinations of these properties are used to aid the object extraction process [114,115]. OBIA has also been applied at multiple scales since it has been found to be useful in extracting semantically significant regions in remote sensing imagery [116]. Moreover, because of its ability to better emulate human cognitive image interpretation, it has been suggested that the results of OBIA better reflect objects in real life [117].
With respect to slums, one of the first studies using OBIA was by Hofmann [69]. In that study, multi-resolution analysis was first used to segment Ikonos imagery at different spatial scales over Cape Town, South Africa. Image objects were extracted at the different scales and then linked together using a class hierarchy approach, with super objects such as informal settlements containing various physical (e.g., size of dwellings) and contextual (e.g., texture) class descriptors. These descriptors characterizing the different objects were described using a set of fuzzy logic rules. The procedure used by Hofmann [69], however, proved complex and data specific, and therefore difficult to generalize to other areas. Hofmann et al. [118] later utilized an ontology for generalizing rules to extract slums in Rio de Janeiro, Brazil. However, besides the work of Hofmann et al. [118], very few studies have investigated the potential of using ontologies to map slums (e.g., [19,119,120]).
Other studies that have applied OBIA to extract information on slums have used an approach similar to that of Hofmann [69]. Examples of such work include studies by Rhinane et al. [94], Kit et al. [51], Veljanovski et al. [70]. These studies mainly differ in the segmentation parameters used for extracting slums as a result of variations in physical characteristics of slums, as captured in remote sensing imagery. Specifically, segmentation parameters (e.g., weight, scale, color/shape, smoothness/compactness, and level) affect how an image is initially partitioned into objects for later refinement and final extraction [69]. Although various combination of values for each segmentation parameter affects an image scene to different extents, Su et al. [121] suggests that scale is usually the most influential factor when doing multi-resolution segmentation. A key issue with segmentation parameters, however, is that they are mainly chosen subjectively [16,122]. Few studies have developed automated methods for the selection of segmentation parameters for slums, notably Novack and Kux [71].
OBIA, as with other approaches used for extracting slum information, have several limitations. One issue is that the presence of vegetation and shadows occluding parts or entire dwellings have been shown to reduce extraction accuracies (e.g., [37,71]). Another recognized issue with OBIA is that the materials used to construct slum dwellings lead to high spectral noise. For example, unpaved roads can have similar spectral reflectance to rooftops in slums, leading to challenges in the extraction of individual dwellings. Also, rules developed to extract slums in an image are usually specific for that image scene, significantly limiting their application to other geographic areas [86]. As a result, automated OBIA tend to provide poor results, especially in highly dense areas, due to the intra and inter diversity of slums [17]. However, for image scenes collected under the same conditions (e.g., sensor angle and ambient lighting), OBIA scene-based rules can be tailed to map slums at all three growth stages. This includes the mapping of individual dwellings at their infancy stage of growth, which becomes increasingly difficult with the desification of dwellings within slums at their consolidation and maturity growth stages. In order to further allow flexibility in the use of OBIA approaches for mapping slums, we suggest the need for greater exploration in the use of ontologies for making such approaches more generalizable to different images and scene conditions.

4.5. Building Feature Extraction

Closely related to OBIA are studies that use digital surface models (DSMs) to study slums. These approaches focus mainly on the extraction of individual dwellings with the underlying assumption that height data can be used to distinguish slum dwellings from surrounding objects, resulting in a 3D model of slums. Most studies applied to slums, however, use optical imagery to derive DSM information with very few studies using LiDAR data (e.g., [123,124]). Height information is extremely valuable for improving population estimates, especially where vertical densification of dwellings is typical. Optical derived DSM feature extraction is usually a two-part process. First, aboveground heights are extracted by subtracting a Digital Terrain Model (DTM) from a DSM to create a normalized DSM (nDSM). The second step involves segmentation of the nDSM [92].
The most common method for extracting DSM information is the use image matching techniques using stereo images. Such an approach was used by Mason et al. [72] to extract slum dwellings in the Marconi Beam settlement in Cape Town, South Africa. An nDSM was first created using stereo images acquired from very high-resolution aerial imagery. That study reported an extraction accuracy of 67%, along with several limitations related to the method used to delineate dwellings using building shadow due to their close proximity with each other. This work was further extended by Li et al. [73] to include color similarity cues to connect edges of dwellings. Although improved results were reported, as in Mason et al. [72], they assumed a rectilinear model for rooftops, which may not be applicable to other slum areas where roofing extent does not follow such a pattern.
Several studies have also used active contour models, commonly known as snakes [125], to study slums. It has been argued that snakes provide a more robust and elastic option for locating the boundaries of features in remote sensing imagery [126]. Rüther et al. [74] used snakes to extract dwellings from contours derived from an nDSM of the Marconi Beam and Manzese slum settlements in Cape Town, South Africa and Dar es Salaam in Tanzania respectively. In that study, an extraction accuracy of 62% was reported with an overall 81% rooftop shape extraction accuracy. In a similar study, Mayunda et al. [127] used a radial casting approach to initialize the position of the snake in the imagery, resulting in an average extraction accuracy of 94% for slum dwellings in Dar es Salaam.
While DSM-based building extraction approaches offer an additional vertical dimension with which to identify and discriminate slums, several limitations have also become apparent from their use. According to Ioannidis et al. [92], simple DSM approaches include not only slum dwellings but also other artifacts such as vegetation, which leads to reduced extraction accuracy. Also, stereo image matching techniques traditionally used for generating DSM suffer from insufficient ground sampling data, poor image quality and degradation from shadows and occlusions, which obstruct the outlines of buildings [72,74,128]. Contour models can alleviate some of these limitations, however, they have been criticized for first having to be initialized [129], and encounter difficultly in distinguishing objects with similar height [92]. These issues are expected to vary with differences in physical characteristics in slums. Nonetheless, given the additional level of discrimination associated with the use of DSM-based approaches, they provide a great opportunity for monitoring slums during their infancy and consolidation growth stages. At the maturity growth stage, it becomes increasingly difficult to penetrate the thick roof canopy of dwellings to extract height information. Future research, in addition to exploring additional segmentation-based methods for working with height data should also consider opportunities for reducing the cost and improving the collection of such data (e.g., LiDAR) over slum areas.

4.6. Data Mining

Of growing interest within the last several years has been the use of data mining approaches for detecting and mapping slums. Such approaches incorporate tools and techniques to undercover novel and potentially useful patterns in large quantities of data [130]. Many of the tools utilized in data mining come from areas such as machine learning and artificial intelligence. Such approaches have also been applied to slums. Graesser et al. [75], for example, applied a See5 decision tree to a set of 230 variables derived from various statistical approaches to study slums in cities in different parts of the world. That study reported overall accuracies of 91%, 89%, 92% and 85% for the cities of Caracas, Venezuela, Kabul and Kandahar in Afghanistan, and La Paz, Bolivia respectively, using all variables. The authors further show that if the top 10 variables alone were to be used, overall accuracies upwards of 75% could be achieved. Other decision trees, such as random forests, have also been used to detect and map slums in Beijing, China [131], Mumbai and Ahmedabad in India, and Kangali, Rwanda [60]. While in Owen and Wong [87], a decision tree developed using a Gini splitting rule was used to study slums and formal settlements in Guatemala city, Guatemala. Studies using decision trees generally report high classification accuracies when used to map slums.
Another data mining approach, pattern recognition, has also been applied slums. Vatsavai [76], for instance, used a multiple instance learning approach to extract slums from high-resolution imagery. In that study, a bag of instances model using a multivariate Gaussian function, was utilized for both training and testing data, and applied to four different geographic locations: (1) Accra, Ghana; (2) Caracas, Venezuela; (3) La Paz, Bolivia and (4) Kandahar, Afghanistan. That study reported classification accuracies upwards of 81%, outperforming other classifiers such as random forest trees and Naïve Bayes classification. Several studies have also applied machine learning (e.g., Support Vector Machines [132,133]) and optimization (e.g., genetic algorithms [119]) approaches to slums and have reported overall high mapping accuracies. However, in general, the body of literature in this area is still rather sparse, as shown in a recent review by Kuffer et al. [15].
Although the accuracy of data mining approaches to study slums tend to be higher than other methods [15], it is important to understand the various limitations with the use of such approaches. As very few studies have used data mining tools and techniques to detect and map slums, the ability to generalize these methods is yet to be fully explored. Most studies reviewed have focused their analysis on very specific areas with even fewer studies, such as Graesser et al. [75] and Vatsavai [76], applying methods to different geographic areas. This is particularly important for data mining approaches that utilize specifically empirically derived parameters using training data [134], making the generalization of such methods problematic. From an implementation perspective, many data mining tools and techniques require significant computing resources, especially when working with large datasets. This can pose a significant challenge, especially to developing countries who often have limited computing resources. While recent work using deep learning tools to map poverty have been shown to be of immense benefit in regional and global mapping efforts (e.g., [135]), the output of such approaches continue to be aggregated at coarse enumeration levels. Given their general need for large amounts of training data, data mining approaches are better suited for monitoring slums during their consolidation and maturity growth stages. Future work using data mining to detect and map slums should further explore other sparse data approaches, along with ensemble-based approaches that combine different algorithms, for which there has been limited work applied to slums.

4.7. Remote Sensing Data for Supporting Socio-Economic Assessment

While directly extracting socio-economic data from remote sensing has been challenging, such data has been used to support socio-economic assessments of slums. Socio-economic information is especially important in rapidly growing areas such as slums where census data is outdated or non-existent [136]. Among those socio-economic variables often estimated and extensively studied is population size. The most common approach for estimating slum populations from H/VH-R remote sensing imagery has been the use of manual photointerpretation (e.g., [37,137,138]). Traditional methods using photointerpretation are able to resolve individual dwellings with high levels of accuracy. However, these methods are not very scalable to large geographic areas, thus further highlighting the need for an automated approach for mapping slum dwellings from remote sensing data.
Information extracted from remote sensing imagery has also been combined with other auxiliary information, and used for characterizing slums. Niebergall et al. [78], for example, used an OBIA (Section 4.4) approach to examine various socio-economic variables in slums in Delhi, India. Objects were first extracted from high-resolution imagery and linked at successive levels of segmentation. Those objects were used to estimate population and water consumption for the various slums. These estimates were then compared to field data, with reported accuracies upwards of 80%. Other studies have also used imagery to extract deprivation (e.g., [139]) and socio-economic status (e.g., [79,80]) in slums. However, few studies of this type could be found in the literature, highlighting the need for greater research in this area.
Similar to other remote sensing approaches discussed above, several limitations have been identified from studies using H/VH-R imagery for supporting socio-economic assessments of slums. First, the ambiguity in identifying socioeconomic groups [79], along with the ambiguity in image classification, can impact the overall accuracy of mapping these groups. Second, socio-economic (proxy) information extracted from remote sensing data is often difficult to combine with existing socio-economic data (e.g., census) due to differences in spatial and temporal resolutions of these data [6]. Third, while many studies have focused on small geographic areas, their applicability to large geographic areas has been the focus of very few studies, prompting further research in this area. Finally, while not exclusively used as an approach for classifying slums from H/VH-R imagery, socio-economic assessment approaches can be used to characterize changes in slums over time. However their use is limited to studying slums during their consolidation and maturity stages, these growth stages support more accurate mapping of slums due to their more discernable boundaries in remote sensing imagery. Future research should further explore different methods for combining remote sensing and socio-economic data, along with socio-economic data (proxy or otherwise) that can be used in this regard, a topic that we will be visiting in Section 5.

5. Challenges and Opportunities

As Section 4 has discussed, remote sensing imagery provides many great opportunities for studying and understanding slums. As it relates to the use of H/VH-R imagery, this data provides us with the opportunity to detect, delineate and characterize slums. Approaches that have been used in this regard range from multiscale (e.g., fractal and lacunarity analysis), which mainly rely on information extracted from remotely sensed imagery, to approaches using remote sensing to support socio-economic assessments have been used to study slums. All approaches, however, encounter issues with no one approach significantly and consistently outperforming others in extracting information on slums. In order to better understand such issues, in Section 5.1 we review the spatial and temporal distribution of studies that have used H/VH-R remote sensing imagery to study slums. Building on this review we discuss issues with the sole use of H/VH-R remote sensing images for studying slums in Section 5.2. Section 5.3 identifies several opportunities for overcoming such issues, highlighting the role of remote sensing data as complementing existing sources (socioe-conomic or otherwise) rather than replacing them. Section 5.4 identifies various emerging sources of information, which have the potential to improve detection and mapping efforts. Finally, Section 5.5 discusses geosensor networks as conceivable mechanisms for increasing the collection of information on slums.

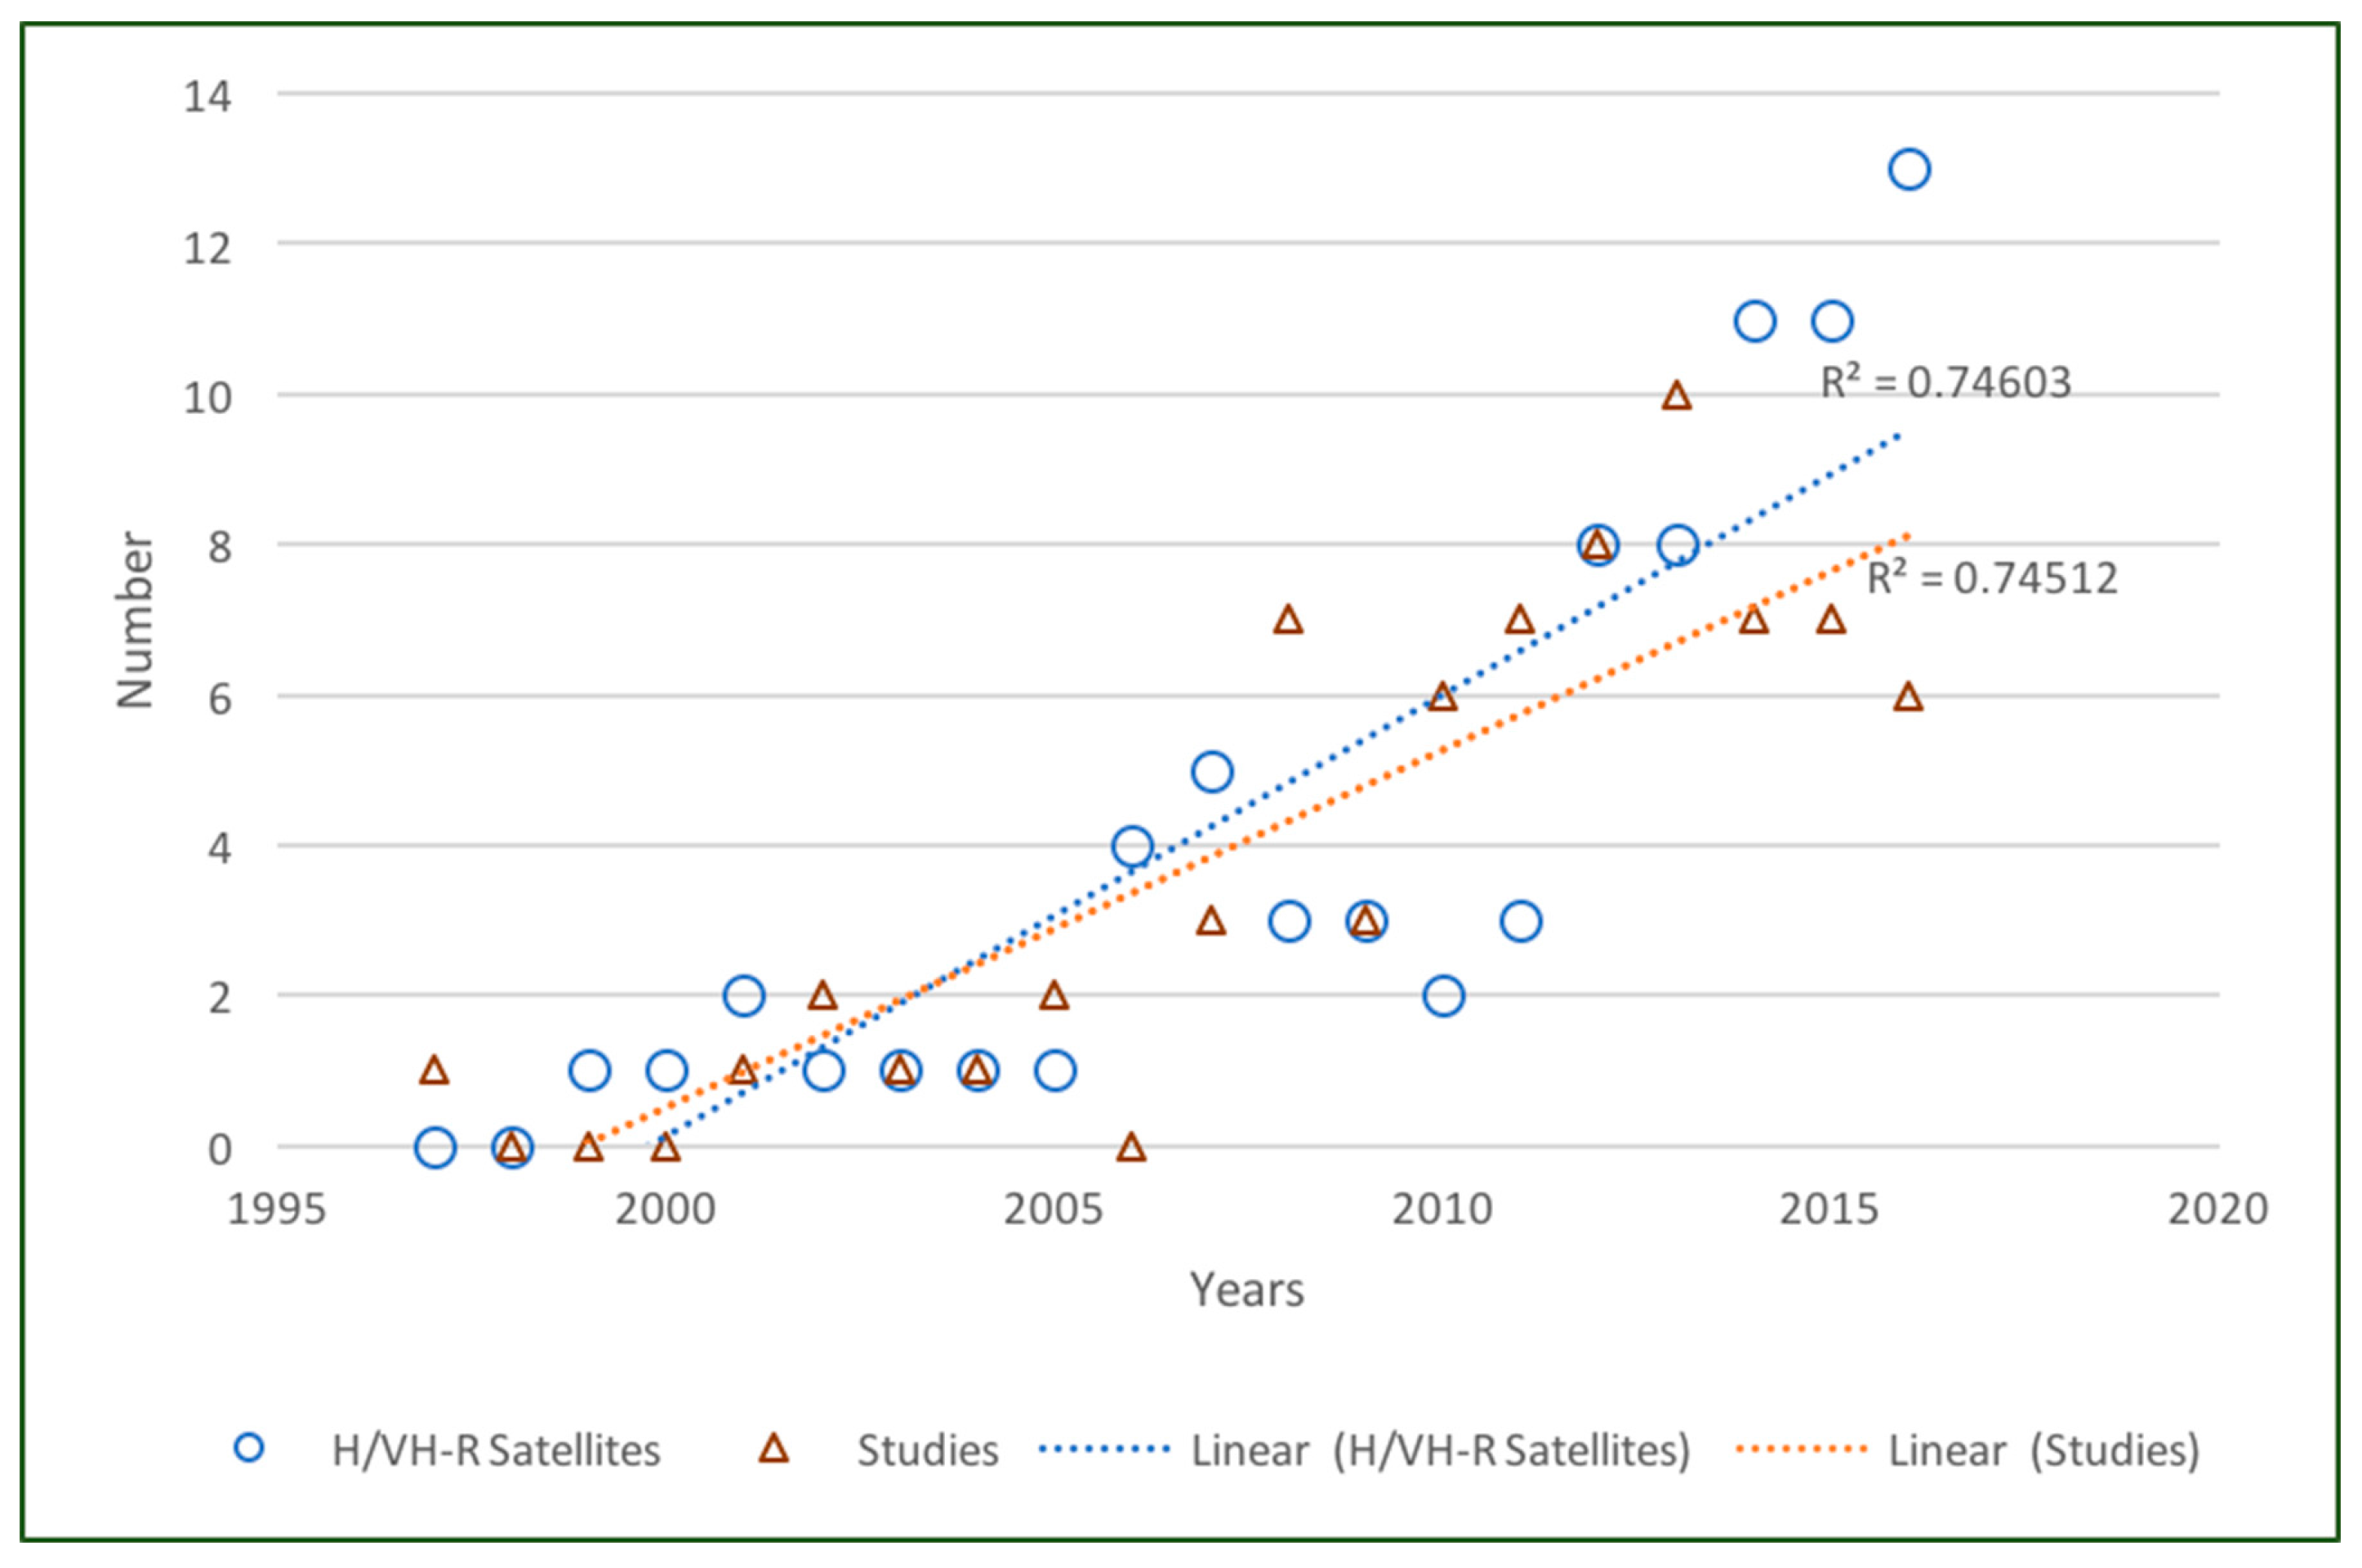
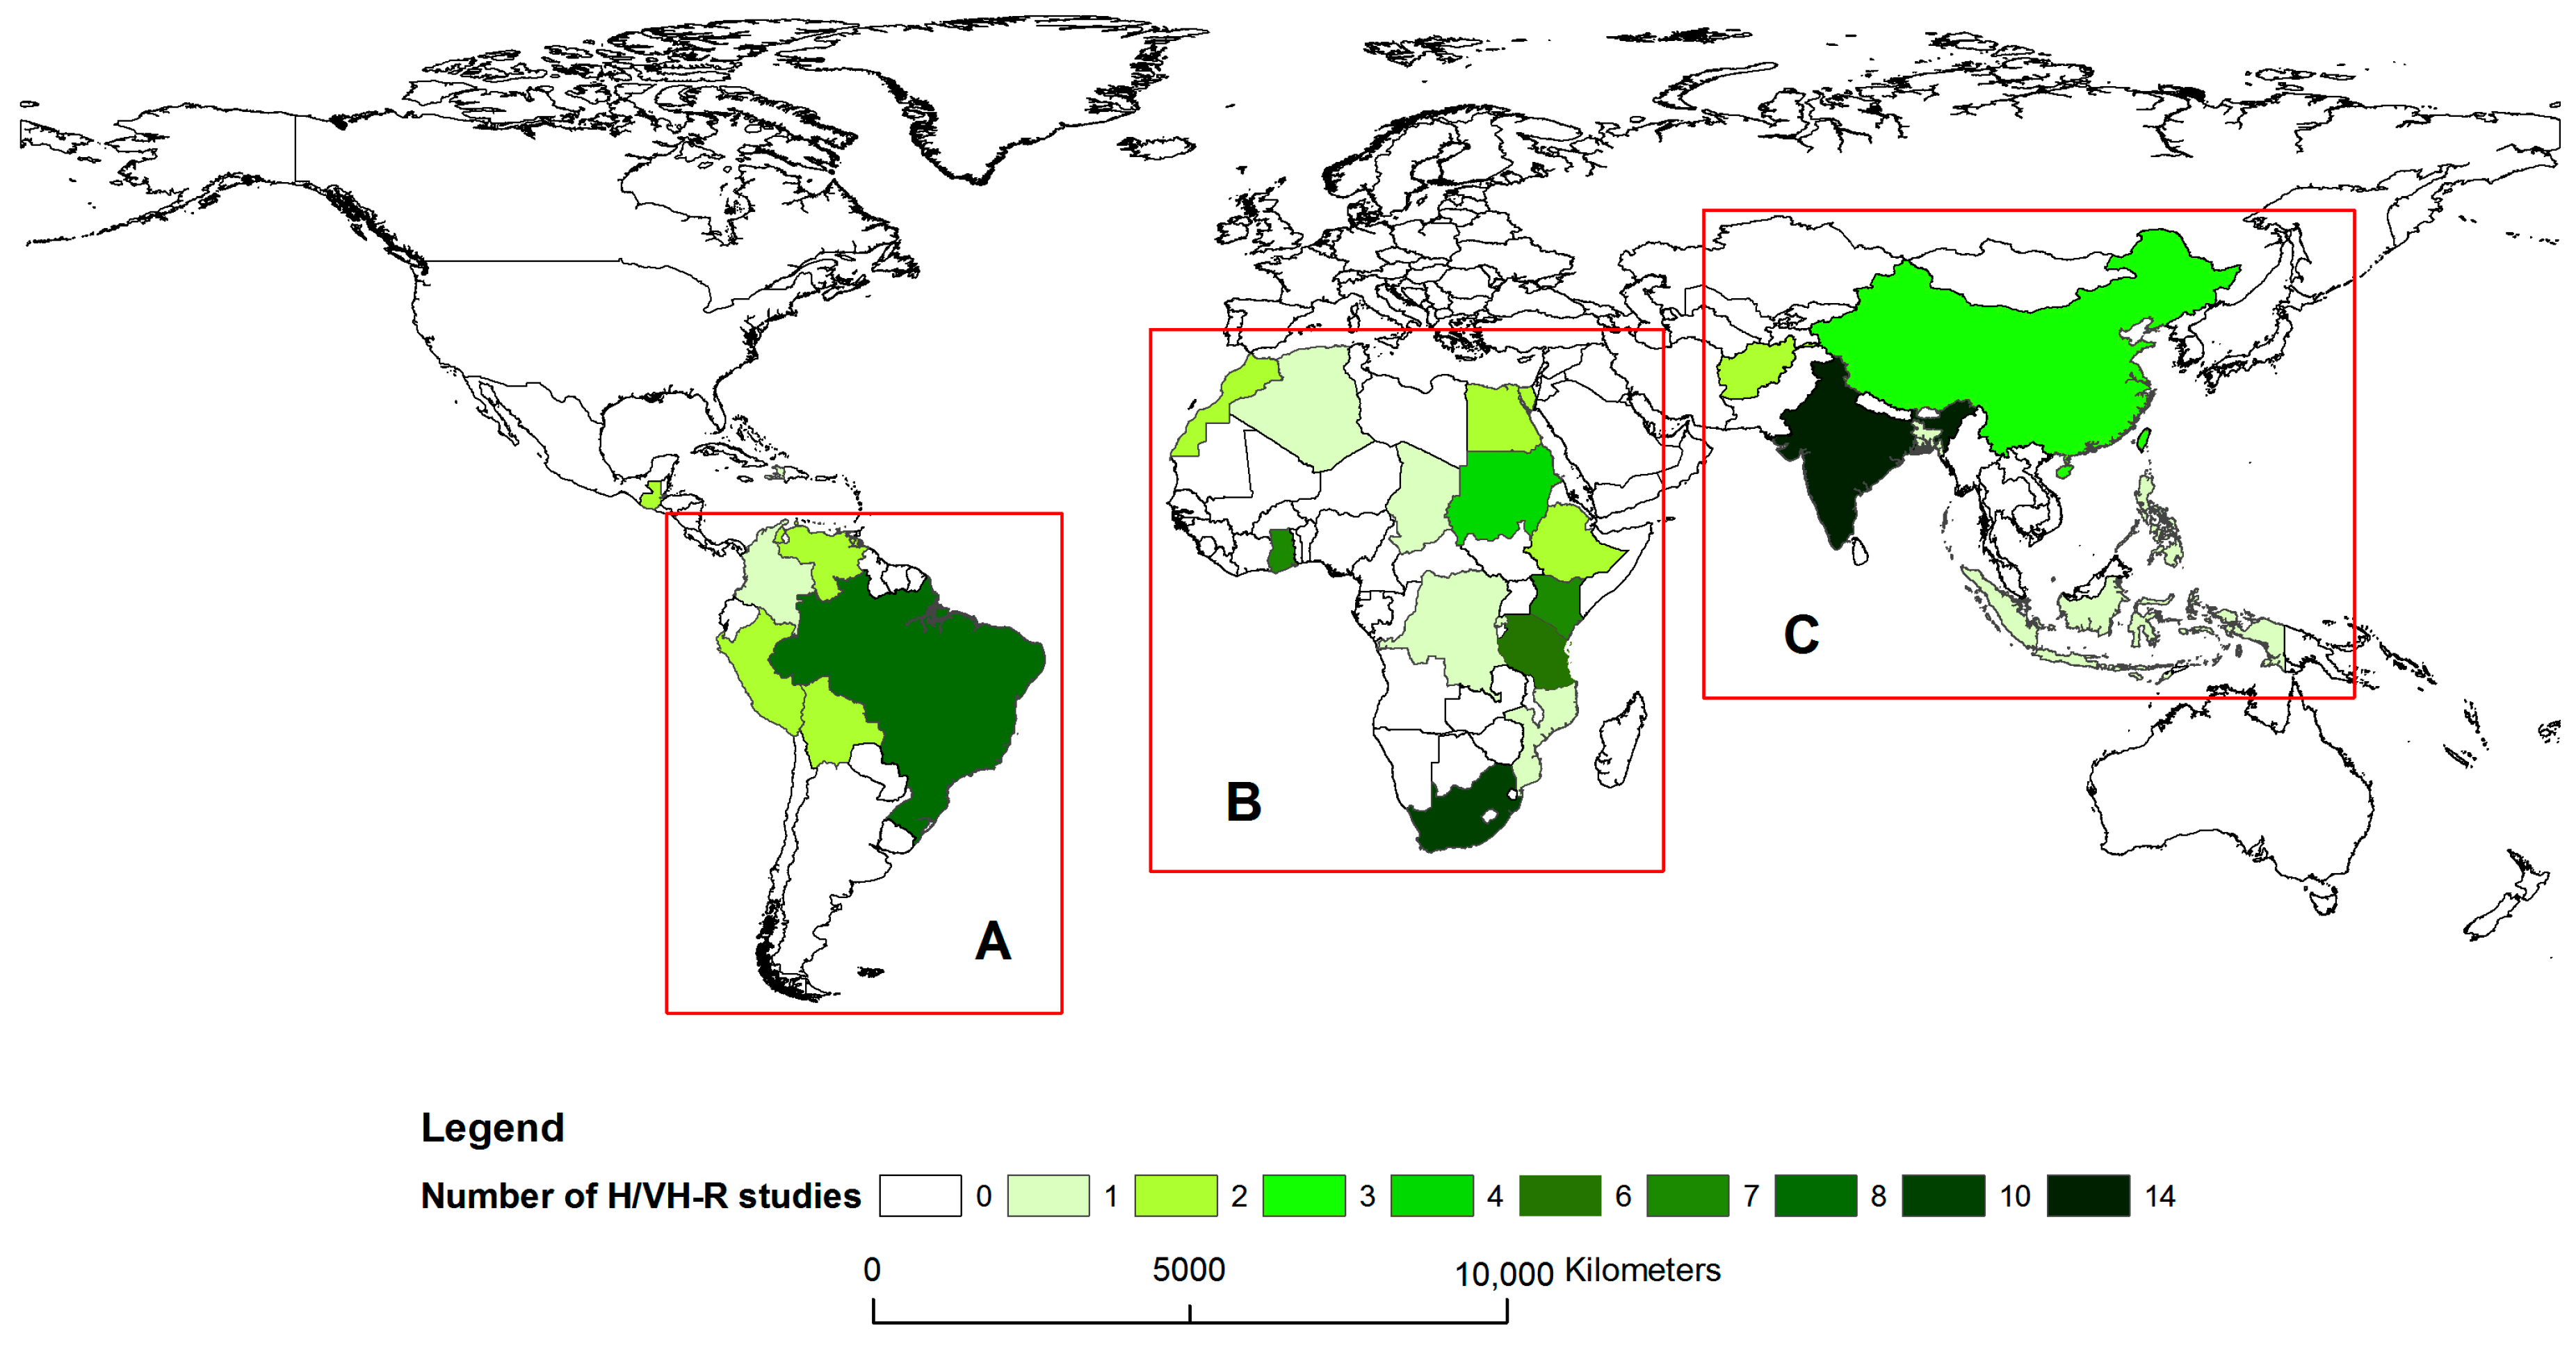
5.1. Spatial and Temporal Distribution of Slum Studies Using H/VH-R Remote Sensing Imagery

In order to understand the spatial distribution of studies using H/VH-R remote sensing imagery to study slums, we first exam such studies with respect to their chronological appearance in the published literature (books, journals and peer reviewed conferences). Figure 1 shows the results of such a survey, reviewing work from the English published literature using scholarly literature services such as Thomas Reuters Web of Science, Microsoft Academic Search and Google Scholar, and the keywords “slum”, “informal settlement” and “remote sensing”. Papers from this search were further limited to those that specifically focus on the detection and mapping of slums. This search resulted in 72 published studies between 1997 (earliest published study that could be found) and 2016. As Figure 1 shows, there has been a general linear upward increase in the number of published papers using of H/VH-R imagery (≤4 m spatial resolution). This trend appears to be in line with the increased availability of H/VH-R imagery to the general public, also shown in Figure 1, and with 79 spaceborne satellites providing H/VH-R imagery for civilian and research purposes. Linear fitting of both the number of studies and satellites shows coefficient of determinant R2 values close to 0.8 for each trend line, an angle of about 5 degrees between both lines, and a Pearson r correlation value of 0.7 (0.313 ≤ r ≤ 0.887 at 95% CI). Further, contrasting the number of published studies that explicitly use H/VH-R imagery, reveals that although H/VH-R imagery has been available for over 15 years, to date, it still remains a largely untapped source of information for slum detection and mapping.
In addition to the number of published studies, as slums are a global issue, it is also interesting to explore the spatial distribution of these studies around the world, which is shown in Figure 2. The areas labeled A, B and C in Figure 2 (South America, Africa and Asia) highlight major regions where H/VH-R imagery has been used to study slums. Within each region the countries with highest number of studies are Brazil (South America), South Africa (Africa) and India (Asia). However, this coverage of H/VH-R studies do not account for the global distribution of slums, as shown in Figure 3. For example, although slum populations in Lebanon and Pakistan account for 47% and 75% of their urban population [141] respectively, no studies using H/VH-R imagery were found for slums in these countries.
Figure 4 shows a more local geographical view of those slums studies shown in Figure 2 at the administrative level and for each country highlighted in regions A, B and C. This figure illustrates that studies tend to be focused on very few locations within countries. For example, in India, the fourteen studies using H/VH-R imagery were distributed across only six administrative districts. Similarly, for Brazil, the eight studies identified in the literature were spread across only four districts. Nonetheless, Figure 4 shows that even when a relatively large number of studies are carried out, they still tend to focus on a relatively small subset of the areas where slums exist, which may not necessarily represent all slums in that particular country. In Brazil, for example, large slum populations have also been reported in the districts of Bahia (e.g., [144,145,146]) and Minas Gerais (e.g., [147]) for which published studies using H/VH-R imagery have not been found. Similarly, in India, as shown in Figure 5, slums are not confined to any one state or administrative district, rather, they can be thought of as existing on a continuum with some locations more susceptible to the presence of slums than others as discussed in Mahabir et al. [6]. The limited study of some slum areas on the one hand, and the relatively extensive study of other slum areas on the other, may have significant implications on our ability to understand slums, their population, and their evolution within the context of their environment.
In conjunction with the tendency of current research to focus on specific slum areas, there has also been a similar trend in the application of analysis methods utilizing H/VH-R imagery to study slums. Table 2 and Table 3 compare peer reviewed published H/VH-R studies in both India and Brazil based on the approaches that was used for analyzing the imagery data according to the categorization presented in Section 4. In the case of India, the most frequently used approaches were: (A) multi-scale analysis; (B) image texture analysis; (C) landscape analysis, and (D) object-based image analysis; while (F) data mining and (G) socio-economic assessment were less prominent. For Brazil (A) and (D) are the primary methods of analysis, with only small representation of others. It should be noted that in both countries the building feature extraction (E) approach was not applied in the published studies reviewed here. These findings provide both a challenge and an opportunity for the future study of slums using H/VH-R imagery. In particular, the more selective use of analysis approaches raises the concern of potential biases in our understanding of slums (as derived from these studies) due to the tendency to view them only through a rather limited set of analysis lenses, and the potential biases that may exist in each analysis approach (as discussed in Section 4). At the same time, the underutilization of other analysis approaches provides several potential research avenues for the study of slums using H/VH-R imagery. Specifically, it would be of interest to (1) explore the analysis methods that have not been extensively used in order to better evaluate their performance in various areas; (2) develop an understanding why specific approaches have been previously preferred while others have been left unexplored, which may lead towards a set of “best practices” for studying slums using H/VH-R imagery; and (3) explore the utility of a combined approach that builds on several complementary analysis approaches for improving the overall performance of the analysis. As can be seen from Table 2 and Table 3, the utilization of more than one analysis approach has not been very common in the studies reviewed here (6 studies out of 21 studies). In light of what we have discussed above, it would also be interesting to compare and contrast the different remote sensing techniques applied to the same slum.

5.2. Limitations of Remote Sensing in Slum Detection and Mapping

Remote sensing systems capture information along four main dimensions (spatial, spectral, temporal and radiometric). Ideally, an optimal sensor would be a sensor that has high resolution in all dimensions. This, however, is not possible due to the various limitations of the sensors and their platforms, leading to a solution that represents a compromise between these different dimensions. For example, while thermal remote sensing could be beneficial for studying urban areas (e.g., the use of band 6 in Landsat 5 [158]), the spatial resolution of such bands is often lower (e.g., 120 m for the thermal band vs. 30 m for the other bands in Lansdat 5). Specifically, with respect to slums, this lower resolution imagery is unable to adequately capture information on individual slum dwellings. Similar tradeoffs in resolutions also exist when analyzing such data due to factors such as the immense sizes of the datasets involved, the time taken to download them, and the difficulties involved with data storage [159]. These tradeoffs can affect both the spatial and classification accuracy of slum mapping applications.
Another limitation of remotely sensed data is that it only captures the characteristics of slums that affect the radiometric properties of such environments [160,161]. While this may work well for some slum properties (e.g., detection of rooftops), other characteristics such as information on the social strata or cultural aspects of slum populations cannot be directly derived from remote sensing data. Such important dimensions of slums are therefore not always represented in many studies, which focus on the use of remotely sensed data alone for studying slums. For example, studies by Hardoy and Satterhwaite [162] in Peru and Saraiva and Marques [163] in Brazil show that some slums have clear divisions among land parcels and road patterns similar to those found in formal settlements. Viewed from remotely sensing imagery, these settlements may be mistaken for formal settlements. These potential limitations highlight the need for better fusion of remote sensing data with socio-cultural data in order to capture a more holistic representation of slums and the population that reside in them.

5.3. Data Fusion of Remote Sensing and Auxiliary Data

In order to develop a more comprehensive view of slums and avoid their representation as a one dimensional phenomena (i.e., physical characteristics), various attempts have been made to fuse remotely sensed data with other complimentary auxiliary data. Such an approach can provide a more accurate description of the phenomena [164,165]. Remote sensing in this regard can further contribute to social scientific measurements by improving on some measures (e.g., using the derived spatial extent of a settlement to improve population estimates) while at the same time validating others (e.g., examining the link between population health and green spaces in cities). This data fusion can potentially lead to a better understanding of slums, their impacts and the factors that continue to lead to their persistence on the human and physical landscapes.
Baud et al. [166], for example, combined information at the administrative district level to map poverty in India using an Index of Multiple Deprivations. Studies by Lo and Faber [167] and Afsar et al. [168] have also made attempts to fuse both remote sensing and socioeconomic data by incorporating land cover data. However, such land cover data is often only available at a coarser classification granularity than what is required for the study of slums. This can lead to loss of spatial heterogeneity in data [139], as well as loss in visibility of slums if the unit of aggregation is coarse in comparison to the size of the slums.
Furthermore, even if slums are detected in the data, there still remains the issue of knowing exactly where they are located and where the extent of their boundary lies if data is too coarsely aggregated. Statistical inference using such aggregated boundaries can further be strongly affected by issues including the Modifiable Areal Unit Problem [169], ecological fallacy [170], aggregation bias [171,172], as well as the small numbers problem [173,174]. Moreover, it has been suggested that the normative boundaries used for delineating poverty can often lead to spurious autocorrelations between poverty indicators [33,175].
Many of the challenges in fusing socio-economic and remotely sensed datasets have stemmed from the different spatial and temporal resolutions of socio-economic data on slums and corresponding remote sensing imagery. Such issues are expected to continue with the anticipated increase in the spatial and temporal resolution of imagery, and further highlight the need for higher resolution socioeconomic datasets. However, obtaining such data often presents a significant resources and logistical challenge [176]. Even in cases where such data exists, privacy and confidentiality may inhibit their availability for research [177]. There is therefore a need for developing and tapping into other complementary data sources that are commensurate with the spatial and temporal resolution of H/VH-R imagery.

5.4. Emerging Sources of Data on Slums

Web 2.0 and the increase availability of relatively inexpensive, portable location-aware devices within the last decade has provided new opportunities for collecting geographic information about slum populations. Some developing countries with large slums populations such as Kenya have mobile penetration rates of 88%, with almost 75% of the population having access to the Internet in 2015. About 99% of this internet access comes from mobile devices [178]. While internet penetration rates are generally low for most developing countries [179], several technology companies, for example, Facebook with its internet.org project [180], and Google’s Project Link [181] and Project Loon [182] are working to overcome such challenges in low penetration areas in the near to mid future.
When available, data collected from mobile phones can provide a wealth of information on slums and their residents. Wesolowski and Eagle [183], for example, examined call logs from the Kibera slum to determine movement patterns of slum dwellers. That study showed Kibera to be a very dynamic living space, with slum dwellers moving to different parts of the slum as opposed to remaining at one residential location. Furthermore, that study also identified various locations where slum dwellers worked, which the authors suggested were influential in determining where slum dwellers relocate in and around Kibera. Recent work has also shown that when combined with remote sensing data, mobile phone data can be used to help discriminate slums from non slum areas [184]. The results of these studies and others highlight the increasing value of mobile device data as an unobtrusive and valuable source of information on slum populations.
Related to the increase use in mobile technologies, in recent years, several alternative sources of spatial and sociocultural data have emerged. Perhaps the most prominent source of these is Volunteered Geographic Information (VGI [185,186]). Examples of VGI which can support slum detection and mapping include data collected from Google Map Maker [187], OpenStreetMap (OSM [188]), ArcGIS Online [189] and Wikimapia [190]. Map Kibera is a prototypical example of the use of VGI for crowdsourcing slum data. Figure 6 shows an overhead view of the Kibera slum captured from satellite imagery. Figure 7a shows a map of the Kibera area taken from both OSM and Google Maps. A comparison of both maps shows that OSM has more intrinsic road information for Kibera. Figure 7b shows a close-up view of part of Kibera, again both in OSM and Google Maps. As can be seen, OSM offers a detailed view of Kibera, including information on water points, churches and medical facilities, while Google maps shows very limited information about the area (e.g., roads and water bodies). Recent work by Mahabir et al. [191] comparing road data from an authoritative source, the Regional Center for Mapping for Resource Development (RCMRD), with non-authoritative sources of road data acquired from Google’s Map Maker and OSM further suggests, that at least for some slums in places such as Nairobi, Kenya, OSM data provides the most up-to-date road data available. Few studies, such as Kuffer et al. [192], have since explored the use of OSM data for mapping slums.
In conjunction with VGI, social media services such as Twitter and Flickr have emerged as a source of slum related geographic information [194]. While users do not explicitly contribute geospatial information through these services, user contributed content often includes ambient (crowdharvested) geospatial information (AGI [195]) from which information about slums can be curated. An example of such information is shown in Figure 8, which depicts the locations of geotagged Flickr images in the Kibera slum area. These images were obtained from a search requested to the Flickr application programming interface (API) using the keyword “slum”. As shown by Jenkins et al. [196], such information can be used to extract discernable socio-spatial patterns for different population groups.
One source of slum images which can be found on social media services such as Flickr is slum tourism. Since the mid-1990s slums has attracted travelers, mainly from other countries, who have visited slums through guided tours in some of the poorest and most disadvantaged parts of large cities around the world [197]. It is estimated that close to 40,000 tourists visit slums in Rio de Janeiro annually, whereas in Cape Town, South Africa, the number of tourists is as much as seven times this amount [198]. This trend resulted in the emergence of the slum tourism industry, which now offers online registration to such tours [199]. Figure 9 shows an example of this growing industry, where a tourist company offers guided tours through the Dharavi slum in India. It is important to note that this trend has a positive impact on slums through increased awareness of conditions in slums and the positive economic activity on the local economy [197]. With respect to this paper, we introduce slums tourism as a source of data since such companies provide the location of slums, while at the same time, tourists also contribute by posting content of visits to slums to online social media platforms, which can then be currated.
Although VGI and AGI type data provides many opportunities for mapping and better understanding slums, there are also several limitations with the use of such data. One limitation is that many of the platforms that provide such data require access to computers or mobile devices with an internet connection. While every year more users are being connected to the Internet, in most developing countries, however, a large proportion of the population still continues to lack access to broadband internet. This makes the collection of such data difficult for mapping features on a global scale [201]. There are also issues with limited access to the Internet in general in many developing countries, a problem popularly termed the digital divide [202]. This may lead to an over or underrepresentation of certain groups within the population based on their socioeconomic, cultural and age characteristics [203,204].
Another known issue with crowdsourced geospatial data is its quality. As such data is often not governed by rigorous quality assurance and control measures, the resulting data is often characterized by uneven quality, or even lower quality when compared to data collected using traditional methods [205]. Although many studies have shown that an acceptable level can be obtained from using crowdsourced geospatial data (e.g., [191,206,207]), special care must be taken to ensure that such quality is acceptable for the intended application.
Finally, research on VGI, and in particular AGI, has also identified privacy issues with the use of such data. While AGI contributors may be indifferent or even encourage the use of geospatial information in the content they generate, contributors are often concerned with maintaining their personal privacy. Such privacy concerns stem from the very nature of geographic information—as VGI and AGI data is generated by particular contributors, a distinct spatio-temporal contribution pattern may emerge. For instance, a VGI contributor who makes contributions only in the vicinity of their residence, or a Twitter user who sends geolocated tweets while commenting between home and their workplace. As many social media users do not give their explicit consent to such personal information sharing [208], unintentional personal information disclosure may occur, leading to a possible breach of personal privacy (e.g., [209]).
In line with the emergence of VGI and AGI data, recent years has also seen an increase in the use of unmanned aerial systems (UASs), also known as unmanned aerial vehicles (UAVs), remote piloted aircraft systems (RPAS) or “drones”, used for collecting spatial data a wide range of applications. Various factors have helped drive the upward growth in the success of the UAS industry, including maturity and affordability [210], and the development of a commercial UAS services industry [211]. Given these trends, UASs are emerging as a potential tool for slum mapping, particularly due their availability to be quickly deployed and provide fine spatial and temporal resolution [212]. These advantages have already been demonstrated in crisis mapping and humanitarian assistance [213]. In line with these trends, it is not just UASs themselves but the plethora of low cost sensors that can be retrofitted on them (e.g., hyperspectral and LiDAR), which can supplement and enhance more traditional aerial and spaceborne data [214,215]. Some recent work has also begun to explore the use of UASs for slum mapping (e.g., [216]), which highlight the strong potential of this new data source for slum mapping, warranting the need for further research in this area.

5.5. Geosensor Networks

An emerging trend within the last decade has been the use of geosensor networks (GSNs), a system of interconnected sensors distributed over a large geographic area, with each sensor or group of sensors collecting different sets of information about the environment [217,218]. The goal of GSNs is the integration of diverse information in order to inform a more complete understanding of the geographic phenomenon being monitored. Sensors in the network are usually small, low powered devices, that can be both static (e.g., mounted traffic cameras) or mobile (e.g., onboard UASs) and communicate wirelessly in an ad-hoc manner [219]. The application of GSNs to slums, however, is still relatively new.
Several developments within the last decade has made use of GSNs applicable for collecting and monitoring slums. One factor is the increase availability of mobile devices. This has been in part due to increase competition in this area by both large and small technology companies, and with the technology that governs these devices increasingly becoming more miniaturized and complex, offering an increasing number of services with added flexibility with each new revision. Added to this, their decreasing costs has made mobile devices almost ubiquitous in some countries. Many countries, including some countries with large slum populations (e.g., South Africa), now have more mobile devices than people [220]. Increasingly, in slums, mobile phones are being adopted not only as a way of keeping in touch socially, but also for informing critical situational awareness. For example, in the Kibera slum in Nairobi, Kenya, a mobile pilot project, M-Maji, allows slum dwellers to dial a cost free number and receive updates on water availability in Kibera, its price, and its quality. This service saves slum dwellers valuable time in locating water resources, which can be as much as several hours in some cases [221].
An innovative project similar to that of M-Maji is M-Pesa, a low cost mobile banking system, which allows Kenyan residents to transfer money [222]. M-Pesa transactions can take place between slums dwellers for the informal provision of services or between slum dwellers and other non-slum dwellers. For example, slum dwellers can make payments to the Government or private truck-borne suppliers for services such as the provision of water. Many slum dwellers utilize M-Pesa because it is easy to use, allows for flexibility in payment, and is perceived by slum dwellers as a safer way to transfer money compared to conventional options (e.g., by post). The cost of using M-Pesa has also been found to be as much as 27% to 68% lower when compared to other available options for transferring money in some instances [223]. Over 73% of Kenyan residents use M-Pesa with reported GDP contributions of more than 30% in 2011 [224]. The success of M-Pesa has led to similar project implementations in several other African countries [225], India [226] and Bangladesh [227], among others. Similar to the many analyses stemming from the use of big data sources such as the Oyster Card database in London (e.g., understanding the movement patterns of people in big cities—e.g., [228]), mobile data from projects such as M-Pesa could be used to better understand the dynamics of slums dwellers and their interactions with the environment. Such analyses are also important for overcoming the lack of research on population dynamics in less developed countries in general [229].
As previously mentioned in Section 5.4, an internet connection is usually required when taking part in VGI projects. Besides the involvement of large technology giants working to overcome this challenge, various other companies and organizations are also working to improve visibility of underrepresented mapped areas. OsmAnd [230], for example, has developed an offline application, which uses OSM for mobile navigation and the viewing of maps. Users can also use this application to upload new content to the OSM web platform when an internet connection becomes available. Similarly, the American Red Cross has developed an portable version of OSM, which can be used offline to assist staff and volunteers when deployed in the field during humanitarian missions [231]. Moreover, given the variety and lower cost alternatives to the typical desktop computer (e.g., Pi Zero and Chip miniature computers for less that USD $10), its becoming increasingly easier for low cost computing technology to be adopted in slums.
Another occurring trend in support of the implementation of GSN for slums is the increasing number of mobile and non-mobile devices alike, which are becoming increasingly smart, that is, there is underlying technology embedded allowing for the remote collection of data and communication between such devices. This is part of a larger initiative to create smart or self aware cities, which can integrate various forms of communication technologies and sensors for managing all of a city’s assets [232]. Added to this, with the Internet of Things allowing for the interconnection of devices using Web 2.0 technologies, many opportunities can arise for collecting large amounts of information on slums. For example, information on air temperature and quality, the location and price of water at different access points, along with movement patterns of slum dwellers can be collected and used to inform a more comprehensive view of slums. Given that slums are not expected to disappear anytime in the near to mid future, the collection of such information is important to better address the specific needs of slum dwellers, informing more appropriate policies, which can lead to a better quality of life for slum dwellers.

6. Discussion and Conclusions

Today almost 1 in 3 people in cities in developing countries live in slums [4]. These communities are often characterized as being socially and economically vulnerable, with most slum dwellers living in substandard housing and having a low quality of life compared to other population groups in society [2]. For some slums, their large spatial footprint and the irregular pathways that run through them is immediately discernable in overhead imagery of cities, while for smaller slums their spatial footprint may be overshadowed by other city elements. The living conditions under which most slum dwellers live are of serious concern to many governments, especially those in developing countries, which are charged with ensuring the health and well-being of their people [6]. Some well-known slums such as Kibera in Nairobi, Kenya have also attracted worldwide attention through online news and social media channels, thus putting additional pressure on governments to improve the living condition in their slums. With many developing countries often lacking the infrastructure and resources to adequately address their own slum issues, the growth and expansion of slums has escalated [6], making slums almost ubiquitous in some developing countries.
Tackling the issue of slums requires up-to-date and reliable information on their location, spatial extent and evolution over time. Data on slums was traditionally sourced from census and population housing surveys, which continue to be both costly and time consuming campaigns. The spatial and temporal relevancy of this data has also been questioned when used to map slums. Guided by these and other shortcomings, remote sensing has emerged as a feasible and cost effective means for the collection of large amounts of data on slums as discussed in Section 2. In this regard, H/VH-R remote sensing imagery is especially beneficial for mapping slums at the individual dwelling and settlement levels. Further, besides spaceborne and aerial systems, many other sources of H/VH-R imagery have emerged making such data very accessible for research and mapping of slums (e.g., UAS [216] and hot air balloons). Moreover, this data can also be used for mapping and monitoring the various growth stages of slums (as discussed in Section 3). Such information is invaluable in providing suitable intervention to slums based on their different growth stage.
While many studies have used H/VH-R imagery to map slums, the approaches used tend to be adhoc. Further, given that the characteristics of slums can vary in different geographical contexts, and even within the same slum, the role that location and local context has in slum detection and mapping needs to be further explored. Towards this goal, this paper provided an in depth geographical analysis of approaches that have used H/VH-R imagery to map slums. Further, because the characteristics of slums can also vary over time, we evaluated methods with respect to their suitability for mapping the various stages in the growth of slums. Such analysis allowed us to better identify and characterise challenges with using H/VH-R imagery to detect and map slums.
Our analysis reviewed approaches used to detect and map slums using seven categories: multi-scale (Section 4.1), image texture analysis (Section 4.2), landscape analysis (Section 4.3), object-based image analysis (Section 4.4), building feature extraction (Section 4.5), data mining (Section 4.6), and socio-economic measures (Section 4.7). The results of our analysis suggest that there is no single universal robust approach for detecting and mapping slums. As more H/VH-R sensors become available, the diversity of approaches that are used to map slums is also likely to increase (as discussed in Section 5.1).
Delving further into the geographical distribution of studies using H/VH-R imagery to study slums showed that they tended to concentrate in very few locations within specific countries. Many countries with very large slums populations were also found to have very few or no studies. As such, this may limit our understanding of slums globally and we risk overspeciallizing approaches to a specific slum context in lieu of a more hollistic analysis.
As we move forward it is important to recognize the potential benefits of newly emerging data sources for mapping slums that go beyond H/VH-R. Such data sources include the use of VGI (Section 5.4) and other social media sources (e.g., Flickr and Twitter), for detecting and mapping slums. VGI and social media sources, in the broader sense, can be considered as part of a wider GSN framework as humans act as passive and active sensors (Section 5.5). These new data sources are likely to become even more important in the future as GSNs are becoming prevalent with the evolution of smart cities around the world.
Slums are a global challenge and are likely to remain a part of the urban landscape. It is hoped that the analysis presented in this paper will help urban researchers and decision makers to better understand the tools currently available, as well as emerging opportunities for detecting and mapping slums. The results of this study highlight a critical area of further work towards improving the utilization of H/VH-R remote sensing imagery for detecting and mapping slums: the need for a benchmarking framework for evaluating slum mapping algorithms. The results of such benchmarking could then be used to create a set of best practice guidelines for selecting the most suitable methods for mapping slums in a given locality, and foster the creation of new approaches to address this challenge.

Acknowledgments

The authors would like to thank the anonymous reviewers for their valuable comments, feedback and suggestions that helped improve the manuscript.

Author Contributions

All authors contributed to the design of the methodology and the writing of the paper. R.M. collected the data and carried out the analysis. All of the authors contributed to the preparation of the manuscript and approved the final version to be published.

Conflicts of Interest

The authors declare no conflict of interest.

References

  1. Cohen, B. Urbanization in Developing Countries: Current Trends, Future Projections, and Key Challenges for Sustainability. Technol. Soc. 2006, 28, 63–80. [Google Scholar] [CrossRef]
  2. Montgomery, M.R. The Urban Transformation of the Developing World. Science 2008, 319, 761–764. [Google Scholar] [CrossRef] [PubMed]
  3. UN Habitat. Urbanization and Development: Emerging Futures. Available online: http://wcr.unhabitat.org/wp-content/uploads/2017/02/WCR-2016-Full-Report.pdf (accessed on 12 December 2016).
  4. United Nations. The Millennium Development Goals Report 2015. Available online: http://www.un.org/millenniumgoals/ (accessed on 12 December 2016).
  5. Bird, J.; Montebruno, P.; Regan, T. Life in a Slum: Understanding Living Conditions in Nairobi’s Slums across Time and Space. Oxf. Rev. Econ. Policy 2017, 33, 496–520. [Google Scholar] [CrossRef]
  6. Mahabir, R.; Crooks, A.; Croitoru, A.; Agouris, P. The Study of Slums as Social and Physical Constructs: Challenges and Emerging Research Opportunities. Reg. Stud. Reg. Sci. 2016, 3, 737–757. [Google Scholar] [CrossRef]
  7. Hacker, K.P.; Seto, K.C.; Costa, F.; Corburn, J.; Reis, M.G.; Ko, A.I.; Diuk-Wasser, M.A. Urban Slum Structure: Integrating Socioeconomic and Land Cover Data to Model Slum Evolution in Salvador, Brazil. Int. J. Health Geogr. 2013, 12, 45. [Google Scholar] [CrossRef] [PubMed]
  8. Pratomo, J.; Kuffer, M.; Martinez, J.; Kohli, D. Coupling Uncertainties with Accuracy Assessment in Object-Based Slum Detections, Case Study: Jakarta, Indonesia. Remote Sens. 2017, 9, 1164. [Google Scholar] [CrossRef]
  9. Huchzermeyer, M. Slum Upgrading in Nairobi within the Housing and Basic Services Market. A Housing Rights Concern. J. Asian Afr. Stud. 2008, 43, 19–39. [Google Scholar] [CrossRef]
  10. Hagen, E. Open Mapping from the Ground up: Learning from Map Kibera; Institute of Development Studies: Brighton, UK, 1998. [Google Scholar]
  11. United Nations. The Sustainable Development Goals Report 2017; United Nations: Nairobi, Kenya, 2017. [Google Scholar]
  12. Duque, J.C.; Patino, J.E.; Betancourt, A. Exploring the Potential of Machine Learning for Automatic Slum Identification from VHR Imagery. Remote Sens. 2017, 9, 895. [Google Scholar] [CrossRef]
  13. Moeller, M.S. Remote Sensing for the Monitoring of Urban Growth Patterns. In ISPRS Photogrammetry and Remote Sensing; Moeller, M., Wentz, E., Eds.; Arizona State University: Temple, TX, USA, 2005. [Google Scholar]
  14. Fugate, D.; Tarnavsky, E.; Stow, D. A Survey of the Evolution of Remote Sensing Imaging Systems and Urban Remote Sensing Applications. In Remote Sensing of Urban and Suburban Areas; Rashed, T., Carsten, J., Eds.; Springer: New York, NY, USA, 2010; Volume 10, pp. 119–139. ISBN 978-1-4020-4385-7. [Google Scholar]
  15. Kuffer, M.; Pfeffer, K.; Sliuzas, R. Slums from Space-15 Years of Slum Mapping Using Remote Sensing. Remote Sens. 2016, 8, 455. [Google Scholar] [CrossRef]
  16. Hurskainen, P.; Pellikka, P. Change Detection of Informal Settlements Using Multi-Temporal Aerial Photographs—The Case of Voi, Se-Kenya. In Proceedings of the African Association of Remote Sensing of the Environment, Nairobi, Kenya, 17–22 October 2004. [Google Scholar]
  17. Kit, O.; Lüdeke, M. Automated Detection of Slum Area Change in Hyderabad, India Using Multitemporal Satellite Imagery. ISPRS J. Photogramm. Remote Sens. 2013, 83, 130–137. [Google Scholar] [CrossRef]
  18. Michael, X.; Jean, N.; Burke, M.; Lobell, D.; Ermon, S. Transfer Learning from Deep Features for Remote Sensing and Poverty Mapping. In Proceedings of the Thirtieth AAAI Conference on Artificial Intelligence, Phoenix, AZ, USA, 12–17 February 2016; pp. 3929–3935. [Google Scholar]
  19. Kohli, D.; Sliuzas, R.; Kerle, N.; Stein, A. An Ontology of Slums for Image-Based Classification. Comput. Environ. Urban Syst. 2012, 36, 154–163. [Google Scholar] [CrossRef]
  20. Weeks, J.R.; Hill, A.; Ackerly, D.D.; Getis, A.; Fugate, D. Can We Spot a Neighborhood from the Air? Defining Neighborhood Structure in Accra, Ghana. GeoJournal 2007, 69, 9–22. [Google Scholar] [CrossRef] [PubMed]
  21. Stow, D.; Lopez, A.; Lippitt, C.; Hinton, S.; Weeks, J. Object-Based Classification of Residential Land Use within Accra, Ghana Based on QuickBird Satellite Data. Int. J. Remote Sens. 2007, 28, 5167–5173. [Google Scholar] [CrossRef] [PubMed]
  22. Baud, I.S.A.; Pfeffer, K.; Sridharan, N.; Nainan, N. Matching Deprivation Mapping to Urban Governance in Three Indian Mega-Cities. Habitat Int. 2009, 33, 365–377. [Google Scholar] [CrossRef]
  23. Karanja, I. An Enumeration and Mapping of Informal Settlements in Kisumu, Kenya, Implemented by Their Inhabitants. Environ. Urban 2010, 22, 217–239. [Google Scholar] [CrossRef]
  24. Hall, B.G.; Malcolm, N.W.; Piwowar, J.M. Integration of Remote Sensing and GIS to Detect Pockets of Urban Poverty: The Case of Rosario, Argentina. Trans. GIS 2001, 5, 235–253. [Google Scholar] [CrossRef]
  25. Ebert, A.; Kerle, N.; Stein, A. Urban Social Vulnerability Assessment with Physical Proxies and Spatial Metrics Derived from Air- and Spaceborne Imagery and GIS Data. Nat. Hazards 2009, 48, 275–294. [Google Scholar] [CrossRef]
  26. Williams, E.; Hara, H. Inconsistencies in Census Data: The Case of Kenya’s North Eastern Province. In Proceedings of the Annual Meeting of the Population Association of America, Chicago, USA, 27–29 April 2017. [Google Scholar]
  27. Engstrom, R.; Newjouse, D.; Haldavanekar, V.; Copenhaver, A.; Hersh, J. Evaluating the Relationship between spatial and Spectral Features derived from High Spatial Resolution Satellite Data abd Urban Poverty in Colombo, Sri Lanka. In Proceedings of the Urban Remote Sensing Event, Dubao, UAE, 6–8 March 2017. [Google Scholar]
  28. Republic of the Union of Myanmar. Department of Population (DoP). The Population and Housing Census of Myanmar, Summary of the Provisional Result. Department of Population, Republic of Burma, 2014. Available online: http://www.dop.gov.mm/moip/ (accessed on 20 February 2017).
  29. Kattan, J.; Eid, R.; Kourie, H.R.; Farhat, F.; Ghosn, M.; Ghorra, C.; Tomb, R. Mesotheliomas in Lebanon: Witnessing a Change in Epidemiology. Asian Pac. J. Cancer Prev. 2016, 17, 4175–4179. [Google Scholar]
  30. Satterthwaite, D. The Scale of Urban Change Worldwide 1950–2000 and its Underpinnings. In Human Settlement Discussion-Urban Change; International Institute for Environment and Development: London, UK, 2002; ISBN 184369560X. [Google Scholar]
  31. Martínez, J. The Use of GIS and Indicators to Monitor Intra-Urban Inequalities. A Case Study in Rosario, Argentina. Habitat Int. 2009, 33, 387–396. [Google Scholar] [CrossRef]
  32. Kotkin, J. Welcome to the Billion-Man Slum. New Geography. 2014. Available online: http://www.newgeography.com/content/004491-welcome-billion-man-slum (accessed on 14 December 2014).
  33. Duque, J.C.; Vicente, R.; Norena, M. A Stepwise Procedure to Determine a Suitable Scale for the Spatial Delimitation of Urban Slums. In Defining the Spatial Scale in Modern Regional Analysis; Esteban, F.V., Fernando, R.M., Eds.; Springer: New York, NY, USA, 2012; pp. 237–254. [Google Scholar]
  34. Baud, I.; Kuffer, M.; Pfeffer, K.; Sliuzas, R.; Karuppannan, S. Understanding Heterogeneity in Metropolitan India: The Added Value of Remote Sensing Data for Analyzing Sub-Standard Residential Areas. Int. J. Appl. Earth Obs. Geoinf. 2010, 12, 359–374. [Google Scholar] [CrossRef]
  35. Stevens, F.R.; Gaughan, A.E.; Linard, C.; Tatem, A.J. Disaggregating Census Data for Population Mapping Using Random Forests with Remotely-Sensed and Ancillary Data. PLoS ONE 2015, 10, e0107042. [Google Scholar] [CrossRef] [PubMed]
  36. Alves, M.C.; Morais, M.L.; Escuder, M.M.; Goldbaum, M.; Barros, M.B.; Cesar, C.L.; Carandina, L. Household Sampling in Slums in Surveys. Revista de Saúde Pública 2011, 45, 1099–1109. [Google Scholar] [CrossRef] [PubMed]
  37. Galeon, F.A. Estimation of Population in Informal Settlement Communities Using High Resolution Satellite Image. In Proceedings of the International Archives of the Photogrammetry, Remote Sensing and Spatial Information Sciences, Beijing, China, 3–11 July 2008; Volume XXXVII, pp. 1377–1382. [Google Scholar]
  38. Karekezi, S.; Kimani, J.; Onguru, O. Energy Access among the Urban Poor in Kenya. Energy Sustain. Dev. 2008, 12, 38–48. [Google Scholar] [CrossRef]
  39. Peszko, G.; Anjaparidze, D.; Dade, D.; Kapanadze, S.; Pedroso-Galinato, K.; Van den Berg, Y.; Yatimov, B. Monitoring What Matters: Tailoring Millennium Targets and Indicators of Environmental Sustainability to Local Conditions in ECA; World Bank: Washington, DC, USA, 2006. [Google Scholar]
  40. Henderson, J.V.; Storeygard, A.; Weil, D.N. Measuring Economic Growth from Outer Space. Am. Econ. Rev. 2012, 102, 994–1028. [Google Scholar] [CrossRef] [PubMed]
  41. Congalton, R.G. A Review of Assessing the Accuracy of Classifications of Remotely Sensed Data. Remote Sens. Environ. 1991, 37, 35–46. [Google Scholar] [CrossRef]
  42. Hoffer, R.M. Remote Sensing to Measure the Distribution and Structure of Vegetation. In The Role of Terrestrial Vegetation in the Global Carbon Cycle: Measurement by Remote Sensing; Woodwell, G.M., Ed.; John Wiley and Sons Ltd.: New York, NY, USA, 1984; ISBN 0471920624. [Google Scholar]
  43. Mason, D.C.; Corr, D.G.; Cross, A.; Hogg, D.C.; Lawrence, D.H.; Petrou, M.; Tailor, A.M. The Use of Digital Map Data in the Segmentation and Classification of Remotely-Sensed Images. Int. J. Geogr. Inf. Syst. 1988, 2, 195–215. [Google Scholar] [CrossRef]
  44. Shamsi, U.M. Remote Sensing Applications. In GIS Applications for Water, Wastewater, and Stormwater Systems; CRC Press: Boca Raton, FL, USA, 2005; pp. 48–75. ISBN 9780849320972. [Google Scholar]
  45. Dees, M.; Straub, C.; Langar, P.; Koch, B. Remote Sensing Based Concepts Utilising SPOT 5 and LIDAR for Forest Habitat Mapping and Monitoring under the EU Habitat Directive. Part of the geoland project reporting dossier. In ONP 10 Test and BenchmarkReport; Lamb, A., Hill, R., Wilson, D., Bock, M., Ivits, E., Dees, M., Eds.; European Commission: Brussels, Belgium, 2006; Volume 10, pp. 53–78. [Google Scholar]
  46. Jacobsen, K.; Buyuksalih, G.; Baz, I. Mapping from Space for Developing Countries. In Proceedings of the EARSel Joing Workshop: Remote Sensing—New Challenges of High Resolution, Bochum, Germany, 5–7 March 2008. [Google Scholar]
  47. Black, R.; Bennett, S.R.G.; Thomas, S.M.; Beddington, J.R. Climate Change: Migration as Adaptation. Nature 2011, 478, 447–449. [Google Scholar] [CrossRef] [PubMed]
  48. Patel, A.; Crooks, A.; Koizumi, N. Slumulation: An Agent-Based Modeling Approach to Slum Formations. J. Artif. Soc. Soc. Simul. 2012, 15, 2. [Google Scholar] [CrossRef]
  49. Burgess, E.W. The Growth of the City: An Introduction to a Research Project; University of Chicago Press: Chicago, IL, USA, 1925; pp. 47–62. [Google Scholar]
  50. Martin, R.; Mathema, A. Clash of Civilisations: Reflections on the Problems of Upgrading Informal Setttlements: Experiences in Ethiopia, Kenya, Swaziland and Zambia. In Informal Settlements: A Perpetual Challenge; Huchzermeyer, M., Ed.; University Cape Town Press: Cape Town, South Africa, 2006; pp. 127–145. ISBN 9781919713946. [Google Scholar]
  51. Kit, O.; Lüdeke, M.; Reckien, D. Texture-Based Identification of Urban Slums in Hyderabad, India Using Remote Sensing Data. Appl. Geogr. 2012, 32, 660–667. [Google Scholar] [CrossRef]
  52. Turner, J.F. Uncontrolled Urban Settlement: Problems and Policies. In The City in Newly Developing Countries: Readings on Urbanism and Urbanization; Breese, G.W., Ed.; Prentice Hall: Upper Saddle River, NJ, USA, 1969; pp. 507–534. [Google Scholar]
  53. Eyre, L.A. The Shantytowns of Montego Bay, Jamaica. Geogr. Rev. 1972, 62, 394–413. [Google Scholar] [CrossRef]
  54. Young, G.F.; Flacke, J. Agent-Based Model of the Growth of an Informal Settlement in Dar Es Salaam, Tanzania: An Empirically Informed Concept. Available online: https://scholarsarchive.byu.edu/iemssconference/2010/all/414/ (accessed on 23 January 2018).
  55. Augustijn-Beckers, E.; Flacke, J.; Retsios, B. Simulating Informal Settlement Growth in Dar Es Salaam, Tanzania: An Agent-Based Housing Model. Comput. Environ. Urban Syst. 2011, 35, 93–103. [Google Scholar] [CrossRef]
  56. Barros, J. Exploring Urban Dynamics in Latin American Cities Using an Agent-Based Simulation Approach. In Agent-Based Models of Geographical Systems; Heppenstall, A.J., Crooks, A.T., See, L.M., Batty, M., Eds.; Springer: New York, NY, USA, 2012; pp. 571–589. [Google Scholar]
  57. Sliuzas, R. Diversity of Global Slum Conditions—Is a Universal Spatial Definition of Slums Feasible? Presented at the Expert Group Meeting on Slum Mapping, Enschede, The Netherlands, 21–32 May 2008. [Google Scholar]
  58. Fekade, W. Deficits of formal urban land management and informal responses under rapid urban growth, an international perspective. Habitat Int. 2000, 24, 127–150. [Google Scholar] [CrossRef]
  59. Gruebner, O.; Sachs, J.; Nockert, A.; Frings, M.; Khan, M.M.; Lakes, T.; Hostert, P. Mapping the Slums of Dhaka from 2006 to 2010. Dataset Pap. Sci. 2014, 2014, 7. [Google Scholar] [CrossRef]
  60. Kuffer, M.; Pfeffer, K.; Sliuzas, R.; Baud, I. Extraction of Slum Areas from VHR Imagery Using GLCM Variance. IEEE J. Sel. Top. Appl. Earth Obs. Remote Sens. 2016, 9, 1830–1840. [Google Scholar] [CrossRef]
  61. UN Habitat. The Challenge of Slums-Global Report on Human Settlements; Earthscan: London, UK, 2003. [Google Scholar]
  62. Patel, A.; Koizumi, N.; Crooks, A. Measuring Slum Severity in Mumbai and Kolkata: A Household-Based Approach. Habitat Int. 2014, 41, 300–306. [Google Scholar] [CrossRef]
  63. Filho, M.N.B.; Sobreira, F.J.A. Accuracy of Lacunarity Algorithms in Texture Classification of High Spatial Resolution Images from Urban Areas. In Proceedings of the International Archives of the Photogrammetry, Remote Sensing and Spatial Information Sciences, Beijing, China, 3–11 July 2008; Jun, C., Jie, J., Förstne, W., Eds.; 2008; Volume XXXVII, pp. 417–422. [Google Scholar]
  64. Leao, S.; Leao, D. Targeting Housing Problems through Urban Texture Analysis. In Proceedings of the 12th International Conference on Computers in Urban Planning and Urban Management, Lake Louise, AB, Canada, 5–8 July 2011. [Google Scholar]
  65. Stasolla, M.; Gamba, P. Spatial Indexes for the Extraction of Formal and Informal Human Settlements From High-Resolution SAR Images. IEEE J. Sel. Top. Appl. Earth Obs. Remote Sens. 2008, 1, 98–106. [Google Scholar] [CrossRef]
  66. Pesaresi, M.; Ehrlich, D. A Methodology to Quantify Built-Up Structures from Optical VHR Imagery. In Global Mapping of Human Settlement: Experiences, Datasets, and Prospects; Gamba, P., Herold, M., Eds.; CRC Press: Boca Raton, FL, USA, 2009; pp. 27–58. [Google Scholar]
  67. Kuffer, M.; Barros, J.; Sliuzas, R.V. The Development of a Morphological Unplanned Settlement Index Using Very-High-Resolution (VHR) Imagery. Comput. Environ. Urban Syst. 2014, 48, 138–152. [Google Scholar] [CrossRef]
  68. Owen, K. Settlement Indicators of Wellbeing and Economic Status—Lacunarity and Vegetation. Available online: http://www.asprs.org/pecora18/proceedings/Owen.pdf (accessed on 23 January 2018).
  69. Hofmann, P. Detecting Informal Settlements from Ikonos Image Data Using Methods of Object Oriented Image Analysis: An Example from Cape Town (South Africa). In Proceedings of the Remote Sensing of Urban Areas/Regensburger Geographische Schriften, Regensburg, Germany, 12–14 September 2001; pp. 107–118. [Google Scholar]
  70. Veljanovski, T.; Kanjir, U.; Pehani, P.; Otir, K.; Kovai, P. Object-Based Image Analysis of VHR Satellite Imagery for Population Estimation in Informal Settlement Kibera-Nairobi, Kenya. In Remote Sensing-Applications; Escalante-Ramirez, B., Ed.; InTech: London, UK, 2012; pp. 407–434. ISBN 978-953-51-0651-7. [Google Scholar]
  71. Novack, T.; Kux, H.J.H. Urban Land Cover and Land Use Classification of an Informal Settlement Area Using the Open-Source Knowledge-Based System InterIMAGE. J. Spat. Sci. 2010, 55, 23–41. [Google Scholar] [CrossRef]
  72. Mason, S.O.; Baltsavias, E.P.; Bishop, I. Spatial Decision Support Systems for the Management of Informal Settlements. Comput. Environ. Urban Syst. 1997, 21, 189–208. [Google Scholar] [CrossRef]
  73. Li, J.; Chapman, M.; Ruther, H. Small Format Digital Imaging for Informal Settlement Mapping. Photogramm. Eng. Remote Sens. 2005, 71, 435–442. [Google Scholar] [CrossRef]
  74. Ruther, H.; Msrtine, H.M.; Mtalo, E.G. Application of Snakes and Dynamic Programming Optimization technique in Modeling of Buildings in Informal Settlement Areas. ISPRS J. Photogramm. Remote Sens. 2002, 56, 269–282. [Google Scholar] [CrossRef]
  75. Graesser, J.; Cheriyadat, A.; Vatsavai, R.R.; Chandola, V.; Long, J.; Bright, E. Image Based Characterization of Formal and Informal Neighborhoods in an Urban Landscape. IEEE J. Sel. Top. Appl. Earth Obs. Remote Sens. 2012, 5, 1164–1176. [Google Scholar] [CrossRef]
  76. Vatsavai, R.R. Gaussian Multiple Instance Learning Approach for Mapping the Slums of the World Using Very High Resolution Imagery. In Proceedings of the 19th ACM SIGKDD International Conference on Knowledge Discovery and Data Mining, Chicago, IL, USA, 11–14 August 2013; pp. 1419–1426. [Google Scholar] [CrossRef]
  77. Busgeeth, K.; van den Bergh, F.; Whisken, J.; Brits, A. Potential Application of Remote Sensing in Monitoring Informal Settlements in South Africa Where Complimentary Data Does Not Exist. In Proceedings of the Planning Africa, Johannesburg, South Africa, 14–16 April 2008; Volume 7, pp. 1470B–71470B. [Google Scholar]
  78. Niebergall, S.; Loew, A.; Mauser, W. Integrative Assessment of Informal Settlements Using VHR Remote Sensing Data: The Delhi Case Study. J. Sel. Top. Appl. Earth Obs. Remote Sens. 2008, 1, 193–205. [Google Scholar] [CrossRef]
  79. Avelar, S.; Zah, R.; Tavares-Corrêa, C. Linking Socioeconomic Classes and Land Cover Data in Lima, Peru: Assessment through the Application of Remote Sensing and GIS. Int. J. Appl. Earth Obs. Geoinf. 2009, 11, 27–37. [Google Scholar] [CrossRef]
  80. Tapiador, F.J.; Avelar, S.; Tavares-Correa, C.; Zah, R. Deriving Fine-Scale Socioeconomic Information of Urban Areas Using Very High-Resolution Satellite Imagery. Int. J. Remote Sens. 2011, 32, 6437–6456. [Google Scholar] [CrossRef]
  81. Filho, M.B.; Sobreira, F. Assessing Texture Pattern in Slum across Scales: An Unsupervised Approach. In Center for Advanced Spatial Analysis; University College London: London, UK, 2005. [Google Scholar]
  82. McAdams, M. Fractal Analysis and the Urban Morphology of a City in a Developing Country: A Case Study of Istanbul. Marmara Geogr. Rev. 2007, 15, 147–170. [Google Scholar]
  83. Batty, M.; Longley, P. Fractal Cities: A Geometry of Form and Function; Academic Press: San Diego, CA, USA, 1994; ISBN 978-0124555709. [Google Scholar]
  84. Galeon, F. Determining Formalities of Settlement Clusters Using Fractal Dimensions. In Proceedings of the Federation Internationale des Geometres (FIG), Marrakech, Morocco, 18–22 May 2011. [Google Scholar]
  85. Sun, W.; Xu, G.; Gong, P.; Liang, S. Fractal Analysis of Remotely Sensed Images: A Review of Methods and Applications. Int. J. Remote Sens. 2006, 27, 4963–4990. [Google Scholar] [CrossRef]
  86. Owen, K.K.; Wong, D.W. An Approach to Differentiate Informal Settlements Using Spectral, Texture, Geomorphology and Road Accessibility Metrics. Appl. Geogr. 2013, 38, 107–118. [Google Scholar] [CrossRef]
  87. Thomas, I.; Tannier, C.; Frankhauser, P. Is There a Link between Fractal Dimension and Residential Environment at a Regional Level? Eur. J. Geogr. 2008, 413, 2659–2663. [Google Scholar] [CrossRef]
  88. Su, J.; Hu, Q. Fast Residential Area Extraction Algorithm in High Resolution Remote Sensing Image Based on Texture Analysis. In Proceedings of the International Archives of the Photogrammetry, Remote Sensing and Spatial Information Sciences, Istanbul, Turkey, 12–23 July 2004. [Google Scholar]
  89. Valous, N.A.; Sun, D.; Allen, P.; Mendoza, F. The Use of Lacunarity for Visual Texture Characterization of Pre-Sliced Cooked Pork Ham Surface Intensities. Food Res. Int. 2010, 43, 387–395. [Google Scholar] [CrossRef]
  90. Materka, A.; Strzelecki, M. Texture Analysis Methods—A Review; COST B11 Report; Technical University of Lodz, Institute of Electronics: Brussels, Russia, 1998. [Google Scholar]
  91. Aptoula, E.; Lefèvre, S. Morphological Texture Description of Grayscale and Color Images. In Advances in Imaging and Electron Physics; Academic Press: Burlington, VT, USA, 2011. [Google Scholar]
  92. Ioannidis, C.; Psaltis, C.; Potsiou, C.; Ioannidis, Charalabos, Christodoulos Psaltis, and Chryssy Potsiou. Towards a Strategy for Control of Suburban Informal Buildings through Automatic Change Detection. Comput. Environ. Urban Syst. 2009, 33, 64–74. [Google Scholar] [CrossRef]
  93. Sulik, J.J.; Edwards, S. Feature Extraction for Darfur: Geospatial Applications in the Documentation of Human Rights Abuses. Int. J. Remote Sens. 2010, 31, 2521–2533. [Google Scholar] [CrossRef]
  94. Rhinane, H.; Hilali, A.; Berrada, A.; Hakdaoui, M. Detecting Slums from SPOT Data in Casablanca Morocco Using an Object Based Approach. J. Geogr. Inf. Syst. 2011, 3, 217. [Google Scholar] [CrossRef]
  95. Pesaresi, M.; Benediktsson, J.A. New Approach for the Morphological Segmentation of High-Resolution Satellite Imagery. IEEE Trans. Geosci. Remote Sens. 2001, 39, 309–320. [Google Scholar] [CrossRef]
  96. Haralick, R.M.; Shanmugam, K.; Dinstein, H. Textural Features for Image Classification. IEEE Trans. Syst. Man Cybern. 1973, 6, 610–621. [Google Scholar] [CrossRef]
  97. Kuffer, M.; Sliuzas, R.; Pfeffer, K.; Baud, I. The Utility of the Co-Occurrence Matrix to Extract Slum Areas from VHR Imagery. In Proceedings of the Joint Urban Remote Sensing Event, Lausanne, Switzerland, 30 March–1 April 2015. [Google Scholar]
  98. Lisini, G.; Gamba, P.; Dell’Acqua, F. A Novel Extension of the Anisotropic Rotation-Invariant Built-up Presence Index to SAR Data. Eur. J. Remote Sens. 2012, 45, 189–199. [Google Scholar] [CrossRef]
  99. Kleynhans, W.; Salmon, B.P.; Olivier, J.C. Detecting Settlement Expansion in South Africa Using a Hyper-Temporal SAR Change Detection Approach. Int. J. Appl. Earth Obs. Geoinf. 2015, 42, 142–149. [Google Scholar] [CrossRef]
  100. Wurm, M.; Taubenböck, H.; Weigand, M.; Schmitt, A. Slum Mapping in Polarimetric SAR Data Using Spatial Features. Remote Sens. Environ. 2017, 194, 190–204. [Google Scholar] [CrossRef]
  101. Soille, P.; Pesaresi, M. Advances in Mathematical Morphology Applied to Geoscience and Remote Sensing. IEEE Trans. Geosci. Remote Sens. 2002, 40, 2042–2055. [Google Scholar] [CrossRef]
  102. Schmitt, A.; Sieg, T.; Wurm, M.; Taubenböck, H. Investigation on the separability of slums by multi-aspect TerraSAR-X dual-co-polarized high resolution spotlight images based on the multi-scale evaluation of local distributions. Int. J. Appl. Earth Obs. Geoinf. 2018, 64, 181–198. [Google Scholar] [CrossRef]
  103. Gholoobi, M.; Kumar, L. Using Object-Based Hierarchical Classification to Extract Land Use Land Cover Classes from High-Resolution Satellite Imagery in a Complex Urban Area. J. Appl. Remote Sens. 2015, 9, 096052. [Google Scholar] [CrossRef]
  104. Wurm, M.; Weigand, M.; Schmitt, A.; Geiß, C.; Taubenböck, H. Exploitation of Textural and Morphological Image Features in Sentinel-2A Data for Slum Mapping. In Proceedings of the Urban Remote Sensing Event, Dubai, UAE, 6–8 March 2017. [Google Scholar]
  105. Amorim, L.; Filho, M.N.B.; Cruz, D. Urban Texture and Space Configuration: An Essay on Integrating Socio-Spatial Analytical Techniques. Cities 2014, 39, 58–67. [Google Scholar] [CrossRef]
  106. Ulaby, F.T.; Kouyate, F.; Brisco, B.; Williams, T.H.L. Textural Infornation in SAR Images. IEEE Trans. Geosci. Remote Sens. 1986, GE-24, 235–245. [Google Scholar] [CrossRef]
  107. Herold, M.; Scepan, J.; Clarke, K.C. The Use of Remote Sensing and Landscape Metrics to Describe Structures and Changes in Urban Land Uses. Environ. Plan. A 2002, 34, 1443–1458. [Google Scholar] [CrossRef]
  108. Mesev, V. Classification of Urban Areas: Inferring Land Use from the Interpretation of Land Cover. In Remote Sensing of Urban and Suburban Areas; Rashed, T., Jurgens, C., Eds.; Springer: New York, NY, USA, 2010; ISBN 1402043716. [Google Scholar]
  109. Liu, X.; Clarke, K.; Herold, M. Population Density and Image Texture. Photogramm. Eng. Remote Sens. 2006, 72, 187–196. [Google Scholar] [CrossRef]
  110. McGarigal, K. Landscape Pattern Metrics. Encycl. Environ. 2002, 21, 1. [Google Scholar] [CrossRef]
  111. Huang, J.; Lu, X.X.; Sellers, J.M. A Global Comparative Analysis of Urban Form: Applying Spatial Metrics and Remote Sensing. Landsc. Urban Plan. 2007, 82, 184–197. [Google Scholar] [CrossRef]
  112. Liu, X.; Herold, M. Of Patterns and Processes: Spatial Metrics and Geostatistics in Urban Analysis. In Integration of GIS and Remote Sensing; Mesev, V., Ed.; John Wiley & Sons: Chichester, UK, 2007; ISBN 9780470864111. [Google Scholar]
  113. Giada, S.; De Groeve, T.; Ehrlich, D.; Soille, P. Information Extraction from Very High Resolution Satellite Imagery over Lukole Refugee Camp, Tanzania. Int. J. Remote Sens. 2003, 24, 4251–4266. [Google Scholar] [CrossRef]
  114. Baatz, M.; Benz, U.; Dehghani, S.; Heynen, M.; Holtje, A.; Hofmann, P.; Lingenfelder, I. eCognition User Guide; Trimble: Munich, Germany, 2004. [Google Scholar]
  115. Petropoulos, G.P.; Kalaitzidis, C.; Vadrevu, K.P. Support Vector Machines and Object-Based Classification for Obtaining Land-Use/Cover Cartography from Hyperion Hyperspectral Imagery. Comput. Geosci. 2012, 41, 99–107. [Google Scholar] [CrossRef]
  116. Hay, G.J.; Blaschke, T.; Marceau, D.J.; Bouchard, A. A Comparison of Three Image-Object Methods for the Multiscale Analysis of Landscape Structure. ISPRS J. Photogramm. Remote Sens. 2003, 57, 327–345. [Google Scholar] [CrossRef]
  117. Blaschke, T.; Strobl, J. What’s Wrong with Pixels? Some Recent Developments Interfacing Remote Sensing and GIS. GIS Zeitschrift Für Geoinformationssysteme 2001, 6, 12–17. [Google Scholar]
  118. Hofmann, P.; Strobl, J.; Kux, H. Detecting informal settlements from QuickBird data in Rio de Janeiro using an object based approach. In Object-Based Image Analysis Spatial Concepts for Knowledge-Driven Remote Sensing Applications; Blaschke, T., Lang, S., Hay, G.J., Eds.; Spinger: Berlin/Heidelberg, Germany, 2008; pp. 531–553. [Google Scholar]
  119. Khelifa, D.; Mimoun, M. Object-Based Image Analysis and Data Mining for Building Ontology of Informal Urban Settlements. In Proceedings of the Image and Signal Processing for Remote Sensing, Edinburgh, UK, 24–27 September 2012; Volume XVII, pp. 853711–853724. [Google Scholar] [CrossRef]
  120. Shekhar, S. Slum Modelling by Using Ontology and Geoinformatics: Case Study of Gulbarga. Int. J. Geoinf. 2013, 9, 53–60. [Google Scholar]
  121. Su, W.; Li, J.; Chen, Y.; Liu, Z.; Zhang, J.; Low, T.M.; Suppiah, I.; Hashim, S.A.M. Textural and Local Spatial Statistics for the Object-oriented Classification of Urban Areas Using High Resolution Imagery. Int. J. Remote Sens. 2008, 29, 3105–3117. [Google Scholar] [CrossRef]
  122. Zhu, H.; Cai, L.; Liu, H.; Huang, W. Information Extraction of High Resolution Remote Sensing Images Based on the Calculation of Optimal Segmentation Parameters. PLoS ONE 2016, 11, e0158585. [Google Scholar] [CrossRef] [PubMed]
  123. Temba, P.; Nero, M.A.; Botelho, L.M.R.; Lopes, M.E.C. Building Vectorization inside a Favela Utilizing Lidar Spot Elevation. In Proceedings of the Earth Observing Systems, San Diego, CA, USA, 8 September 2015. [Google Scholar]
  124. Henderson, J.V.; Regan, T.; Venables, A.J. Building the City: Sunk Capital, Sequencing, and Institutional Frictions; SERC Discussion Papers; SERCDP0196; Spatial Economics Research Centre: London, UK, 2016. [Google Scholar]
  125. Kass, M.; Witkin, A.; Terzopoulos, D. Snakes: Active Contour Models. Int. J. Comput. Vis. 1988, 1, 321–331. [Google Scholar] [CrossRef]
  126. Agouris, P.; Stefanidis, A.; Gyftakis, S. Differential Snakes for Change Detection in Road Segments. Photogramm. Eng. Remote Sens. 2001, 67, 1391–1400. [Google Scholar]
  127. Mayunda, S.D.; Coleman, D.J.; Zhang, Y. Semi-Automatic Building Extraction in Dense Urban Settlement Areas from High-Resolution Satellite Images. Surv. Rev. 2010, 42, 50–61. [Google Scholar] [CrossRef]
  128. Theng, L.B. Automatic Building Extraction from Satellite Imagery. Eng. Lett. 2006, 13, 3–15. [Google Scholar]
  129. Wang, C.; Stefanidis, A.; Croitoru, A.; Agouris, P. Map Registration of Image Sequences Using Linear Features. Photogramm. Eng. Remote Sens. 2008, 74, 25–38. [Google Scholar] [CrossRef]
  130. Fayyad, U.; Piatetsky-Shapiro, G.; Smyth, P. From Data Mining to Knowledge Discovery in Databases. AI Mag. 1996, 17, 37–54. [Google Scholar]
  131. Du, S.; Zhang, F.; Zhang, X. Semantic Classification of Urban Buildings Combining VHR Image and GIS Data: An Improved Random Forest Approach. ISPRS J. Photogramm. Remote Sens. 2015, 105, 107–119. [Google Scholar] [CrossRef]
  132. Dahmani, R.; Fora, A.A.; Sbihi, A. Extracting Slums from High-Resolution Satellite Images. Int. J. Eng. Res. Dev. 2014, 10, 1–10. [Google Scholar]
  133. Gevaert, C.M.; Persello, C.; Sliuzas, R.; Vosselman, G. Classification of Informal Settlements through the Integration of 2D and 3D Features Extracted from UAV Data. In Proceedings of the ISPRS Annals of Photogrammetry, Remote Sensing and Spatial Information Sciences, Prague, Czech Republic, 12–19 July 2016; Volume 3, pp. 317–324. [Google Scholar]
  134. Belgiu, M.; Lampoltshammer, T.J.; Hofer, B. An Extension of an Ontology-Based Land Cover Designation Approach for Fuzzy Rules. In GI_Forum 2013. Creating the GISociety; Car, A., Jekel, T., Strobl, J., Eds.; Austrian Academy of Sciences Press: Vienna, Austria, 2013; pp. 59–70. [Google Scholar]
  135. Jean, N.; Burke, M.; Xie, M.; Davis, W.M.; Lobell, D.B.; Ermon, S. Combining Satellite Imagery and Machine Learning to Predict Poverty. Science 2016, 353, 790–794. [Google Scholar] [CrossRef] [PubMed]
  136. Uzun, B.; Cete, M. A Model for Solving Informal Settlement Issues in Developing Countries. In Proceedings of the Planning, Valuation and the Environment, Athens, Greece, 22–27 May 2004. [Google Scholar]
  137. Satori, G.; Nembrini, G.; Stauffer, F. Monitoring of Urban Growth of Informal Settlements (IS) and Population Estimation from Aerial Photography and Satellite Imaging; Occasional Paper 6; Geneva Foundation: Geneva, Switzerland, 2002. [Google Scholar]
  138. Checchi, F.; Stewart, B.T.; Palmer, J.J.; Grundy, C. Validity and Feasibility of a Satellite Imagery-Based Method for Rapid Estimation of Displaced Populations. Int. J. Health Geogr. 2013, 12, 4. [Google Scholar] [CrossRef] [PubMed]
  139. Sliuzas, R.; Kuffer, M. Analysing the Spatial Heterogeneity of Poverty Using Remote Sensing: Typology of Poverty Areas Using Selected RS Based Indicators. In Analysing the Spatial Heterogeneity of Poverty Using Remote Sensing: Typology of Poverty Areas Using Selected RS Based Indicators-Remote Sensing: New Challenges of High Resolution; Jurgens, C., Ed.; EARSeL: Bochum, Germany, 2008; pp. 158–167. [Google Scholar]
  140. Deroin, J.P.; Téreygeol, F.; Cruz, P.; Guillot, I.; Méaudre, J. Integrated Non-Invasive Remote-Sensing Techniques and Field Survey for the Geoarchaeological Study of the Sud Lípez Mining District, Bolivia. J. Geophys. Eng. 2012, 9, S40. [Google Scholar] [CrossRef]
  141. United Nations Statistics Division (UNSD). Millenium Development Goal Indicators. United Nations Statistics Division, United Nations, 2012. Available online: http://mdgs.un.org/unsd/mdg/Default.aspx (accessed on 17 June 2017).
  142. Global Urban Observatory. Urban Population Countries. Available online: http://urbandata.unhabitat.org (accessed on 26 July 2017).
  143. United Nations Database. Slum Population in Urban Areas (Thousands). Available online: http://data.un.org (accessed on 23 March 2017).
  144. Riley, L.W.; Ko, AI.; Unger, A.; Reis, M.G. Slum Health: Diseases of Neglected Populations. BMC Int. Health Hum. Rights 2007, 7, 2. [Google Scholar] [CrossRef] [PubMed]
  145. Melo, M.C.N.; Taddei, A.A.C.; Diniz-Santos, D.R.; Vieira, C.; Carneiro, N.B.; Melo, R.F.; Silva, L.R. Incidence of Diarrhea in Children Living in Urban Slums in Salvador, Brazil. Braz. J. Infect. Dis. 2008, 12, 89–93. [Google Scholar] [CrossRef] [PubMed]
  146. Reis, R.B.; Ribeiro, G.S.; Felzemburgh, R.D.; Santana, F.S.; Mohr, S.; Melendez, A.X.; Queiroz, A.; Santos, A.C.; Ravines, R.R.; Tassinari, W.S. Impact of Environment and Social Gradient on Leptospira Infection in Urban Slums. PLoS Negl. Trop. Dis. 2008, 2, e228. [Google Scholar] [CrossRef] [PubMed] [Green Version]
  147. Oliveira, C.D.L.; Diez-Roux, A.; César, C.C.; Proietti, F.A. A Case-Control Study of Microenvironmental Risk Factors for Urban Visceral Leishmaniasis in a Large City in Brazil, 1999–2000. Revista Panamericana de Salud Pública 2006, 20, 369–376. [Google Scholar] [CrossRef] [PubMed]
  148. Government of India. Census of India. Available online: http://www.censusindia.gov.in (accessed on 21 April 2017).
  149. MHUPA. Mumbai Human Development Report 2009; Oxford Universtiy Press: New Delhi, India, 2010. Available online: http://mhupa.gov.in/writereaddata/Mumbai%20HDR%20Complete.pdf (accessed on 24 August 2017).
  150. Kit, O.; Lüdeke, M.; Reckien, D. Defining the Bull’s Eye: Satellite Imagery-assisted Slum Population Assessment in Hyderabad, India. Urban Geogr. 2012, 34, 413–424. [Google Scholar] [CrossRef]
  151. Kohli, D.; Sliuzas, R.; Stein, A. Urban Slum Detection using Texture and Spatial Metrics derived from Satellite Imagery. J. Spat. Sci. 2016, 61, 405–426. [Google Scholar] [CrossRef]
  152. Yadav, S.; Rizvi, I.; Kadam, S. Comparative Study of Object Based Image Analysis on High Resolution Satellite Images for Urban Development. Int. J. Tech. Res. Appl. 2015, 31, 105–110. [Google Scholar]
  153. Shekhar, S. Detecting slums from Quick Bird data in Pune using an object oriented approach. In Proceedings of the International Archives of the Photogrammetry, Remote Sensing and Spatial Information Sciences, Melbourne, Australia, 25 August–1 September 2012. [Google Scholar]
  154. Kuffer, M.; Barros, J. Urban Morphology of Unplanned Settlements: The use of Spatial Metrics in VHR remotely sensed images. Procedia Environ. Sci. 2011, 7, 152–157. [Google Scholar] [CrossRef]
  155. Bhangale, U.; Rathod, V.; Rajgor, N.; Rami, J.; Kurte, K. Identification of Informal Settlement using Remote Sensing Images. In Proceedings of the International Conference on Advances in Information Communication Technology and Computing, Bikaner, India, 12–13 August 2016. [Google Scholar]
  156. De Melo, R.H.C.; Conci, A. How Succolarity could be used as another Fractal Measure in Image Analysis. Telecommun. Syst. 2013, 52, 1643–1655. [Google Scholar] [CrossRef]
  157. Ribeiro, B.M.G. Mapping Informal Settlements using WorldView-2 Imagery and C4. 5 Decision Tree Classifier. In Proceedings of the Joint Urban Remote Sensing Event, Lausanne, Switzerland, 30 March–1 April 2015. [Google Scholar]
  158. Rhinane, H.; Hilali, A.; Bahi, H.; Berrada, A. Contribution of Landsat TM Data for the Detection of Urban Heat Islands Areas Case of Casablanca. J. Geogr. Inf. Syst. 2012, 4, 20. [Google Scholar]
  159. Nagendra, H.; Rocchini, D. High Resolution Satellite Imagery for Tropical Biodiversity Studies: The Devil Is in the Detail. Biodivers. Conserv. 2008, 17, 3431–3442. [Google Scholar] [CrossRef]
  160. Weeks, J.R.; Larson, D.P.; Fugate, D.L. Patterns of Urban Land Use as Assessed by Satellite Imagery: An Application to Cairo, Egypt. In Population, Land Use, and Environment: Research Directions; The National Academies Press: Washington, DC, USA, 2005; pp. 265–286. [Google Scholar]
  161. Hofmann, P.; Taubenböck, H.; Werthmann, C. Monitoring and Modelling of Informal Settlements—A Review on Recent Developments and Challenges. In Proceedings of the Joint Urban Remote Sensing Event, Lausanne, Switzerland, 30 March–1 April 2015. [Google Scholar]
  162. Hardoy, J.E.; Satterhwaite, D. Squatter Citizen: Life in the Urban Third World; International Institute for Environment and Development: London, UK, 1989. [Google Scholar]
  163. Saraiva, C.; Marques, E. The Social Dynamics of the Slums of the Metropolitan Region of São Paulo. Available online: http://neci.fflch.usp.br/sites/neci.fflch.usp.br/files/8306-20330-1-SM.pdf (accessed on 27 June 2017).
  164. Rindfuss, R.R.; Stern, P.C. Linking Remote Sensing and Social Science: The Need and the Challenges. In People and Pixels: Linking Remote Sensing and Social Science; The National Academies Press: Washington, DC, USA, 1998; pp. 1–27. [Google Scholar]
  165. Wurm, M.; Taubenböck, H. Detecting Social Groups from Space—Assessment of Remote Sensing-based Mapped Morphological Slums using Income Data. Remote Sens. Lett. 2018, 9, 41–50. [Google Scholar] [CrossRef]
  166. Baud, I.; Sridharan, N.; Pfeffer, K. Mapping Urban Poverty for Local Governance in an Indian Mega-City: The Case of Delhi. Urban Stud. 2008, 45, 1385–1412. [Google Scholar] [CrossRef]
  167. Lo, C.P.; Faber, B.J. Integration of Landsat Thematic Mapper and Census Data for Quality of Life Assessment. Remote Sens. Environ. 1997, 62, 143–157. [Google Scholar] [CrossRef]
  168. Afsar, S.; Ali, S.S.; Kazmi, S.J.H. Assessment the Quality of Life in Karachi City through the Integration of Space and Spatial Technologies. J. Basic Appl. Sci. 2013, 9, 373–388. [Google Scholar] [CrossRef]
  169. Openshaw, S. The Modifiable Areal Unit Problem. Geo Books Norwich. 1984, Volume 38. Available online: https://www.uio.no/studier/emner/sv/iss/SGO9010/openshaw1983.pdf (accessed on 23 December 2016).
  170. Robinson, W.S. Ecological Correlations and the Behavior of Individuals. Am. Sociol. Assoc. 1950, 15, 351–357. [Google Scholar] [CrossRef]
  171. Paelinck, J.H.P. On Aggregation in Spatial Econometric Modelling. J. Geogr. Syst. 2000, 2, 157–165. [Google Scholar] [CrossRef]
  172. Fotheringham, A.S.; Wong, D.W.S. The Modifiable Areal Unit Problem in Multivariate Statistical Analysis. Environ. Plan. A 1991, 23, 1025–1044. [Google Scholar] [CrossRef]
  173. Kennedy, S. The Small Number Problem and the Accuracy of Spatial Databases. In the Accuracy of Spatial Databases; Goodchild, M.F., Gopal, S., Eds.; CRC Press: Bristol, PA, USA, 1989; pp. 121–127. ISBN 9780850668476. [Google Scholar]
  174. Levin, S.A. The Problem of Pattern and Scale in Ecology. Ecol. Soc. Am. 1992, 73, 1943–1967. [Google Scholar] [CrossRef]
  175. Weeks, J.R.; Hill, A.; Stow, D.; Getis, A.; Fugate, D. The Impact of Neighborhood Structure on Health Inequalities in Accra, Ghana. In Proceedings of the Annual Meeting of the Population Association of America Los Angeles, Los Angeles, CA, USA, 30 March–1 April 2006; pp. 1–34. [Google Scholar]
  176. Rindfuss, R.R.; Entwisle, B.; Walsh, S.J.; Prasartkul, P.; Sawangdee, Y.; Crawford, T.W.; Reade, J. Continuous and Discrete: Where They Have Met in Nang Rong, Thailand. In Linking People, Place, and Policy; Walsh, S.J., Crews-Meyer, K.A., Eds.; Springer: New York, NY, USA, 2002; pp. 7–37. [Google Scholar]
  177. Lesschen, J.P.; Verburg, P.H.; Staal, S.J. Statistical Methods for Analysing the Spatial Dimension of Changes in Land Use and Farming Systems; LUCC Report Series 7; International Livestock Research Institute: Nairobi, Kenya, 2005. [Google Scholar]
  178. Communications Authority of Kenya. First Quarter Sector Statistics Report for the Financial Year 2015/2016; Communications Authority of Kenya: Nairobi, Kenya, 2015. Available online: http://www.ca.go.ke/images/downloads/STATISTICS/Sector%20%20Statistics%20Report%20Q1%202015-16.pdf (accessed on 12 December 2017).
  179. Dutta, S.; Geiger, T.; Lanvin, B. The Global Information Technology Report. World Economic Forum. 2015. Available online: http://www3.weforum.org/docs/WEF_Global_IT_Report_2015.pdf (accessed on 21 January 2017).
  180. Connecting the World. Facebook. Available online: https://info.internet.org/en/ (accessed on 23 April 2017).
  181. CSquared. Google. Available online: https://www.google.com/get/projectlink/ (accessed on 23 April 2017).
  182. Balloon-Powered Internet For Everyone. Google. Project Loon. Available online: https://x.company/loon/ (accessed on 24 May 2017).
  183. Wesolowski, A.; Eagle, N. Parameterizing the Dynamics of Slums. In Proceedings of the AAAI Spring Symposium: Artificial Intelligence for Development, Palo Alto, CA, USA, 22–24 March 2010. [Google Scholar]
  184. Steele, J.E.; Sundsøy, P.R.; Pezzulo, C.; Alegana, V.A.; Bird, T.J.; Blumenstock, J.; Bjelland, J.; Engø-Monsen, K.; de Montjoye, Y.; Iqbal, A.M.; et al. Mapping poverty using mobile phone and satellite data. J. R. Soc. Interface 2017, 14, 20160690. [Google Scholar] [CrossRef] [PubMed]
  185. Goodchild, M.F. Citizens as Sensors: The World of Volunteered Geography. GeoJournal 2007, 69, 211–221. [Google Scholar] [CrossRef]
  186. Mullen, W.F.; Jackson, S.P.; Croitoru, A.; Crooks, A.; Stefanidis, A.; Agouris, P. Assessing the impact of demographic characteristics on spatial error in volunteered geographic information features. GeoJournal 2015, 80, 587–605. [Google Scholar] [CrossRef]
  187. Google. Google Map Maker. Available online: https://services.google.com/fb/forms/mapmakerdatadownload (accessed on 21 October 2017).
  188. OpenStreetMap. Available online: http://www.openstreetmap.org (accessed on 1 December 2017).
  189. ArcGIS Online. Environmental Systems Research Institute (ESRI). Available online: http://www.arcgis.com/ (accessed on 21 July 2017).
  190. Wikimapia. Available online: http://wikimapia.org (accessed on 2 January 2017).
  191. Mahabir, R.; Stefanidis, A.; Croitoru, A.; Crooks, A.T.; Agouris, P. Authoritative and Volunteered Geographical Information in a Developing Country: A Comparative Case Study of Road Datasets in Nairobi, Kenya. ISPRS Int. J. GeoInf. 2017, 6, 24. [Google Scholar] [CrossRef]
  192. Kuffer, M.; Pfeffer, K.; Sliuzas, R.; Baud, I.; van Maarseveen, M. Capturing the Diversity of Deprived Areas with Image-Based Features: The Case of Mumbai. Remote Sens. 2017, 9, 384. [Google Scholar] [CrossRef]
  193. Geofabrik. Map Compare. 2016. Available online: http://tools.geofabrik.de/mc (accessed on 25 August 2016).
  194. Croitoru, A.; Crooks, A.T.; Radzikowski, J.; Stefanidis, A.; Vatsavai, R.R.; Wayant, N. Geoinformatics and Social Media: A New Big Data Challenge. In Big Data Techniques and Technologies in Geoinformatics; Karimi, H., Ed.; CRC Press: Boca Raton, FL, USA, 2014; pp. 207–232. [Google Scholar]
  195. Stefanidis, A.; Crooks, A.; Radzikowski, J. Harvesting Ambient Geospatial Information from Social Media Feeds. GeoJournal 2013, 78, 319–338. [Google Scholar] [CrossRef]
  196. Jenkins, A.; Croitoru, A.; Crooks, A.T.; Stefanidis, A. Crowdsourcing a Collective Sense of Place. PLoS ONE 2016, 11, e0152932. [Google Scholar] [CrossRef] [PubMed]
  197. Frenzel, F.; Koens, K.; Steinbrink, M.; Rogerson, C.M. Slum Tourism: State of the Art. Tour. Rev. Int. 2015, 18, 237–252. [Google Scholar] [CrossRef]
  198. Rolfes, M. Poverty Tourism: Theoretical Reflections and Empirical Findings Regarding an Extraordinary Form of Tourism. GeoJournal 2010, 75, 421–442. [Google Scholar] [CrossRef]
  199. Privitera, D. Tourist Valorisation of Urban Poverty: An Empirical Study on the Web. Urban Forum 2015, 26, 373–390. [Google Scholar] [CrossRef]
  200. Reality Tours and Travel. Available online: http://realitytoursandtravel.com (accessed on 23 March 2017).
  201. Heipke, C. Crowdsourcing Geospatial Data. ISPRS J. Photogramm. Remote Sens. 2010, 65, 550–557. [Google Scholar] [CrossRef]
  202. Ali, A.H. Power of Social Media in Developing Nations: New Tools for Closing the Global Digital Divide and Beyond. Harv. Hum. Rts. J. 2011, 24, 185. [Google Scholar]
  203. Norris, P. Digital Divide: Civic Engagement, Information Poverty, and the Internet Worldwide; Cambridge University Press: Oxford, UK, 2001; ISBN 978-0521002233. [Google Scholar]
  204. Warschauer, M. Technology and Social Inclusion: Rethinking the Digital Divide; MIT Press: Boston, MA, USA, 2004; ISBN 9780262232241. [Google Scholar]
  205. Iren, D.; Bilgen, S. Cost of Quality in Crowdsourcing. Hum. Comput. 2014, 1, 283–314. [Google Scholar] [CrossRef]
  206. Haklay, M. How Good Is Volunteered Geographical Information? A Comparative Study of OpenStreetMap and Ordnance Survey Datasets. Environ. Plan. B 2010, 37, 682–703. [Google Scholar] [CrossRef]
  207. Jackson, S.P.; Mullen, W.; Agouris, P.; Crooks, A.; Croitoru, A.; Stefanidis, A. Assessing Completeness and Spatial Error of Features in Volunteered Geographic Information. ISPRS Int. J. GeoInf. 2013, 2, 507–530. [Google Scholar] [CrossRef]
  208. Stefanidis, A.; Nittel, S. GeoSensor Networks; CRC Press: Boca Raton, FL, USA, 2004. [Google Scholar]
  209. Riederer, C.; Kim, Y.; Chaintreau, A.; Korula, N.; Lattanzi, S. Linking Users Across Domains with Location Data: Theory and Validation. In Proceedings of the 25th International Conference on World Wide Web, Montréal, QC, Canada, 11–15 April 2016; pp. 707–719. [Google Scholar]
  210. Stehr, N.J. Drones: The newest technology for precision agriculture. Nat. Sci. Educ. 2015, 44, 89–91. [Google Scholar] [CrossRef]
  211. The Economist. Commercial Drones Are the Fastest-Growing Part of the Market. 2018. Available online: https://www.economist.com/news/technology-quarterly/21723003-most-drones-today-are-either-cheap-toys-or-expensive-weapons-interesting (accessed on 14 January 2018).
  212. Sliuzas, R.; Kuffer, M.; Gevaert, C.; Persello, C.; Pfeffer, K. Slum mapping. In Proceedings of the Urban Remote Sensing Event, Dubai, UAE, 6–8 March 2017. [Google Scholar]
  213. Meier, P. Digital Humanitarians: How Big Data Is Changing the Face of Humanitarian Response; CRC Press: Boca Raton, FL, USA, 2015. [Google Scholar]
  214. Hruska, R.; Mitchell, J.; Anderson, M.; Glenn, N.F. Radiometric and Geometric Analysis of Hyperspectral Imagery acquired from an Unmanned Aerial Vehicle. Remote Sens. 2012, 4, 2736–2752. [Google Scholar] [CrossRef]
  215. Lin, Y.; Hyyppa, J.; Jaakkola, A. Mini-UAV-borne LIDAR for fine-scale mapping. IEEE Geosci. Remote Sens. Lett. 2011, 8, 426–430. [Google Scholar] [CrossRef]
  216. Gevaert, C.M.; Persello, C.; Sliuzas, R.; Vosselman, G. Informal settlement classification using point-cloud and image-based features from UAV data. ISPRS J. Photogramm. Remote Sens. 2017, 125, 225–236. [Google Scholar] [CrossRef]
  217. Ahmed, S.; Simiyu, E.; Githiri, G.; Sverdlik, A.; Mbaka, S. Cooking up a Storm: Community-Led Mapping and Advocacy with Food Vendors in Nairobi’s Informal Settlements; International Institute for Environment and Development: London, UK, 2015. [Google Scholar]
  218. Walter, K.F.N.; Bill, R. Geosensor Web Enablement in Early Warning Systems for Landslides. Available online: http://bono.hostireland.com/~eurosdr/km_pub/no54/workshops_docs/Geosensor_WS/walter_niemeyer.pdf (accessed on 14 August 2017).
  219. Nittel, S.; Labrinidis, A.; Stefanidis, A. Introduction to Advances in Geosensor Networks. In GeoSensor Networks; Lecture Notes in Computer Science; Nittel, S., Labrinidis, A., Stefanidis, A., Eds.; Springer: Berlin/Heidelberg, Germany, 2008; Volume 4540. [Google Scholar] [CrossRef]
  220. Kearney, A.T. African Mobile Observatory: Driving Economic and Social Development through Mobile Services; Groupe Spéciale Mobile Association: London, UK, 2011. [Google Scholar]
  221. Jeon, S. M-Maji. Available online: https://mmaji.wordpress.com (accessed on 25 February 2017).
  222. Safaricom. M-PESA. Available online: http://www.safaricom.co.ke/personal/m-pesa (accessed on 25 February 2017).
  223. Morawczynski, O.; Pickens, M. Poor People Using Mobile Financial Services: Observations on Customer Usage and Impact from M-PESA. Available online: https://www.cgap.org/sites/default/files/CGAP-Brief-Poor-People-Using-Mobile-Financial-Services-Observations-on-Customer-Usage-and-Impact-from-M-PESA-Aug-2009.pdf (accessed on 25 May 2017).
  224. Demombynes, G.; Thegeya, A. Kenya’s Mobile Revolution and the Promise of Mobile Savings; World Bank Policy Research Working Paper, No. 5988; World Bank: Washington, DC, USA, 2012. [Google Scholar]
  225. Kariuki, J. Safaricom Partners with MTN to Spread M-Pesa Services to 19 African Countries. 2015. Available online: http://www.nation.co.ke/business/eMoney/Safaricom-MTN-partnership-Africa/-/1625712/2694198/-/pps4q6z/-/index.html (accessed on 23 January 2017).
  226. Vodafone. M-Pesa. Available online: https://www.mpesa.in (accessed on 23 January 2017).
  227. Brac Bank. bKash. Available online: http://www.bkash.com (accessed on 23 January 2017).
  228. Roth, C.; Kang, S.M.; Batty, M.; Barthélemy, M. Structure of Urban Movements: Polycentric Activity and Entangled Hierarchical Flows. PLoS ONE 2011, 6, e15923. [Google Scholar] [CrossRef] [PubMed]
  229. Wesolowski, A.; Eagle, N.; Noor, A.M.; Snow, R.W.; Buckee, C.O. Heterogeneous Mobile Phone Ownership and Usage Patterns in Kenya. PLoS ONE 2012, 7, e35319. [Google Scholar] [CrossRef] [PubMed] [Green Version]
  230. OsmAnd. Offline Mobile Maps and Navigation. Available online: http://osmand.net (accessed on 13 August 2017).
  231. American Red Cross. Portable OpenStreetMap. Available online: https://github.com/AmericanRedCross/posm (accessed on 13 August 2017).
  232. Chourabi, H.; Nam, T.; Walker, S.; Gil-Garcia, J.R.; Mellouli, S.; Nahon, K.; Pardo, T.A.; Scholl, H.J. Understanding Smart Cities: An Integrative Framework. In Proceedings of the International Conference on System Science, Maui, HI, USA, 4–7 January 2012; pp. 2289–2297. [Google Scholar]
Figure 1. Research using H/VH-R imagery to study slums, 1997–2016 (Data on number of satellite updated after [15,140]).
Urbansci 02 00008 g001
Figure 2. Country level distribution of H/VH-R studies (studies published between 1997–2016).
Urbansci 02 00008 g002
Figure 3. Global distribution of urban and slum populations (Data—Urban Population estimates 2014 [142] and Slum population estimates 2015 [143]).
Urbansci 02 00008 g003
Figure 4. Administrative level distribution of H/VH-R studies.
Urbansci 02 00008 g004
Figure 5. Geographic distribution of slums population in India (a) and Mumbai (b) (Data—India districts [148] and Mumbai wards [149]).
Urbansci 02 00008 g005
Figure 6. Map showing the location of (A) Kenya relative to Africa; (B) Nairobi relative to Kenya; (C) the Kibera slum relative to Nairobi and (D) the Kibera slum (background imagery source: ESRI [189]).
Urbansci 02 00008 g006
Figure 7. OSM and Google Maps views of Kibera slum [193] Top images (overview of Kibera): (a) left OSM and (b) right Google Maps; Bottom images (zoomed in view of Kibera): (c) left OSM and (d) right Google Maps.
Urbansci 02 00008 g007
Figure 8. Geotagged Flickr images with word “slum” in their description (background imagery source: ESRI [189]). Images A, B and C represent different views of Kibera embedded within the Flickr data.
Urbansci 02 00008 g008
Figure 9. Reality Tours and Travel slum tours webpage [200].
Urbansci 02 00008 g009
Table 1. Remote sensing approaches using H/VH-R imagery for identifying and mapping slums.
ApproachProperties
Multi-scale (Section 4.1)Description
Discriminate objects based on properties at different scales.
Commonly exploited remote sensing attributes
Spatial, contextual and multi-scale.
Extraction approach
Detection and characterization.
Sample studies
  • Kit et al. [17]
  • Filho and Sobreira [63]
  • Leao and Leao [64]
Advantages
  • Properties of objects at different scales aid in better discrimination.
  • Provide information on intra and inter diversity.
  • Can provide valuable information to study the structural changes of a feature over time.
Limitations
  • Research mainly assume a mono-fractal model for slums.
  • Some features in the built environment may not exhibit properties of self-similarity with varying spatial scales.
  • Most research using fractal geometry has focused on large cities where differences between slums and non-slums is more noticeable compared to smaller cities, towns and villages.
  • Depending on the measure used to calculate the fractal value, values can differ significantly.
  • Lacunarity has the potential to misplace or misidentify slums covering areas smaller than the gird sizes used to collect information.
  • Very few measures have been evaluated besides lacunarity.
  • Lacunarity values from one slum may be non-transferable to another slum due to specific qualities of the imagery being used such as its spatial and radiometric resolution.
  • Research on lacunarity mainly focus on the use binarized imagery, which leads to the loss of valuable image properties of slums compared to the use of grayscale or color imagery.
Image texture analysis (Section 4.2)Description
Extract features in an image based on its shape, size and tonal variation within the image. Image texture analysis have widely been used as part of OBIA extraction strategies.
Commonly exploited remote sensing attributes
Spatial, spectral, contextual and multi-scale.
Extraction approach
Detection and characterization.
Sample studies
  • Kuffer et al. [60]
  • Stasolla and Gamba [65]
  • Pesaresi and Ehrlich [66]
Advantages
  • Uses contextual information inherent with objects in real life to better separate slums from their surroundings.
  • Many texture measures as available.
Limitations
  • The small size of slum dwelling may be detected as spurious pixels and removed during MM processing.
  • If dwellings are very close, dilation type operations may merge dwelling together.
  • MM uses scene specific rules, which may not be transferrable to other image scenes.
  • Few studies have applied MM to color imagery to study slums.
  • MM measures such as DMP often lack completeness, even when auxiliary data is used.
  • The unique properties of individual slums and the imagery used makes it difficult to transfer textures at specific windows sizes and at a particular shape found significant for one slum to another slum.
  • Many GLCM texture measures are correlated.
Landscape analysis (Section 4.3)Description
Use spatial metrics developed in the field of landscape ecology to quantitatively analyze the spatial patterns of land cover. These metrics describe spatial composition and configuration.
Commonly exploited remote sensing attributes
Spatial and spectral.
Extraction approach
Detection and characterization.
Sample studies
  • Baud et al. [34]
  • Kuffer et al. [67]
  • Owen [68]
Advantages
Wide variety of metrics available.Generally easy to interpret.
Limitations
  • Landscape metrics are completely dependent on an initial spectral characterization of the remotely sensed imagery.
  • Values can change with scale, spatial resolution and model of land cover land use used.
  • Many metrics are correlated with each other.
  • Process of trial and error in the choice of the most suitable metric for use.
  • Image must first be classified.
Object-based image analysis (Section 4.4)Description
Treats images as a composition of objects.
Commonly exploited remote sensing attributes
Spatial, spectral, contextual and multi-scale.
Extraction approach
Detection and characterization.
Sample studies
  • Hofmann [69]
  • Veljanovski et al. [70]
  • Novack and Kux [71]
Advantages
  • Better reflect features in reality
  • Over 30 years of OBIA research available
Limitations
  • Segmentation parameters often chosen subjectively.
  • Many segmentation parameters are interconnected.
  • Clustered buildings lead to merging during object extraction.
  • Building materials used in slums may be similar to other surface features such as unpaved roads and reduce extraction performance.
  • Shape of slum dwellings is not necessarily maintained across multiple scales due to the small sizes of slum dwellings.
  • Shape of building often not preserved at multiple scales due to small size of slum dwellings.
  • OBIA rules are image specific.
Building feature extraction (Section 4.5)Description
Use computer generated algorithms and tools to help humans with extracting knowledge from large volumes of data.
Commonly exploited remote sensing attributes
Spatial, spectral and contextual.
Extraction approach
Detection, delineation and characterization.
Sample studies
  • Mason et al. [72]
  • Li et al. [73]
  • Ruther et al. [74]
Advantages
  • Objects not within the threshold range of slum heights being studied can be filter out.
  • Can be used to develop 3D models of slums.
Limitations
  • Artifacts such as vegetation can occlude parts of slums and lead to incorrect results.
  • Typical building cues commonly used in building extraction (e.g., parallelism and rectangularity) are less reliable in some slums.
  • Some algorithms for extracting the rooftops of buildings encounter issues when opposite sides of roofs are at different heights such as on a house on a slope.
  • Active contour methods for extracting building outlines require initialization.
  • Active contour methods have problems with distinguishing objects of the same height.
  • Challenging to select the appropriate weights used for determining the shape of active contours.
  • Only small areas within slums have been tested with no extrapolation to larger geographic areas.
Data mining (Section 4.6)Description
Use elevation data to extract individual slum dwellings.
Commonly exploited remote sensing attributes
Spatial, spectral and contextual.
Extraction approach
Detection and characterization.
Sample studies
  • Graesser et al. [75]
  • Vatsavai. [76]
  • Busgeeth et al. [77]
Advantages
  • Can analyze large amounts of data.
  • Many algorithms exist.
  • Methods can be more easily automated compared to other methods discussed.
  • Available in many different open source software and programming packages.
Limitations
  • Typically, requires large amounts of data for training, which are not always available for slums.
  • Empirically specific for the data algorithms they are trained on.
  • Require significant computing resources.
Socio-economic measures (Section 4.7)Description
Estimate socio-economic information from remotely sensing imagery or link them with census or similar data.
Commonly exploited remote sensing attributes
Spatial and spectral.
Extraction approach
Detection and characterization.
Sample studies
  • Niebergall et al. [78]
  • Avelar et al. [79]
  • Tapiador et al. [80]
Advantages
  • Identifies the relationship between physical and social dimensions.
  • Can be used to understand different population strata.
Limitations
  • Rigid assumptions must be made with respect to what makes up a specific social class.
  • Often difficult to combine socio-economic and remote sensing data because of differences in spatial and temporal resolutions.
  • Many studies have focused on small geographic locations, the results of which may be difficult to apply to larger areas.
  • Many metrics are correlated.
Table 2. Studies of slums in India using H/VH-R imagery, classified by analysis approach. (A) Multi-scale analysis; (B) Image texture analysis; (C) Landscape analysis; (D) Object-based image analysis; (E) Building feature extraction; (F) Data mining and (G) Remote sensing data for supporting socio-economic assessment.
StudiesApproachAdministrative DistrictLocal Area
ABCD* E* FG
Kit et al. [51]X Andhra PradeshHyderabad
Kit et al. [150]X Andhra PradeshHyderabad
Kit and Ludeke [17]X Andhra PradeshHyderabad
Niebergall et al. [78] X XDelhiDelhi
Kohli et al. [19] X X GujaratAhmedabad
Kohli et al. [151] X X MaharashtraPune
Yadav et al. [152] X MaharashtraMumbai
Shekhar [153] MaharashtraPune
Baud et al. [34] X XDelhiDelhi
Kuffer et al. [67] X DelhiDelhi
Kuffer and Barros [154] X DelhiDelhi
Kuffer et al. [60] X X MaharashtraMumbai
Bhangale et al. [155] X MaharashtraMumbai
Total3334022
* No studies using this approach occurred in India.
Table 3. Studies of slums in Brazil using H/VH-R resolution, classified by analysis approach. (A) Multi-scale analysis; (B) Image texture analysis; (C) Landscape analysis; (D) Object-based image analysis; (E) Building feature extraction; (F) Data mining and (G) Remote sensing data for supporting socio-economic assessment.
StudiesApproachesAdministrative DistrictLocal Area
A* B* CD* EFG
Filho and Sobreira [63]X PernambucoRacife
Filho and Sobreira [81]X Sao PauloCampinas
Amorim et al. [105]X PernambucoRacife
De Melo and Conci [156]X Rio de JanieroRio de Janiero
De Melo and Conci [156]X Sao PauloCampinas
Hofmann [118] X Rio de JaneiroRio de Janeiro
Leao and Leao [64]X XRio Grande do SulCanela
Novack and Kux [71] X Sao PauloSao Paulo
Ribeiro [157] X Sao PauloEmbu
Total6002011
* No studies using this approach occurred in Brazil.

