
Biological Effects of Air Pollution on Sensitive Bioindicators: A Case Study from Milan, Italy

 , ,
, ,
Abstract
:1. Introduction
2. Materials and Methods
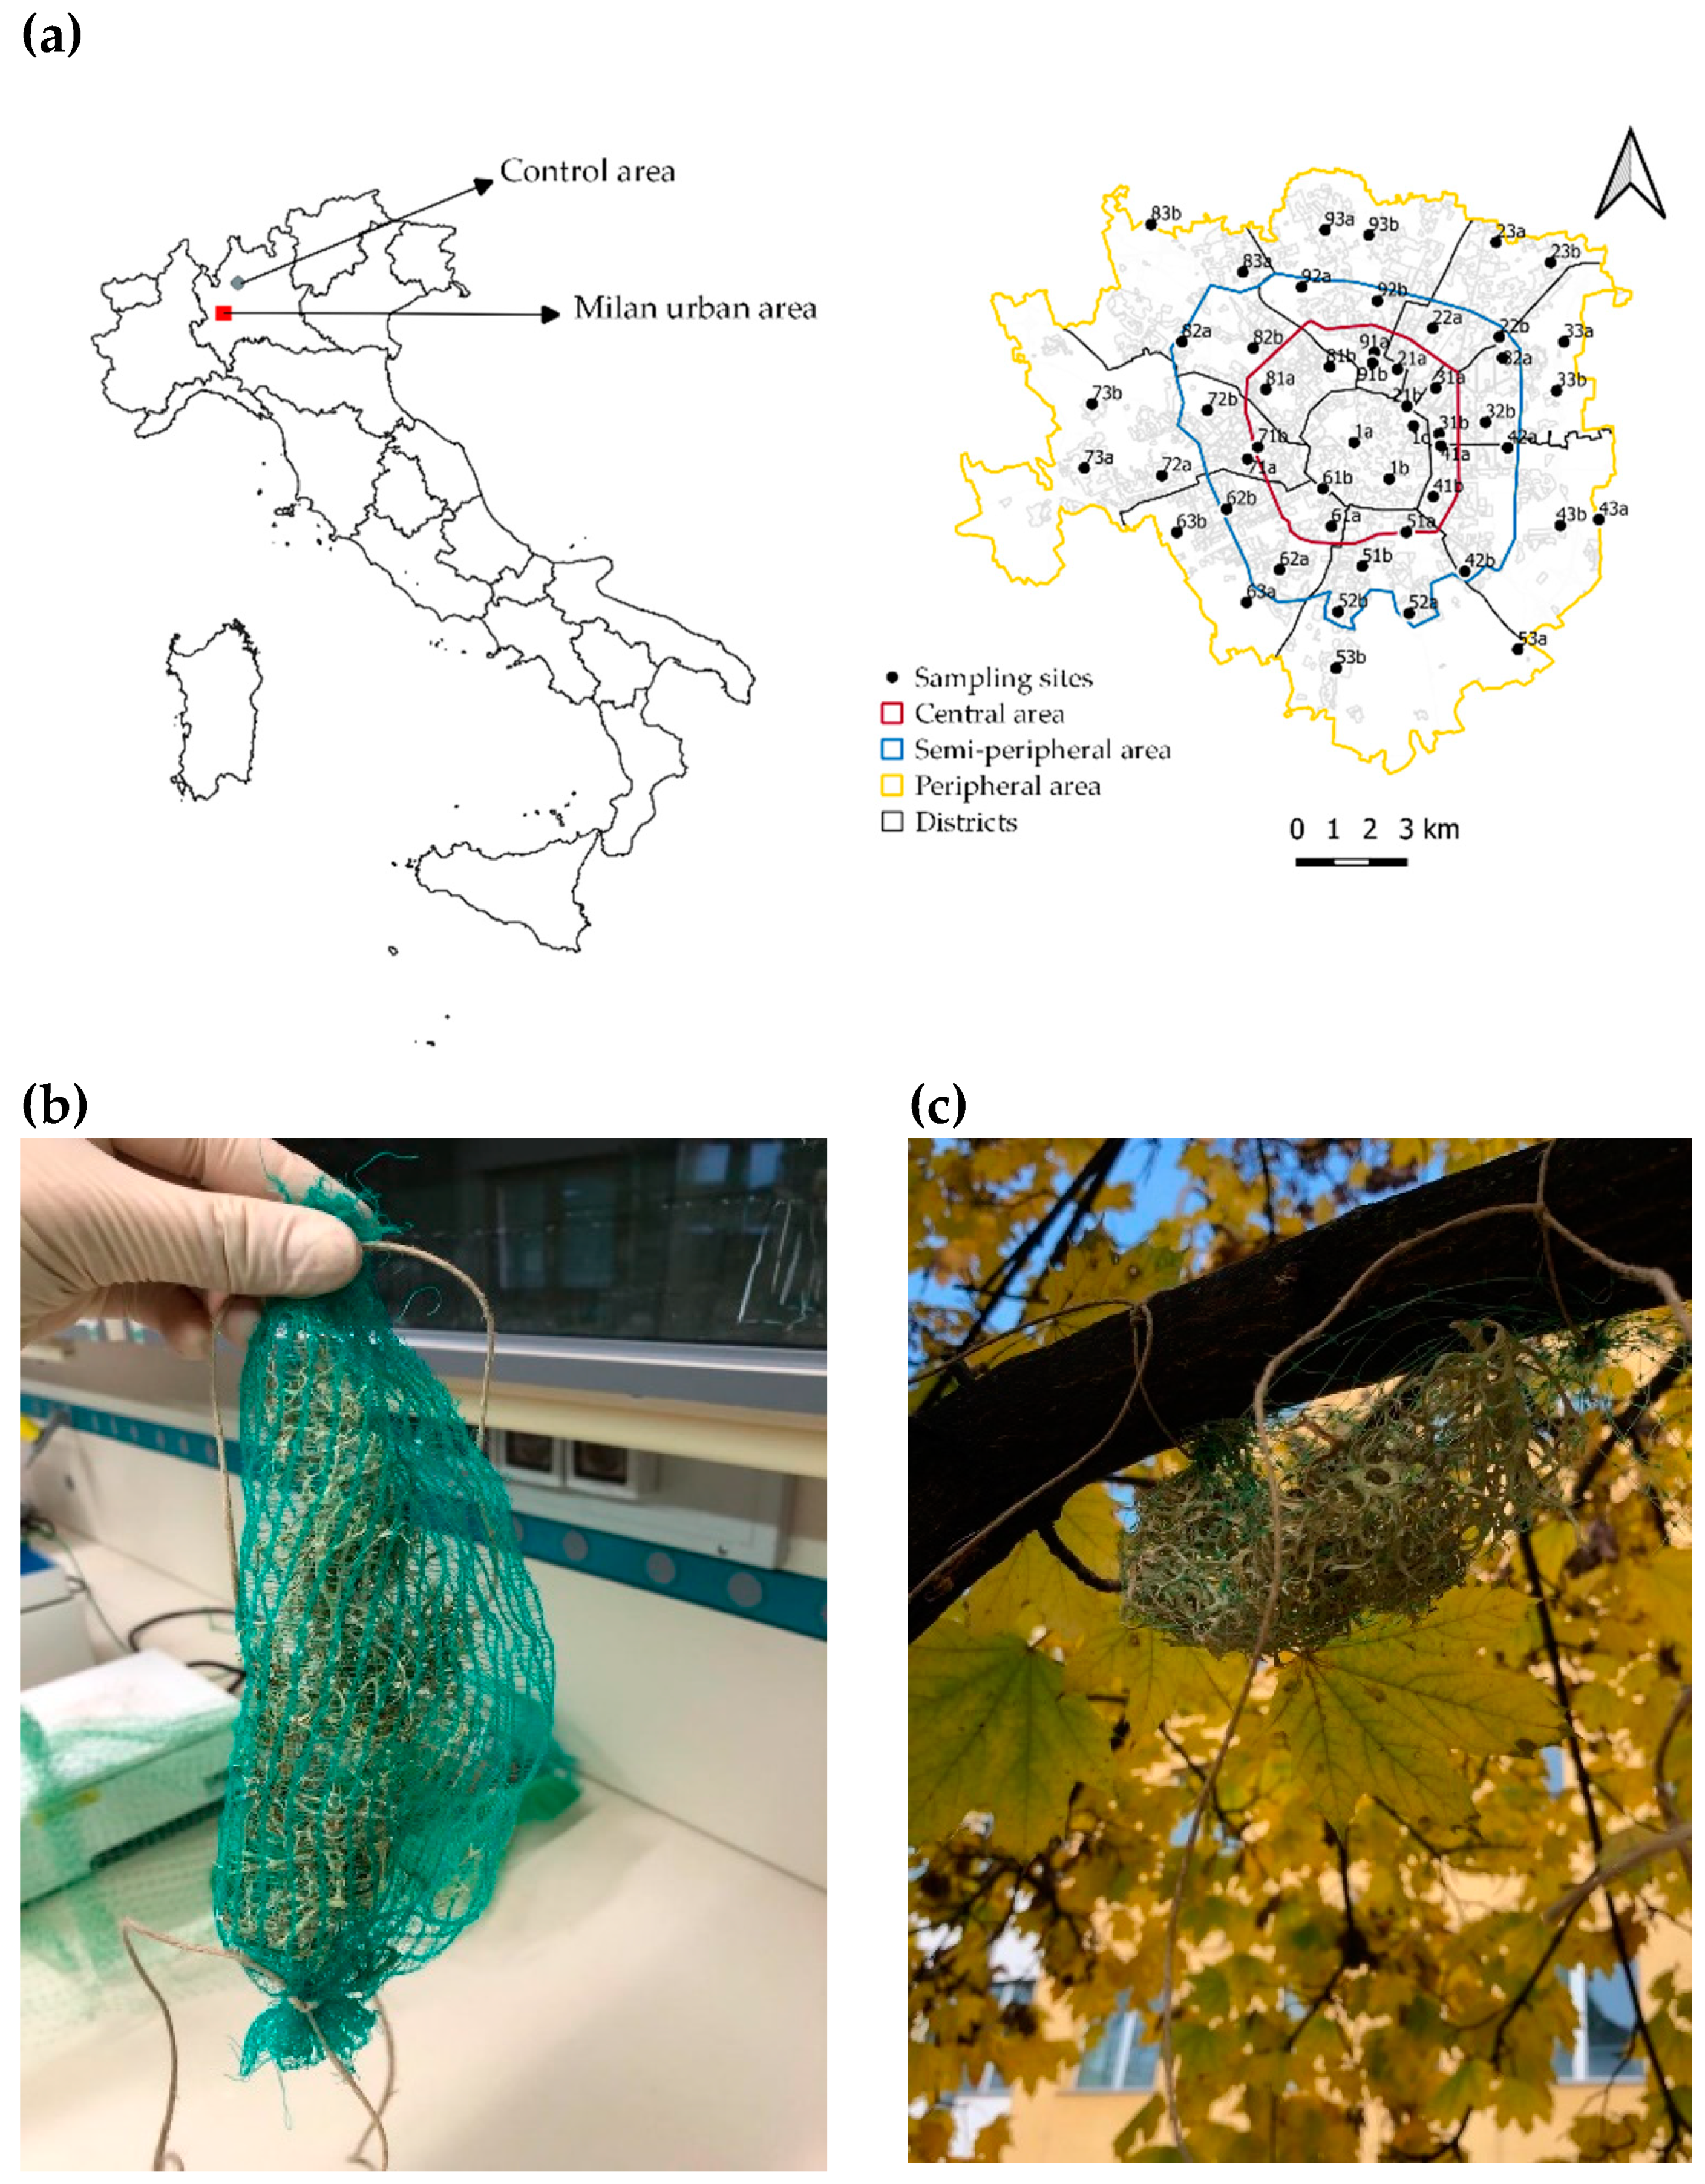
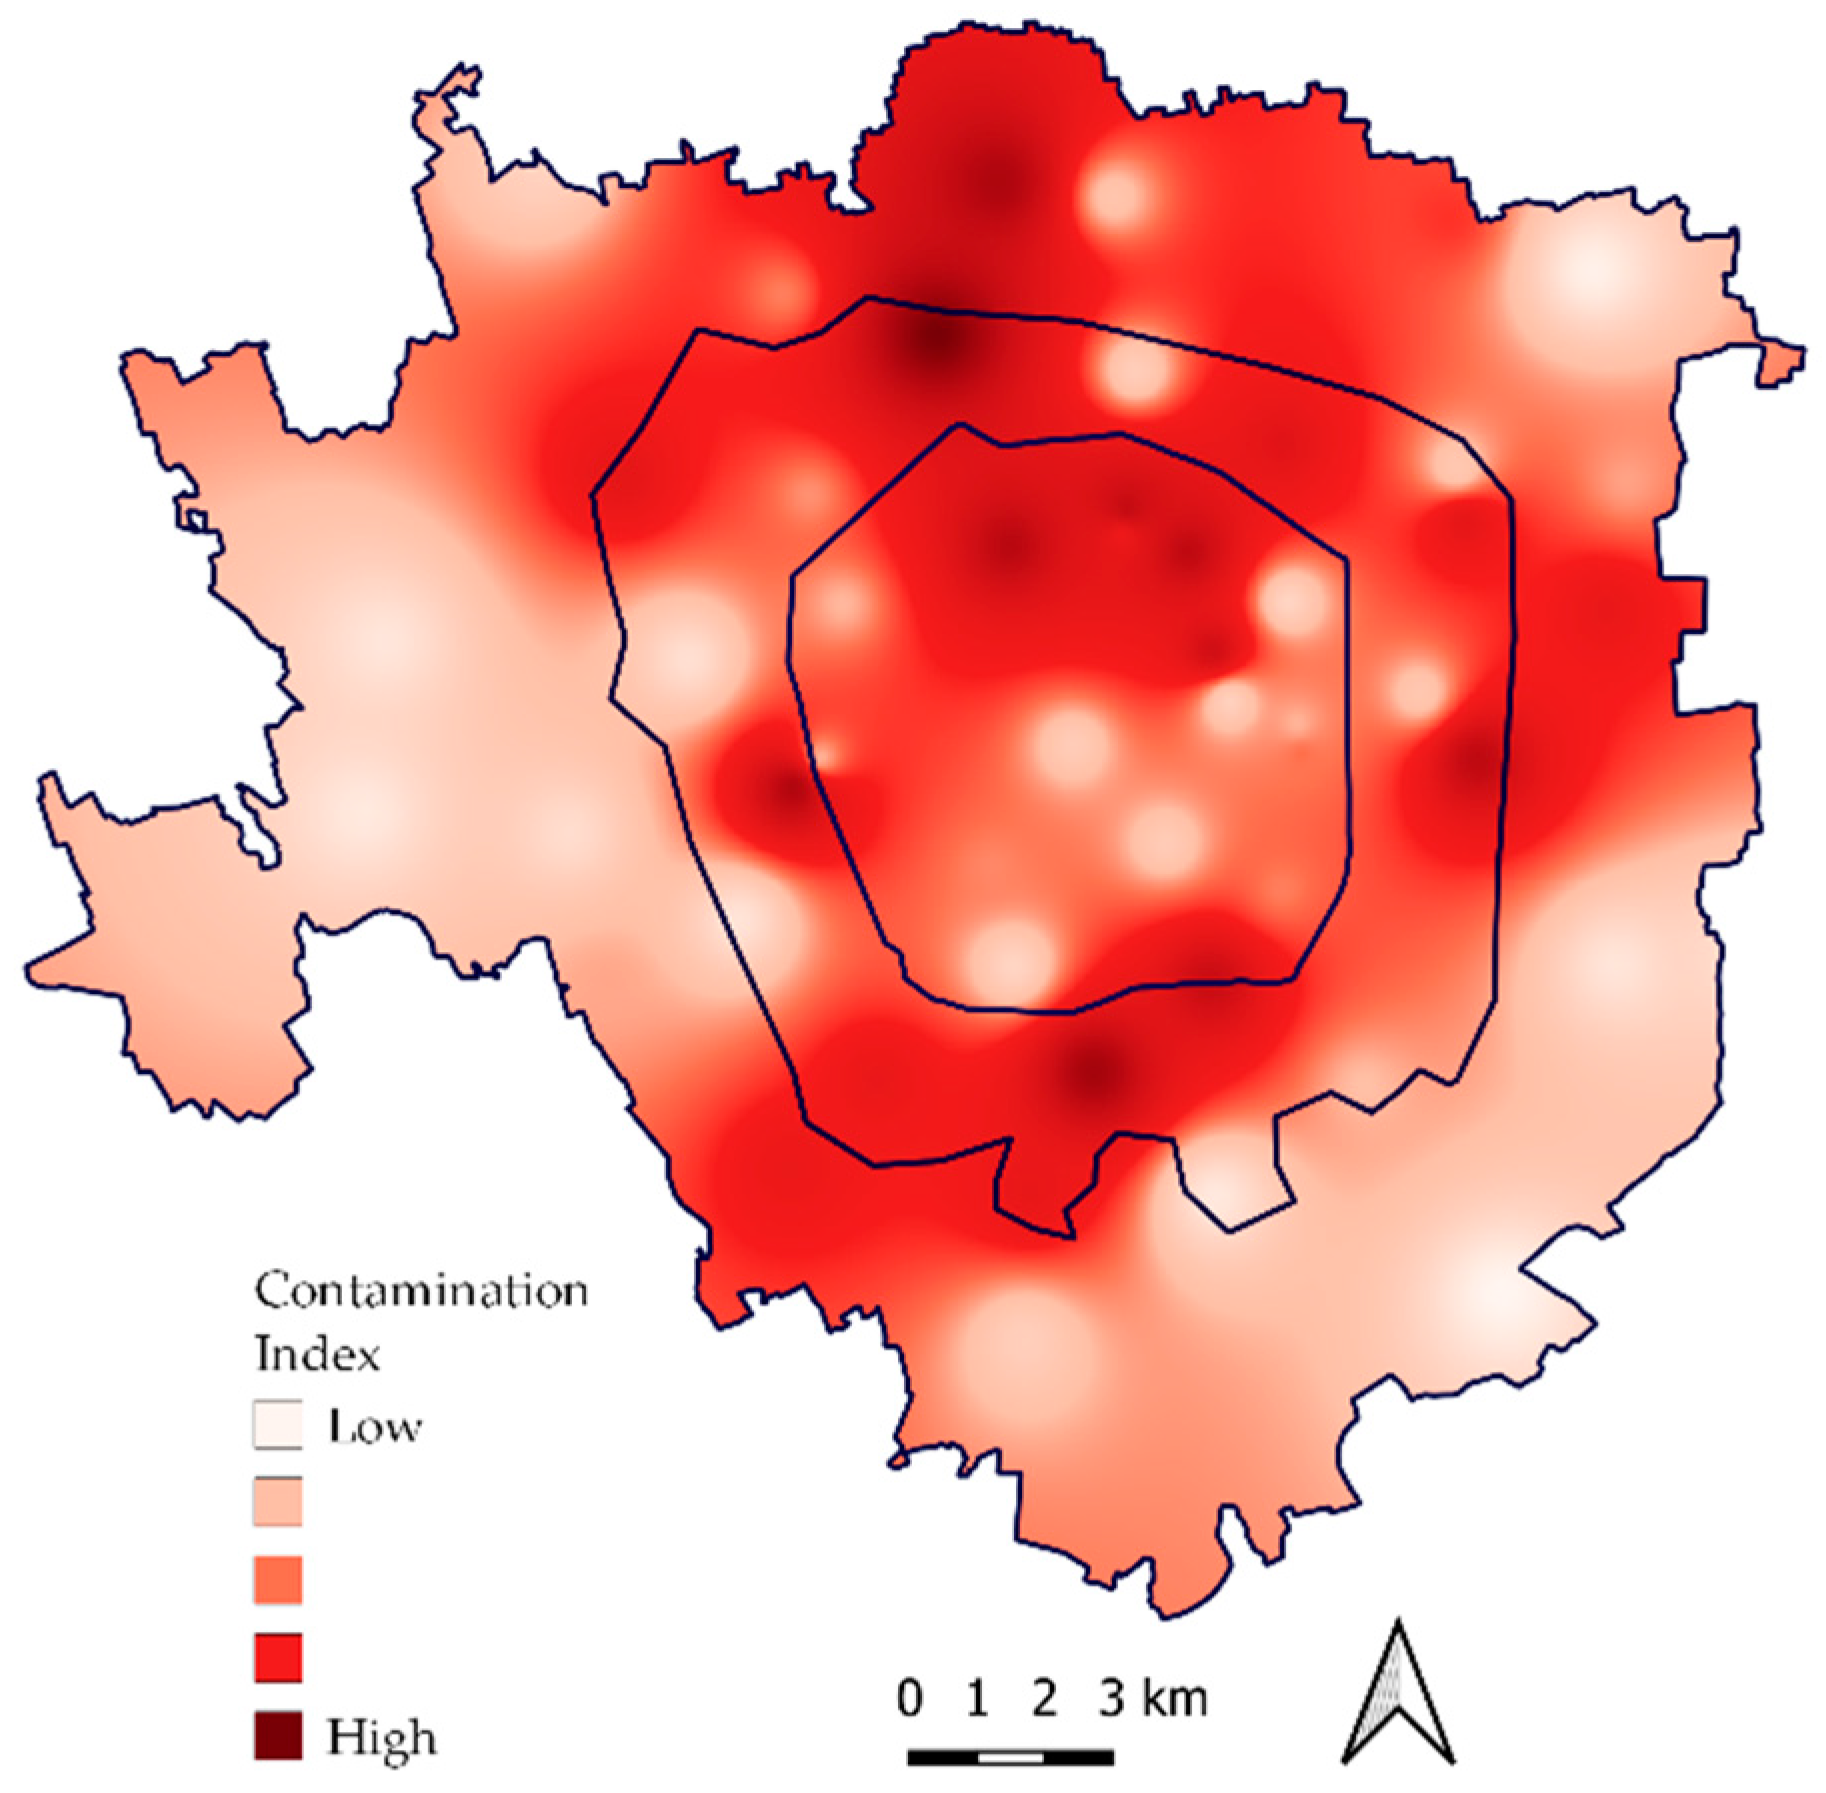
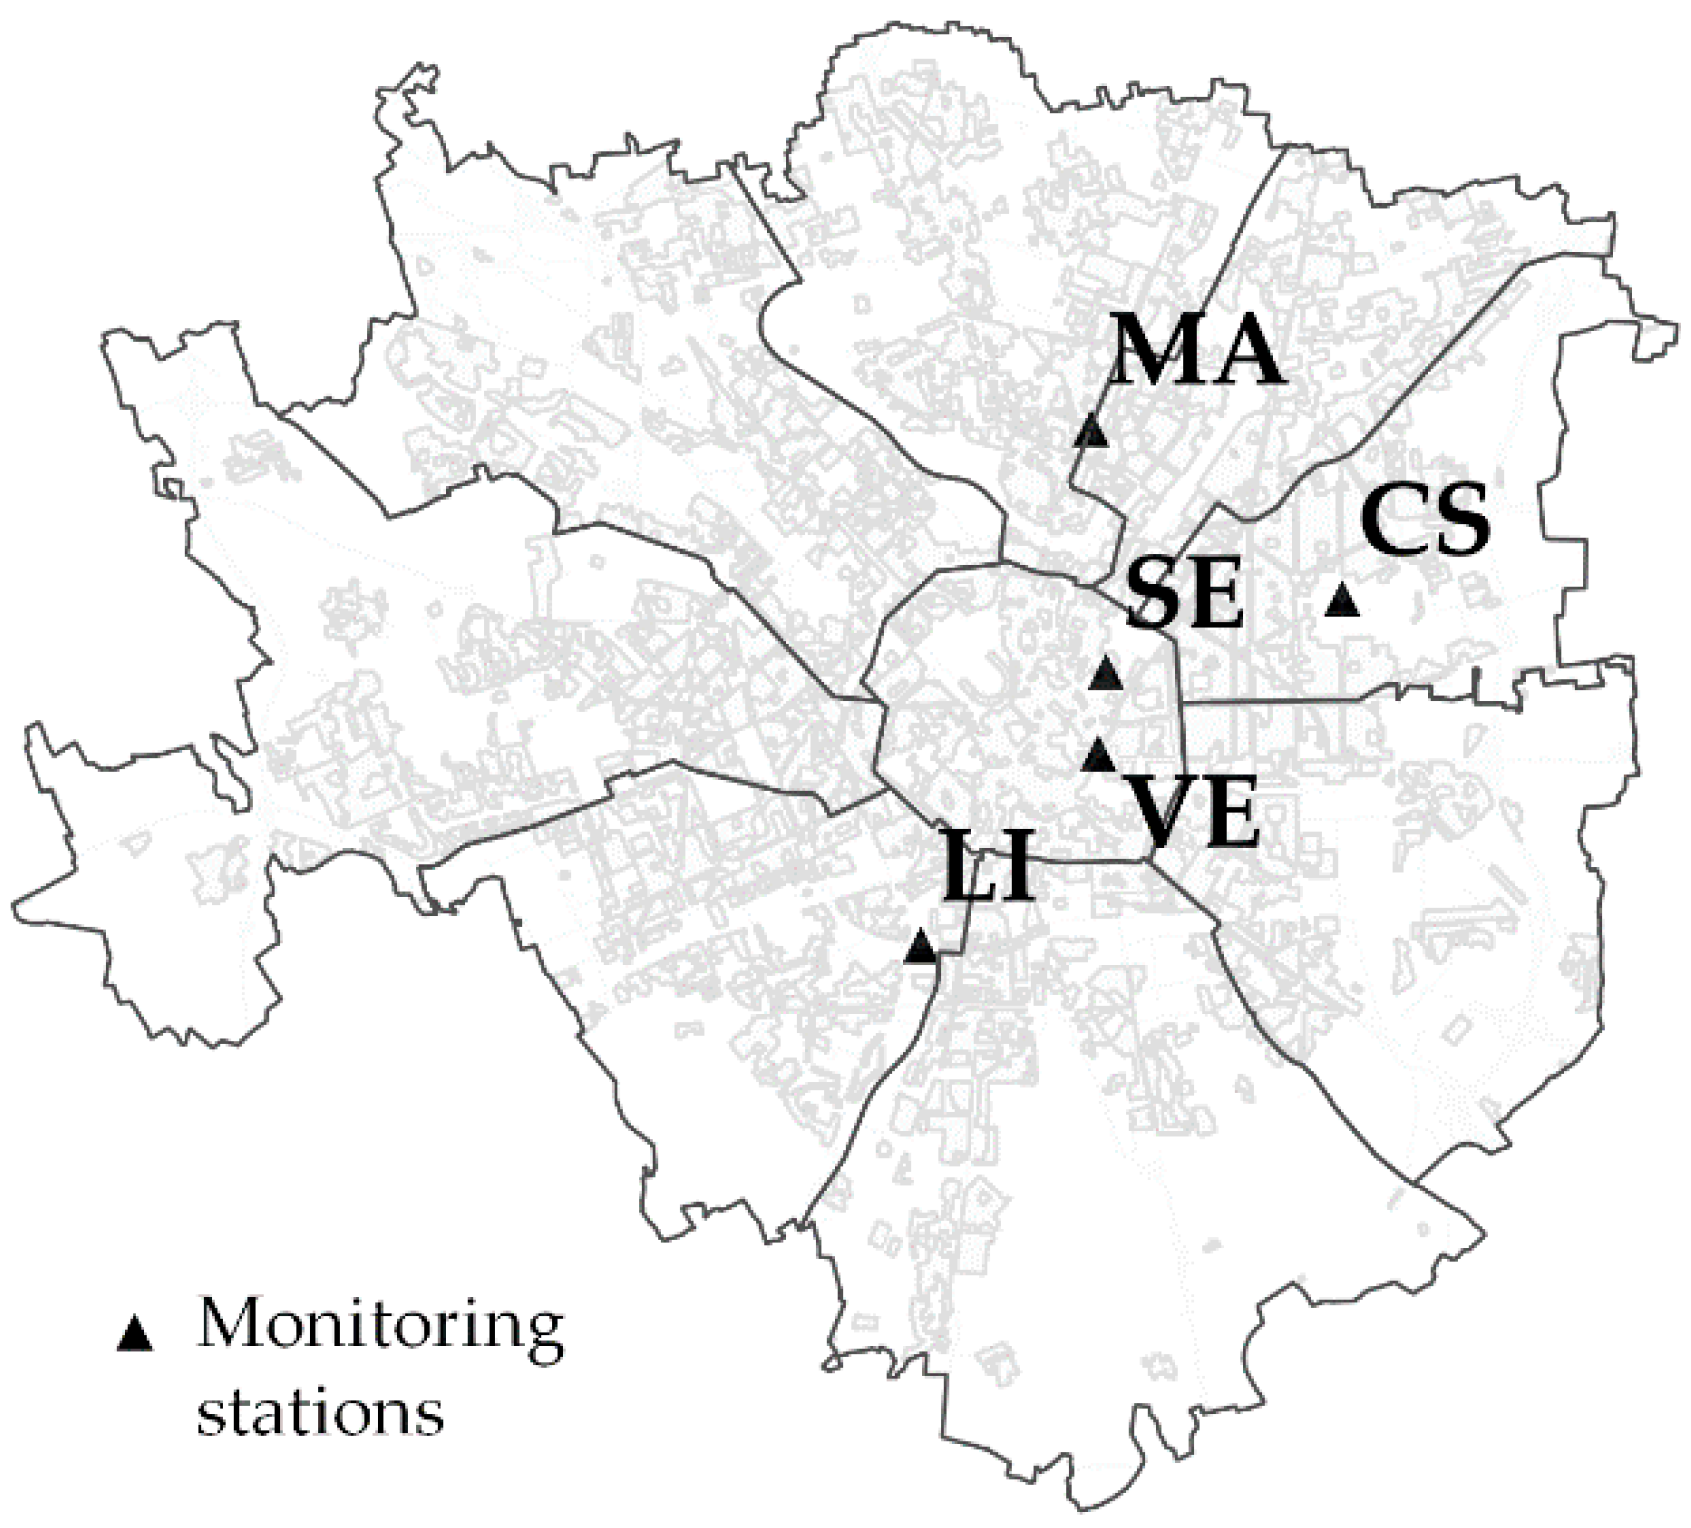
2.1. Study Area
2.2. Lichen Material
2.3. Sampling Design
2.4. Physiological Parameters
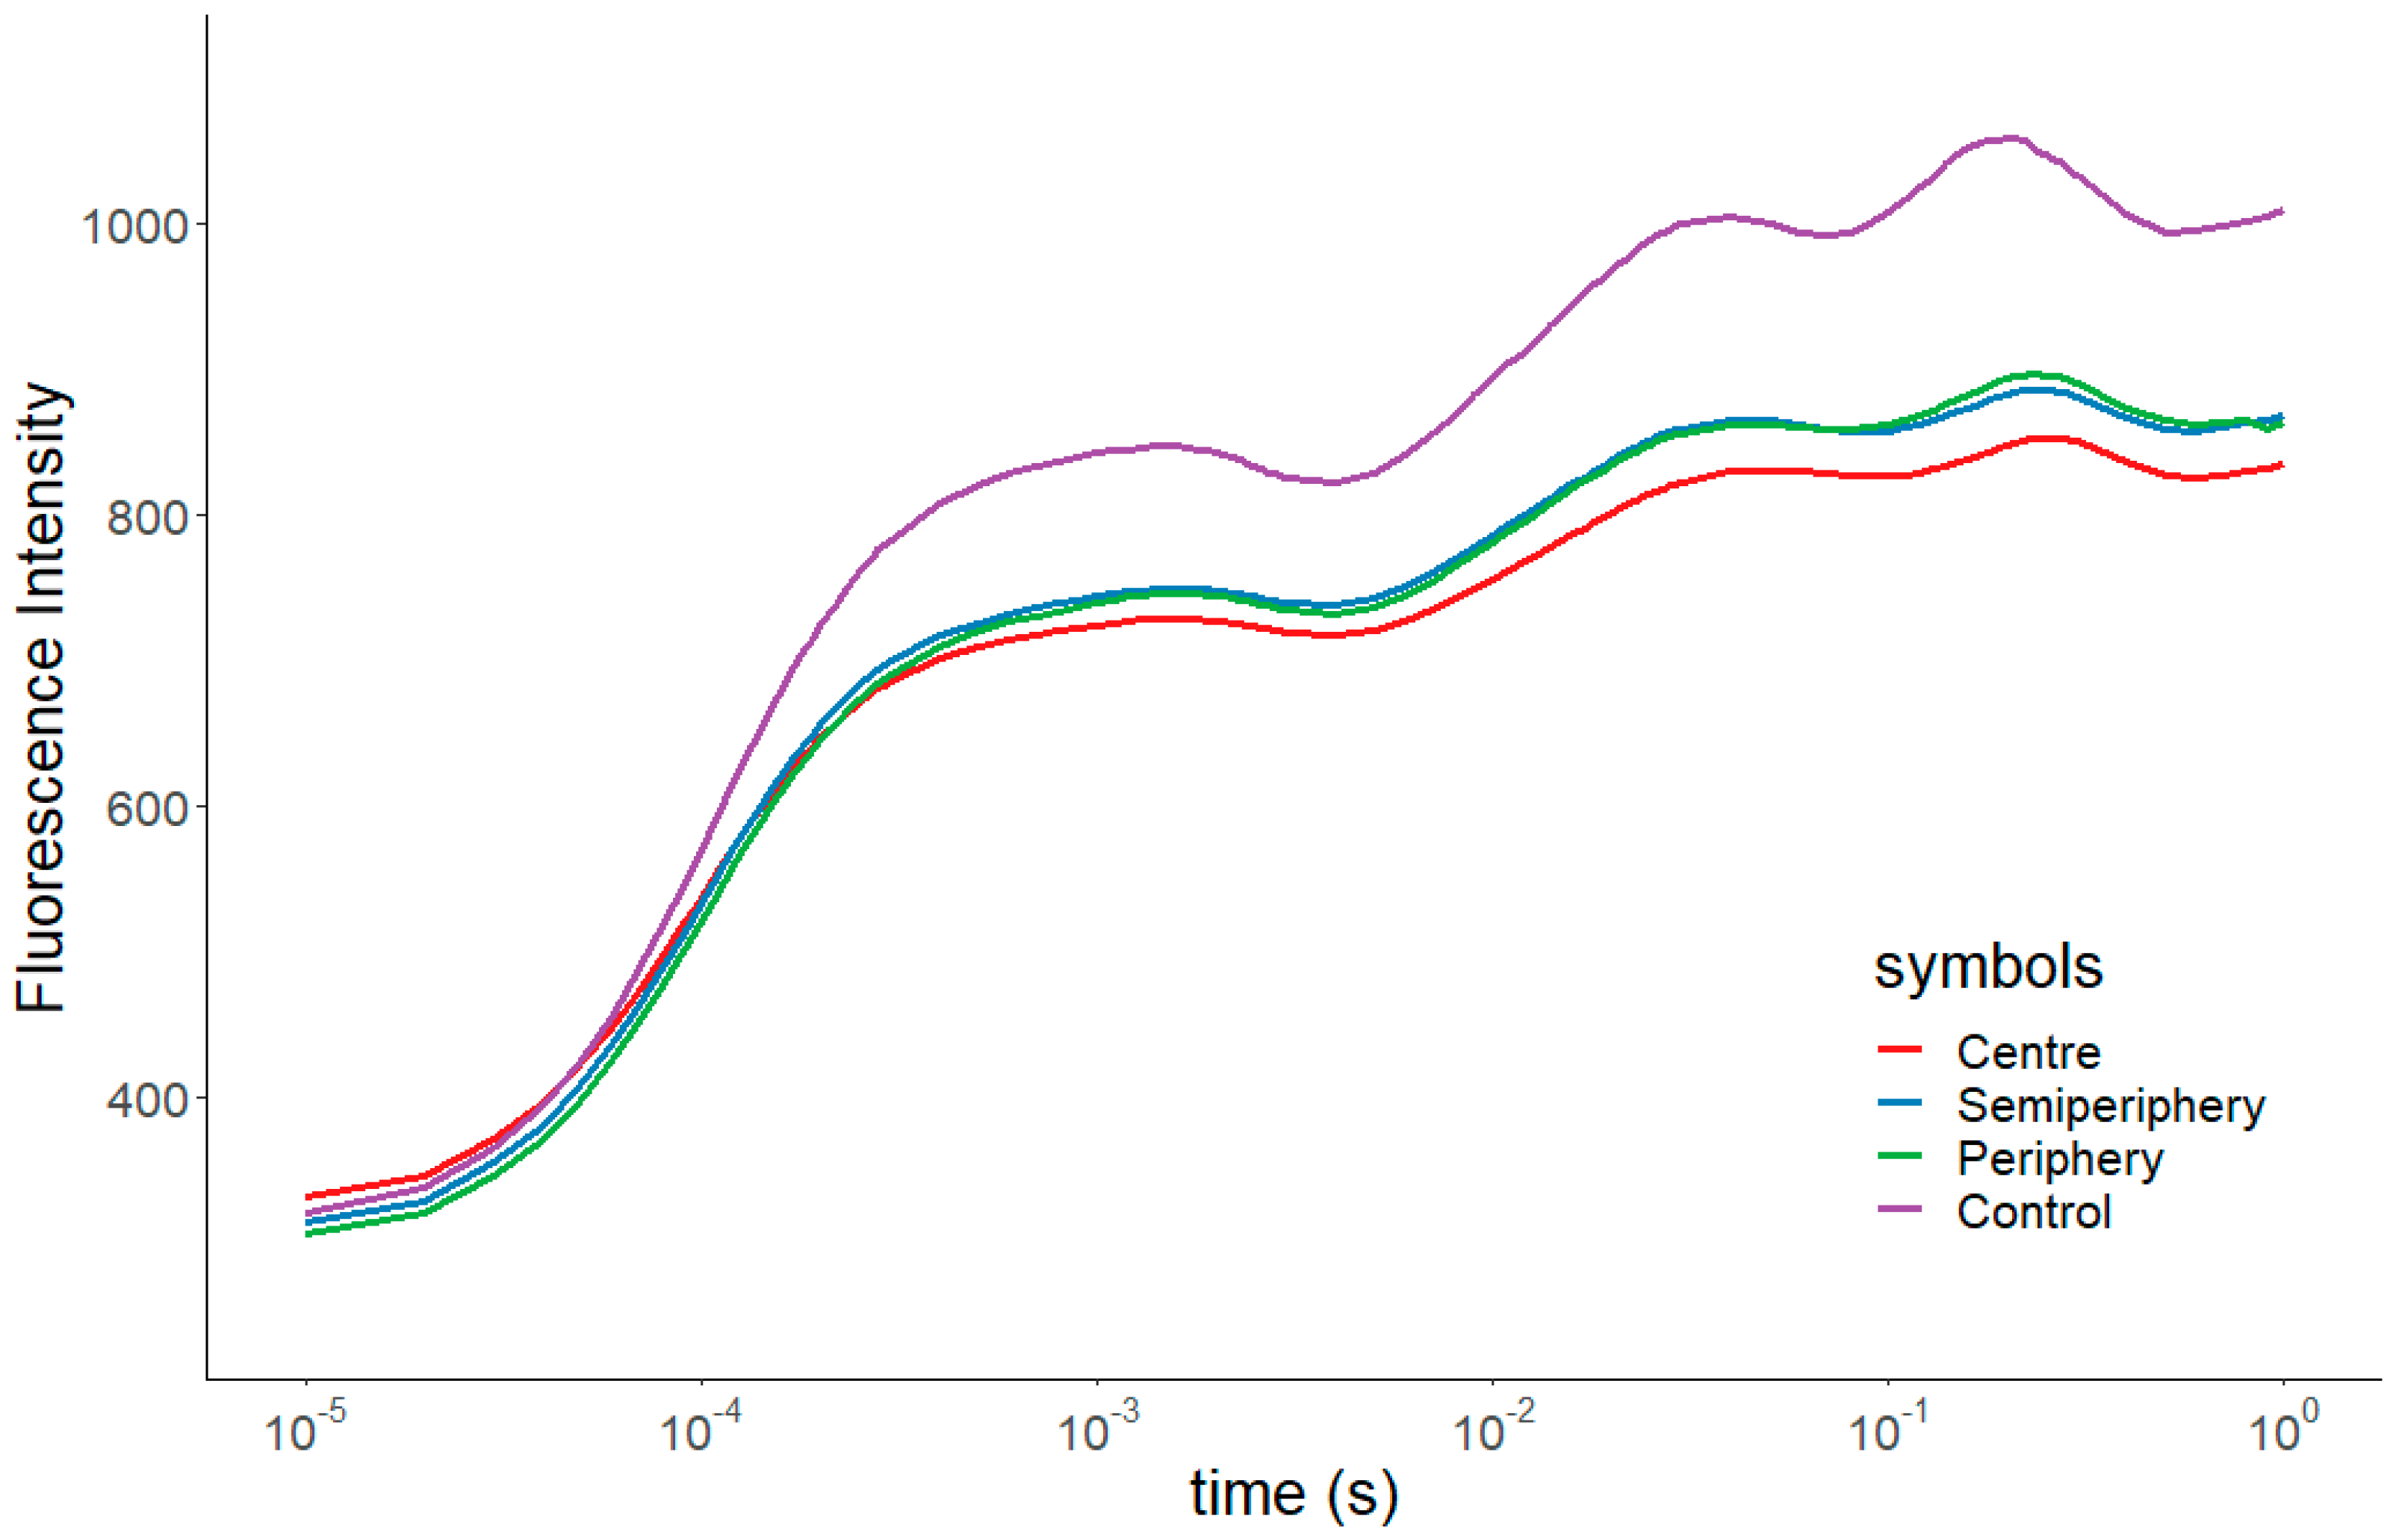
2.4.1. Photosynthetic Efficiency
2.4.2. Cell Membrane Integrity
2.4.3. Antioxidant Activity
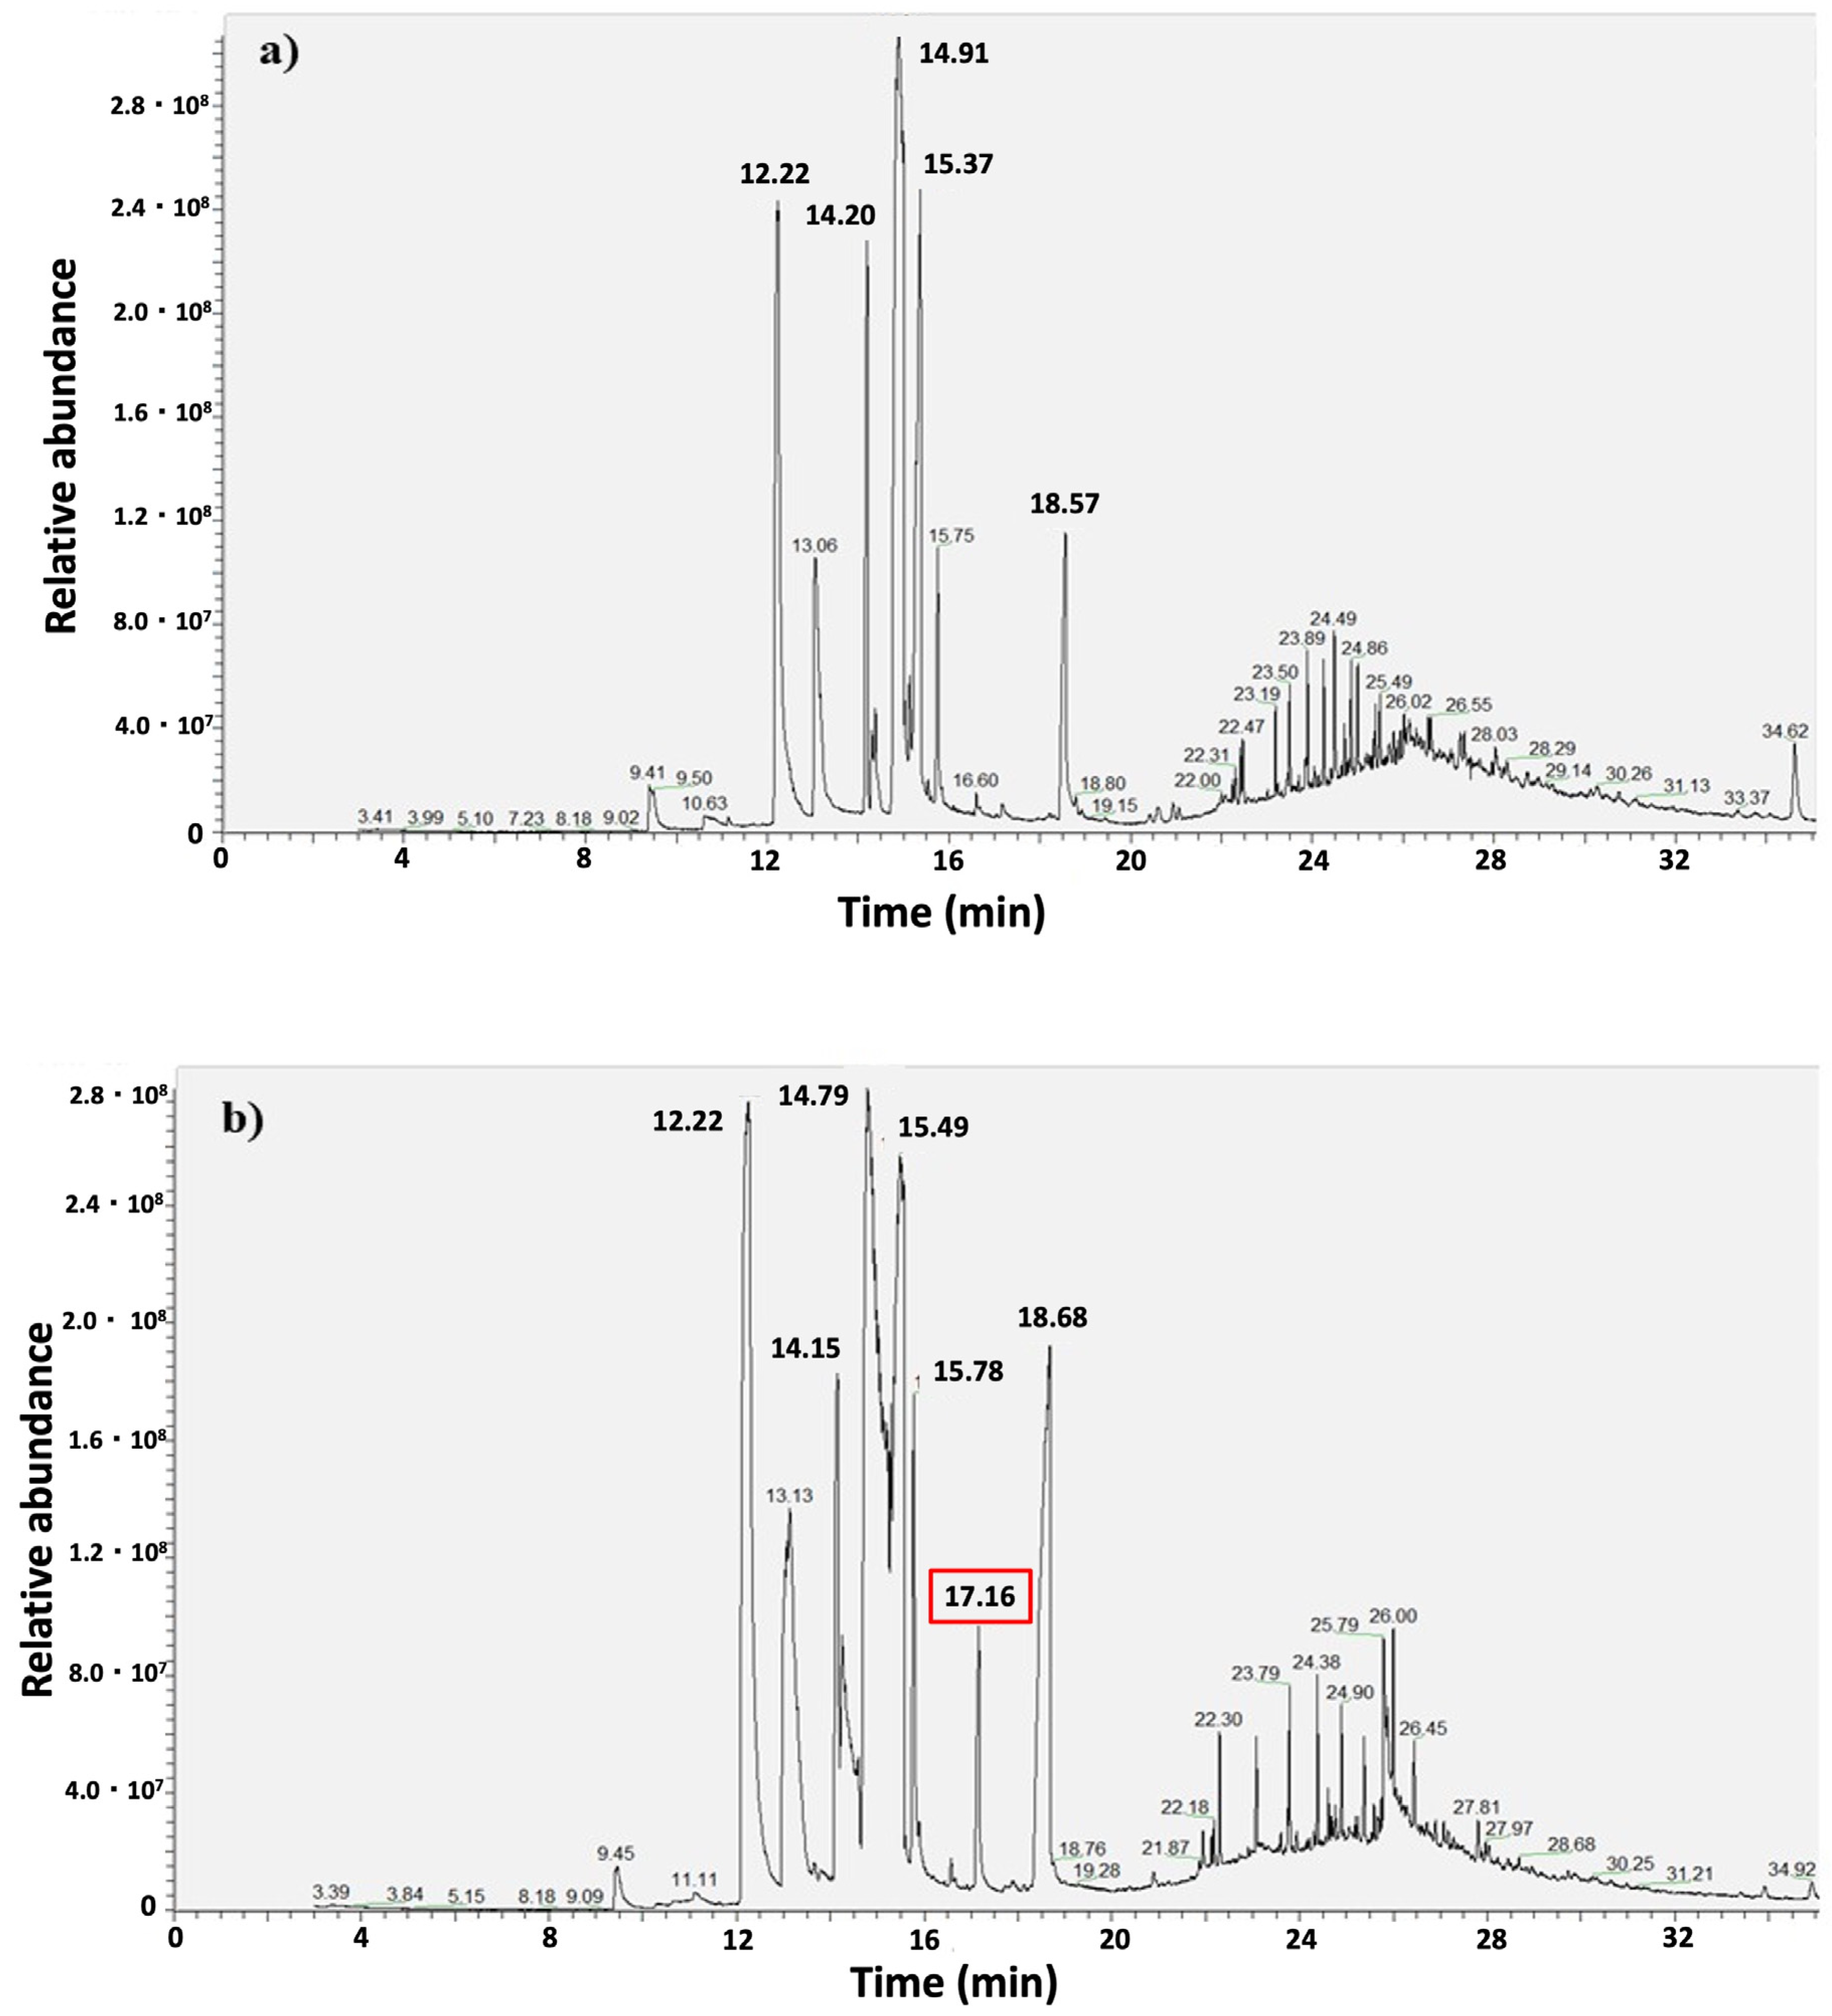
2.5. Assessment of Secondary Metabolites Production
2.6. Statistical Analysis
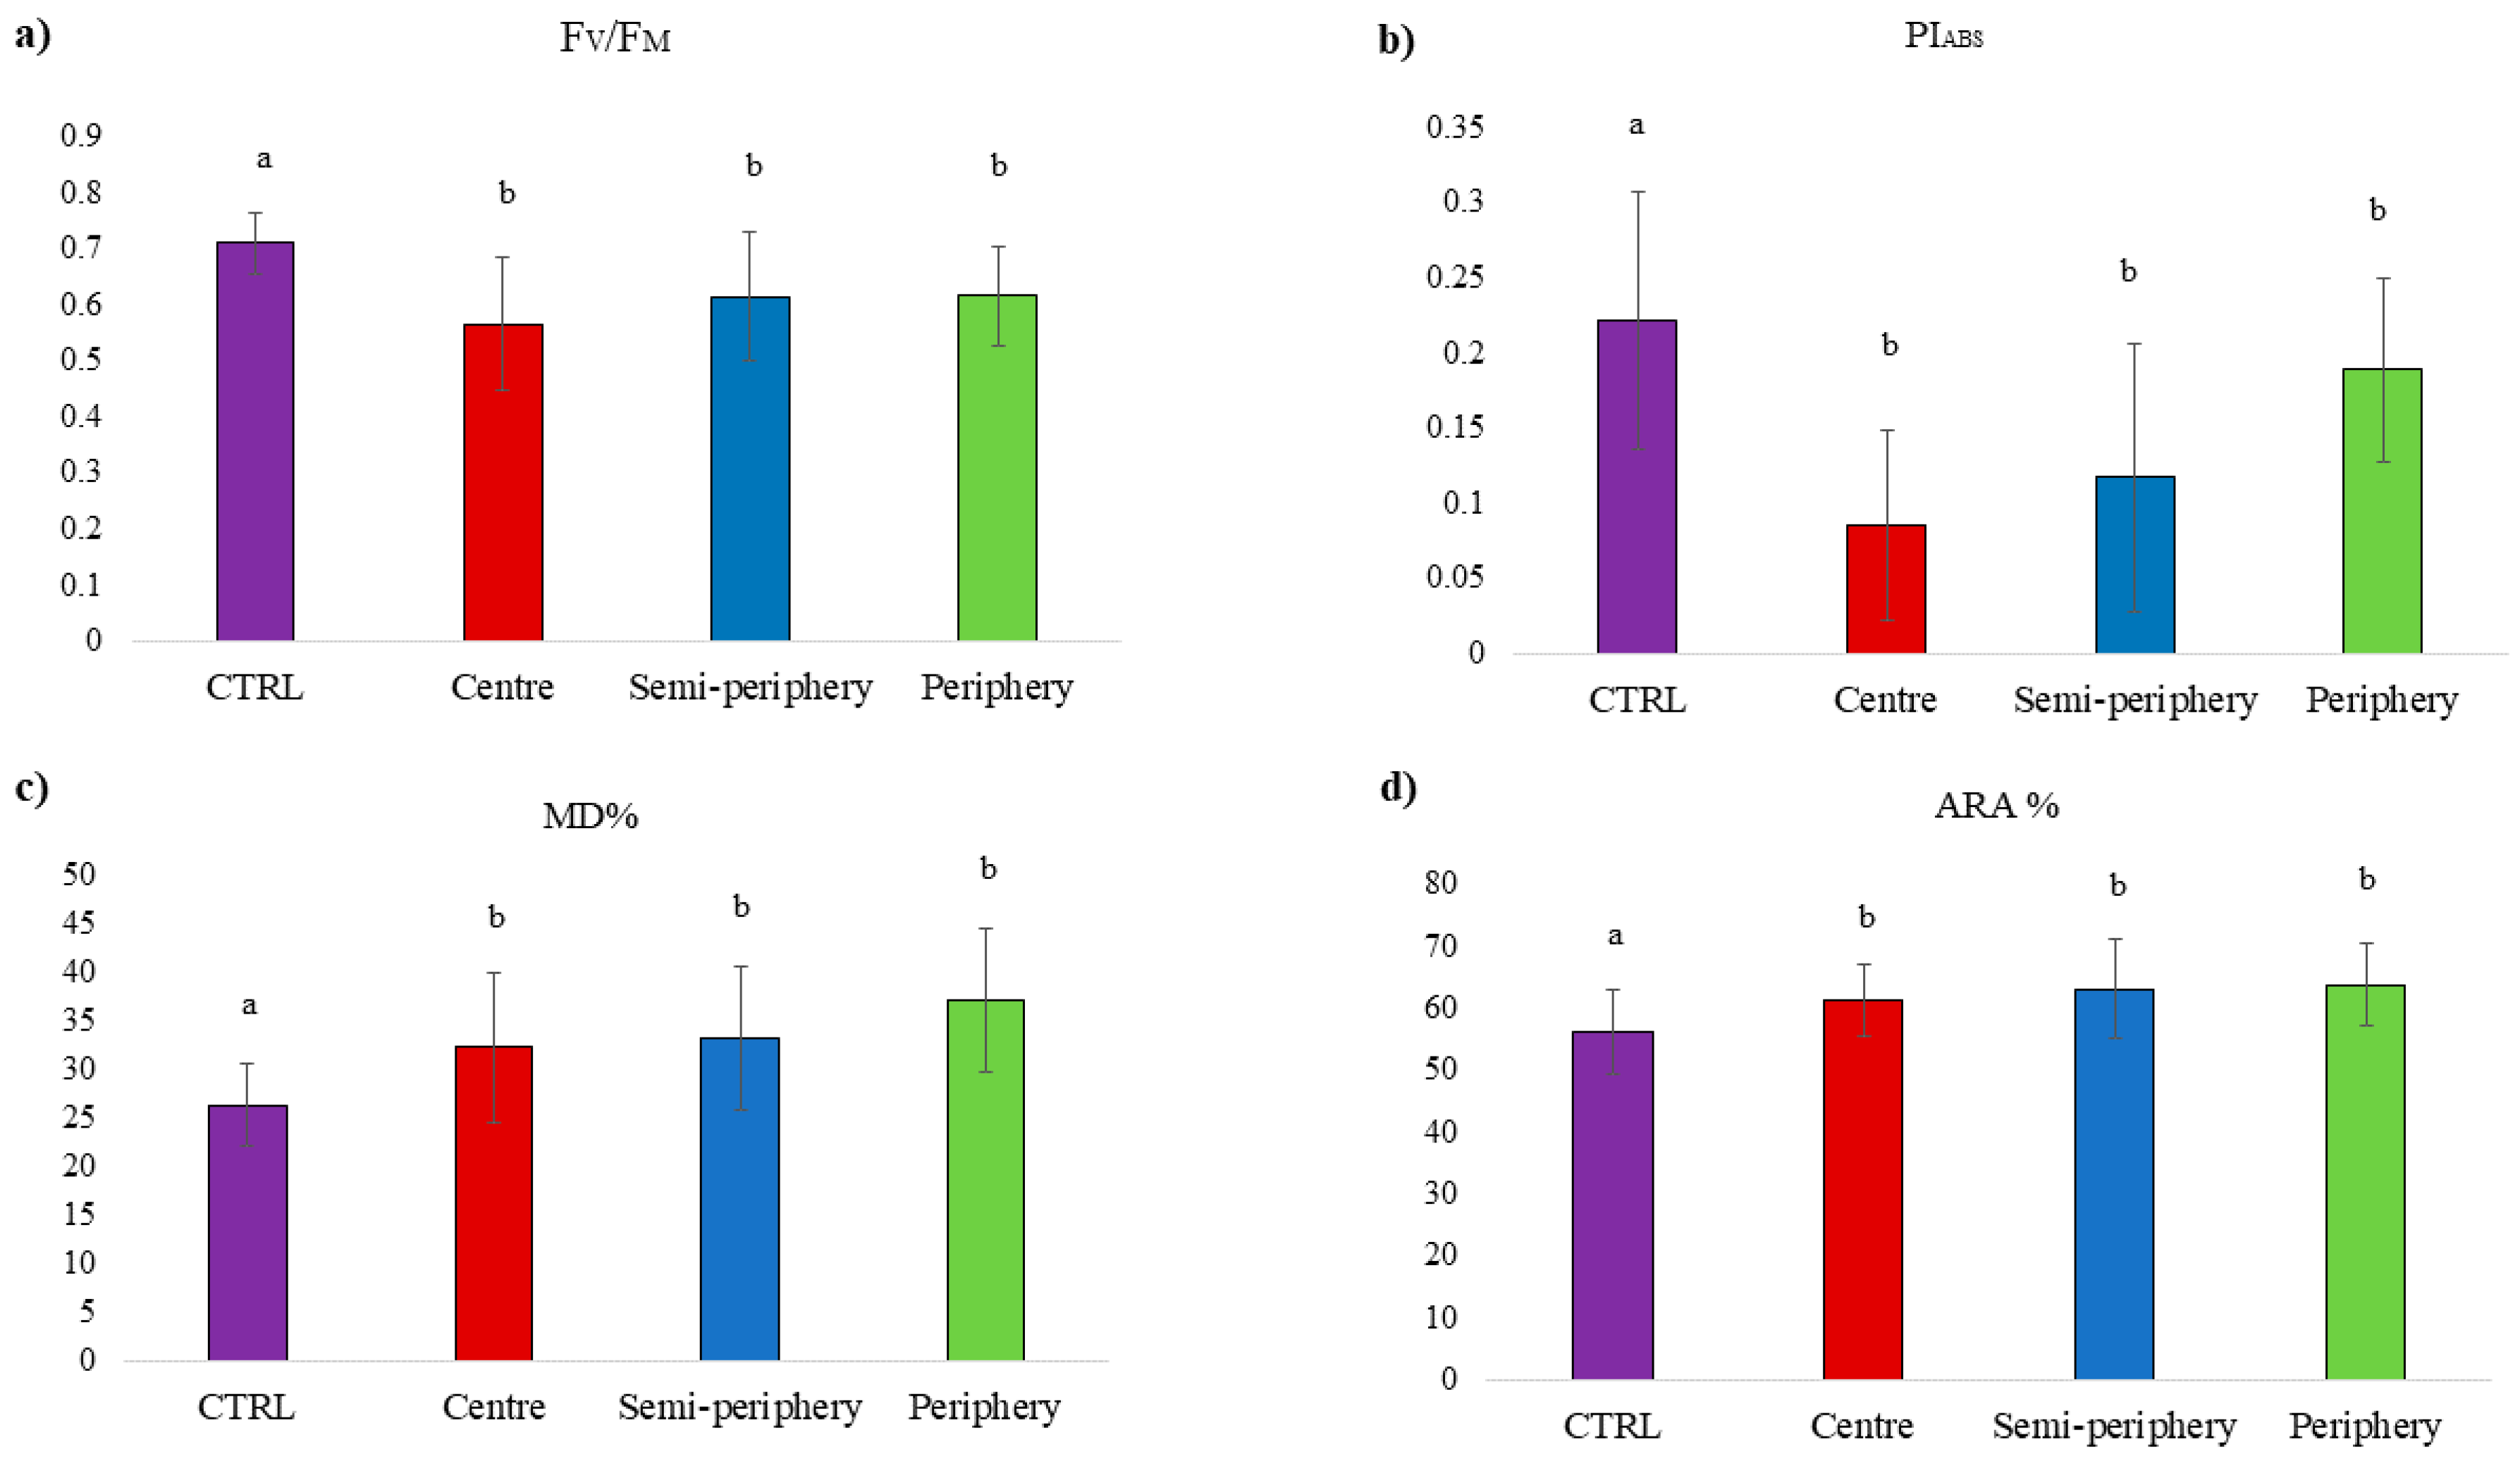
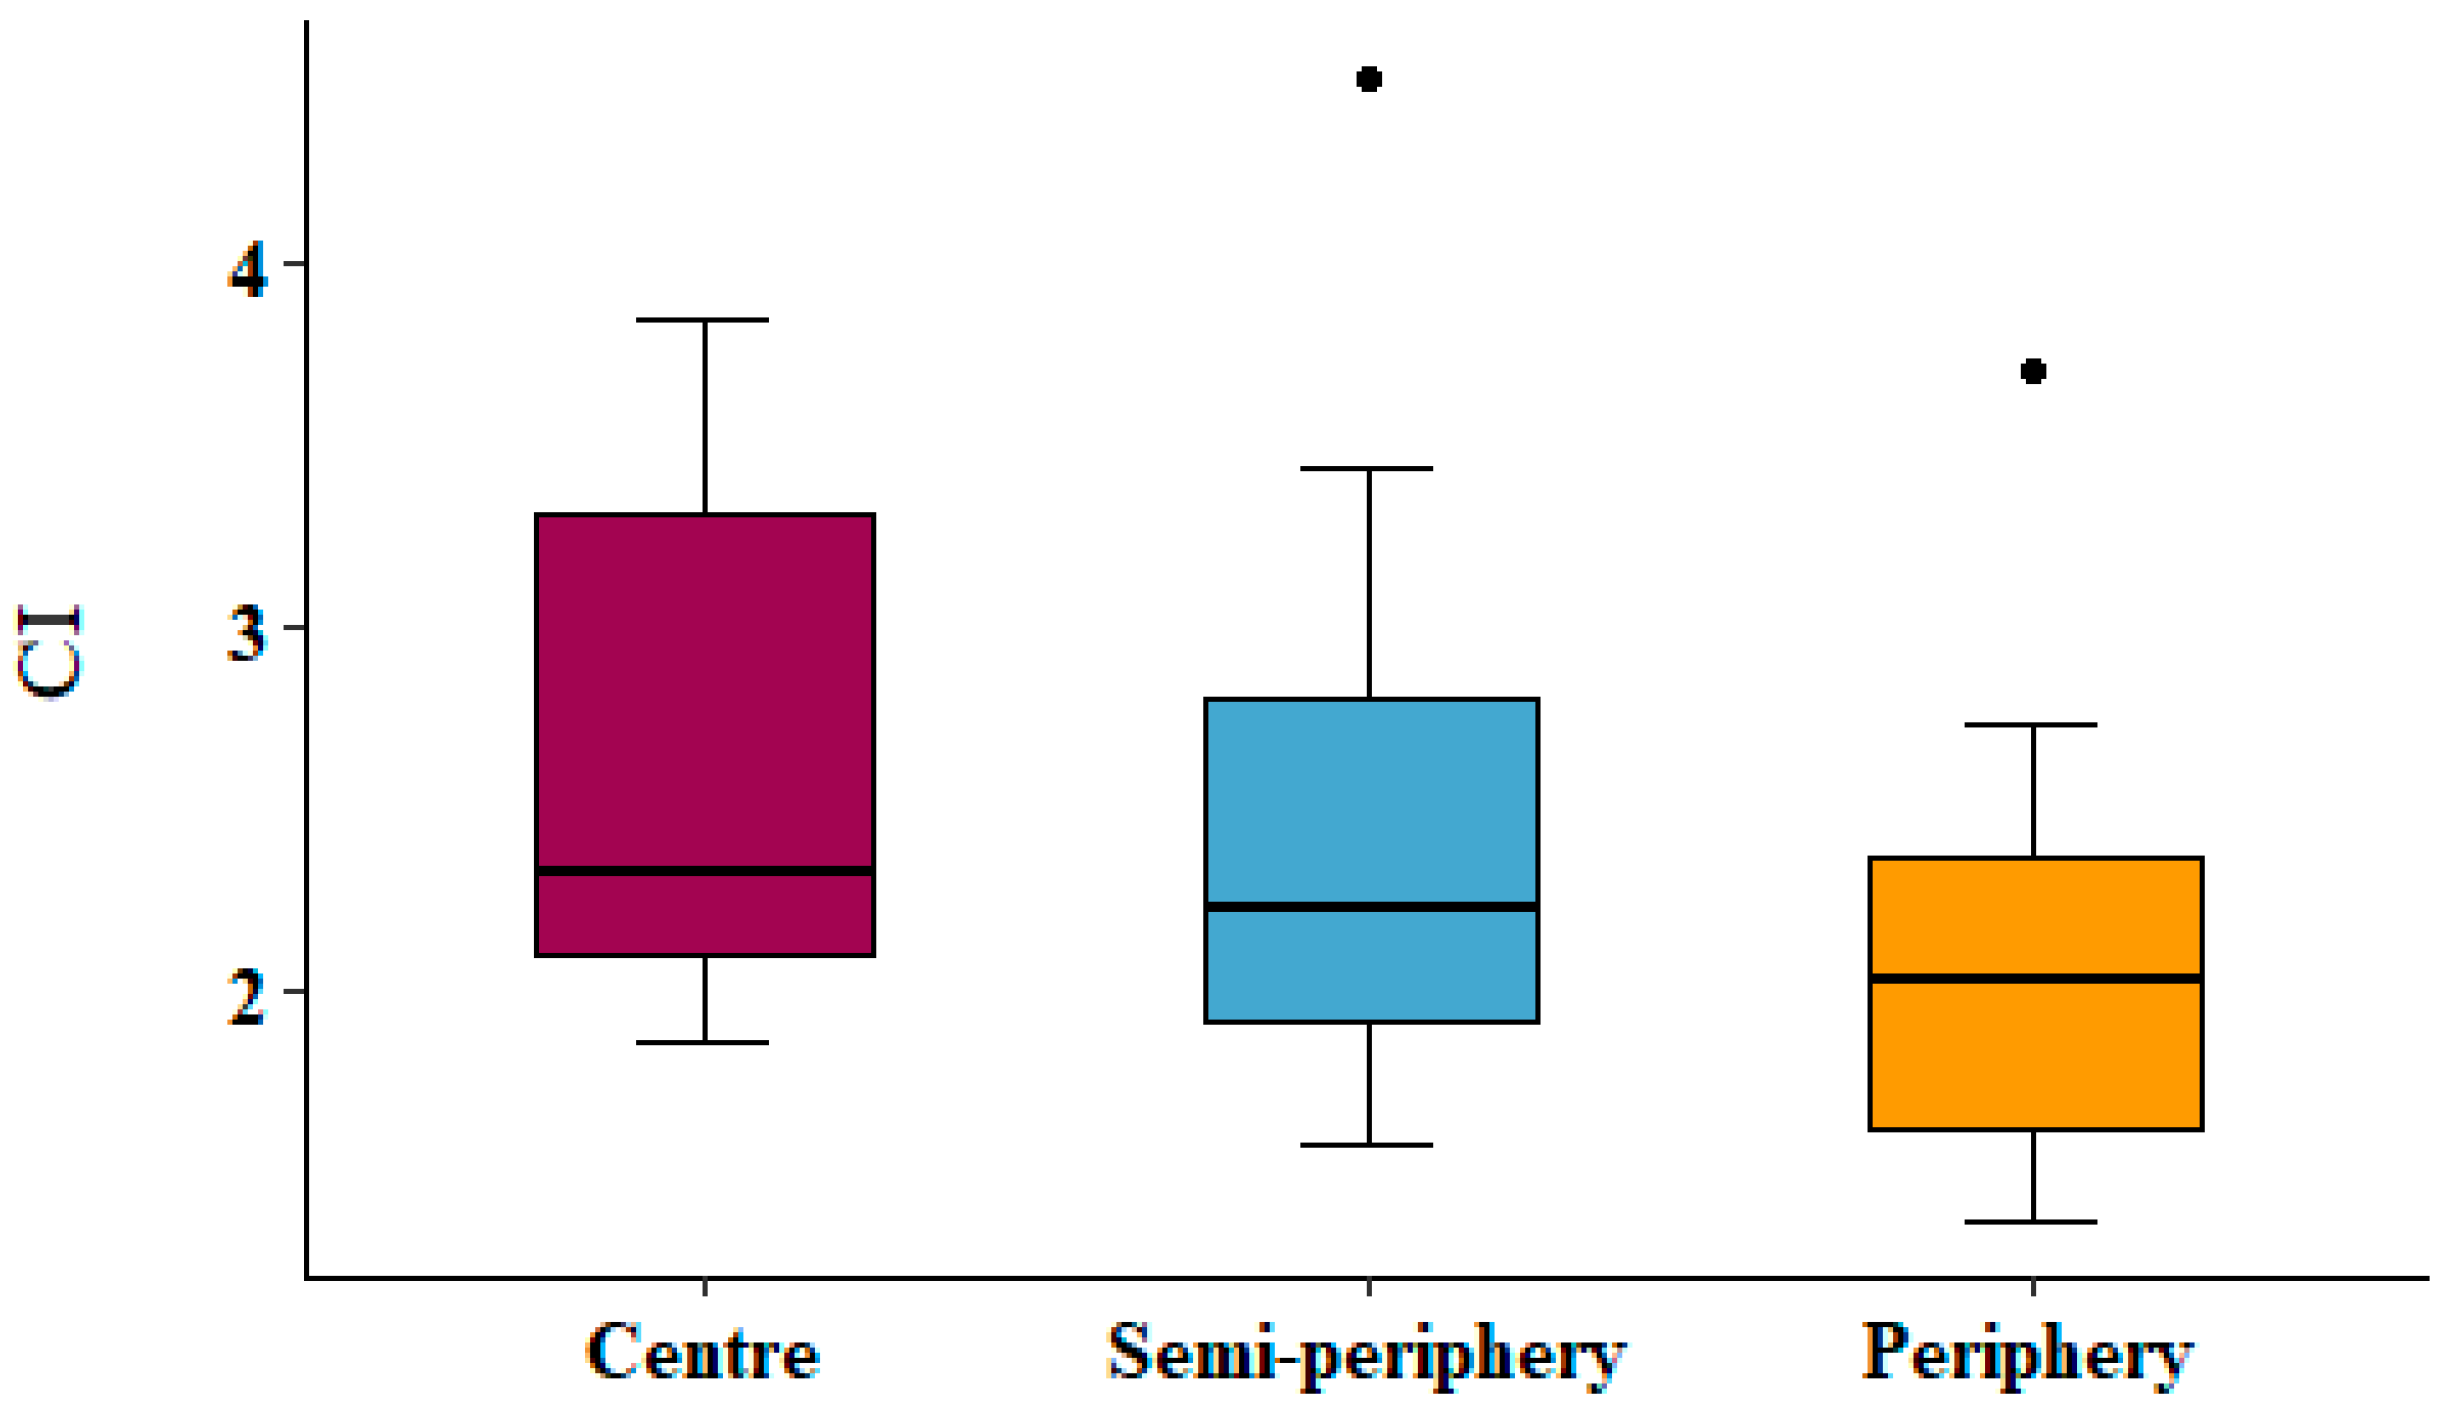
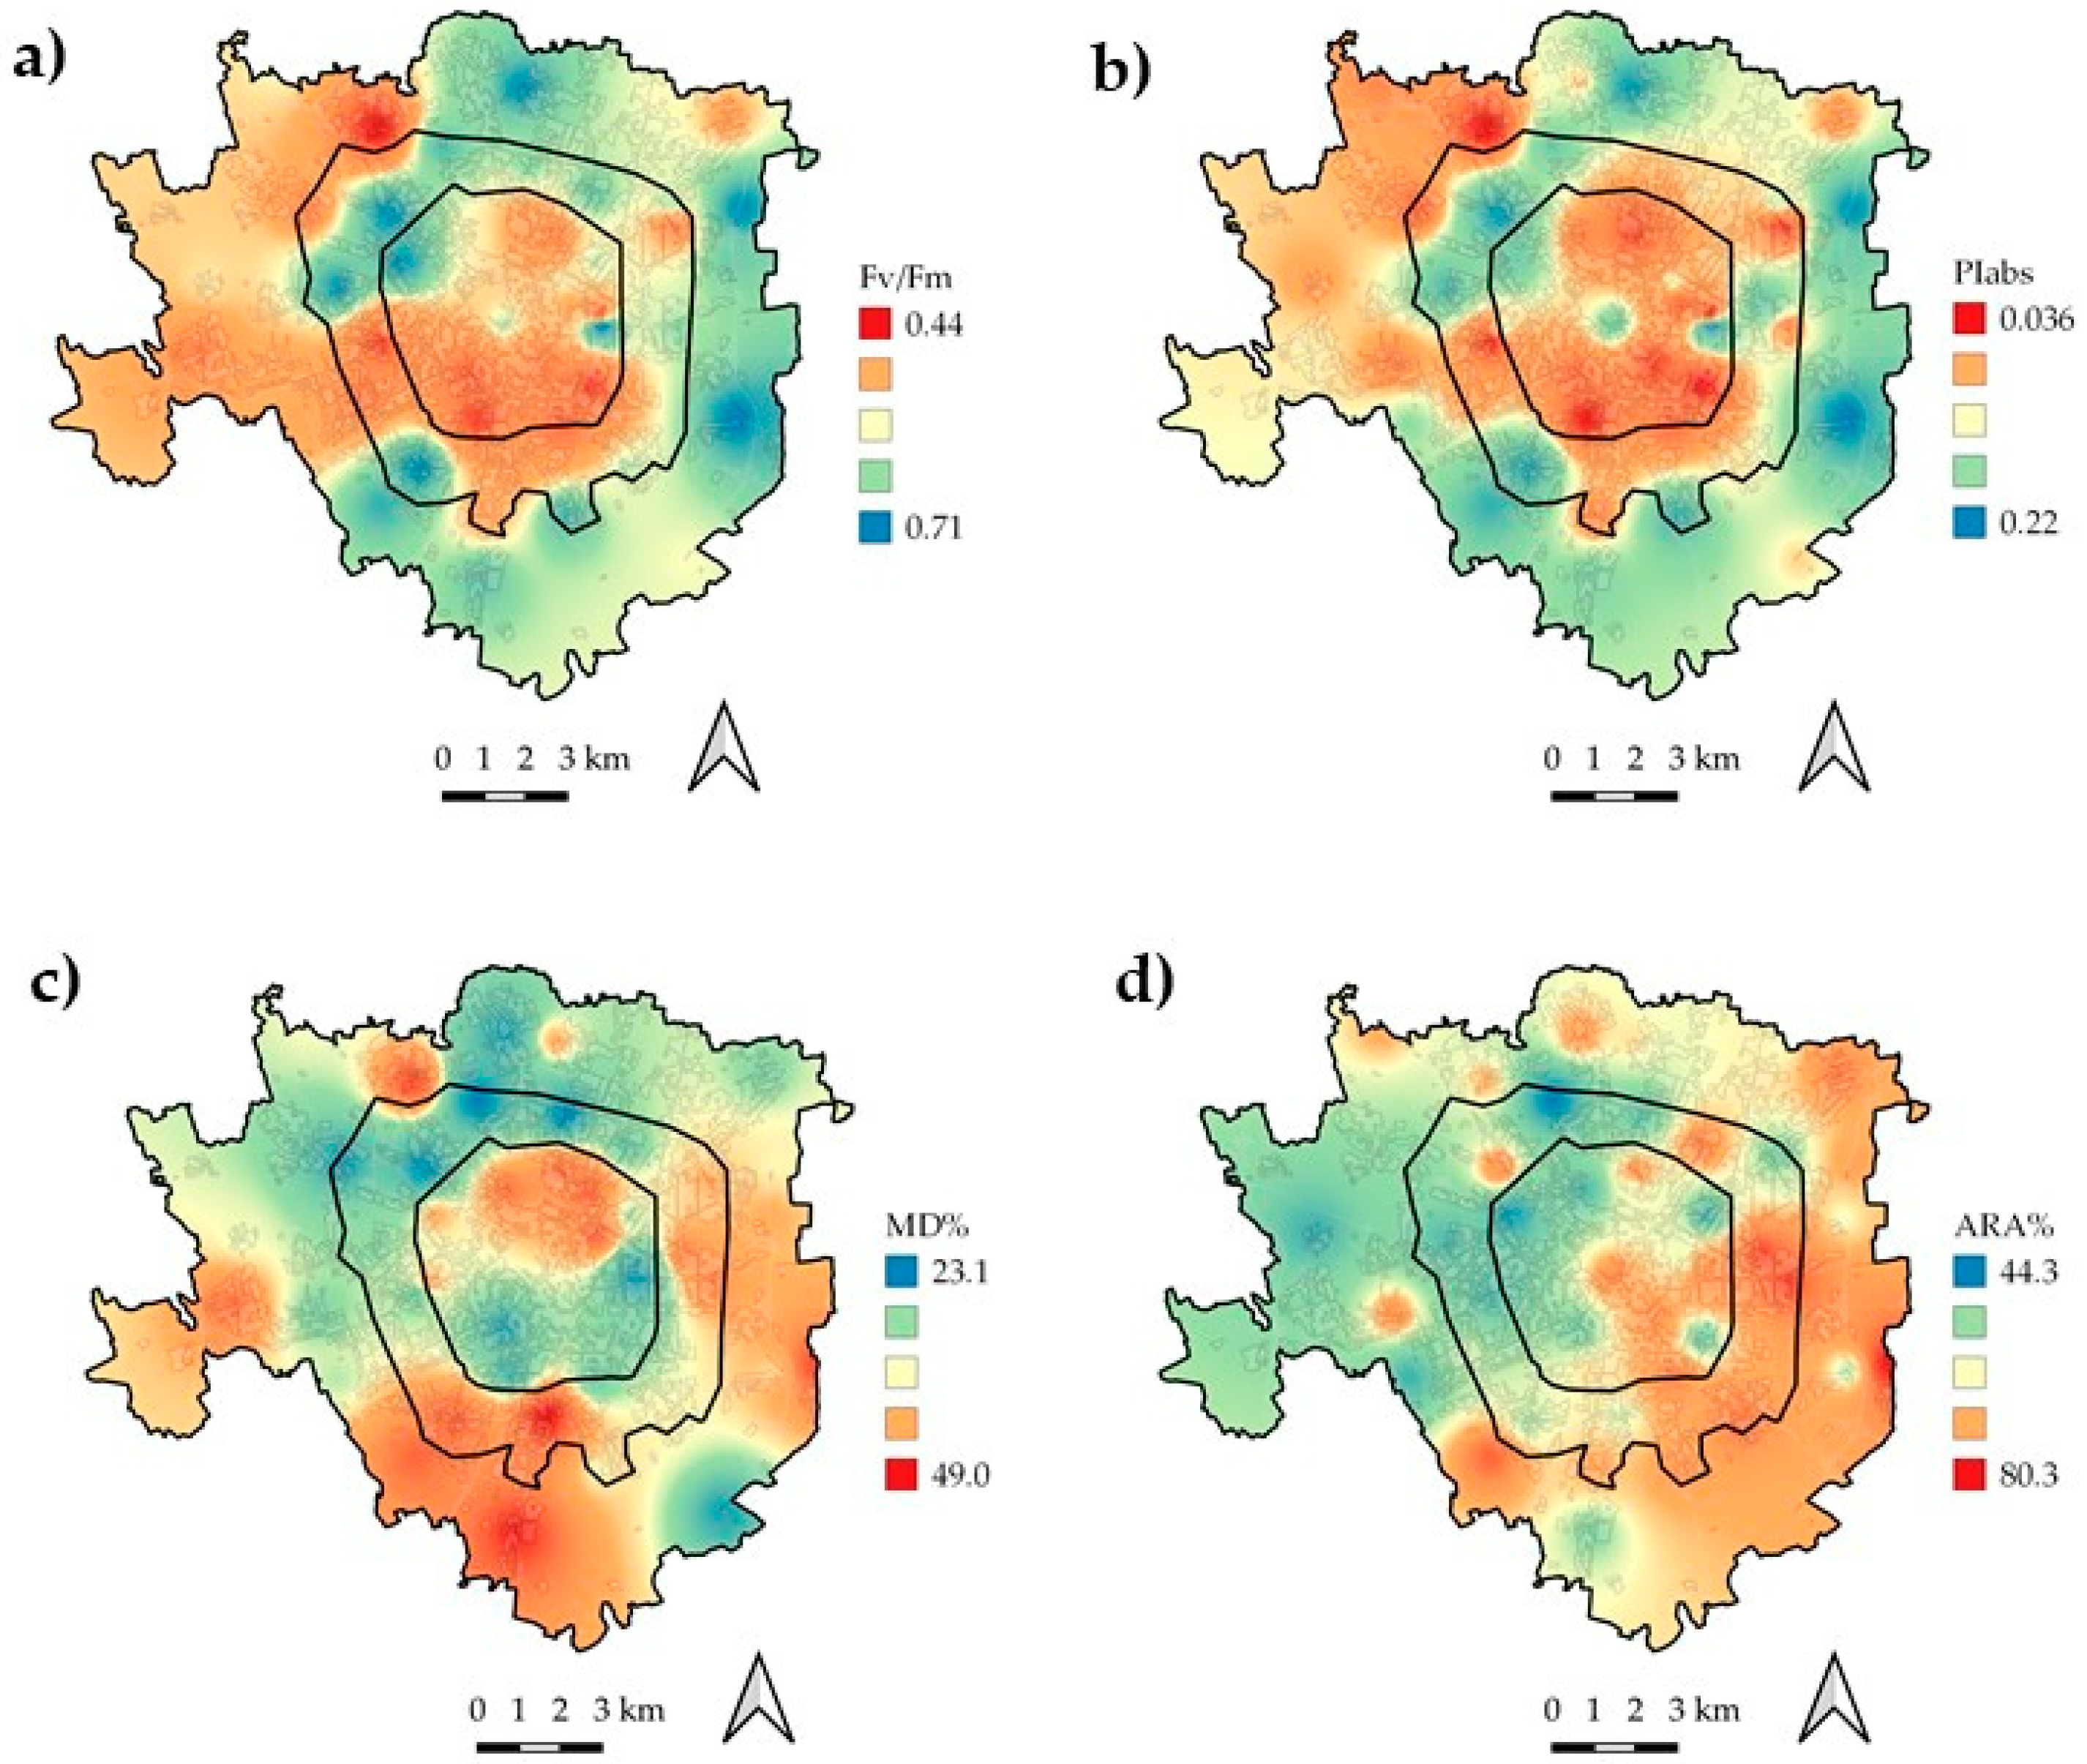
3. Results
4. Discussion
5. Conclusions
Author Contributions
Funding
Institutional Review Board Statement
Informed Consent Statement
Data Availability Statement
Conflicts of Interest
References
- Oberdörster, G.; Utell, M.J. Ultrafine Particles in the Urban Air: To the Respiratory Tract–and Beyond? Environ. Health Perspect. 2002, 110, A440–A441. [Google Scholar] [CrossRef]
- Medina, S.; Plasencia, A.; Ballester, F.; Mücke, H.G.; Schwartz, J. Apheis: Public Health Impact of PM10 in 19 European Cities. J. Epidemiol. Community Health 2004, 58, 831–836. [Google Scholar] [CrossRef] [PubMed] [Green Version]
- Valko, M.; Morris, H.; Cronin, M.T.D. Metals, Toxicity and Oxidative Stress. Curr. Med. Chem. 2005, 12, 1161–1208. [Google Scholar] [CrossRef] [PubMed] [Green Version]
- Sternbeck, J.; Sjödin, Å.; Andréasson, K. Metal Emissions from Road Traffic and the Influence of Resuspension—Results from Two Tunnel Studies. Atmos. Environ. 2002, 36, 4735–4744. [Google Scholar] [CrossRef]
- Fenger, J. Air Pollution in the Last 50 Years–From Local to Global. Atmos. Environ. 2009, 43, 13–22. [Google Scholar] [CrossRef]
- Purvis, O.; Pawlik-Skowrońska, B. Chapter 12. Lichens and Metals. British Mycological Society Symposia Series. In Stress in Yeasts and Filamentous Fungi; Academic Press: Cambridge, MA, USA, 2008; Volume 27, pp. 175–200. [Google Scholar]
- Hawksworth, D.L.; Rose, F. Qualitative Scale for Estimating Sulphur Dioxide Air Pollution in England and Wales Using Epiphytic Lichens. Nature 1970, 227, 145–148. [Google Scholar] [CrossRef] [PubMed]
- Søndergaard, J.; Bach, L.; Asmund, G. Modelling Atmospheric Bulk Deposition of Pb, Zn and Cd near a Former Pb–Zn Mine in West Greenland Using Transplanted Flavocetraria nivalis Lichens. Chemosphere 2013, 90, 2549–2556. [Google Scholar] [CrossRef]
- Occelli, F.; Bavdek, R.; Deram, A.; Hellequin, A.-P.; Cuny, M.-A.; Zwarterook, I.; Cuny, D. Using Lichen Biomonitoring to Assess Environmental Justice at a Neighbourhood Level in an Industrial Area of Northern France. Ecol. Indic. 2016, 60, 781–788. [Google Scholar] [CrossRef]
- Purvis, O.W.; Williamson, B.J.; Spiro, B.; Udachin, V.; Mikhailova, I.N.; Dolgopolova, A. Lichen Monitoring as a Potential Tool in Environmental Forensics: Case Study of the Cu Smelter and Former Mining Town of Karabash, Russia. Geol. Soc. Lond. Spec. Publ. 2013, 384, 133–146. [Google Scholar] [CrossRef] [Green Version]
- Garty, J.; Cohen, Y.; Kloog, N.; Karnieli, A. Effects of Air Pollution on Cell Membrane Integrity, Spectral Reflectance and Metal and Sulfur Concentrations in Lichens. Environ. Toxicol. Chem. 1997, 16, 1396–1402. [Google Scholar] [CrossRef]
- Gaio-Oliveira, G.; Dahlman, L.; Palmqvist, K.; Martins-Loução, M.A.; Máguas, C. Nitrogen Uptake in Relation to Excess Supply and Its Effects on the Lichens Evernia prunastri (L.) Ach and Xanthoria parietina (L.) Th. Fr. Planta 2005, 220, 794–803. [Google Scholar] [CrossRef] [PubMed]
- Pearson, L.; Skye, E. Air Pollution Affects Pattern of Photosynthesis in Parmelia sulcata, a Corticolous Lichen. Science 1965, 148, 1600–1602. [Google Scholar] [CrossRef] [PubMed]
- Cansaran-Duman, D.; Atakol, O.; Aras, S. Assessment of Air Pollution Genotoxicity by RAPD in Evernia prunastri L. Ach. from around Iron-Steel Factory in Karabük, Turkey. J. Environ. Sci. 2011, 23, 1171–1178. [Google Scholar] [CrossRef]
- Majumder, S.; Mishra, D.; Ram, S.S.; Jana, N.K.; Santra, S.; Sudarshan, M.; Chakraborty, A. Physiological and Chemical Response of the Lichen, Flavoparmelia caperata (L.) Hale, to the Urban Environment of Kolkata, India. Environ. Sci. Pollut. Res. 2013, 20, 3077–3085. [Google Scholar] [CrossRef]
- Kosanić, M.; Ranković, B. Antioxidant and Antimicrobial Properties of Some Lichens and Their Constituents. J. Med. Food 2011, 14, 1624–1630. [Google Scholar] [CrossRef]
- Nimis, P.L.; Castello, M.; Perotti, M. Lichens as Biomonitors of Sulphur Dioxide Pollution in La Spezia (Northern Italy). Lichenologist 1990, 22, 333–344. [Google Scholar] [CrossRef]
- Carreras, H.A.; Pignata, M.L. Biomonitoring of Heavy Metals and Air Quality in Cordoba City, Argentina, Using Transplanted Lichens. Environ. Pollut. 2002, 117, 77–87. [Google Scholar] [CrossRef]
- Loppi, S.; Ravera, S.; Paoli, L. Coping with Uncertainty in the Assessment of Atmospheric Pollution with Lichen Transplants. Environ. Forensics 2019, 20, 228–233. [Google Scholar] [CrossRef]
- European Environment Agency. Air Quality in Europe: 2015 Report; Publications Office of the European Union: Luxembourg, 2015. [Google Scholar]
- Invernizzi, G.; Ruprecht, A.; Mazza, R.; De Marco, C.; Močnik, G.; Sioutas, C.; Westerdahl, D. Measurement of Black Carbon Concentration as an Indicator of Air Quality Benefits of Traffic Restriction Policies within the Ecopass Zone in Milan, Italy. Atmos. Environ. 2011, 45, 3522–3527. [Google Scholar] [CrossRef]
- Percoco, M. Is Road Pricing Effective in Abating Pollution? Evidence from Milan. Transp. Res. Part Transp. Environ. 2013, 25, 112–118. [Google Scholar] [CrossRef]
- Luè, A.; Colorni, A.; Nocerino, R.; Paruscio, V. Green Move: An Innovative Electric Vehicle-Sharing System. Procedia-Soc. Behav. Sci. 2012, 48, 2978–2987. [Google Scholar] [CrossRef] [Green Version]
- Vannini, A.; Paoli, L.; Nicolardi, V.; Di Lella, L.A.; Loppi, S. Seasonal Variations in Intracellular Trace Element Content and Physiological Parameters in the Lichen Evernia prunastri Transplanted to an Urban Environment. Acta Bot. Croat. 2017, 76, 171–176. [Google Scholar] [CrossRef] [Green Version]
- El Rhzaoui, G.; Divakar, P.K.; Crespo, A.; Tahiri, H. Biomonitoring of Air Pollutants by Using Lichens (Evernia prunastri) in Areas between Kenitra and Mohammedia Cities in Morocco. Mediterr. Bot. 2015, 36, 21. [Google Scholar] [CrossRef] [Green Version]
- McCune, B.; Derr, C.C.; Muir, P.S.; Shirazi, A.; Sillett, S.C.; Daly, W.J. Lichen Pendants for Transplant and Growth Experiments. Lichenologist 1996, 28, 161. [Google Scholar] [CrossRef]
- Paoli, L.; Munzi, S.; Pisani, T.; Guttová, A.; Loppi, S. Freezing of Air-Dried Samples of the Lichen Evernia Prunastri (L.) Ach. Ensures That Thalli Remain Healthy for Later Physiological Measurements. Plant Biosyst.-Int. J. Deal. Asp. Plant Biol. 2013, 147, 141–144. [Google Scholar] [CrossRef]
- Contardo, T.; Vannini, A.; Sharma, K.; Giordani, P.; Loppi, S. Disentangling Sources of Trace Element Air Pollution in Complex Urban Areas by Lichen Biomonitoring. A Case Study in Milan (Italy). Chemosphere 2020, 256, 127155. [Google Scholar] [CrossRef] [PubMed]
- Strasser, R.J.; Tsimilli-Michael, M.; Srivastava, A. Analysis of the chlorophyll a fluorescence transient. In Chlorophyll a Fluorescence; Springer: Berlin/Heidelberg, Germany, 2004; pp. 321–362. [Google Scholar]
- Paoli, L.; Munzi, S.; Guttová, A.; Senko, D.; Sardella, G.; Loppi, S. Lichens as Suitable Indicators of the Biological Effects of Atmospheric Pollutants around a Municipal Solid Waste Incinerator (S Italy). Ecol. Indic. 2015, 52, 362–370. [Google Scholar] [CrossRef]
- Malaspina, P.; Giordani, P.; Pastorino, G.; Modenesi, P.; Mariotti, M.G. Interaction of Sea Salt and Atmospheric Pollution Alters the OJIP Fluorescence Transient in the Lichen Pseudevernia furfuracea (L.) Zopf. Ecol. Indic. 2015, 50, 251–257. [Google Scholar] [CrossRef]
- Malaspina, P.; Modenesi, P.; Giordani, P. Physiological Response of Two Varieties of the Lichen Pseudevernia furfuracea to Atmospheric Pollution. Ecol. Indic. 2018, 86, 27–34. [Google Scholar] [CrossRef]
- Marante, F.T.; Castellano, A.G.; Rosas, F.E.; Aguiar, J.Q.; Barrera, J.B. Identification and Quantitation of Allelochemicals from the Lichen Lethariella canariensis: Phytotoxicity and Antioxidative Activity. J. Chem. Ecol. 2003, 29, 2049–2071. [Google Scholar] [CrossRef] [PubMed]
- Staples, R.; LaDuca, R.L.; Roze, L.V.; Laivenieks, M.; Linz, J.E.; Beaudry, R.; Fryday, A.; Schilmiller, A.L.; Koptina, A.V.; Smith, B. Structure and Chemical Analysis of Major Specialized Metabolites Produced by the Lichen Evernia prunastri. Chem. Biodivers. 2020, 17, e1900465. [Google Scholar] [CrossRef] [PubMed]
- Winkler, A.; Contardo, T.; Vannini, A.; Sorbo, S.; Basile, A.; Loppi, S. Magnetic Emissions from Brake Wear Are the Major Source of Airborne Particulate Matter Bioaccumulated by Lichens Exposed in Milan (Italy). Appl. Sci. 2020, 10, 2073. [Google Scholar] [CrossRef] [Green Version]
- Garty, J.; Galun, M.; Kessel, M. Localization of Heavy Metals and Other Elements Accumulated in the Lichen Thallus. New Phytol. 1979, 82, 159–168. [Google Scholar] [CrossRef]
- Branquinho, C.; Brown, D.H.; Catarino, F. The Cellular Location of Cu in Lichens and Its Effects on Membrane Integrity and Chlorophyll Fluorescence. Environ. Exp. Bot. 1997, 38, 165–179. [Google Scholar] [CrossRef]
- Vannini, A.; Paoli, L.; Russo, A.; Loppi, S. Contribution of Submicronic (PM1) and Coarse (PM > 1) Particulate Matter Deposition to the Heavy Metal Load of Lichens Transplanted along a Busy Road. Chemosphere 2019, 231, 121–125. [Google Scholar] [CrossRef]
- Rola, K. Insight into the Pattern of Heavy-Metal Accumulation in Lichen Thalli. J. Trace Elem. Med. Biol. 2020, 61, 126512. [Google Scholar] [CrossRef]
- Hauck, M.; Willenbruch, K.; Leuschner, C. Lichen Substances Prevent Lichens from Nutrient Deficiency. J. Chem. Ecol. 2009, 35, 71–73. [Google Scholar] [CrossRef] [Green Version]
- Puckett, K.J. The Effect of Heavy Metals on Some Aspects of Lichen Physiology. Can. J. Bot. 1976, 54, 2695–2703. [Google Scholar] [CrossRef]
- Godinho, R.M.; Freitas, M.C.; Wolterbeek, H.T. Assessment of Lichen Vitality during a Transplantation Experiment to a Polluted Site. J. Atmos. Chem. 2004, 49, 355–361. [Google Scholar] [CrossRef]
- Koolen, C.D.; Rothenberg, G. Air Pollution in Europe. Chemsuschem 2019, 12, 164–172. [Google Scholar] [CrossRef] [PubMed]
- La Gaccia, L.; Colombi, C.; Algieri, A.; Chiesa, M.; Cigolini, G.; Corbella, L.; Gianelle, V. Rapporto Sulla Qualità dell’Aria della Città Mteropolitana di Milano. 2019. Available online: https://www.arpalombardia.it/qariafiles/RelazioniAnnuali/RQA_MI_2019.pdf (accessed on 11 August 2021).
- World Health Organization. Guidelines for Air Quality; World Health Organization: Geneva, Switzerland, 2000. [Google Scholar]
- Davies, L.; Bates, J.W.; Bell, J.N.B.; James, P.W.; Purvis, O.W. Diversity and Sensitivity of Epiphytes to Oxides of Nitrogen in London. Environ. Pollut. 2007, 146, 299–310. [Google Scholar] [CrossRef] [PubMed]
- Linee guida per la predisposizione delle reti di monitoraggio della qualità dell’aria in Italia. Available online: https://www.isprambiente.gov.it/files/aria/lineeguidaretimonitoraggio.pdf (accessed on 11 August 2021).
- Kosanić, M.; Manojlović, N.; Janković, S.; Stanojković, T.; Ranković, B. Evernia prunastri and Pseudoevernia furfuraceae Lichens and Their Major Metabolites as Antioxidant, Antimicrobial and Anticancer Agents. Food Chem. Toxicol. 2013, 53, 112–118. [Google Scholar] [CrossRef]
- Valencia-Islas, N.; Zambrano, A.; Rojas, J.L. Ozone Reactivity and Free Radical Scavenging Behavior of Phenolic Secondary Metabolites in Lichens Exposed to Chronic Oxidant Air Pollution from Mexico City. J. Chem. Ecol. 2007, 33, 1619–1634. [Google Scholar] [CrossRef]
- Von Arb, C.; Mueller, C.; Ammann, K.; Brunold, C. Lichen Physiology and Air Pollution: II. Statistical Analysis of the Correlation between SO2, NO2, NO and O3, and Chlorophyll Content, Net Photosynthesis, Sulphate Uptake and Protein Synthesis of Parmelia Sulcata Taylor. New Phytol. 1990, 115, 431–437. [Google Scholar] [CrossRef]
- Sujetoviene, G.; Sliumpaite, I. Response of Evernia prunastri Transplanted to an Urban Area in Central Lithuania. Atmos. Pollut. Res. 2013, 4, 222–228. [Google Scholar] [CrossRef] [Green Version]
- Fenn, M.E.; Bytnerowicz, A.; Schilling, S.L.; Vallano, D.M.; Zavaleta, E.S.; Weiss, S.B.; Morozumi, C.; Geiser, L.H.; Hanks, K. On-Road Emissions of Ammonia: An Underappreciated Source of Atmospheric Nitrogen Deposition. Sci. Total Environ. 2018, 625, 909–919. [Google Scholar] [CrossRef] [PubMed] [Green Version]
- Paoli, L.; Benesperi, R.; Proietti Pannunzi, D.; Corsini, A.; Loppi, S. Biological Effects of Ammonia Released from a Composting Plant Assessed with Lichens. Environ. Sci. Pollut. Res. 2014, 21, 5861–5872. [Google Scholar] [CrossRef]
- Riddell, J.; Nash, T.H.; Padgett, P. The Effect of HNO3 Gas on the Lichen Ramalina menziesii. Flora-Morphol. Distrib. Funct. Ecol. Plants 2008, 203, 47–54. [Google Scholar] [CrossRef]
- Jovan, S.; Riddell, J.; Padgett, P.E.; Nash, T.H. Eutrophic Lichens Respond to Multiple Forms of N: Implications for Critical Levels and Critical Loads Research. Ecol. Appl. 2012, 22, 1910–1922. [Google Scholar] [CrossRef]


| Control | Exposed | |
|---|---|---|
| Cr | 1.67 ± 0.09 | 3.63 ± 0.90 |
| Cu | 3.79 ± 0.03 | 16.6 ± 8.6 |
| Fe | 442 ± 10 | 837 ± 214 |
| Pb | 1.96 ± 0.08 | 5.84 ± 2.39 |
| Sb | 0.11 ± 0.01 | 0.76 ± 0.32 |
| Cr | Cu | Fe | Pb | Sb | CI | |
|---|---|---|---|---|---|---|
| FV/FM | −0.17 | −0.12 | −0.23 | 0.02 | −0.08 | −0.11 |
| PIABS | −0.20 | −0.18 | −0.26 | −0.04 | −0.10 | −0.18 |
| MD | 0.22 | 0.28 * | 0.22 | −0.11 | 0.14 | 0.17 |
| ARA | −0.05 | 0.07 | −0.10 | −0.22 | −0.17 | −0.13 |
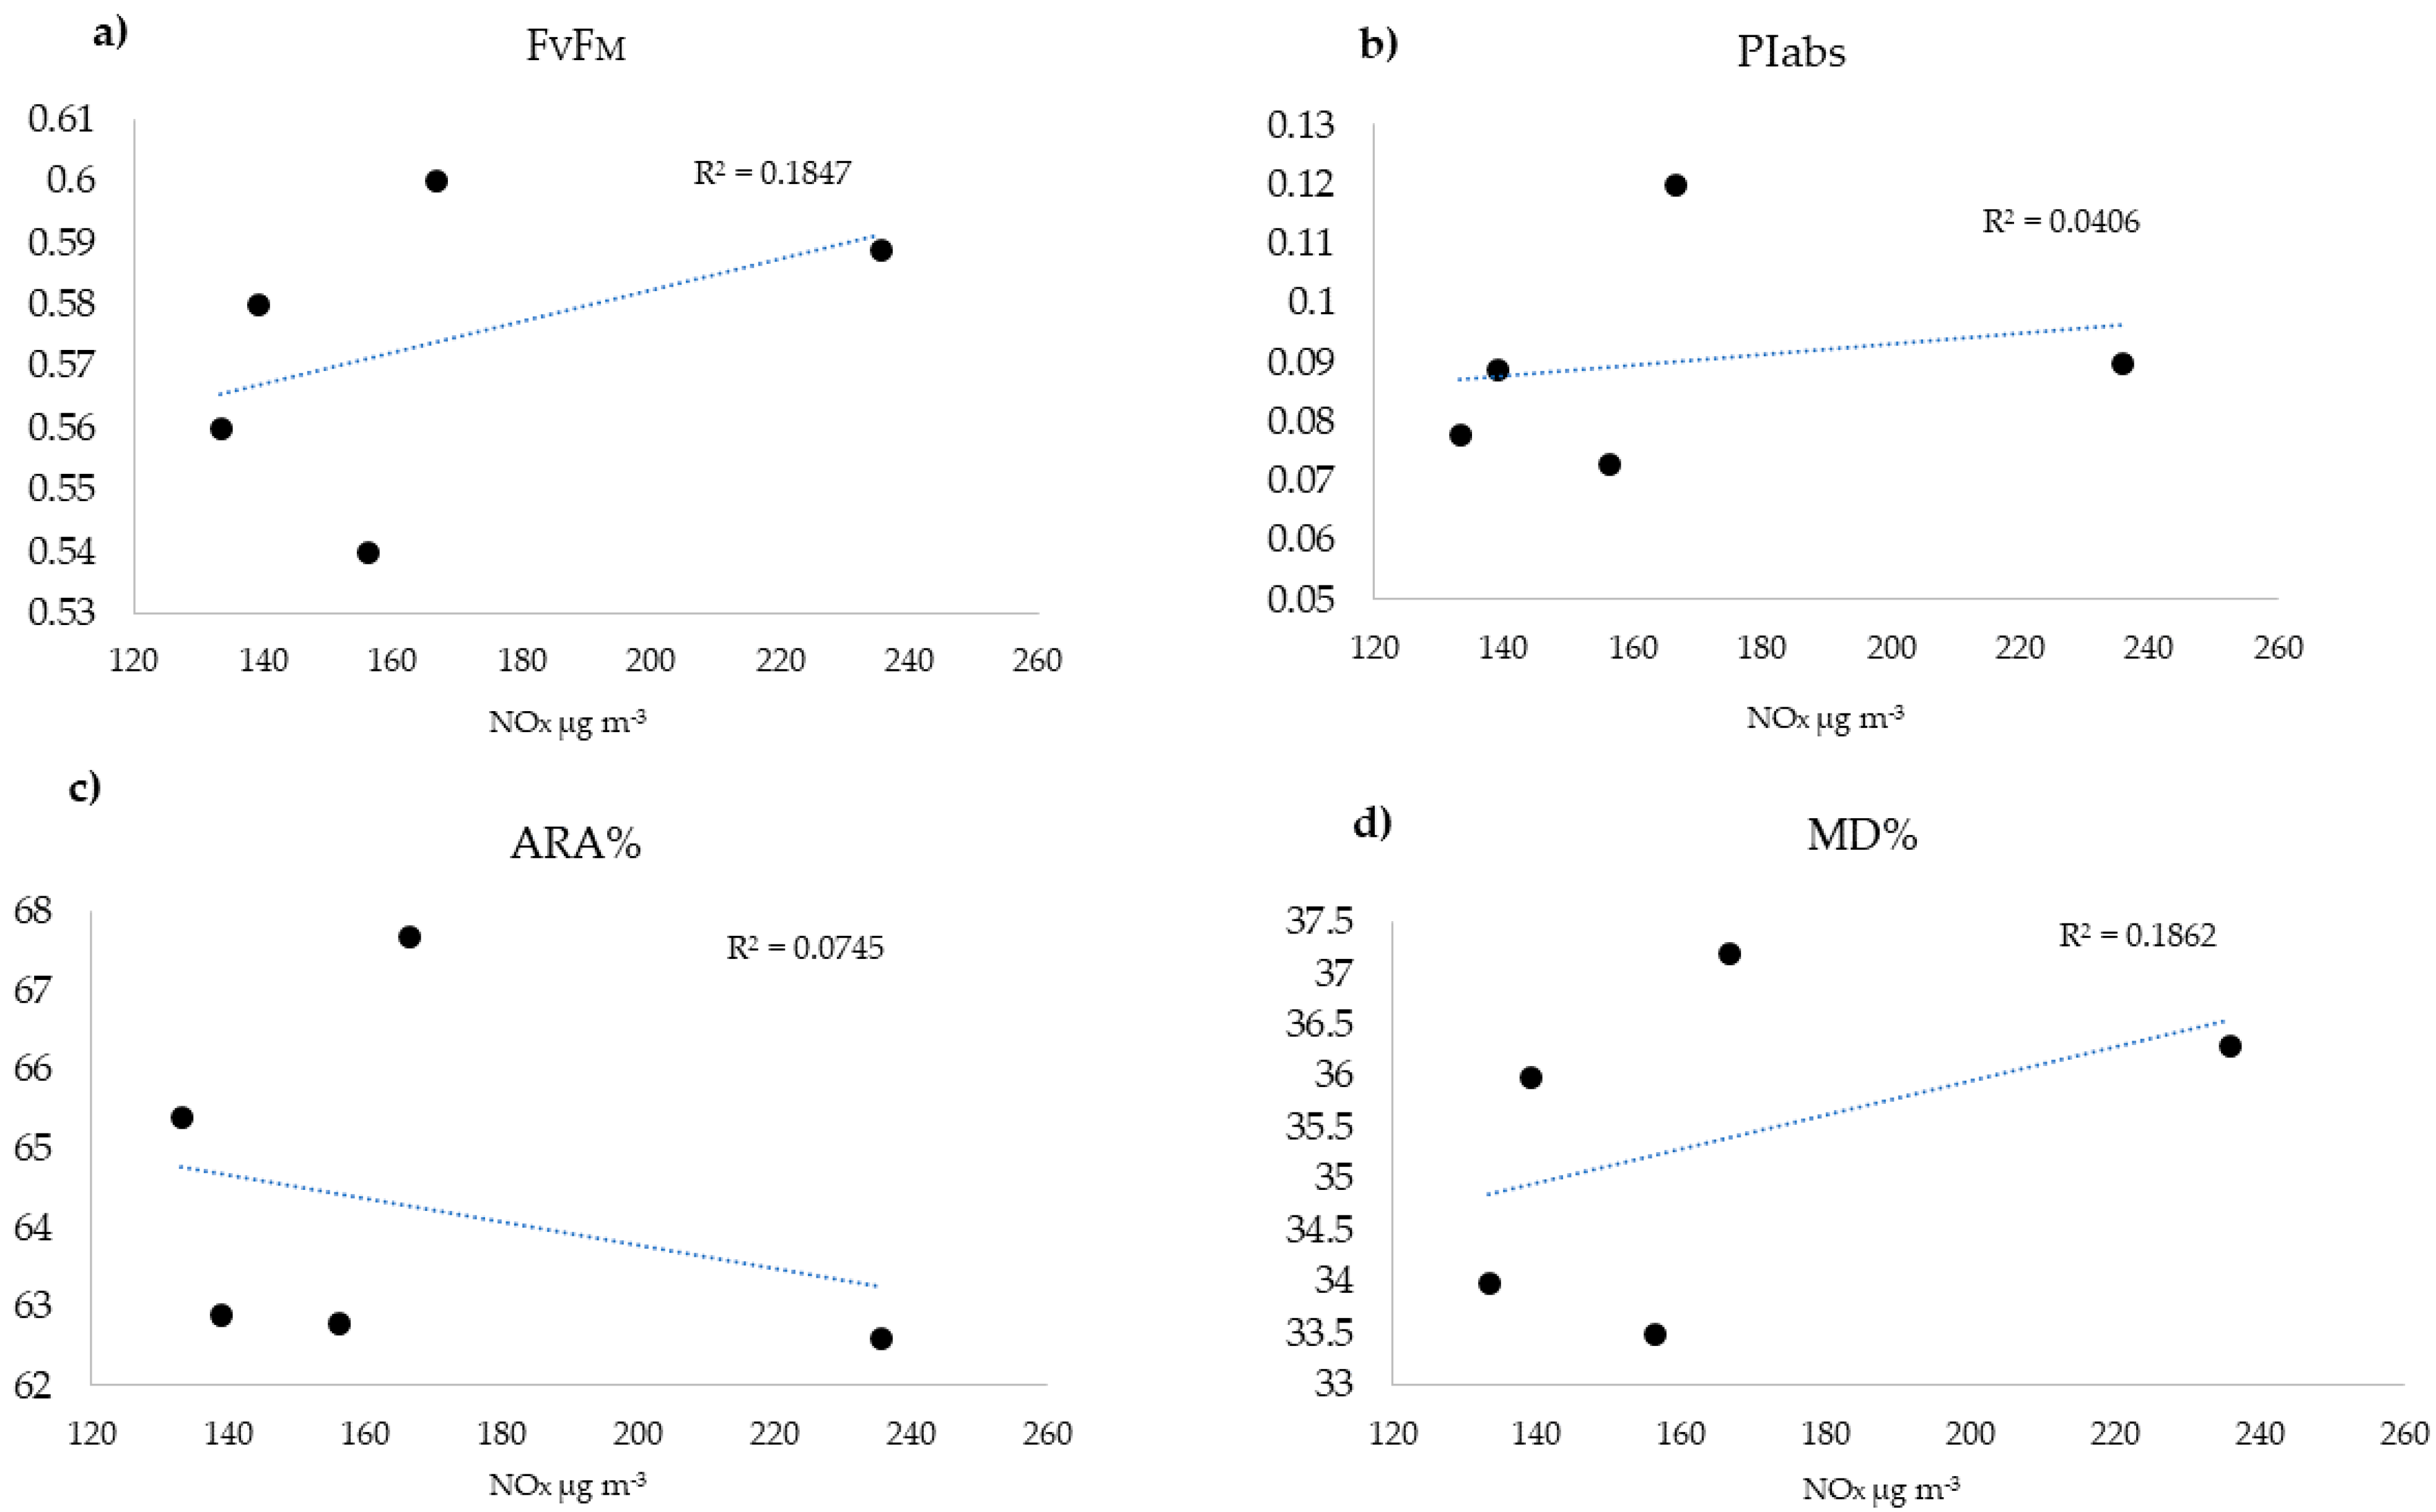
| Monitoring Station | NOx | FVFM | PIabs | ARA | MD |
|---|---|---|---|---|---|
| SE | 138.95 | 0.58 | 0.089 | 62.9 | 36.0 |
| MA | 235.67 | 0.589 | 0.090 | 62.6 | 36.3 |
| LI | 156.22 | 0.54 | 0.073 | 62.8 | 33.5 |
| PA | 166.59 | 0.60 | 0.12 | 67.7 | 37.2 |
| VE | 133.17 | 0.56 | 0.078 | 65.4 | 34.0 |
Publisher’s Note: MDPI stays neutral with regard to jurisdictional claims in published maps and institutional affiliations. |
© 2021 by the authors. Licensee MDPI, Basel, Switzerland. This article is an open access article distributed under the terms and conditions of the Creative Commons Attribution (CC BY) license (https://creativecommons.org/licenses/by/4.0/).
Share and Cite
Contardo, T.; Gazzotti, S.; Ortenzi, M.A.; Vannini, A.; Loppi, S. Biological Effects of Air Pollution on Sensitive Bioindicators: A Case Study from Milan, Italy. Urban Sci. 2021, 5, 64. https://0-doi-org.brum.beds.ac.uk/10.3390/urbansci5030064
Contardo T, Gazzotti S, Ortenzi MA, Vannini A, Loppi S. Biological Effects of Air Pollution on Sensitive Bioindicators: A Case Study from Milan, Italy. Urban Science. 2021; 5(3):64. https://0-doi-org.brum.beds.ac.uk/10.3390/urbansci5030064
Chicago/Turabian StyleContardo, Tania, Stefano Gazzotti, Marco Aldo Ortenzi, Andrea Vannini, and Stefano Loppi. 2021. "Biological Effects of Air Pollution on Sensitive Bioindicators: A Case Study from Milan, Italy" Urban Science 5, no. 3: 64. https://0-doi-org.brum.beds.ac.uk/10.3390/urbansci5030064