
Dengue, Chikungunya, and Zika: Spatial and Temporal Distribution in Rio de Janeiro State, 2015–2019

 ,
,
Abstract
:1. Introduction
2. Material and Methods
2.1. Study Design
Ethics Committee
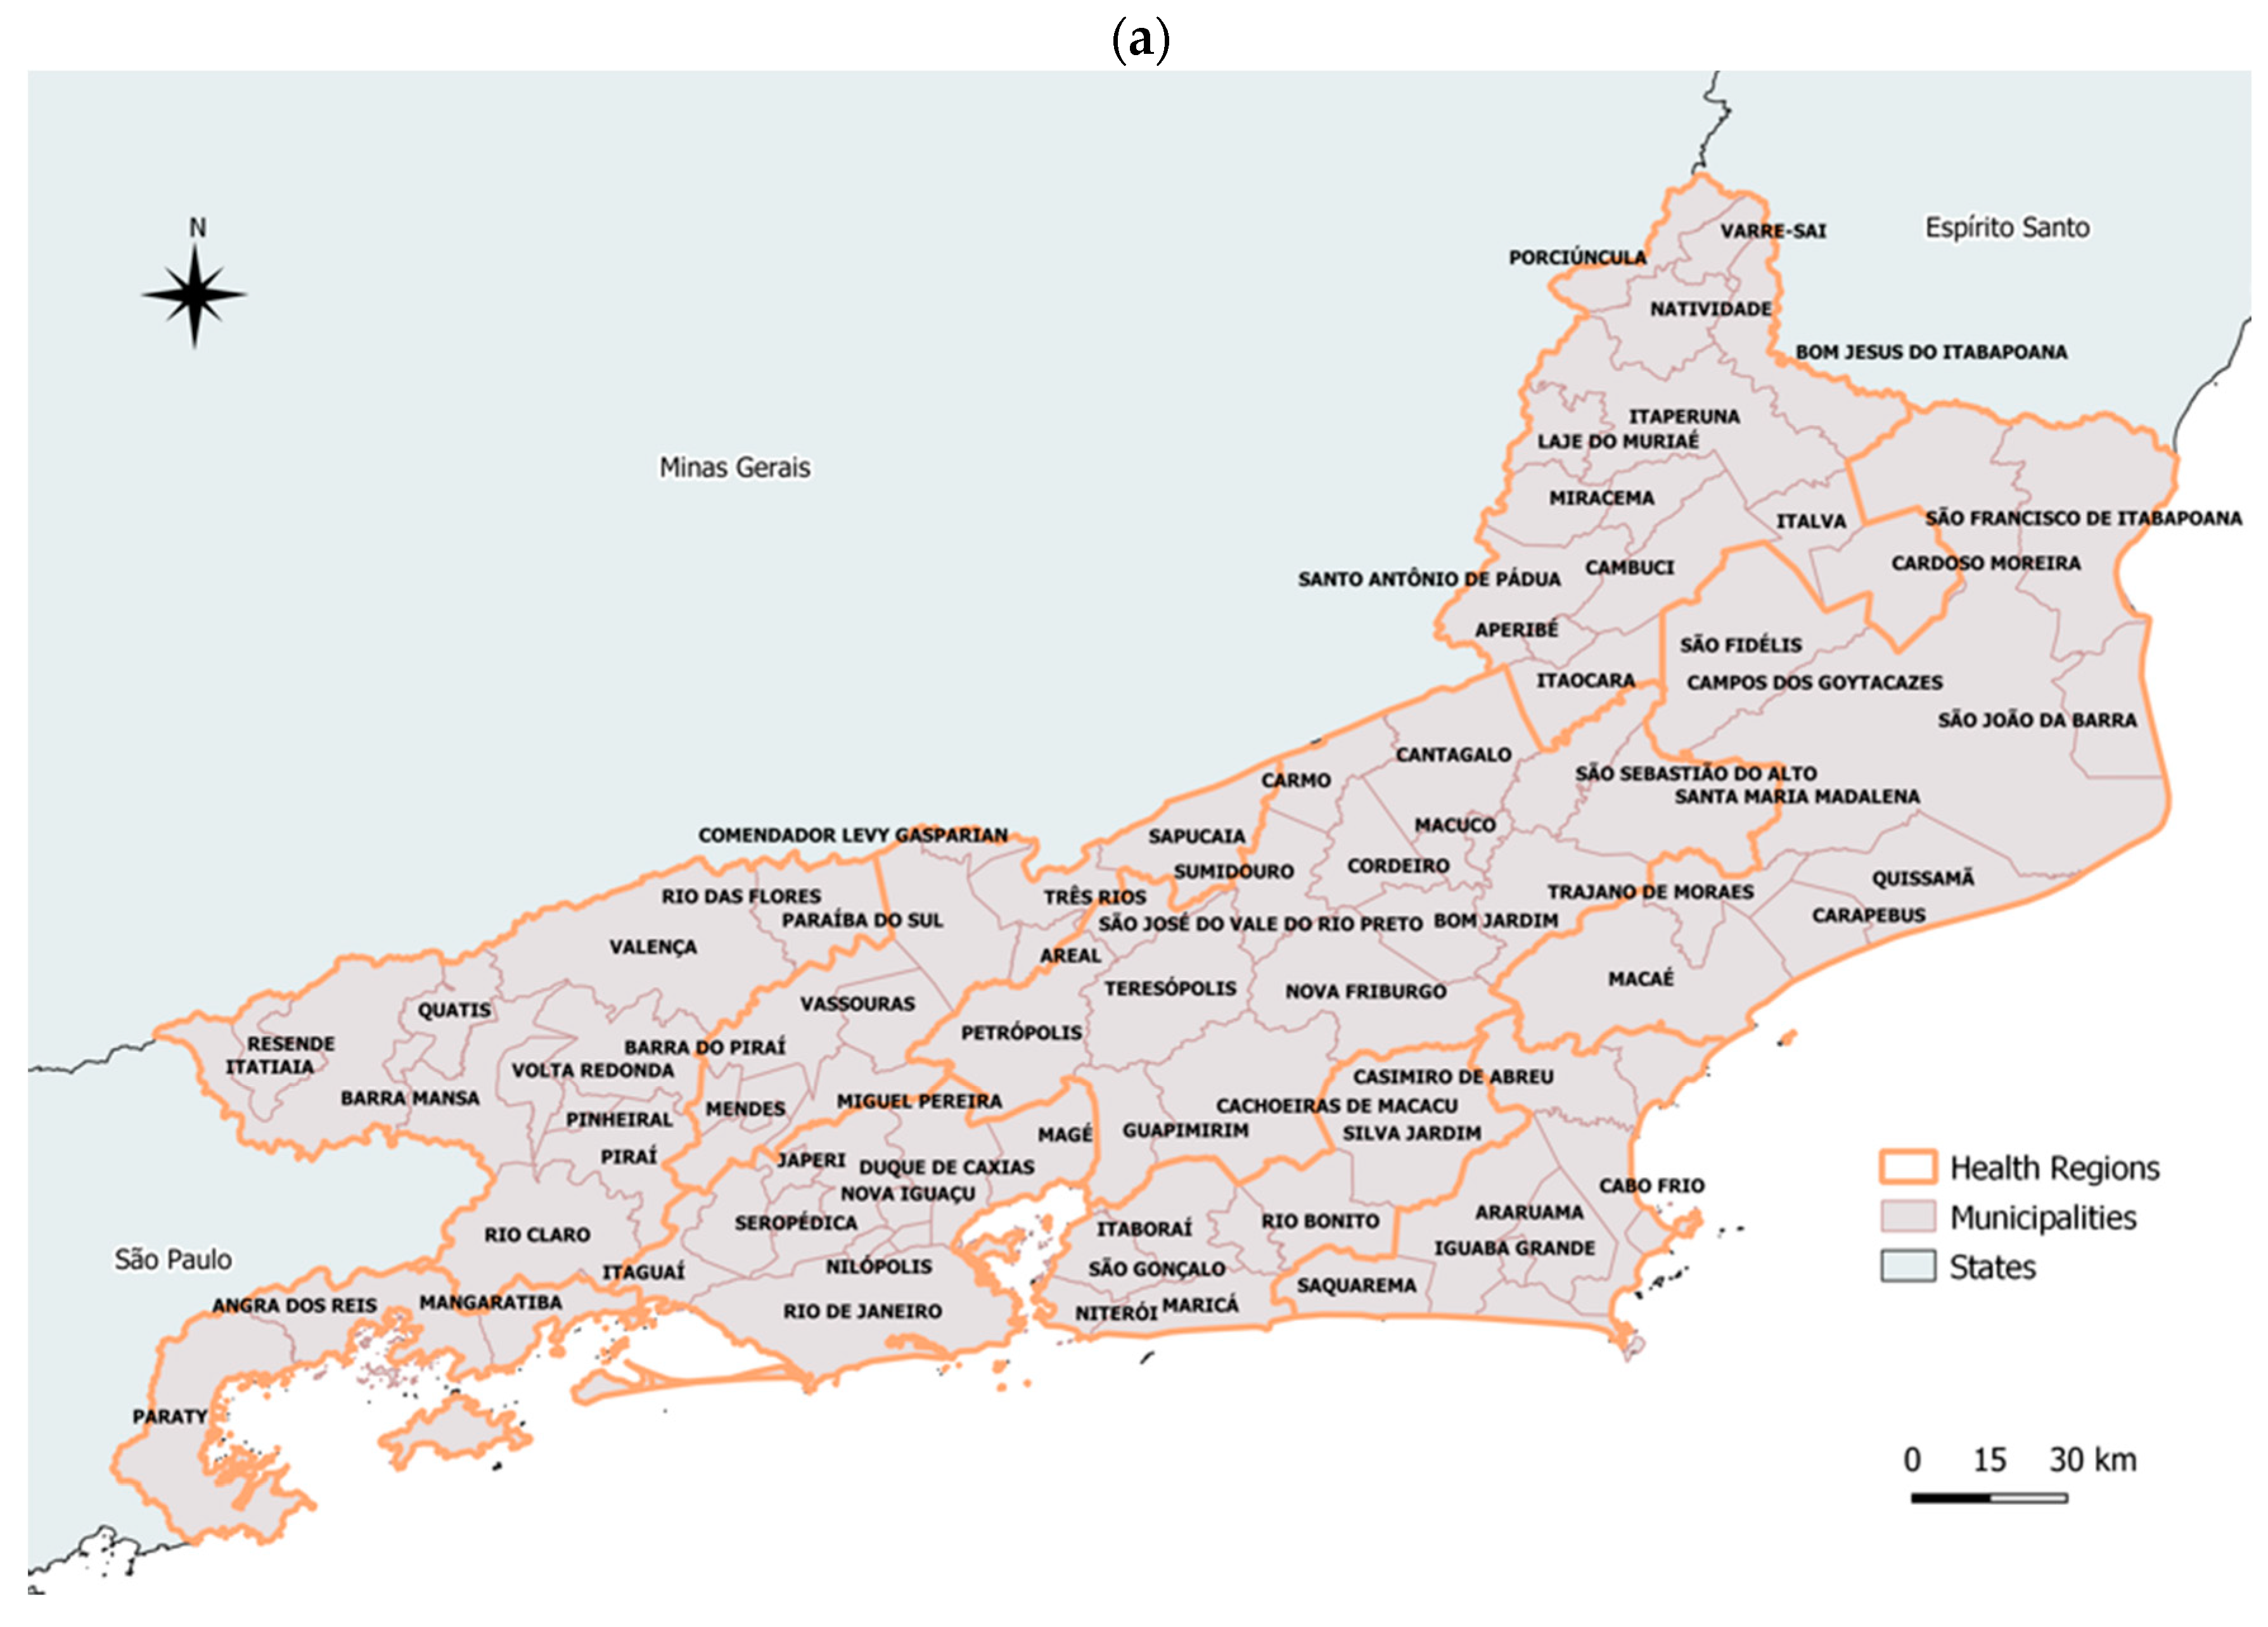
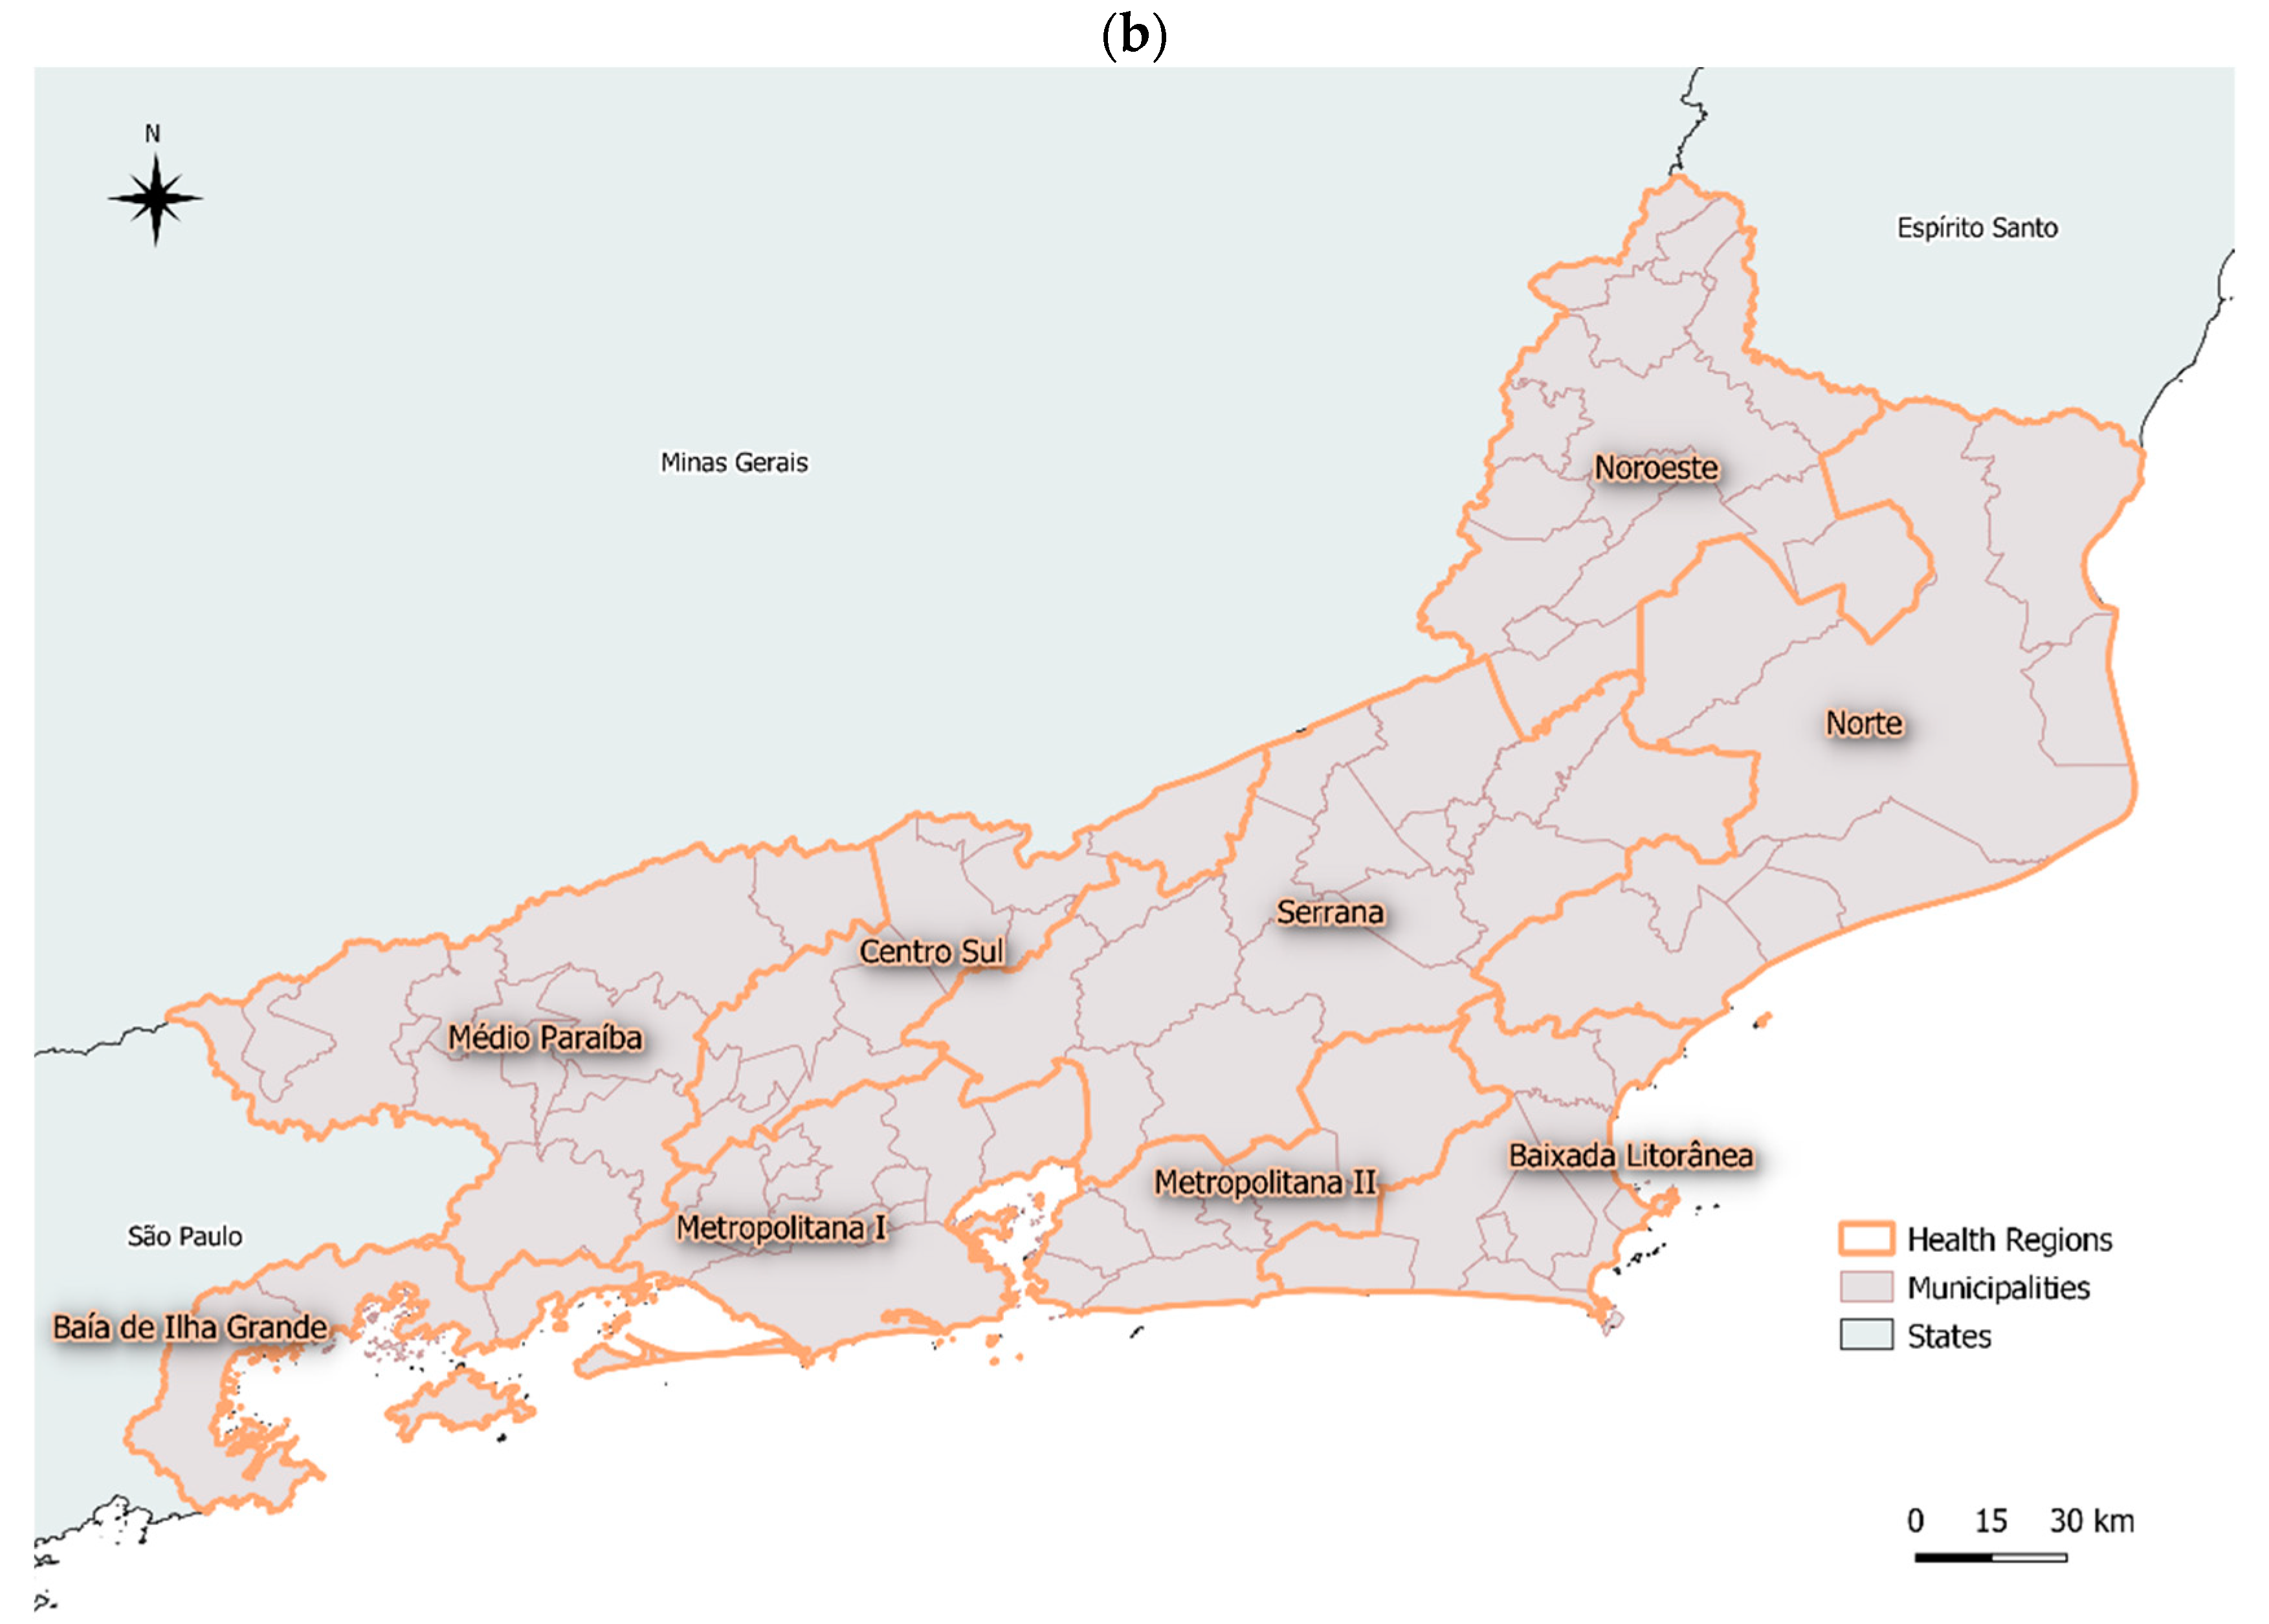
2.2. Study Area
2.3. Data Source
2.4. Statistical Analysis
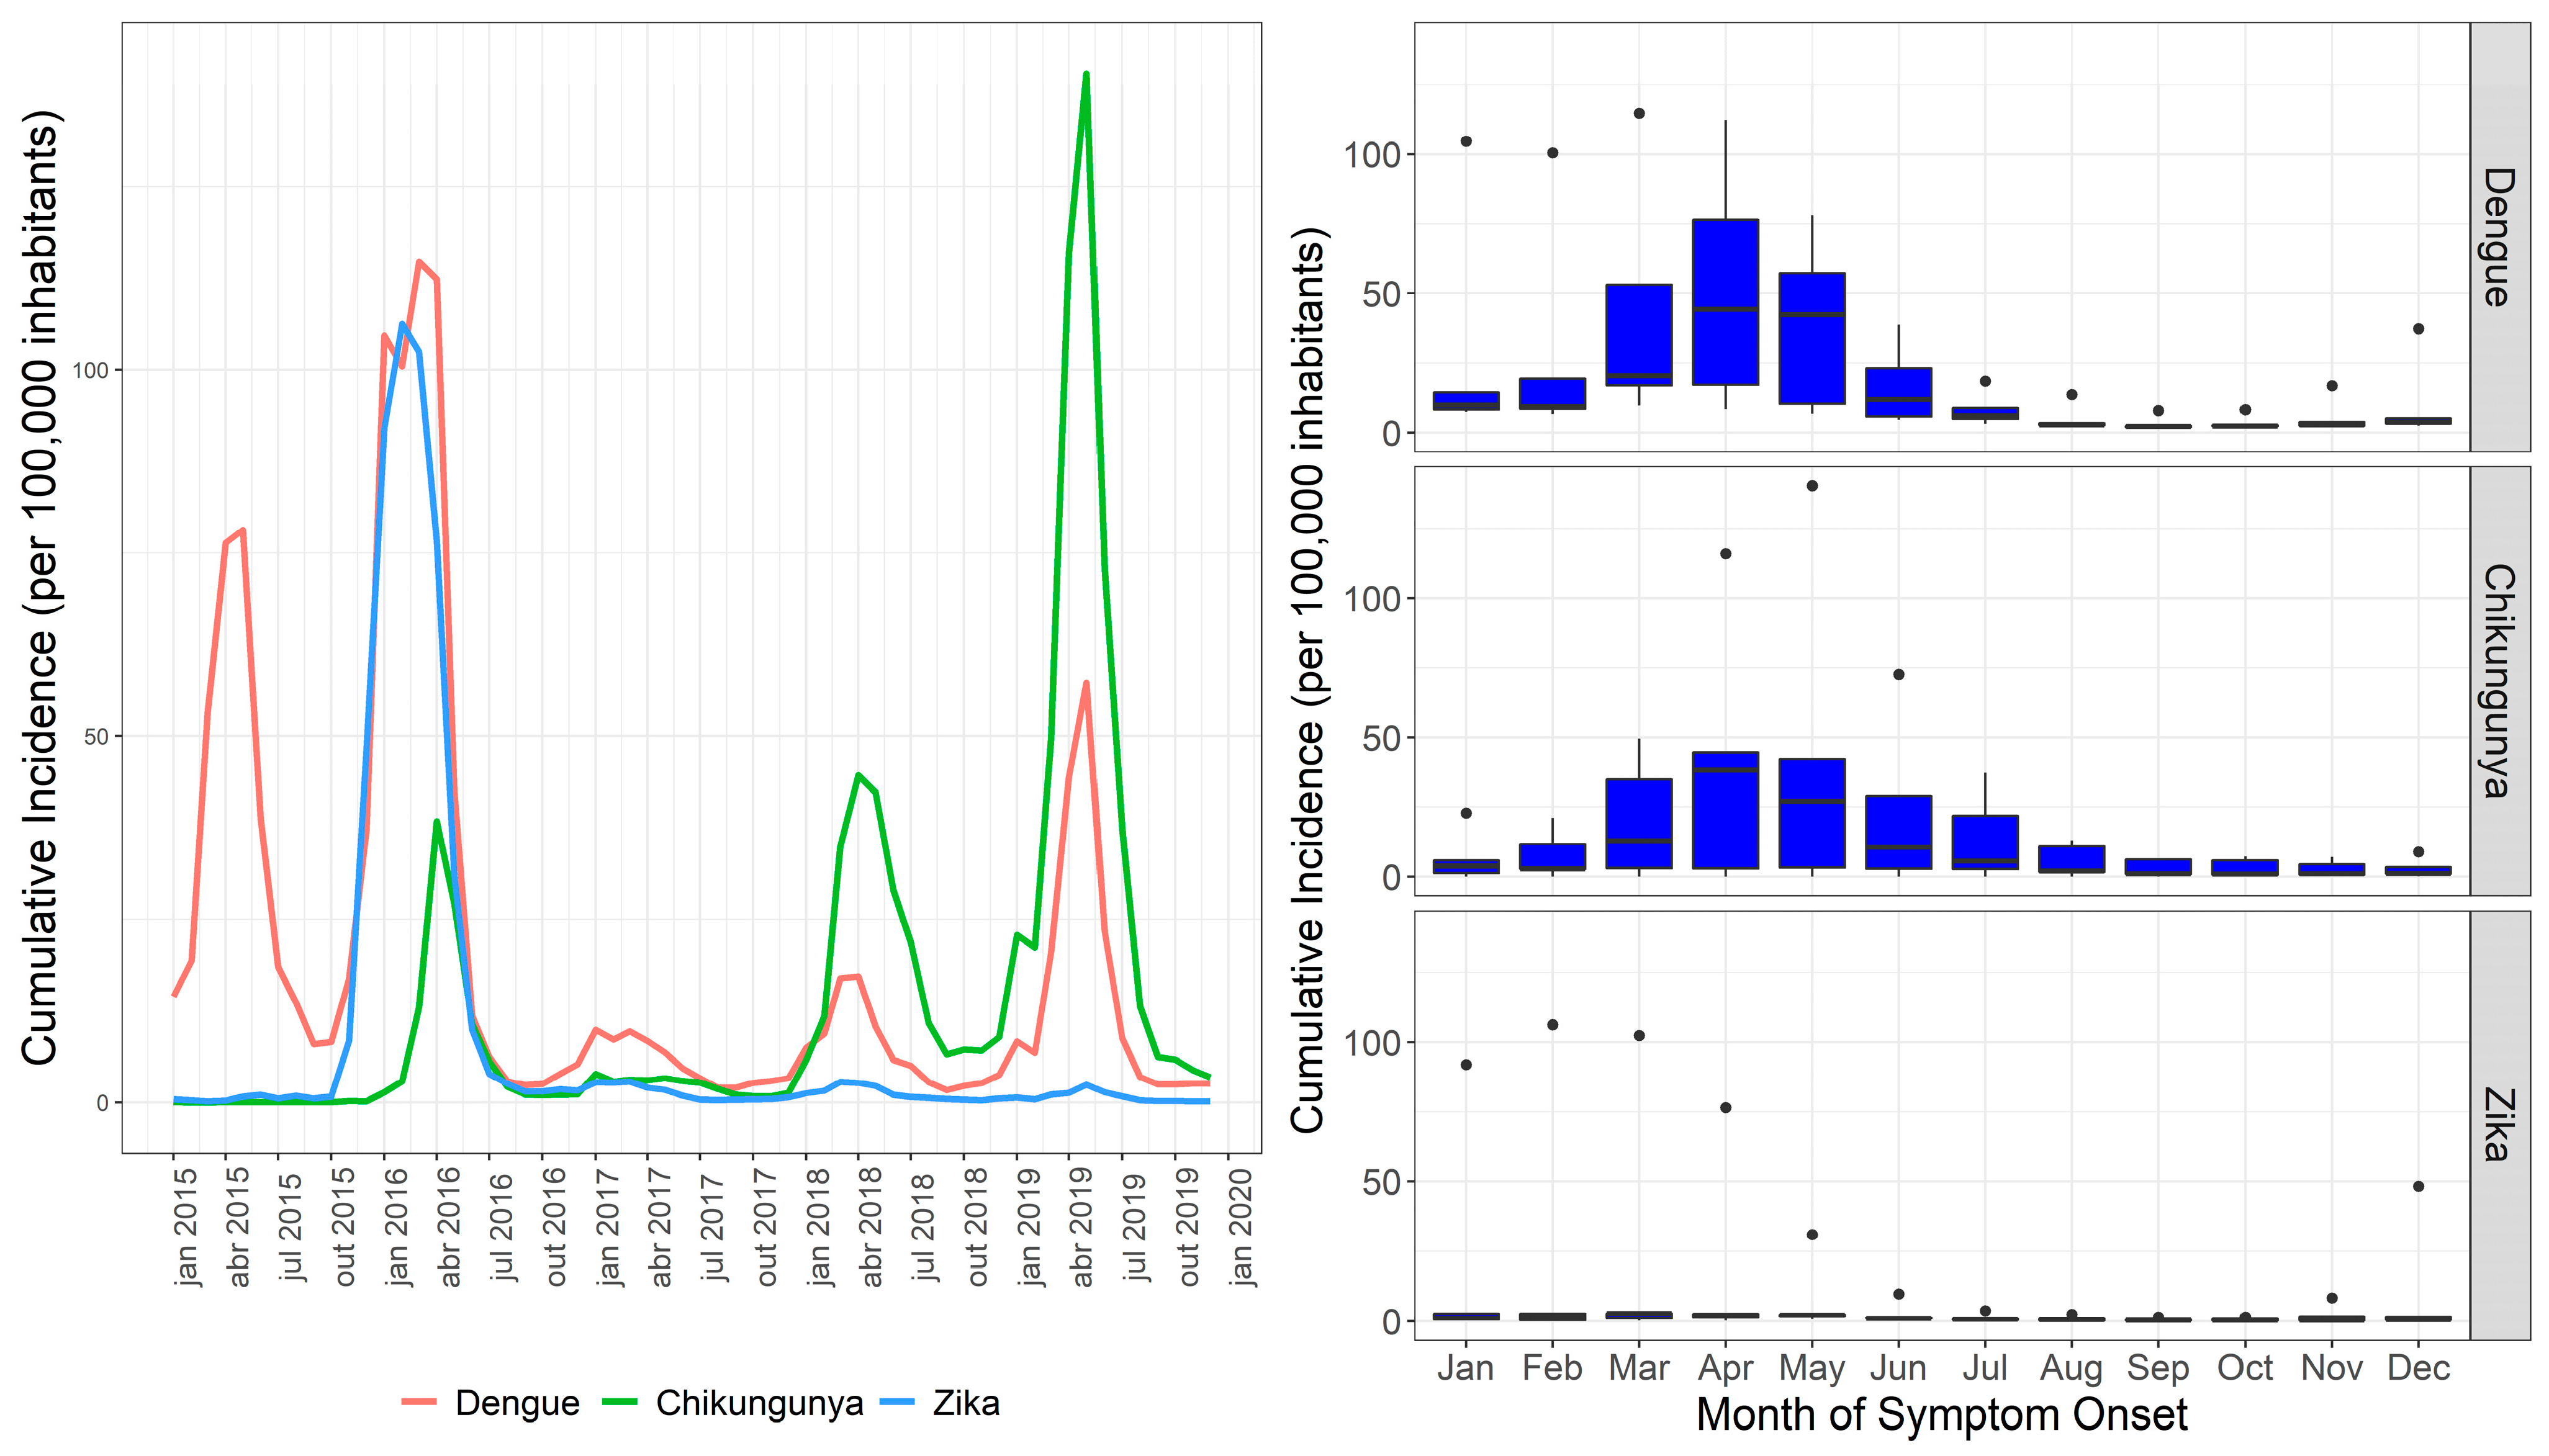
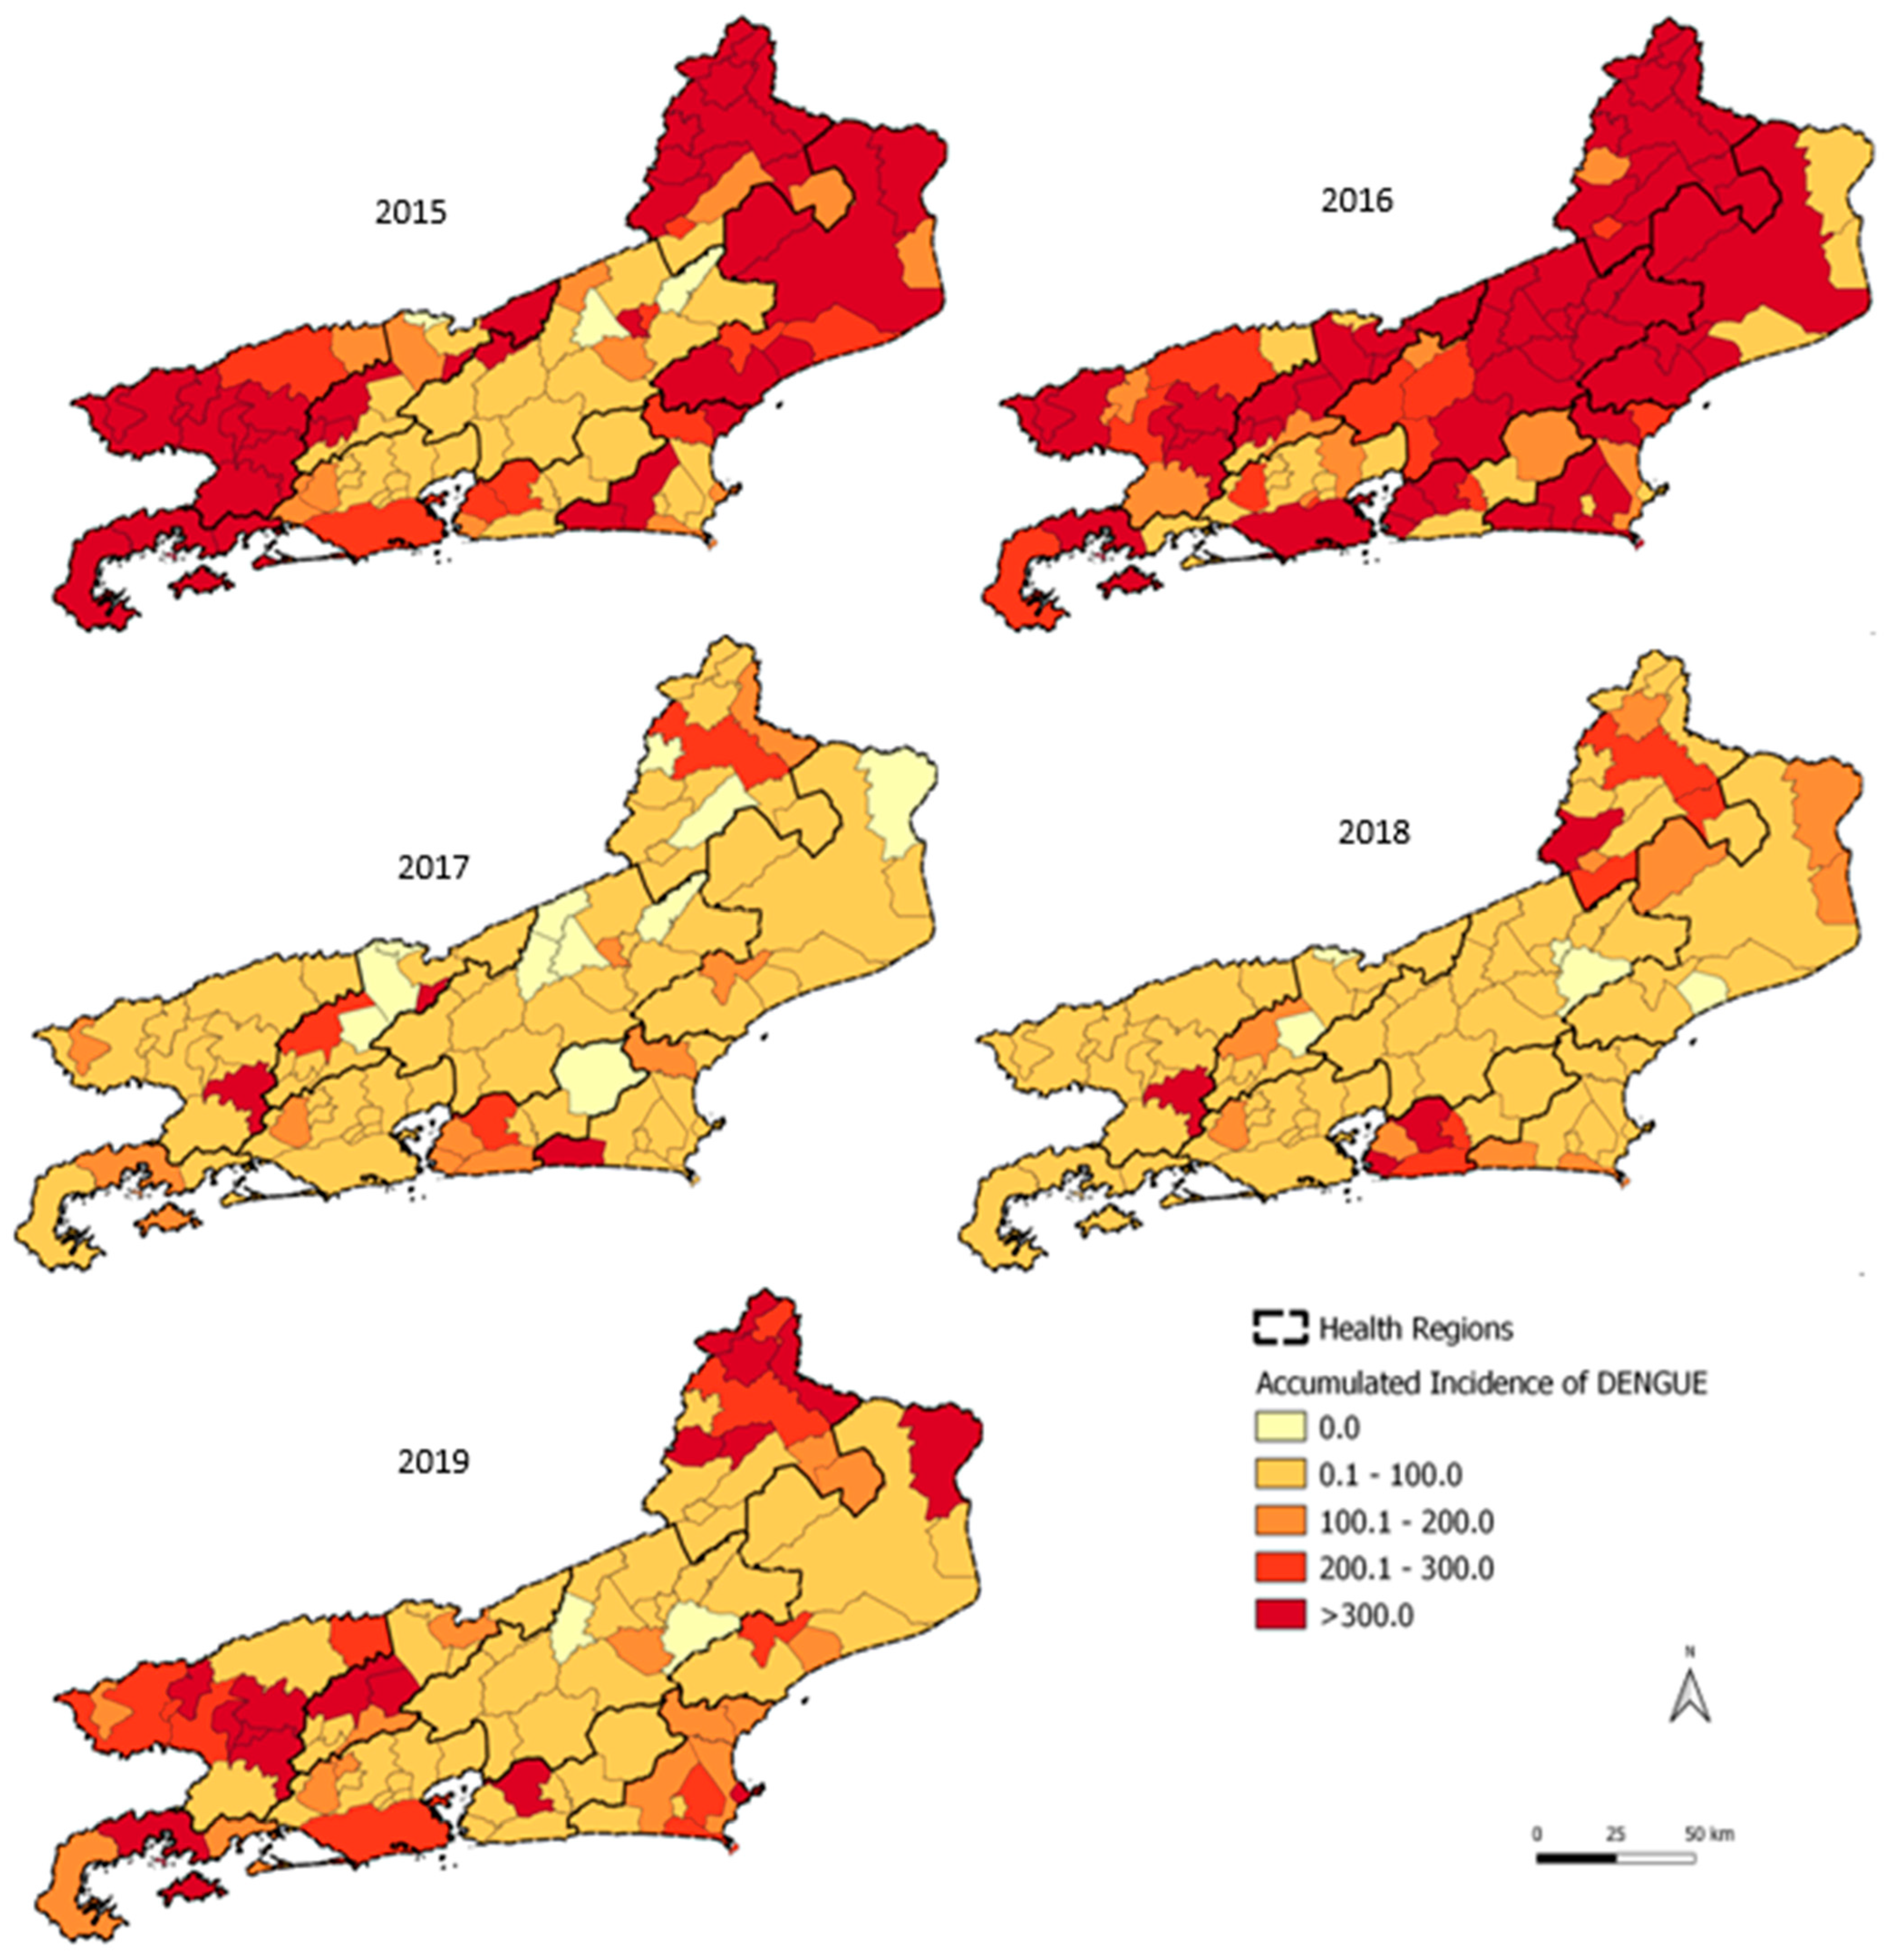
3. Results
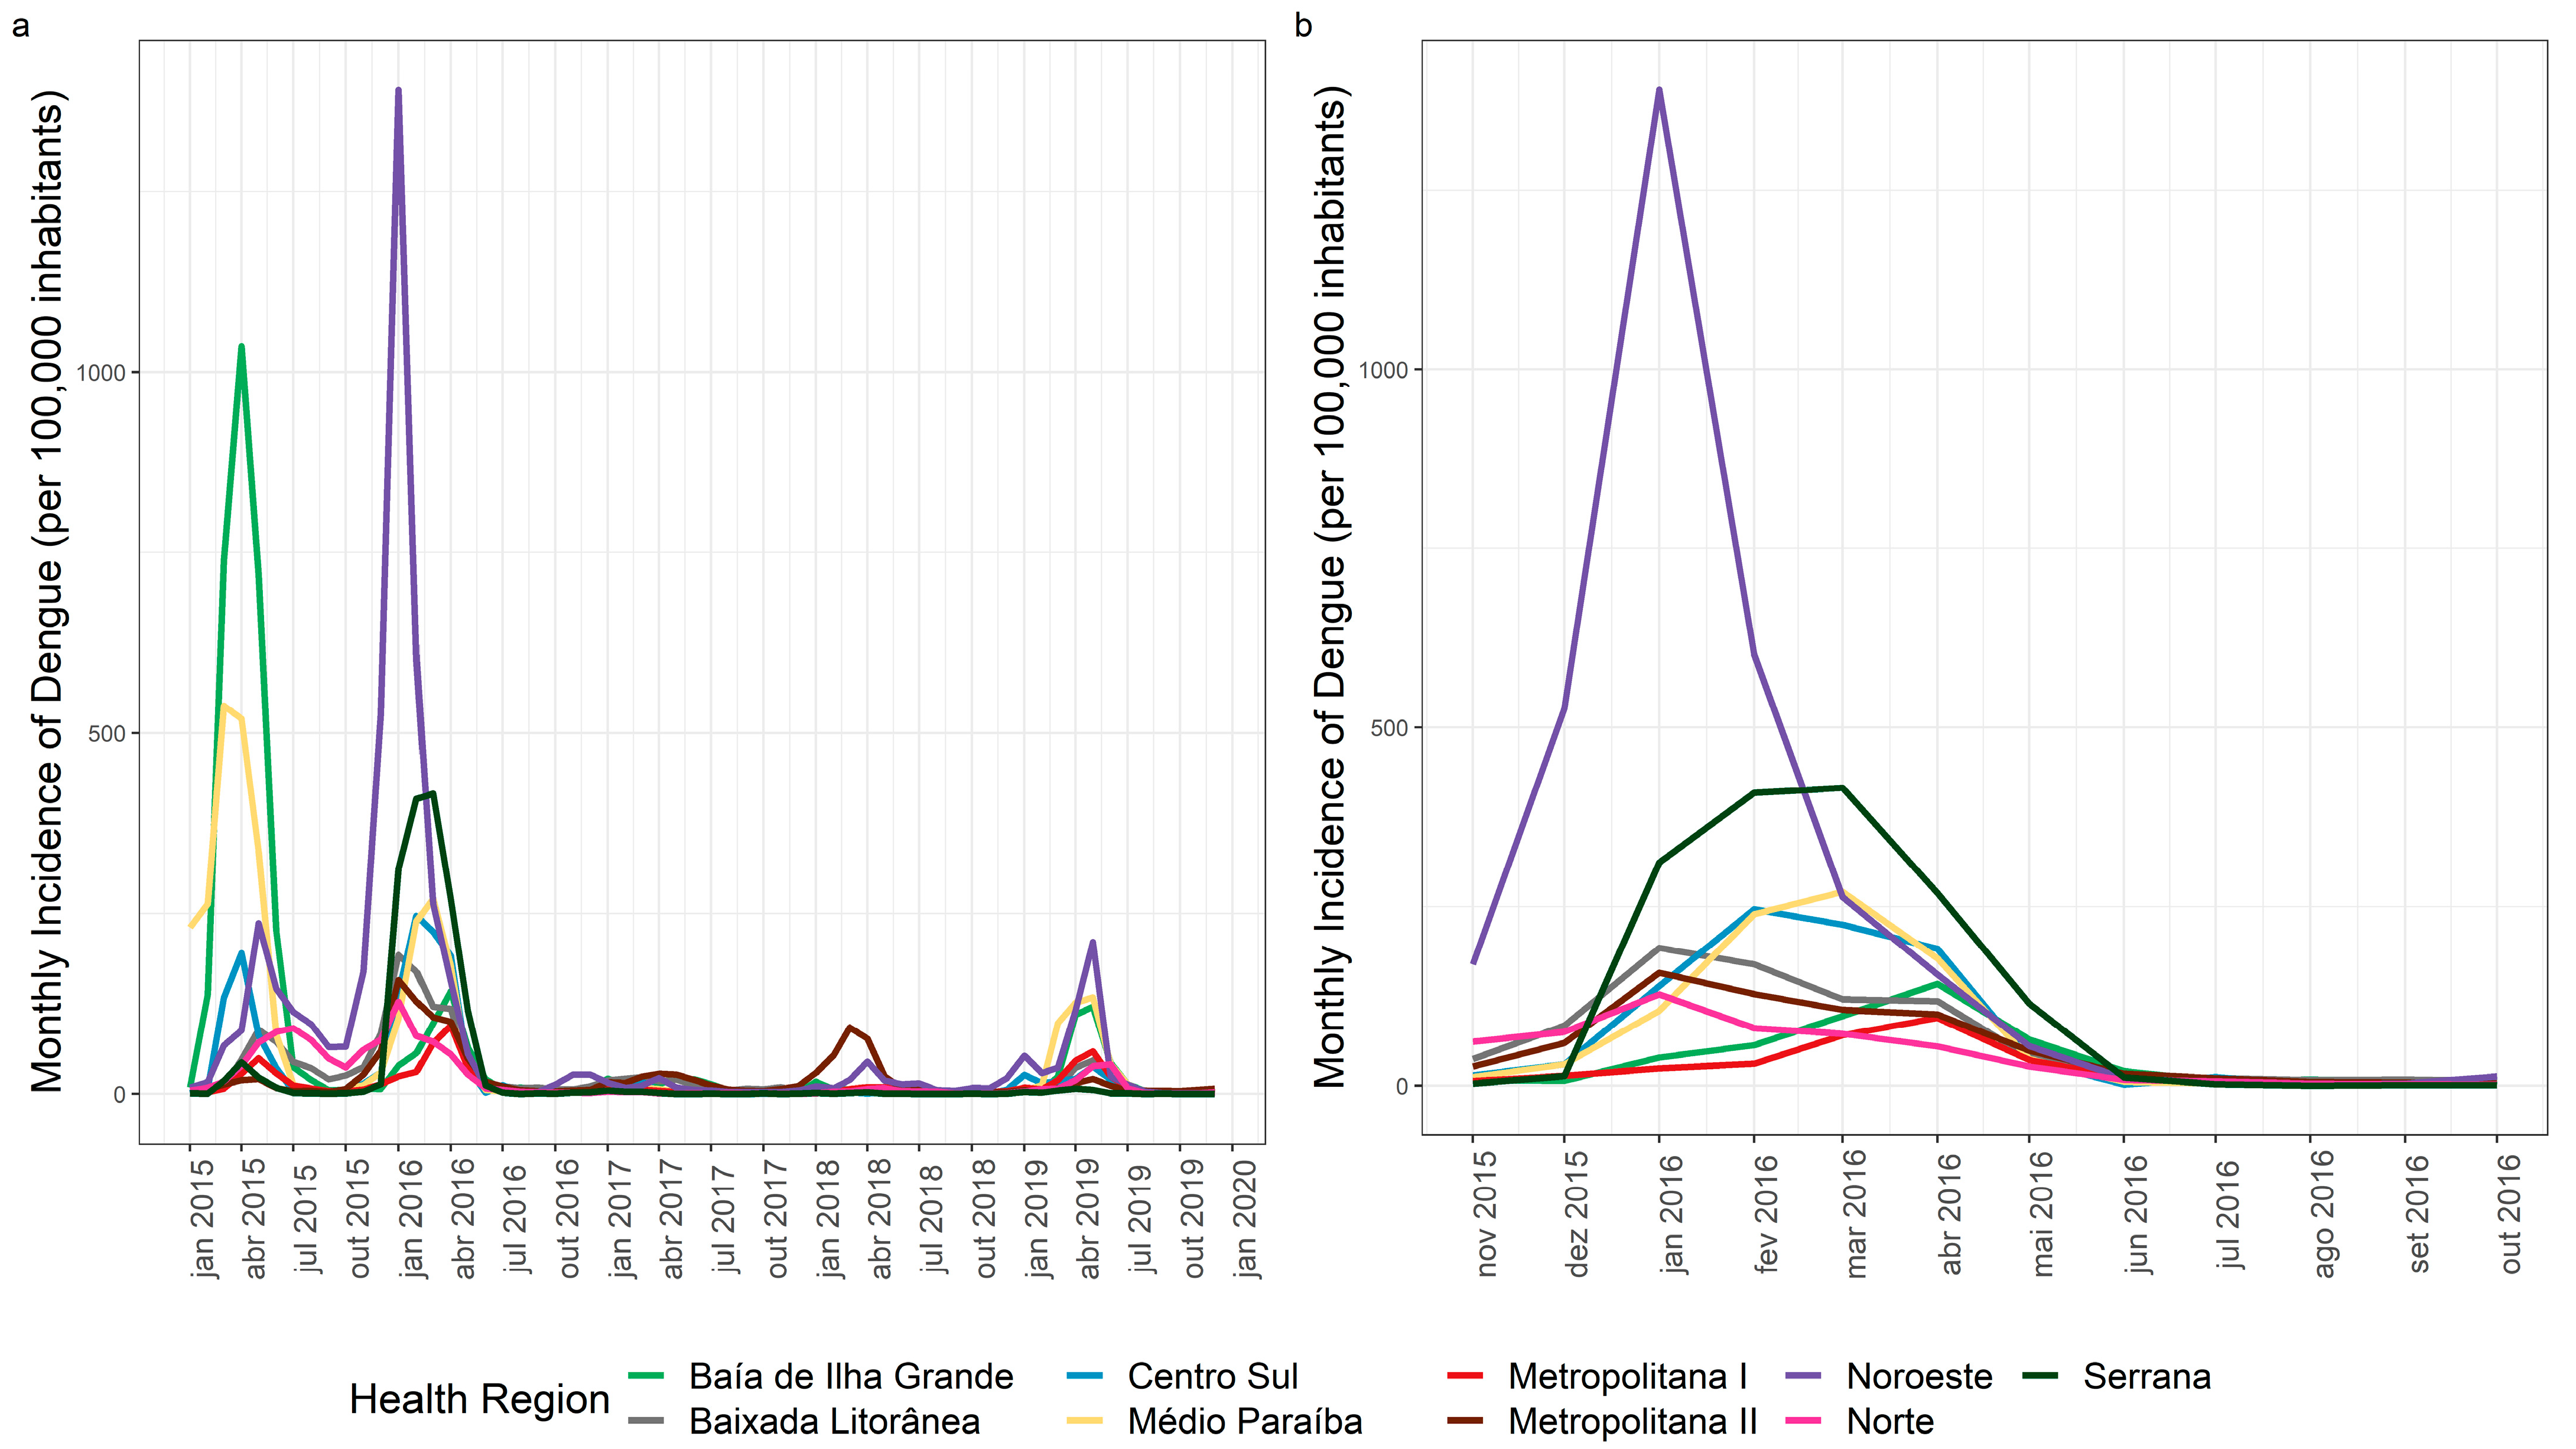
3.1. Dengue Spatial and Temporal Distribution
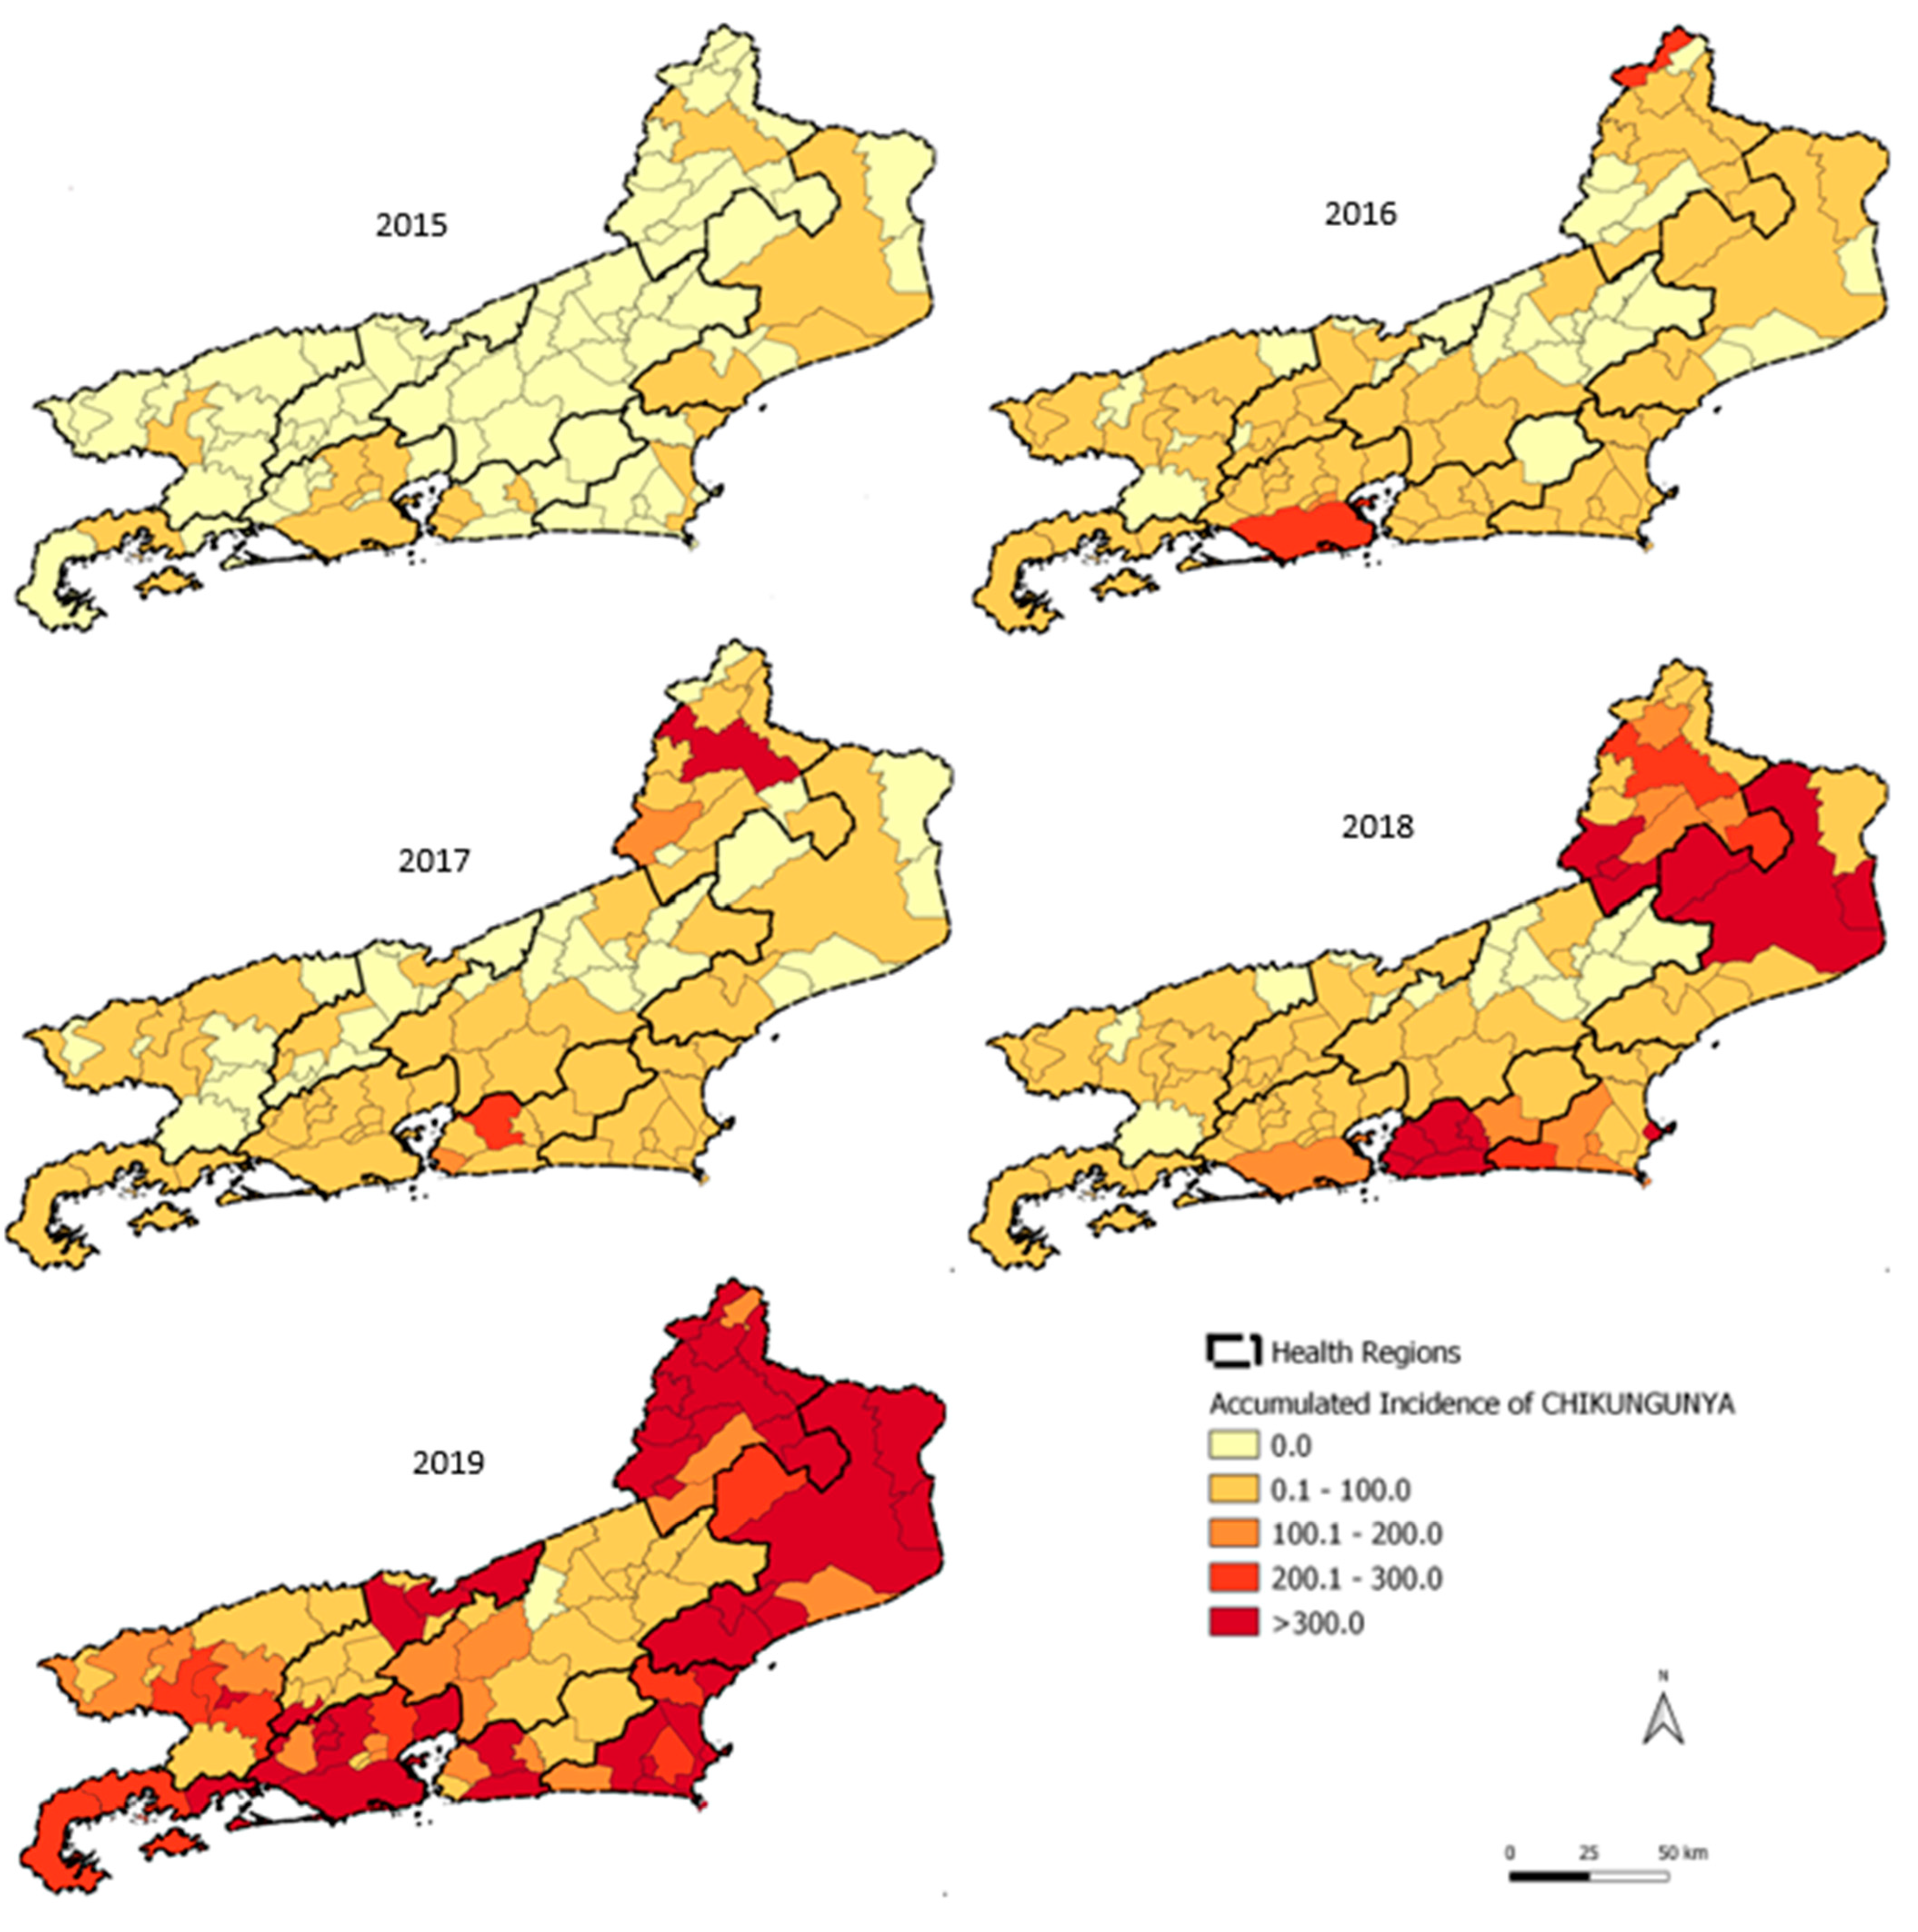
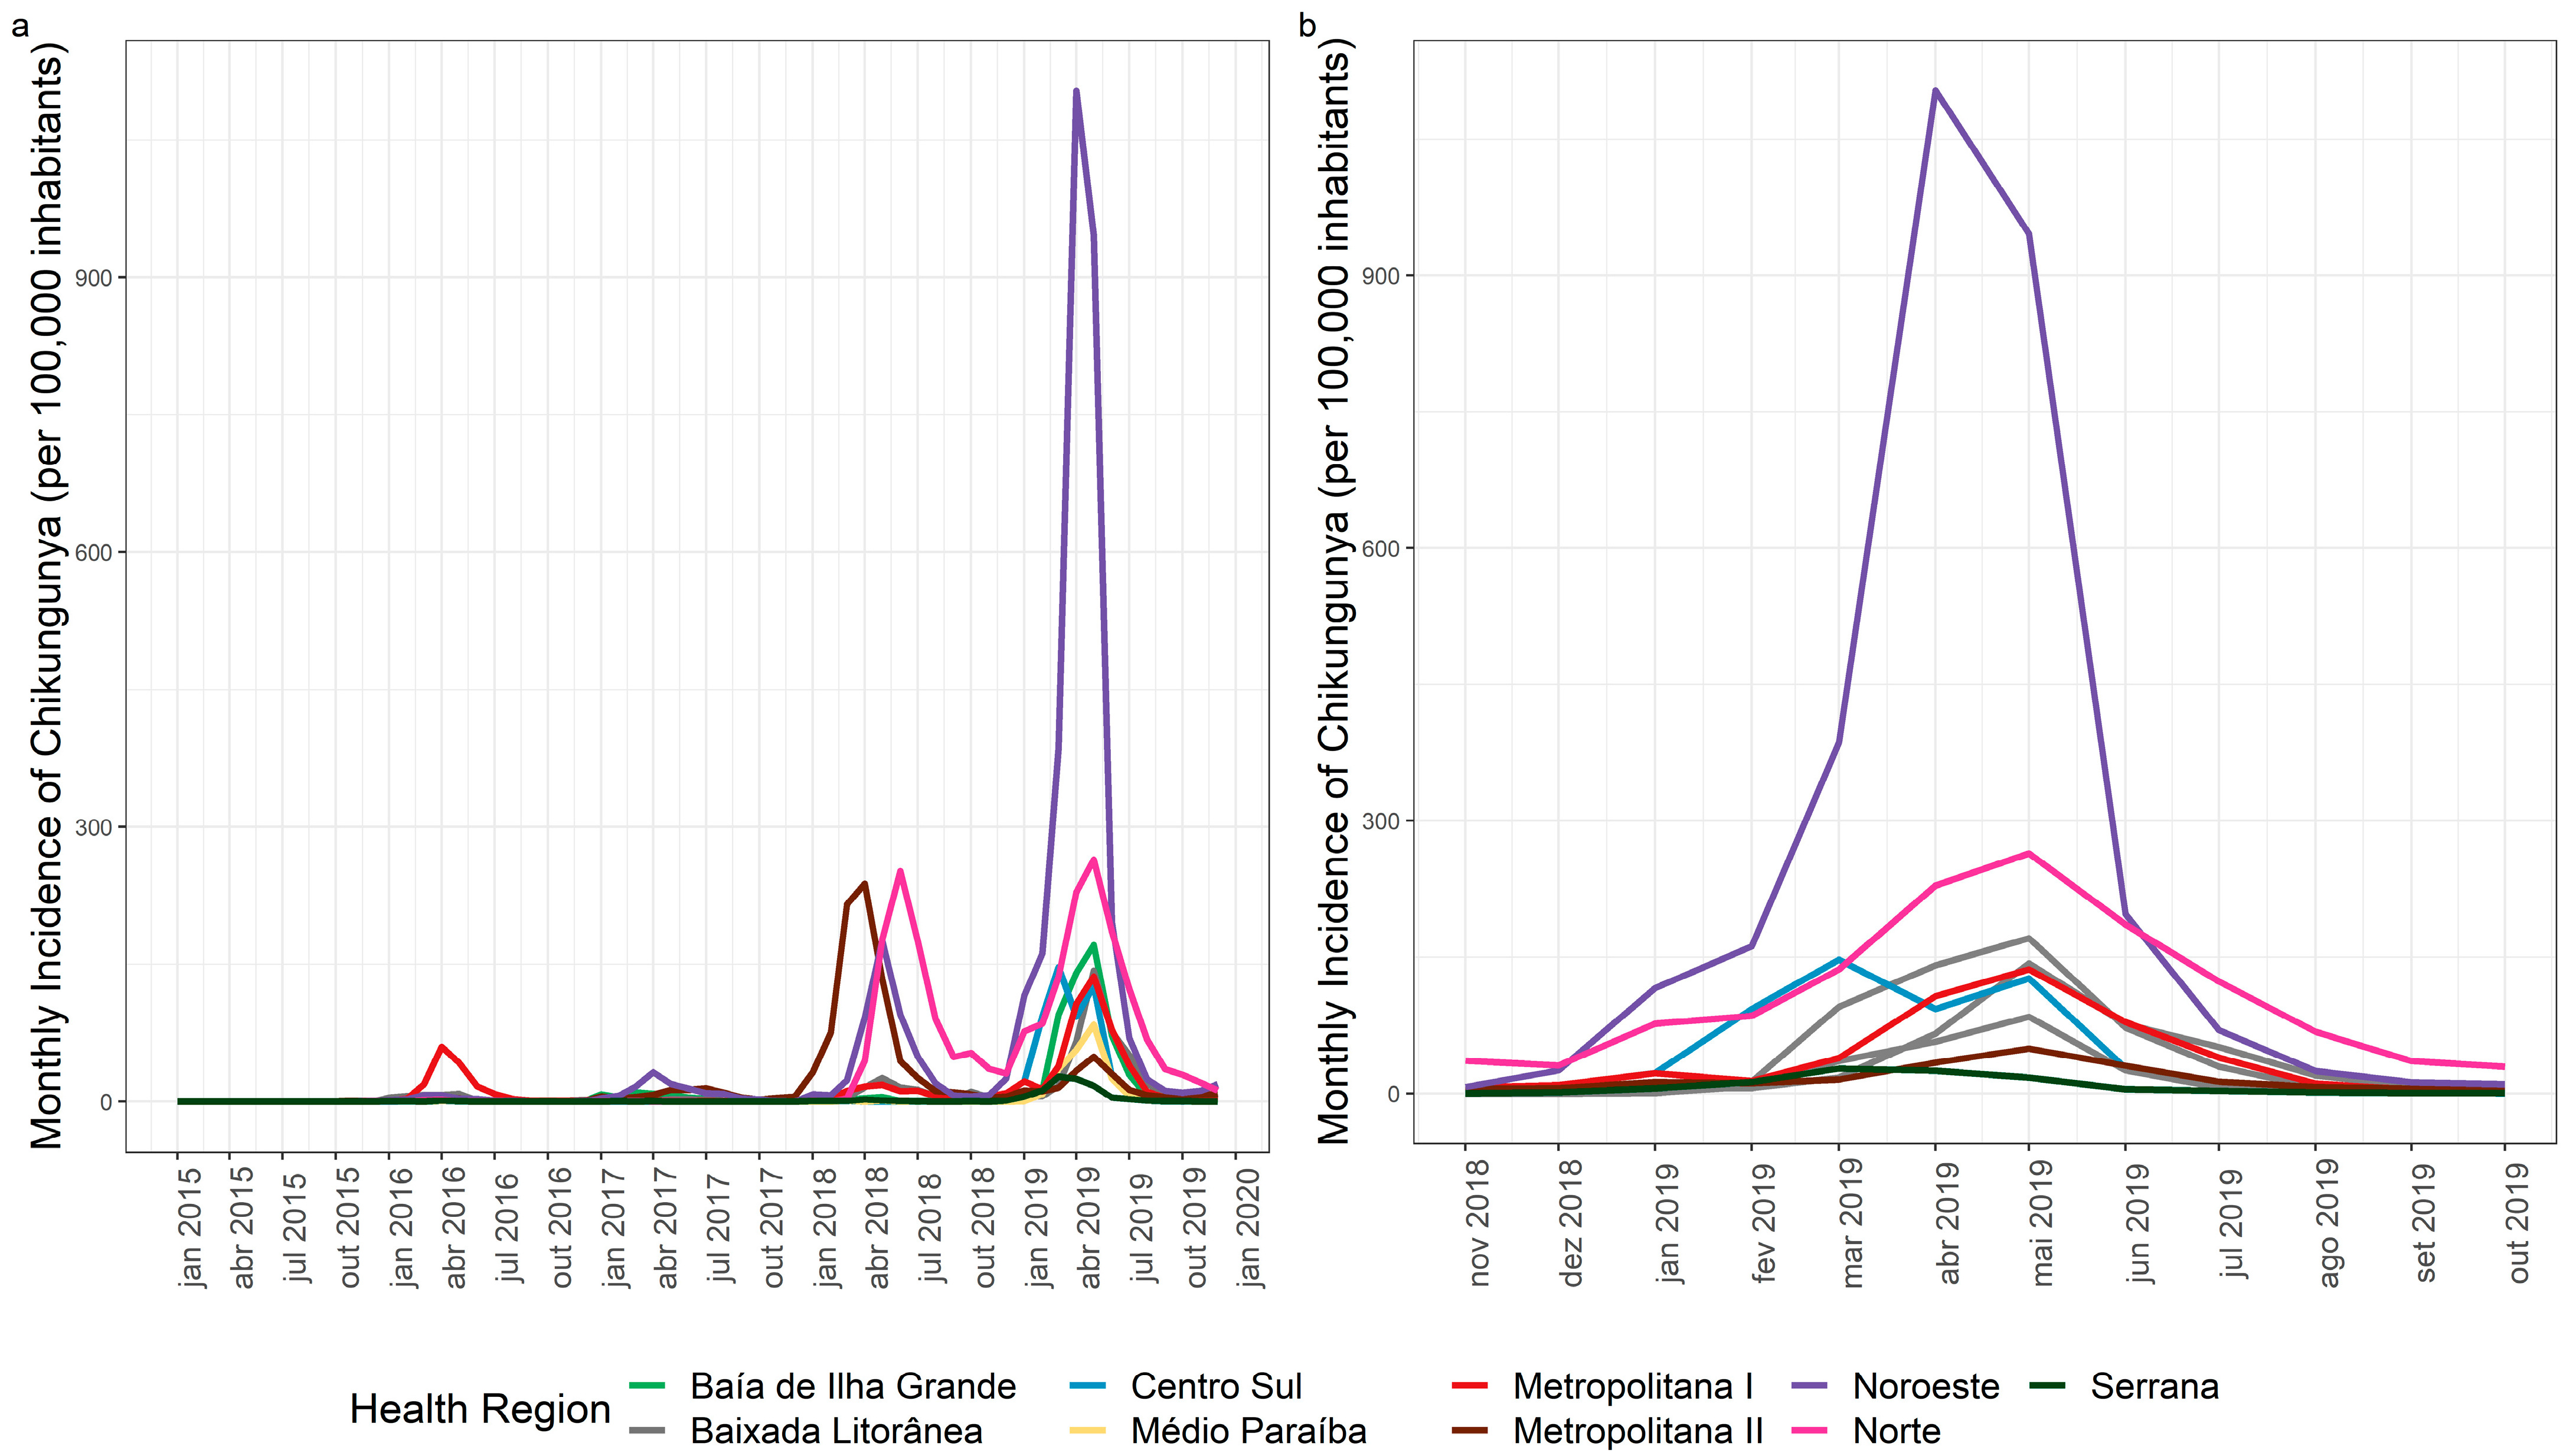
3.2. Chikungunya Spatial and Temporal Distribution
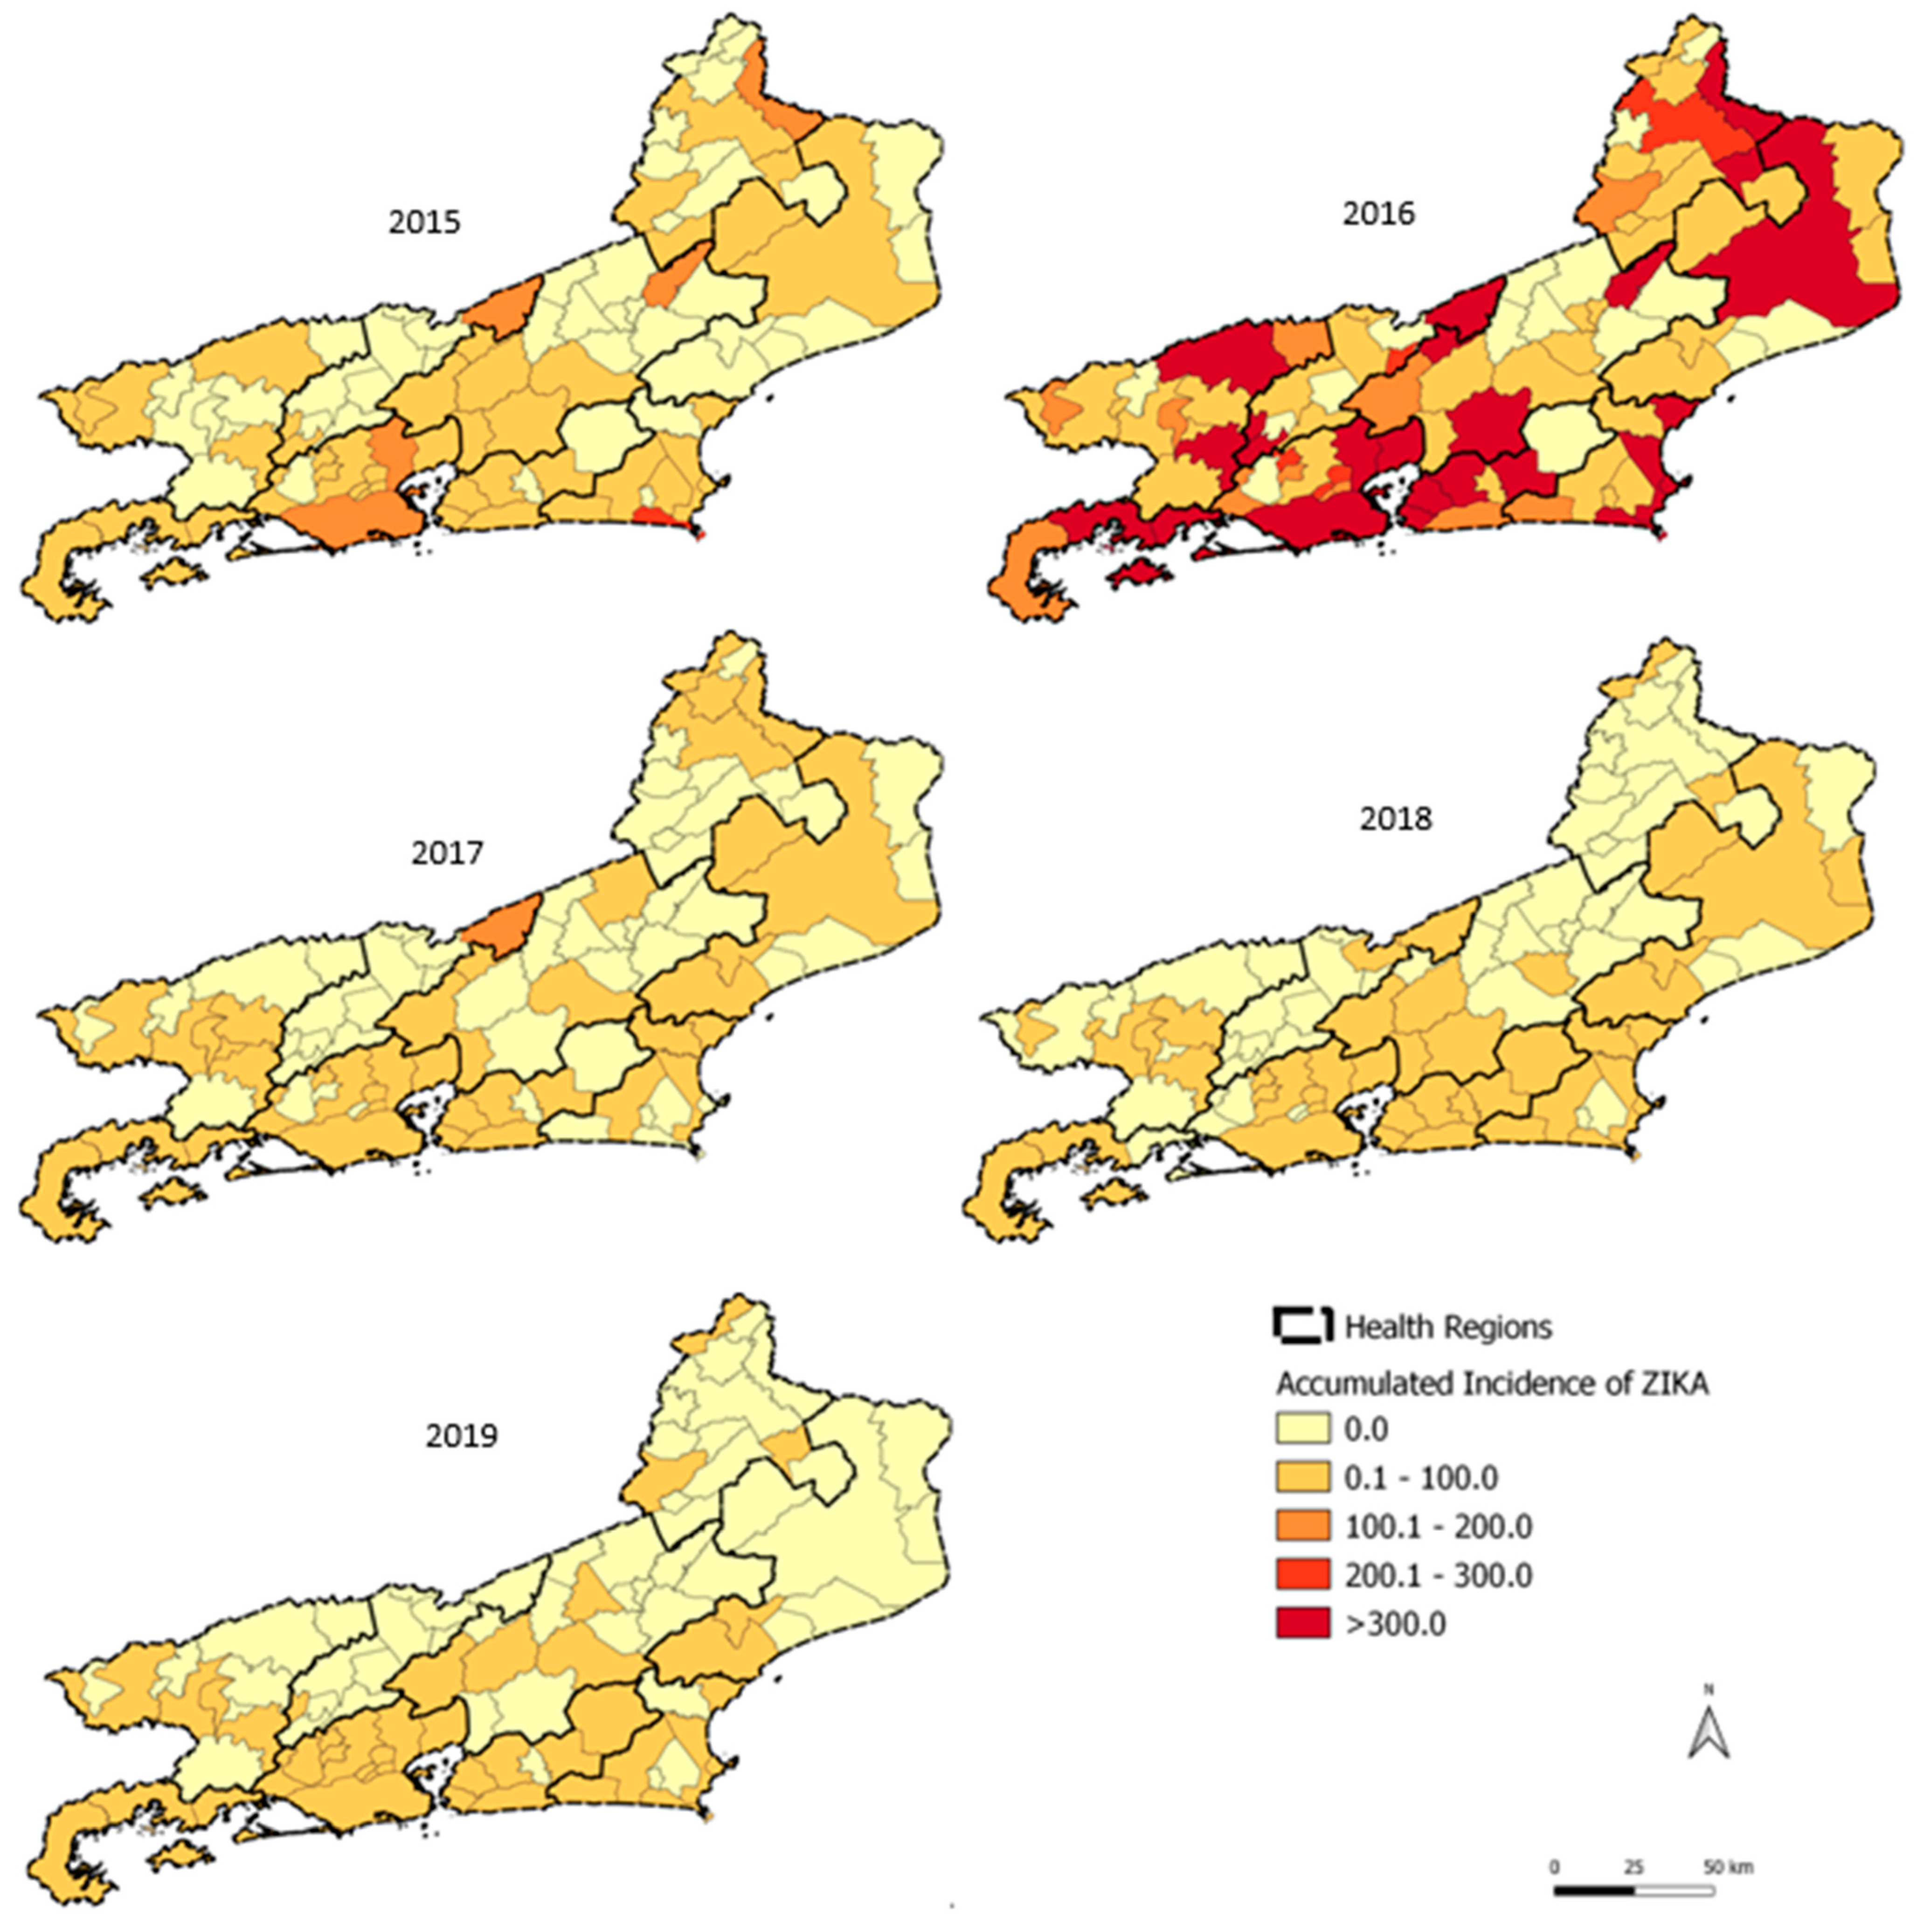
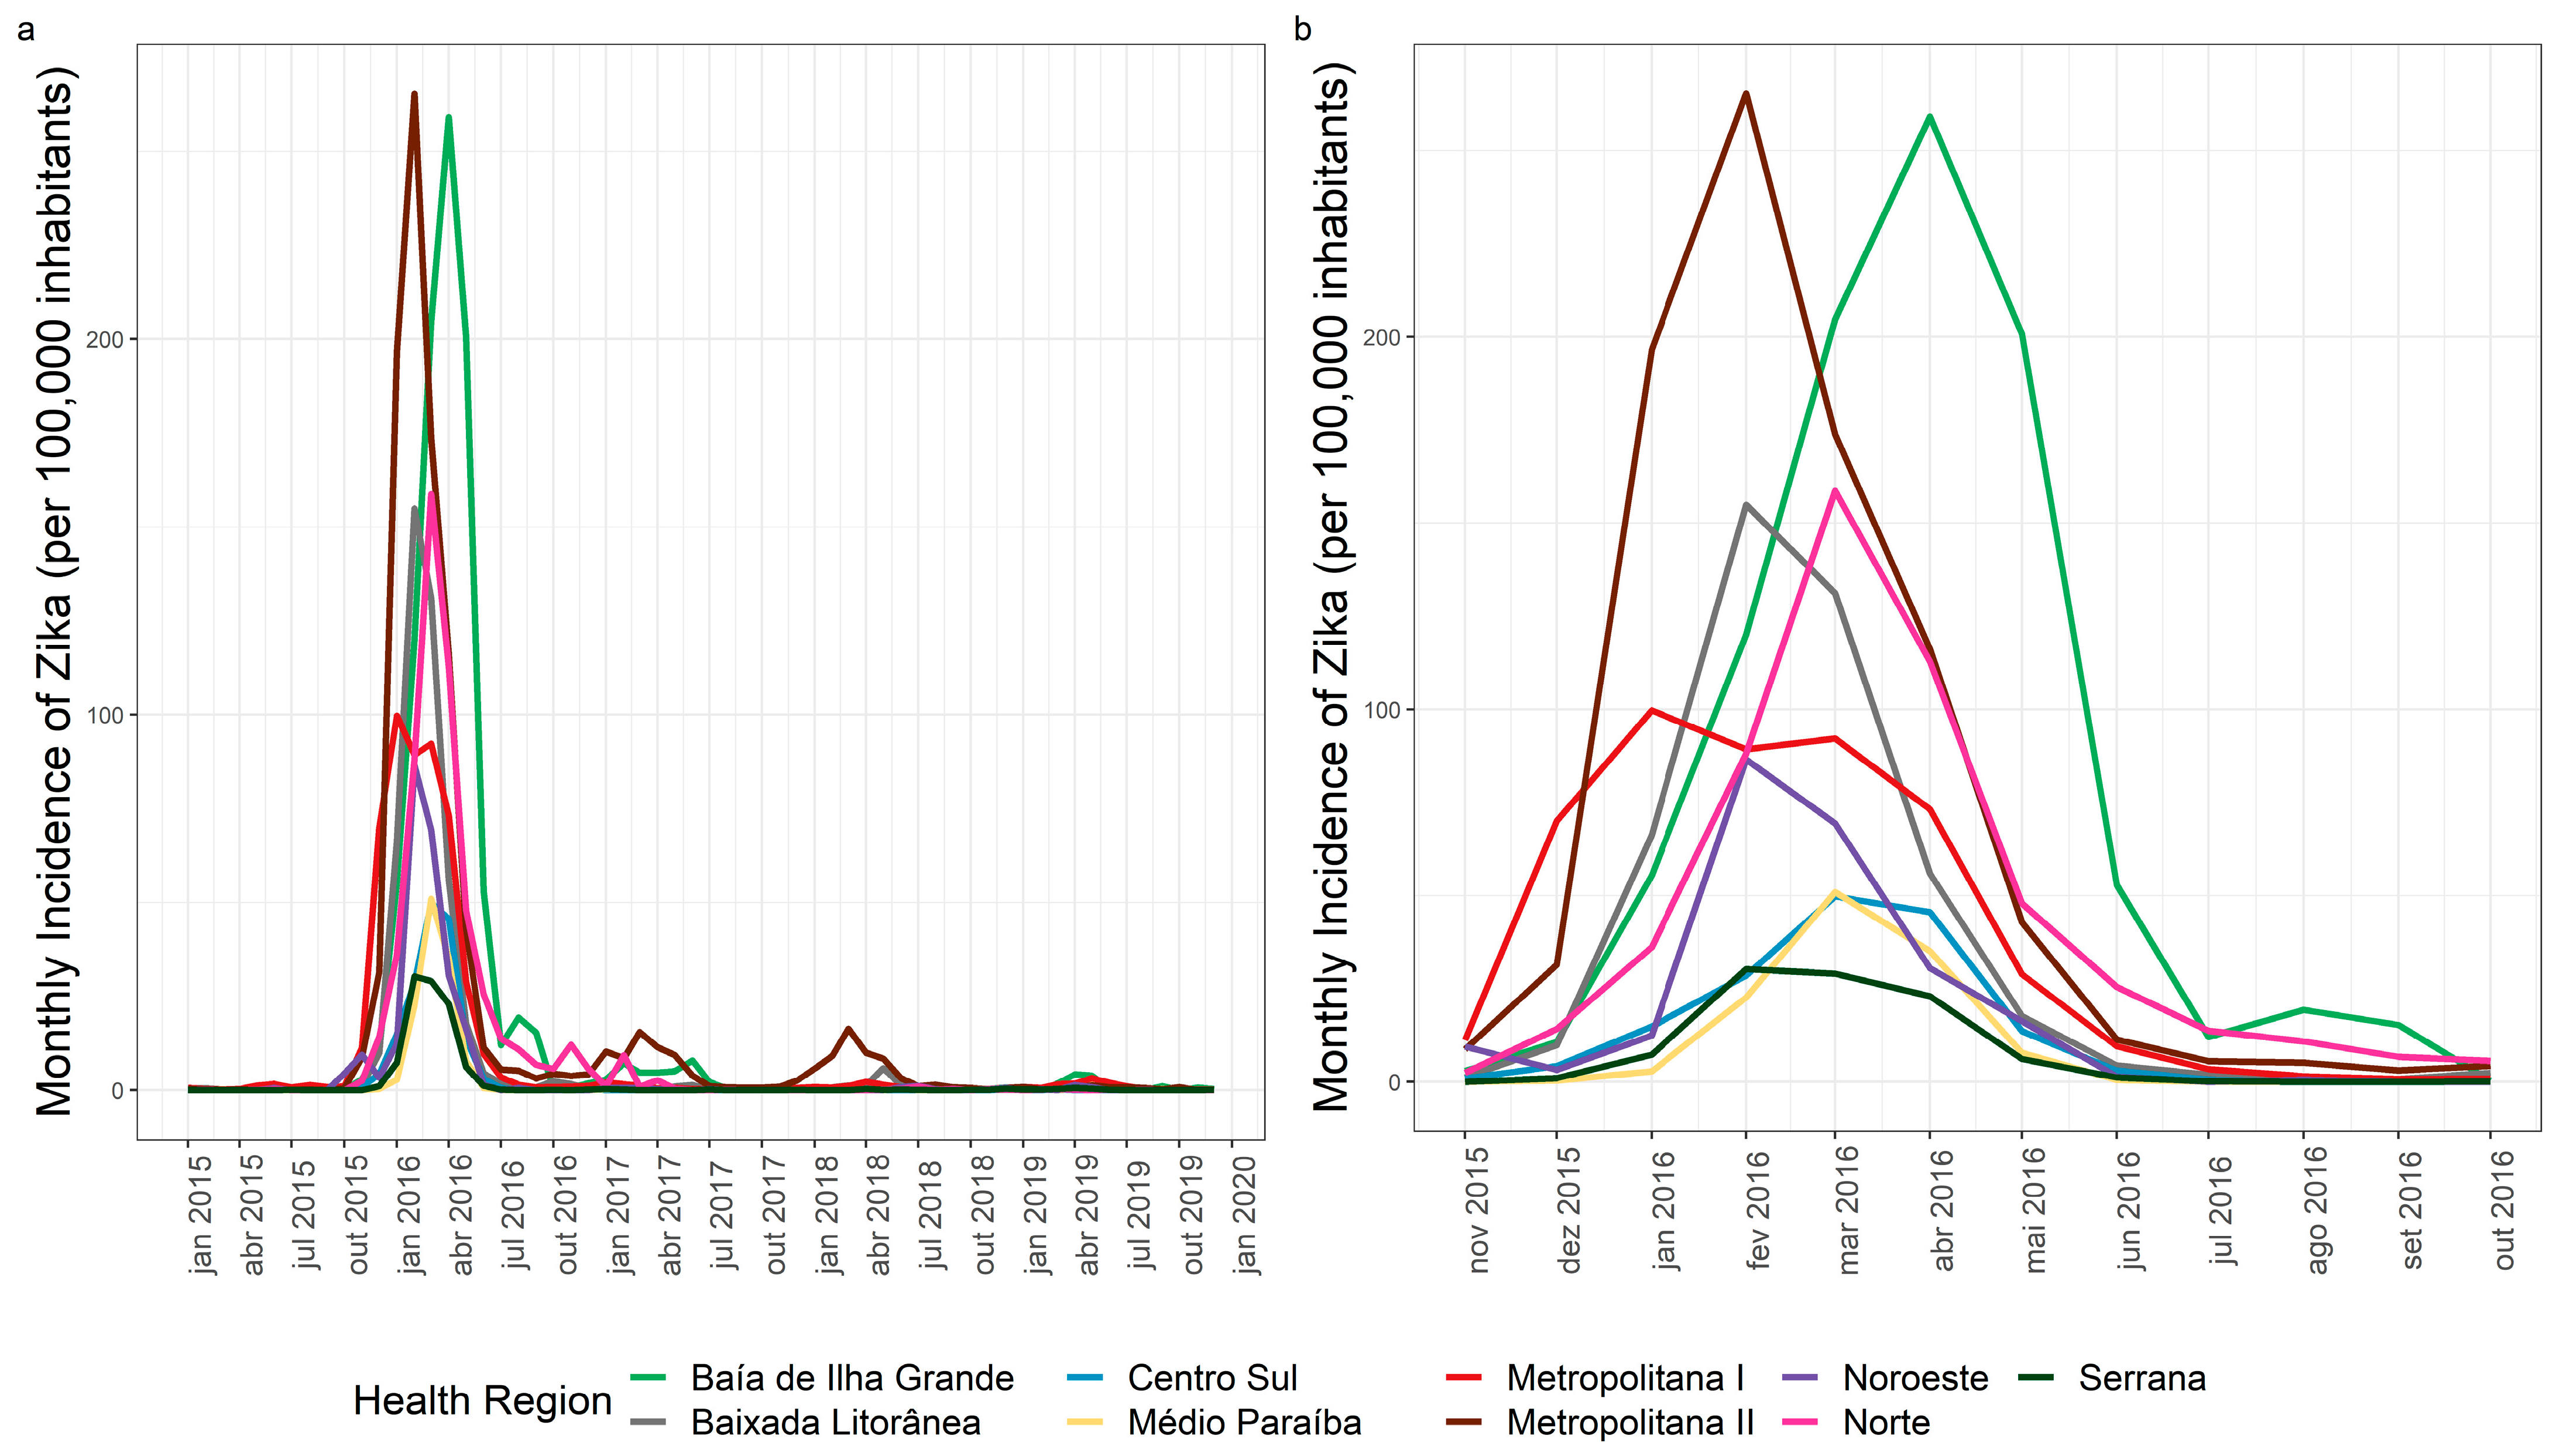
3.3. Zika Spatial and Temporal Distribution
4. Discussion
Author Contributions
Funding
Institutional Review Board Statement
Informed Consent Statement
Data Availability Statement
Acknowledgments
Conflicts of Interest
References
- Weaver, S.C. Arrival of Chikungunya Virus in the New World: Prospects for Spread and Impact on Public Health. PLoS Negl. Trop. Dis. 2014, 8, e2921. [Google Scholar] [CrossRef] [PubMed] [Green Version]
- Honório, N.A.; Câmara, D.C.P.; Calvet, G.A.; Brasil, P.; Honório, N.A.; Câmara, D.C.P.; Calvet, G.A.; Brasil, P. Chikungunya: An Arbovirus Infection in the Process of Establishment and Expansion in Brazil. Cad. Saúde Pública 2015, 31, 906–908. [Google Scholar] [CrossRef] [PubMed] [Green Version]
- Lima-Camara, T.N. Emerging Arboviruses and Public Health Challenges in Brazil. Rev. Saúde Pública 2016, 50, 36. [Google Scholar] [CrossRef] [Green Version]
- Zanluca, C.; Melo, V.C.A.d.; Mosimann, A.L.P.; dos Santos, G.I.V.; dos Santos, C.N.D.; Luz, K. First Report of Autochthonous Transmission of Zika Virus in Brazil. Mem. Inst. Oswaldo Cruz 2015, 110, 569–572. [Google Scholar] [CrossRef]
- Consoli, R.A.G.B.; Lourenço-de-Oliveira, R. Principais Mosquitos de Importância Sanitária no Brasil; Editora FIOCRUZ: Rio de Janeiro, Brazil, 1994; ISBN 85-85676-03-5. [Google Scholar]
- Osanai, C.H.; Travassos da Rosa, A.P.; Tang, A.T.; do Amaral, R.S.; Passos, A.D.; Tauil, P.L. Dengue outbreak in Boa Vista, Roraima. Preliminary report. Rev. Inst. Med. Trop. Sao. Paulo. 1983, 25, 53–54. [Google Scholar] [PubMed]
- Braga, I.A.; Valle, D. Aedes Aegypti: Vigilância, Monitoramento Da Resistência e Alternativas de Controle No Brasil. Epidemiol. Serv. Saúde 2007, 16, 295–302. [Google Scholar] [CrossRef]
- Teixeira, M.G.; Costa, M.C.N.; Coelho, G.; Barreto, M.L. Recent Shift in Age Pattern of Dengue Hemorrhagic Fever, Brazil. Emerg. Infect. Dis. 2008, 14, 1663. [Google Scholar] [CrossRef]
- Lourenço-de-Oliveira, R. Rio de Janeiro against Aedes aegypti: Yellow Fever in 1908 and Dengue in 2008—Editorial. Mem. Inst. Oswaldo Cruz 2008, 103, 627–628. [Google Scholar] [CrossRef] [Green Version]
- Honório, N.A.; Castro, M.G.; de Barros, F.S.M.; de Avelar Figueiredo Mafra Magalhães, M.; Sabroza, P.C. The Spatial Distribution of Aedes aegypti and Aedes albopictus in a Transition Zone, Rio de Janeiro, Brazil. Cad. Saúde Pública 2009, 25, 1203–1214. [Google Scholar] [CrossRef]
- Ayllón, T.; de Mendonça Campos, R.; Brasil, P.; Morone, F.C.; Câmara, D.C.P.; Meira, G.L.S.; Tannich, E.; Yamamoto, K.A.; Carvalho, M.S.; Pedro, R.S.; et al. Early Evidence for Zika Virus Circulation among Aedes aegypti Mosquitoes, Rio de Janeiro, Brazil. Emerg. Infect. Dis. 2017, 23, 1411–1412. [Google Scholar] [CrossRef] [Green Version]
- de Andrade Zanotto, P.M.; de Cerqueira Leite, L.C. The Challenges Imposed by Dengue, Zika, and Chikungunya to Brazil. Front. Immunol. 2018, 9, 1964. [Google Scholar] [CrossRef] [PubMed]
- Teixeira, M.G.; da Conceição N. Costa, M.; de Oliveira, W.K.; Nunes, M.L.; Rodrigues, L.C. The Epidemic of Zika Virus-Related Microcephaly in Brazil: Detection, Control, Etiology, and Future Scenarios. Am. J. Public Health 2016, 106, 601–605. [Google Scholar] [CrossRef] [PubMed]
- Lowe, R.; Barcellos, C.; Brasil, P.; Cruz, O.G.; Honório, N.A.; Kuper, H.; Carvalho, M.S. The Zika Virus Epidemic in Brazil: From Discovery to Future Implications. Int. J. Environ. Res. Public Health 2018, 15, 96. [Google Scholar] [CrossRef] [Green Version]
- Secretaria de Estado de Saúde do Rio de Janeiro. SES-RJ Estimativas Preliminares Elaboradas Pelo Ministério da Saúde/SVS/DASNT/CGIAE, Para 2000 a 2020, Baseadas Nas Projeções da População 2018 2020. Available online: https://www.saude.rj.gov.br/informacao-sus/dados-sus/2020/11/dados-demograficos (accessed on 13 April 2021).
- Instituto Brasileiro de Geografia e Estatística. IBGE Panorama das Cidades do Brasil; Instituto Brasileiro de Geografia e Estatística: Brasília, Brazil, 2017. [Google Scholar]
- Reisen, W.K. Landscape Epidemiology of Vector-Borne Diseases. Annu. Rev. Entomol. 2010, 55, 461–483. [Google Scholar] [CrossRef] [PubMed] [Green Version]
- Fuller, T.L.; Calvet, G.; Genaro Estevam, C.; Rafael Angelo, J.; Abiodun, G.J.; Halai, U.-A.; De Santis, B.; Carvalho Sequeira, P.; Machado Araujo, E.; Alves Sampaio, S.; et al. Behavioral, Climatic, and Environmental Risk Factors for Zika and Chikungunya Virus Infections in Rio de Janeiro, Brazil, 2015–2016. PLoS ONE 2017, 12, e0188002. [Google Scholar] [CrossRef] [Green Version]
- Mordecai, E.A.; Cohen, J.M.; Evans, M.V.; Gudapati, P.; Johnson, L.R.; Lippi, C.A.; Miazgowicz, K.; Murdock, C.C.; Rohr, J.R.; Ryan, S.J.; et al. Detecting the Impact of Temperature on Transmission of Zika, Dengue, and Chikungunya Using Mechanistic Models. PLoS Negl. Trop. Dis. 2017, 11, e0005568. [Google Scholar] [CrossRef] [Green Version]
- Tozan, Y.; Sjödin, H.; Muñoz, Á.G.; Rocklöv, J. Transmission Dynamics of Dengue and Chikungunya in a Changing Climate: Do We Understand the Eco-Evolutionary Response? Expert Rev. Anti. Infect. Ther. 2020, 18, 1187–1193. [Google Scholar] [CrossRef]
- Valle, D.; Pimenta, D.N.; da Cunha, R.V. Dengue: Teorias e Práticas; Editora FIOCRUZ: Rio de Janeiro, Brazil, 2015; ISBN 978-85-7541-456-9. [Google Scholar]
- Rodrigues, N.C.P.; Daumas, R.P.; de Almeida, A.S.; Dos Santos, R.S.; Koster, I.; Rodrigues, P.P.; de Freitas Gomes, M.; de Fátima Macedo, A.; Gerardi, A.; da Costa Leite, L. Risk Factors for Arbovirus Infections in a Low-Income Community of Rio de Janeiro, Brazil, 2015–2016. PLoS ONE 2018, 13, e0198357. [Google Scholar] [CrossRef]
- Freitas, L.P.; Cruz, O.G.; Lowe, R.; Sá Carvalho, M. Space–Time Dynamics of a Triple Epidemic: Dengue, Chikungunya and Zika Clusters in the City of Rio de Janeiro. Proc. R. Soc. B: Biol. Sci. 2019, 286, 20191867. [Google Scholar] [CrossRef] [Green Version]
- Santos, J.P.C.D.; Honório, N.A.; Nobre, A.A. Definition of Persistent Areas with Increased Dengue Risk by Detecting Clusters in Populations with Differing Mobility and Immunity in Rio de Janeiro, Brazil. Cad. Saude Publica 2019, 35, e00248118. [Google Scholar] [CrossRef]
- Xavier, D.R.; de Avelar Figueiredo Mafra Magalhães, M.; Gracie, R.; dos Reis, I.C.; de Matos, V.P.; Barcellos, C. Difusão espaço-tempo do dengue no Município do Rio de Janeiro, Brasil, no período de 2000–2013. Cad. de Saúde Pública 2017, 33, e00186615. [Google Scholar] [CrossRef] [Green Version]
- Teixeira, T.R.d.A.; Medronho, R.d.A. Indicadores sócio-demográficos e a epidemia de dengue em 2002 no Estado do Rio de Janeiro, Brasil. Cad. Saúde Pública 2008, 24, 2160–2170. [Google Scholar] [CrossRef] [PubMed] [Green Version]
- Faria, N.R.; Azevedo, R.d.S.d.S.; Kraemer, M.U.G.; Souza, R.; Cunha, M.S.; Hill, S.C.; Thézé, J.; Bonsall, M.B.; Bowden, T.A.; Rissanen, I.; et al. Zika Virus in the Americas: Early Epidemiological and Genetic Findings. Science 2016, 352, 345–349. [Google Scholar] [CrossRef] [PubMed] [Green Version]
- Paixão, E.S.; Rodrigues, L.C.; Costa, M.d.C.N.; Itaparica, M.; Barreto, F.; Gérardin, P.; Teixeira, M.G. Chikungunya Chronic Disease: A Systematic Review and Meta-Analysis. Trans. R. Soc. Trop. Med. Hyg. 2018, 112, 301–316. [Google Scholar] [CrossRef] [PubMed]
- de Carvalho Viana, L.R.; Pimenta, C.J.L.; de Araújo, E.M.N.F.; Teófilo, T.J.S.; da Costa, T.F.; de Freitas Macedo Costa, K.N. Arboviroses reemergentes: Perfil clínico-epidemiológico de idosos hospitalizados. Rev. Esc. Enferm. USP 2018, 52, e03403. [Google Scholar] [CrossRef] [Green Version]
- Jan, R.; Boulaaras, S. Analysis of Fractional-Order Dynamics of Dengue Infection with Non-Linear Incidence Functions. Trans. Inst. Meas. Control. 2022, 01423312221085049. [Google Scholar] [CrossRef]
- Jan, R.; Shah, Z.; Deebani, W.; Alzahrani, E. Analysis and Dynamical Behavior of a Novel Dengue Model via Fractional Calculus. Int. J. Biomath. 2022, 15, 2250036. [Google Scholar] [CrossRef]
- Barbosa, R.M.R.; de Melo-Santos, M.A.V.; Silveira, J.C.; Silva-Filha, M.H.N.L.; Souza, W.V.; de Oliveira, C.M.F.; Ayres, C.F.J.; do Nascimento Xavier, M.; Rodrigues, M.P.; Santos, S.A.D.; et al. Infestation of an Endemic Arbovirus Area by Sympatric Populations of Aedes aegypti and Aedes albopictus in Brazil. Mem. Inst. Oswaldo Cruz 2020, 115, e190437. [Google Scholar] [CrossRef]
- Olson, M.F.; Juarez, J.G.; Kraemer, M.U.G.; Messina, J.P.; Hamer, G.L. Global Patterns of Aegyptism without Arbovirus. PLoS Negl. Trop. Dis. 2021, 15, e0009397. [Google Scholar] [CrossRef]


| Cumulative State Incidence by Year | |||||||||||||||
|---|---|---|---|---|---|---|---|---|---|---|---|---|---|---|---|
| DENGUE | CHIKUNGUNYA | ZIKA | |||||||||||||
| 2015 | 2016 | 2017 | 2018 | 2019 | 2015 | 2016 | 2017 | 2018 | 2019 | 2015 | 2016 | 2017 | 2018 | 2019 | |
| 382.6 | 509.5 | 64.0 | 85.0 | 182.7 | 0.5 | 105.1 | 27.3 | 230.7 | 492.8 | 62.4 | 430.9 | 15.3 | 14.5 | 8.9 | |
| 92 Municipalities | |||||||||||||||
| Average | 806.6 | 1102.9 | 59.5 | 72.9 | 207.4 | 0.3 | 22.7 | 17.1 | 188.9 | 580.0 | 15.7 | 316.9 | 6.4 | 6.3 | 4.1 |
| Standard Deviation | 1463.1 | 1694.4 | 126.7 | 144.8 | 381.9 | 1.0 | 43.6 | 48.0 | 455.7 | 1015.3 | 37.4 | 796.9 | 22.0 | 15.2 | 12.4 |
| Median | 206.1 | 454.4 | 17.6 | 25.9 | 76.9 | 0.0 | 5.0 | 3.0 | 17.7 | 201.2 | 0.6 | 47.5 | 0.0 | 0.0 | 0.0 |
| Minimum | 0.0 | 6.3 | 0.0 | 0.0 | 0.0 | 0.0 | 0.0 | 0.0 | 0.0 | 0.0 | 0.0 | 0.0 | 0.0 | 0.0 | 0.0 |
| Maximum | 9153.6 | 9887.5 | 1019.1 | 1143.7 | 2677.0 | 7.4 | 258.9 | 326.0 | 2588.7 | 5995.6 | 216.5 | 6788.2 | 174.5 | 76.4 | 83.7 |
| Number of municipalities with incidence > 300 cases/100.000 inhabitants | |||||||||||||||
| 39 | 54 | 3 | 4 | 16 | 0 | 0 | 1 | 12 | 38 | 0 | 25 | 0 | 0 | 0 | |
Publisher’s Note: MDPI stays neutral with regard to jurisdictional claims in published maps and institutional affiliations. |
© 2022 by the authors. Licensee MDPI, Basel, Switzerland. This article is an open access article distributed under the terms and conditions of the Creative Commons Attribution (CC BY) license (https://creativecommons.org/licenses/by/4.0/).
Share and Cite
de Almeida, P.M.P.; Nobre, A.A.; Câmara, D.C.P.; Costa, L.M.M.; dos Reis, I.C.; Ribeiro, M.S.; Dias, C.M.G.; Ayllón, T.; Honório, N.A. Dengue, Chikungunya, and Zika: Spatial and Temporal Distribution in Rio de Janeiro State, 2015–2019. Trop. Med. Infect. Dis. 2022, 7, 141. https://0-doi-org.brum.beds.ac.uk/10.3390/tropicalmed7070141
de Almeida PMP, Nobre AA, Câmara DCP, Costa LMM, dos Reis IC, Ribeiro MS, Dias CMG, Ayllón T, Honório NA. Dengue, Chikungunya, and Zika: Spatial and Temporal Distribution in Rio de Janeiro State, 2015–2019. Tropical Medicine and Infectious Disease. 2022; 7(7):141. https://0-doi-org.brum.beds.ac.uk/10.3390/tropicalmed7070141
Chicago/Turabian Stylede Almeida, Paula Maria Pereira, Aline Araújo Nobre, Daniel Cardoso Portela Câmara, Luciana Moura Martins Costa, Izabel Cristina dos Reis, Mário Sérgio Ribeiro, Cristina Maria Giordano Dias, Tania Ayllón, and Nildimar Alves Honório. 2022. "Dengue, Chikungunya, and Zika: Spatial and Temporal Distribution in Rio de Janeiro State, 2015–2019" Tropical Medicine and Infectious Disease 7, no. 7: 141. https://0-doi-org.brum.beds.ac.uk/10.3390/tropicalmed7070141