1. Introduction
The need for continuous improvements in gas turbine performance, in terms of efficiency and rangeability, alongside the need of a deeper understanding of the flow physics, still asks for important theoretical and experimental efforts and research. A key field of interest—among the many involved in gas turbine studies—is thermo-fluid-dynamics, pillar for getting a holistic comprehension of turbomachinery and for their optimal design. In this context, one of the major interests in present-day research is the interaction between system components, as well as stationary and rotating rows of turbomachinery. Multiple classes of problems can be acknowledged, such as the combustor–1st turbine stage interaction, the stator–rotor interaction in both high-pressure and low-pressure turbines, the last turbine stage–diffuser interaction, the impeller–diffuser interaction and the surge in compressors.
With specific reference to turbines stages, the stator–rotor interaction consists of potential field interference, wake/shock/vortex-blade interaction, wake-wake interaction and wake/vortex-secondary flow interaction [
1,
2,
3,
4,
5,
6,
7,
8,
9,
10,
11,
12,
13]. In general, most of the papers focus on the effect of the stator flow structures on the rotor aerodynamics and performance, as the spatial non uniformities at the stator exit result in time-varying inlet boundary conditions for the rotor. Only a few studies report about the effects of the rotor potential field on the stator, for example, [
14] for subsonic turbines and [
15] for transonic high-pressure turbines; these studies typically include measured data on the stator blade surface. Thanks to the recent improvements in measuring techniques—such as fast response aerodynamic pressure probes—and CFD codes, it is now possible to more proficiently track these features, also considering the detailed flow configuration in-between the blade rows, i.e., in the stator–rotor axial gap.
When discussing the flow unsteadiness in turbomachines, one basic observation is the inherent link between unsteady flow and work exchange [
16], related to the coupling, valid for inviscid flows, between the material derivative of the total enthalpy and the local time-derivative of the static pressure:
The same concept, when applied to a wake incoming on a turbine cascade and impinging on the blades, was observed to produce a local increase in the total enthalpy and pressure, due to onset of energy separation effects [
17].
Similar features may apply also to the potential field, with the important difference that the pressure field also propagates upstream of a cascade (at least up to the sonic throat of the upstream cascade, if this latter is choked) which might lead, in case of a rotor, to the onset of unexpected flow features within the stator–rotor axial gap. Such features, not visible if applying time-mean measurement techniques or steady computational models, can instead be highlighted by resorting to unsteady measurements and time-accurate CFD simulations. This is indeed the focus of the present paper, which aims at discussing the effect of the rotor potential field on the flow released by the stator, thanks to a combined experimental and numerical approach.
The paper is structured as follows: at first the experimental and numerical approaches are described, then the experimental results are discussed with the support of CFD results for physical interpretations and, finally, some conclusions are derived.
2. Test Facility and Measuring Techniques
The test rig and instrumentation applied in the present research work are already described in other papers: see, for example, [
18]. In this section, they are briefly recalled.
2.1. Test Rig and Axial Turbine Stage
The test rig run for the present investigation is the high-speed test rig for turbine and compressor located at the Laboratory of Fluid Machine (LFM) of the Energy dept. of the Politecnico di Milano. It consists of a radial section where a centrifugal compressor is run and, in the present investigation, it feeds the turbine with the proper pressure ratio and flow rate; its maximum rotational speed is 45,000 rpm with a power available upstream of the gearbox of 800 kW. The radial section is then followed by a cooler to set the temperature level of the rig, a venturi pipe to measure the flow rate and a throttling section to control the expansion ratio made available to the turbine. The turbine is located in an axial section, whose maximum rotational speed is 20,000 rpm.
The axial turbine stage is a single stage, not cooled, representative of a high pressure one. The main features are reported in
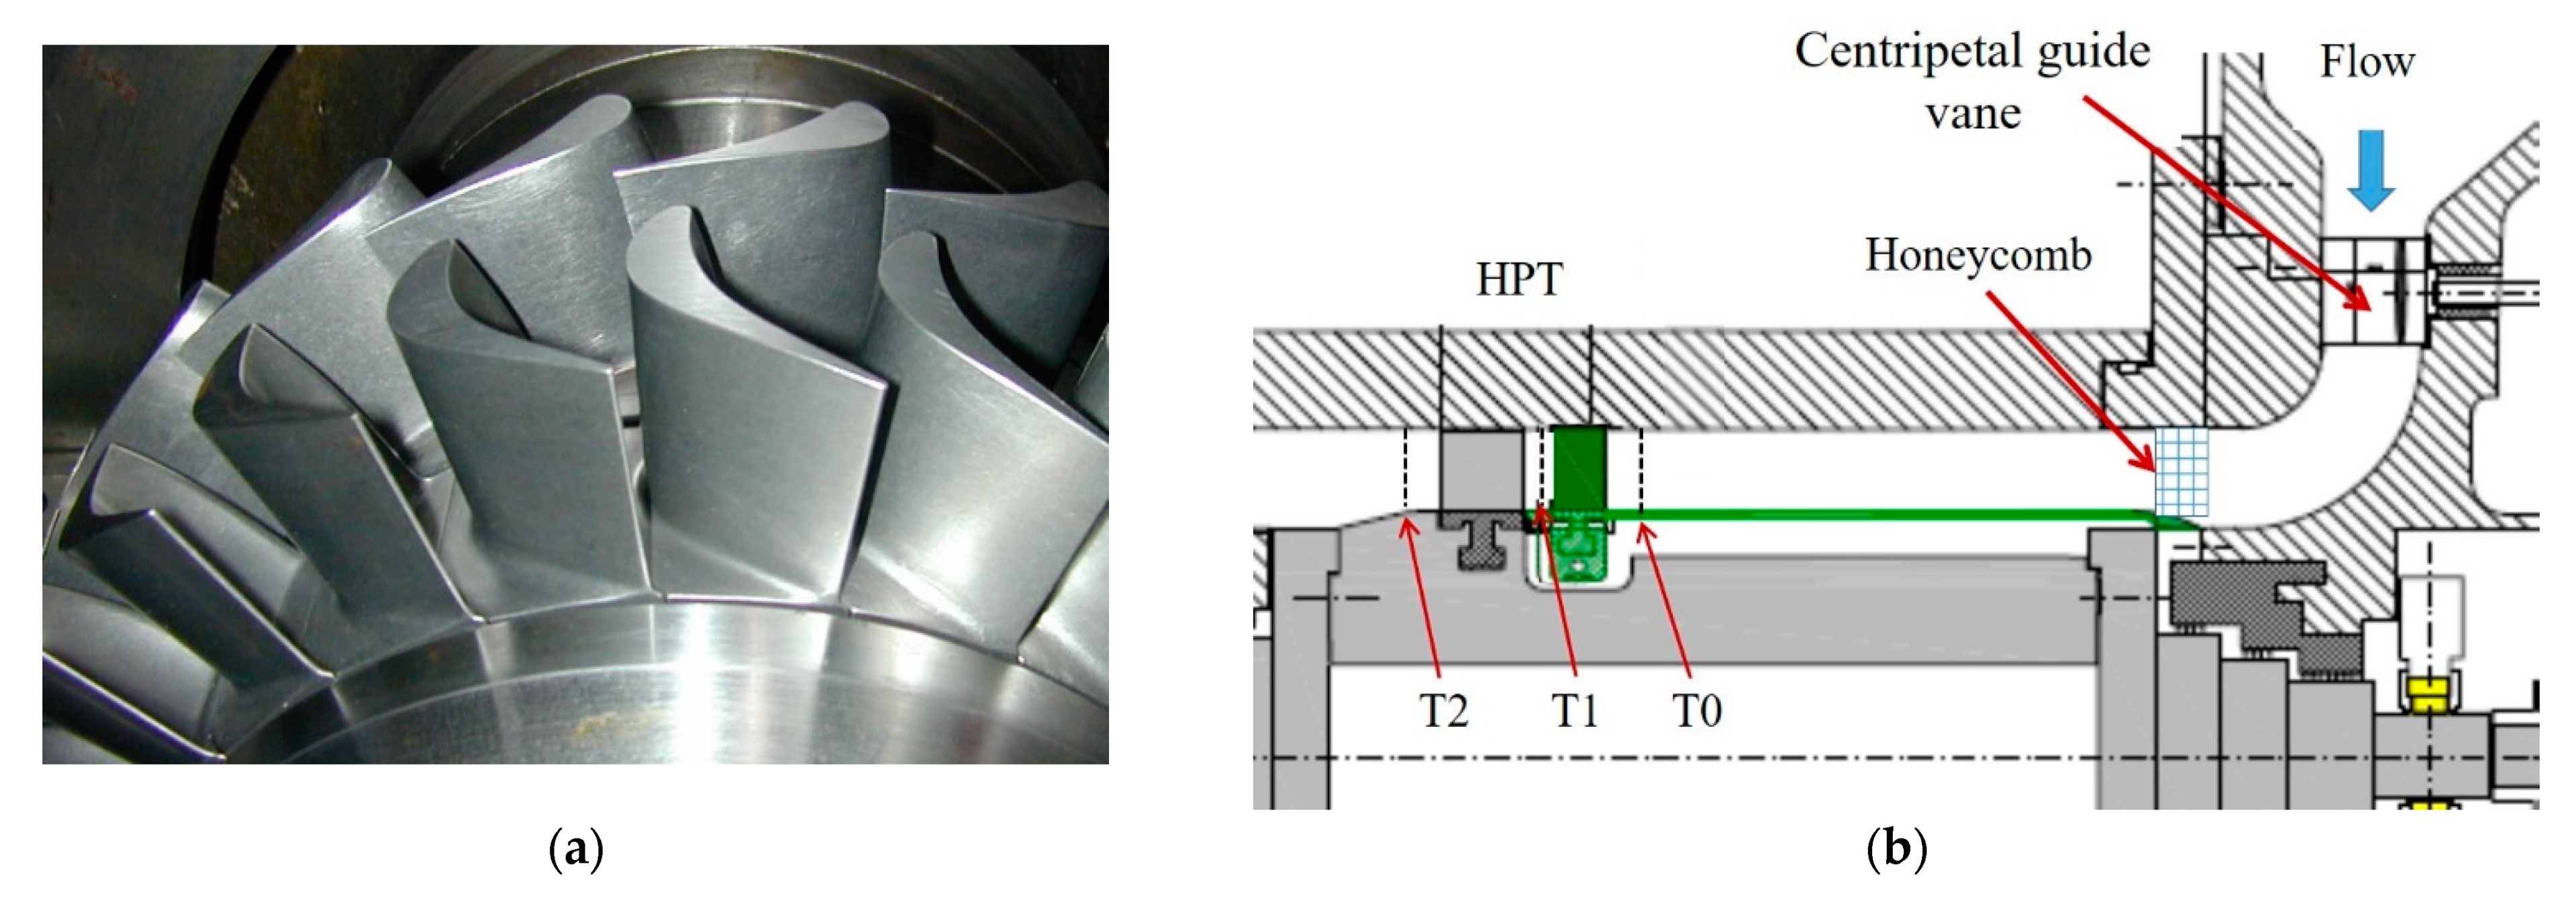
Table 1; in addition, the stator blade is leaned by 12° on the pressure side and at midspan it has a geometrical discharge angle of 75.4°. The rotor is bowed with a constant outlet angle of −67.7°, it has a clearance at tip of 0.6 mm and a blade height of 50 mm (clearance included). The axial distance between the stator and the rotor is equal to one stator axial chord (30.6 mm), easing the probe insertion.
Measurements were taken at 71% of the stator axial chord downstream of the stator trailing edge, all over the channel height: the measurement grid counts 320 points (16 points on the stator pitch, 20 points along the blade span) on each stator channel.
Figure 1 reports a picture of the stage and a sketch of the meridional section.
2.2. Measurement Techniques
In the present study, besides the instrumentation for the rig management, only a Fast Response Aerodynamic Pressure Probe (FRAPP) was applied. The reader is referred to [
19] for a picture of the present-day FRAPP, design, operation and technology available at Politecnico di Milano and to [
11,
13,
18] for the FRAPP application in the rig.
The FRAPP here applied has a cylindrical head (diameter of 2 mm) where a single sensor is inserted (Kulite, model XCQ062) and connected to the external environment by a hole whose diameter is 0.35 mm. The probe promptness, evaluated on a shock tube, is 100 kHz after digital compensation thanks to the very small size of the line-cavity system facing the sensor. The probe is applied in the absolute frame of reference as a virtual 3 holes probe by rotating it around its own stem and then re-phasing the measurements making use of the key-phasor. Each pressure data set is acquired at 500 kHz and has 500,000 samples.
In addition to the standard use described in the aforementioned papers, by applying the methodology proposed in [
20], it is possible to have a qualitative evaluation of the turbulence level. Thanks to this quantity, it is possible to track and evaluate the viscous structure released by the stator.
For the specific investigation, each rotor pitch has been discretized by means of 40 points.
As for the rig instrumentation, the inlet and outlet temperatures are monitored by T thermocouple, whose uncertainty after calibration is 0.3 °C.
The stage inlet and outlet pressure level are measured by means of Kulite transducers (model XT190) whose uncertainty, after calibration, is 60 Pascal.
FRAPP data reduction is based on the phase-averaging techniques. First, the pressure measurements are phase averaged by referring to the key-phasor signal: the averaged value in each interval (40 per rotor pitch) is thus the result of about 12,000 samples. Second, by applying the calibration matrices, they are used to derive the flow quantities in terms of total and static pressure, flow angle. Finally, assuming a total temperature constant across the stator, the velocity field is determined and—by the peripheral speed—the flow conditions in the rotating frame of reference are calculated. As it will be discussed in the last section, the total temperature fluctuates by about ±1 K; the corresponding velocity fluctuation is expected to be of the order of 0.1% and, hence, negligible, also considering that the Mach number is correct coming from a phase-resolved data reduction.
Overall, pressure values have an averaged uncertainty of 0.5% of the kinetic head measured by the FRAPP.
The phase averaged signals for the different stator positions (in all the blade span positions) are re-organized in order to map the stator—rotor interaction for the different stator to rotor positions. The time mean quantities in the absolute frame of reference are calculated by averaging in time the phase averaged flow quantities. The time mean quantities in the rotating frame of reference are calculated by averaging the stator to rotor interaction positions, acknowledging the rotor pitch periodicity.
3. CFD Model and Experimental Validation
In this study, CFD simulations mainly act as support to the interpretation of the experimental result. The calculations were performed using ANSYS-CFX, applying the flow model developed at Politecnico di Milano for turbomachinery flow simulations, discussed in detail in [
21] and briefly summarized in the following. Fully 3D and time-resolved calculations were performed, modeling the fluid as perfect gas and introducing turbulence effects by resorting to the fully-turbulent k-ω SST model. The near-wall resolution was specified so to guarantee y
+ < 1 on endwalls and on blade surfaces, thus avoiding the use of wall functions. Unsteady terms are discretized with an implicit second order scheme, the advection terms with a high-resolution total-variation-diminishing scheme, the diffusive terms with a second order central scheme. Simulations were performed by assigning, at the inlet, the measured radial profile of total pressure, uniform total temperature, axial flow direction and a uniform turbulence intensity of 2.5%, resulting from dedicated hot-wire measurements (the eddy viscosity ratio was set equal to 25, following the recommended expression proposed by the solver). A radial-equilibrium distribution of static pressure was assigned at the outlet.
Coupled stator–rotor simulations were performed, first resolving the flow in steady-state fashion using a mixing-plane stator–rotor interface for initialization and then moving to time-resolved analysis. Given the different blade numbers between the stator and the rotor, to simulate the full stator–rotor coupling (i.e., also the rotor-to-stator interaction and not only the stator-to-rotor interaction as was conducted in [
21] where only the unsteady flow in the rotor was solved) while saving computational cost, the time-inclined solution strategy proposed in [
22] was adopted. By virtue of this method, spatial-temporal solutions are obtained so to guarantee automatically the phase-lag between periodic boundaries and neither multiple channels nor alteration of the cascade solidity (or blade scaling) are required.
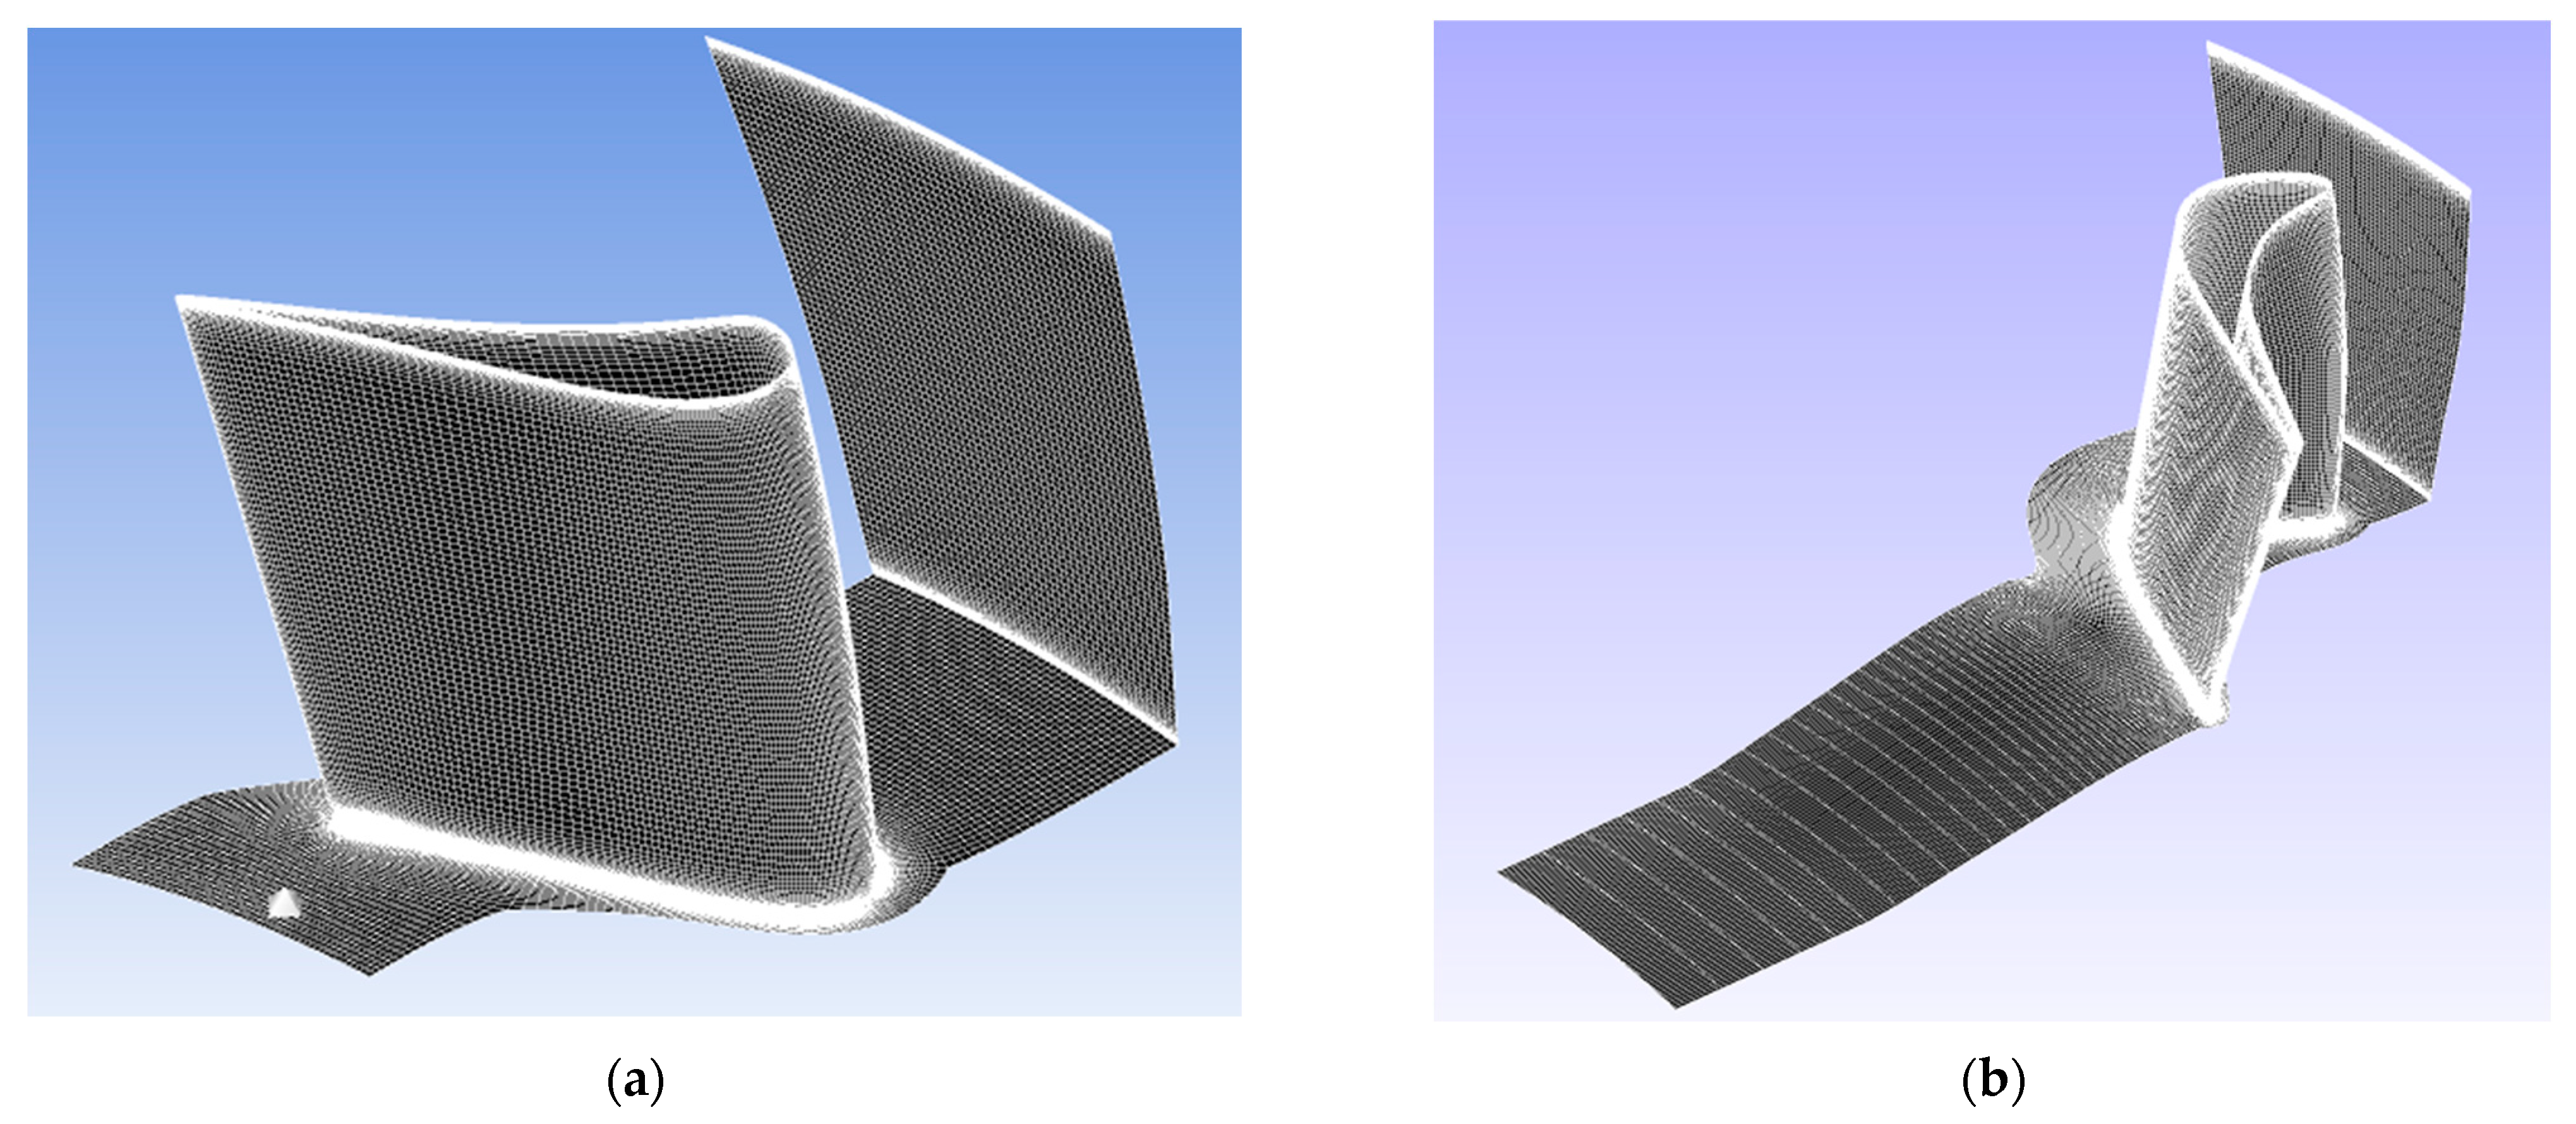
The solver integrates the equations over structured meshes composed by hexahedral elements. A grid-dependence study was performed to select the proper spatial resolution. The study was conducted by keeping constant the near-wall resolution so that the boundary layer is properly resolved on both blade walls and hub and shroud walls for each of the tested meshes. The mesh dimension ranged from 2.2 million to 18.4 million cells for the entire stage; overall cascade/stage performance data as well as detailed spanwise profiles were considered to judge the influence of spatial resolution. Grid-independent results were achieved for stator and rotor meshes composed by 4.6 million cells, for a total of 9.2 million cells (the difference in stage efficiency with respect to the result obtained with the finest mesh resulted below 0.1%). The final meshes of each blade row, reported in
Figure 2, are composed by 140 cells in spanwise direction and 33,000 cells in each blade-to-blade layer.
The time step was set to 1/56 of the rotor blade passing period (corresponding to about 0.25°); the unsteady solution resulted smooth (due to the subsonic flow regime) and further reductions of the time step were not found to alter the performance prediction and the flow morphology. The specific time step value was selected to optimize the sampling of the 3D solution for post-processing (since the stage periodicity 22 × 25 is close to 7 × 8 and 56 is the least common value of these two numbers). The periodic solution was achieved after 20 periods (the first 12 ones run with a larger time step, 1/25 of the rotor blade passing period). The computational cost of the time-resolved simulation was about one week on a 40-processor cluster.
Before simulations are used to aid the interpretation of the experiments, experiments are used to assess the simulation results.
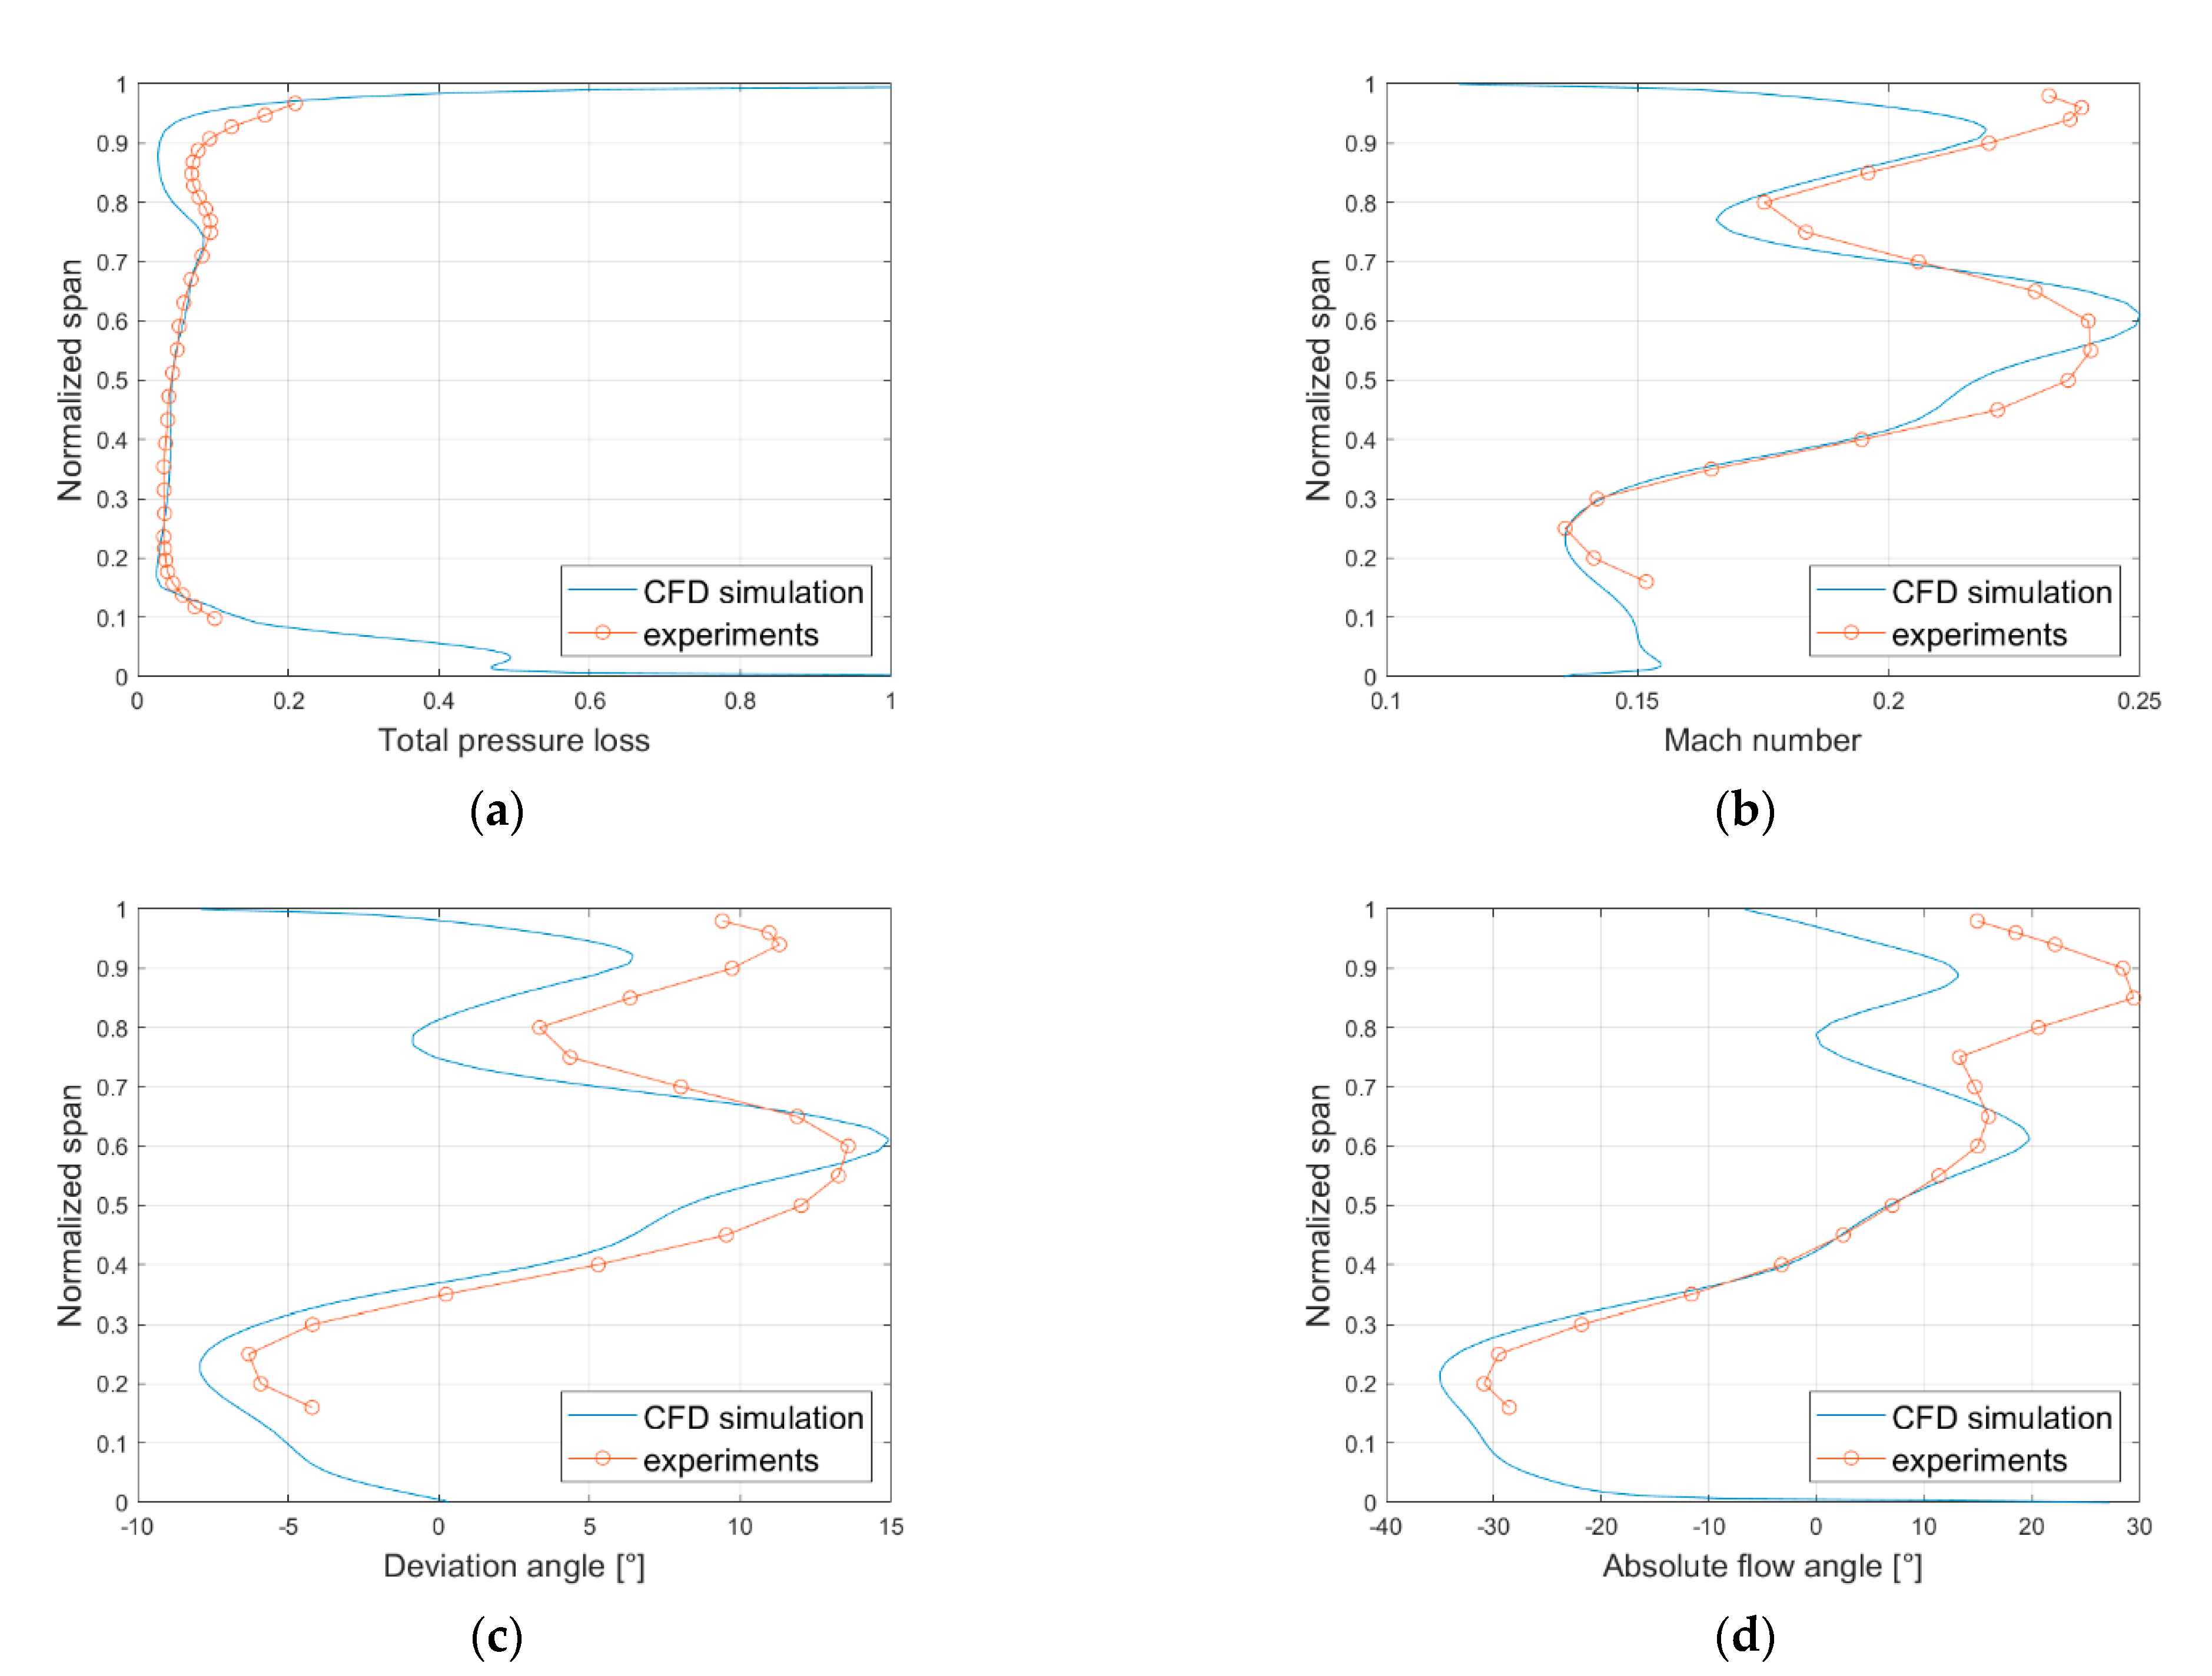
Figure 3 shows a set of spanwise profiles, comparing the computations and measurements both at the stator and rotor exit. The top-left frame of
Figure 3 reports the distribution of total pressure loss coefficient (Yloss) at the stator exit and shows a remarkable agreement between experiment and calculations. It is to be noted that the experimental trend interrupts at 10% span, due to limitations in the probe traversing, so the severe increase of loss in the hub region predicted by the numerical trend cannot be entirely visible in the measurements (but it is outlined in the bottom part of the experimental profile). This generation of loss in the hub region is driven by a hub clearance in the region of the blade tail, whose effect combines with the inherent cascade corner vortex to generate a wide vortex counter-rotating with the hub passage vortex. More details on the stator aerodynamic will be discussed later, when analyzing the flow configuration.
The remaining three frames of
Figure 3 report the spanwise profiles of Mach number, deviation angle (defined as the difference between the relative flow angle and the blade metallic angle) and absolute flow angle downstream of the rotor. Again, a good agreement was found between simulations and experiments, especially below 80% span. The spanwise flow configuration appears highly non uniform, marking the presence of large over-turning (i.e., low/negative deviation angle) region at 20% and 80% span caused by the secondary flows and an underturning region at midspan, where the two large rotor passage vortices come to interact. The simulations capture well the radial extension and the spanwise migration of the vortices, as well as their impact on the flow angle. Larger discrepancies appear only in the top 20% span, where a wide tip leakage vortex develops and proves to be challenging for the turbulence modeling used in this study.
Accordingly, a very good quantitative agreement is also obtained in terms of cascade and stage efficiency. The overall stator loss coefficient, estimated from the experiments equal to 5.9%, resulted 5.4% from the simulation (averaging over the span covered by the measurement traverse). The total-total stage efficiency, calculated as the ratio between the Euler work (computed as the difference between the terms weighted on the flow rate upstream and downstream of the rotor) and the total to static isentropic enthalpy drop, is estimated as 86.4% from experiments, with an uncertainty quantified in ±0.5% and resulted equal to 85.5% in the CFD simulation.
The quantitative and qualitative reliability resulting from this assessment study indicate that the present simulation can be used as an effective tool for the physical interpretation of experimental data.
4. Results
This section presents the results of the flow downstream of the stator, first neglecting the stator–rotor interaction and then highlighting its effect. The flow field is discussed first from the perspective of a stationary observer, to show what discharged by the stator and then in the rotating frame of reference, to present what enters into the rotor according to its own perspective.
Results will be presented first in a time-mean form to evidence the gross features of the flow and secondly by the description of the different interaction phases between the stator and the rotor.
4.1. Time Averaged Quantities
4.1.1. Absolute Frame of Reference
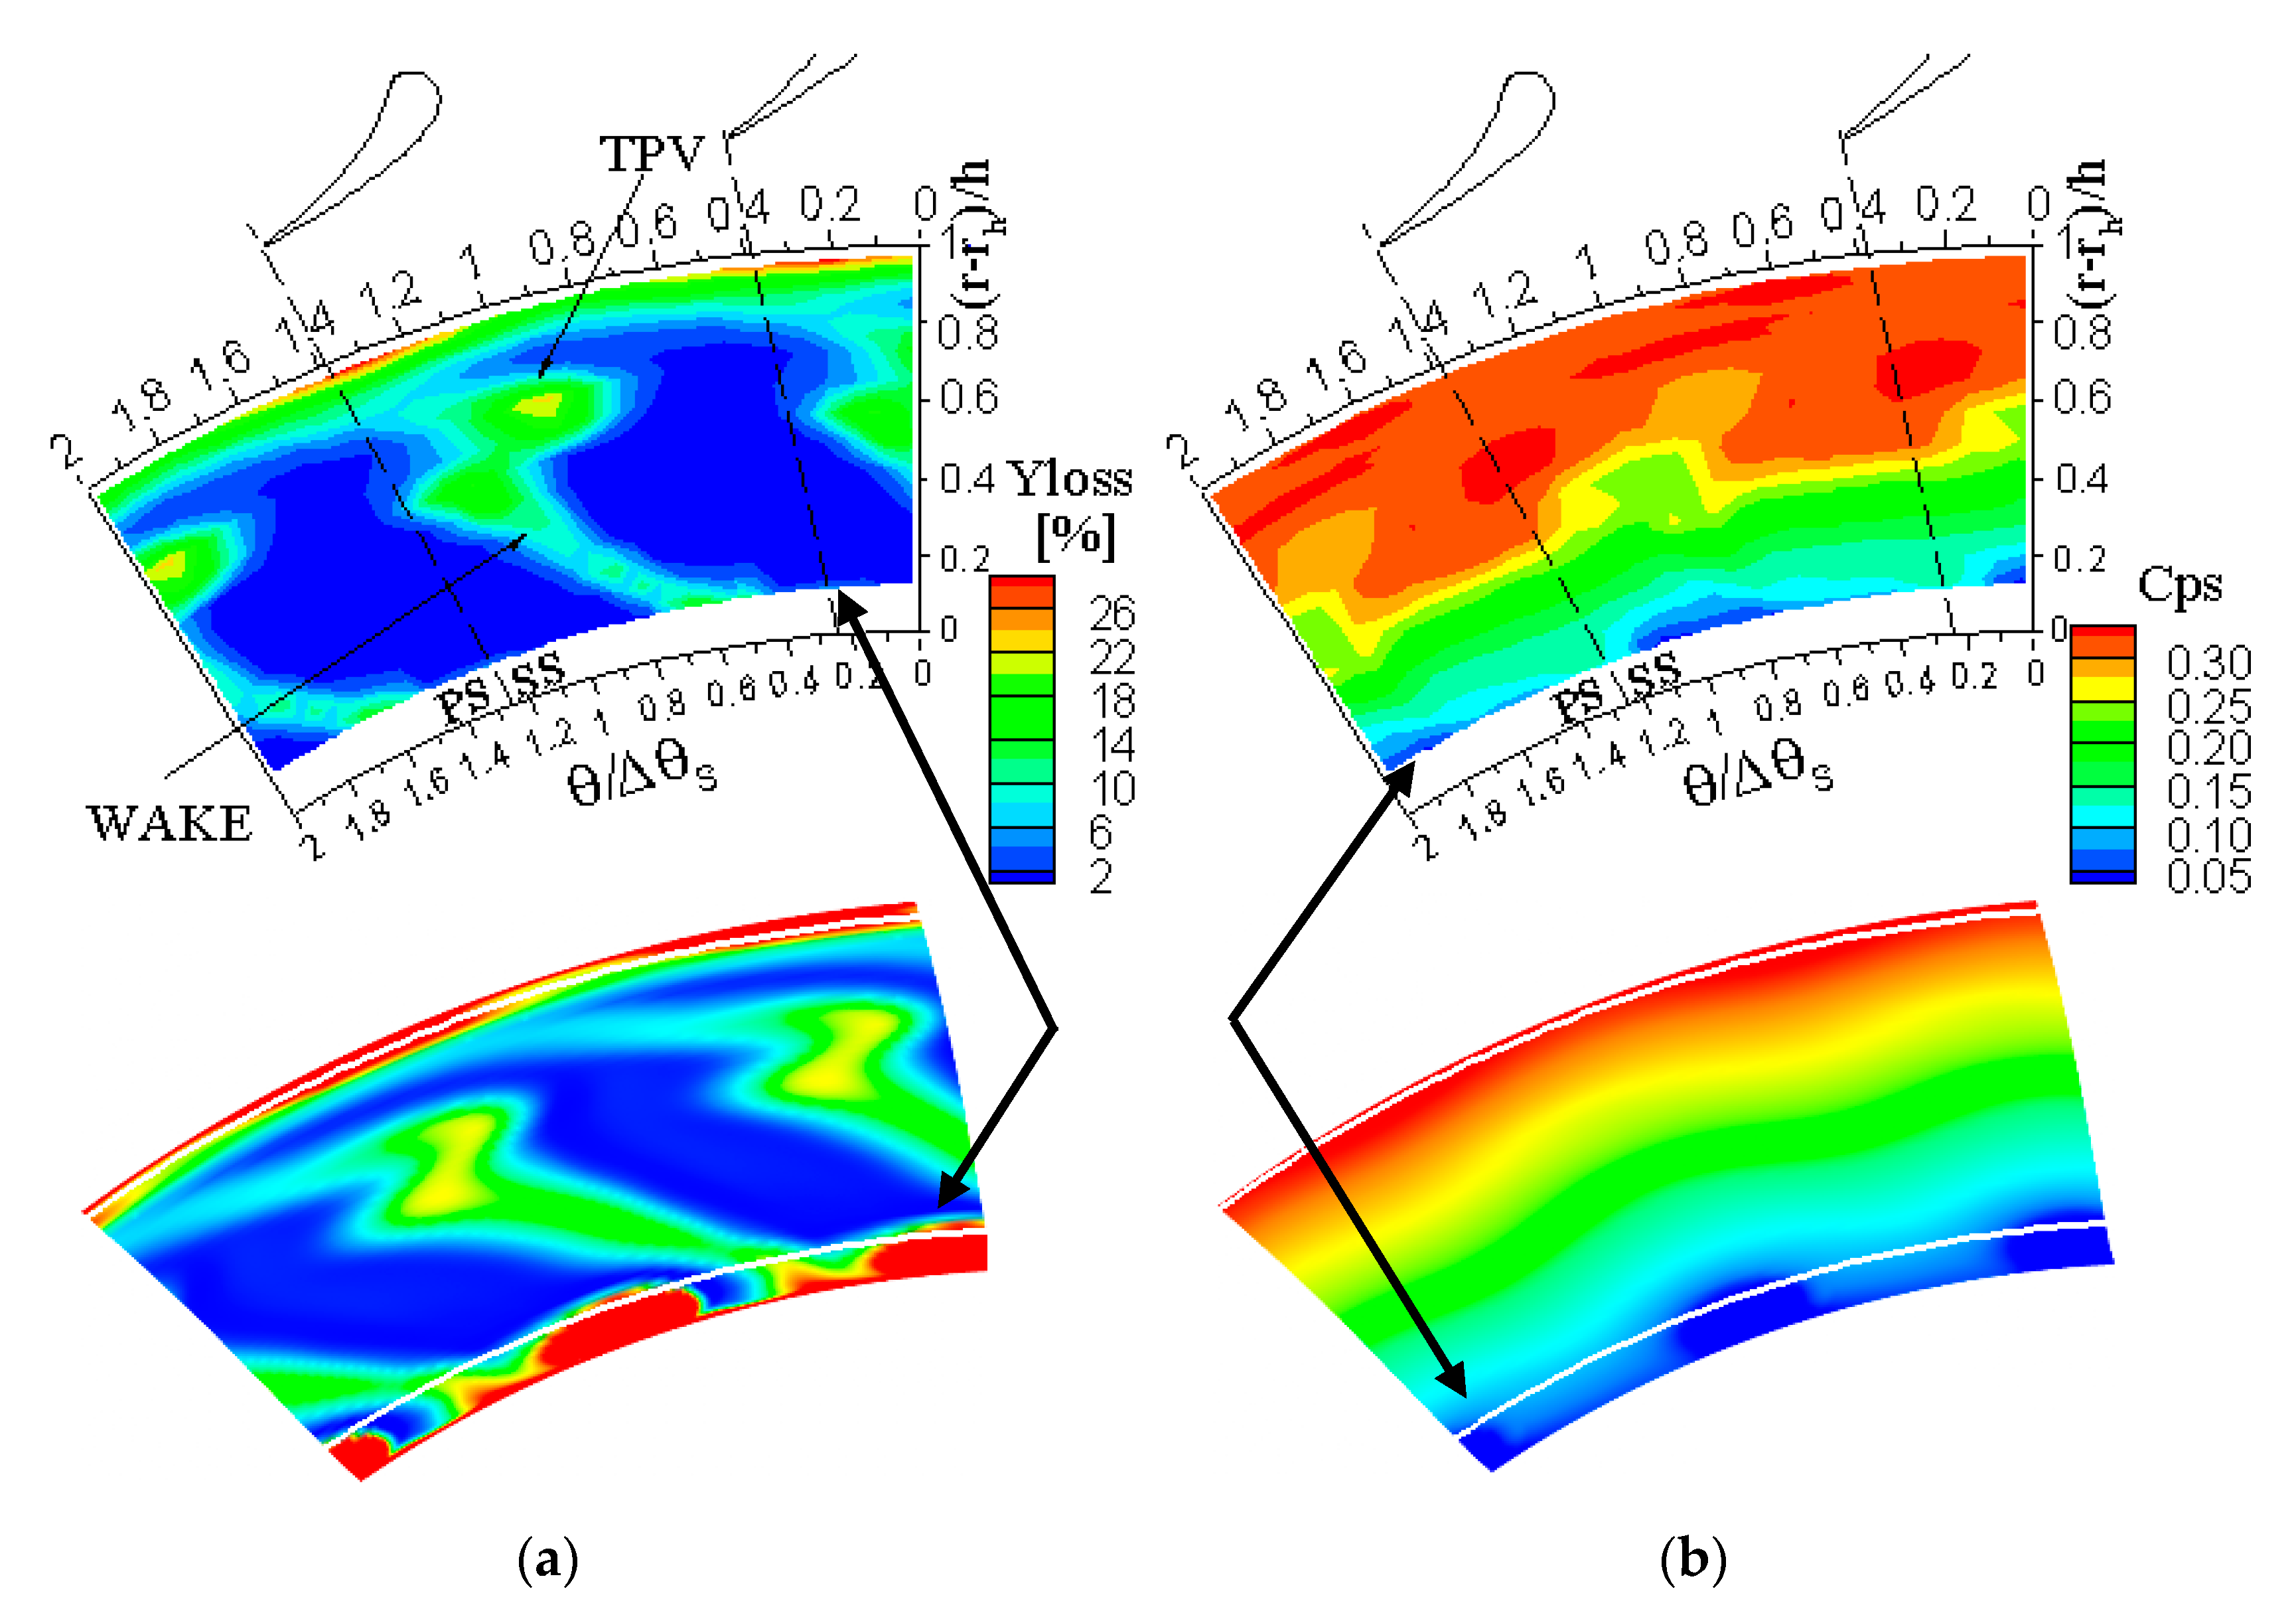
One of the most important physical quantity to describe is the total pressure and its related total pressure loss coefficient. In stators, losses are generated by the blade boundary layers, the wake shed downstream of the blade trailing edge and the secondary vortices and their mutual interaction (shock losses being absent due to subsonic character of the flow). Given such occurrence, a typical distribution of total pressure loss coefficient downstream of the stator located in the present test rig is reported in the frame (a) of
Figure 4, as measured by FRAPP (top) and predicted by CFD (bottom) within the stator–rotor gap.
As extensively discussed in [
11,
18] the narrow loss trace along the span is the wake, whereas the two cores, one at the hub and the second one at 75% span, are related to the secondary flows and to their interaction with the wake. The wake, evidenced both in the total pressure and loss field, is distorted by the action of the secondary flows, by the blade twist and lean resulting in a spanwise variation of flow angle from 85° at the tip to 64° at the hub. These features are properly captured by the code, demonstrating the fidelity of the simulation tool also on a distributed level. In the hub region, a wide loss core appears, induced by the hub clearance. Even though measurements are not available in this region (the bottom and top limits of the measurement surface are marked in the computed field by white lines), the very bottom part of the measurement plane indicates an increase of loss coefficient in the central part of the channel (far away from the wake) consistent with what predicted by the code. While this feature is weakly visible here (though present and marked by black arrows), it clearly appeared in the five-hole probe measurement data presented in [
18] for that the probe design allowed to extend the measurement grid closer to the hub end wall. The static pressure field, shown in
Figure 4b evidences the usual radial pressure gradient due to the radial equilibrium, combined to a circumferential perturbation resulting from the suction/pressure gradient across the blade passage still not completely decayed at this axial position. The pressure field marks the perturbation produced by the hub vortex, also evident in the experiment.
All frames appearing at the top of
Figure 4 were obtained by time-averaging the FRAPP data and for this reason the periodic unsteadiness given by the rotor is filtered. Exploiting the FRAPP promptness and applying the so-called triple decomposition to the pressure signal, it is possible to extract the resolved (periodic) and unresolved unsteadiness of the flow. Filtering only the periodic component, the resulting signal can be interpreted as the random total pressure oscillation due to turbulence and its standard deviation RMSP can be used as marker of regions of high turbulence [
22]. All the low total pressure regions identified above find perfect correspondence with high RMSP regions, as visible from the RMSP map reported in
Figure 5, assessing the interpretation of such regions as viscous flow structures released by the stator. This observation, which appears trivial on a time-averaged basis, will become less trivial when we will focus on the stator–rotor interaction in
Section 4.2 of the paper.
4.1.2. Rotating Frame of Reference
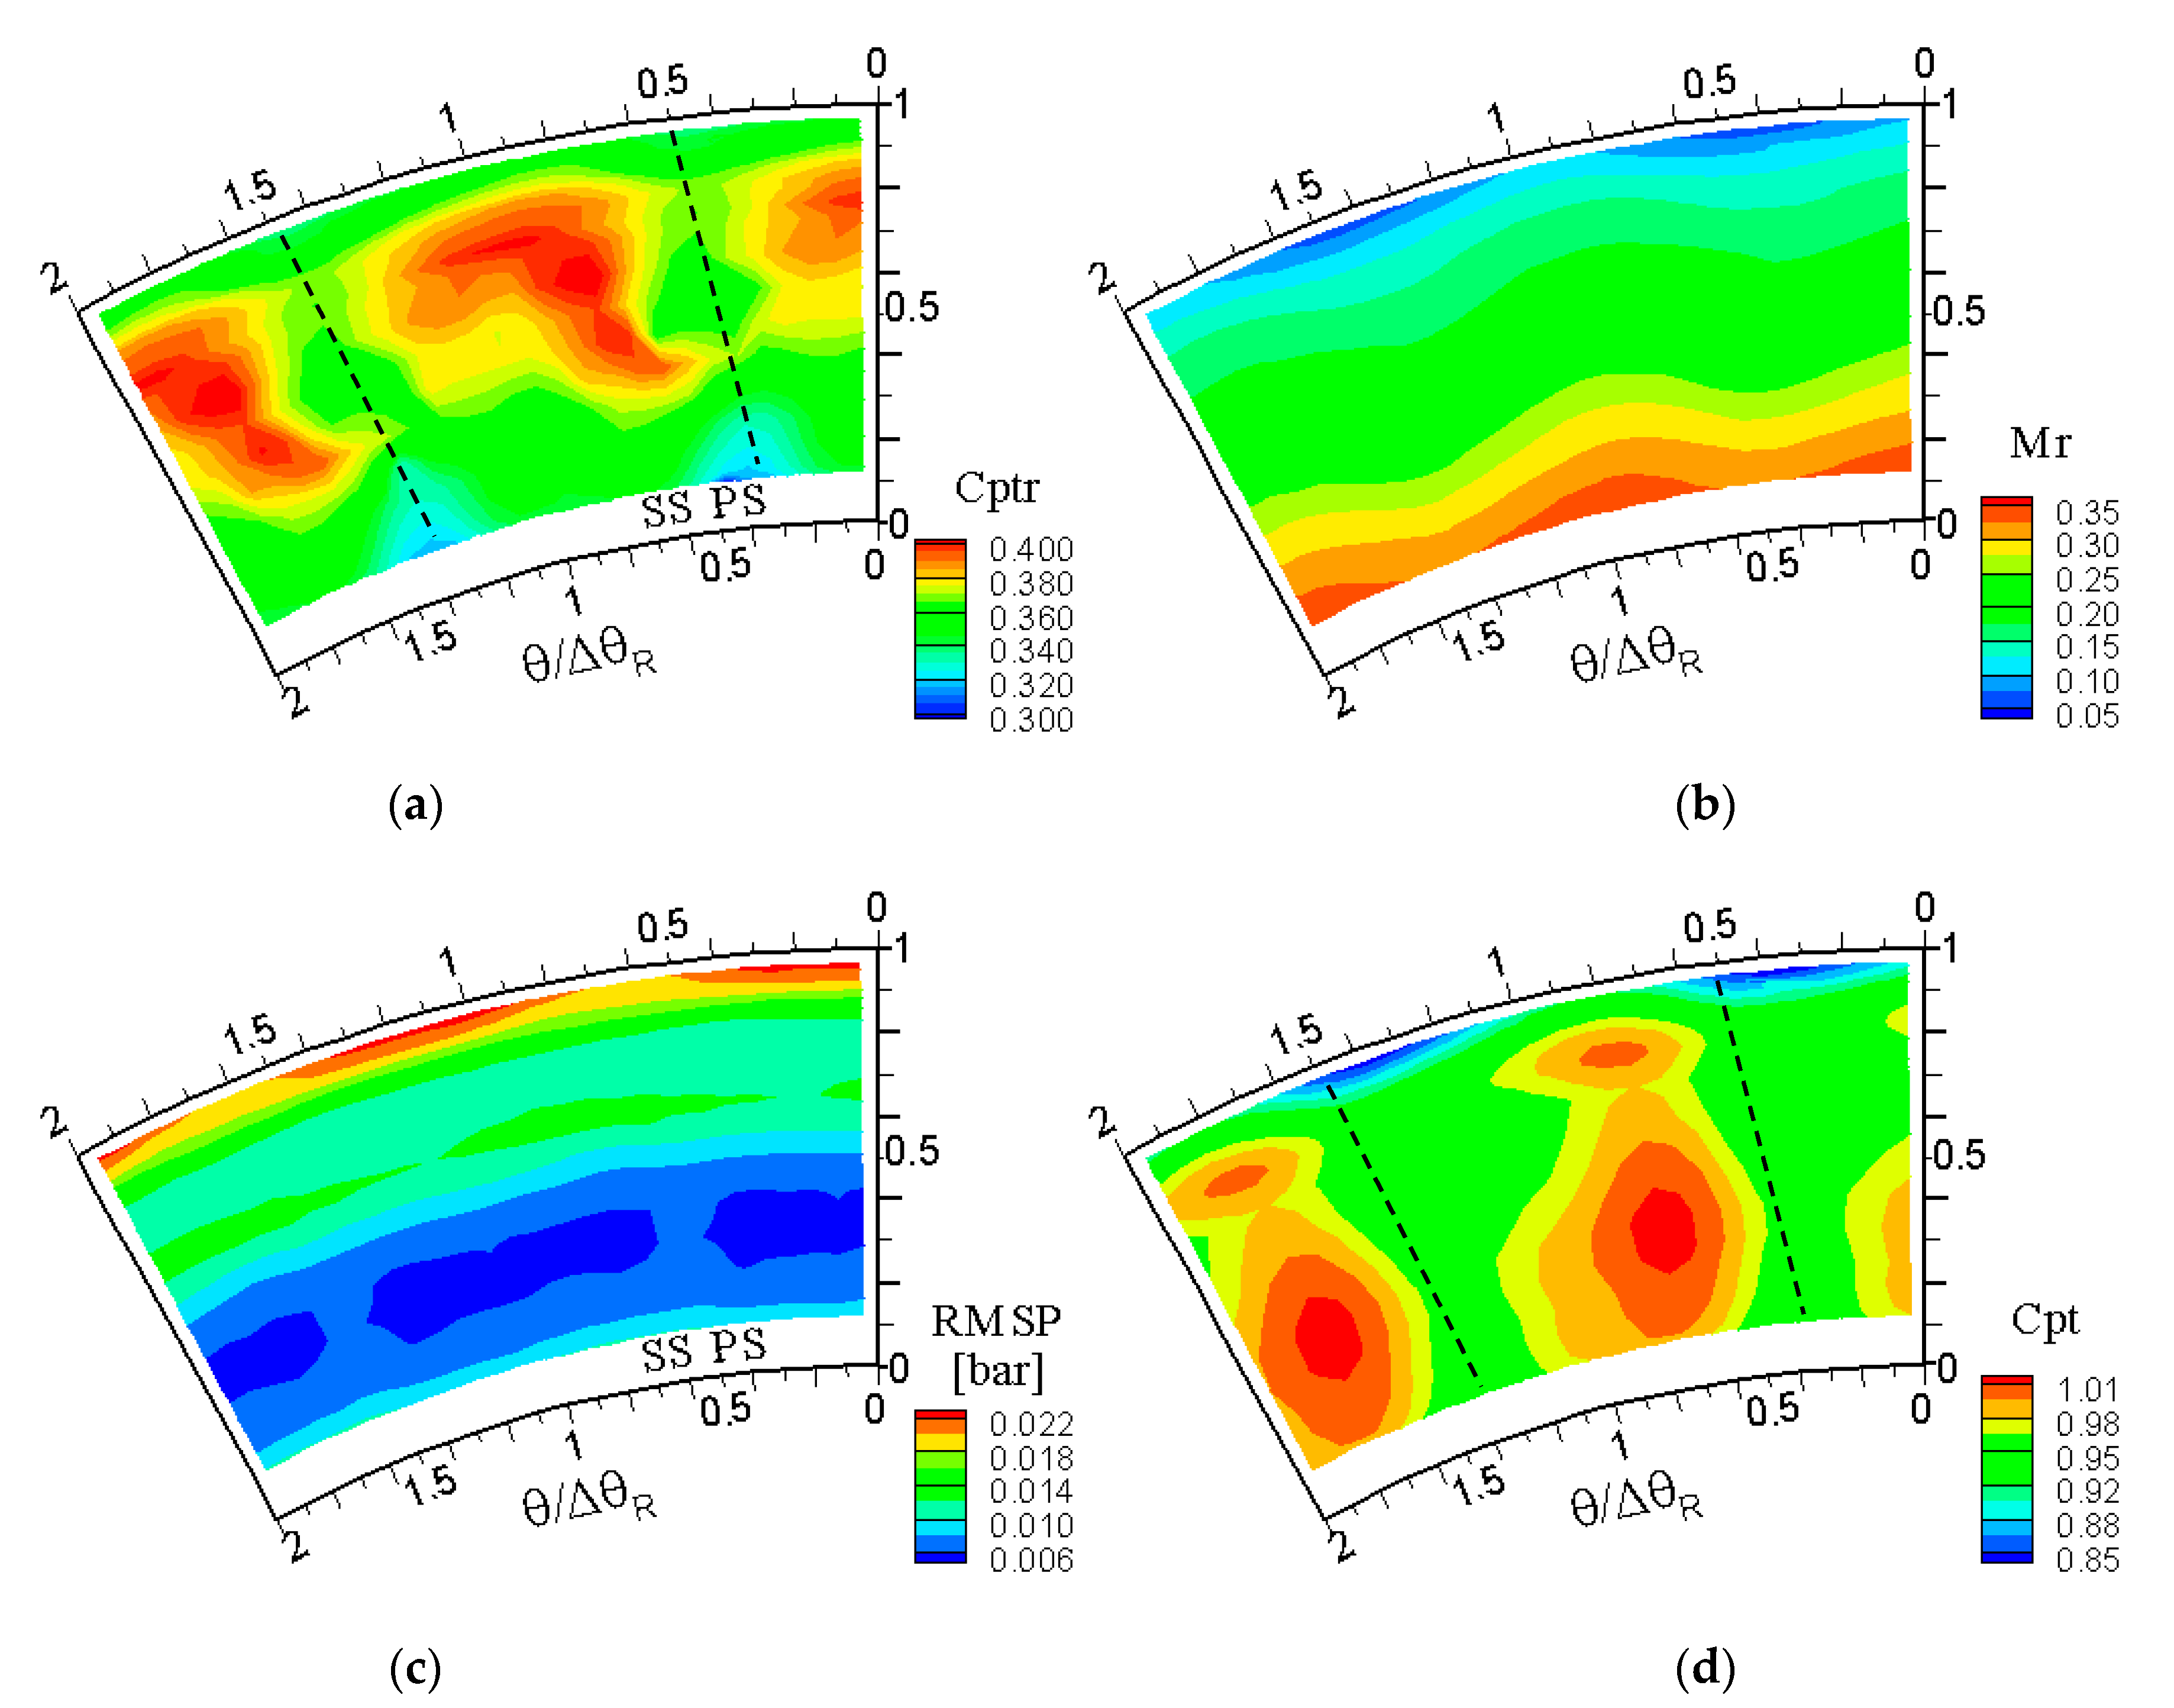
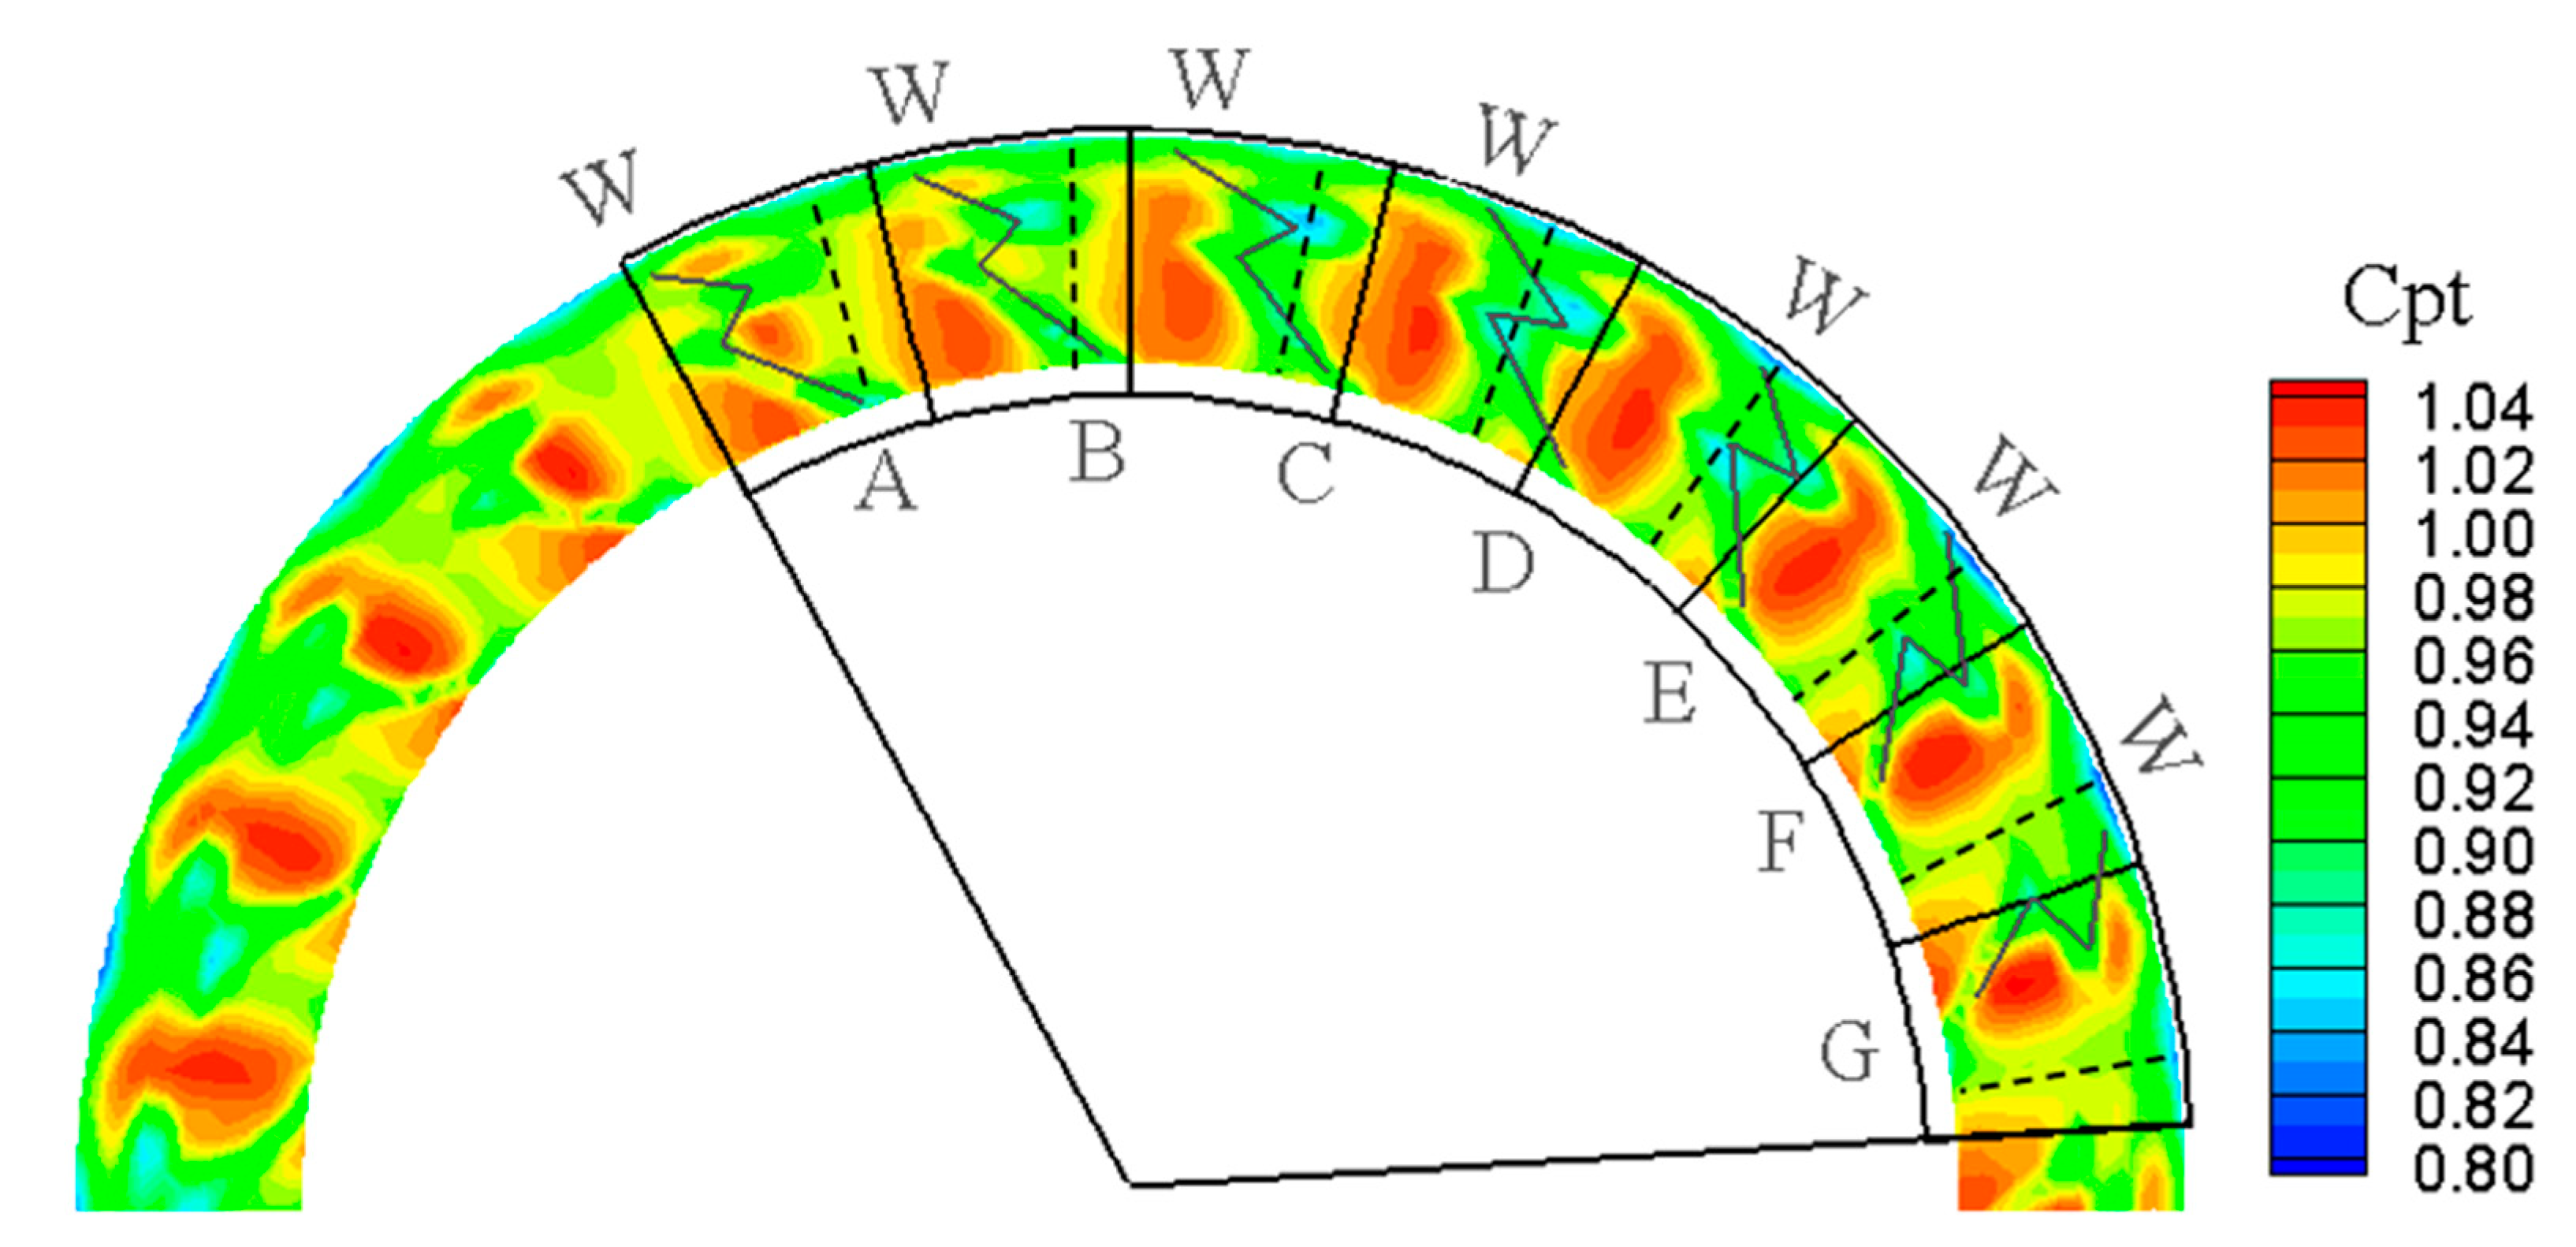
When the perspective is changed from the stationary to the rotating frame of reference, different flow features can be highlighted. In the rotating frame, usual meaningful quantities are the relative total pressure (and its related coefficient Cptr) and the relative Mach number (Mr) entering the rotor, whose measured distributions are reported in the two top frames of
Figure 6.
As for the Cptr distribution in circumferential direction, it shows a peak and a sink per pitch, thus evidencing a periodic trend; the same feature is found for the Mach number, which presents a trend opposite to that of the static pressure. The shape of the low Cptr region (highlighted by black dashed lines in
Figure 6), which has a nearly constant extension in circumferential direction along the whole channel span, suggests that it is not related to the stator wake (which, instead, is strongly bended); thus, another effect is acting here, clearly related to the rotor.
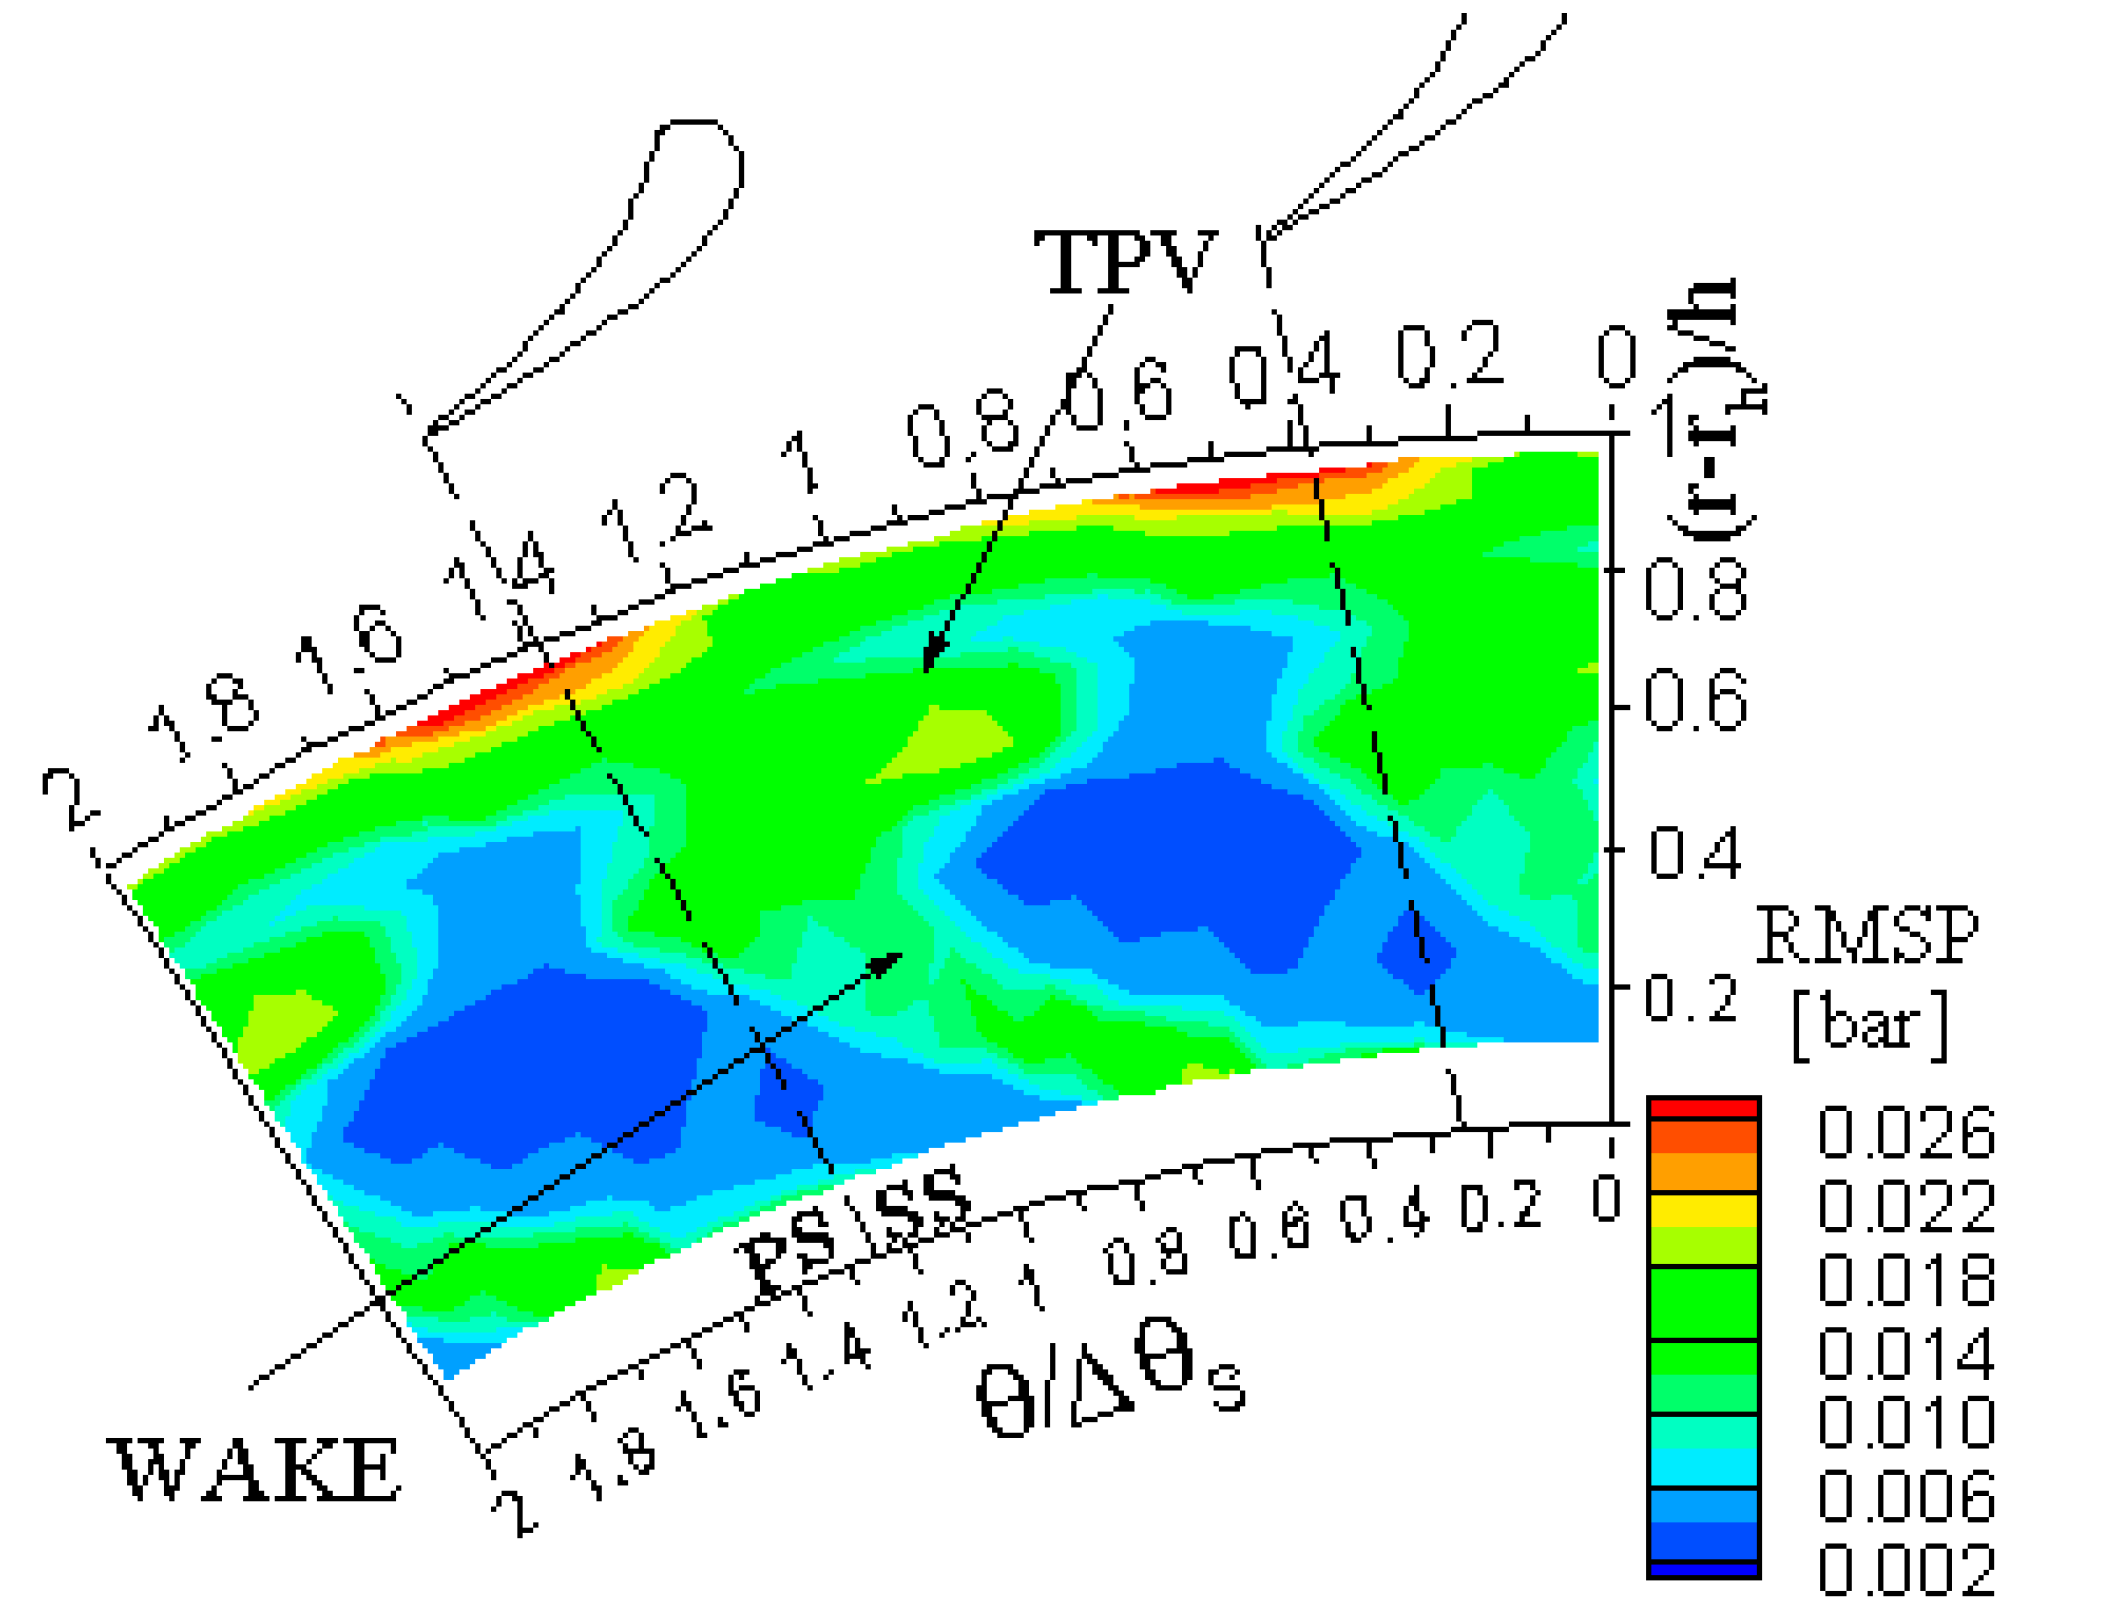
If, somehow artificially, the time-mean distribution of absolute total pressure perceived by a rotating observer is analyzed, one may expect to see a uniform trend in circumferential direction; the same conclusion applies to the RMSP, whose distribution was found to correspond to the one of the absolute total pressure for stationary observers. This expectation is disregarded by measurements, also being visible in the two bottom frames of
Figure 6. As a matter of fact, only the RMSP evidences an azimuthally uniform distribution, whereas the Pt distribution shows an evident perturbation whose spatial periodicity coincides with that of the rotor. The low total pressure region cannot be acknowledged as the stator wake or as the secondary loss region since no characteristic features of those phenomena can be found.
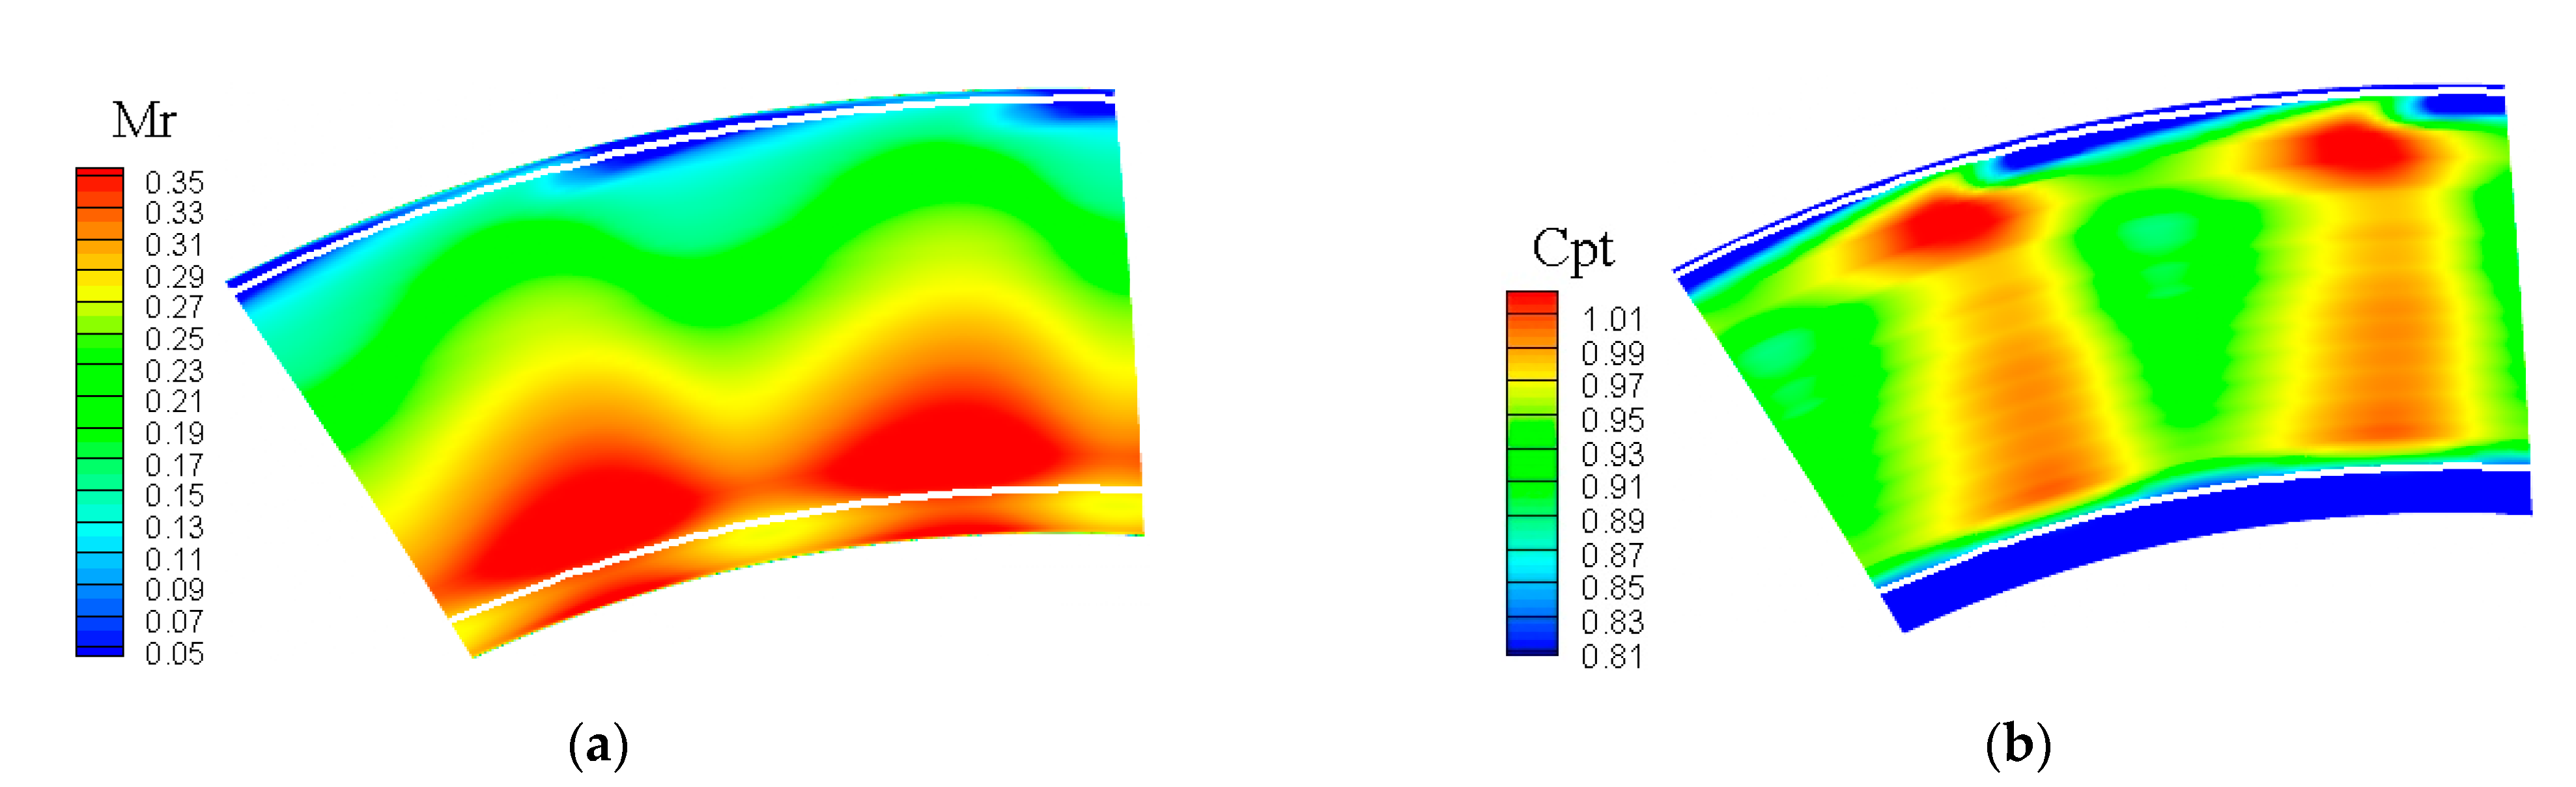
CFD simulation results, reported in
Figure 7, confirm the regular and typical trend of relative Mach number and, especially, the unexpected distribution of absolute total pressure. The reason for these results must be searched for in the stator–rotor interaction phenomena, deeply presented and discussed in the following section.
4.2. Rotor–Stator Interaction Effects
By exploiting the FRAPP promptness and the phase averaging techniques, it is possible to map the different instants of the stator–rotor interaction and, specifically for this analysis, the effect of the rotor on the flow field released by the stator.
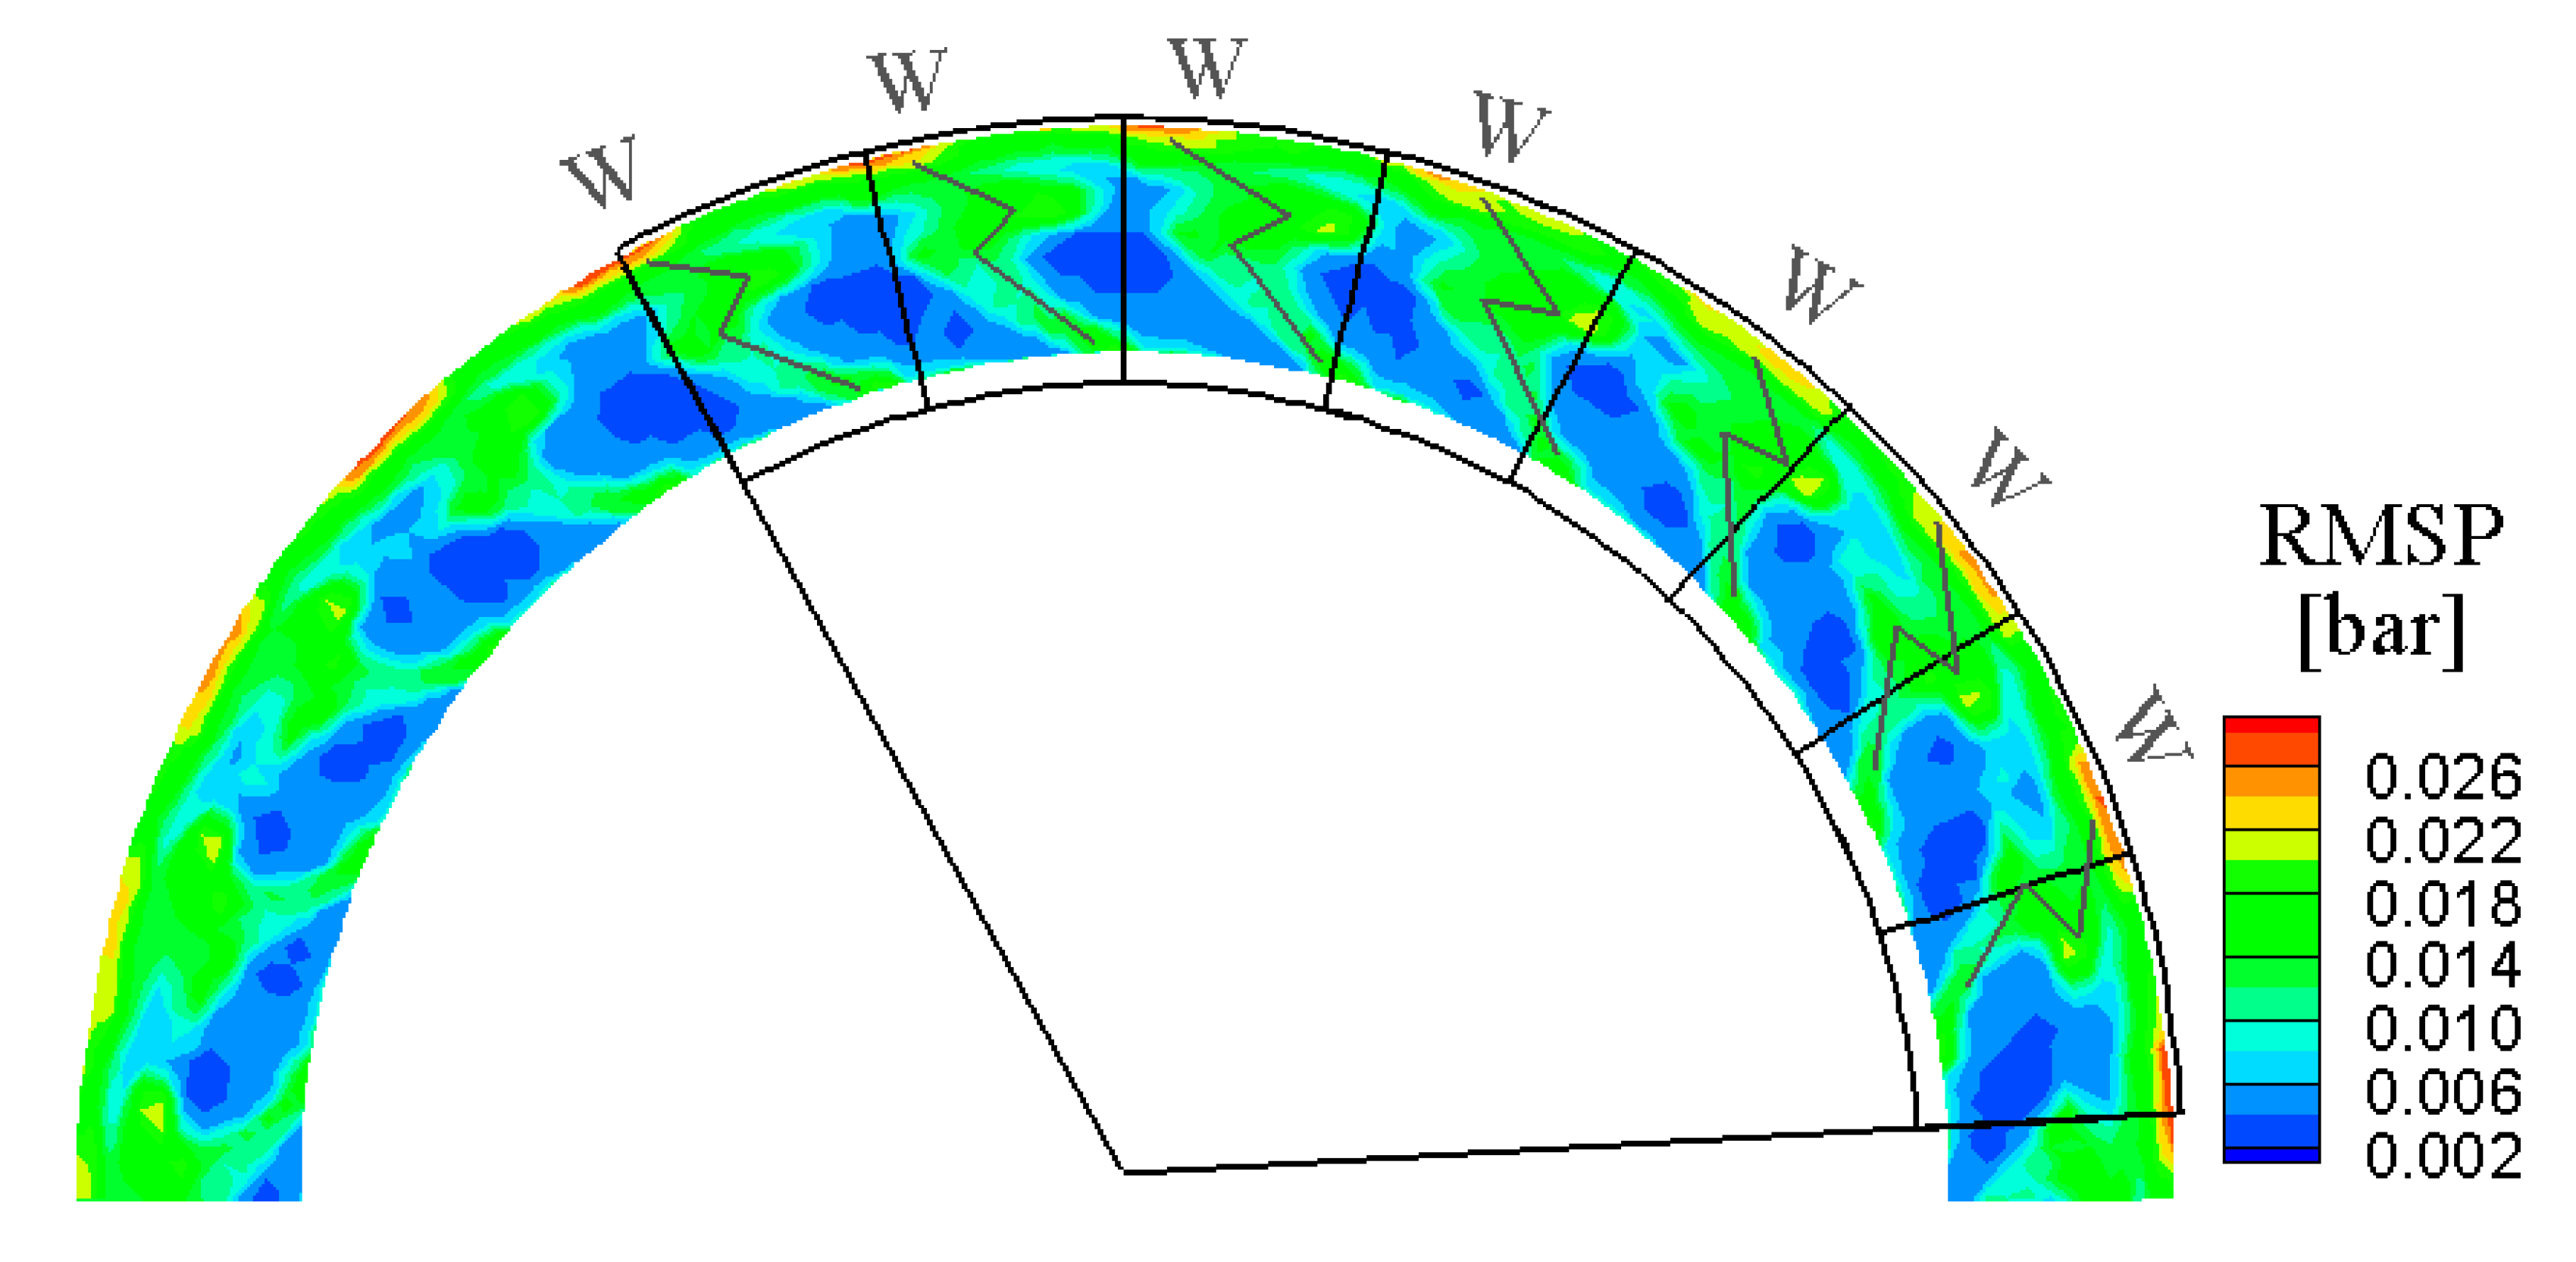
The first quantity described is the RMSP, plotted over half of the stator blade row in
Figure 8. As a preliminary note, in this kind of plots adjacent channels reproduce different stator–rotor interaction phases, due to the phase-lag resulting from the different number of stator and rotor blade rows. As clearly visible, the distribution is nearly periodic with the stator pitch, being mainly related to the stator viscous structures (labelled as W) that are only marginally affected by the rotor–stator interaction. It is also clearly visible a periodicity over the whole crown of about 120° degrees as a consequence of the rotor and stator blade number (25/22 ≈ 8/7, that means 3 nearly periodic configurations over the whole annulus). The outlines of eight rotor adjacent channels are also marked by black lines and the resulting total arc is also reported.
When studying the instantaneous distribution of Pt, reported in
Figure 9, the stator wakes, acknowledged as regions of low Pt/high RMSP in the stationary time-averaged maps, become no longer clearly visible, as shown in
Figure 8. In the
Figure 9 and in the following two figures, the black lines labelled with “W” mark the wake traces identified from RMSP in
Figure 8, and are also renamed from A to G to consider the different channel.
With reference to
Figure 9 and starting from left, a low Pt region coincides with black continuous line A, i.e., the stator wake, but another low Pt zone appears on the right (highlighted with a dashed line), not merged with the former; this second low Pt region is nearly uniform in spanwise direction. As the adjacent channel is considered (wake B), the low Pt zone corresponding to the black line still remains (with marginal difference with respect to the wake A), while the low Pt region ‘moves’ towards the wake and partially overlaps with the latter. For wake C, the two low Pt zones perfectly overlap, leading to the deepest total pressure deficit. Furthermore, shifting from one channel to the adjacent one (wake C to wake D, to E, etc.) the second low Pt region progressively ‘moves’ leftward with respect to the stator wake. The same consideration can be done on the high total pressure region, typically referred to as the isentropic region, where the level is modulated passing from one channel to the adjacent one. The time average of this process in the absolute frame, which is the average among the different stator channels appearing in this plot, has been already reported in
Figure 4. Moreover, if the pressure level is considered, the time-averaged value Pt in the free stream is 1.345 bar (which corresponds to the upstream one), while the phase resolved one is up to 1.36 bar. Since across the stator the total pressure cannot increase, the azimuthal perturbation of Pt discussed above is clearly an effect of the rotor on the flow released by the stator.
As a further proof of that, this Pt perturbation rotates consistently with the sweeping of the rotor blades. In fact, as the rotor sweeps downstream of the stator outlet section, the rotor potential field propagates upstream with a wave of high and low static pressure, which also induces corresponding changes in the local flow direction. This also induces a local redistribution of mechanical energy, conceptually corresponding to an ‘internal’ work exchange between different portions of the flow, which ultimately alters the total pressure. In
Section 5 a quantification of the periodic change in total temperature on the fluid upstream of the rotor, resulting from the process discussed above, will be proposed.
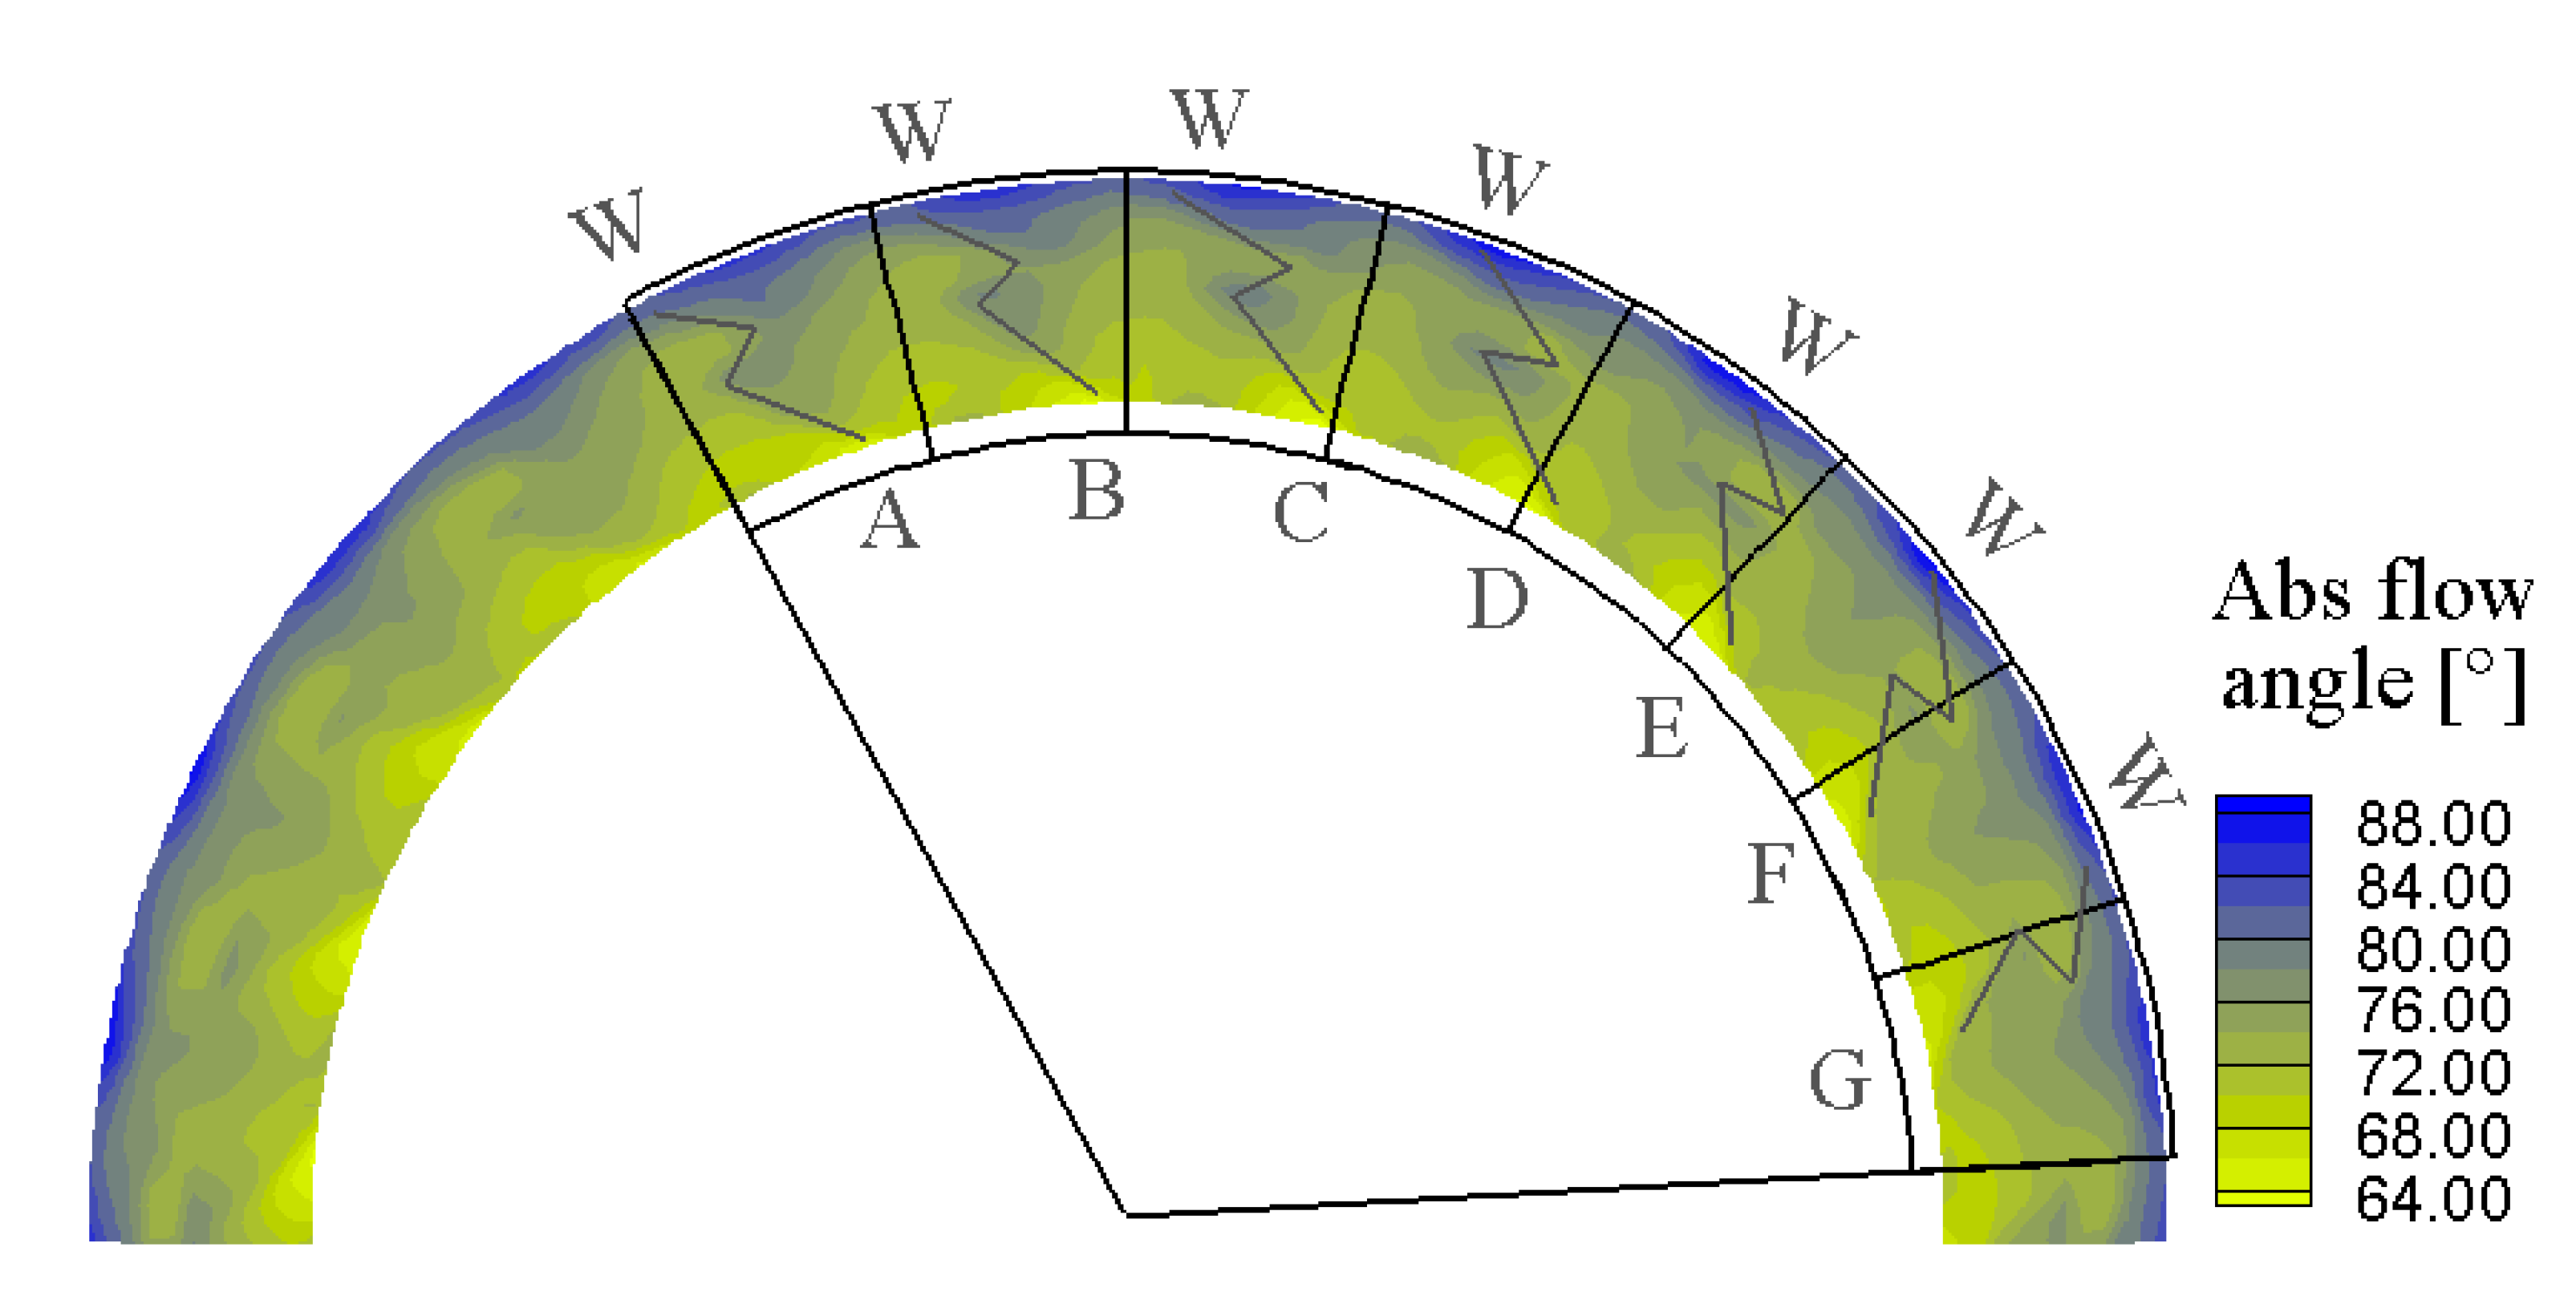
Considering the absolute flow angle, reported in
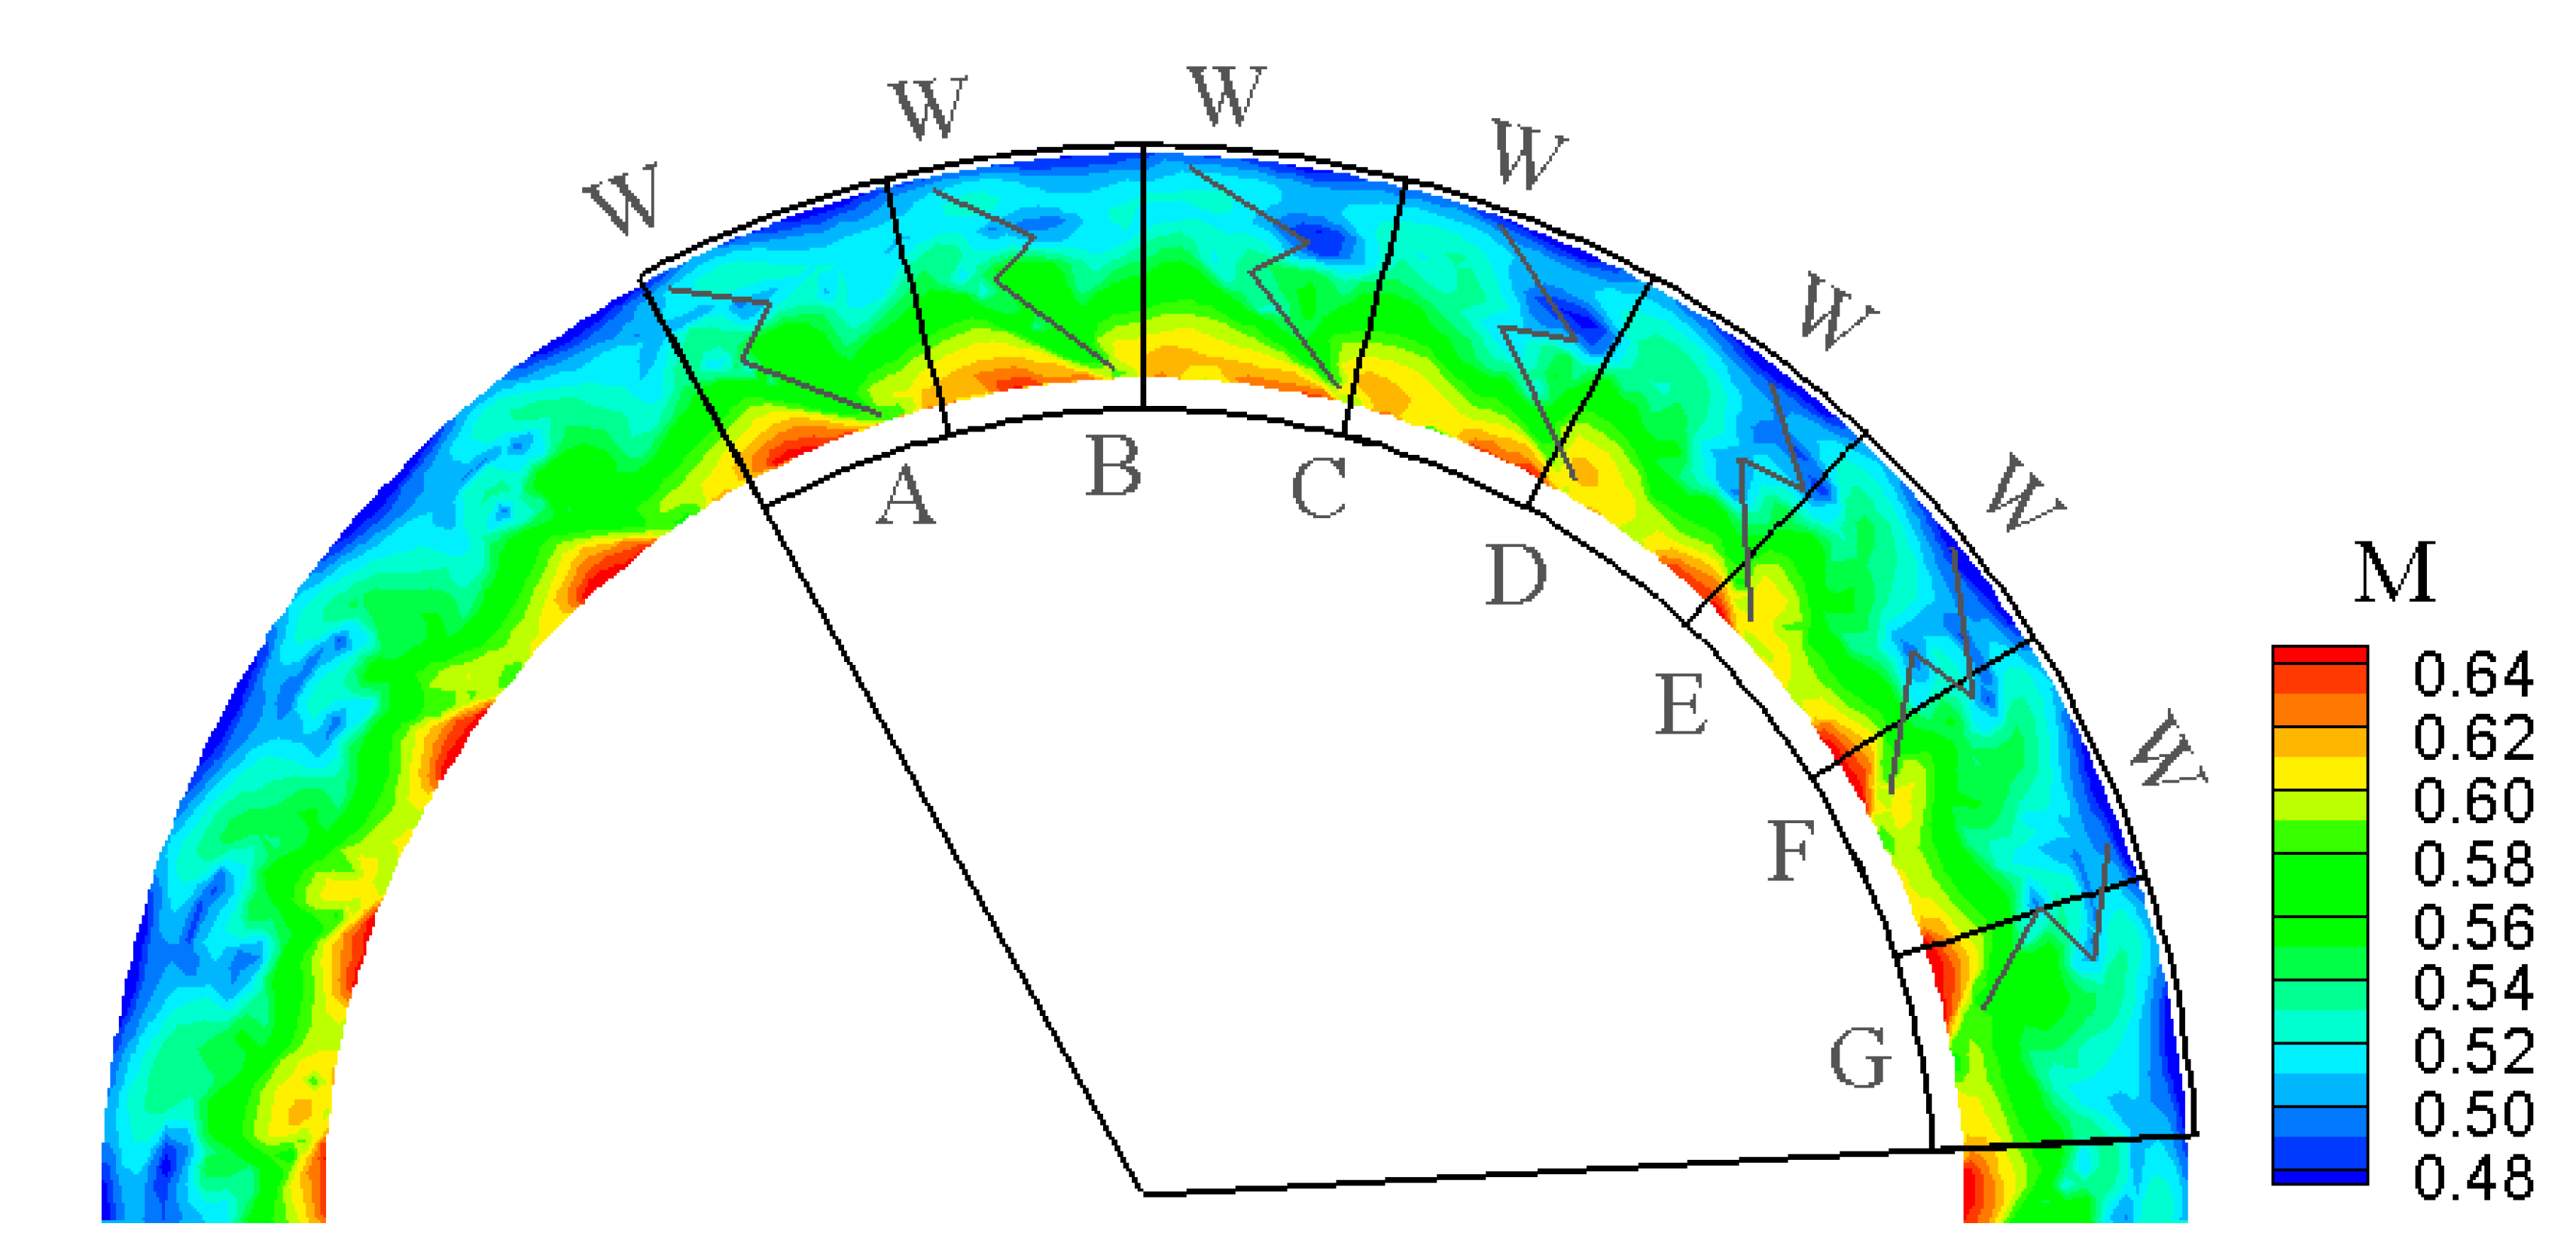
Figure 10, the rotor-induced perturbation is observed to alter the flow direction. In particular, the interaction positions labelled as wake C and D show the maximum over-turning (high angles) in the midspan region and the maximum under-turning (low angles) condition at hub. The maximum cross flow at the tip is for the interaction position E, F, where also the lowest total pressure is found. The Mach number field, reported in
Figure 11, shows a modulation among the adjacent channels. This feature evidences that changes in the flow rate released by the stator channel depend on the rotor position, as the blade leading edge creates a blockage at the outlet of the stator channel. The lowest Mach number, as an average on the passage, is found in the channel between wakes D and E.
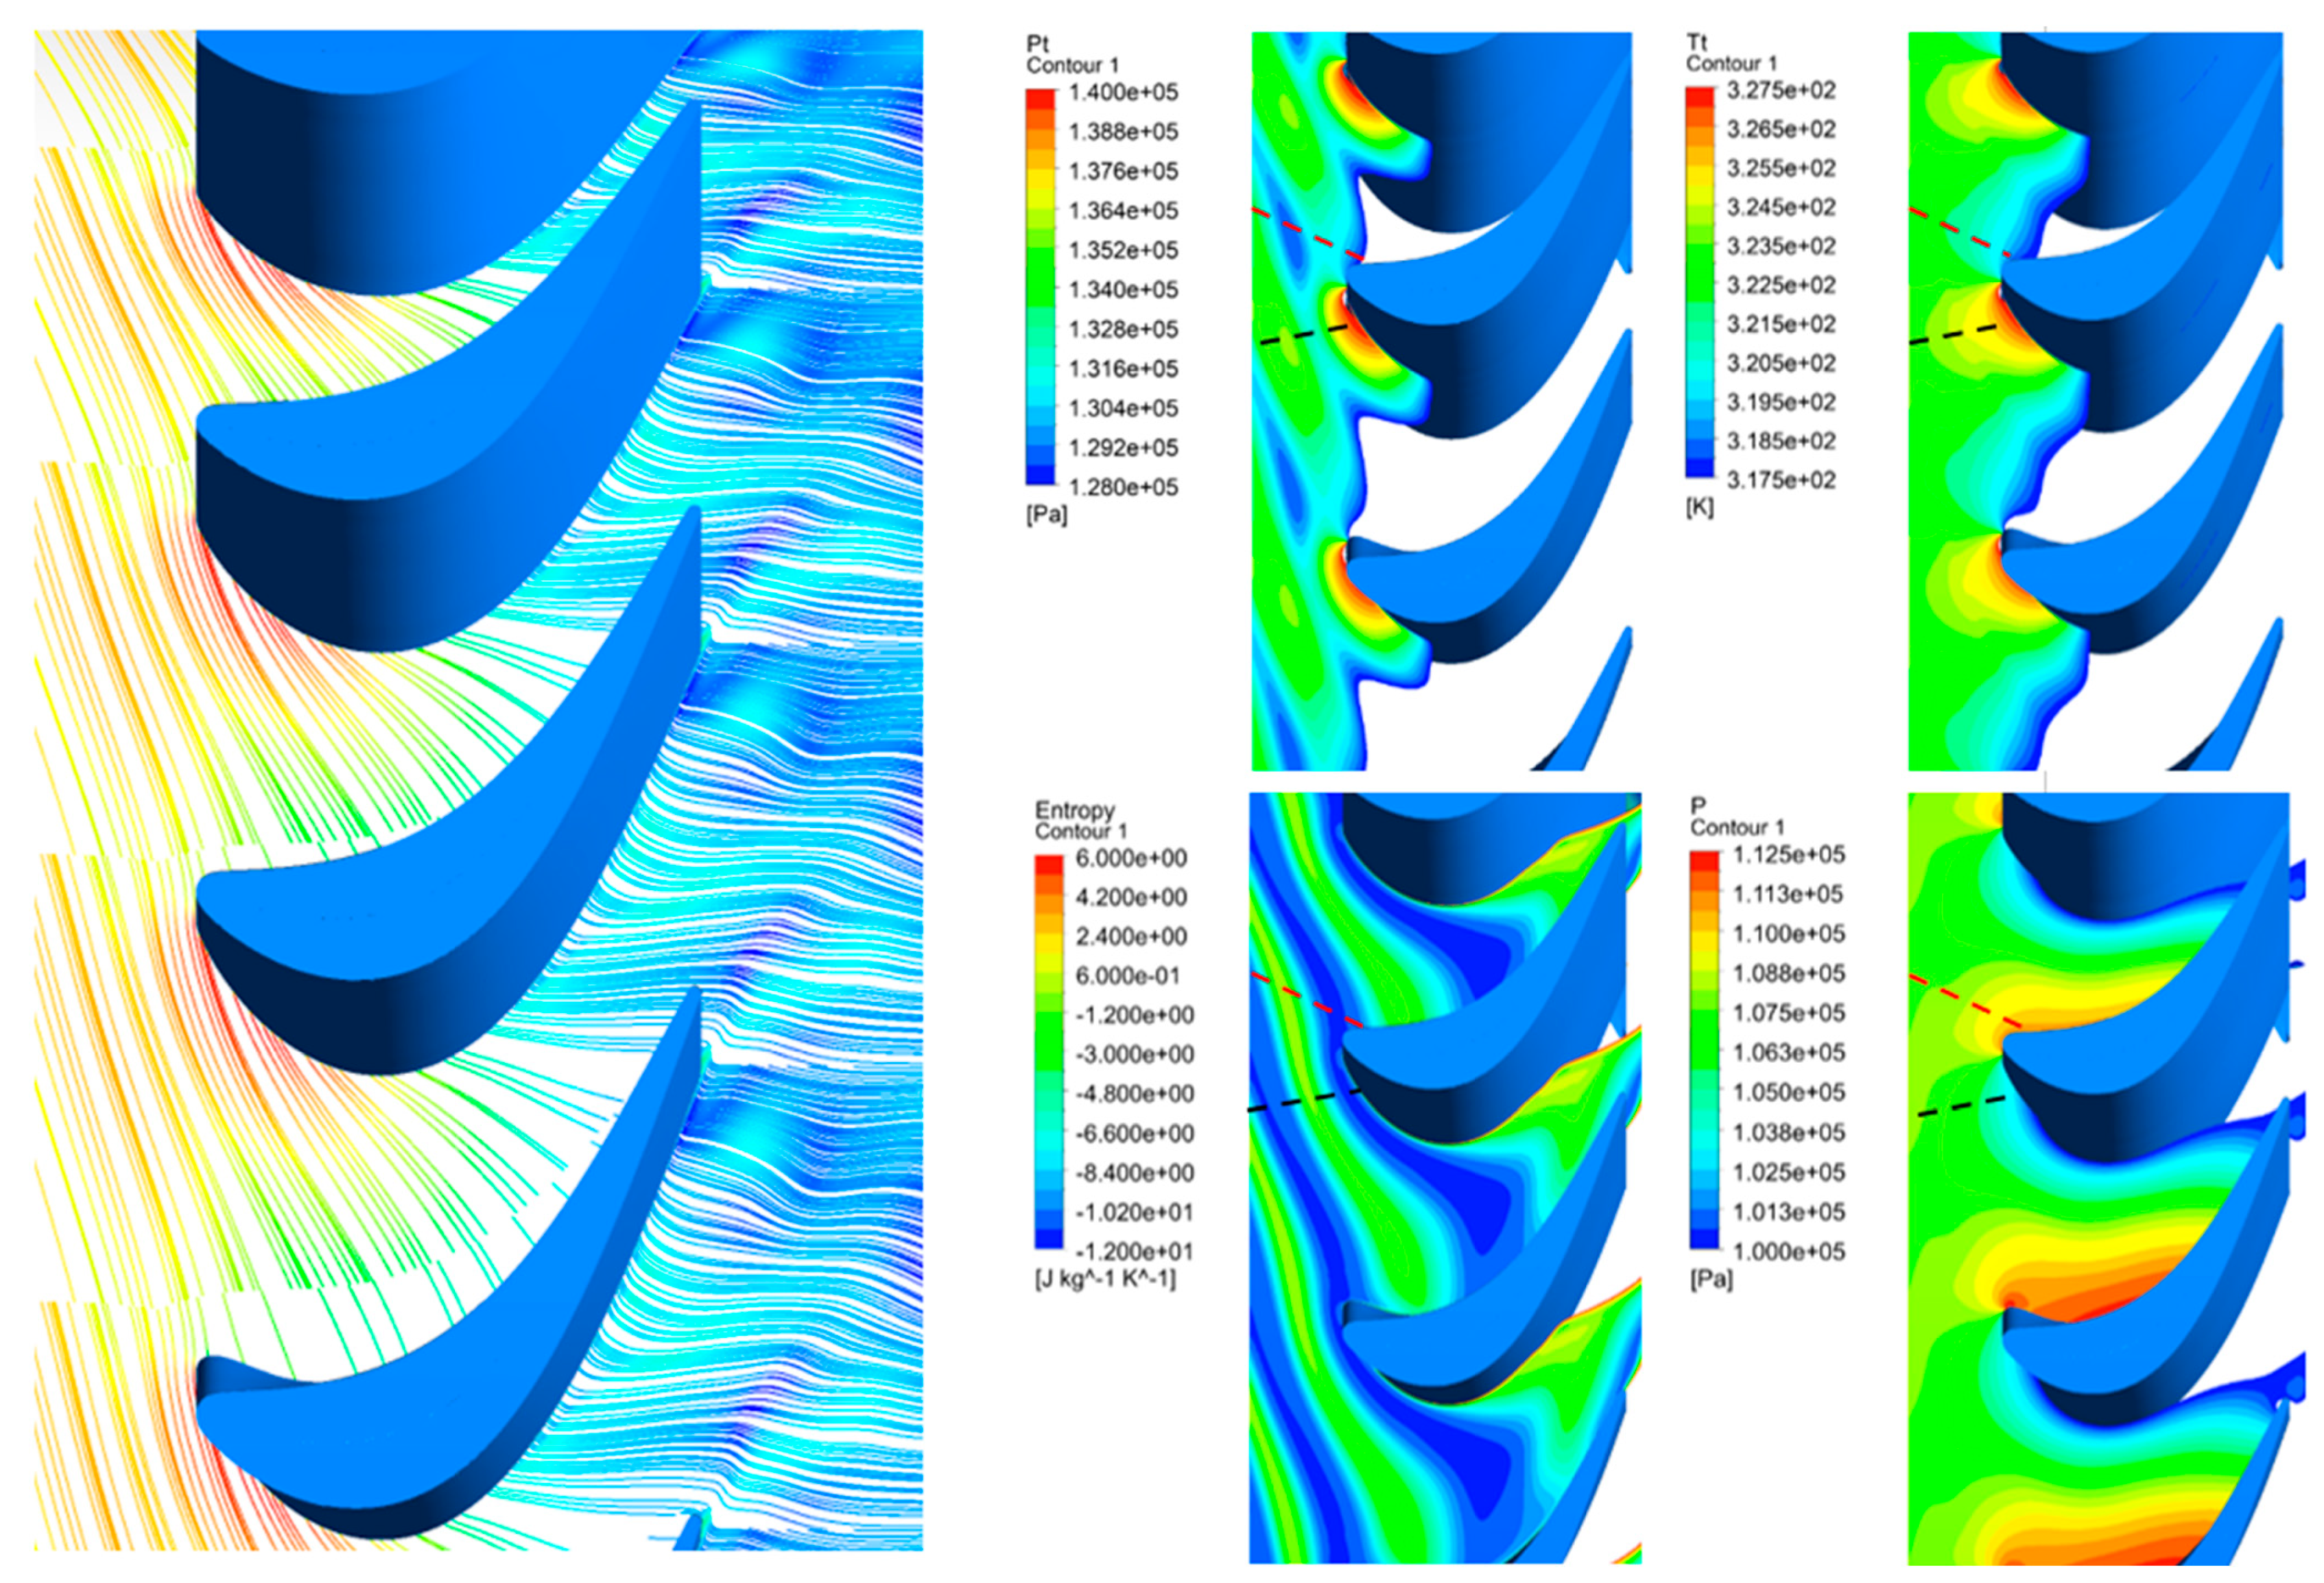
The scenario resulting from the analysis of the time-resolved experiments in-between the stator–rotor gap demonstrates a significant interference between the stator and rotor aerodynamics. While several effects are well known and properly discussed in Literature, for other quantities (like the absolute total pressure) an explanation is required. To this end, the CFD simulations were considered and
Figure 12 summarizes relevant features—unavailable in the experiments—such as the flow configuration and the distribution of absolute total quantities, entropy and pressure on a blade-to-blade surface at midspan. The left frame of
Figure 12 shows the streamlines constructed with the absolute velocity vector upstream and within the rotor channel. Streamlines clearly mark the local flow turning occurring around the rotor leading edge and in particular the absolute flow undergoes a local acceleration and deflection close to the front suction side of the rotor blade. This is the motivation for the azimuthal variability of flow angle observed in the experiments, recognized when commenting
Figure 10.
The change in flow angle is associated to a change in the angular momentum of the fluid, which increases locally, because the rotor blade has locally imparted torque to the flow: this process has ultimately increased the mechanical energy of the flow upstream of the blade. This variation of mechanical energy has opposite sign with respect to the one expected in a turbine, thus leading to the local absolute total pressure increase and explaining the unexpected rise of Pt upstream of the rotor. This phenomenon is clearly visible in the corresponding Pt distribution reported in
Figure 12, which shows how the high Pt region propagates upstream, producing a significant effect also on the stator wake, as appearing in this interaction phase. It is interesting to note that this process does not alter the entropy level in the flow upstream of the rotor: the entropy field shows how the stator wake is bowed by the interaction with the rotor blade, but it also highlights that no further entropy production occurs, thus confirming the quasi-isentropic character of the effect here discussed.
The field of Tt at midspan exhibits an azimuthal perturbation propagating upstream, along the black dashed lines reported in
Figure 12, thus testifying that the flow deflection upstream of the rotor is the main player of the process. Thanks to the near-uniformity of the total temperature background field, one can properly appreciate the sinusoidal character of the perturbation, as well as its crucial dependence on the design of the front part of the blade, especially on the suction side. From this perspective, the comparison with the static pressure field indicates that the Pt-Tt perturbations are not linked to the recompression induced by the rotor leading edge (which propagates upstream along the red dashed line), but it conversely occurs in a region of the flow featuring a relatively low static pressure; in particular, the total temperature/total pressure rise begins exactly where maximum (in absolute value) negative azimuthal pressure gradients is found.
5. Discussion: Energy Separation Effect
One of the consequences of the rotor-induced periodic flow fluctuation is that the rotor pressurises and depressurizes the flow field in the stator–rotor gap: if, as in this case, the flow is subsonic, no shock waves establish and the time-average of this perturbation is null, namely the time-mean flow corresponds to the steady-state flow condition. As shown by CFD results, the rotation of the rotor potential field induces quasi-isentropic unsteady perturbations of total temperature (or total enthalpy) propagating upstream. The observed effect can be analytically justified by resorting to equation 1, which establishes a link, rigorously valid only for inviscid flows, between the material derivative of the total enthalpy and the local (partial) derivative of the static pressure. The capability of static pressure unsteadiness to ‘redistribute’ total quantities is often called, in Literature, energy separation effect. Energy separation was widely documented to occur in the Von Karman vortex streets featuring the wake of cylinders in cross-flow [
23,
24] and was also observed to occur in the blade-wake interaction phenomena [
18]. In the present case, the source of the static pressure unsteadiness has to be found in the rotor pressure field travelling with the blade itself. As a result of the blade motion, the azimuthal gradients of pressure on the relative frame covert into static pressure unsteadiness according to the formula [
25]:
By plugging expression (2) into Equation (1), one gets a differential relation between the rotor pressure field and the total enthalpy rise:
Equation (3) demonstrates analytically the experimental and computational finding of this study, i.e., that the rotor pressure field is able to trigger energy separation effects in the stator–rotor axial gap of a high pressure gas turbine. If the rotor aerodynamic loading is high (as usual in present-day gas turbine stages) and the stator–rotor axial gap is small (as usual in turbines) this effect might influence in a non-negligible way the stator blade aerodynamics and heat transfer.
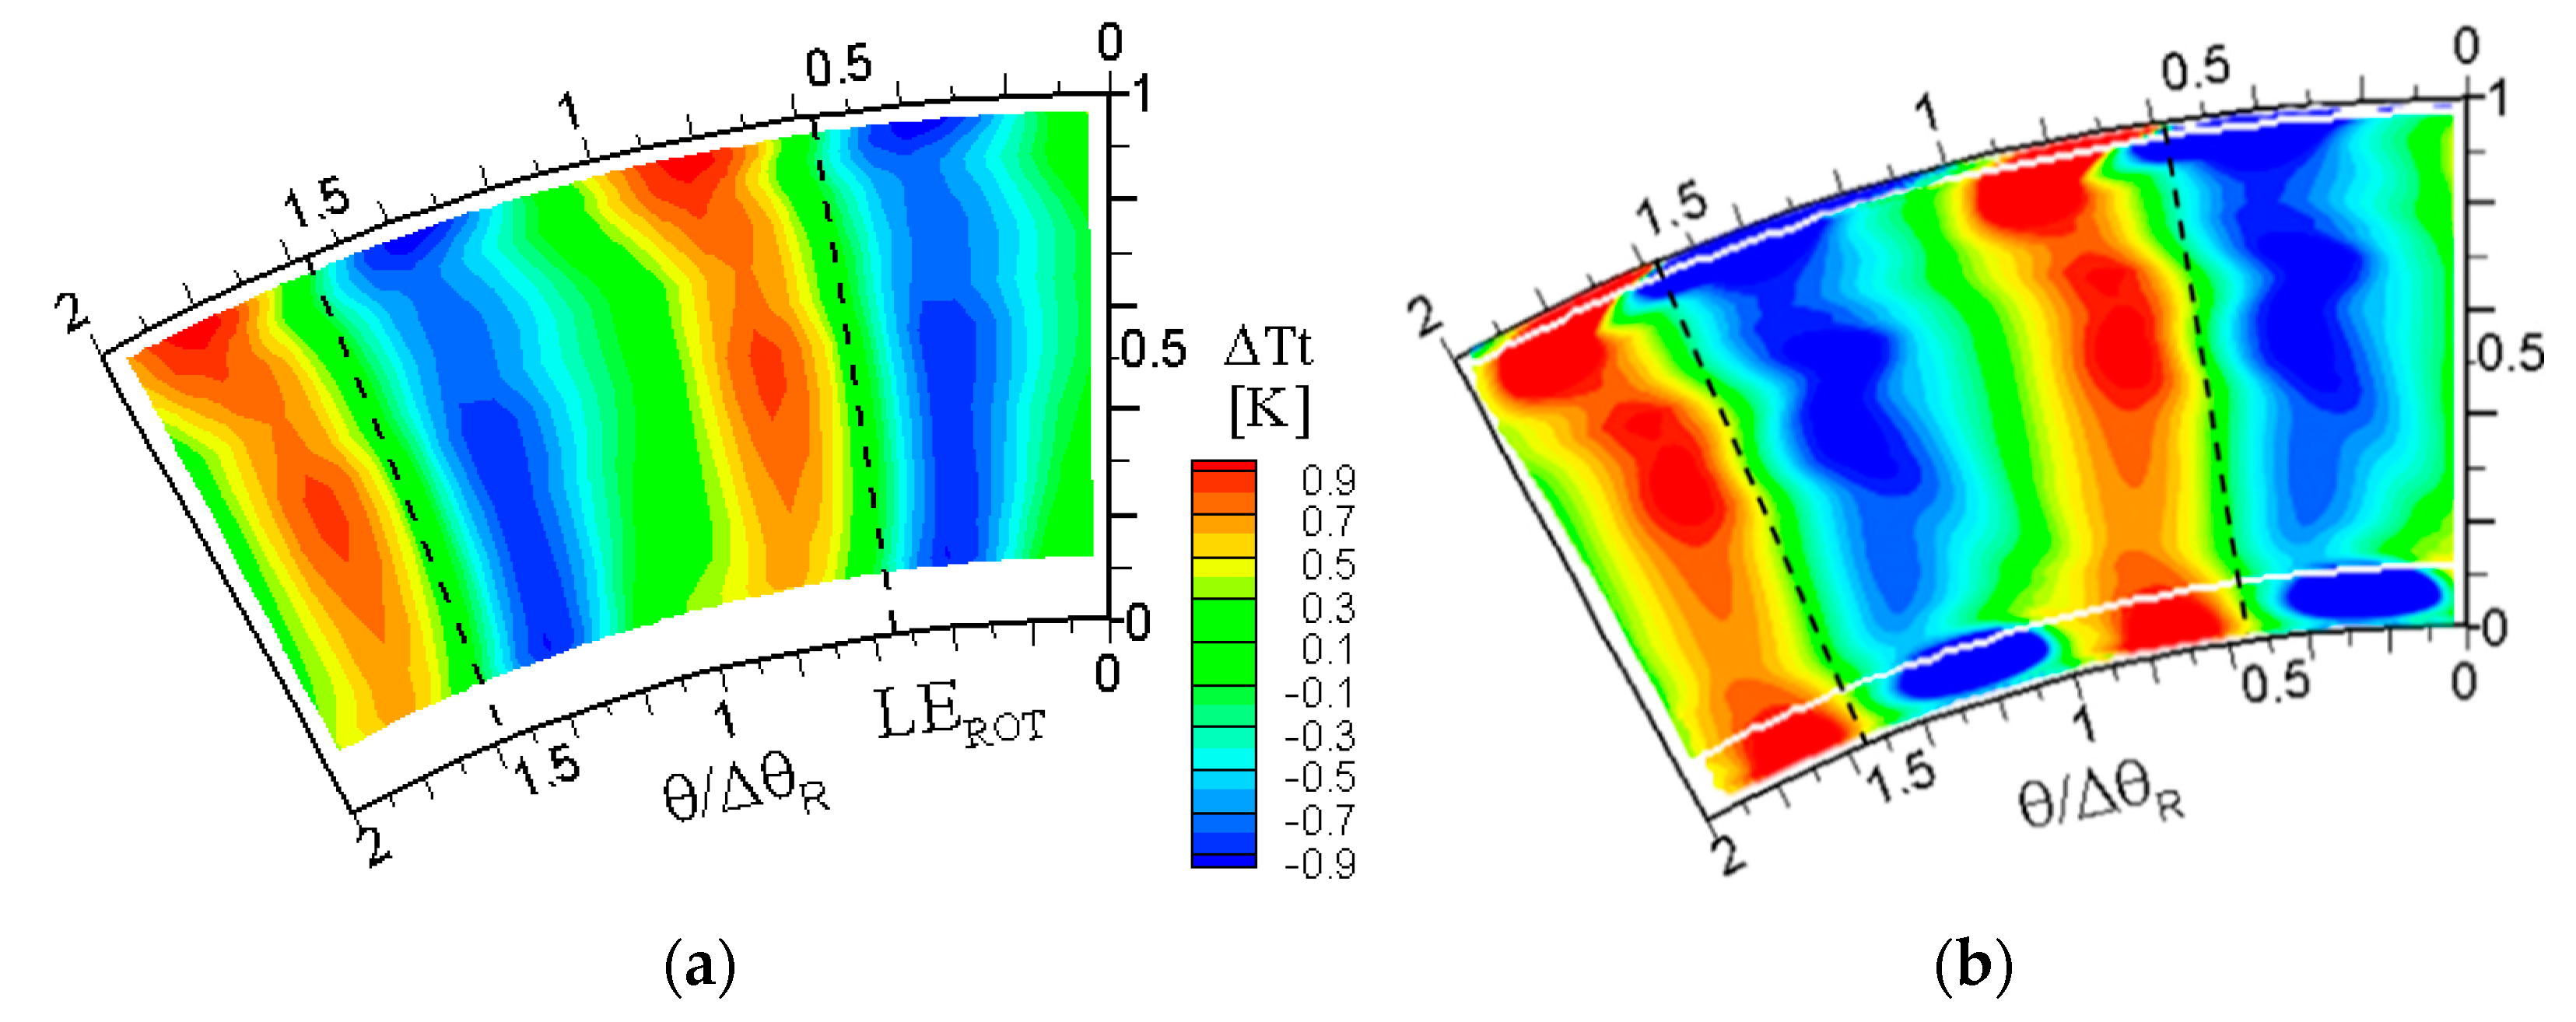
The statements above and, in a broader sense, the technical relevance of the energy separation effect here discussed demand for a proper quantification. In fact, a direct quantitative evaluation of the total enthalpy/total temperature oscillation upstream of the rotor is not feasible, since no unsteady measurements of total temperature are available (neither a fast-response temperature probe nor a rotating probe are available for such high speed rotors). Nevertheless, the isentropic character of the energy separation effect allows estimating the total temperature increase from experiments, by applying the isentropic thermodynamic relations to the measured total pressure perturbations. Considering as reference values the pitchwise-averages of the measured total pressure and total temperature distributions, the local phase-resolved total temperature is calculated by the phase-resolved total pressure as follows:
It is interesting to note that the pitchwise averages and are effective reference conditions, as the average filters the effect of the rotor potential field. The total temperature fluctuation due to energy separation can be finally evaluated as .
The results of this quantification are reported in
Figure 13a over two rotor pitches and show—for the present operating condition—a temperature fluctuation
of ±0.9 K; this value corresponds to about 8% of the total temperature drop across the stage (≈21.5 K). The slight tangential shift between the high temperature level at the hub and at the tip depends on the rotor blade twisting, on the spanwise trend of the azimuthal leading edge position of the rotor blade and on the leading edge loading. Interestingly,
Figure 13b reports the distribution of
over two rotor pitches as directly extracted from CFD simulation (i.e., using the actual unsteady total temperature values predicted by the solver). The excellent comparison between the experimental estimate and the simulation demonstrates not only the ‘qualitative’ validity of the interpretation, but also the quantitative relevance of the energy separation approach.
Ultimately, the operating condition here presented is one out of the four ones actually available, taken at higher and lower expansion ratio (though still all subsonic) and here not shown for sake of brevity: it is important to highlight that, for all such different operating conditions, the total temperature fluctuation always results of about 10% of the stage total temperature drop.
6. Conclusions
The paper has presented, by combining experiments and CFD simulations, the flow within the stator–rotor gap of a subsonic high-pressure turbine and on how this is influenced by the rotor potential field propagating upstream.
First, a validation of the CFD model against the experimental data has been provided, showing a very good agreement in terms of overall cascade and stage performance, spanwise profiles of pitch-wise averaged data and distributed flow field.
Then, the flow released by the stator has been investigated considering two alternative perspectives, i.e., for stationary and rotating observers, both in terms of time mean and phase-resolved quantities. The analysis in the stationary frame shows the well-known wake and secondary flows pattern, the radial equilibrium issues and loss mechanisms typical of a subsonic modern stator. In the rotating frame of reference, the relative quantities show a periodic pattern with a shape and periodicity related to the rotor pitch. On the contrary, the absolute total pressure perceived by a rotating observer evidences a periodic pattern featuring the rotor angular periodicity, thus revealing an influence of the rotor potential field on the total pressure field in the stator–rotor gap.
When the phase-resolved flow field is analyzed, the impact of the rotor aerodynamics on the flow in the stator–rotor gap is found on most quantities, such as the total pressure, the Mach number, the flow angle, while the viscous dissipative structures released by the stator appear only weakly affected by the rotor. These effects can only be connected to the rotor potential field, which is the unique rotor feature which can propagate upstream. The Mach number distribution exhibits a periodic blockage of the stator channel flow rate. The flow angle also shows a periodic increase in the tangential component of the absolute velocity. The total pressure experiences a periodic increase with respect to the stator upstream, thus apparently violating the energy and momentum balances. CFD simulations reveal the inherent link between these observations, suggesting that the total pressure rise is caused by the deflection imposed to the absolute flow when turning around the front part of the rotor blade. Predictions also show local and periodic total temperature rise in correspondence to the total pressure one, also marking a nearly-isentropic process.
An analytical approach allows explaining the observed feature and to classify it as a new energy separation effect, not described up to now in the scientific literature according to authors’ knowledge, in which the static pressure unsteadiness is triggered by the rotation of the rotor potential field. On the quantitative ground, this energy separation effect impacts the total temperature field, which is periodically altered by about ±8% with respect to the mean temperature drop across the stage.
Such an effect might play a role on the aerodynamics and, especially, on the heat transfer in the rear section of the stator blade, especially for new-generation gas turbines stages featuring high rotor loading and small axial gap in-between the blade rows. Moreover, in case of transonic turbines (except for the very rare, saturated condition) the onset of supersonic flows and shock wave patterns within the stator–rotor gap would likely alter the isentropic character of the process, with potential impact on the performance. Future works will extend the present study considering transonic stages and more realistic axial gaps, with special focus on the aero-thermal stator behavior.
Beside the physical aspects, the present findings also show the importance of the design of the front part of the rotor blade, that is, one of the main geometrical features that determines the propagation upstream of the rotor potential field. Further studies on this feature and its implication may lead to novel design remarks for both the rotor and the stator optimization.


