
Transport of Swirling Entropy Waves through an Axial Turbine Stator †


Department of Energy, Politecnico di Milano, 20156 Milano, Italy
*
Author to whom correspondence should be addressed.
†
This paper is an extended version of our contribution to the 14th European Turbomachinery Conference, Gdansk, Poland, 12–16 April 2021.
Int. J. Turbomach. Propuls. Power 2021, 6(4), 45; https://0-doi-org.brum.beds.ac.uk/10.3390/ijtpp6040045
Submission received: 24 May 2021
/
Revised: 3 June 2021
/
Accepted: 19 November 2021
/
Published: 26 November 2021
Abstract
:The transport of entropy waves and their impact on the stage aerodynamics are still open questions. This paper shows the results of an experimental campaign that focuses on the swirling entropy waves advection through an axial turbine stator. The research aims at quantifying the aerodynamic impact of the swirling entropy waves on the first nozzle and characterizing their transport. The disturbance is generated by a novel entropy wave generator that ensures a wide set of different injection parameters. The device injects the disturbance axially, four different clocking positions are investigated. Measurements show a severe temperature attenuation of the swirling entropy wave at stator outlet. The high temperature location changes with the injection position as a result of the different interaction with the stator secondary flows. Depending on the injection position, the aerodynamic flow field is strongly perturbed by the injected swirl profile, instead the entropy wave effect is negligible.
1. Introduction
Combustor-turbine interaction is a research topic that needs to be further addressed in order to understand all the phenomena there involved. In aero-engines, the strict requirements to minimize the fuel consumption ask for a complete knowledge of the flow physics to enhance the design, therefore the effects related to combustor-turbine interaction cannot be neglected. Modern lean-burn combustors are characterized by an unsteady heat release rate that, combined with a strong swirl motion, produces significant velocity and temperature non-uniformities [1,2]. The latter consists in temperature perturbations labeled as hot streak or entropy wave (EW), depending on whether they are steady or unsteady, respectively. The non-uniformities generated inside the combustion chamber are advected towards the turbine maintaining their intensity and strength, as [3,4] have shown in their investigations. The injection of the aforementioned disturbances in the 1st turbine stage produces significant problems that have to be accounted by turbine designers. First, the aerodynamic flow field is strongly affected by the swirl profile [5,6] and temperature disturbance [7]. A direct implication of the modified aerothermal field regards the blade heat transfer [6,8] that is significantly altered, thus, to design the blade cooling the combustor non-uniformities have to be considered. Finally, the acceleration of vorticity and temperature perturbation contributes to the production of indirect combustion noise [9], considered a significant source of engine noise [1,2].
Although there are several works that presented and discussed the effect of injecting swirl profile [10], hot-streak [11,12] and entropy waves [13,14], to authors knowledge there are no published experimental studies that combine the effects of a swirl profile and unsteady temperature perturbation (EW) in an annular turbine cascade. The only experimental campaign getting close to the present one has been carried out at Oxford university and it is based on the combustor simulator developed in Adams et al. [15]: this campaign combines the generation of a swirl profile with a steady temperature perturbation [16]. According to Khanal et al. [17] computational study, a superimposition of the isolate cases considering either a swirl profile or a temperature perturbation leads to misleading results, hence they should be considered together, their effects being strongly non-linear.
In this work an experimental study of combustor-turbine interaction is carried out on the turbine test rig of Politecnico di Milano. The rig is equipped with a novel designed combustor simulator able to reproduce engine-representative turbine inlet conditions combining the generation of a swirl profile and EWs. The outlet conditions at the first stator is deeply analyzed and results shown. Steady aerodynamic measurements are carried out by a 5-hole pressure probe, whereas a fast response S-type micro-thermocouple is used to characterize the unsteady temperature field. The combustor simulator is moved azimuthally to inject the disturbance at four different stator relative positions, i.e., at leading edge, mid pitch, suction side and pressure side. Furthermore, the entropy wave is injected at two different frequencies, i.e., 10 and 110 Hz, chosen as the most representative. At these frequencies, the peak-to-mean flow temperature ratio is approximately 1.3 at 10 Hz and 1.08 at 110 Hz. These values are comparable with other works [3,18,19] where models have been developed to predict the EW dispersion. These authors agree that the higher the frequency, the higher is the EW dissipation caused by diffusion and dispersion inside the duct from the combustor to the turbine inlet. Therefore, an EW is expected to preserve a significant magnitude at turbine inlet only at low frequencies: 10 and 110 Hz seem to match the previous statement, as also showed in Notaristefano and Gaetani [20].
The geometry of the combustor simulator allows to carry out experiments injecting a swirl profile alone, while the isolation of the entropy wave is not possible. Therefore, the former case is also investigated. For a sake of comparison, the last case considered regards the uniform situation, where no swirl profile or entropy wave are injected.
After a brief description of the test rig and the EWG, the measuring techniques are introduced. The main features of the inlet disturbance are shown and finally the measurements at the stator outlet are discussed.
2. Materials and Methods
2.1. Test Rig and Entropy Wave Generator
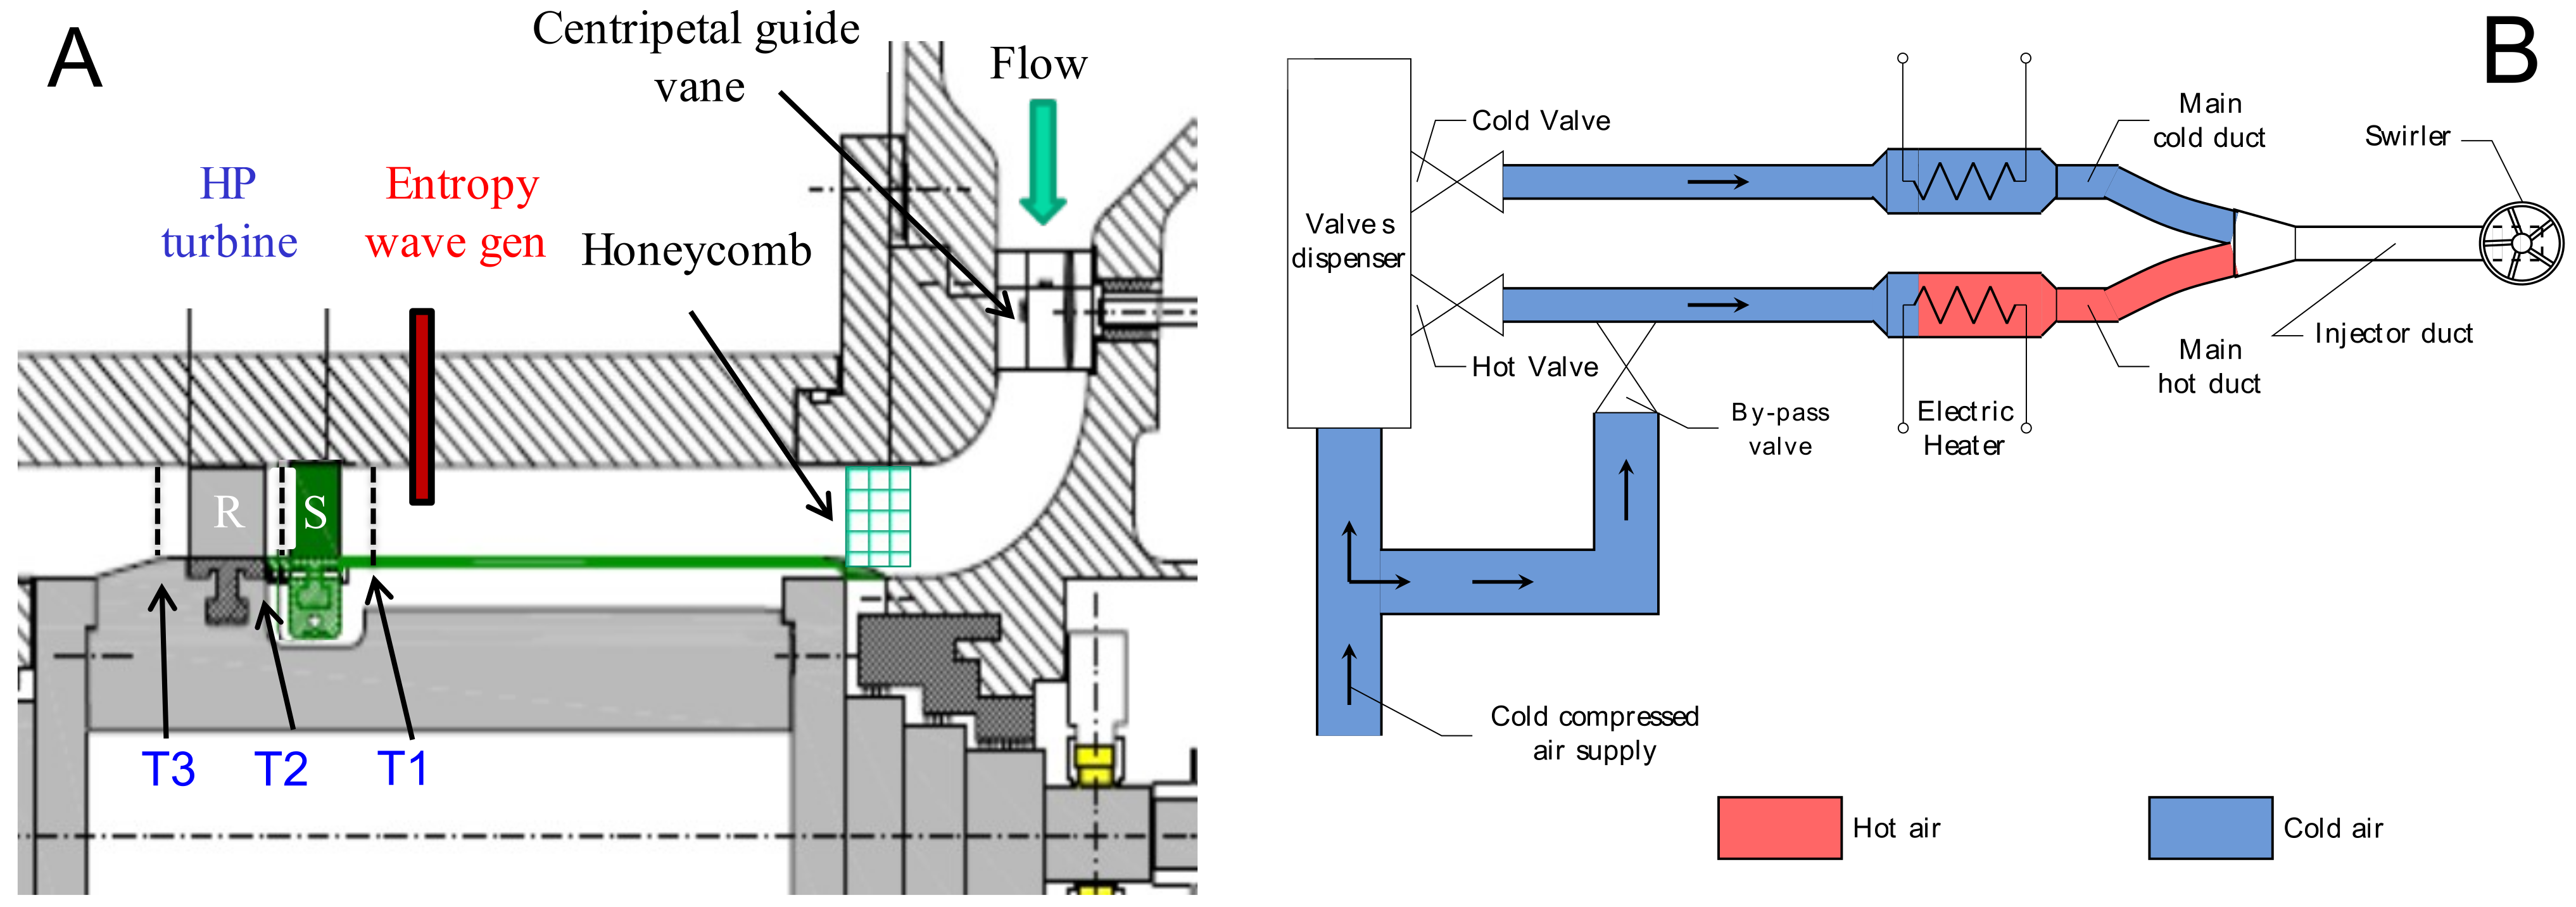
The experimental campaign has been carried out on the high-speed closed-loop test rig at the Laboratory of Fluid Machines (Politecnico di Milano, Milano, Italy). A centrifugal compressor feeds the circuit allowing to set the mass flow rate and the turbine inlet conditions. Between the compressor and the turbine there is a cooler to control the turbine inlet flow conditions. The turbine is single stage, and it is representative of a high pressure turbine stage. Figure 1A shows a meridional view of the turbine test rig. The vane blades have a leaned geometry with a lean angle of 12°. Further details of the test rig operating principle can be found in Gaetani et al. [21].
The operating condition analyzed in this paper exploits an expansion ratio of 1.4 that means subsonic conditions throughout all the stage. The stator outlet Mach number at midspan is close to 0.6 with a Reynold number of 9 × 10⁵ based on the stator chord; the average relative Mach number at rotor outlet is 0.45 with a Reynolds number of 5 × 10⁵, based on rotor chord. The turbine aerodynamic in this condition is well known as a result of extensive previous studies [21]. The main operating conditions parameters and blade geometry are shown in Table 1.
A combustor simulator, called entropy wave generator (EWG) and shown in Figure 1B, is placed upstream of the stator in order to carry out experiments aimed at characterizing the combustor-turbine interaction. The EWG injects an entropy wave (EW) in streamwise direction through a specifically designed injector. A swirler generator placed at the injector outlet produces a swirl profile that puts in rotation both the mainstream air and partially the EW. The working principle of the EWG is simple: two automotive valves feed alternatively two ducts, one of which has an electric heater to heat up the air passing through. The two ducts are then coupled in the injector head which injects the EW in the turbine. This novel EWG, extensively described in [20], allows to tune different parameters: the valves frequency that is the corresponding EW fluctuation frequency, the valves duty cycle, the feeding pressure and the heater power. For each frequency, the aforementioned parameters are set to guarantee the best EW penetration in the mainstream and the highest peak-to-trough temperature value.
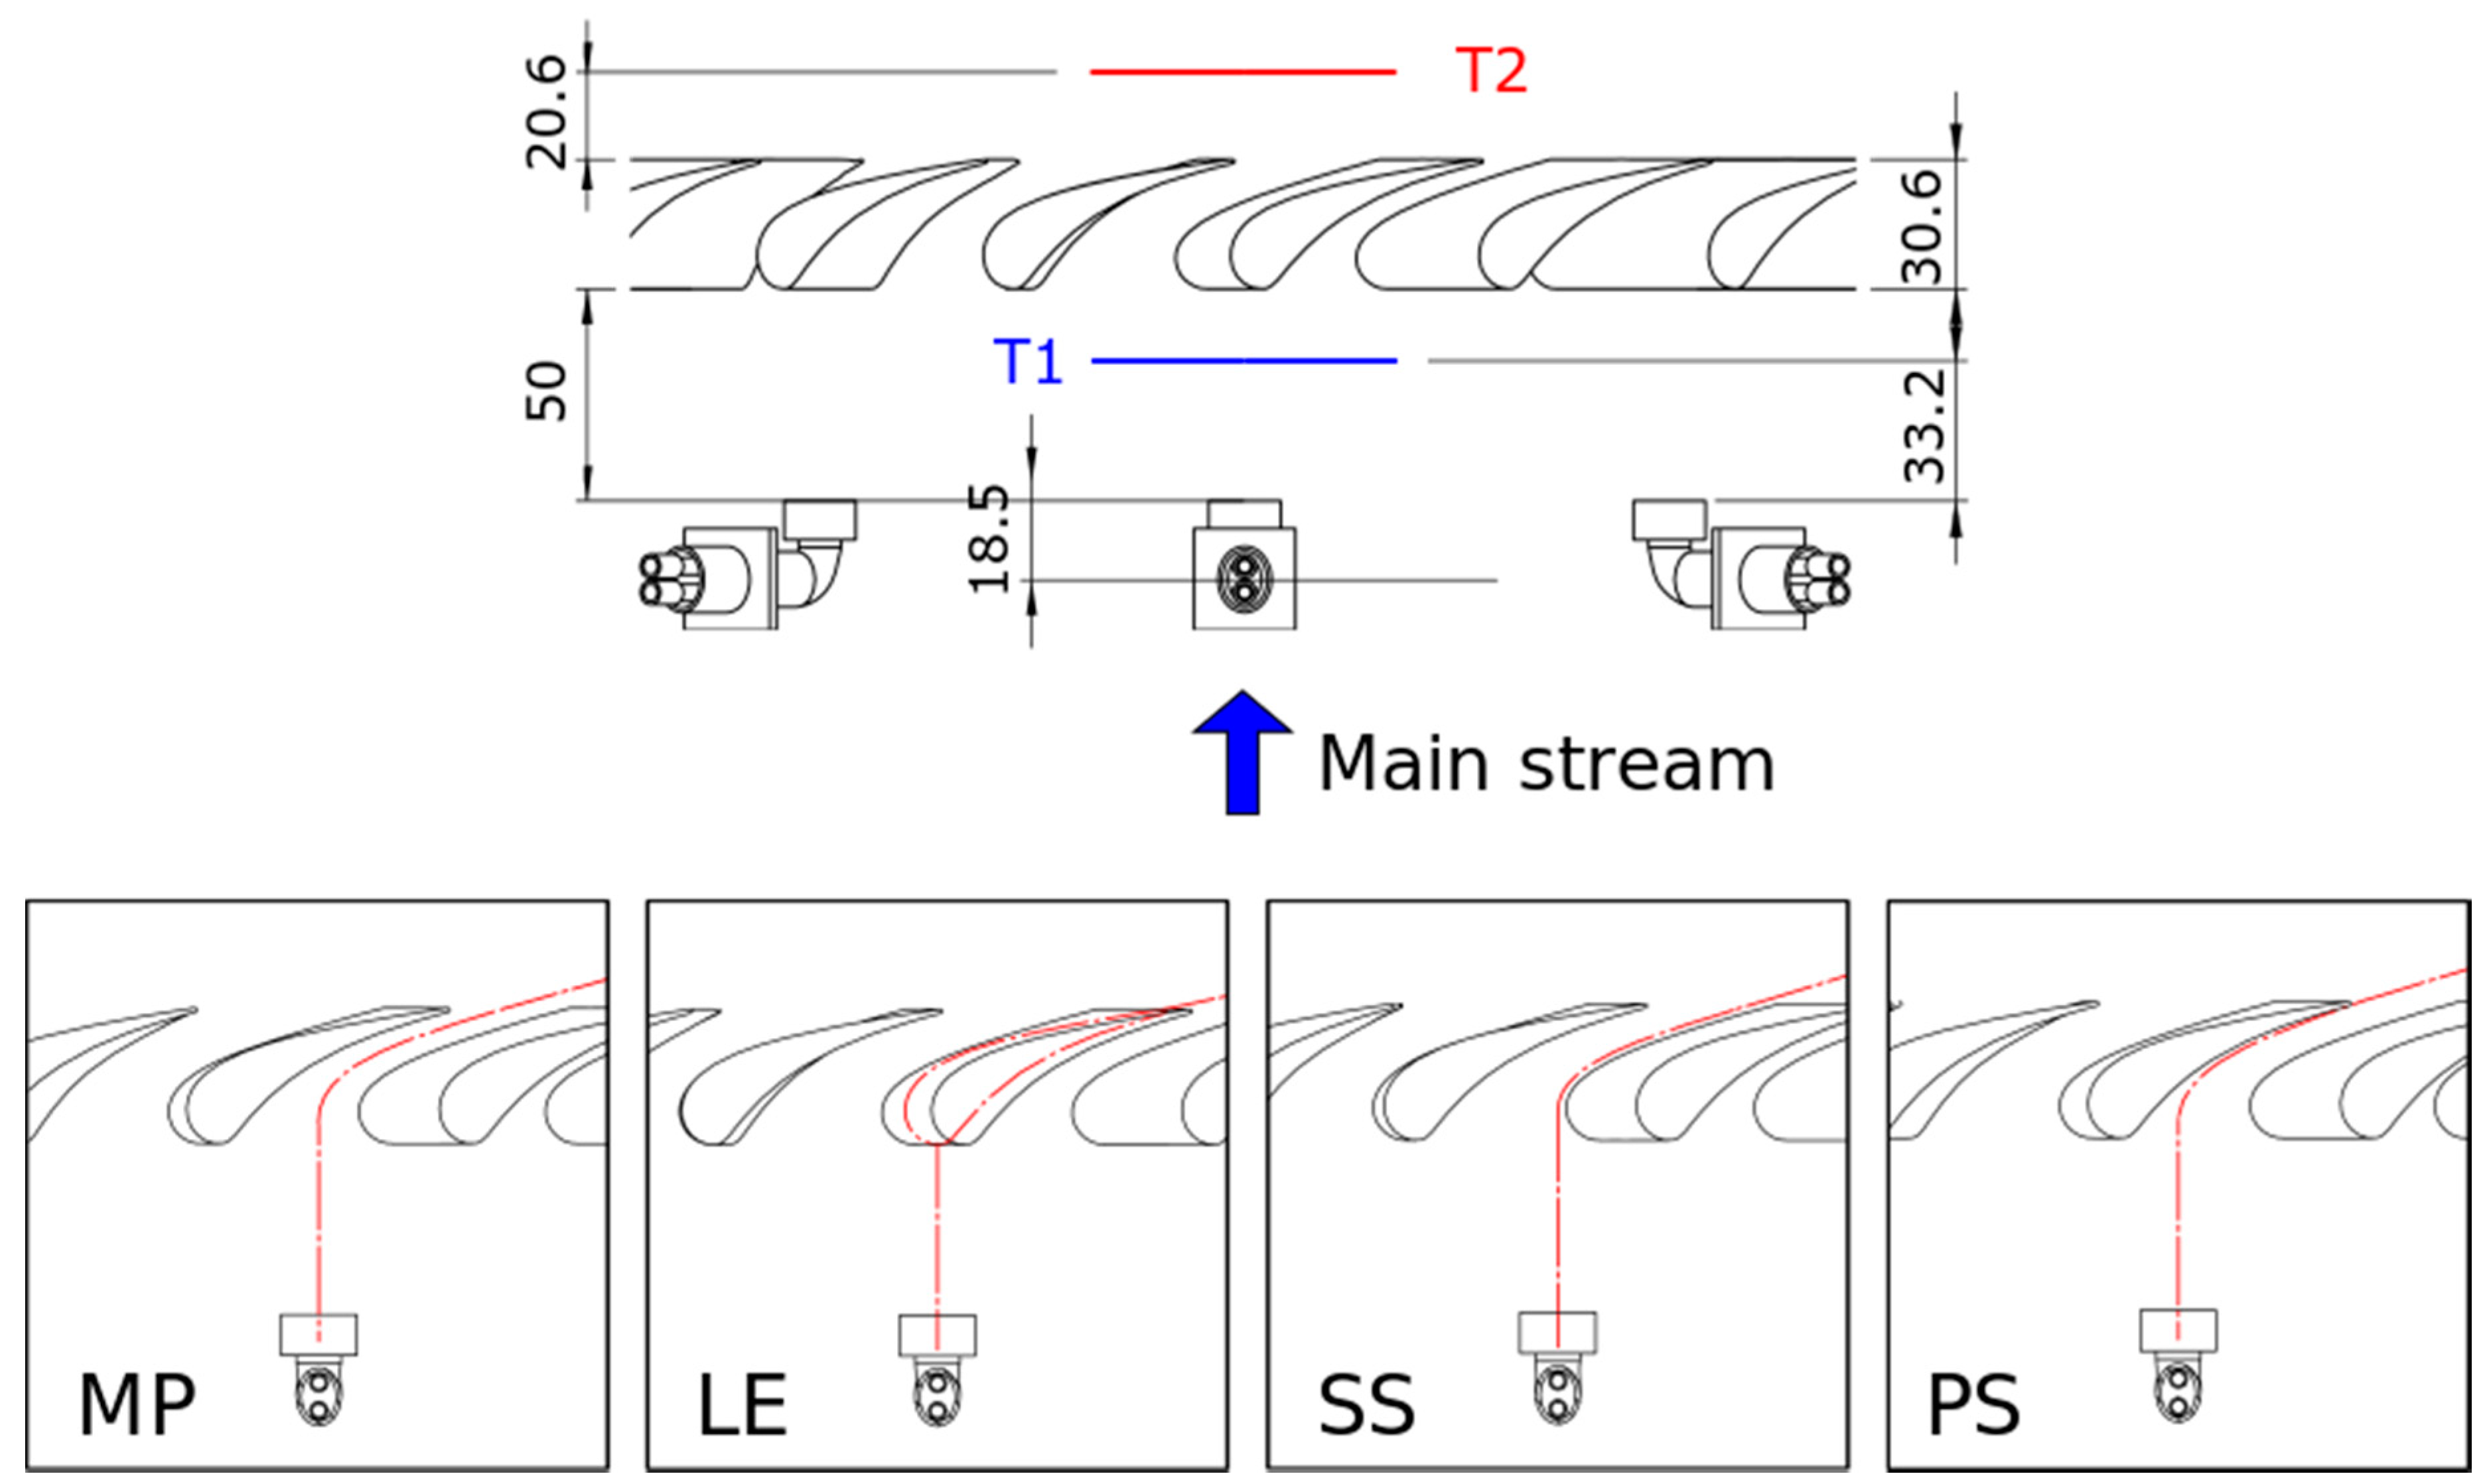
Aerodynamic measurements are carried out using only three EWG for a sake of simplicity. Notwithstanding that the test rig can host eleven injectors, one out of two stator blades, the usage of three EWG requires to carry out measurements on the central one to satisfy the azimuthal periodicity. The EW is injected at blade midspan at four different circumferential positions with respect to the stator blade (Figure 2): mid-pitch, leading edge, pressure side and suction side. The outlet of the injector is 50 mm upstream the stator leading edge, as shown in Figure 2.
2.2. Measuring Devices
This section is organized in two subsections: the first describes the measuring set-up of the turbine and EWG, the second introduces the probes that are used to characterize the flow field.
2.2.1. Turbine and EWG Set-Up
The turbine inlet total pressure is measured by a total pressure probe with head dimension of 0.5 mm and uncertainty 60 Pa. An inlet free stream turbulence intensity of 2.5% is measured by a hot wire probe. Inlet total temperature is measured by means of a K-type thermocouple. At the rotor outlet, T-type thermocouple gives the total temperature, a Kulite XT190 (Kulite, Leonia, NJ, USA) series pressure transducer measures the static pressure. A venturi tube gives information on the mass flow with an uncertainty of 1%.
The EWG is fully instrumented to measure its flow properties, necessary for control purposes. A T-type thermocouple measures the EWG supply air temperature and a Kulite XT190 pressure transducer (full scale 50 psi) the total pressure. A calibrated nozzle gives information on the mass flow rate given the pressure drop measured by a Kulite XT190 transducer (full scale 10 psi). The heater outlet temperature is measured by a K-type thermocouple: this value is used to control the power supply of the heater. In order to ensure that the heaters are switched off when no air is passing through, a Kulite XT190 (full scale 50 psi) measures the pressure difference between the heater inlet pressure and the turbine static pressure. A Kulite XT190 transducer (full scale 10 psi) measures the pressure in the cold duct to be used as trigger signal to phase-average the unsteady measurements. Pressure transducers have an uncertainty of 0.1% on the full scale, while thermocouples uncertainty is 0.2 K.
2.2.2. Flow Field Measurements
Several probes are used to characterize the flow quantities. These are mounted on a stepping motor that allows to measure at different spans, instead the stator and EWG annulus are moved synchronously in circumferential direction to complete the traversing. The measuring grid covers two blade passages, that is about 32.5°, to have the full periodicity, being the combustor simulator pitch twice the stator one. Four different positions of the EWG with respect to the stator are analyzed (see Figure 2):
- LE: aligned to the stator leading edge;
- PS: at 1/3 of the pitch close to the pressure side;
- MP: at mid pitch;
- SS: at 1/3 of the pitch close to the suction side.
The traversing probes are positioned approximately at 67.3% stator axial chord downstream of the stator trailing edge. Unsteady temperature measurements are carried out by means of a fast response miniaturized S-type thermocouple with a junction size of 25.4 µm. The probe is calibrated in an oven and in a shock tube and exhibits a 1st order instrument response with a time constant of 2.4 ms. Temperature measurements are compensated applying the transfer function. The extended uncertainty of this probe is ±0.3 K.
The steady aero-dynamic flow field is measured by a 5-hole pressure probe that is able to reconstruct a 3D flow field. The probe has 1.4 mm head dimension and is calibrated in a reference nozzle in the range of 0.2 to 0.8 Mach numbers. On average the probe exhibits an uncertainty of 0.15° for the flow angles, 80 Pa for the total pressure and 40 Pa for the static pressure. A detailed analysis on the determination of these uncertainties can be found in [22].
3. Results and Discussion
3.1. Generated Disturbance
In this section the injected disturbance into the stator is characterized for the two frequencies of interest, 10 and 110 Hz. These are the lowest and highest, respectively, among the five frequencies tested and are chosen as representative. The complete assessment of the flow field downstream the EWG can be found in [20]. For each frequency, the best combination of feeding pressure, valves duty cycle and heater power can be set to maximize the EW penetration and the peak-to-trough temperature difference while keeping the same averaged momentum. The parameters outcoming the aforementioned maximization can be found in Table 2 for the two frequencies of interest. The first of the two numbers of the “Duty cycle” row refers to the hot period while the second refers to the cold injection time so that valves are modulated to have longer cold injection time than hot.
In addition to “10 Hz” and “110 Hz” cases, to better compare and analyze the results, other two cases are considered: the first (“EWG off”) with the injector hosted, but the EWG switched off, i.e., only the swirl profile is injected; the second (“Clean”) investigates the uniform condition when the injector is removed, thus no disturbance is generated.
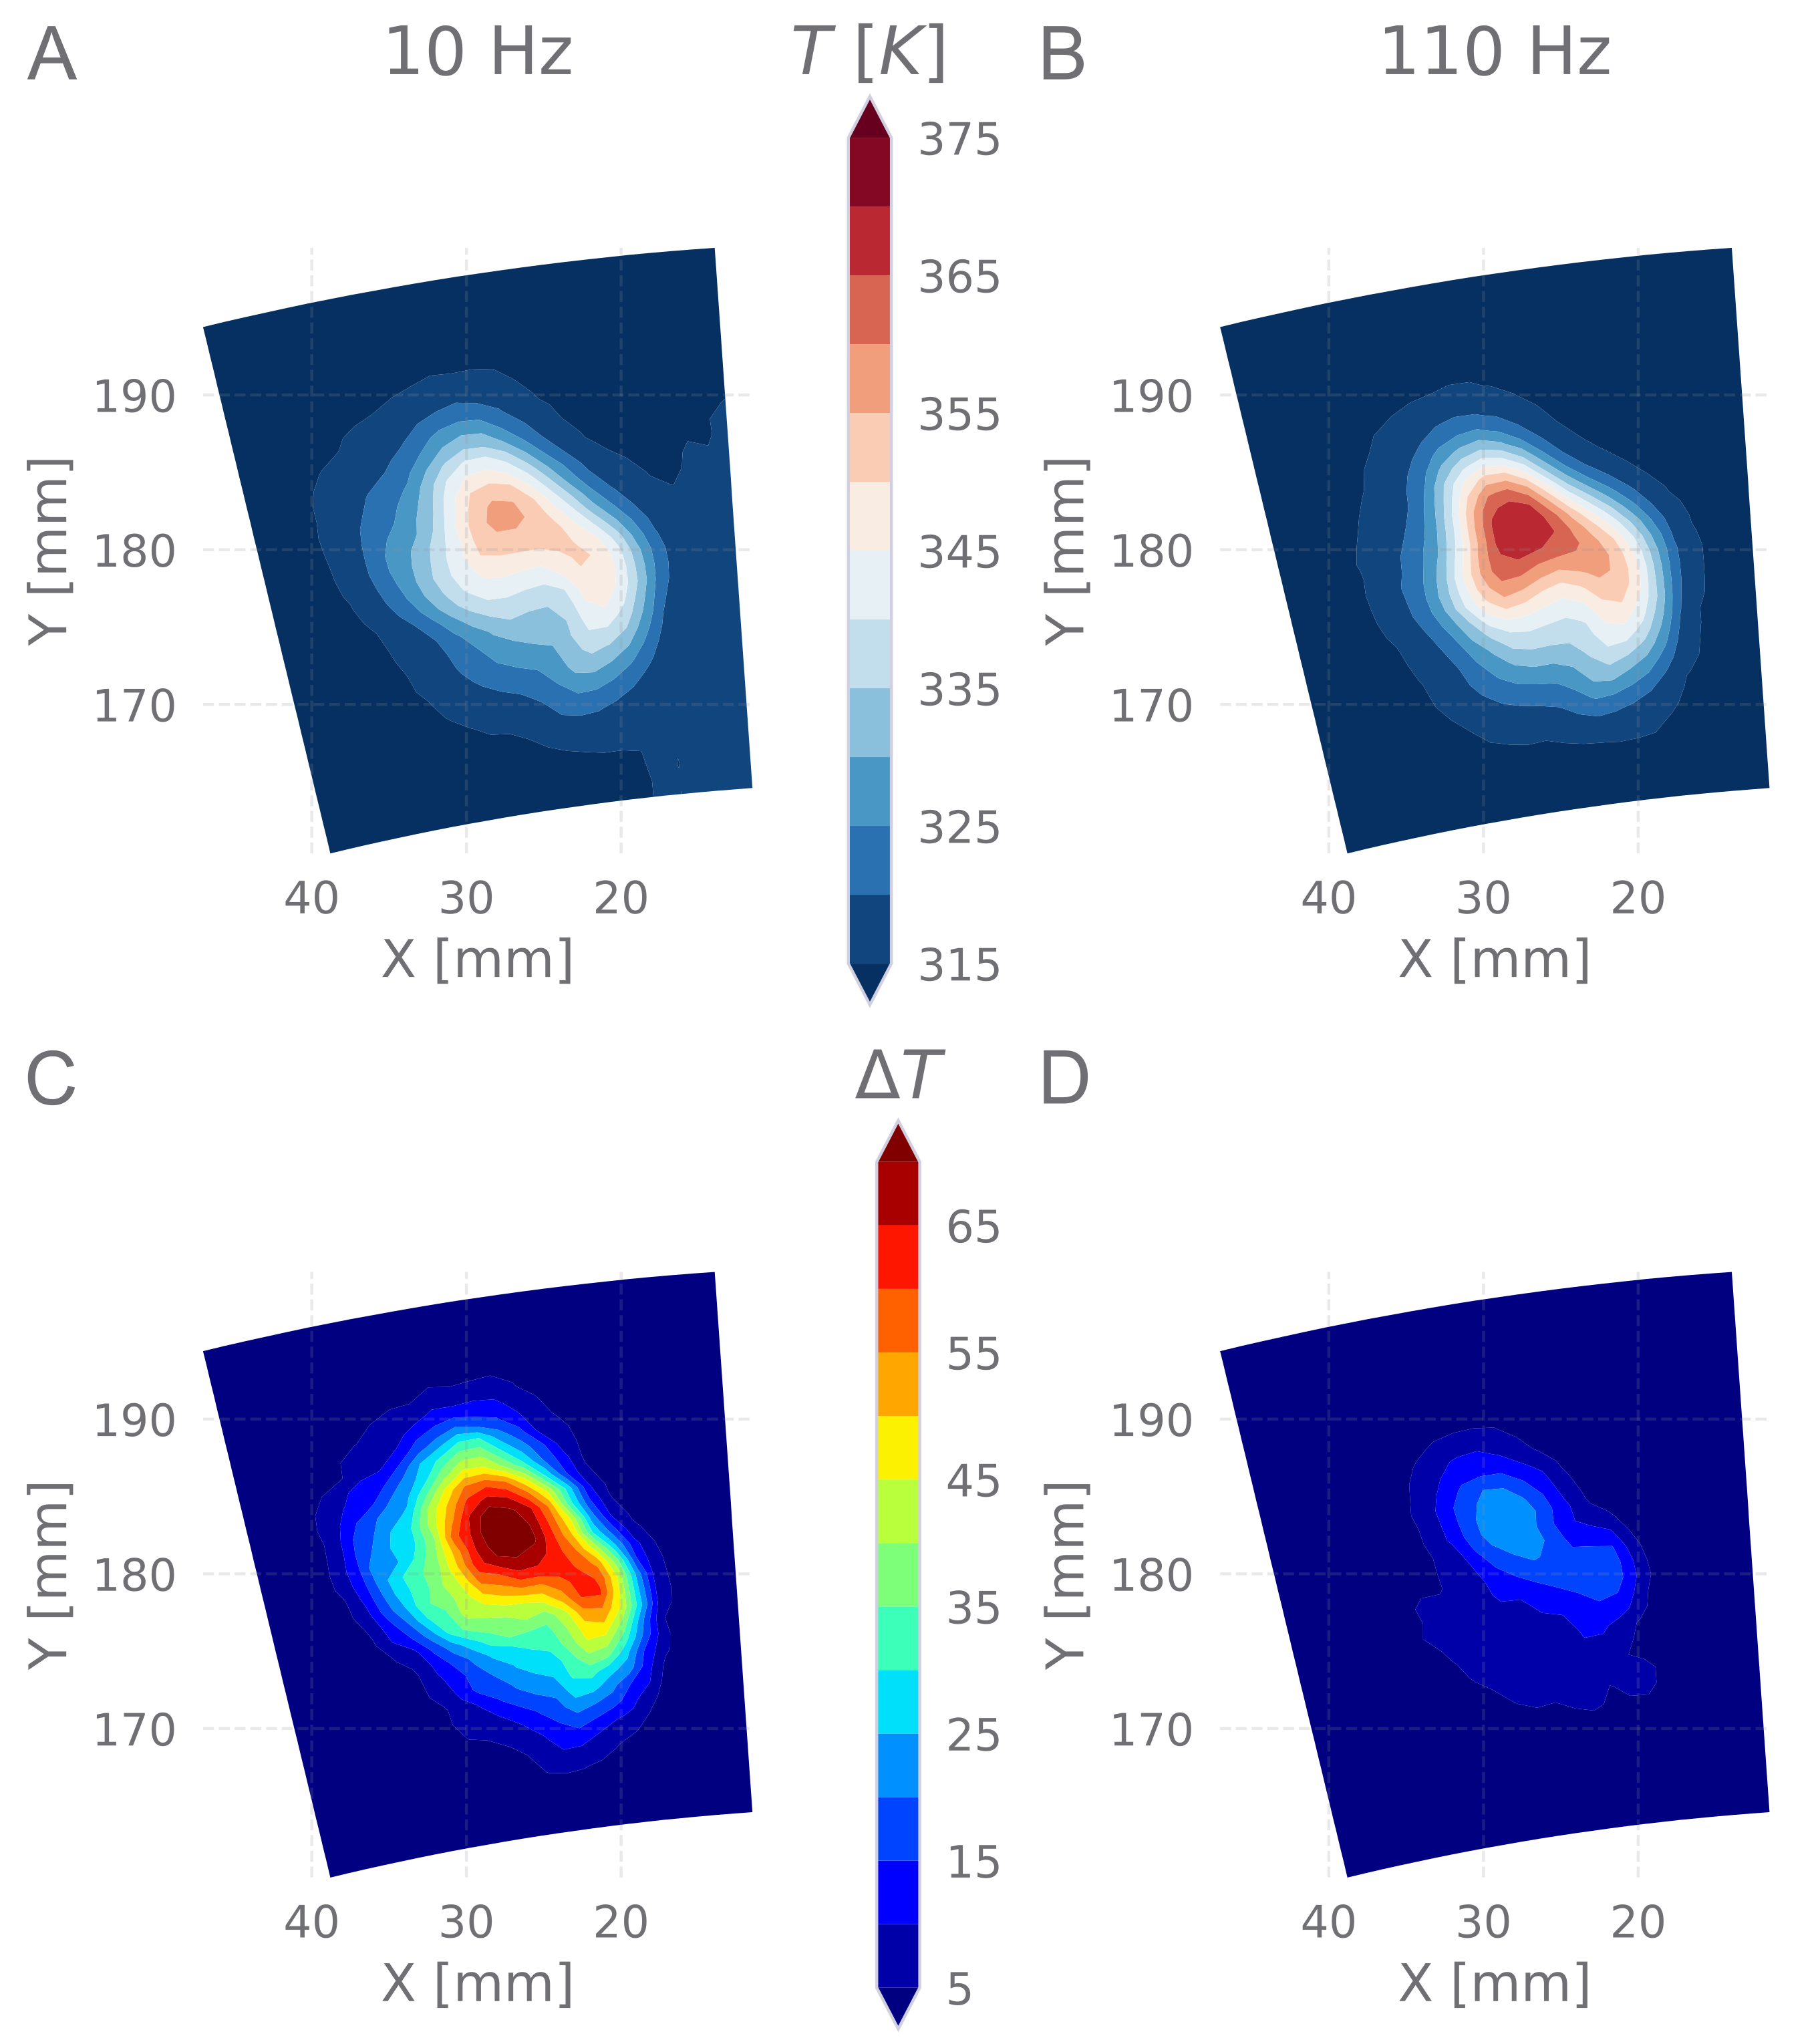
Figure 3 shows the measured temperature disturbance produced by the EWG. The mean temperature contours (frames A and B) indicate that the mean temperature is similar for the two frequencies, but higher for the “110 Hz” case. Despite the EW is injected at mid-span, the swirled motion transports radially upward the temperature disturbance whose peak is found at 65% blade span, 8 mm over the mid span. If the frequency does not influence significantly the mean temperature, it dramatically changes the peak-to-trough temperature difference (frames C and D) due to the severe mixing process taking place at high frequency, as discussed in [20]. Overall, the local peak-to-trough temperatures are 70 K at 10 Hz and 25 K at 110 Hz. Peak-to-mean temperature ratio is approximately 1.30 at 10 Hz and 1.08 at 110 Hz and they are comparable with other combustor simulators documented in literature [3,18,19].
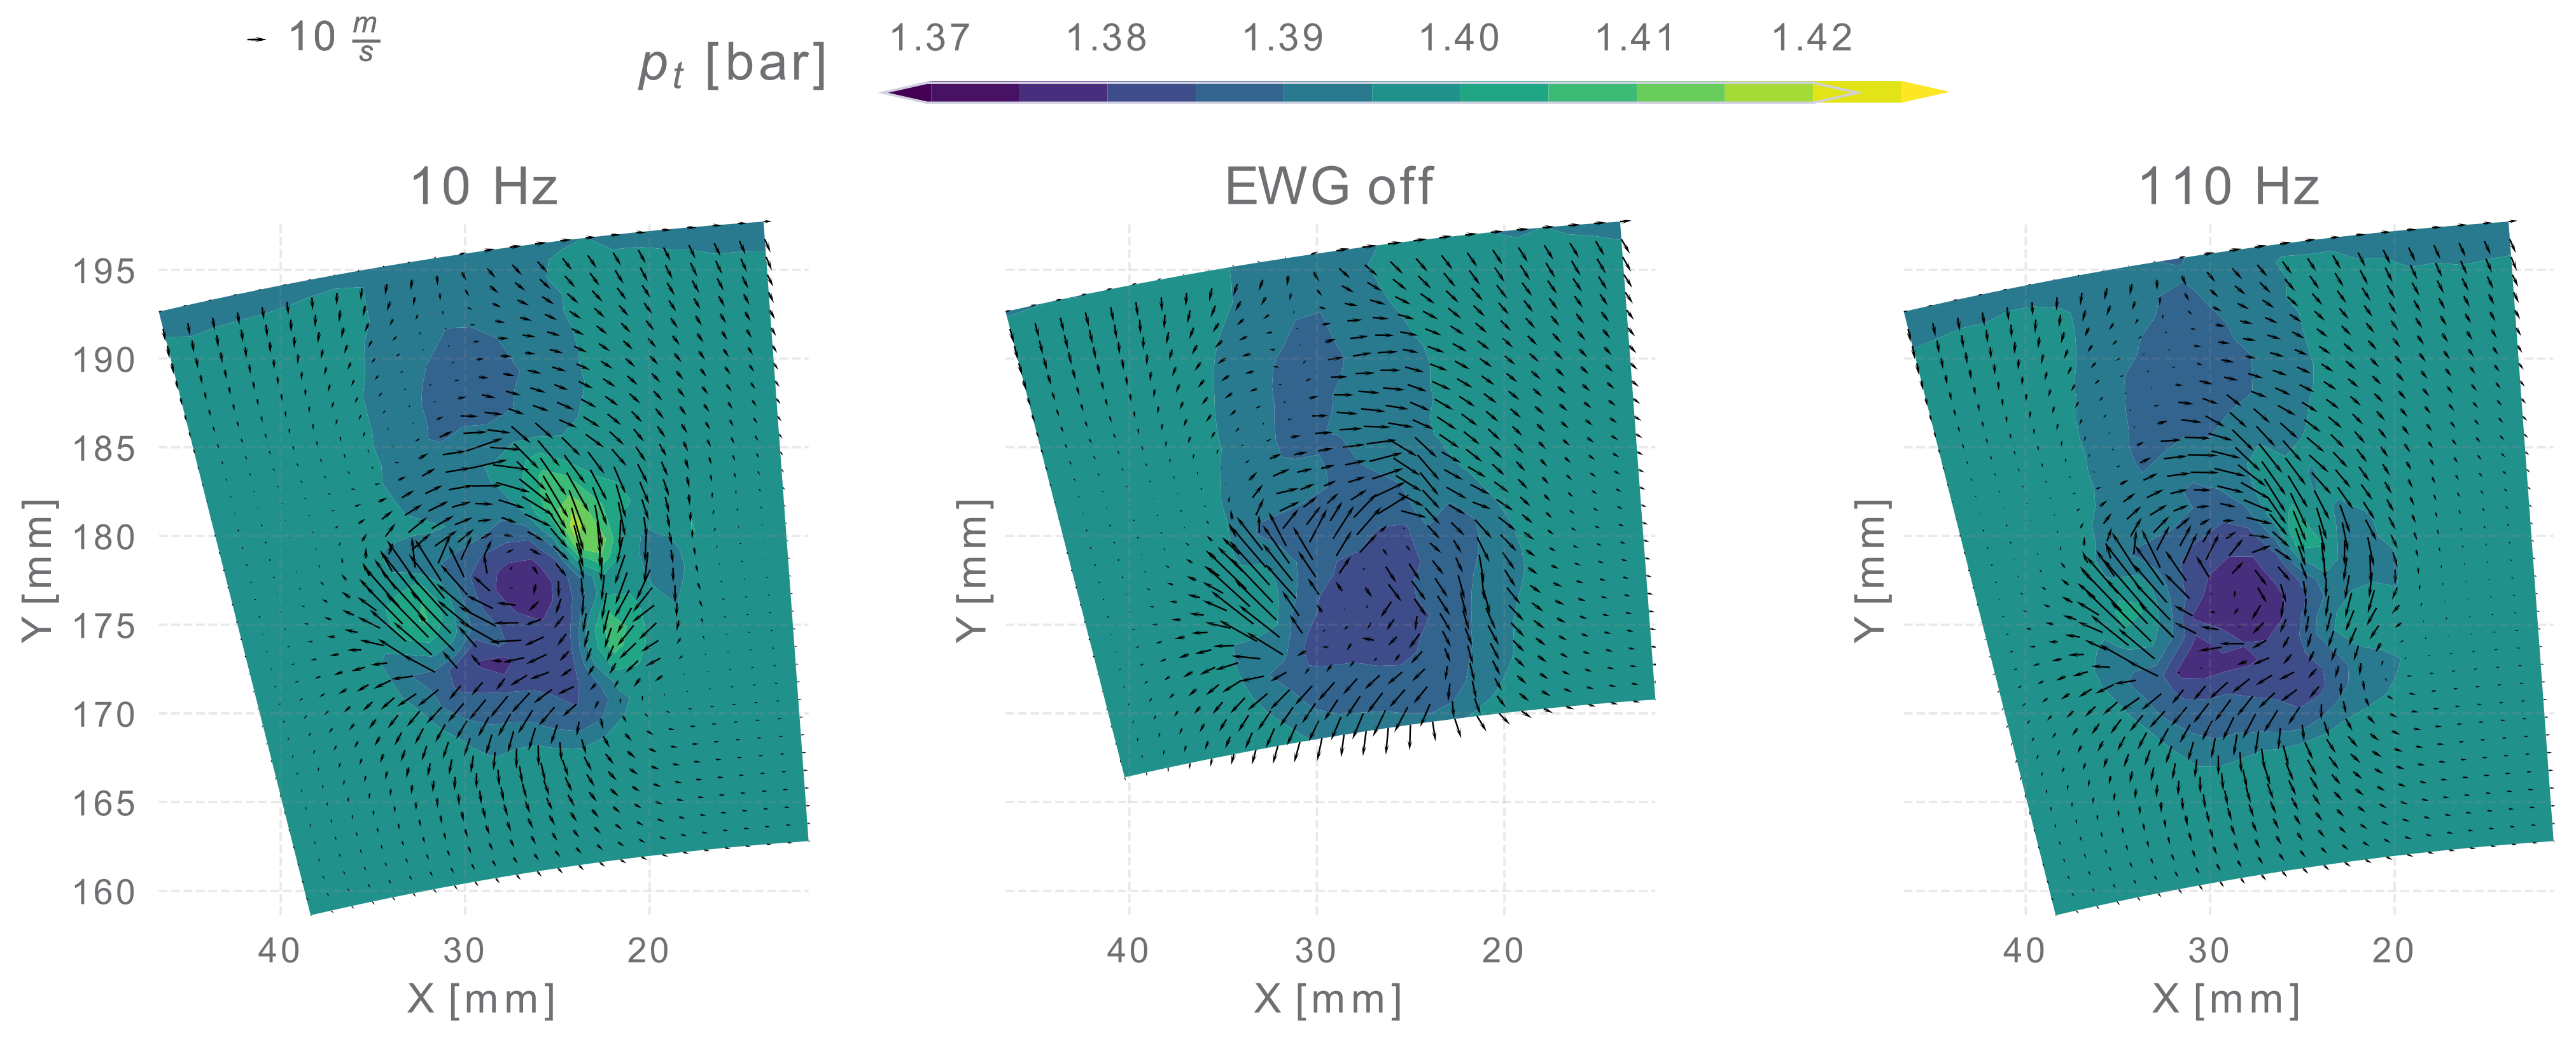
The aerodynamic flow field is shown in Figure 4, where the total pressure contours and the velocity vectors are shown for the cases “10 Hz”, “EWG off” and “110 Hz”. The velocity vectors highlight the generation of a well-defined vortex which has a central recirculation zone, typical of intense swirled flows [23]. The swirl number computed through the correlation showed in [24] is 0.6 that agrees with the calculations through experimental data. Furthermore, the generated vortex exhibits swirl angles of approximately ±50°. The two peaks of the total pressure have to be attributed to the hot and cold jets exiting the injector that do not completely mixed with the main flow. This conclusion comes from the comparison among “10 Hz” and “110 Hz” cases with “EWG off”: when the EWG works, total pressure has higher values than when only the mainstream is swirled. Figure 4 results are consistent with Table 2: EW pressure is larger for the “10 Hz” case than “110 Hz”. Furthermore, a comparison between EW injection cases and “EWG off” one highlights a stabilization and a reinforcement of the vortex. The stabilization is due to the axial injection that avoids, or at least reduces, the recirculation at vortex core. In addition to this, the injection of EWs increases the mass flow that is turned in the swirler generator, thus increasing its strength.
Finally, an unavoidable drawback of the employed injector is the significant wake released by the stem. However, previous experimental campaigns in a wind tunnel have shown that the wake is completely reabsorbed at stator leading edge [20]. As such, the aforementioned flow features of the generated swirl make the generated vortex comparable to what documented in literature [16,17,25,26].
3.2. Downstream Stator Measurements
This section shows and discusses the flow field measurements downstream of the stator. The section is divided into subsections, each one showing the results obtained with a different probe. The goal is to study the EW advection and dissipation through the stator. Quantities are averaged on two stator pitches to preserve the full periodicity.
3.2.1. 5-Hole Pressure Probe
The 5-hole pressure measures the steady flow field exiting the stator. The measurements allow to calculate a total pressure loss coefficient defined as:
where and are the local total and static pressure measured by the 5-hole probe, respectively. is the average upstream turbine total pressure and it is the same for all the 4 cases, being measured upstream the EWG. Please consider that the total pressure loss across the EWG is negligible with respect to the total pressure level.
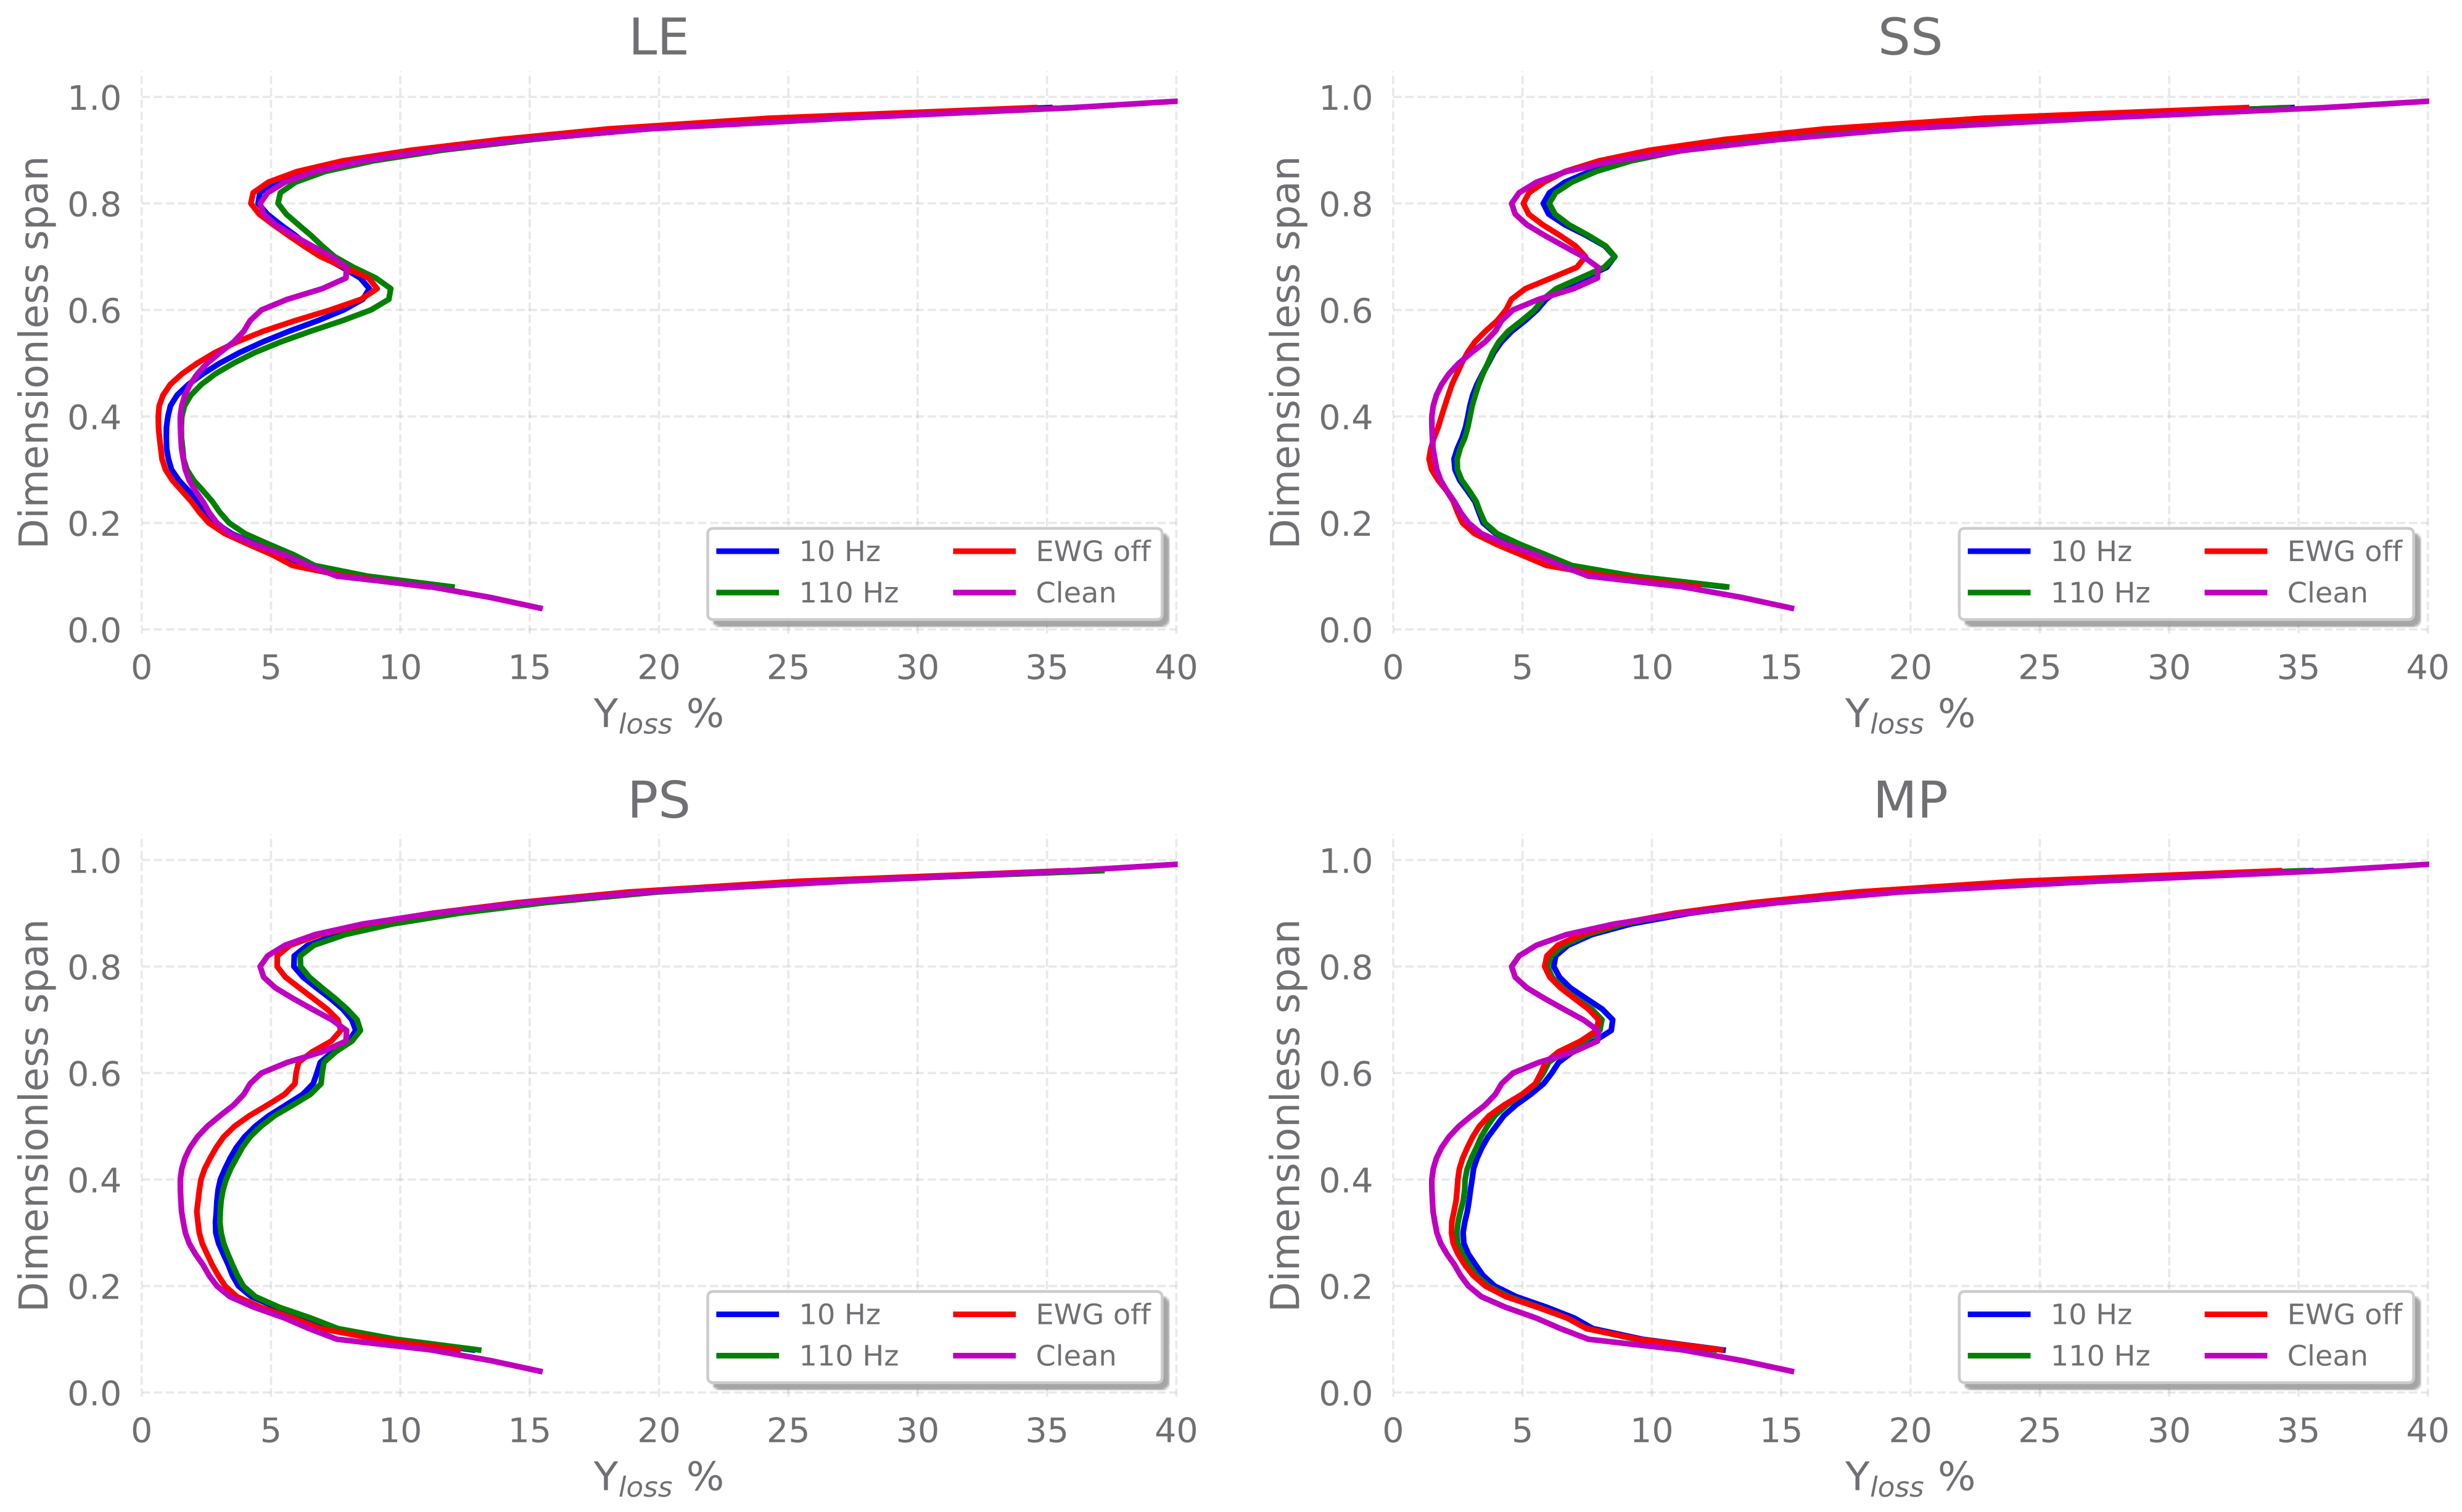
Figure 5 shows the circumferential mass average loss coefficient for the four stator clocking positions and the different injection cases. Particularly, the condition labeled as “Clean” refers to a uniform inlet flow field, whereas in the “EWG off” case the EWG is in place but the EW is not injected. Table 3 summarizes the results highlighting the mass average total pressure loss coefficient.
In all the configurations, the regions close to the hub and tip do not change the loss intensity meaning that they are dominated by the casing boundary layers at tip and by the hub leakage at hub due to a slot in the trailing edge region: hence, the effect of the introduced perturbation is negligible. Instead, the impact on the central region is significant and changes for the different cases: the lowest losses are achieved with the “Clean” condition (see Table 3). The presence of the isolated swirler, i.e., case “EWG off”, and the EW injection as well increase the losses and shift the peak in the central region. Generally speaking, in the midspan region the injected swirl has a positive incidence while it is negative close to the tip; moreover, the introduced swirl co-rotates with the tip passage vortex interacting with it and leading to an overall loss increase. The highest local losses magnitude is found at the LE injection position, whereas the clocking position PS has the widest region of high losses. Although the LE position has the highest peak, the loss profile in the other radial positions overlap with the “Clean” case, showing that EW and swirl profile have a small influence on the downstream stator aerodynamics. Considering that the case “EWG off” imposes only a swirl profile and that the cases “10 Hz” and “110 Hz” combine the swirl profile and the EW, the swirl profile is the biggest contribution to the losses. A proof of this trend can be obtained comparing the relative change between the cases “Clean” and “EWG off” with “EWG off” and the remaining others: the former is the largest, as also shown in Table 3, where the mass average values are shown. The last consideration on Figure 5 regards the effect of the frequency on the aerodynamic flow field: no clear trend can be evidenced comparing outcomes at 10 and 110 Hz. The differences among the perturbed injections cases are still an open question. In authors’ opinion, they could be attributed to the pressure correction implemented on data to take into account of the plant drifts and not to some important flow feature: anyhow, the loss increase due to the inlet perturbation injection is unquestionable. Therefore, regardless the frequency, the EW impact on the downstream flow field is the same, as it will be also pointed out in the yaw angle analysis.
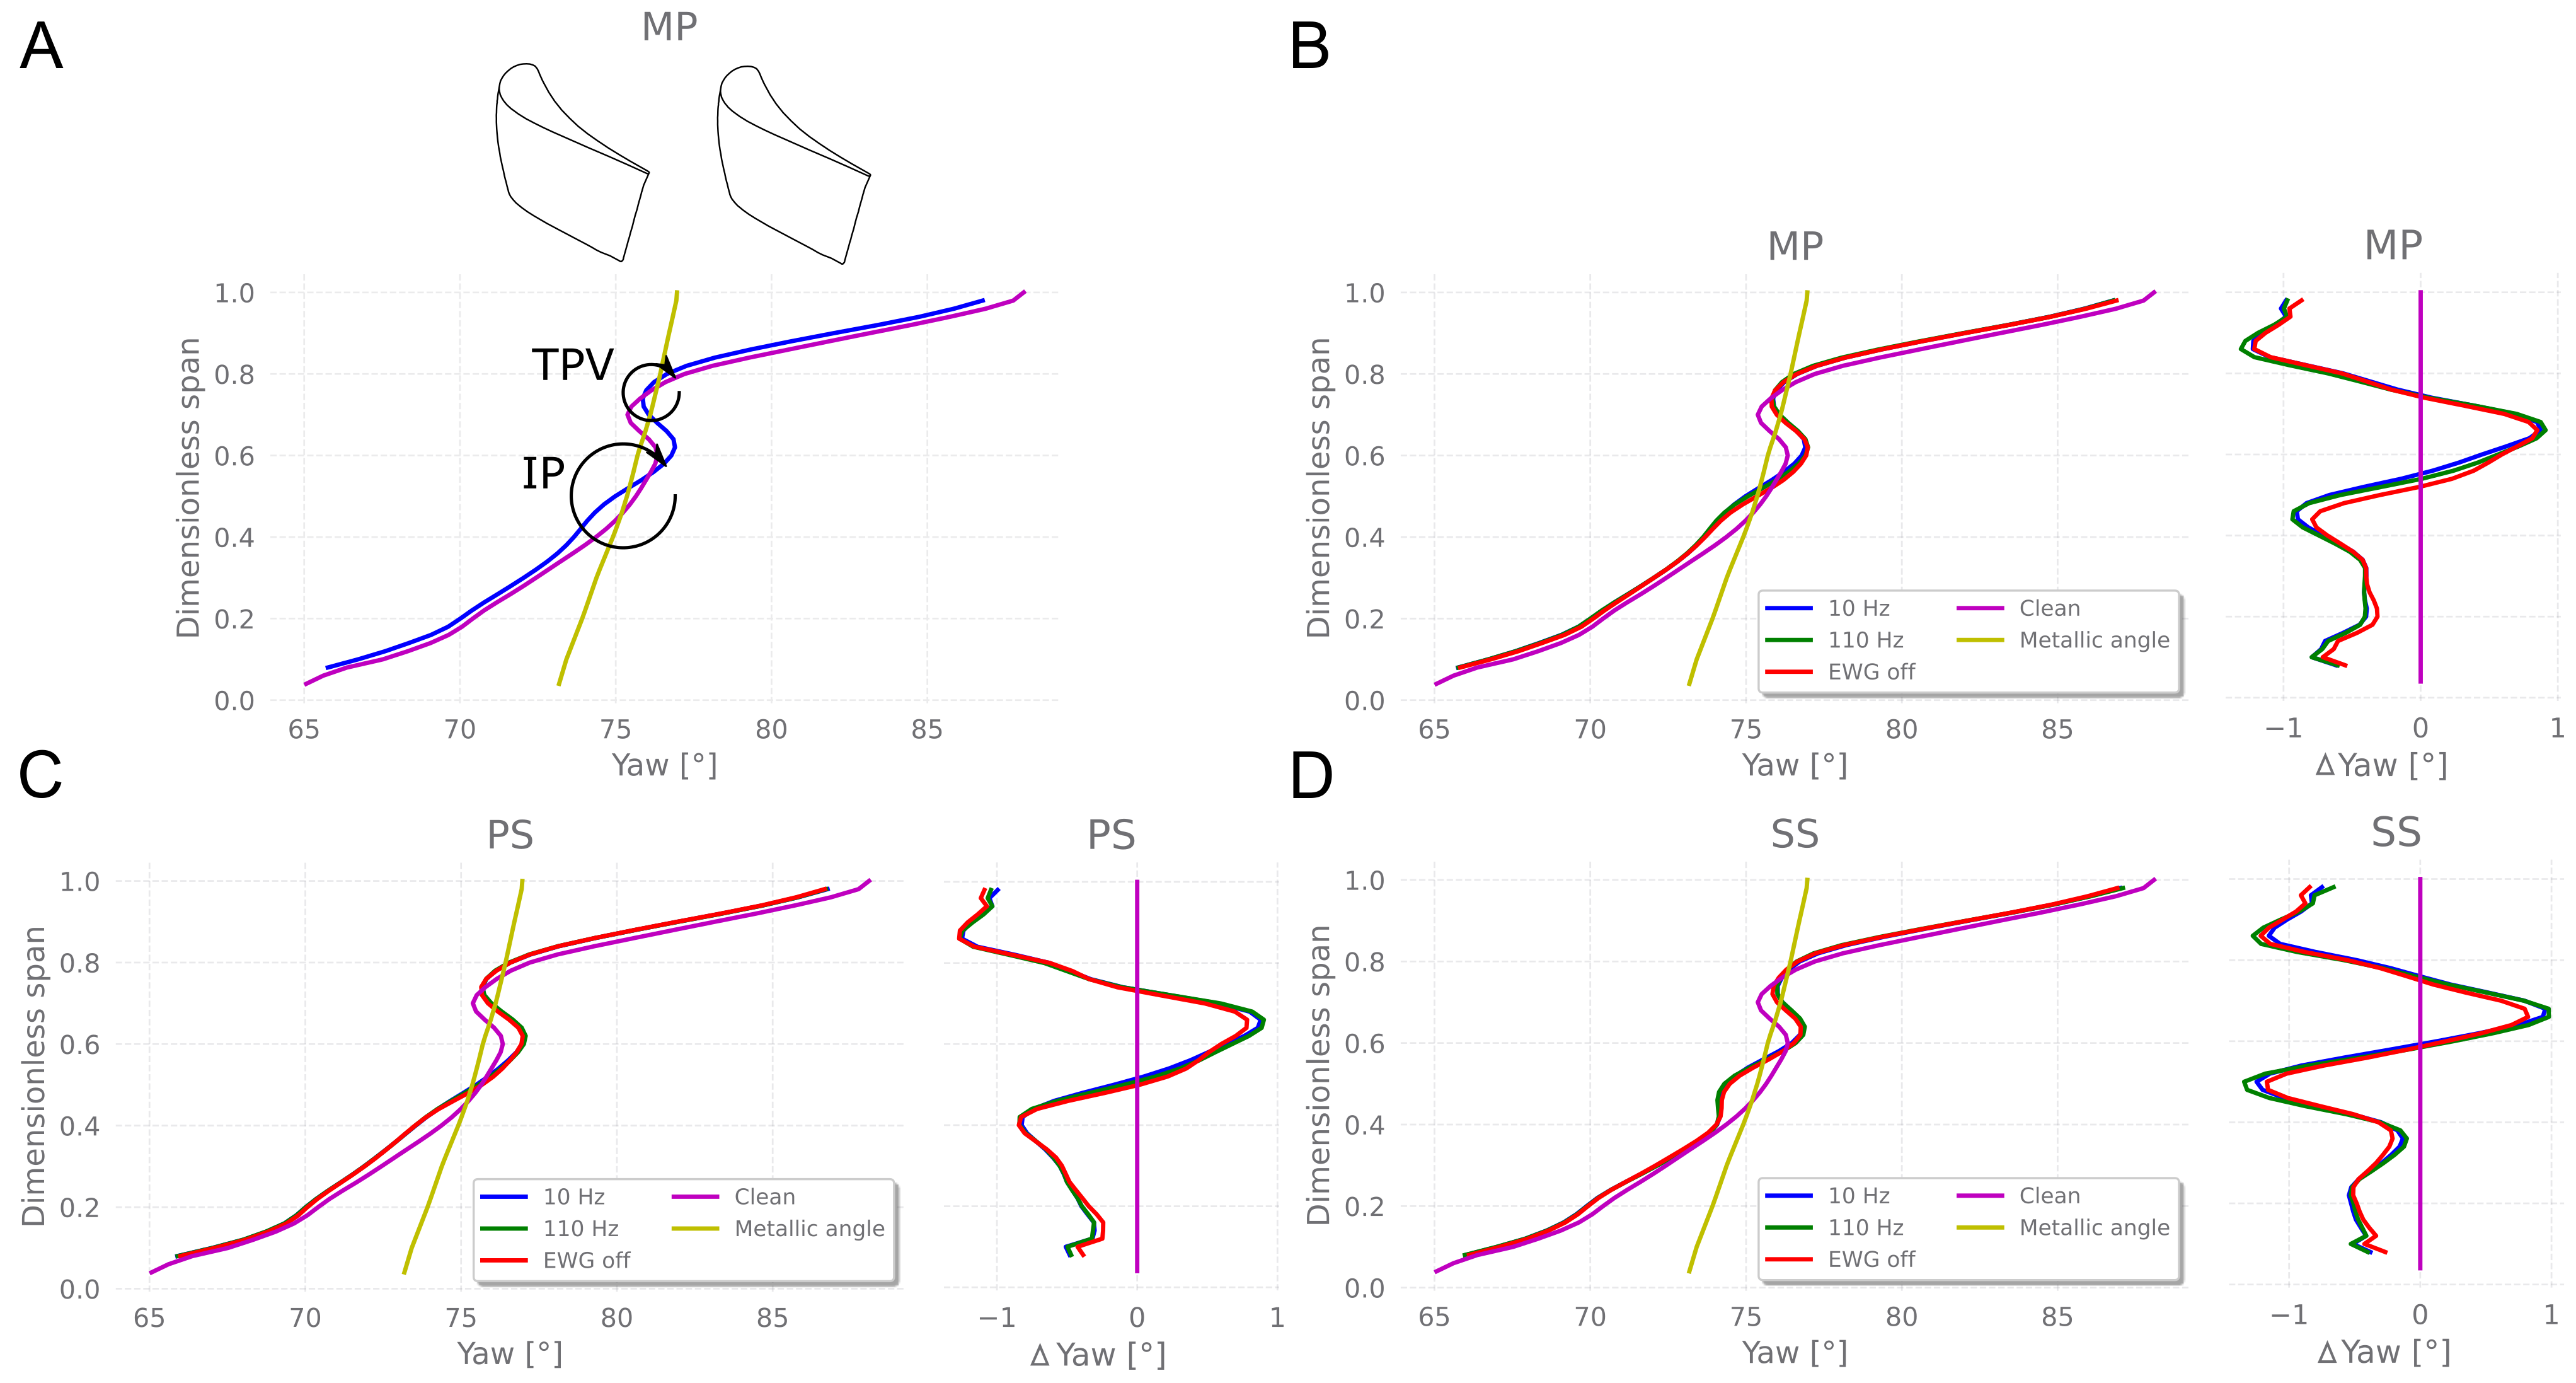
Figure 6 shows the spanwise profile of the azimuthal mass average yaw angle at stator outlet for passage aligned injections, i.e., MP, PS and SS and its difference with the clean case: this difference is supposed to be helpful in supporting the discussion.
In order to understand the yaw angle trend, a brief description of the “Clean” case, i.e., purple line, is helpful. The stator blade has a leaned geometry that produces an overturning at the tip and underturning at the hub. The overturning at the tip can be explained by the strong pressure gradient that is established between the blade pressure side and the suction side, as found in [27,28,29]. The lean geometry produces an accumulation of mass flow at the hub that makes the flow more axial, thus this effect produces the aforementioned underturning at the hub. Furthermore, this blade geometry shifts the tip passage vortex towards midspan.
The effect of the swirl profile injected upstream is appreciable at midspan where, for the passage aligned injections it interacts significantly with the secondary flows. The injected disturbance for these cases can be found around mid-span, as it will be shown in the vorticity discussion. To aid the comprehension of the flow physics, Figure 6A shows the MP case, comparing only “Clean” and “10 Hz” cases. The undisturbed injection, i.e., the purple line, shows an overturning at the tip and underturning at the hub as previously discussed. The tip passage vortex (TPV) is found at approximately 75% of the span and it is highlighted in Figure 6A. Its main effect is at 70% of the span where produces a significant underturning. When the swirl profile is injected (IP vortex in Figure 6A), it is against the bottom TPV branch reducing the underturning found in the “Clean” case; however, the IP produces an overturning and underturning at approximately 60% and 40% span, respectively, according to its turning direction. The core of the swirl profile results at midspan, confirming the previous statement.
Comparing Figure 6B,C profiles, the SS case shows a more confined effect around midspan while for the PS and MP cases the influence arrives till 20% of the span. In fact, in the SS case the lean geometry keeps the IP at its original injection radial position, thus confining its effect and reducing the interaction with the tip secondary flow. The three cases discussed up to now do not show significant differences in the steady aerodynamic flow field injecting or not EW at different frequencies.
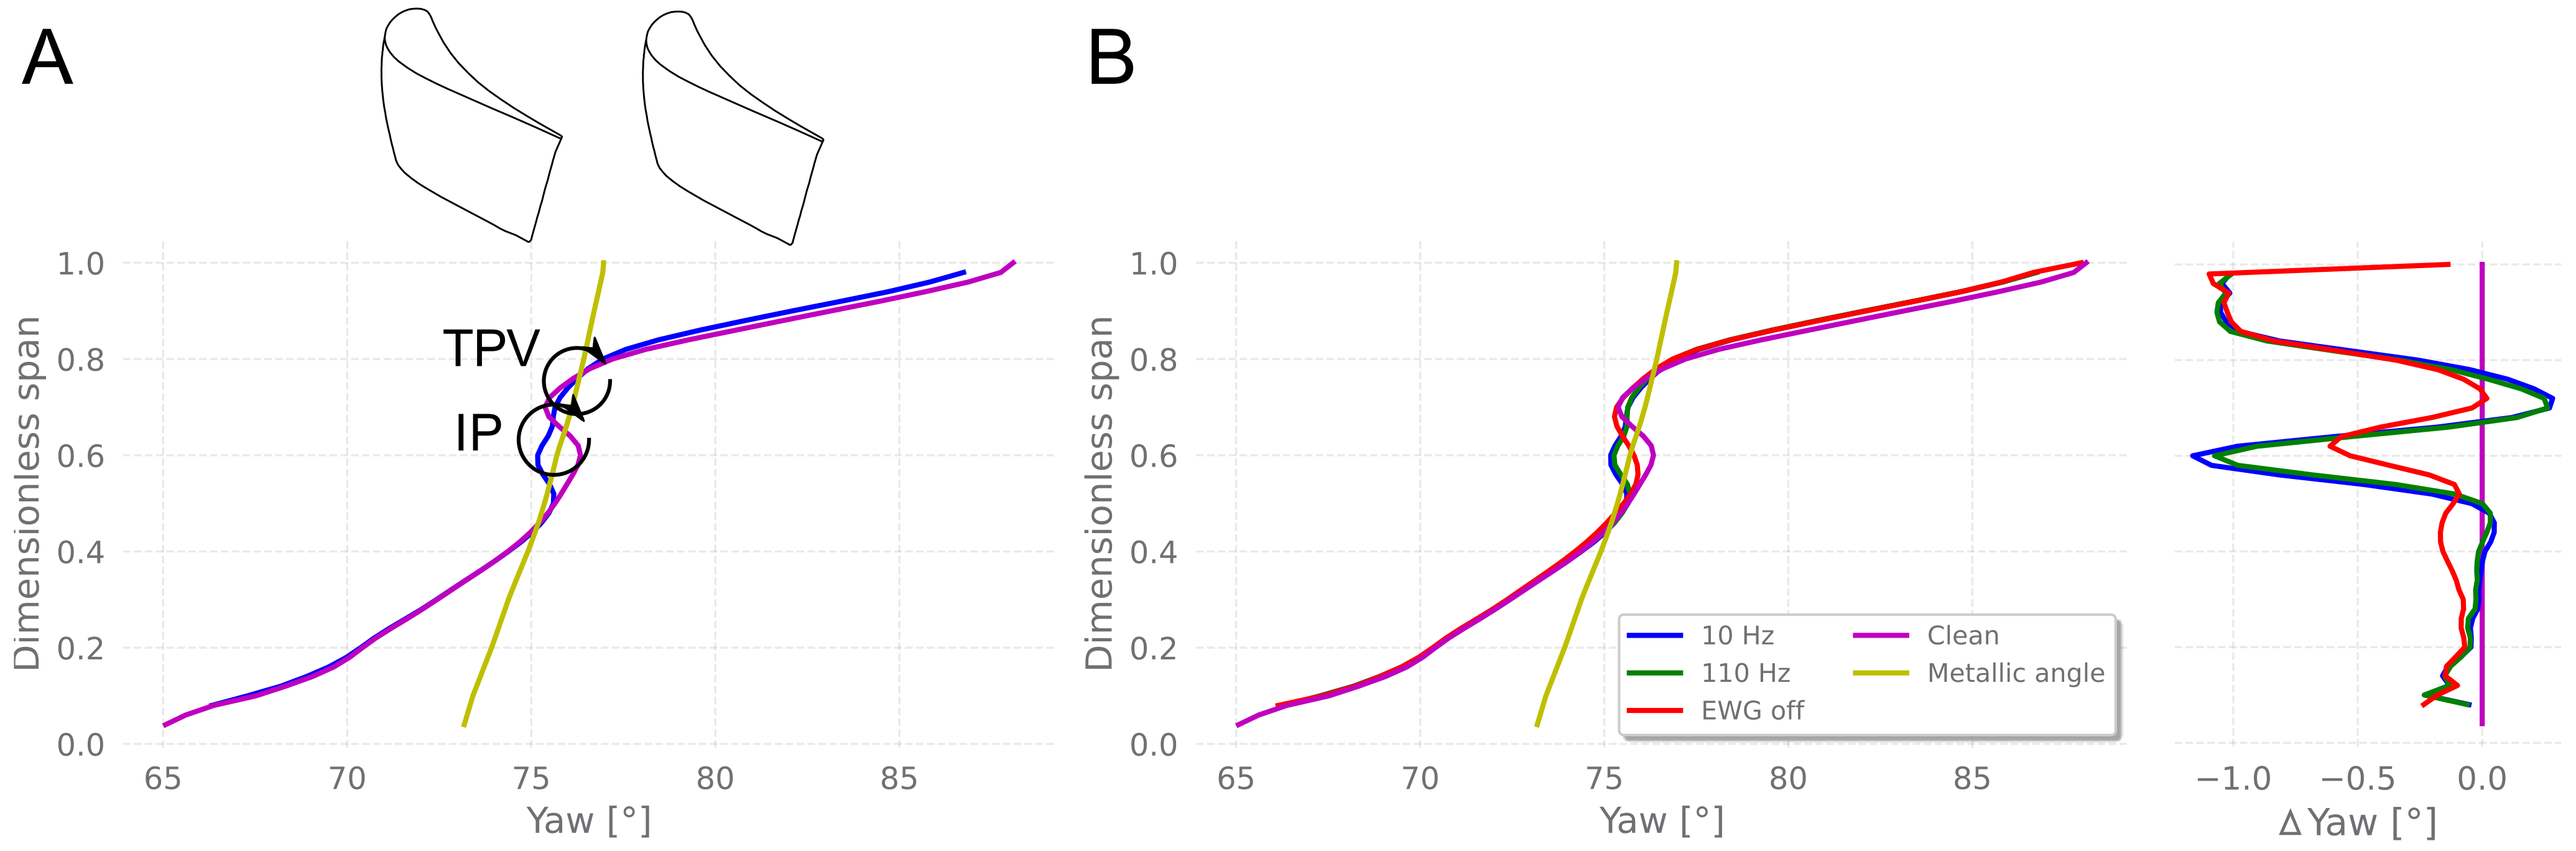
The LE case shows a different trend (Figure 7): independently of the EW frequency, its injection produces differences with respect to the “EWG off” and “Clean” cases. The injected swirl impacting on the blade is weakened but kept confined and moves radially towards the tip, as found in Figure 8, due to a sort of climbing on the suction side blade surface. The swirl profile produces a more pronounced underturning at 60% span than the “Clean” condition, that is in agreement with swirl profile bottom branch (Figure 7A). The interaction between the swirl profile (climbed upward) and the tip passage vortex (pushed downward from the lean geometry) reduces the underturning at 70% span (Figure 7A). Although the two vortexes are corotating, their interaction reduces their impact: the swirl upper branch weakens the bottom tip passage vortex branch. Furthermore, the partial stagnation of the injected perturbation on the LE, thus its weakening, causes a more localized and weaker flow perturbation than passage aligned cases (MP, PS and SS). When the EW is injected (Figure 7B), the swirl profile mass flow increases, thus its intensity. Therefore, the impact discussed regarding Figure 7A is reduced in the case “EWG off”, as highlighted in the Yaw plot (Figure 7B).
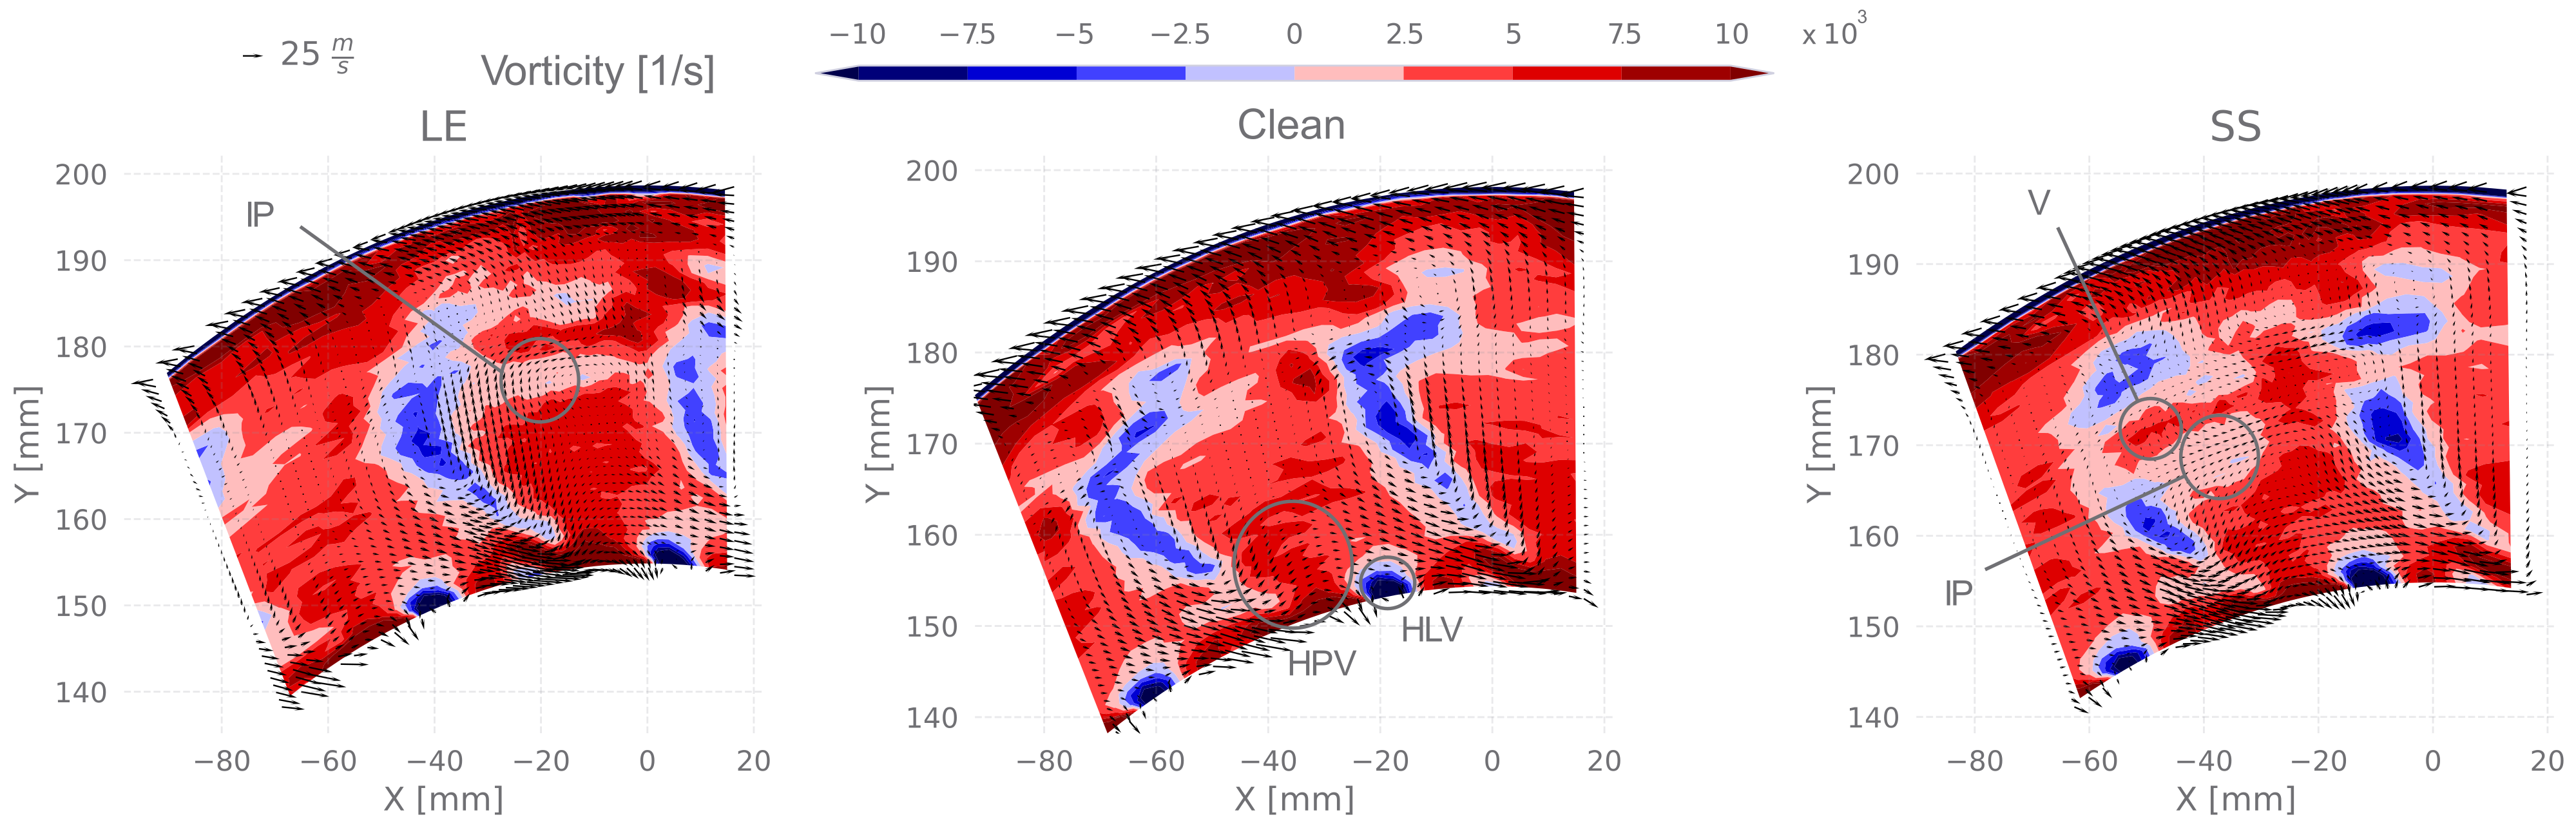
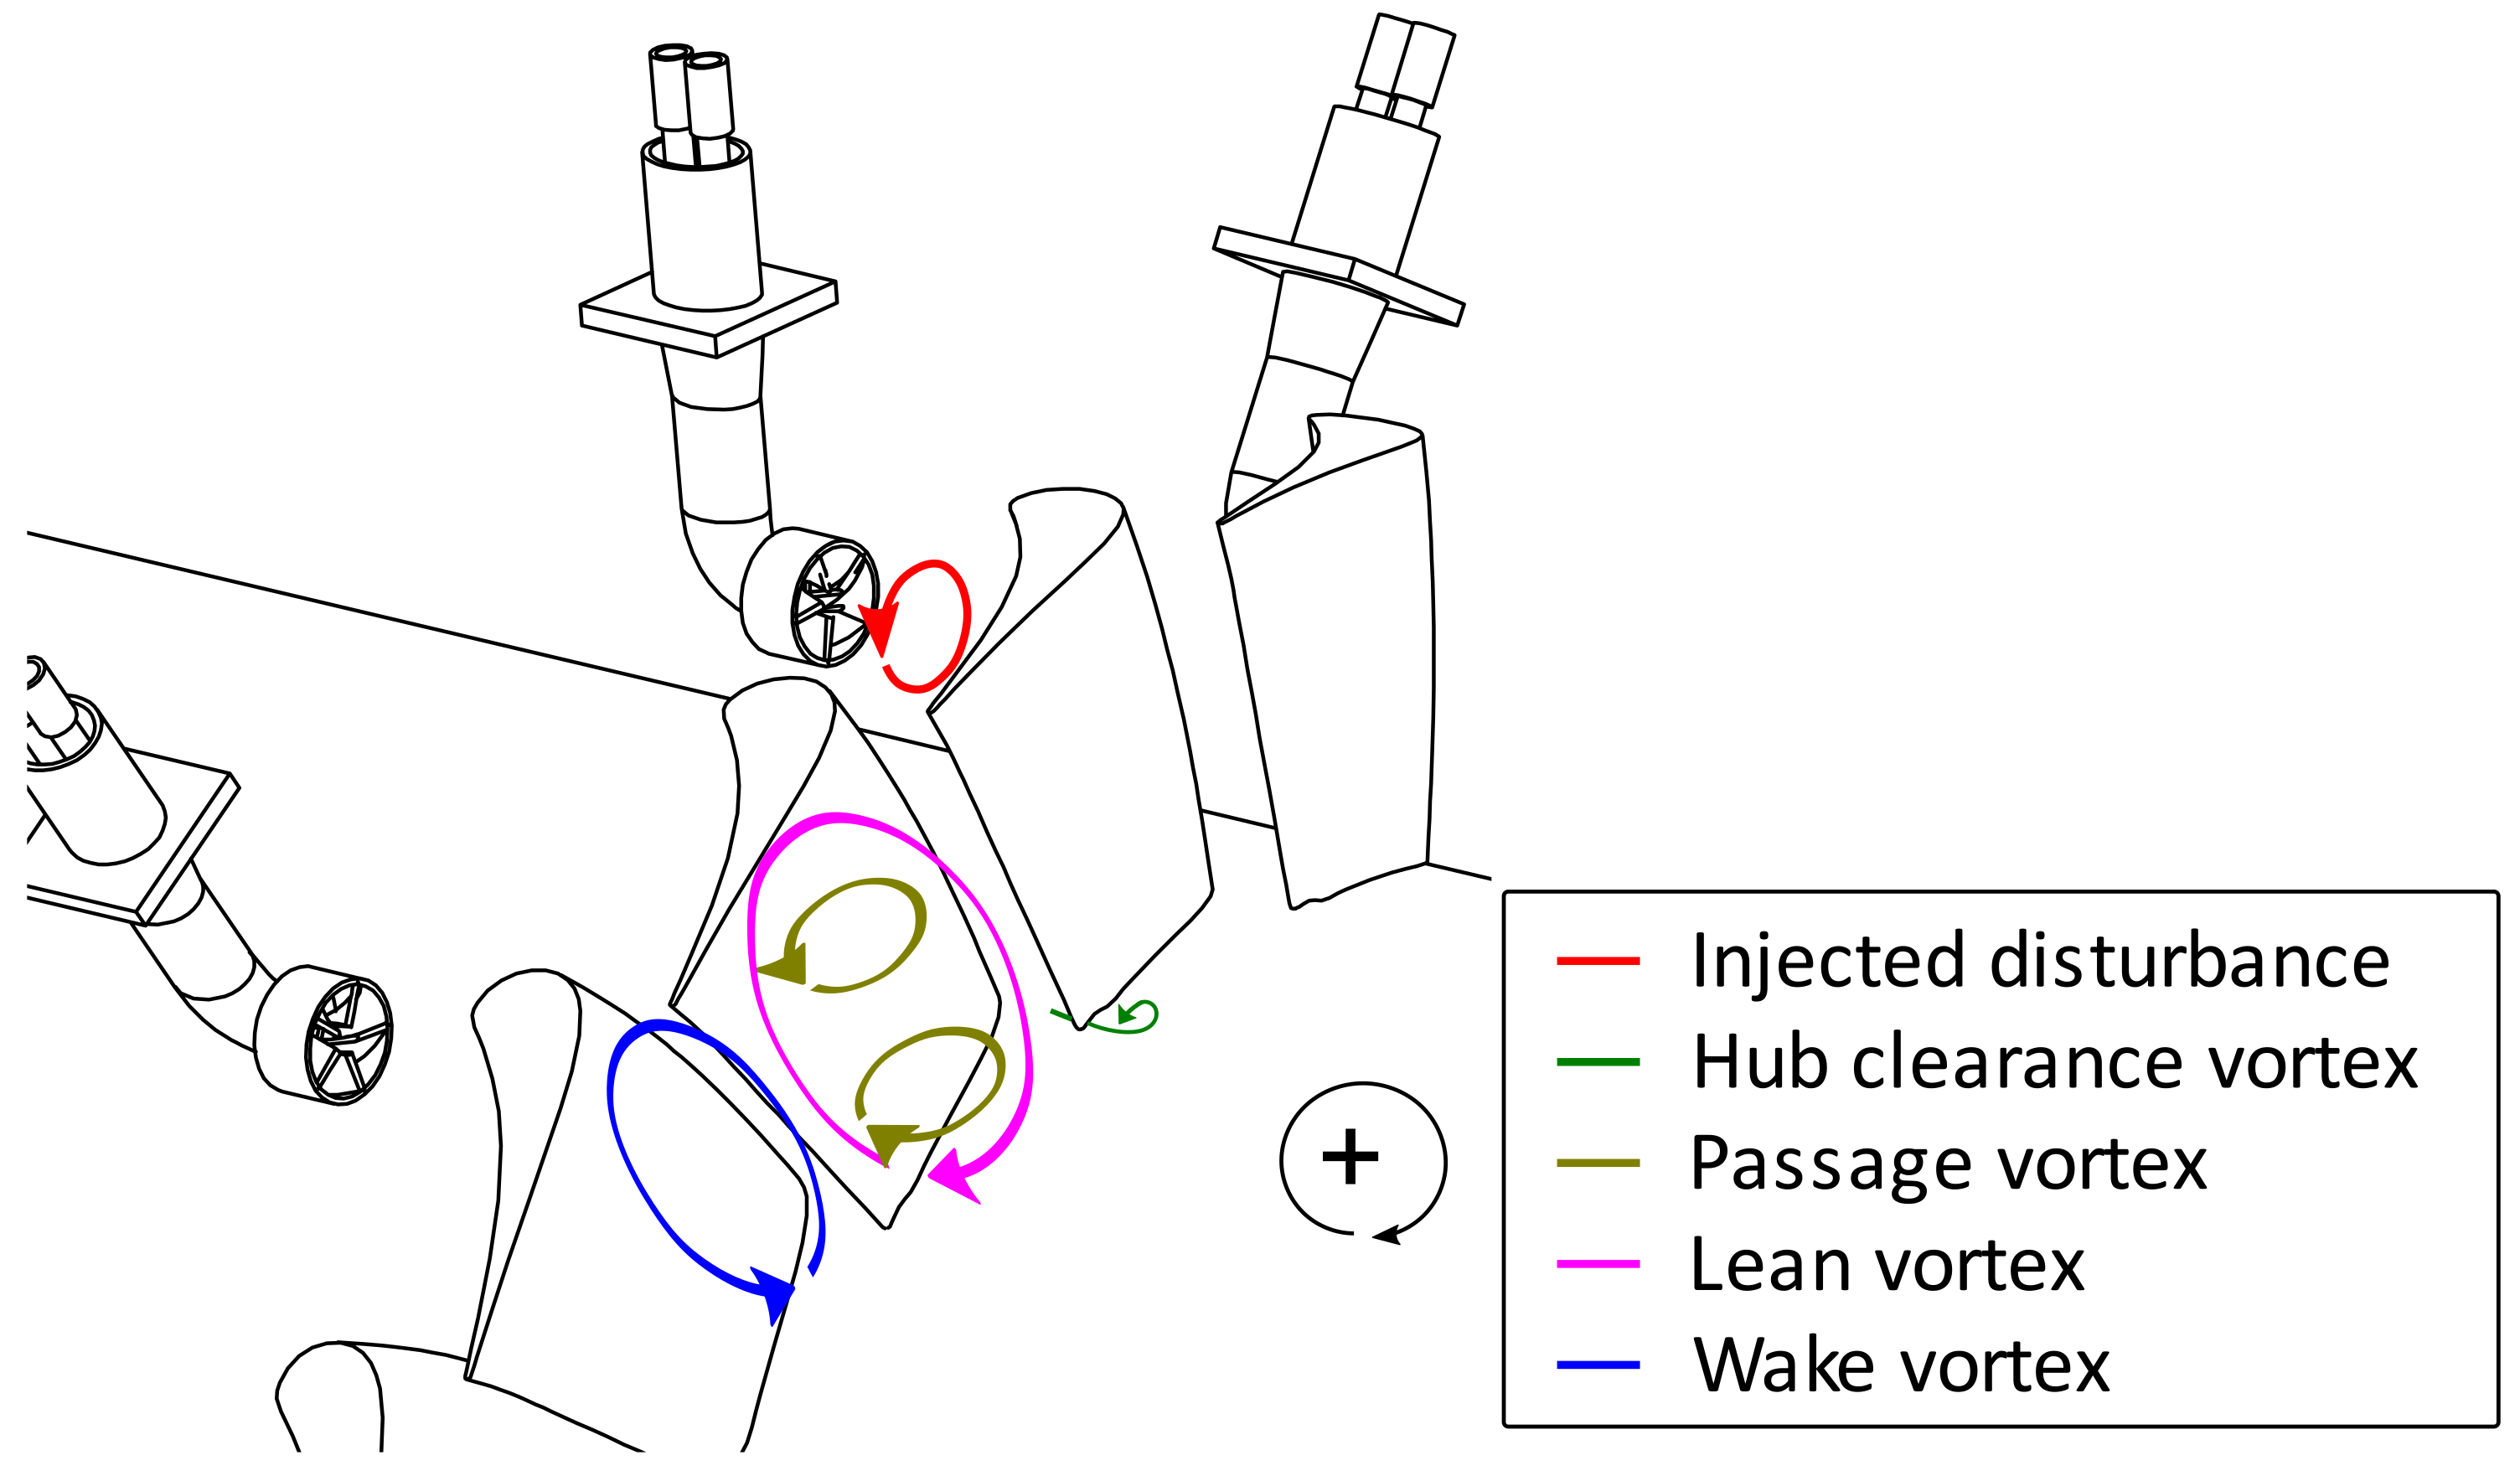
The vorticity field aids the comprehension of the previous results and discussions (Figure 8). The velocity vectors in Figure 8 are calculated as the projection of the flow velocity (measured by 5-hole probe) on a plane perpendicular to the local metallic angle. According to Persico et al. [30] they are not the secondary velocity vectors but provide a useful picture of the vorticity structures. The central frame shows the “Clean” case. The description of the main vortical structures of the “Clean” condition allows to have a clear overview and aid the discussion of the cases with the injected perturbation (labeled as “IP” in Figure 8). By convention, the vorticity is positive when the vortical structures rotate clockwise. The main vorticity field is positive as a result of the leaned geometry [27]: it strengthens the hub passage vortex “HPV”, while it weakens the tip passage vortex “TPV”, being counter-rotating. The vorticity is positive on all the blade height meaning that the vortical structure produced by the lean geometry is stronger than the TPV, which has negative vorticity. In the hub region the lean vorticity strengthens the HPV generating a high vorticity region. The negative vorticity region that extends radially represents the wake vorticity: the viscous shear between the wake and the positive vorticity (generated by the lean) produces a negative vorticity. Leakage at the hub produces an important vortical structure (hub leakage vortex: HLV) that is negative and highlighted in Figure 8.
The left and right frames of Figure 8 show the LE and SS cases for an injection frequency of 10 Hz. Only this frequency is considered since previous outcomes showed that the EW frequency does not affect significantly the aerodynamic flow field, thus the vorticity pattern. Furthermore, the “EWG Off” case is very similar to the “10 Hz” case, confirming that the EW has negligible influence on the steady aerodynamic flow field. Considering that the aerodynamic flow field of SS, MP and PS cases is very similar, SS is shown as representative of the aforementioned three cases. A comparison between the two injection cases with the “Clean” one clearly evidences how significantly the swirling entropy wave affects the stator downstream vorticity. Given that the injected perturbation has a negative vorticity, as shown in Figure 9, in the LE case the EW interacts dramatically with the blade, hence with its wake, lowering the vorticity magnitudes. The experiments show that the injected perturbation remains on the blade suction side, thus interacting with its boundary layer. Furthermore, the injected perturbation is released at the trailing edge close to the wake: this causes a non-negligible reduction of the vorticity in the wake region. In fact, the wake at LE has the widest extension with respect to the other two cases shown.
In the SS case, the IP remains in the central region very close to the blade SS, as shown by the grey circle. The counter-rotating viscous structures, that result from the interaction of the swirling entropy wave and the mainstream, produce an increase in the vorticity field, i.e., the “V” region in Figure 9, around the EW core that affects also the wake.
3.2.2. Fast-Thermocouple
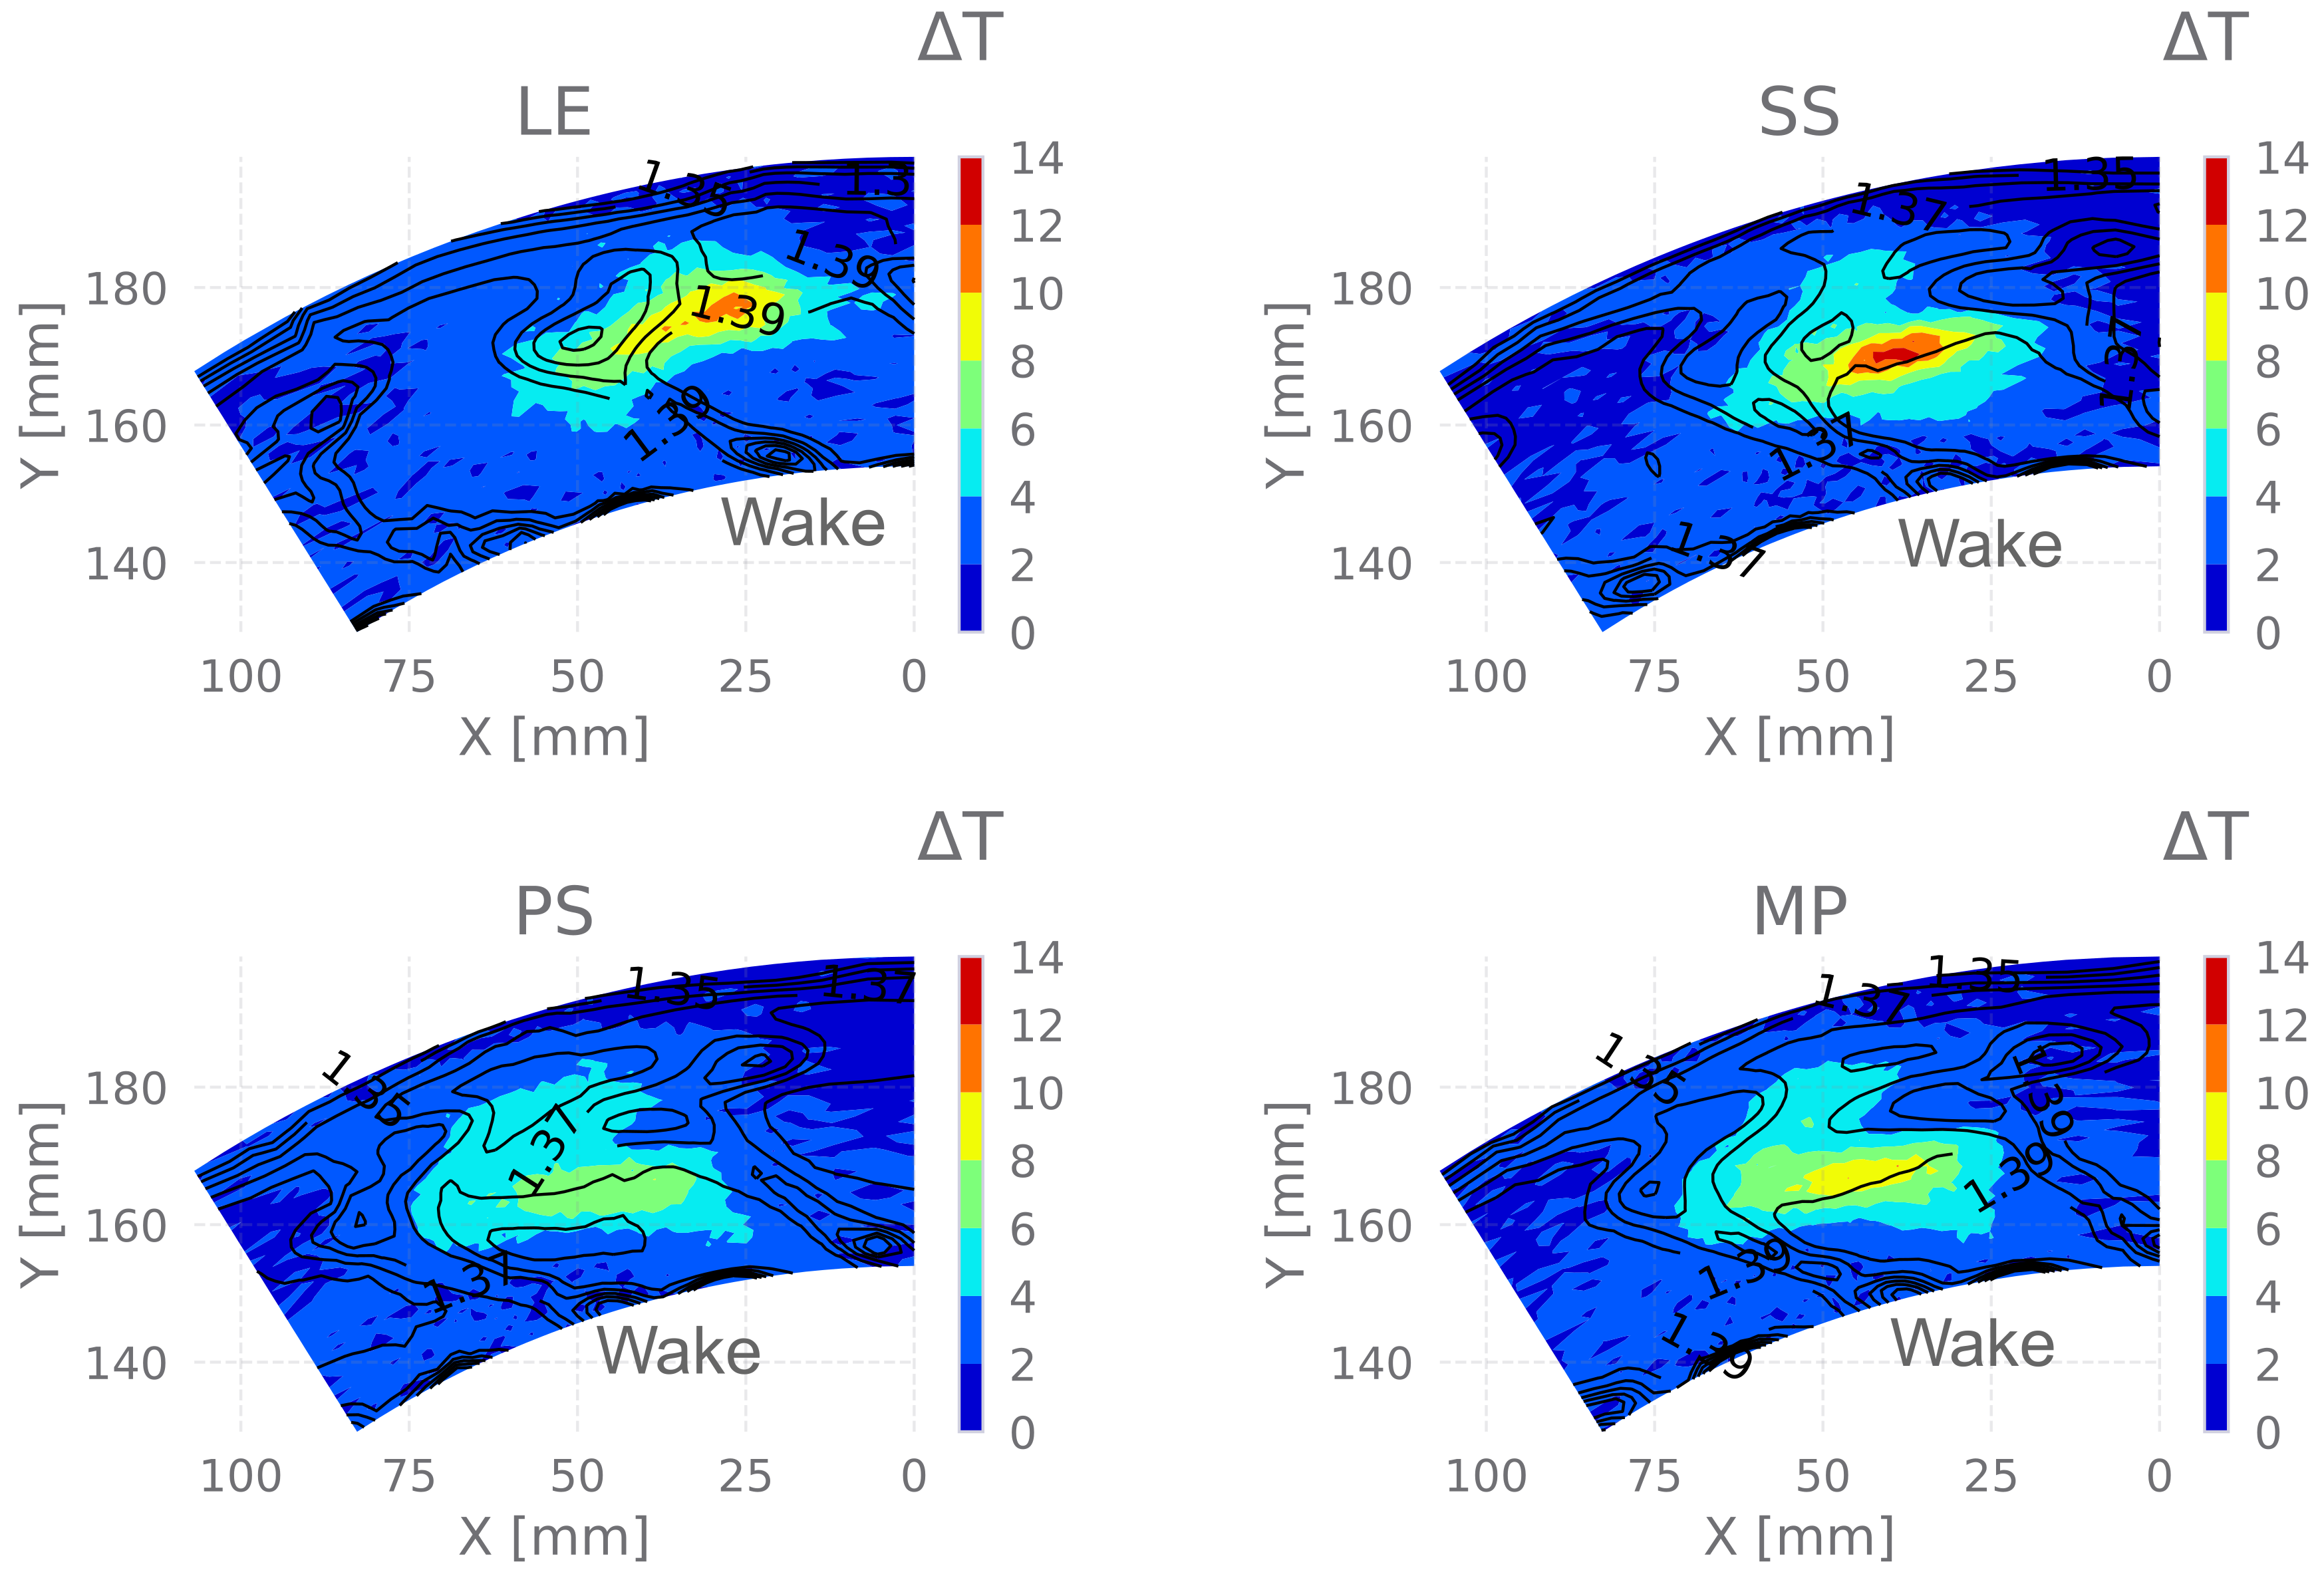
In this section the results of the fast-thermocouple are discussed. This experimental campaign aims at detecting the remaining magnitude of the injected EW downstream of the stator. Furthermore, the temperature field helps in investigating where the EW is released and which secondary structures it interacts with. Figure 10 shows the peak-to-trough temperature value for the different injection positions; each figure also shows the total pressure level as contour-lines.
In each position, the temperature perturbation is found mainly at the center of the blade passage that corresponds in the “Clean” case to the isentropic region. The differences regard the shape of the temperature disturbance that is differently stretched in radial and azimuthal direction depending on the injection position. The highest peak-to-trough temperature is found at the SS: the interaction between the injected EW and stator secondary flows is the lowest. In fact, the shape is also preserved, it is just stretched in radial direction due to its interaction with pressure field generated by the lean geometry. In the PS and MP cases, the temperature level is lower due to the mixing and spreading of the EW over the whole channel. Excluding the LE case, in all the others the EW is not entrained in the blade boundary layer, thus it does not affect significantly the wake temperature. In the LE case, the EW is injected on the blade LE and it interacts significantly with boundary layer so that at stator outlet the EW is partially inside the wake. Although the LE has a different shape, it shares with all the other cases a transport in azimuthal direction towards the pressure side. It can be justified by the interaction of the EW with the bottom branch of the tip passage vortex.
Khanal et al. [17] have found that in case of passage aligned injection the temperature disturbance is transported in the tip region, however in these experiments the injected EW in the passage region, i.e., cases MP, SS and PS, is found at mid span due to the lean blade geometry that pushes the mean flow towards the hub, compensating the aforementioned behavior. Furthermore, Khanal et al. [17] found that given a positive inlet swirl and a hot-streak injected vane aligned (corresponding to the LE case in the present work), it splits in two branches that move on the suction and pressure side respectively. The positive swirl transports the hot-streak on the pressure side towards the tip region, towards the hub on the suction surface. No evidence of this behavior is found in the present work. However, the injected EW is transported partially towards the tip, i.e., the core region, and partially towards the hub in the wake region.
A second comparison can be done with previous works on the same turbine performed at Politecnico di Milano where the injection of an isolated no-swirling EW disturbance discussed [13]. The two works have in common the EW transport towards the pressure side, independently on the injection position. However, in the SS case this transport was lower than what found in this work. The main difference regards the LE case: in their work, Gaetani and Persico [13] found that the EW injected on the LE spreads on the blade surface and mixed with the wake all along its span. These differences can be attributed to the imposed swirl profile that modifies significantly the EW interaction with the blade and secondary flows, as deeply discussed in previous section. As for the intensity, the SS case shows also in [13] the highest temperature level. A large difference is for the PS case where, in case of swirl, the magnitude is strongly weakened with respect to the purely axial no swirled EW injection.
4. Conclusions
This work has shown the strong impact on the flow field at the nozzle vane outlet injecting a combined swirl profile and entropy wave disturbance. Results strengthen the idea that, when designing the first stator blade, the perturbations generated in the combustion chamber cannot be neglected.
The effect on the downstream stator flow field is strongly affected by the injection position. When the disturbance is injected vane aligned (LE), it impinges on the blade vane causing a reduction of its vortical structure strength. Furthermore, the flow has a complex interaction with the secondary flows generating a lower under/overturning with respect to the “Clean” case; the temperature disturbance is strongly stretched in azimuthal direction. In the passage aligned cases (SS, MP, PS cases), the total pressure losses increase on 70% of the blade height, especially in the region between midspan and hub where the swirl profile produces a positive incidence that locally increases the loading, thus the strength of the secondary flows.
Generally, the temperature perturbation is found close to the pressure side of the passage where it is injected, regardless of the cases. This behavior can be attributed to the bottom branch of the tip passage vortex that pushes the injected temperature disturbance towards the pressure side. However, this interaction will require further investigation supported by CFD computations, especially for the LE case.
The comparison between the cases without the injector, with the injector placed but not fed, and the combined swirl profile and entropy wave injection have demonstrated that the aerodynamic steady flow field is mainly affected by the swirl profile, the temperature perturbation having negligible effects. This will be deeply investigated carrying out unsteady pressure measurements to analyze the effects of the temperature perturbation on the unsteady flow field downstream the stator. Furthermore, the EW frequency seems not to have an important effect, besides the attenuation of the injected peak-to-trough temperature difference.
Author Contributions
A.N. and P.G. contributed to the experimental campaign and the data reduction. A.N. gave the major contribution to the paper writing. All authors have read and agreed to the published version of the manuscript.
Funding
This research received no external funding.
Data Availability Statement
The datasets generated during the current study are available from the authors.
Acknowledgments
Authors want to thank Giorgio Scherini and Sofia Sagliocco for their help in the experimental campaigns.
Conflicts of Interest
The authors declare no conflict of interest.
References
- Morgans, A.S.; Duran, I. Entropy noise: A review of theory, progress and challenges. Int. J. Spray Combust. 2016, 8, 285–298. [Google Scholar] [CrossRef] [Green Version]
- Dowling, A.N.; Mahmoudi, Y. Combustion noise. Proc. Combust. Inst. 2015, 35, 65–100. [Google Scholar] [CrossRef] [Green Version]
- Morgans, A.S.; Goh, C.S.; Dahan, J.A. The dissipation and shear dispersion of entropy waves in combustor thermoacoustic. J. Fluid Mech. 2013, 733, R2. [Google Scholar] [CrossRef]
- Sattelmayer, T. Influence of the combustor aerodynamics on combustion instabilities from equivalence ratio fluctuations. J. Eng. Gas Turb. Power 2003, 125, 11–19. [Google Scholar] [CrossRef]
- Beard, P.F.; Smith, A.; Povey, T. Impact of severe temperature distortion on turbine efficiency. J. Turbomach. 2013, 135, 011018. [Google Scholar] [CrossRef]
- Jacobi, S.; Mazzoni, C.; Chana, K.; Rosic, B. Investigation of unsteady flow phenomena in first vane caused by combustor flow with swirl. J. Turbomach. 2017, 139, 041006. [Google Scholar] [CrossRef]
- Beard, P.F.; Smith, A.; Povey, T. Effect of combustor swirl on transonic high pressure turbine efficiency. J. Turbomach. 2014, 136, 011002. [Google Scholar] [CrossRef]
- Gundy-Burlet, K.L.; Dorney, D.J. Influence of 3D Hot Streak on Turbine Heat Transfer. Int. J. Turbo Jet Eng. 1997, 14, 123–131. [Google Scholar]
- Cumpsty, N.A.; Marble, F.E. The interaction of entropy fluctuations with turbine blade rows; A mechanism of turbojet engine noise. Proc. R. Soc. Lond. 1997, 357, 323–344. [Google Scholar]
- Qureshi, I.; Smith, A.D.; Povey, T. HP Vane Aerodynamics and Heat Transfer in the Presence of Aggressive Inlet Swirl. J. Turbomach. 2013, 135, 021040. [Google Scholar] [CrossRef]
- Butler, T.L.; Sharma, O.P.; Joslyn, H.D.; Dring, R.P. Redistribution of an Inlet Temperature Distortion in an Axial Flow Turbine Stage. J. Propuls. Power 1989, 5, 64–71. [Google Scholar] [CrossRef]
- Basol, A.M.; Jenny, P.; Ibrahim, M.; Kalfas, A.I.; Abhari, R.S. Hot Streak Migration in a Turbine Stage: Integrated Design to Improve Aerothermal Performance. J. Eng. Gas Turb. Power 2011, 133, 061901. [Google Scholar] [CrossRef]
- Gaetani, P.; Persico, G. Transport of Entropy Waves Within a High Pressure Turbine Stage. J. Turbomach. 2019, 141, 031006. [Google Scholar] [CrossRef]
- Pinelli, L.; Marconcini, M.; Pacciani, R.; Gaetani, P.; Persico, G. Computational and Experimental Study of the Unsteady Convection of Entropy Waves Within a High Pressure Turbine Stage. J. Turbomach. 2021, 143, 091011. [Google Scholar] [CrossRef]
- Adams, M.G.; Povey, T.; Hall, B.F.; Cardwell, D.N.; Chana, K.S.; Beard, P.F. Commissioning of a combined hot-streak and swirl profile generator in a transonic turbine test facility. J. Eng. Gas Turb. Power 2020, 142, 031008. [Google Scholar] [CrossRef] [Green Version]
- Adams, M.G.; Beard, P.F.; Stokes, M.R.; Wallin, F.; Chana, K.S.; Povey, T. Effect of a Combined Hot-Streak and Swirl Profile on Cooled 1.5-Stage Turbine Aerodynamics: An Experimental and Computational Study. J. Turbomach. 2021, 143, 021011. [Google Scholar] [CrossRef]
- Khanal, B.; He, L.; Northall, J.; Adami, P. Analysis of Radial Migration of Hot-Streak in Swirling Flow Through High-Pressure Turbine Stage. J. Turbomach. 2013, 135, 041005. [Google Scholar] [CrossRef]
- Giusti, A.; Worth, N.A.; Mastorakos, E.; Dowling, A.P. Experimental and Numerical Investigation into the Propagation of Entropy Waves. AIAA J. 2017, 55, 446–458. [Google Scholar] [CrossRef]
- Christodoulou, L.; Karimi, N.; Cammarano, A.; Paul, M.; Navarro-Martinez, S. State prediction of an entropy wave advecting through a turbulent channel flow. J. Fluid Mech. 2020, 882, A8. [Google Scholar] [CrossRef]
- Notaristefano, A.; Gaetani, P. Design and commissioning of a Combustor Simulator combining Swirl and Entropy Wave generation. Int. J. Turbomach. Propuls Power 2020, 5, 27. [Google Scholar] [CrossRef]
- Gaetani, P.; Persico, G.; Spinelli, A. Coupled effect of expansion ratio and blade loading on the aerodynamics of a high-pressure gas turbine. Appl. Sci. 2017, 7, 259. [Google Scholar] [CrossRef] [Green Version]
- Notaristefano, A.; Gaetani, P.; Dossena, V.; Fusetti, A. Uncertainty evaluation on multi-hole aerodynamic pressure probes. J. Turbomach. 2021, 143, 091001. [Google Scholar] [CrossRef]
- Ruith, M.R.; Chen, P.; Meiburg, E.; Maxworthy, T. Three-dimensional vortex breakdown in swirling jets and wakes: Direct numerical simulation. J. Fluid Mech. 2003, 486, 331–378. [Google Scholar] [CrossRef] [Green Version]
- Gupta, A.K.; Lilley, D.G.; Syred, N. Swirl Flows; Energy and Engineering Science Series; Abacus Press: Kent, UK, 1985. [Google Scholar]
- Andreini, A.; Bacci, T.; Insinna, M.; Mazzei, L.; Salvadori, S. Hybrid RANS-LES modeling of the aerothermal field in an annular hot streak generator for the study of combustor—Turbine interaction. J. Eng. Gas Turb. Power 2016, 139, 021508. [Google Scholar] [CrossRef]
- Werschnik, H.; Schneider, M.; Herrmann, J.; Ivanov, D.; Schiffer, H.P.; Lyko, C. The influence of combustor swirl on pressure losses and the propagation of coolant flows at the Large Scale Turbine Rig (LSTR): Experimental and numerical investigation. Int. J. Turbomach. Propuls. Power 2017, 2, 12. [Google Scholar] [CrossRef]
- D’Ippolito, G.; Dossena, V.; Mora, A. The Influence of Blade Lean on Straight and Annular Turbine Cascade Flow Field. J. Turbomach. 2011, 133, 011013. [Google Scholar] [CrossRef]
- Harrison, S. The Influence of Blade Lean on Turbine Losses. J. Turbomach. 1992, 114, 184–190. [Google Scholar] [CrossRef]
- Denton, J.D.; Xu, L. The exploitation of three-dimensional flow in turbomachinery design. Proc. Inst. Mech. Eng. Part C J. Mec. 1999, 213, 125–137. [Google Scholar] [CrossRef]
- Persico, G.; Gaetani, P.; Dossena, V.; D’Ippolito, G.; Osnaghi, C. On the definition of the secondary flow in three-dimensional cascades. Proc. Inst. Mech. Eng. Part A J. Power Energy 2003, 223, 667–676. [Google Scholar] [CrossRef]
Figure 1.
Turbine meridional view (A) and EWG layout (B).

Figure 2.
EWG set-up. Top: main geometrical distances. Bottom: injection positions.

Figure 3.
EWG generated disturbance assessment (Plane T1). Contour plots of: total temperature in frames (A,B); peak-to-trough temperature value in (C,D). (A,C) “10 Hz” case; (B,D) “110 Hz” case.
Figure 3.
EWG generated disturbance assessment (Plane T1). Contour plots of: total temperature in frames (A,B); peak-to-trough temperature value in (C,D). (A,C) “10 Hz” case; (B,D) “110 Hz” case.

Figure 4.
EWG generated disturbance assessment (Plane T1). Total pressure field as a contour and velocities magnitudes as vectors (viewed upstream the injector). From left to right: “10 Hz”, “EWG off” and “110 Hz” cases.
Figure 4.
EWG generated disturbance assessment (Plane T1). Total pressure field as a contour and velocities magnitudes as vectors (viewed upstream the injector). From left to right: “10 Hz”, “EWG off” and “110 Hz” cases.

Figure 5.
Circumferential mass average loss coefficient downstream of the stator (plane T2) at different injection positions. Measurements are carried out with EWG switched off (“EWG off”), injecting EW at 10 and 110 Hz (“10 Hz” and “110 Hz” respectively) and without the EWG in exploiting uniform inlet condition (“Clean”).

Figure 6.
Circumferential mass average flow angle downstream of the stator (plane T2) at different passage aligned injecting positions (MP, PS and SS). Measurements are carried out with EWG switched off (“EWG off”), injecting EW at 10 and 110 Hz (“10 Hz” and “110 Hz” respectively) and without the EWG exploiting uniform inlet condition (“Clean”). Metallic angle line represents the geometric stator exiting angle. Frame (A): “Clean” and “10 Hz” cases comparison for MP. Frames (B–D): flow angle and its difference with respect to the “Clean” case for MP, PS and SS cases, respectively. Blade mirrored in frame A to ease the reading compared to flow angle.

Figure 7.
Circumferential mass average yaw angle downstream of the stator (Plane T2) at vane aligned position (LE). Measurements are carried out with EWG switched off (“EWG off”), injecting EW at 10 and 110 Hz (“10 Hz” and “110 Hz” respectively) and without the EWG exploiting uniform inlet condition(“Clean”). Metallic angle line represents the geometric stator exiting angle. Frame (A): “Clean” and ”10 Hz” cases. Frame (B): flow angle and its difference with respect to the “Clean” case. Blade mirrored in frame A to ease the reading compared to flow angle.

Figure 8.
Vorticity contours at plane T2 for the cases “Clean”, “LE 10 Hz” and “SS 10 Hz”. Vectors represent the velocity magnitudes projected on a plane perpendicular to the stator geometrical discharge direction.
Figure 8.
Vorticity contours at plane T2 for the cases “Clean”, “LE 10 Hz” and “SS 10 Hz”. Vectors represent the velocity magnitudes projected on a plane perpendicular to the stator geometrical discharge direction.

Figure 9.
Vortical structures stator downstream.

Figure 10.
Peak-to-trough temperature contours at different injection positions at plane T2. The black line contour is the total pressure (barA).
Figure 10.
Peak-to-trough temperature contours at different injection positions at plane T2. The black line contour is the total pressure (barA).


Table 1.
Turbine geometry and operating conditions.
| Operating Condition | β | n (rpm) | (kg/s) | |
|---|---|---|---|---|
| 3.78 | 313 | |||
| Geometry | h (mm) | tc/h | Dm (mm) | Gap/Cx,v |
| 50 | 0.02 | 350 | 1.00 | |
| Blade rows | σ | AR | Δθ | |
| Vane | 22 | 1.20 | 0.83 | 75.2 |
| Rotor | 25 | 1.25 | 0.91 | 115.3 |
Table 2.
EWG injection parameters.
| Frequency (Hz) | 10 Hz | 110 Hz |
|---|---|---|
| Duty cycle | 40–60 | 35–65 |
| Feeding pressure (barG) | 1.2 | 0.7 |
| Heater power (W) | 600 | 600 |
Table 3.
Mass average total pressure loss coefficients.
| Position | 10 Hz | 110 Hz | EWG off | Clean |
|---|---|---|---|---|
| MP | 6.0 | 5.7 | 5.6 | 4.5 |
| LE | 5.0 | 5.7 | 4.7 | |
| PS | 6.1 | 6.3 | 5.4 | |
| SS | 5.6 | 5.7 | 4.7 |
Publisher’s Note: MDPI stays neutral with regard to jurisdictional claims in published maps and institutional affiliations. |
© 2021 by the authors. Licensee MDPI, Basel, Switzerland. This article is an open access article distributed under the terms and conditions of the Creative Commons Attribution (CC BY-NC-ND) license (https://creativecommons.org/licenses/by-nc-nd/4.0/).
Share and Cite
MDPI and ACS Style
Notaristefano, A.; Gaetani, P. Transport of Swirling Entropy Waves through an Axial Turbine Stator. Int. J. Turbomach. Propuls. Power 2021, 6, 45. https://0-doi-org.brum.beds.ac.uk/10.3390/ijtpp6040045
AMA Style
Notaristefano A, Gaetani P. Transport of Swirling Entropy Waves through an Axial Turbine Stator. International Journal of Turbomachinery, Propulsion and Power. 2021; 6(4):45. https://0-doi-org.brum.beds.ac.uk/10.3390/ijtpp6040045
Chicago/Turabian StyleNotaristefano, Andrea, and Paolo Gaetani. 2021. "Transport of Swirling Entropy Waves through an Axial Turbine Stator" International Journal of Turbomachinery, Propulsion and Power 6, no. 4: 45. https://0-doi-org.brum.beds.ac.uk/10.3390/ijtpp6040045