Article

Fate of Nitrogen from Artichoke (Cynara cardunculus L. var. scolymus (L.)) Crop Residues: A Review and Lysimeter Study

by
Nouraya Akkal-Corfini
1,*,
Paul Robin
1,
Safya Menasseri-Aubry
1,
Michael S. Corson
1,
Jean Paul Sévère
2,
Jean Michel Collet
3 and
Thierry Morvan
1
1
SAS, INRAE, Agrocampus Ouest, F-35000 Rennes, France
2
Comité d’Action Technique et Économique, Station Expérimentale Légumière et Horticole de Vézendoquet, F-29250 Saint-Pol-de-Léon, France
3
Ctifl-Caté, Station Expérimentale Légumière et Horticole de Vézendoquet, F-29250 Saint-Pol-de-Léon, France
*
Author to whom correspondence should be addressed.
Submission received: 2 December 2020 / Revised: 8 January 2021 / Accepted: 19 January 2021 / Published: 1 February 2021

Abstract

:
The goal of the European Nitrate Directive 91/676/CEE is to mitigate or prevent water pollution associated with the nitrogen (N) cascade. Vegetable crops have a high risk of nitrate leaching during autumn and winter. Information about the fate of N from artichoke (Cynara cardunculus L. var. scolymus (L.)) residues is reviewed and then supplemented with a three-year study with 15N-labelled residues in an artichoke-cauliflower (Brassica oleracea L. cv. botrytis) rotation in six lysimeters. After three years, 6% of N in artichoke residues was leached, 8% was exported by crops, while 86% remained in the lysimeter. Summed over the rotation, 16% of artichoke-residue N was absorbed by artichoke and 14% by cauliflower. Total aboveground N uptake by all crops during the entire rotation ranged from 370 to 534 kg N ha−1, of which 207–311 kg N ha−1 returned to the soil as residues. Increasing N-recycling efficiency and reducing the risk of N leaching while conserving crop productivity requires capturing N mineralized from soil organic N. Cauliflower performs this capture effectively during the drainage period. A break crop should be introduced after the first and second harvests of artichoke to further synchronize N mineralization and uptake and reduce leaching risk during the rotation.

1. Introduction

Nitrogen (N) fertilizers have increased the yield and quality of vegetable crops and thereby stimulated their genetic progress. In many agricultural areas of the world, however, increased nitrate loading of surface waters and groundwater has contaminated drinking water resources and caused eutrophication of freshwaters and coastal marine ecosystems [1,2]. Northern coasts of Brittany, France, regularly experience green algae blooms due to high nitrate concentrations in soil and groundwater that make their way to the ocean in surface water. High soil nitrate concentrations come from high fertilization or mineralization of soil organic matter (SOM), which releases N that at times is out of sync with crop needs. Vegetable production areas in this region traditionally practice intensive rotations that include artichokes, cauliflower, cabbage, potatoes, onions and shallots. Vegetable cropping systems have short-term production cycles and long-term rotations. Vegetable crops require (1) high N availability to achieve the product quality required by market demand and (2) frequent tillage, which increases SOM mineralization, leading to a high risk of N leaching during rainy periods.
Increasing N-use efficiency in vegetable cropping systems is crucial to maintain farm productivity and revenue, keep food production close to populations and decrease environmental impacts. The target of such improvement is better synchronization between soil mineralization and vegetable N uptake [3,4]. One mechanism for action is complementarity between crops. Choosing which break crop to grow during drainage periods requires crop-specific knowledge about dynamics of N availability from crop residues and soils as a function of time and climate.
Nearly 85% of the world’s globe artichokes (Cynara cardunculus L. var. scolymus (L.)) are produced in Europe [5,6,7]. They are cultivated on more than 9500 ha [8], which is approximately 75% of the total world area [9]. France ranks fourth in European production, producing 42,465 t of artichokes on 7721 ha in 2013 [10]; 90% of the French artichoke area is located in Brittany. The part of the plant marketed is the immature composite inflorescence (head or capitulum), with edible fleshy leaves (bracts) and receptacle [5,11]. Artichoke heads are harvested along with the floral stem and include 2–3 leaves at the marketing stage, regardless of size [12]. Most of the plant returns to the soil as chopped residues.
Artichoke is perceived as a healthy, nutritious vegetable [13]. It is rich in inulin, fiber, minerals and, in particular, polyphenols [14]; is a source of biophenols; and its leaf extracts have been widely used in herbal medicine as hepatoprotectors and choleretics since ancient times [11,15]. Artichoke extracts have been shown to produce various pharmacological effects, such as inhibition of cholesterol biosynthesis and low-density lipoprotein oxidation [16].
The artichoke is an herbaceous perennial plant with an annual growth cycle [17,18] and a deep root system. In Brittany, artichokes are produced for only 3–4 years in a row because production decreases significantly after three years. The artichoke crop is often rotated with cauliflower (Brassica oleracea L. cv. botrytis), which has residues particularly high in N [4].
The artichoke cycle lasts seven months during the first year and 11–12 months during the second and third years. Artichoke develops during winter and spring and is ready for harvest in summer, when it is still growing rapidly [11,19,20]. During autumn and winter, the plant remains in the vegetative growth stage (i.e., a rosette without a head). Therefore, increasing N-use efficiency requires specific knowledge to analyze separately the fate of N from residues of each successive artichoke crop. Artichokes can achieve high annual yields [11,21] and take up large amounts of N (e.g., 400 kg N ha−1) [22]. The artichoke’s deep and efficient root system takes advantage of soil N at depth, decreasing N leaching and soil and groundwater pollution [23]. After each artichoke harvest, farmers cut aboveground biomass because of its sensitivity to frost and to allow new stems to grow in spring. They leave the soil with only stumps during autumn and part of the winter. Therefore, most artichoke biomass and N absorbed by plants return to the soil as residues. Total N in artichoke residues ranges from 1.43 to 3.07 g kg−1, depending on the amount of N fertilizer applied [24]. Excessive N fertilization leads to N accumulation in plants [25], which increases biomass without increasing the yield [26]. It also increases mineralization of organic N and carbon (C) [26]. Through mineralization, vegetable residues can release 20–80% of the N a few weeks after their incorporation into the soil [27,28]. In crop rotations, this represents a potential source of available N for the following crop [4,29] but also a potential risk of nitrate leaching, especially when residue incorporation is followed by bare soil during a drainage period [30,31]. This practice is unlike that for the cultivation of Madeira cardoon (Cynara cardunculus var. ferocissima) for bioenergy, which keeps the soil covered throughout most of the year, minimizing the risk of soil erosion [32] and leaching during the drainage period (autumn and winter). To reduce residue N leaching into groundwater, it is important to consider this mineralized N when applying fertilizers. In agricultural systems, past applications of mineral fertilizers and N from crop residues, as well as the N-retention capacity of the soil, must be considered to reduce emissions of nitrate from agriculture to aquatic systems [2,33].
N from crop residues that becomes available to a subsequent crop has been estimated by labeling plants with 15N [34,35,36,37]. Monitoring 15N over several years in multiple soil and plant pools helps quantify N availability, recycling and losses in response to application of fresh plant material [38]. Several studies have been performed to trace N dynamics in natural ecosystems and agricultural systems [39,40], but few of them occurred in vegetable-cropping systems. Information on recovery of 15N in residues by crops beyond the first year of application remains scarce, since most studies measure only recovery of residue N by the first crop following application [33]. Few studies have investigated the turnover and availability of N applied as plant residues using l5N at the rotation scale [4,41].
The aim of this study was to review the fate of N from artichoke residues and to supplement existing knowledge by monitoring the fate of incorporated 15N-labeled artichoke residues in a lysimeter experiment in an artichoke–cauliflower crop rotation. Since the production cycle of artichoke has three successive annual harvests, the protocol was adapted to separate the fate of N from each harvest’s residues.

2. Materials and Methods

2.1. Lysimeter Site History and Experimental Conditions

The experiment was conducted from 1998 to 2004 at the Committee of Technical and Economic Action experimental station (48.65° N, 3.98° W) in Brittany, France, in six lysimeters (2.5 m in diameter at a depth of 2 m). Lysimeter soil was derived from an aeolien loam (Epianthric Luvisol) [42] with 15% clay, 60% silt and 25% sand; a mean pH of 6.87 (range 6.79–7.01); a mean organic matter content of 2.66% (range 2.55–2.71%) and a mean organic N content of 0.14% (range 0.13–0.15% corresponding to 5300–6200 kg N ha−1). The lysimeters were cultivated with cauliflower/artichoke rotations for 6 years (1992–1998) prior to the experiment. The variety of artichoke used was “Camus de Bretagne, clone no. 46”, which represents 80% of artichoke production in France. For cauliflower, the “Jaouen hybride F1” was used, which is representative of January and February production.

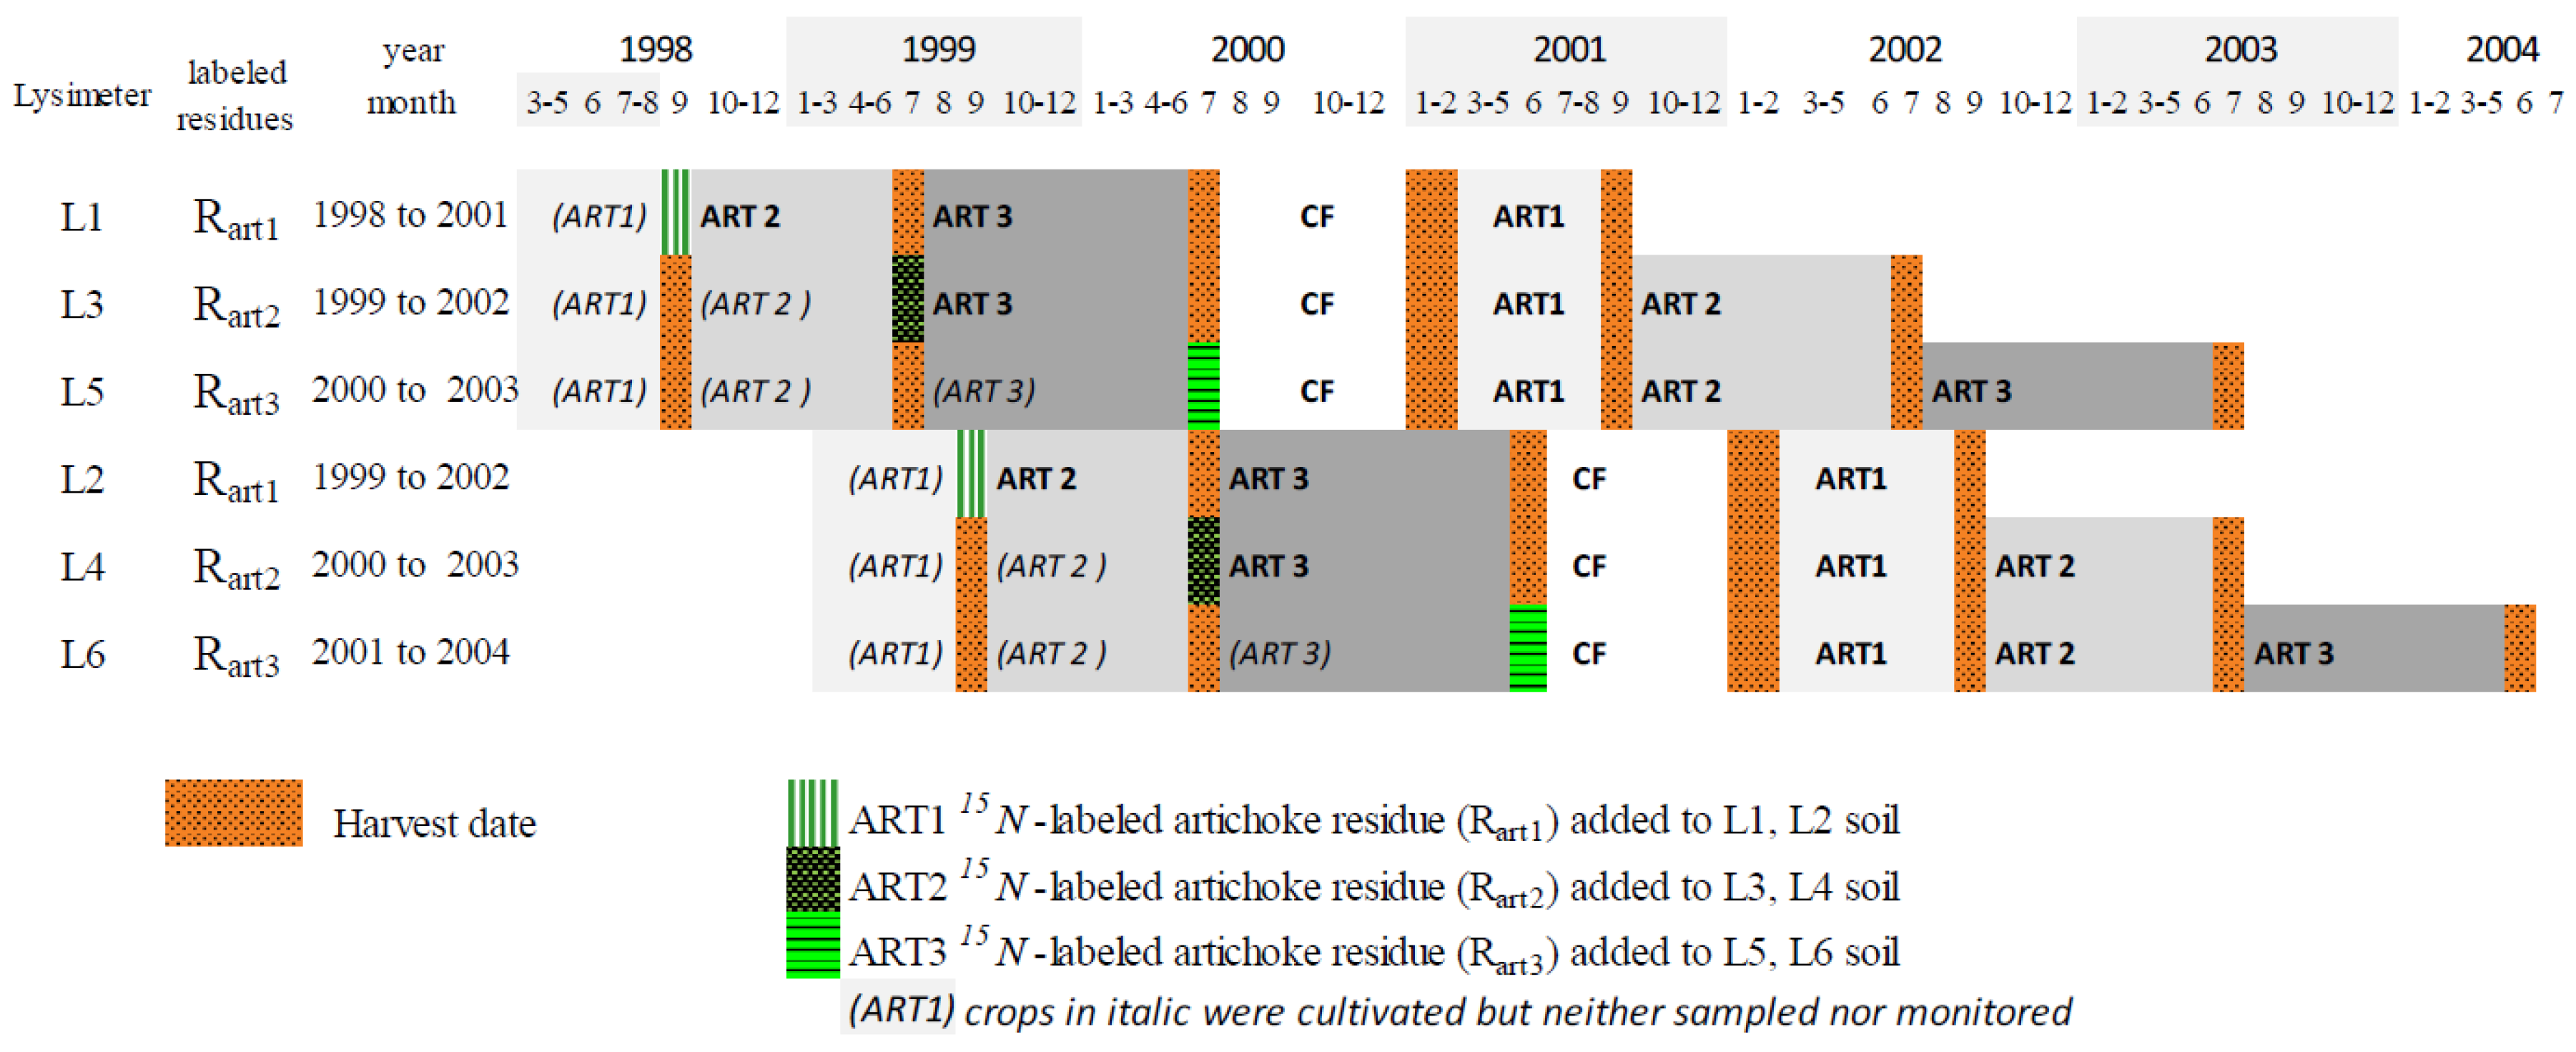
2.2. Experimental Design

We followed three artichoke cycles (ART1, ART2 and ART3) and mineralization of their 15N-labeled residues (RART1, RART2 and RART3, respectively) (Figure 1). The N contribution of residues of each artichoke cycle was estimated for the artichoke–cauliflower rotation (ART1-ART2-ART3-cauliflower) for each residue (i.e., RART1, RART2 and RART3) and then summed to estimate total artichoke contribution to the rotation.
Lysimeters receiving the same artichoke residues (L1-L2 for RART1, L3-L4 for RART2 and L5-L6 for RART3) were established with a one-year time lag. This approach aimed to minimize weather risks and to avoid losing an artichoke cycle in the artichoke–cauliflower rotation. This allowed us to follow at least one of the two lysimeters each year, in case one of them had a problem. The experimental design did not include replicates of each treatment because only six lysimeters were available, but it was repeated in time, with the one-year time lag between treatments, for a total of six years. Consequently, differences in annual weather were part of the variability in results. Differences observed between artichoke cycles or between artichoke and cauliflower due to differences in the weather, as well as average results based on the six lysimeters observed during the six years, can be considered representative of current practices in the region.

2.3. Production, Analysis and Incorporation of 15N-Labeled Artichoke Plants

Artichoke plants labeled with 15N were planted (10,000 plants ha−1) in a field near the lysimeters on 29 April 1998 for lysimeters L1/L3/L5 and on 30 April 1999 for lysimeters L2/L4/L6. Thirteen applications of 15N in a solution of ammonium nitrate enriched with 10 atom% excess were performed over the three years of artichoke cycles. Applications of 15N were followed by soil tillage at a depth of 10 cm to decrease volatilization losses.
Artichoke plants were harvested on different dates (Figure 1), and plant biomass was sampled separately as stems and leaves (Table 1). Plant parts were dried at 60 °C to measure dry matter (DM) content, and a subsample was finely ground for chemical analyses. Total C and N contents and 15N atom% excess were analyzed by total combustion with an elementary analyzer (C. E. 1500 NA, Carlo Erba, Milan, Italy) interfaced with an isotope ratio mass spectrometer (Optima, Micromass, Cheshire, UK).
One day after harvesting 15N-labeled artichoke plants, all aboveground biomass of non-labeled artichoke plants grown on the lysimeters was removed and replaced by the same amount of mixed stems and leaves of the 15N-labeled artichoke residues, which then was incorporated into the upper 10 cm of the soil in each lysimeter (Table 1) according to current farm practices.

2.4. Crop Rotations and Practices on Lysimeters

Artichoke–cauliflower crop rotations continued on the lysimeters over the next three years (Figure 1). To ensure representative yields and biomass production and to improve estimates of N bioavailability in artichoke residues and leaching losses during the experiment, moderate fertilization was applied: ART1, ART2, and ART3 were fertilized with ammonium nitrate (105 kg N ha−1) on two dates in November (30 kg N ha−1) and March (75 kg N ha−1). No N fertilizer was applied to the cauliflower crop, except on lysimeters L5 and L6 (90 kg N ha−1) to ensure sufficient N availability, because all ART3 residues (aboveground and stump) were exported. No phosphorus fertilization was required due to its already high concentration in the soil. At each crop harvest, all aboveground plant parts were removed and separated into leaf, stem and head portions. For ART3 (and ART1 or ART2 at the end of the experiment), stumps were also removed. “Crop residues” correspond only to “aboveground residues” after the first and second cycles. After the third cycle, the stump is removed and then considered part of “crop residues” as well. Biomass was then subsampled for DM and chemical analyses, as described above. Once subsampled, crop residues were immediately returned to the lysimeters and incorporated into the soil.

2.5. Weather

Meteorological data were obtained at the experimental station. The study site has a temperate humid oceanic climate. During the 1998–2004 study period, mean monthly air temperature ranged from 6.2 to 18 °C, and mean monthly precipitation ranged from 10.4 to 220.8 mm. Mean annual air temperature during this period was 11.7 °C. Cumulative autumn and winter precipitation varied from 693 to 1088 mm. During the study period, cumulative precipitation for cauliflower on lysimeters L2/L4/L6 (July 2001–February 2002) was 414 mm less than that on lysimeters L1/L3/L5 (July 2000–February 2001). Precipitation differences were also observed for ART2 and ART3 (July 1999–June 2000). They were less than 130 mm between L1 and L2 (ART2) but ranged from 252 to 444 mm when L1 or L2 were compared to L5 or L6 for ART3. Drainage water collected from the lysimeters for each crop during the experiment varied from 78 to 801 mm. A portion of cropping cycles for ART2, ART3 and cauliflower had a common drainage period (October to March-April). ART1 growth occurred entirely outside of this period. From 1998 to 2004, mean soil temperature at a depth of 10 cm was 13 °C, which was similar to the mean air temperature (12 °C).

2.6. Water Sampling and Analytical Procedures

Drainage water was collected in tanks, sampled twice per month and stored at 4 °C. Ammonium and nitrate contents were analyzed by continuous flow colorimetry (Technicon Auto-Analyser II, Seal Analytical, Mequon, WI, USA). Since ammonium concentration in the water was low, the isotopic composition of the ammonium pool was not determined. Isotopic composition of nitrate N was measured after concentration by evaporation and the reduction of nitrate to ammonium with the reducing Devarda’s alloy in an alkaline medium. The 15N enrichment of nitrate was determined after diffusion [43], as modified by [44], and subsequent analysis was performed with an elementary analyzer (C. E. 1500 NA, Carlo Erba, Milan, Italy) interfaced with an isotope ratio mass spectrometer (Optima, Micromass, Cheshire, UK).

2.7. Calculations of 15N Recovery and Leaching in Plants and Water

The fate of 15N-labeled cauliflower residues was calculated from the amount of 15N recovered in aboveground plant biomass, the topsoil layer and drainage water. A correction factor of 0.0025 atom% was applied to the values of atom% excess of all samples to account for the natural abundance of 15N in soils, which is slightly higher than that of the air [4,45,46]. The percentage of N from the 15N-labeled artichoke residues recovered in each compartment (i.e., aboveground plant biomass, topsoil layer, drainage water) was calculated as
( N r e c o v e r y % ) c o m p a r t m e n t = N c o m p a r t m e n t   × [ ( a t o m %   e x c e s s ) c o m p a r t m e n t 0.0025 ] N a r t . r e s i d u e   × [ ( a t o m %   e x c e s s ) a r t . r e s i d u e 0.0025 ] × 100
where
  • NX is the amount of N measured in compartment X (kg N ha−1 for a given period; e.g., harvest, water drainage);
  • (atom% excess)X is the percentage of 15N in compartment X above the natural abundance in the atmosphere (reference material considered to have 0.3663 atom% of 15N atoms out of the total number of N atoms in the sample).
Residual 15N in the soil was calculated as the 15N applied in artichoke residues minus that lost through plant exportation and leaching, assuming that gaseous losses of 15N (e.g., denitrification of artichoke-residue N) were negligible:
( N r e c o v e r y % ) s o i l =   100 ( N r e c o v e r y % ) p l a n t ( N r e c o v e r y % ) l e a c h i n g ( N 15 a r t . r e s i d u e % ) g a s e o u s   l o s s e s
We assumed that denitrification of artichoke-residue N was negligible based on results of a similar 15N experiment [4]. The protocol of the current experiment was designed to minimize denitrification losses. A well-aerated soil that minimized anaerobic conditions was used, as usually practiced in such vegetable cropping systems. The artichoke residues were finely chopped and mixed with the 10 cm of topsoil to enhance nitrogen absorption by soil organisms. The limited and fractionated mineral fertilization was expected to minimize periods of excess soil nitrogen.
Residual 15N in the soil was initially deduced from soil samples, nitrogen content and 15N analysis. The measurements of total nitrogen content in the soil were considered insufficiently reliable to close the nitrogen balance of the lysimeters, perhaps due to excessive soil heterogeneity. Therefore, we chose to deduce soil nitrogen content from plant and water 15N analysis, since we considered that soil 15N deduced from other observations (i.e., plants, water) was more robust than that calculated from soil observations during the experiment.
Exhaustive information from the experiment (i.e., raw data and calculation procedures) is openly available (see below, “Data Availability Statement”).

3. Results

3.1. Crop Production and Biomass

Due to the experimental design, the main features of crop production were observed on each lysimeter but not during the same year or with the same amount of artichoke residues. The lack of replicates prevented analysis of differences in these features. Large standard deviations (SD) in the results illustrated the high variability possible in commercial artichoke production due to interactions among agricultural practices (e.g., dates of planting, fertilization, treatments), climate and cropping conditions. Thus, we used mean values to analyze the fate of nitrogen from artichoke residues and values from individual lysimeters (Table 2) to assess ranges of values.
ART1 fresh matter (FM) yield (mean ± 1 SD = 12.3 ± 1.5 t ha−1) (Table 2) and mean aboveground total DM (8.6 ± 1.5 t ha−1) were influenced slightly by year. More than 70% of aboveground DM (6.3 ± 1.1 t ha−1) was returned to the soil. ART2 mean FM yield on lysimeters L2/L4/L6 was 2.5 t ha−1 less than that on L1/L3/L5, which had a mean FM yield of 10.8 ± 2.3 t ha−1. ART2 total aboveground DM was 7.2 ± 2.6 t ha−1, and 70% of it was returned to the soil as residues. ART3 FM yield was 8.6 ± 3.8 t ha−1, and the mean difference between yields on lysimeters L2/L4/L6 and L1/L3/L5 was 1.6 t ha−1. Total aboveground DM for ART3 was 4.5 ± 2.3 t ha−1. It was higher on lysimeters L2/L4/L6 than on L1/L3/L5. No difference was observed in total stump DM produced on lysimeters L2/L4/L6 vs. L1/L3/L5. ART3 total DM of stumps was 5.6 ± 1.4 t ha−1 and represented 57% of total DM (stump and aboveground). All ART3 stump biomass was chopped and returned to the soil. Total DM returned to the soil as residues from ART3 was 8.0 ± 2.4 t ha−1 (2.4 t ha−1 from aboveground and 5.6 t ha−1 from stumps).
Cauliflower FM yield was 24.8 ± 2.1 t ha−1. Despite a one-year shift between lysimeters L1/L3/L5 (2000–2001) and L2/L4/L6 (2001–2002) (Table 2), only small differences in cauliflower FM yield were observed between them. Cauliflower FM yield was influenced little by year, even during the low-precipitation season of July 2001 to February 2002, except for L4 (21.0 t ha−1, compared to the other lysimeters’ range of 24.4–26.7 t ha−1). Total DM of cauliflower was 6.5 ± 0.8 t ha−1 and was not influenced by year, even on L4. Cauliflower residues returned to the soil (4.1 ± 0.6 t ha−1) were similar among years and represented a mean of 64% of total aboveground DM.

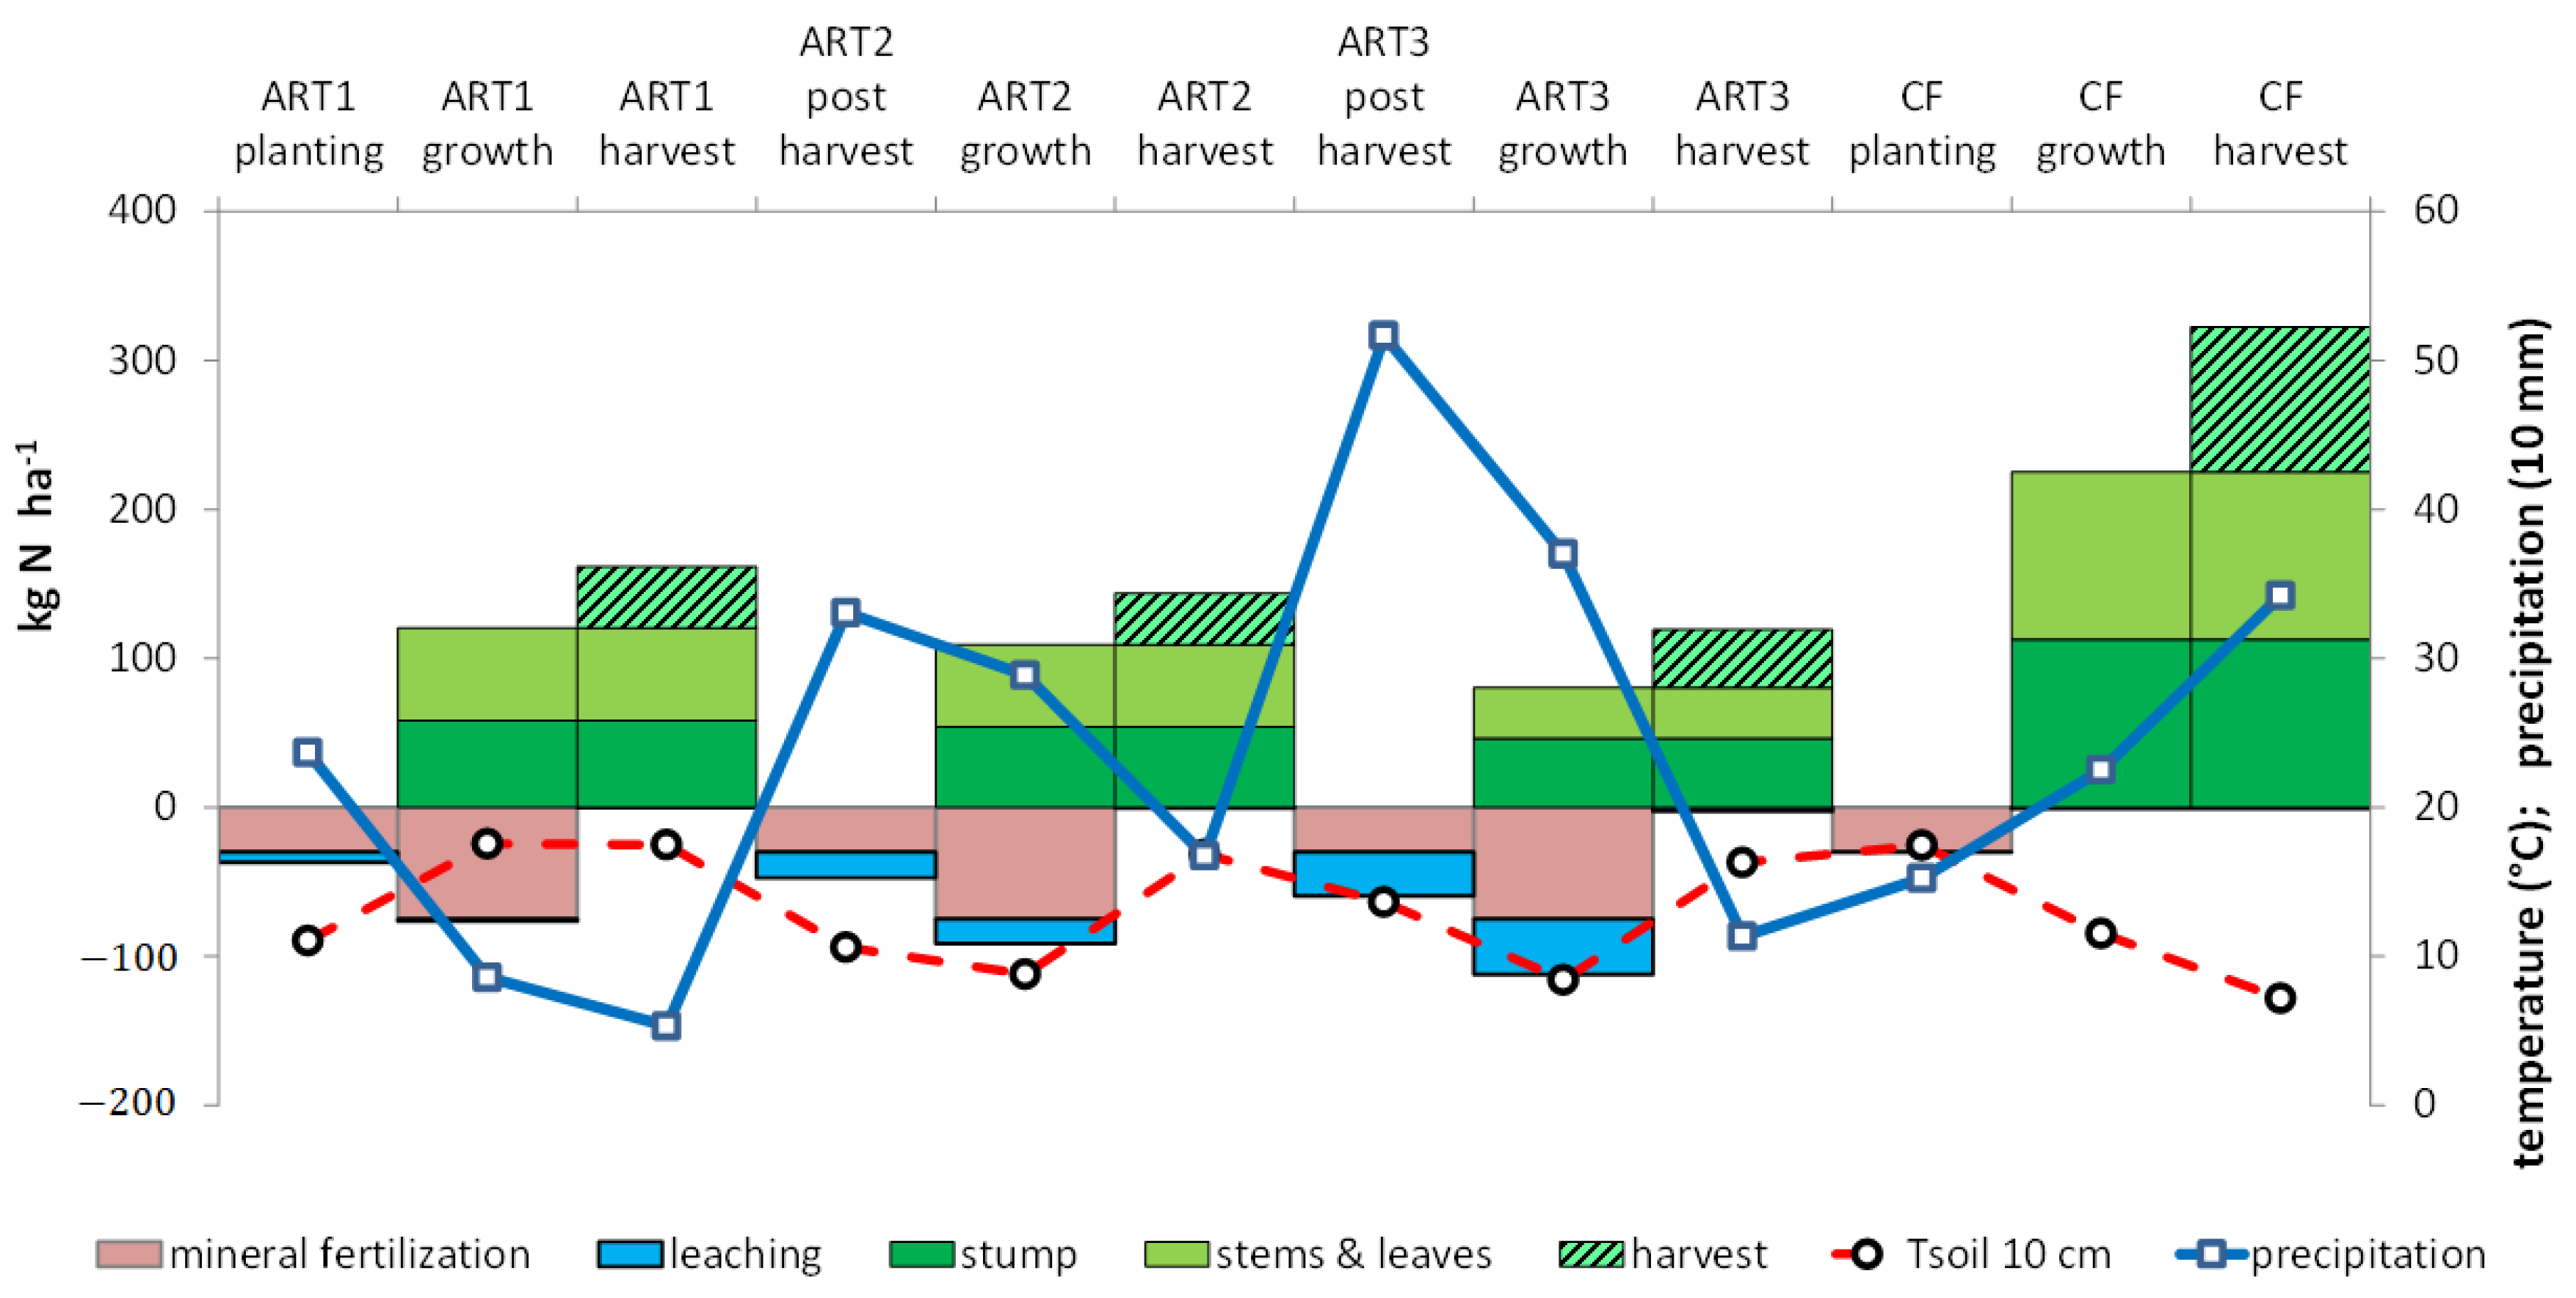
3.2. Nitrogen Uptake
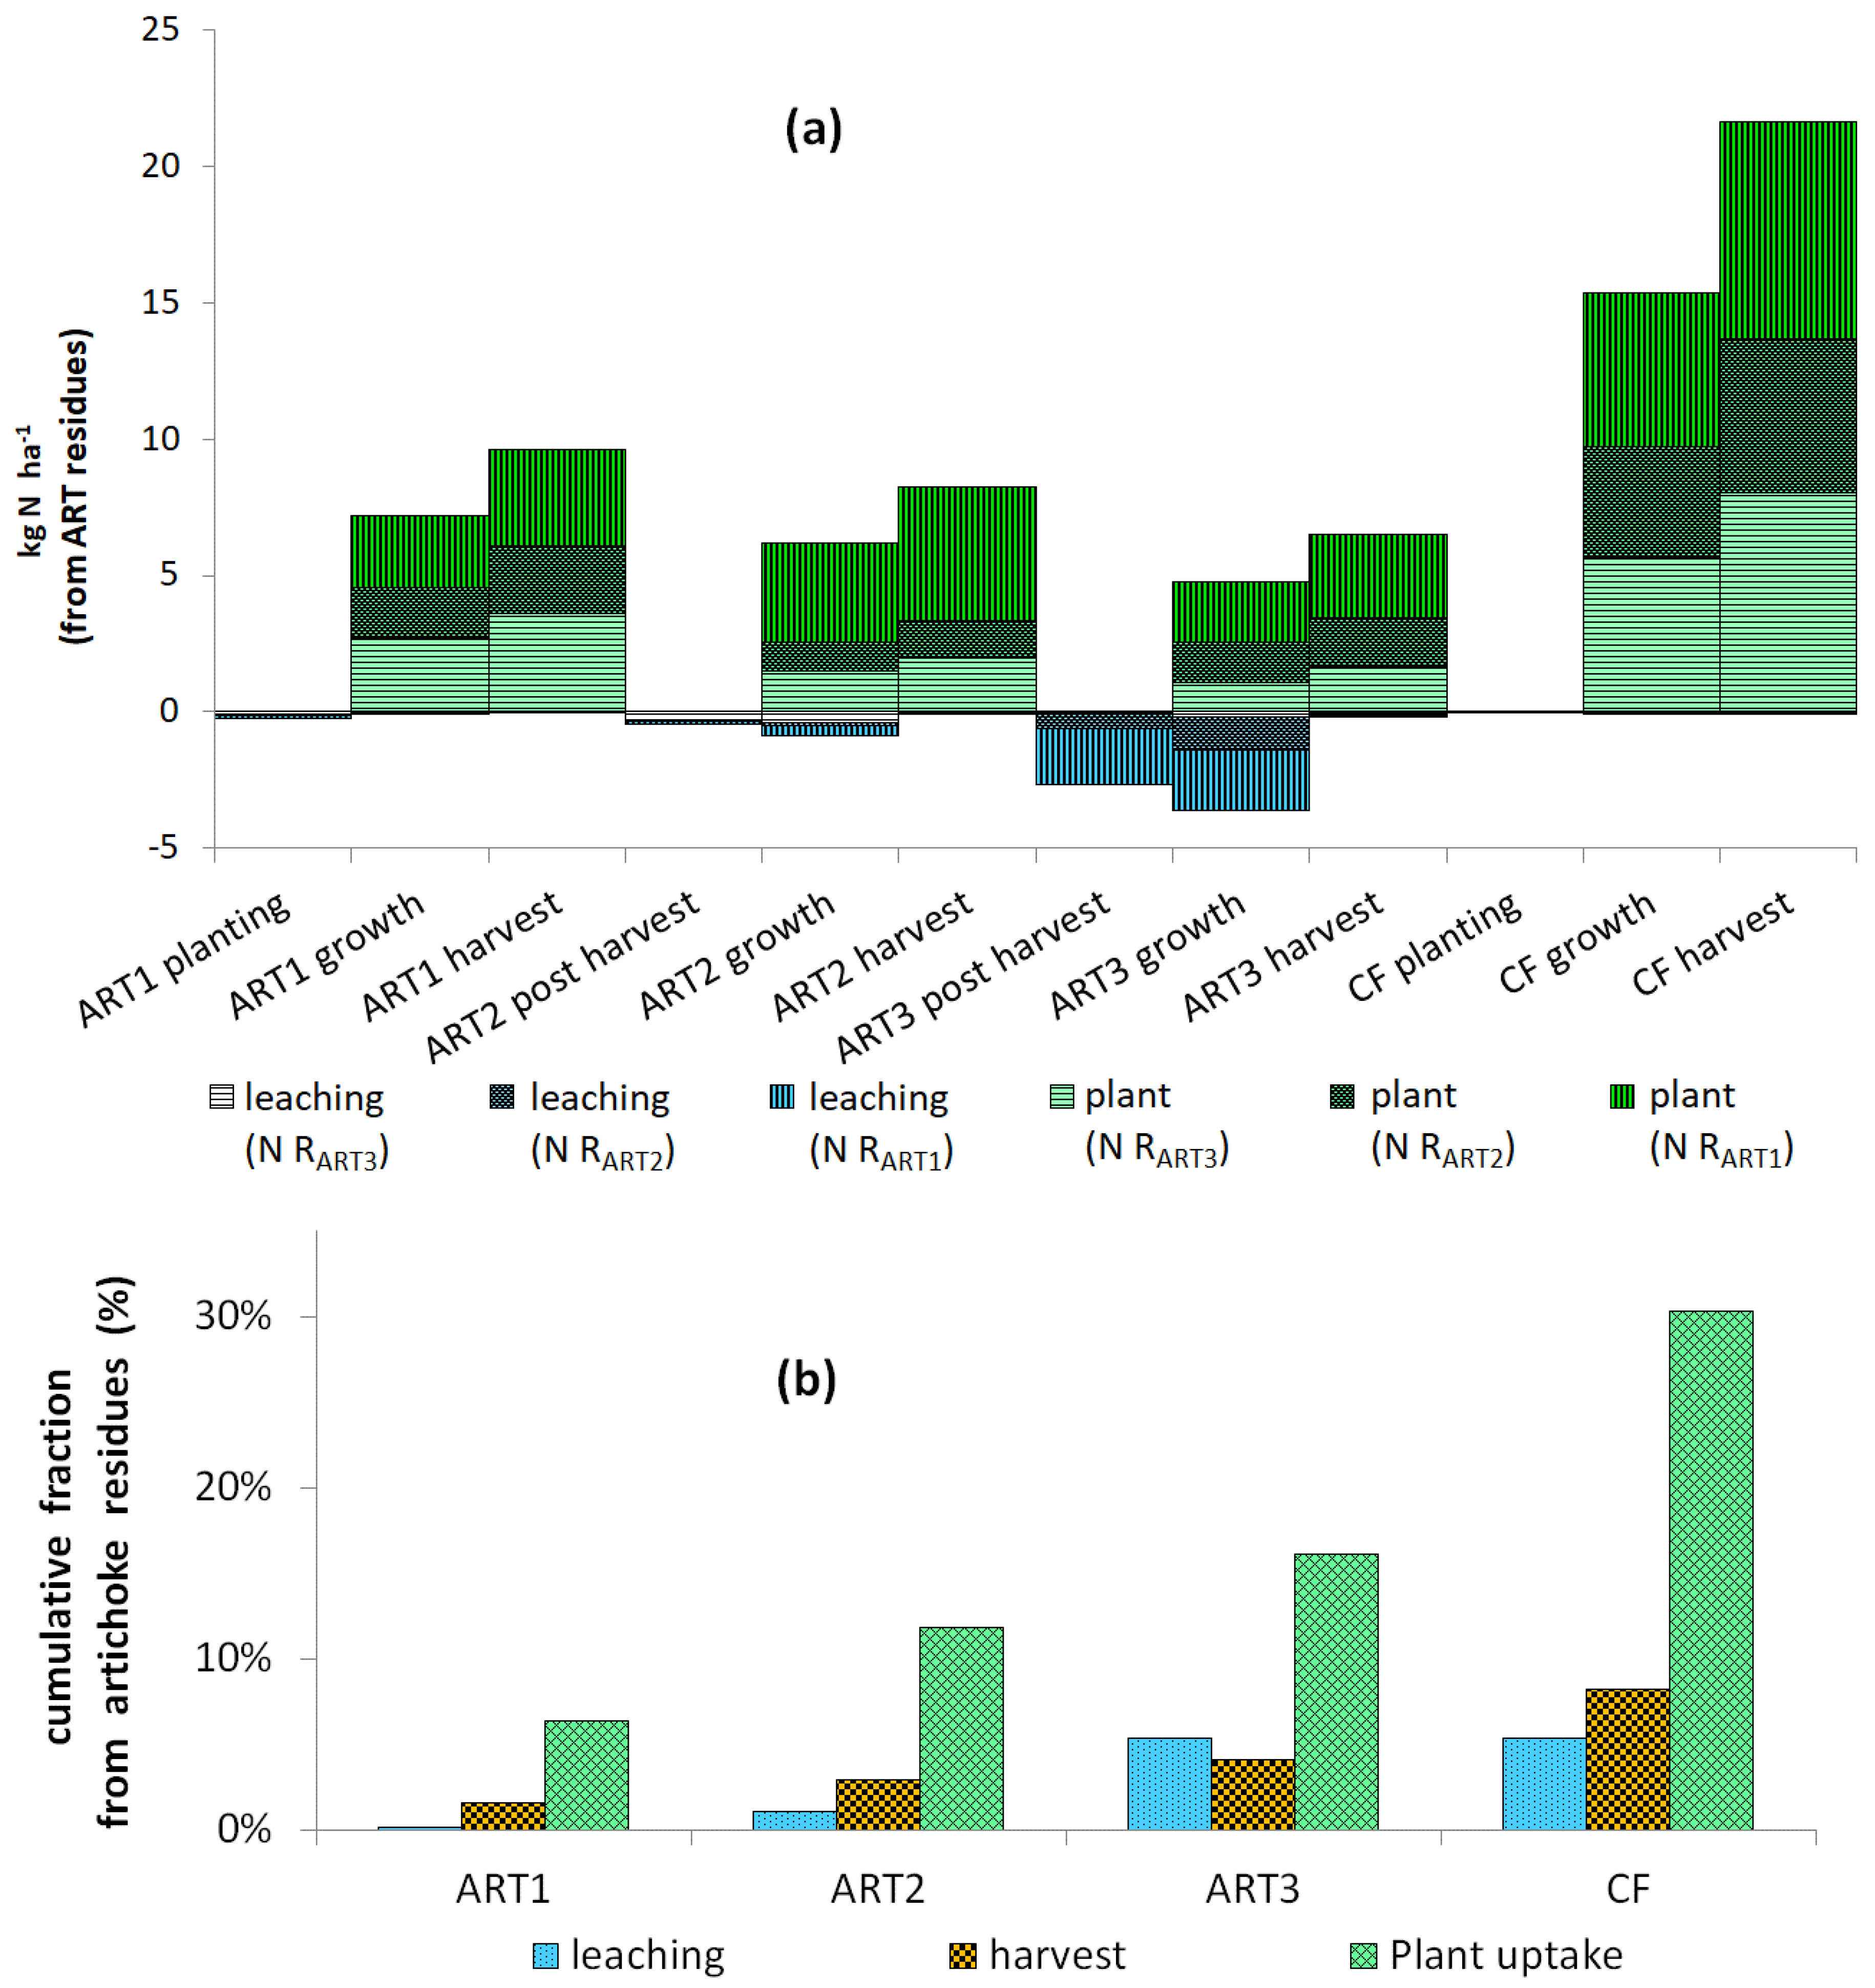
Annual N uptake by artichoke total aboveground biomass was less than that by cauliflower; it decreased from 103 ± 9 to 73 ± 30 kg N ha−1 from ART1 to ART3, respectively (Table 3). ART3 stump uptake was 46 ± 12 kg N ha−1. N returned to the soil by aboveground residues also decreased: 62 ± 8 to 34 ± 9 kg N ha−1 from ART1 to ART3, respectively. The percentage of N in residues also decreased from 60% to 50% of total N uptake by aboveground biomass from ART1 to ART3. The amount of N returned to the soil during ART3 (aboveground and stump) was 80 ± 21 kg N ha−1.
N uptake by cauliflower was 237 ± 41 kg N ha−1 on lysimeters L1/L3/L5 and 183 ± 41 kg N ha−1 on L2/L4/L6 (Table 3). The greatest difference in N uptake (122 kg N ha−1) was observed between L3 and L4, which also had the highest and lowest FM production, respectively. Cauliflower residues contained 113 ± 31 kg N ha−1, representing 53% of N uptake (Table 3). Cauliflower N uptake was influenced by growing conditions, but not the N contained in its residues.

3.3. Uptake of 15N

The repeatability of 15N recovery in plant parts or leaching was considered acceptable despite differences in weather between the two replicates (Table 4 and Table 5). The percentage of 15N labeled recovered aboveground (Table 4) decreased from ART1 to ART3 (3.04 ± 0.92% to 1.87 ± 0.45% of 15N from one harvest’s residue). 15N uptake by aboveground biomass was the highest from the residues most recently applied (RART1: 3.4 ± 0.2% in ART2; RART2: 2.2 ± 0.2% in ART3). ART1 15N uptake by aboveground biomass was the highest from RART3 residues (3.9 ± 1.0%). It probably benefited from RART3 15N that had been returned via cauliflower residues (Table 3). The 15N uptake by artichoke stumps was considerable, representing a mean of 34–44% of all artichoke 15N uptake. Stump uptake in ART3 slightly decreased from RART1 to RART3 (from 1.4 ± 0.7% to 1.1 ± 0.4% for RART1 in ART3 to RART3 in ART3, respectively), but it remained approximately 1% regardless of the residue and the cycle (Table 4). The 15N of one harvest’s residues recovered by ART3 (aboveground and stump) remained lower (2.1–4.4%) than that recovered by cauliflower aboveground biomass (3.9–9.6%).
More than 36–74% of 15N recovered by artichoke aboveground biomass returned to the soil in the residues. A small percentage of 15N was exported by commercial parts: a mean of 3.0% in cauliflower heads and similar percentages in artichoke heads (1.2 ± 0.3% to 0.8 ± 0.4% from ART1 to ART3, respectively).
In all lysimeters, regardless of the position of cauliflower in the rotation and the nature of residues applied (RART1, RART2 and RART3), recovered 15N in cauliflower was more than double that in the artichoke crops. 15N recovered by cauliflower was 6.8 ± 2.3% of 15N artichoke residues applied to the soil (Table 4). L4 had the lowest N and 15N uptake. Approximately half of the 15N-labeled residues taken up by cauliflower or artichoke returned to the soil as residues.

3.4. Water Drainage and Nitrate Leaching

Water drainage differed among lysimeters during the rotation and for a given crop. Water drainage ranged from 78 to 551 mm for the cauliflower cycle (August–February). Mean drainage was six times as high on lysimeters L1/L3/L5 (532 mm in 2000–2001) than on L2/L4/L6 (81 mm in 2001–2002). Precipitation in 2001–2002 was half of that in 2000–2001.
Water drainage differed among artichoke cycles, since ART1 occurred in spring, and 5 months of the cycles of ART2 and ART3 occurred during the drainage period (Table 3). Drainage was lower in ART1 (146–226 mm) than ART2 (80–469 mm) or ART3 (260–801 mm). Weather differences among lysimeters clearly influenced nitrate leaching (Table 3). However, mean values showed that nitrate leaching was negligible with cauliflower and that the risk was highest after ART2 harvest (Figure 2).
Mean 15N from labeled artichoke residues leached in drained water was low for cauliflower, ranging from 0.00 to 0.14%, and it reached 6.2% after the ART2 harvest (Table 4 and Table 5). The 15N in leached water was influenced by crop cycle and year. It increased over the artichoke cycle from 0.1% to 3.0%. Mean 15N leaching from one artichoke harvest’s residues was less than 0.1% in five cauliflower crop lysimeters regardless of the position of cauliflower in the rotation, the weather and the nature of residues RART1, RART2 and RART3 (Table 4).

3.5. Recovery of N at the Rotation Scale

At the artichoke–cauliflower rotation scale (three years), mean total aboveground DM was similar among lysimeters receiving the same artichoke residues. Cumulative total DM (aboveground and ART3 stumps) of residues returned to the soil by both crops of the rotation ranged from 19.6 to 29.3 t ha−1 (Table 2). Mean N uptake by the entire artichoke–cauliflower rotation on a given lysimeter ranged from 414 to 602 kg N ha−1. Additionally, 47–80% of annual N uptake returned to the soil in residues, which represented a total of 251–355 kg N ha−1. Cumulative N taken up by crops appeared less variable on lysimeters L1/L2 and L5/L6 than on L3 and L4. Nevertheless, a difference of 152 kg N ha−1 was observed between L3 and L4.
During the three-year artichoke–cauliflower rotation, total uptake of 15N artichoke residues (from RART1, RART2, or RART3) in artichoke and cauliflower biomass was 18 ± 5% (Table 5). When converted into kg N ha−1 and averaged over all lysimeters, total uptake reached 30% of N from residues (Figure 3). Total N supplied by each harvest’s residues after three years was 20, 11 and 15 kg N ha−1 for RART1, RART2 and RART3, respectively. Total N supplied by all residues (46 kg N ha−1) represented 6% of total N taken up by crops (747 kg N ha−1 during the rotation) and 9% of total N returned in residues. Cumulative 15N leaching losses represented 5.7%, 4.0% and 1.3% of the 15N applied as 15N residues from RART1, RART2 and RART3, respectively (Table 4). Relatively little 15N in residues was lost via leaching, while large amounts of it were conserved in the soil. Total cumulative 15N output through plant exportation was moderate, ranging from 5.4 to 6.9% of the RART1, RART2 and RART3 applied. Residual 15N remaining in the soil during the rotation was more than 85% of the 15N applied.

4. Discussion

4.1. Yields and N Accumulation by Crops

The mean and SD of artichoke biomass among the three cycles, 6.5 ± 0.8 t DM ha−1, were similar to those reported by [11], even though artichokes received less N fertilization (105 kg N ha−1) in the present study. As already shown, N fertilization had no significant effect on artichoke stem biomass [24,47,48]. Therefore, we assume that 15N results were representative of the commercial conditions of artichoke production. ART1 had a shorter cycle (March–September) than ART2 and ART3, but its aboveground biomass took up more N than ART2 or ART3 (Table 3). Artichoke aboveground total DM and N uptake decreased over the artichoke cycles, as previously observed by [13,22]. With more than 60% of total aboveground artichoke biomass, leaves contain the highest N concentration [22], and more than 50% of N uptake was returned to the soil as residues. Aboveground-residue N returned to the soil from the three artichoke cycles decreased from ART1 to ART2 to ART3 (62, 55 and 34 kg N ha−1, respectively), a trend observed by [22]. All N contained in stumps in ART3 was returned; thus, ART3 returned more N to the soil (119 kg N ha−1 in aboveground and stump biomass) than ART1 or ART2.
Cauliflower commercial yield exceeded 16 t FM ha−1 (mean French production, [10]) despite variability in weather and lack of mineral fertilization on lysimeters L1-L4. ART1 yield was also similar to the regional mean [10]. Despite the one-year lag time between lysimeters receiving the same artichoke residues, cauliflower FM and total DM yields were not influenced by year, except cauliflower on lysimeter L4: N uptake, FM and DM decreased following less precipitation than that on L3 (Table 2 and Table 3). Cauliflower N in the residues returned to the soil was not influenced by year. Like for most vegetable crops [4], results showed that most N in cauliflower leaves and stems returned to the soil as residues.
At the rotation scale (three years), artichoke and cauliflower residues represented an important source of nutrients: 35–67% of N uptake in aboveground biomass returned to the soil with residues (414–602 kg N ha−1). Chopped residues were returned to the soil at different periods: in March for cauliflower and in October for ART1, ART2 and ART3. We assume that the higher residue-use rate by cauliflower and ART1 (2–10% of residue N, compared to 1–4% by ART2 or ART3) is explained by plant growth (artichoke ART1 at the rosette stage). In ART2 and ART3, the fraction of N mineralized from artichoke residues was more organized in SOM or leached than absorbed by roots because plant growth was stopped after ART1 or ART2 harvest and aboveground biomass cutting.

4.2. Recovery of 15N from Residues by Crops

After three years, the artichoke–cauliflower rotation took up 30% of the N supplied by residues of three artichoke cycles (Figure 3b). At the rotation scale, annual N derived from residues (aboveground and ART3 stumps) RART1, RART2 and RART3 equaled 6–10 kg N ha−1 for artichoke and 22 kg N ha−1 for cauliflower (Figure 2). The corresponding recovery percentages (4–6% and 14%, respectively) were within those of previous studies, showing that crop N recovery from organic inputs, such as plant residues or manures, is often less than 20% [49,50].
The present results confirm that variability in residue N taken up by subsequent crops depends on crop ability to take up N [33,51,52]. N availability depends on factors such as plant species, time after residue input and climate effects that influence both plant absorption and mineralization of organic N from residues [38].
Cauliflower took up significantly more 15N-labeled artichoke residues, and in less time (7 months), than any of the three artichoke cycles (11–12 months), even 2–3 years after application, especially during the drainage period (Figure 2). As observed by [22], N concentration (and thus N uptake) in each artichoke cycle was highest during vegetative growth and decreased after harvest.
Recovery of 15N in artichoke residues after their application was influenced by the position of a crop in the rotation. Cauliflower and artichoke aboveground 15N uptake was higher for crops grown sooner after the application of labeled residues. The highest cauliflower 15N uptake occurred after RART3 residues, when cauliflower benefited from aboveground residues and 15N of stumps applied to the soil. Similarly, the highest 15N uptake by artichoke occurred immediately after applying 15N-labeled residues: the highest 15N uptake by ART1, ART2 and ART3 occurred from RART3, RART1 and RART2, respectively.
Artichoke residues degrade quickly [24], and N uptake from residues depends on environmental factors such as temperature and soil moisture. At our study site, soil temperatures were relatively warm, with mean temperatures above 7 °C throughout the year (Figure 2), which probably ensured a minimal rate of soil mineralization regardless of season [53]. Soil mineralization is higher during summer (July to mid-October). During this period, ART1 was at mid-vegetative growth and could absorb the soil N, but ART2 and ART3 were at the end of their cycles and could not. This difference explains the loss of N after harvest of ART2 and ART3.

4.3. Residual 15N Remaining in the Lysimeter after Harvest

After the first growing season, a mean of 97% of 15N-labeled residue remained in the lysimeter, and 93% remained after each rotation. Previous studies [33,41,51] reported that 75–89% of N applied as crop-residue 15N remained in the soil. Approximately 40% of residue N was recovered in the soil after five growing seasons in other experiments [33]. The contribution of artichoke residues—2% of residue N supplied to the crop—was low, which was similar to the 1% reported by [33] and has no practical significance when making N fertilizer recommendations. More than 60% of the 15N taken up by artichoke and cauliflower was returned to the soil as residues. After three years, 70% of 15N-labeled residues remained in the lysimeter, and less than 20% of residue N had left the system through harvest and leaching. Similar results have been observed for N in other crop residues [51] and for fertilizer-derived N. Two years after application of labeled N, 60–76% of labeled N remained in the soil [54,55]. Three decades after application, 12–15% of fertilizer-derived N still resided in SOM [2]. Likewise, legume-residue 15N increased soil biomass N by approximately 90% and microbial biomass N derived from crop-residue 15N by approximately 70% [41].
Residues sustain SOM N content better than mineral N does; in a previous study, short-term recovery of residue N (40%) was higher than that of fertilizer N (18%) after five growing seasons [33], and long-term recoveries of 15N-labeled fertilizer or residues in crops and soil were similar. The amount of N from residues remaining in the soil depends on residue characteristics, such as the C/N ratio. Residues with a high C/N ratio have been shown to immobilize soil N [56]. The break-even point between net N mineralization and N immobilization occurs at C/N ratios of 20–40 [57,58,59]. Plant residues with C/N ratios above this range can cause net immobilization of mineral N in the soil [60,61]. In our study, C/N ratios ranged from 20 to 81 (Table 1), which can explain the distribution of 15N among soil, plant uptake and leaching.
Several studies have shown that SOM is the main source of N in crops [33,62,63,64]. Humic compounds may be an important source of N over the long term [41]. A mean of 79% of N in a variety of crops was obtained from soil organic N [33]. In most environments, the quantity of N derived from the soil is often large (100–200 kg N ha−1.year−1), even at sites with low SOM contents [33]. The low annual contribution of residue N supplied to the crop reflects the long-term role of organic inputs in supplying N and maintaining the SOM content [33]. Residue N maintains and increases N reserves in SOM [65]. Most residues undergo biological transformations within the first year following application, with the remaining residues incorporated into the SOM [66]. However, a significant percentage of 15N recently applied to the soil may not be extractable [67]. Therefore, maintaining SOM levels will remain a crucial component of sustainable agricultural practices [68]. Environmental sustainability requires N availability to replace mineral fertilizers while limiting the risk of N leaching.

4.4. Leaching of 15N

The nitrate concentration leached under artichoke was higher than that under cauliflower (Table 3). Similar differences in nitrate leaching under crops have been reported in previous studies [69,70]. For artichoke, nitrate leaching was influenced by both cycle growth (ART1, ART2 and ART3) and year (precipitation and drainage). Mean nitrate concentration in drainage water from artichoke, during the same period as cauliflower, was much higher (0–4, 25–105 and 26–89 mg NO3 L−1 for cauliflower, ART2 and ART3, respectively; Table 3).
Differences in leaching were also related to differences in water drainage. Leaching decreased for the same growth stage because of differences in precipitation: for ART1 between L1-L2 (158 mm); for ART2 between L3-L4 (205 mm), L5-L6 (260 mm) and L1-L2 (269 mm); and for ART3 between L3-L4 (332 mm). These differences were explained by a difference in total precipitation in 2001–2002, which was half that in 2000–2001.
In each year of an artichoke crop, artichokes are in the rosette stage from spring to autumn (March/April to October) and completely cover the soil [19]. The highest N uptake rates, decreasing N leaching from mineralized N, occurred during this period of highest artichoke growth [22]. Therefore, when artichoke is harvested in July (ART2 and ART3), its cycle includes approximately 5 months without high N uptake during the drainage period after harvest (October–February). Following agricultural practices, all aboveground artichoke biomass is cut, chopped and returned to the soil in mid-October. Only the artichoke stump is left on the ground. Therefore, ART2 and ART3 crops partially cover the ground (20–30%). During this period, artichoke does not take up N like the cauliflower does, resulting in N leaching (Table 5; Figure 2). This management practice increases the risk of nitrate leaching below the root zone, as reported for other crops [52]. According to [33], most 15N losses from fertilizers or residues occurred during the year of application. This was not observed in our study, in which the most 15N leached from residues after the ART2 harvest, which was not immediately after application of 15N-labeled residues, and concerned both ART1 and ART2 residues (Figure 3a). Therefore, the highest peak of N leaching depends on precipitation and soil temperature, and plant uptake can decrease leaching provided cover percentage and growth are sufficient. The representativeness of our results for artichoke production elsewhere depends on the local harvest date and precipitation in autumn and winter.
The ability of soil cover to decrease leaching was confirmed by the leaching results for cauliflower (Figure 3a). Regardless of drainage for cauliflower (78–514 mm), concentrations of leached nitrate were low (<5 mg NO3 L−1), which is lower than the threshold in the European Nitrates Directive: 50 mg NO3 L−1. Regardless of cauliflower growing conditions, little 15N was leached during its cycle, as reported by [4]. Therefore, we can conclude that in climates that allow N mineralization and leaching during autumn and winter, and management practices such as introducing break crops (catch crops) can decrease leaching risk of ART2 and ART3. Other practices that improve synchronization between N mineralization and N sinks will also decrease leaching risk.

4.5. Reducing N Leaching by Improving Synchronization between Residue Mineralization and Crop Uptake

Most leaching occurred when plants had low N demand, as previously shown [38]. The lower 15N recovery of artichoke than that of cauliflower can be related to a lack of synchronization between soil mineralization and artichoke requirements. The percentage of available residue N taken up by a crop depends on how well N mineralization of residues is synchronized with the crop’s N demand [71]. However, close synchronization is hard to achieve in many environments [33]. Artichoke and cauliflower 15N recovery was influenced by growth stage, crop management practices, warm weather conditions and nutrient losses through leaching.
ART2 and ART3 had approximately 5–6 months of low demand at a period with high risk of leaching because of higher drainage (October–February). The high nitrate leaching in ART2 and ART3 could be associated with asynchronism between the N released from the soil and residues and the low N demand in the early growth stages that occur after cutting aboveground biomass. Management strategies have been suggested to avoid fallow periods by planting cover crops for the drainage period after artichoke harvest, unlike for cauliflower, which has high N requirements during the drainage period [33]. Appropriate management of cropping systems can minimize nitrate leaching. One plausible solution is cover vegetables that can take up soil N during this period of drainage and low N requirements of ART2 and ART3.
The C/N ratio of residues influences the availability and uptake of N by the first subsequent crop, even if its effect on recovery of 15N by following crops may be limited [33]. Therefore, another option to decrease N leaching is to stimulate N assimilation by soil organisms. This can be done by increasing the C/N ratio of residues by applying compost. However, variability in compost quality and difficulties associated with incorporating compost with crop residues make this solution less reliable than break crops for short-term improvements.

5. Conclusions

Recovery of N derived from artichoke residues was low. Our results, confirmed by a literature review, show that 15N in residues contributed less to crop N requirements but contributed much more to sustaining and augmenting N reserves in SOM. After three growing seasons of an artichoke–cauliflower rotation, more than 86% of artichoke-residue N remained in the soil. Approximately 93% of 15N recently applied to the soil remained there, and soil N remained the primary N source for crops.
Management practices to increase N-use efficiency and reduce N losses remain a challenge. Management practices should be designed to maximize synchronization between the release of N from soil sources and the time of maximum N uptake by crops. Mitigation or restoration measures must consider the delay that results from the legacy of past residue-derived N and applications of mineral fertilizers in agricultural systems. The literature review showed that break crops should be introduced in artichoke–cauliflower rotations to reduce nitrate leaching after the first and second artichoke harvests in regions where autumn and winter precipitation induce a leaching risk. Appropriate management of organic amendments in intensive cropping systems, including crop residues, can play an important role in maximizing production efficiency and minimizing negative environmental impacts. In turn, predictive models should integrate feedbacks between the dynamics of soil temperature, drainage and plant uptake.

Author Contributions

Conceptualization, N.A.-C., P.R. and J.P.S.; methodology, N.A.-C., P.R., J.P.S., J.M.C., T.M. and S.M.-A.; software, N.A.-C., P.R.; validation, T.M., M.S.C. and S.M.-A.; formal analysis, N.A.-C., P.R., J.P.S.; investigation, N.A.-C., J.P.S.; resources, N.A.-C., J.P.S.; data curation, N.A.-C., P.R.; writing—original draft preparation, N.A.-C., P.R.; writing—review—visualization and editing, T.M., M.S.C. and S.M.-A. All authors have read and agreed to the published version of the manuscript.

Funding

This work was financially supported by the authors’ institutions.

Institutional Review Board Statement

Not applicable, this study did not involve humans or animals.

Informed Consent Statement

Not applicable, this study did not involve humans or animals.

Data Availability Statement

The data and calculations presented in this study are openly available in data.inrae.fr repository, at [doi:10.15454/5MQJSV], version 3.0.

Acknowledgments

We would like to thank C. Barrier for his help with the experiments.

Conflicts of Interest

The authors declare no conflict of interest.

References

  1. Galloway, J.N.; Schlesinger, W.H.; Levy, H.; Michaels, A.; Schnoor, J.L. Nitrogen fixation: Anthropogenic enhancement-environmental response. Glob. Biogeochem Cycles 1995, 9, 235–252. [Google Scholar] [CrossRef] [Green Version]
  2. Sebilo, M.; Mayer, B.; Nicolardot, B.; Pinay, G.; Mariotti, A. Long-term fate of nitrate fertilizer in agricultural soils. Proc. Natl. Acad. Sci. USA 2013, 110, 18185–18189. [Google Scholar] [CrossRef] [PubMed] [Green Version]
  3. Crews, T.E.; Poples, M.B. Can the synchrony of nitrogen supply and crop demand be improved in legume and fertilizer-based agroecosystems? A review. Nutr. Cycl. Agroecosyst. 2005, 72, 101–120. [Google Scholar] [CrossRef]
  4. Akkal-Corfini, N.; Morvan, T.; Menasseri-Aubry, S.; Bissuel-Bélaygue, C.; Poulain, D.; Orsini, F.; Leterme, P. Nitrogen mineralization, plant uptake and nitrate leaching following the incorporation of (15N)-labeled cauliflower crop residues (Brassica oleracea) into the soil: A 3-year lysimeter study. Plant Soil. 2010, 328, 17–26. [Google Scholar] [CrossRef]
  5. Lanteri, S.; Acquadro, A.; Comino, C.; Mauro, R.; Mauromicale, G.; Portis, E. A first linkage map of globe artichoke (Cynara cardunculus var. scolymus L.) based on AFLP, S-SAP, M-AFLP and microsatellite markers. Theor. Appl. Genet. 2006, 112, 1532–1542. [Google Scholar] [CrossRef]
  6. Azza, A.; El-din, E.; Eman, E.; Aziz, S.F.; Hendawy, E.; Omer, A. Impact of phosphorus nutrition and number of cuttings on growth, yield and active constituents of artichoke. Int. J. Acad. Res. 2010, 2, 240–244. [Google Scholar]
  7. Iapichino, G. Micropropagation of globe artichoke (Cynara cardunculus L. var. scolymus). In Protocols for Micropropagation of Selected Economically-Important Horticultural Plants; Lambardi, M., Ozudogru, E.A., Jain, S.M., Eds.; Humana Press: Totowa, NJ, USA, 2013; Volume 994, pp. 369–380. [Google Scholar]
  8. FAOSTAT. Statistical Database; FAO: Rome, Italy, 2019; Available online: http://faostat.fao.org/en/?#data/QC (accessed on 4 November 2020).
  9. Giorgi, D.; Pandozy, G.; Farina, A.; Grosso, V.; Lucretti, S.; Crinò, P.; Saccardo, F. Karyotype of globe artichoke (Cynara cardunculus var. scolymus): Preliminary studies to define its chromosome morphology. Acta Horticulturae 2013, 133–138. [Google Scholar] [CrossRef]
  10. Agreste, Statistique Agricole Annuelle. Available online: http://agreste.agriculture.gouv.fr (accessed on 26 November 2020).
  11. Colla, G.; Rouphael, Y.; Cardarelli, M.; Svecova, E.; Rea, E.; Lucini, L. Effects of saline stress on mineral composition, phenolic acids and flavonoids in leaves of artichoke and cardoon genotypes grown in floating system. J. Sci. Food Agric. 2012, 93, 1119–1127. [Google Scholar] [CrossRef]
  12. Lombardo, S.; Pandino, G.; Mauromicale, G.; Knodler, M.; Carle, R.; Schieber, A. Influence of genotype, harvest time and plant part on polyphenolic composition of globe artichoke (Cynara cardunculus L. var. scolymus (L.) Fiori). Food Chem. 2010, 119, 1175–1181. [Google Scholar] [CrossRef]
  13. Pandino, G.; Lombardo, S.; Mauromicale, G.; Williamson, G. Profile of polyphenols and phenolic acids in bracts and receptacles of globe artichoke (Cynara cardunculus var. scolymus) germplasm. J. Food Compos. Anal. 2011, 24, 148–153. [Google Scholar] [CrossRef]
  14. Ruta, C.; Tagarelli, A.; Campanelli, A.; De Mastro, G.; Morone-Fortunato, I. Callogenesis Capability of Artichoke (Cynara cardunculus var. scolymus L. Fiori). Acta Horticulturae 2013, 377–380. [Google Scholar] [CrossRef]
  15. De Falco, B.; Incerti, G.; Amato, M.; Lanzotti, V. Artichoke: Botanical, agronomical, phytochemical, and pharmacological overview. Phytochem. Rev. 2015, 14, 993–1018. [Google Scholar] [CrossRef]
  16. Soliman, G.; Saad, T.M. Effect of cynara scolymus L. (artichoke) extract on lipid profile of hyperlipidemic male rats. Egypt. J. Hosp. Med. 2009, 37, 733–741. [Google Scholar]
  17. Gominho, J.; Lourenco, A.; Palma, P.; Lourenco, M.E.; Curt, M.D.; Fernandez, J.; Pereira, H. Large scale cultivation of Cynara cardunculus L. for biomass production—A case study. Ind. Crop. Prod. 2011, 33, 1–6. [Google Scholar] [CrossRef]
  18. Gouveia, S.C.; Castilho, P.C. Phenolic composition and antioxidant capacity of cultivated artichoke, Madeira cardoon and artichoke-based dietary supplements. Food Res. Int. 2012, 48, 712–724. [Google Scholar] [CrossRef]
  19. Archontoulis, S.V.; Struik, P.C.; Vos, J.; Danalatos, N.G. Phenological growth stages of Cynara cardunculus: Codification and description according to the BBCH scale. Ann. Appl. Biol. 2010, 156, 253–270. [Google Scholar] [CrossRef]
  20. Duarte, D.; Figueiredo, R.; Pereira, S.; Pissarra, J. Structural characterization of the stigma style complex of Cynara cardunculus (Asteraceae) and immunolocalization of cardosins A and B during floral development. Can. J. Bot. 2006, 84, 737–749. [Google Scholar] [CrossRef]
  21. Angelini, L.G.; Ceccarini, L.; Nassi o Di Nasso, N.; Bonari, E. Long-term evaluation of biomass production and quality of two cardoon (Cynara cardunculus L.) cultivars for energy use. Biomass Bioenergy 2009, 33, 810–816. [Google Scholar] [CrossRef]
  22. Rincon, L.; Perez, A.; Pellicer, C.; Abadia, A.; Saez, J. Nutrient uptake by artichoke. Acta Horticulturae 2007, 287–292. [Google Scholar] [CrossRef]
  23. Archontoulis, S.V.; Vos, J.; Yin, X.; Bastiaans, L.; Danalatos, N.G.; Struik, P.C. Temporal dynamics of light and nitrogen vertical distributions in canopies of sunflower, kenaf and cynara. Field Crop Res. 2011, 122, 186–198. [Google Scholar] [CrossRef]
  24. Mahmoud, E.K.; Abd EL-Kader, N.K. How the nitrogen fertilization dose affects the biochemical composition and net mineralization of the artichoke residues. J. Soil Sci. Plant Nutr. 2012, 12, 23–31. [Google Scholar] [CrossRef] [Green Version]
  25. Thompson, T.L.; Doerge, T.A.; Godin, R.E. Nitrogen and water interactions in subsurface drip-irrigated cauliflower: I. Plant response. Soil Sci. Soc. Am. J. 2000, 64, 406–411. [Google Scholar] [CrossRef] [Green Version]
  26. Li, Z.P.; Han, C.W.; Han, F.X. Organic C and N mineralization as affected by dissolved organic matter in paddy soils of subtropical China. Geoderma 2010, 157, 206–213. [Google Scholar] [CrossRef]
  27. Chaves, B.; De Neve, S.; Boeckx, P.; Berko, C.; Van Cleemput, O.; Hofman, G. Manipulation the N release from 15N labelled celery residues by using straw and vinasses. Soil Biol. Biochem. 2006, 38, 2244–2254. [Google Scholar] [CrossRef]
  28. De Neve, S.; Hofman, G. Modelling N mineralization of vegetable crop residues during laboratory incubation. Soil Biol. Biochem. 1996, 28, 1451–1457. [Google Scholar] [CrossRef]
  29. Rahn, C.R.; Paterson, C.D.; Vaidyanathan, L.V. The use of measurement of soil mineral N in understanding the response of crops to fertilizer nitrogen in intensive cropping rotations. J. Agric. Sci. 1998, 130, 345–356. [Google Scholar] [CrossRef] [Green Version]
  30. Neeteson, J.J.; Carton, O.T. The environmental impact of nitrogen in field vegetable production. Acta Hort. 2001, 563, 21–28. [Google Scholar] [CrossRef]
  31. Rahn, C.R.; Bending, G.D.; Tuner, M.K. Management of N mineralization from crop residues of high N content using amendment materials of varying quality. Soil Use Manag. 2003, 19, 193–200. [Google Scholar] [CrossRef]
  32. Danalatos, N.G.; Skoufogianni, E.; Giannoulis, K.; Archontoulis, S.V. Responses of Cynara cardunculus to irrigation and N-fertilization in central Greece 2007. In Proceedings of the 15th European Biomass Conference & Exhibition from Research to Market Deployment, Berlin, Germany, 7–11 March 2007; Available online: http://www.researchgate.net/publication/272942878_Responses_of_Cynara_cardunculus_to_irrigation_and_N-fertilization_in_central_Greece (accessed on 25 January 2021).
  33. Dourado-Neto, D.; Powlson, D.; Abu Bakar, R.; Bacchi, O.O.S.; Basanta, M.V.; Cong, P.; Thi Keerthisinghe, G.; Ismaili, M.; Rahman, S.M.; Reichardt, K.; et al. Multiseason recoveries of organic and inorganic nitrogen-15 in tropical cropping systems. Soil Sci. Soc. Am. J. 2010, 74, 139–152. [Google Scholar] [CrossRef]
  34. Jensen, E.S. Availability of nitrogen in 15N-labelled mature pea residues to subsequent crops in the field. Soil Biol. Biochem. 1994, 26, 465–472. [Google Scholar] [CrossRef]
  35. Stevenson, F.C.; Walley, F.L.; van Kessel, C. Direct vs. indirect nitrogen-15 approaches to estimate nitrogen contributions from crop residues. Soil Sci. Soc. Am. J. 1998, 62, 1327–1334. [Google Scholar] [CrossRef]
  36. Hood, R.C.; Merckx, R.; Jensen, E.S.; Powlson, D.; Matijevic, M.; Hardarson, G. Estimating crop N uptake from organic residues using a new approach to the 15N isotope dilution technique. Plant Soil. 2000, 223, 33–46. [Google Scholar] [CrossRef]
  37. Kumar, K.; Goh, K.M.; Scott, W.R.; Frampton, C.M. Effects of N-15-labelled crop residues and management practices on subsequent winter wheat yields, nitrogen benefits and recovery under field conditions. J. Agric. Sci. 2001, 136, 35–53. [Google Scholar] [CrossRef] [Green Version]
  38. Jackson, L.E. Fates and losses of nitrogen from a nitrogen-15-labeled cover crop in an intensively managed vegetable system. Soil Sci. Soc. Am. J. 2000, 64, 1404–1412. [Google Scholar] [CrossRef]
  39. Zapata, F.; Hera, C. Enhancing nutrient management through use of isotope techniques. In Nuclear Techniques in Soil-Plant Studies for Sustainable Agriculture and Environmental Preservation, Proceedings of the International Symposium on Nuclear and Related Techniques in Soil-Plant Studies on Sustainable Agriculture and Environmental Preservation. Vienna, Austria, 17–21 October 1994; IAEA: Vienna, Austria, 1995. [Google Scholar]
  40. Lehmann, J.; Muraoka, T. Tracer methods to assess nutrient uptake distribution in multistrata agroforestry systems. Agrofor. Syst. 2001, 53, 133–140. [Google Scholar] [CrossRef]
  41. Azam, F.; Malik, K.A.; Sajjad, M.I. Transformations in soil and availability to plants of is N applied as inorganic fertilizer and legume residues. Plant Soil. 1985, 86, 3–13. [Google Scholar] [CrossRef]
  42. IUSS Working Group WRB. World Reference Base for Soil Resources 2014, update 2015. International soil classification system for naming soils and creating legends for soil maps. In World Soil Resources Reports No. 106; FAO: Rome, Italy, 2015; p. 203. Available online: http://www.fao.org/3/i3794en/I3794en.pdf (accessed on 21 December 2020).
  43. Brooks, P.D.; Stark, J.M.; McInteer, B.B.; Preston, T. Diffusion method to prepare soil extracts for automated nitrogen-15 analysis. Soil Sci. Soc. Am. J. 1989, 53, 1707–1711. [Google Scholar] [CrossRef]
  44. Sparling, G.P.; Zhu, C.Y.; Fillery, I.R.P. Microbial immobilization of 15N from legume residues in soils of differing textures: Measurement by persulphate oxidation and ammonia diffusion methods. Soil Biol. Biochem. 1996, 28, 1707–1715. [Google Scholar] [CrossRef]
  45. Morvan, T. Quantification et Modélisation des Flux D’azote Résultant des Épandages de Lisier. Ph.D. Thesis, University of Paris VI, Paris, France, 1999; 146p. [Google Scholar]
  46. Portela, S.I.; Andriulo, A.E.; Sasal, M.C.; Bruno, M.; Jobbagy, E.G. Fertilizer vs. organic matter contributions to nitrogen leaching in cropping systems of the Pampas: 15N application in field lysimeters. Plant Soil. 2006, 289, 265–277. [Google Scholar] [CrossRef]
  47. Archontoulis, S.; Danalatos, N.G.; Struik, P.; Vos, J.; Yin, X. Agronomy of Cynara cardunculus growing on an aquic soil in central Greece. In Proceedings of the International Conference on Agricultural Engineering, Hersonissos, Crete, Greece, 23–25 June 2008; pp. 1–15. Available online: https://www.researchgate.net/profile/SV_Archontoulis/publication/37790122_Agronomy_of_Cynara_cardunculus_growing_in_an_aquic_soil_in_central_Greece/links/02bfe51397069bfd8f000000.pdf (accessed on 25 January 2021).
  48. Shinohara, T.; Agehara, S.; Yoo, K.S.; Leskovar, D.I. Irrigation and nitrogen management of artichoke: Yield, head quality, and phenolic content. Hortscience 2011, 46, 377–386. [Google Scholar] [CrossRef] [Green Version]
  49. Haggar, J.P.; Tanner, E.V.J.; Beer, J.W.; Kass, D.C.L. Nitrogen dynamics of tropical agroforestry and annual cropping systems. Soil Biol. Biochem. 1993, 25, 1363–1378. [Google Scholar] [CrossRef]
  50. Vanlauwe, B.; Swift, M.J.; Merckx, R. Soil litter dynamics and N use in a leucaena (Leucaena leucocephala Lam. (DeWitt)) alley cropping system in southwestern Nigeria. Soil Biol. Biochem. 1996, 28, 739–749. [Google Scholar] [CrossRef]
  51. Macdonald, A.J.; Poulton, P.R.; Stockdale, E.A.; Powlson, D.S.; Jenkinson, D.S. The fate of residual 15N-labelled fertilizer in arable soils: Its availability to subsequent crops and retention in soil. Plant Soil 2002, 246, 123–137. [Google Scholar] [CrossRef]
  52. Vázquez, N.; Pardo, A.; Suso, M.L.; Quemada, M. A methodology for measuring drainage and nitrate leaching in unevenly irrigated vegetable crops. Plant Soil 2005, 269, 297–308. [Google Scholar] [CrossRef]
  53. Vanlauwe, B.; Nwoke, O.C.; Sanginga, N.; Merckx, R. Impact of residual quality on the C and N mineralization of leaf and root residues of three agroforestry species. Plant Soil 1996, 183, 221–231. [Google Scholar] [CrossRef]
  54. Hart, P.B.S.; Powlson, D.S.; Poulton, P.R.; Johnson, A.E.; Jenkinson, D.S. The availability of the nitrogen in the crop residues of winter wheat to subsequent crops. J. Agric. Sci. 1993, 121, 355–362. [Google Scholar] [CrossRef]
  55. Glendining, M.J.; Poulton, P.R.; Powlson, D.S.; Macdonald, A.J.; Jenkinson, D.S. Availability of the residual nitrogen from a single application of 15N-labelled fertilizer to subsequent crops in a long-term continuous barley experiment. Plant Soil 2001, 233, 231–239. [Google Scholar] [CrossRef]
  56. Kumar, K.; Goh, K.M. Crop residues and management: Effects on soil quality, soil nitrogen dynamics, crop yield and nitrogen recovery. Adv. Agron. 2000, 68, 198–320. [Google Scholar]
  57. Seneviratne, G. Litter quality and nitrogen release in tropical agriculture: A synthesis. Biol. Fertil. Soils 2000, 31, 60–64. [Google Scholar] [CrossRef]
  58. Van Kessel, J.S.; Reeves, J.B.; Meisinger, J.J. Nitrogen and carbon mineralization of potential manure components. J. Environ. Qual. 2000, 29, 1669–1677. [Google Scholar] [CrossRef]
  59. Qian, P.; Schoenau, J. Availability of nitrogen in solid manure amendments with different C:N ratios. Can. J. Soil Sci. 2002, 82, 219–225. [Google Scholar] [CrossRef]
  60. Jensen, E.S. Dynamics of mature pea residue nitrogen turnover in unplanted soil under field conditions. Soil Biol. Biochem. 1994, 26, 455–464. [Google Scholar] [CrossRef]
  61. McKenney, D.J.; Wang, S.W.; Drury, C.F.; Findlay, W.I. Denitrification, immobilization and mineralization in nitrate limited and non-limited residue-amended soil. Soil Sci. Soc. Am. 1995, 59, 118–124. [Google Scholar] [CrossRef]
  62. Macdonald, A.J.; Poulton, P.; Powlson, D.S.; Jenkinson, D.S. Effects of season, soil type and cropping on recoveries, residues and losses of 15N-labelled fertilizer applied to arable crops in the spring. J. Agric. Sci. 1997, 129, 125–154. [Google Scholar] [CrossRef]
  63. Sanchez, P.A.; Jama, B. Soil fertility replenishment takes off in East and southern Africa. In Integrated Plant Nutrient Management in Sub-Saharan Africa: From Concept to Practice; Vanlauwe, B., Ed.; CAB Int.: Wallingford, UK, 2002; pp. 23–46. [Google Scholar]
  64. Stevens, W.B.; Hoeft, R.G.; Mulvaney, R.L. Fate of nitrogen-15 in a long-term nitrogen rate study: II. Nitrogen uptake efficiency. Agron. J. 2005, 97, 1046–1053. [Google Scholar] [CrossRef]
  65. Janzen, H.H.; Bole, J.B.; Biederbeck, V.O.; Slinkard, E. Fate of N applied as green manure or ammonium sulfate fertilizer to soil subsequently cropped with spring wheat in three sites in western Canada. Can. J. Soil Sci. 1990, 70, 313–323. [Google Scholar] [CrossRef]
  66. Ladd, J.N.; Amato, M. The fate of nitrogen from legume and fertilizer sources in soils successively cropped with wheat under field conditions. Soil Biol. Biochem. 1986, 18, 417–425. [Google Scholar] [CrossRef]
  67. Thönnissen, C.; Midmore, D.J.; Ladha, J.K.; Olk, D.C.; Schmidhalter, U. Legume decomposition and nitrogen release when applied as green manures to tropical vegetable production systems. Agron. J. 2000, 92, 253–260. [Google Scholar] [CrossRef]
  68. Swift, M.J.; Woomer, P. Organic matter and the sustainability of agricultural systems: Definition and measurement. In Soil Organic Matter Dynamics and Sustainability of Tropical Agriculture; Mulongoy, K., Merckx, R., Eds.; John Wiley & Sons: Chichester, UK, 1993; pp. 3–18. [Google Scholar]
  69. Min, J.; Zhang, H.L.; Shi, W.M. Optimizing nitrogen input to reduce nitrate leaching loss in greenhouse vegetable production. Agr. Water Manag. 2012, 111, 53–59. [Google Scholar] [CrossRef]
  70. Yang, X.L.; Lu, Y.L.; Tong, Y.A.; Yin, X.F. A 5-year lysimeter monitoring of nitrate leaching from wheat–maize rotation system: Comparison between optimum N fertilization and conventional farmer N fertilization. Agric. Ecosyst. Environ. 2015, 199, 34–42. [Google Scholar] [CrossRef]
  71. Giller, K.E.; Cadish, G. Future benefits from biological nitrogen fixation: An ecological approach to agriculture. Plant Soil 1995, 174, 255–277. [Google Scholar] [CrossRef]
Figure 1. Crop rotations in six lysimeters (L1 to L6) and 15N-labeled artichoke (ART) residues applied to soil (RART1, RART2 and RART3) in ART–cauliflower (CF) rotations.
Nitrogen 02 00004 g001
Figure 2. Change in mean soil temperature (Tsoil 10 cm), precipitation, N fertilization, uptake and leaching during the artichoke (ART)–cauliflower (CF) rotation.
Nitrogen 02 00004 g002
Figure 3. Nitrogen taken from artichoke (ART) residues: (a) distribution of RART1, RART2 and RART3 in plant and leaching; and (b) cumulative nitrogen from ART residues in leaching, harvest and total plant uptake of ART and cauliflower (CF) crops. RART1, RART2 and RART3 correspond to the artichoke residues chopped and applied to the soil after the first, second and third harvests, respectively.
Nitrogen 02 00004 g003
Table 1. C/N ratio, 15N concentration and amounts of dry matter (DM) and N of 15N-labeled artichoke leaves and stems incorporated into lysimeter soil.
LysimeterLabeled ResiduesArtichoke PartN
(% DM)
C/N Ratio15N
(δ% Excess)
DM
(g m−2)
N
(kg N ha−1)
L1RART1leaves2.2919.91.9531572
stems0.7171.01.7234124
L2RART1leaves2.1320.52.3429262
stems0.6757.72.1137725
L3RART2leaves1.7723.31.1926647
stems0.4880.60.981979
L4RART2leaves1.8920.01.9519737
stems0.5970.21.731509
L5RART3leaves1.75-2.0227248
stems0.44-1.822099
L6RART3leaves1.7423.92.6231054
stems0.5577.62.5426915
Table 2. Artichoke (ART) and cauliflower (CF) total fresh-matter (FM) in biomass (belowground + aboveground) and yield (heads), along with dry matter (DM) amounts and percentages returned to the soil as residues.
Lysimeter Planting DateHarvest DateResidues ProvidedCrop RotationTotal FM (t ha−1)Yield FM (t ha−1)Aboveground Total DM (t ha−1)Stump DM (t ha−1)Crop Residue DM (t ha−1)Aboveground Residues in Total DM (%)
L1September 1998July 1999RART1ART2 26.39.34.9-3.162.5
July 1999June 2000 ART3 13.64.22.23.9 *1.672.8
July 2000February 2001 CF74.824.65.9-3.864.5
March 2001September 2001 ART1 44.911.29.16.87.278.6
L2October 1999July 2000RART1ART2 24.48.84.4-2.863.8
July 2000June 2001 ART3 16.29.24.45.3 *1.943.5
July 2001February 2002 CF67.225.17.2-4.663.9
March 2002September 2002 ART1 38.712.48.86.15.967.3
L3July 1999June 2000RART2ART3 12.15.02.54.4 *1.561.3
July 2000February 2001 CF76.124.46.2-4.267.1
March 2001 September 2001 ART1 42.114.99.6-6.870.9
September 2001July 2002 ART2 49.612.210.09.27.878.3
L4July 2000June 2001RART2ART3 15.37.43.96.5 *2.358.0
July 2001February 2002 CF54.121.06.0-3.963.9
March 2002September 2002 ART1 33.111.58.2-6.073.7
September 2002July 2003 ART2 30.510.07.59.65.370.7
L5July 2000February 2001RART3CF73.326.75.6-3.460.7
March 2001September 2001 ART1 42.213.18.7-6.473.6
September 2001July 2002 ART2 52.814.810.3-7.875.2
July 2002July 2003 ART3 29.314.26.77.7 *4.059.1
L6July 2001February 2002RART3CF72.326.77.7-5.064.7
March 2002September 2002 ART1 31.510.97.1-5.273.3
September 2002July 2003 ART2 28.39.86.1-4.168.4
July 2003July 2004 ART3 26.511.57.45.8 *3.344.7
* 100% of stump DM (ART3) returned to soil. “-” indicates periods without sampling; underlined values represent contributions of artichoke stumps from ART3 at the end of the artichoke cycle; values not underlined correspond to the end of the experiment but not the end of the cycle.
Table 3. Artichoke (belowground, i.e., stump, and aboveground) and cauliflower (aboveground) N uptake by plant biomass. N amounts in crop residues measured in subsequent crops; the percentage of total N uptake returned to the soil; precipitation, water drainage and its mean nitrate (NO3) concentration measured under successive artichoke and cauliflower crops.
LysimeterPlanting DateHarvest DateResidues ProvidedCrop RotationAboveground N Uptake
(kg N ha−1)
Belowground N Uptake
(kg N ha−1)
N in
Aboveground
Residues
(kg N ha−1)
N in
Aboveground Residues (%)
Precipitation (mm)Water Drainage (mm)Mean NO3
(mg L−1)
L1September 1998July 1999RART1 ART2 72-4461102444141.5
July 1999June 2000 ART3 5731.1 *3358106052087.2
July 2000February 2001 CF260-145568545362.5
March 2001September 2001 ART1 10462.0706744722524.7
L2October 1999July 2000RART1ART2 60-345689946957.6
July 2000June 2001 ART3 6848.8 *2740118678351.0
July 2001February 2002 CF185-10054440790.8
March 2002September 2002 ART1 12155.3736040515013.3
L3July 1999June 2000RART2ART3 4339.1 *2763106046898.8
July 2000February 2001 CF262-150578545103.3
March 2001September 2001 ART1 103-555444722624.5
September 2001July 2002 ART2 11977.479667068026.7
L4July 2000June 2001RART2ART3 5143.8 *2854118680133.1
July 2001February 2002 CF140-7251440863.3
March 2002September 2002 ART1 94-576040515912.4
September 2002July 2003 ART2 8543.6516076029538.6
L5July 2000February 2001RART3CF189-89478545511.5
March 2001September 2001 ART1 98-545544722618.8
September 2001July 2002 ART2 108-646070610522.3
July 2002July 2003 ART3 10247.1 *494880831633.5
L6July 2001February 2002RART3CF222-12054440781.2
March 2002September 2002 ART1 100-666640514622.9
September 2002July 2003 ART2 94-6164760298102
July 2003July 2004 ART3 11867.4 *413574226062.2
* 100% of stump DM (ART3) returned to soil. “-” indicates periods without sampling; underlined values represent contributions of artichoke stumps from ART3 at the end of the artichoke cycle.
Table 4. Artichoke and cauliflower 15N (%) uptake by the parts of each crop, 15N amounts in crop residues, 15N lost by nitrate leaching and 15N exported by harvest measured in subsequent crops.
LysimeterPlanting DateHarvest DateResidues ProvidedCrop RotationAboveground 15N Uptake (%)Stump 15N Uptake (%)Aboveground 15N in Residues Restored to Soil (%)15N Leached (%)15N Export (%)Balance Deficit (%)
L1September 1998July 1999RART1 ART2 3.20-1.910.531.2998.2
July 1999June 2000 ART3 1.500.941.003.660.5094.0
July 2000February 2001 CF5.56-3.130.0462.4391.6
March 2001September 2001 ART1 2.131.311.410.180.7290.7
L2October 1999July 2000RART1ART2 3.63-2.060.681.5797.7
July 2000June 2001 ART3 2.431.931.005.871.4290.5
July 2001February 2002 CF5.61-3.020.0022.5987.8
March 2002September 2002 ART1 3.251.071.980.0391.2786.5
L3July 1999June 2000RART2ART3 1.991.011.273.990.7195.3
July 2000February 2001 CF9.61-5.650.103.9691.2
March 2001 September 2001 ART1 3.09-1.640.251.4589.5
September 2001July 2002 ART2 1.881.371.220.0730.6688.8
L4July 2000June 2001RART2ART3 2.321.771.723.240.6196.2
July 2001February 2002 CF3.86-1.890.0041.9694.2
March 2002September 2002 ART1 2.07-1.210.0550.8693.3
September 2002July 2003 ART2 1.290.600.730.540.5692.2
L5July 2000February 2001RART3CF6.85-3.150.0063.7096.3
March 2001September 2001 ART1 3.12-1.690.141.4394.7
September 2001July 2002 ART2 1.72-1.010.0700.7194.0
July 2002July 2003 ART3 1.300.810.660.350.6593.0
L6July 2001February 2002RART3CF9.51-5.610.0033.9096.1
March 2002September 2002 ART1 4.60-3.100.1221.5194.5
September 2002July 2003 ART2 2.12-1.371.930.7591.8
July 2003July 2004 ART3 1.701.330.610.491.0890.2
“-” indicates periods without sampling; underlined values represent contributions of artichoke stumps from ART3. “Balance deficit” indicates the amount of 15N estimated to remain in the lysimeter after harvest (sum of soil, Equation (2), and aboveground residues).
Table 5. Mean values (±1 standard deviation) of artichoke (ART) and cauliflower (CF) 15N (%) uptake, 15N lost by nitrate leaching and 15N exported by harvest measured from each residue.
Lysimeter Residues ProvidedProcess RotationTotal 15N per Rotation (2)15N Conserved (3)
L1-L2RART1 ART2 ART3 CFART1
15N uptake (1)4.6%±0.72%3.4%±1.35%5.6%±0.04%3.9%±0.62%17.5%±2.73%88.6%
15N crop export1.4%±0.20%1.0%±0.65%2.5%±0.11%1.0%±0.39%5.9%±1.35%
15N leached0.6%±0.11%4.8%±1.56%0.0%±0.03%0.1%±0.10%5.5%±1.54%
Total 15N loss2.0%±0.31%5.7%±2.21%2.5%±0.10%1.1%±0.29%11.4%±2.91%
L3-L4RART2 ART3 CFART1 ART2
15N uptake (1)3.5%±0.77%6.7%±4.07%3.8%±1.13%2.6%±0.96%16.6%±5.39%90.5%
15N crop export 0.7%±0.07%3.0%±1.42%1.2%±0.42%0.6%±0.07%5.4%±1.98%
15N leached3.6%±0.53%0.1%±0.07%0.2%±0.14%0.3%±0.33%4.1%±0.41%
Total 15N loss 4.3%±0.60%3.0%±1.48%1.3%±0.56%0.9%±0.26%9.5%±2.37%
L5-L6RART3 CFART1 ART2 ART3
15N uptake (1)8.2%±1.88%5.1%±1.46%3.1%±0.70%2.6%±0.65%19.0%±4.27%91.6%
15N crop export 3.8%±0.14%1.5%±0.05%0.7%±0.03%0.9%±0.31%6.9%±0.53%
15N leached0.0%±0.00%0.1%±0.01%1.0%±1.31%0.4%±0.10%1.6%±1.40%
Total 15N loss 3.8%±0.15%1.6%±0.04%1.7%±1.35%1.3%±0.41%8.4%±1.93%
(1)15N uptake: artichoke = aboveground + stump (observed or missing data replaced by mean of 1.22%); cauliflower = aboveground only, (2) Total 15N uptake: some of this total comes from 15N recycled by residues and not directly from initial residues, (3) 15N conserved: balance deficit = 100%—15N exported in harvest or lost by leaching (volatilization was assumed to be negligible).
Publisher’s Note: MDPI stays neutral with regard to jurisdictional claims in published maps and institutional affiliations.

