Article

Evaluation of Unmanned Aerial Vehicles (UAV) as a Tool to Predict Biomass and Carbon of Tectona grandis in Silvopastoral Systems (SPS) in Costa Rica

Escuela Ingeniería Forestal, Instituto Tecnológico de Costa Rica, Cartago 30101, Costa Rica
*
Author to whom correspondence should be addressed.
Submission received: 27 April 2021 / Revised: 23 May 2021 / Accepted: 27 May 2021 / Published: 1 June 2021
(This article belongs to the Section Drones in Agriculture and Forestry)

Abstract

:
The main objective of this research was to evaluate the use of unmanned aerial vehicles (UAVs) in estimating the aboveground biomass and carbon, and the dasometric characteristics at three different spacings (2.5 m × 1.0 m, 2.5 m × 2.0 m and 2.5 m × 3.0 m) in a silvopastoral system (SPS) for the biomass production of Tectona grandis. A total of 90 trees were sampled, 63 of which were used to perform a dasometric evaluation (vertical and horizontal) in a spacing test in an SPS, and the rest to evaluate the use of UAVs in estimating the aboveground biomass in the spacing test. The results showed significant differences in average diameter at breast height (dbh) between spacings, and in aboveground biomass per tree. The amount of aboveground biomass and carbon per hectare increases at smaller spacings, but the differences were not statistically significant. A logarithmic model was prepared to estimate the dbh based on the crown diameter from the data collected taken in the field, since estimating this variable by means of UAVs is difficult. Significant differences were found in the aboveground biomass estimated using the field data compared to UAV data. The estimation of the crown diameter of the selected trees, hindered by the canopy closure in the SPS, was not adequate, which could influence the amount of aboveground biomass estimated using UAV data.

1. Introduction

Biomass can be defined as the living matter that comes from plants, animals or microorganisms, and is available in different parts [1]. Various reports mention that the total aquatic and terrestrial biomass reserves in the world are around 4000 million and 1.8 trillion tons, respectively [1,2]. Herbaceous and lignocellulosic biomass can be found in forests, forest plantations and agricultural crops [3,4]. Biomass coming from trees can be obtained from different sources [5], such as short-rotation energy crops (SRC) [6] or residuals from forest production [2,7].
Agroforestry systems (AFS) are forest production systems that combine woody crops (shrubs and trees) with agricultural crops or the maintenance of animals from which humans benefit, sharing a given area and temporal space [8,9]. One type of AFS is silvopastoral systems (SPS), which have been proposed as a means to intensify beef production through the association of trees, pastures and animals [10].
Precise and reliable estimations of the structural attributes of trees from forest production systems are crucial for stakeholders to make decisions regarding long-term sustainable management [11,12]. Therefore, low cost systems to measure or estimate variables such as diameter at breast height (dbh), mean height, basal area and volume are fundamental in research involving the productivity of plantations, forests, AFS and SPS [13,14].
The livestock sector accounts for approximately 15% of global greenhouse gas (GHG) emissions, mainly because of methane (CH4) emission produced by digestion; thus, this sector is one of the main contributors to climate change [15,16]. However, SPS can help neutralize livestock emissions through carbon (C) accumulation in the biomass of planted trees [17,18], hence the need to gather information about biomass and carbon stored in trees.
With the development of the fourth industrial revolution (Industry 4.0), new equipment and techniques have been introduced in agriculture that aim to reduce costs and increase the productivity of agricultural crops [19]. In the field of forestry, unmanned aerial vehicles (UAV) have great potential for the evaluation of natural resources, since they offer the possibility of making non-destructive and precise measurements of many attributes of trees [20]. This potential also related to the utilization of few materials in the field, a high intensity of data collection [21] and low costs [22,23].
The advancement of remote sensing technology, such as airborne laser scanning (ALS) and digital aerial photography derived from UAVs, can produce difficulties in accurately measuring some attributes of the characteristics of trees, such as height or diameter [24]. Several studies have demonstrated the high precision of LiDAR data in estimating forest characteristics of large areas of forests [25]. However, the main limitation of LiDAR data is the high cost of photography acquisition [26].
One of the uses given to UAVs is the estimation of aboveground biomass (AGB) in forests and pure plantations, AFS or SPS, due to the advantages UAVs offer, such as reduced cost, flexible take-off and landing, safety, low cloud flights and hyperspace image resolution [27]. UAVs have been applied widely in different regions of the world [28,29], whereas practical applications in SPS are limited [30]. For example, Surový et al. [31] used UAVs to estimate the position and height of trees; Páuda et al. [30] used them to classify silvopastoral systems using RGB images; and Gutiérrez et al. [32] studied the influence of grazing on gully erosion in silvopastoral systems in southwest Spain using drones.
The traditional biomass estimation methodology consists of destructive and non-destructive methods [33]. Destructive methods involve tree felling and weighing, while non-destructive methods include the development of allometric equations using predictor variables such as dbh or total tree height, among other factors [33,34]. In the other hand, in recent years, with the implementation of drones, more technological methodologies have emerged, which allow one to obtain more flexible data with a low operating cost [22].
The main objective of this research was to evaluate the use of UAVs for estimating AGB and C, and to evaluate the dasometric characteristics of Tectona grandis at three different spacings (2.5 × 1.0 m, 2.5 × 2.0 m and 2.5 × 3.0 m) in a silvopastoral system (SPS) for biomass production.

2. Materials and Methods

To meet the project’s aims, the process was divided into three major activities. In the first activity, an evaluation of the direct measurements of the dasometric variables (vertical and horizontal) of the SPS was conducted. The second activity included an estimation of AGB and C per tree and per hectare by means of destructive methods, taking into account the SPS spacing test. Lastly, we performed a comparison between the quantity of AGB and C per hectare using field data and UAV measurements. UAV flights were performed over the SPS; an allometric equation was chosen to estimate AGB per tree as a function of diameter at 1.30 m (dbh) and total height, and a model was made to estimate the dbh as a function of the crown diameter; this model was to be used in biomass calculations using the data provided by UAV measurements.

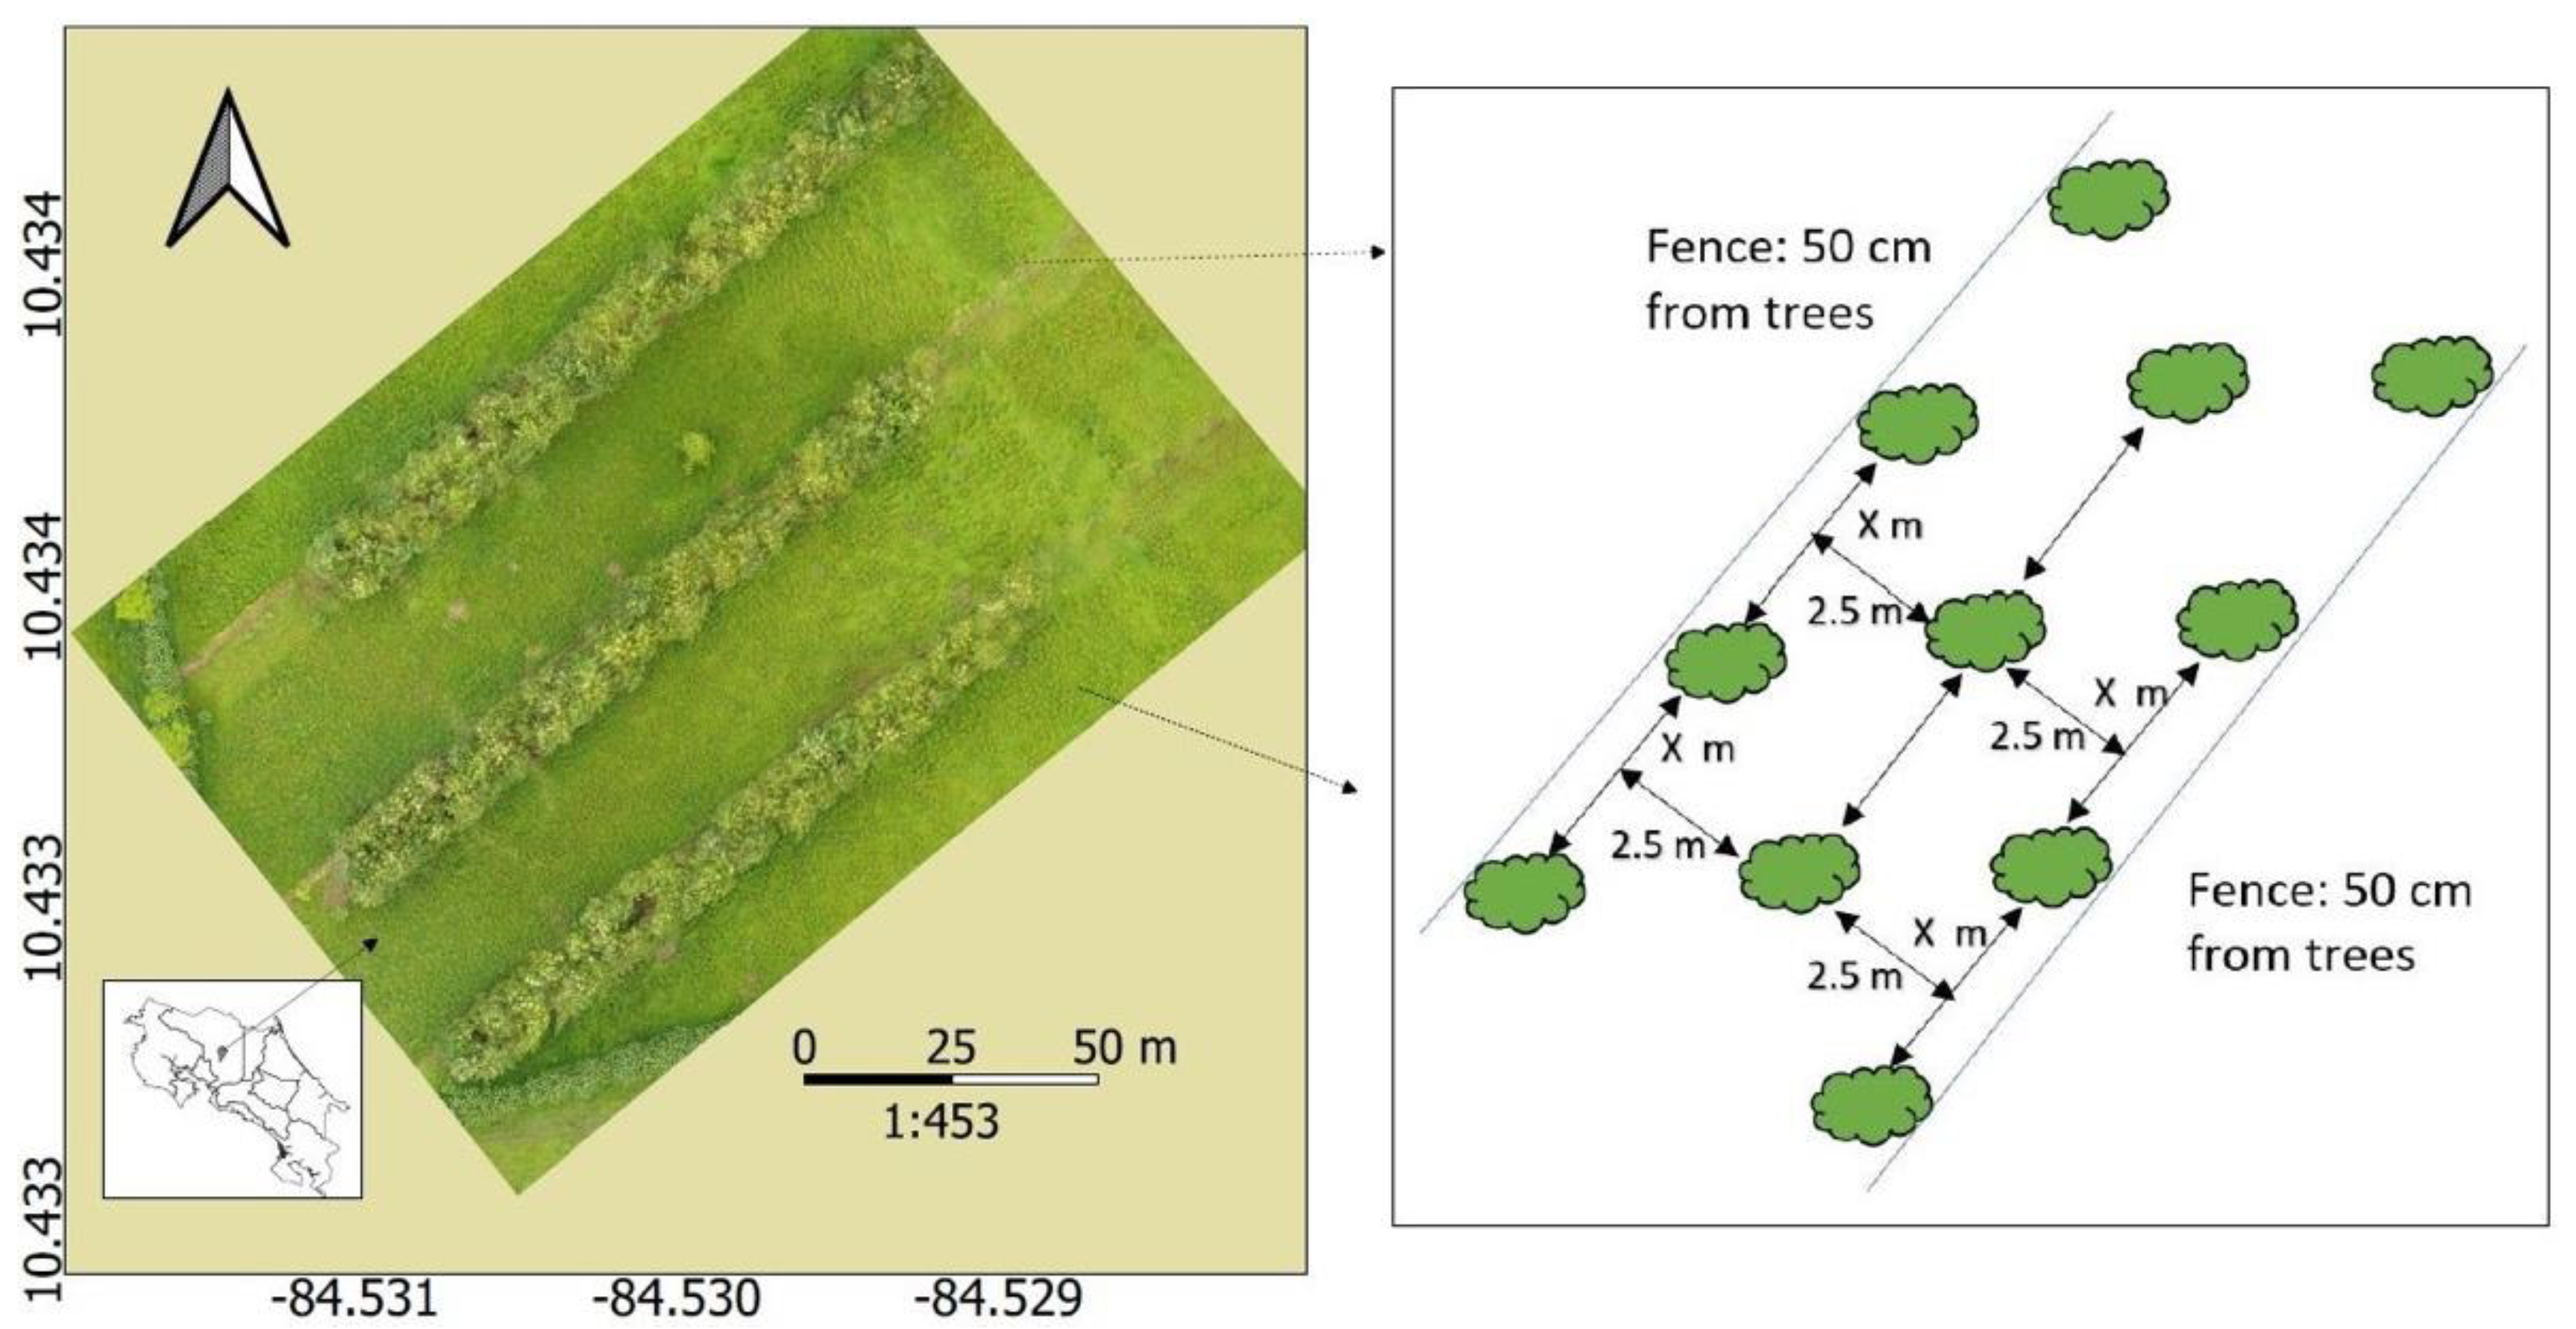
2.1. Region of Study and Spacing Test Description

The SPS spacing test is located in Finca La Vega, which belongs to the Instituto Tecnológico de Costa Rica, in San Carlos, Costa Rica, with WGS84 coordinates 10°34′ N latitude and 84°36′ W longitude. The average temperature in this site ranges between 25 and 28 °C and the average annual rainfall is between 3000 and 3300 mm. The spacing test is located in the lowlands, with altitudes from 200 to 225 MASL. Soils of the inceptisols, clayey, highly acidic and shallow types are present in the area (pH < 5.5) [35].
This spacing test (4.70 ha) was set up in 2014 using clones produced by the International Cooperative for Forest Genetic Improvement (GENFORES, using the Spanish abbreviation) [36]. In this spacing test, three blocks were established, each one including six tree spacings and each spacing including three rows of trees (right, center and left). Three of the six spacings were evaluated in this research, namely, 2.5 × 1.0 m, 2.5 × 2.0 m and 2.5 × 3.0 m where spacing between tree rows was kept constant (Figure 1). As for the silvopastoral system, no management had been carried. The first thinning was performed in the present study, when the trees were 6 years old.

2.2. Dasometric Evaluation of Tress and Number of Trees per Treatment and per Hectare

The diameter at a 1.30 m height and the total height of 7 trees per spacing (7 trees × 3 spacings × 3 rows, 63 trees in total) were measured. The trees were selected randomly, choosing one per row (right, center and left).
The number of trees per hectare for each treatment was calculated considering the initial area of each one of them. Then, an estimation was made of the possible number of trees in a row of trees under the same spacing, considering the mortality observed in each treatment and an average row length of 100 m. Finally, we multiplied the value obtained by 2, since Ospino-Araya et el. [37] mention that this number of rows per hectare has been used in various studies in this area of the country since 2015.

2.3. Aboveground Biomass and Carbon Content Evaluation in the SPS

To calculate aboveground biomass (AGB), 3 trees per spacing (3 trees × 3 spacing × 3 rows) were felled, making 27 trees in total. Trees from the first thinning, one from each row (right, center and left), plus those showing less growth, were used. The trees were cut at ground level, and branches and leaves were separated from the trunk. Each part (leaves, branches and trunk) was weighed independently. After this, 5 cross sections 10 cm in length were extracted at 5 different tree heights: at the base, at 25%, at 50%, at 75% and at 100% of the tree height. These samples were utilized to find moisture content of the trunk and bark, and for tests to estimate C content. In the case of leaves, a sample weighing approximately 600 g was taken to determine moisture content in the laboratory. All of this material was stored in plastic bags to preserve moisture content.
For moisture content determination, the leaves, branches and trunk in green condition were weighed separately and then placed into an oven at 105 °C for 24 h; after this period, the samples were weighed again. Moisture content was calculated by means of the following equation according to the ASTM D4442-07 [38] standard.
Moisture   content   % = weight   before   drying weight   after   drying   g weight   before   drying   g × 100  
For C content, sub-samples of the sections were taken from the base of the trunk and from 25%, 50%, 75% and 100% of the total height. These sub-samples were then splintered and sieved through meshes of 0.25 and 0.42 mm (40 and 60 meshes respectively). The samples from the different trees per spacing per row were combined to make a mixed sample (1 sample × 1 spacing × 1 row), thus obtaining 3 samples per each spacing, making a total of 27 samples. From each combined sample, 5 sub-samples were taken to obtain 135 sub-samples. C percentage was determined using the Vario Micro Cube (Elementar, Germany) Elemental Analyzer.
For biomass calculation per tree, the green weight measured in the field and moisture content obtained with the samples collected were used in Equation (2). The amounts of biomass were calculated separately for the trunk, branches and leaves. Then the AGB was calculated per tree, adding the values of biomass of the trunk, branches and leaves. The value obtained was calculated in kg/hectare by multiplying the value of AGB per tree by the number of trees per hectare.
B i o m a s s   t r e e   kg = G r e e n   w e i g h t   t r e e   kg × 1 Moisture   content   % 100
where: Green weight is the weight of the different components (trunk, bark and leaves) and Moisture content is the moisture content of each component (trunk and leaves).
The quantity of C per tree and per hectare were calculated multiplying C average (%) of the 5 sub-samples by the quantity of AGB per tree (Equation (3)). To determine the quantity of C per hectare, the value of C per tree multiplied by the number of trees per hectare was used.
Total   c a r b o n t r e e     kg = Total   biomass T r e e   kg × C a r b o n   %  

2.4. UAV Flight Planning and Processing

A DJI WAV Phantom 4 Pro model (DJI, China) (Table 1) was used for aerial evaluation of the SPS. The Pix4D capture (Pix4D; version IOS; Lausanne, Switzerland) application was used for flight planning and three flights with the characteristics illustrated in Table 2 were performed.
An Asus X556UQK laptop with 16 GB RAM, an NVIDIA GEFORCE 940 MX® graphics card and the Pix4D mapper (Pix4D; version IOS; Lausanne, Switzerland) software were used to process the information from the flights. Finally, each flight was evaluated to choose the one showing better images of the trees. This evaluation was performed with three different criteria: ground sample distance, orthomosaic area and orthomosaic quality.
The ground sample distance was obtained when the drone flights were performed, the orthomosaic area was provided in the report generated by Pix4D and the quality of the orthomosaic was evaluated as follows:
  • There are no distortions, gaps or any other imperfection that could affect tree counting or crown diameter estimation, among others in the orthomosaic.
  • There are distortions, gaps or other imperfections that minimally or partially affect tree counting tasks or crown diameter estimation, among others in the orthomosaic.
  • There are distortions, gaps or other types of imperfection that make it impossible to perform tree counting tasks or crown diameter estimation, among others within the orthomosaic.

2.5. Allometric Equations and Selection of Aboveground Biomass Prediction

A review of the literature was conducted to identify allometric equations to calculate AGB for Tectona grandis, which used dbh and total height (ht) as predictor variables. Equations developed in Costa Rica were given priority and 4 equations (Equations (4)–(7)) were identified. The first one was developed by [39], and was prepared using Tectona grandis trees from forest plantations in many regions in Costa Rica (Equation (4)). The second one corresponds to Rodríguez et al. [40], developed with Tectona grandis trees from Guanacaste (Equation (5)). The third one, proposed by González [41], estimates the AGB per tree using trunk volume and also uses the density of the species and an expansion factor of AGB (Equation (6)). Equation (7) was developed by Chave et al. [42], who used species from different countries around the world.
Log10 AGB (kg) = −0.317 + 0.771 × Log10 dbh (cm)
AGB (kg) = 7.35(0.16 × dbh (cm))
AGB (kg) = (Volume (m3) × ρ (kg/m3) × BEF)
AGB (kg) = 0.0673 + (ρ (g/cm3)) × dbh (cm) × H (m))0.976
where: Log10 AGB is aboveground dry biomass, Log10 dbh is diameter at 1.30 m, AGB is aboveground dry biomass, Volume is basal area (m2) × total height (m) × Form factor (0.44), ρ is wood density, H is total height, BEF2 is aboveground biomass expansion factor.
Since Equation (6) requires the commercial volume of the trunk, it was calculated using a form factor of 0.44 proposed by Peréz and Kanninen [43]. Similarly, the conversion factor of commercial volume into AGB (BEF2) was calculated for each tree by means of Equation (8). As for the density of the species, each tree’s density was calculated with Equation (9).
B E F 2 = trunk   biomass   kg +   branch   biomass   kg +   leaves   biomass   kg trunk   biomass   kg  
D e n s i t y   kg m 3 = Dry   weigth kg Green   volume   m 3  
where: ρ is wood density, Dry weight is dry weight of the sample, Green volume is green volume of the sample, BEF2 is aboveground biomass expansion factor.
For the section of the AGB equation which concerns the estimation with data gathered in the field vs. data obtained with UAV, we compared the 4 allometric equations previously described (Equations (4)–(7)). For this, we used 26 of the felled trees since the real value of biomass was available. Therefore, a comparison was realized between the real value of biomass and that obtained through the equation. For this, a paired means test was carried out to verify if there were significant differences between the real value of biomass and the one estimated with the equation. In addition, the results were plotted to visualize which of them best fit the data.

2.6. Development and Validation of the dbh Prediction Model

A dbh (cm) prediction model was prepared using the crown diameter (dc) of trees measured in the field. For model validation, the dc of 36 of the 63 trees measured in the field were measured, of which 9 were reserved to realize the validation of the model. Several models were proposed (Equations (10)–(12)), of which one was chosen, taking into account different precision statistics: coefficient of determination (R2), standard error (Syx) and coefficient of variation (%CV). For validation, the percentage of bias (%) was calculated, and a Wilcoxon test of paired observations was performed using the program PAST®.
dbh = α + β × dc
dbh = α + β × ln(dc)
dbh = α + dcβ
where α and β are constants of the model, dbh: diameter at breast height (cm), dc: crown diameter (m).

2.7. Comparison of Aboveground Biomass and Carbon per Tree (Field Data vs. UAV Data)

To perform this comparison, 27 of the 63 trees measured in the field (dbh and ht) were separated, and AGB was calculated using these field data, dbh and ht measurements and the selected biomass equation. AGB estimation using UAV data utilized dc measurements on the complete orthomosaic with greater spatial resolution, with the help of the corresponding digital elevation model and the biomass equation selected. The first step was to identify the 27 trees selected in the orthomosaic. To achieve this, a central point was marked on the tree crown. This was possible since the spacing, block and row the tree belonged to was annotated in the field. Once the trees were identified, each one was measured for its ht and then the average dc (m) was calculated after taking two measurements: one north–south and another in an east–west direction. Finally, the model created in the previous section was used to calculate the dbh and then to calculate AGB with the equation. Once the biomass values were obtained for each method, the average C percentage determined in the laboratory tests per tree was used to calculate C in trees. Lastly, a paired means test was carried out to see if there were significant differences between the two aboveground biomass estimation methods.

2.8. Statistical Analysis

The compliance of the assumptions of normality of the data and homogeneity of the variance, as well as the presence of atypical values of dasometric variables and of biomass production in the trunk, branches, leaves, biomass and carbon above ground per tree and per hectare were verified and applied to the models tested. Analyses of variance were performed to verify the effect of blocks and spacing in the different variables mentioned. The compliance of assumptions, analysis of variance, Tukey tests and model development were conducted using Infostat (Universidad Nacional de Córdoba, student version, Córdoba, Argentina) and Minitab (Minitab LLC, version 2019, State College, PA, USA) statistical software.

3. Results and Discussion

3.1. Dasometric Variables (Horizontal and Vertical) and Number of Trees per Hectare

The values of average dbh per tree were statistically different between a spacing of 2.5 × 3 m and spacings of 2.5 × 1.0 m and 2.5 × 2.0 m, the highest being 2.5 × 3.0 m (Table 3). The quantity of trees per hectare varied between spacings, which is to be expected since the area of growth of each tree is different. The smaller the growing space, the higher the number of trees per hectare (Table 3).
Various studies have demonstrated that the spacing used in the plantation may influence tree diameter growth [44,45,46,47]. These differences may be attributed to the fact that in greater spacings (such as 2.5 × 3 m), the trees have greater growing area allocated and less competition among them; therefore, the rooting system and foliage area are bigger [47,48].
As for tree height in each spacing, no significant differences were observed between spacings. This result agrees with those of various authors, who found that growth in height is not affected by spacing [49,50]. Scarce tree height variation per spacing could be explained by Cardoso et al. [51], who mention that tree height is not normally affected by the initial plantation density, while it is also possible that the range of spacings used is not sufficient to produce significant differences in height. However, Toillon et al. [52] indicates that this condition can be significantly modified by the site and genotype of the trees.

3.2. Aboveground Biomass Characterization in Each Spacing

The results indicate that for the variables of biomass in the trunk, leaves and branches, there are no significant differences between treatments (Table 4). In general, trunk biomass was greater than biomass in branches and leaves, as expected, which is congruent with reports from several authors [53,54,55]. Specifically, these results are similar to those presented by Eloy et al. [56] and Tun et al. [46], who found no differences in trunk biomass among some spacings using different species.
Accordingly, the biomasses of leaves and branches in each spacing are similar to the ones reported by Tenorio et al. [48], who found that there were no significant differences between the biomasses of leaves between spacings in two sites planted with Gmelina arborea. This behavior can be explained by the fact that the spacings used produced no significant differences [51].
Table 5 demonstrates congruence between the above results and the results in Table 3, since the greater the spacing, the greater the tree diameters are, owing to increased space for growth, resulting in higher AGB values.

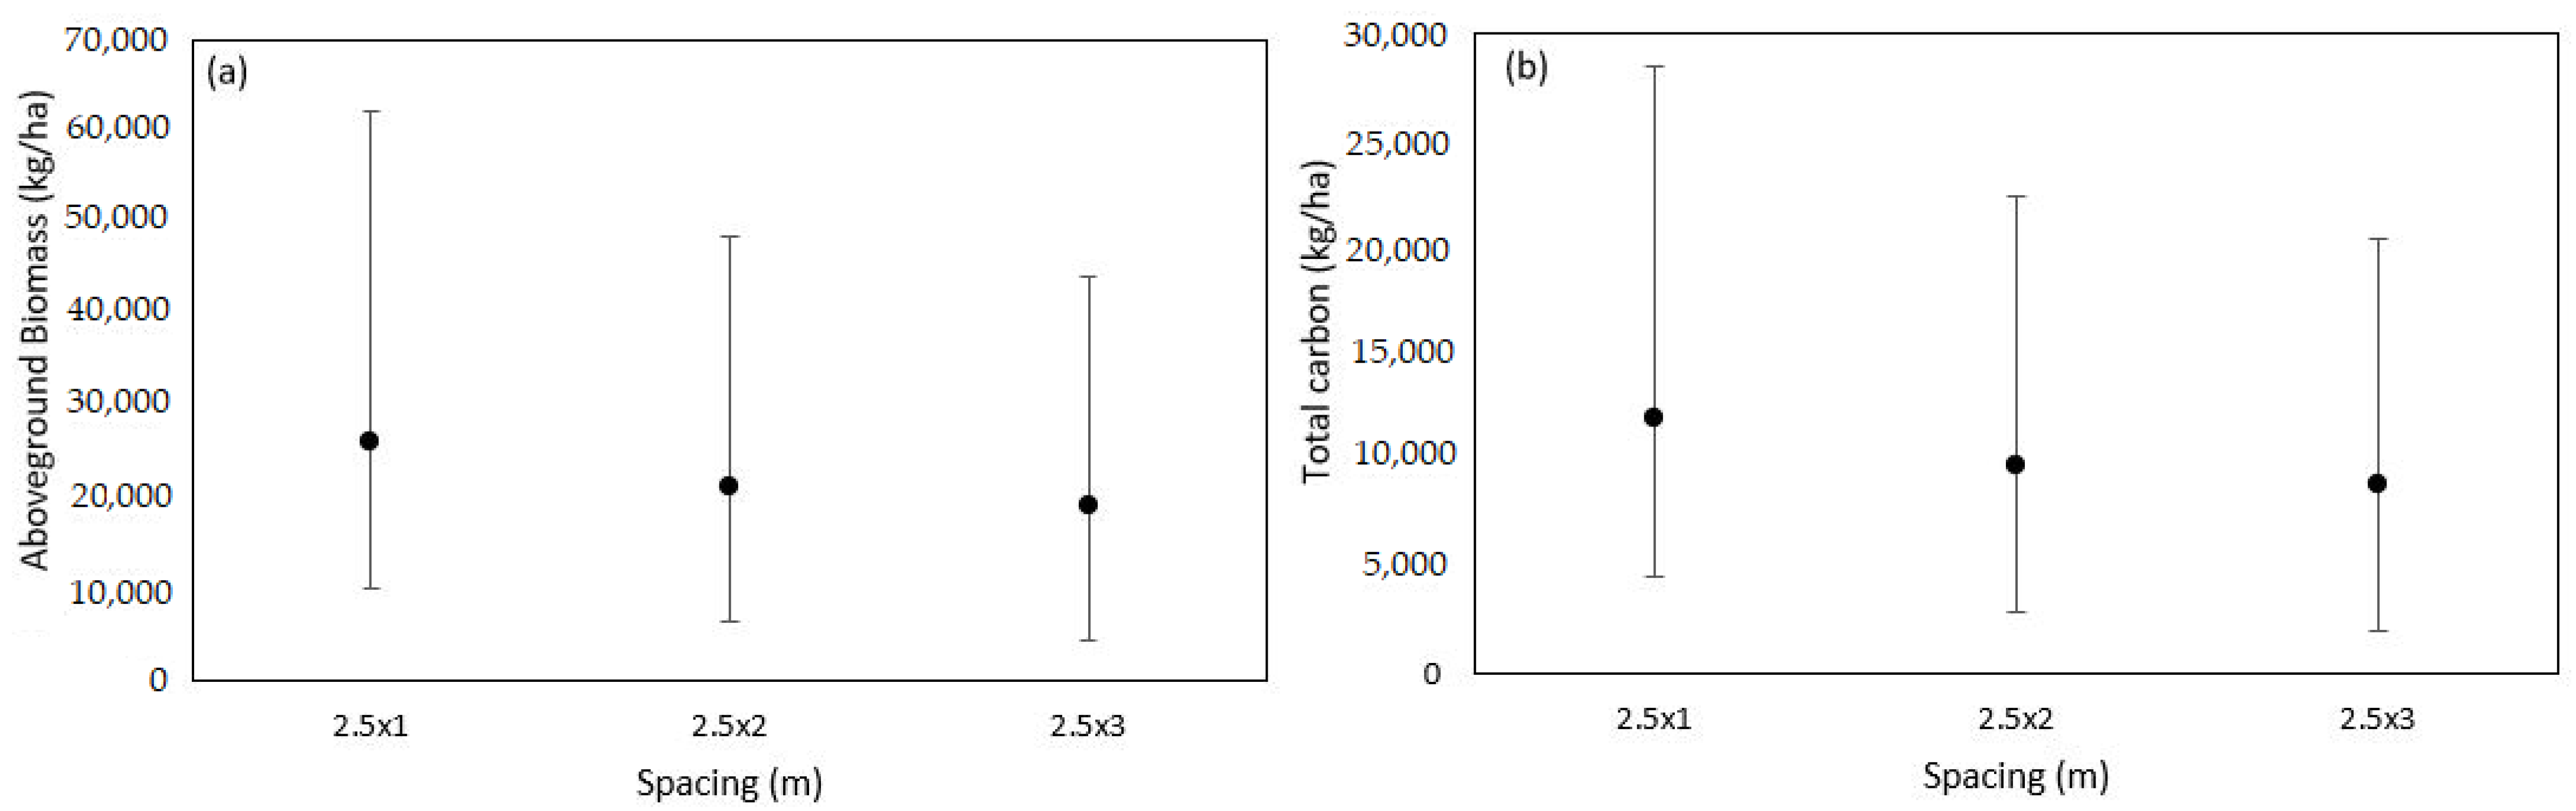
3.3. Aboveground Biomass and Carbon in Each Spacing

According to Figure 2, the spacing with less aboveground biomass and carbon per hectare was 2.5 × 3. Several works that included species such as Poplar balsamifera, Poplar trichocarpa, Eucalyptus grandis, Acacia mearnsii and Gmelina arborea, among others, have found that biomass and carbon per hectare can vary at different spacings [46,47,48,56]. In conclusion, there are no statistical differences in AGB between spacings, according to the analysis of variance, therefore it is convenient to apply the spacing with less and larger trees, that is, 2.5 × 3 spacing.

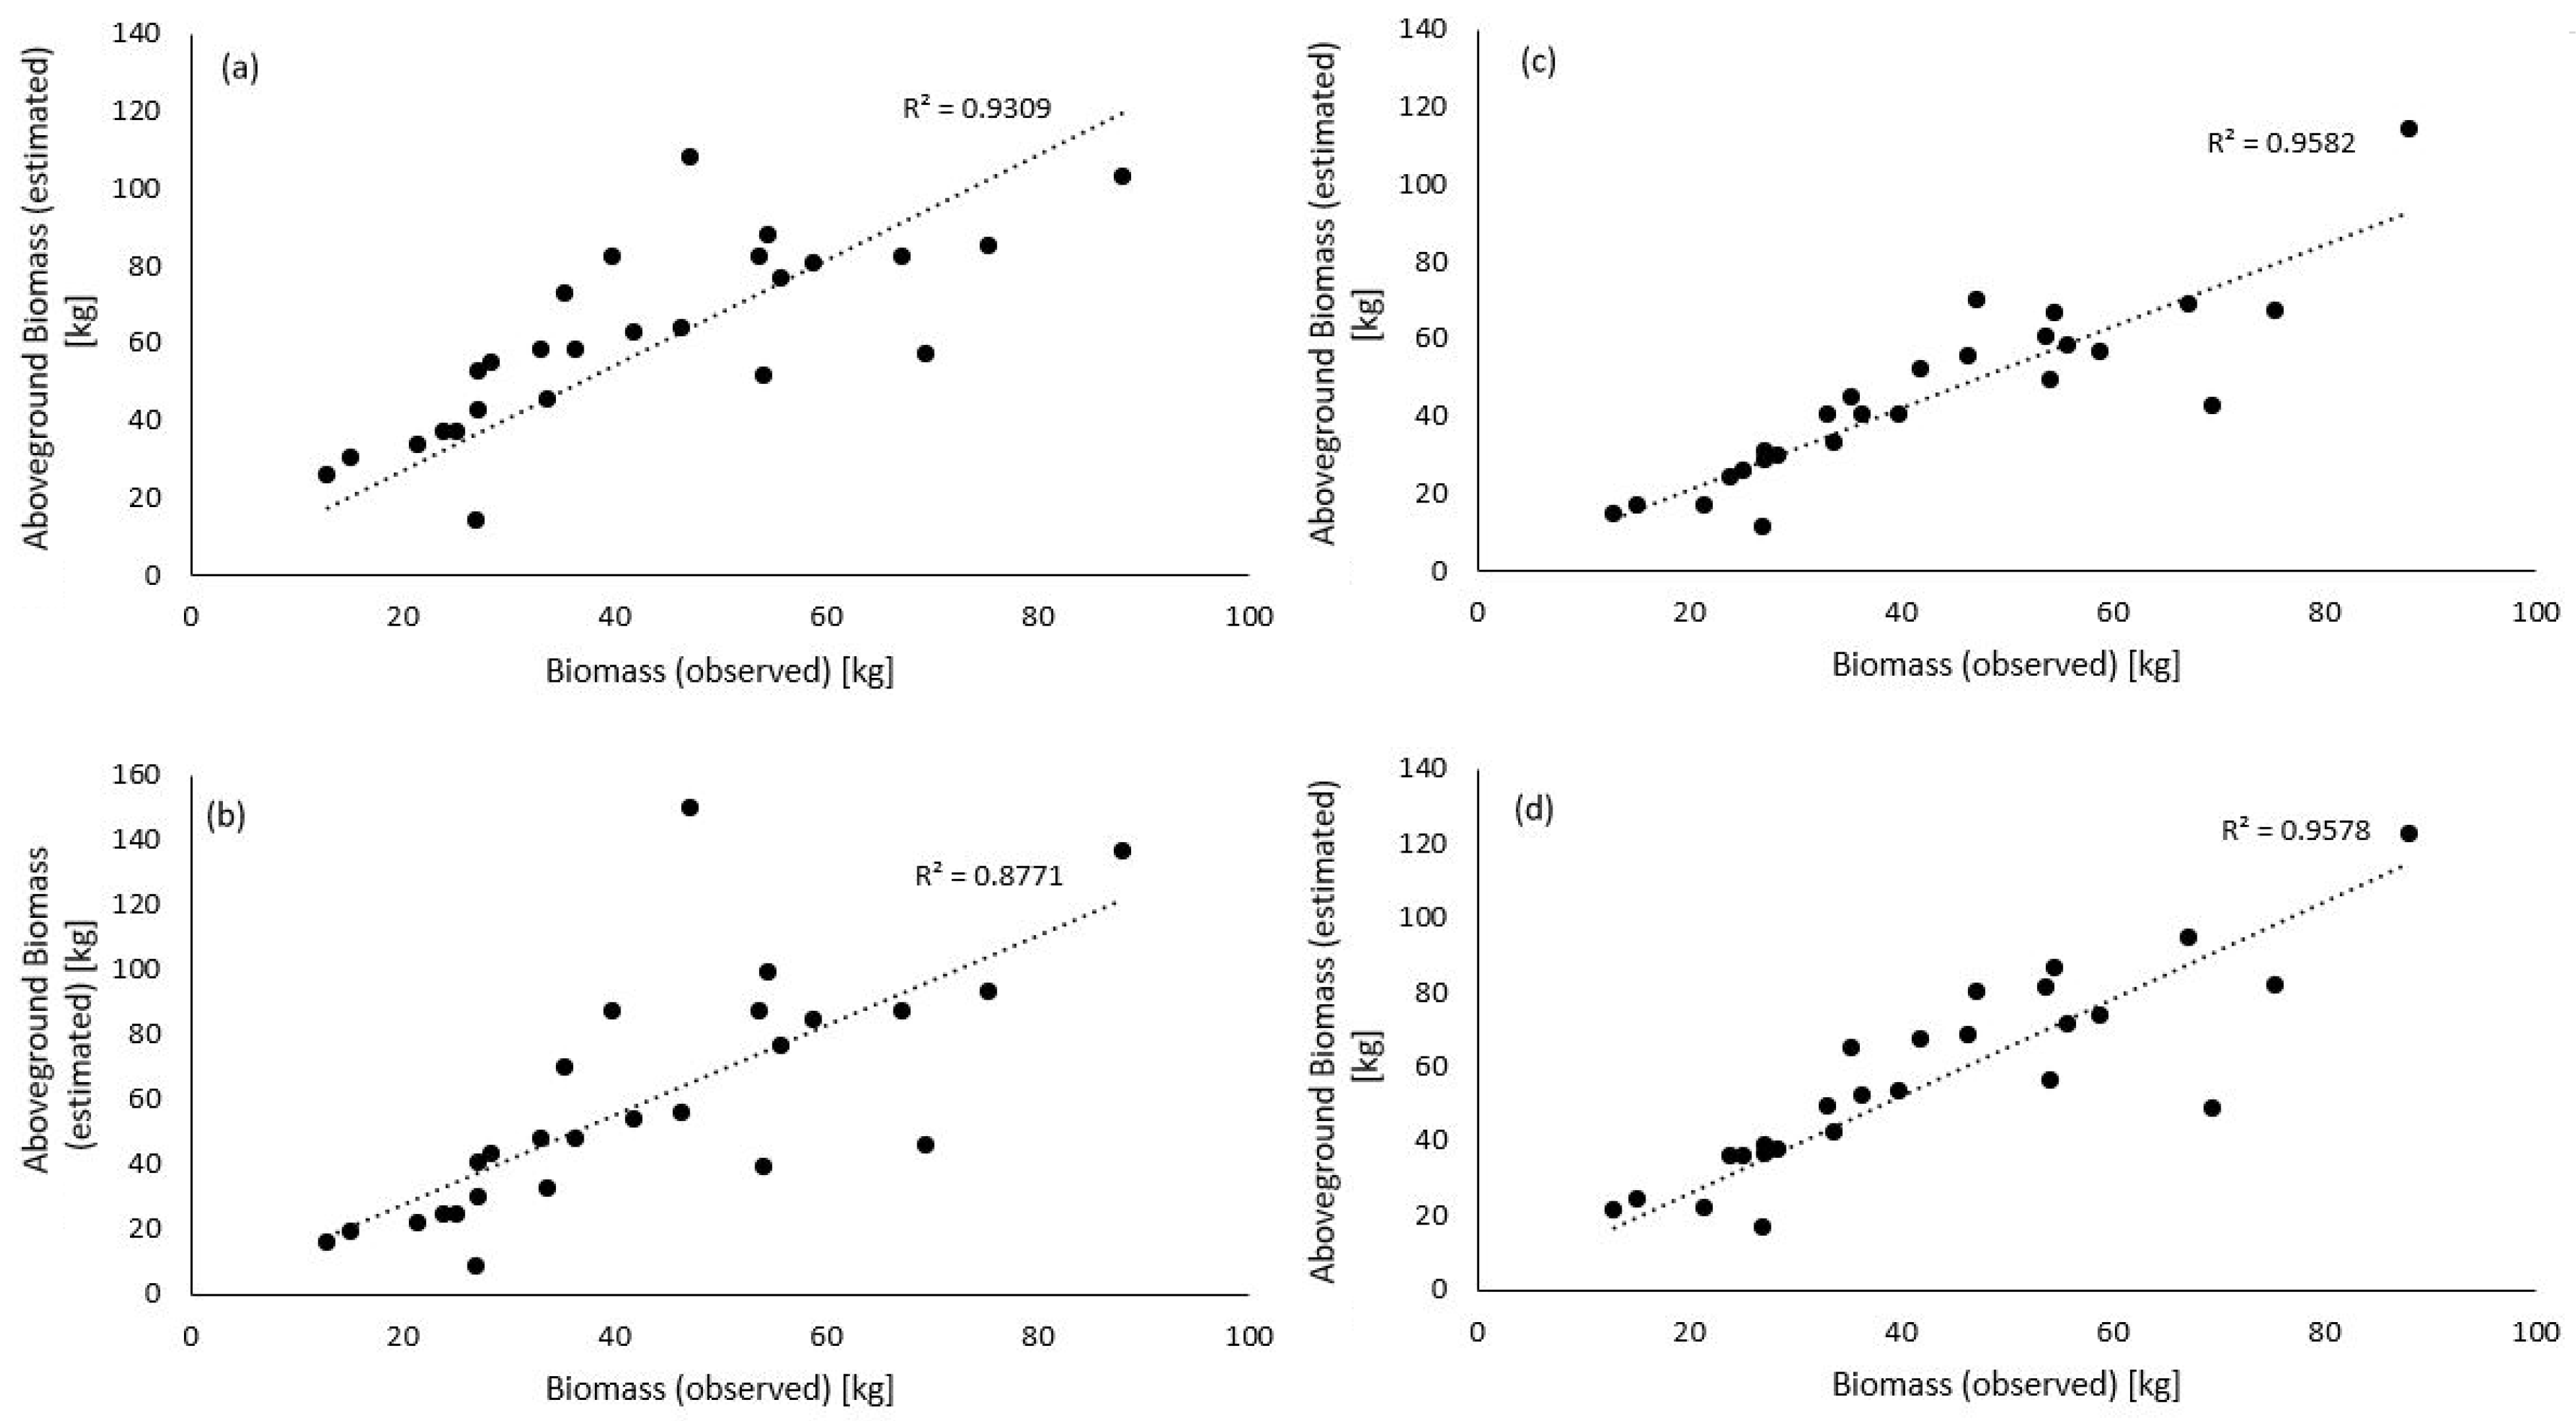
3.4. Biomass Equations

Data fitting of aboveground biomass per tree estimated from different allometric equations (Figure 3) and those measured in the field is greater than 0.85, therefore a suitable fitting can be inferred for all equations. The residuals of the adjustment follow a normal distribution. The general aboveground biomass reported by González [41] obtained the best data fitting, which was R2 of 0.96 (Figure 3c). The Wilcoxon test indicates that three of the equations present significant differences with respect to the biomass values observed (Table 6). Only the general equation (Figure 3c) reported by González [41] presents a p-value above 0.05. Thus, this last one was used for comparing the AGB with the field and UAV data.

3.5. DBH Prediction Model

Table 7 illustrates the different models proposed for dap estimation in the function of crown diameter, together with some precision statistics. The logarithmic model obtained the best statistics, with R2 among the highest and low error and coefficient of variation with respect to the other two models. Therefore, this model was chosen for calculating the AGB from UAV data, since the biomass equation needs the dbh data, which cannot be directly calculated with this technology. Importantly, all models have very low R2, which can affect dap prediction and therefore the amount of aerial biomass calculated with UAV data. A low R2 in the models generated suggests that more data should be incorporated to the model, or that there is no positive correlation between dbh and dc in the silvopastoral system studied.

3.6. Selection of the Orthomosaic

Therefore, as mentioned, direct calculation of dbh by means of UAV is very difficult. Thus, it was necessary to make a model to predict dbh from crown diameters. Flights 2 and 3 allowed a complete orthomosaic of the spacings test studied to be produced, and obtained the best orthomosaic quality, which could not be achieved flying 80 m high from the ground. On the other hand, flight 2 has greater spatial resolution than flight 3, which made crown identification easier in flight 2 (Table 8). Therefore, this flight was used for the measurements of the crown diameter and the heights of the trees.

3.7. Comparison of Aboveground Biomass and Carbon per Tree

Crown diameter measurement was difficult to carry out because the silvopastoral system under study already presented a marked canopy closure, which hindered the precise differentiation of individual tree crowns. Various authors indicate that the precise estimation of the attributes of individual trees may be affected by the delineation method and, largely, by the forest structure studied [57,58,59]. For this reason, crown diameter measurements are more feasible when there is no canopy closure.
There are significant differences between the field method and the UAV method with regard to the values of aboveground biomass and carbon (p-value < 0.0001) (Table 6). In addition, average AGB calculated by means of UAV was lower than average AGB in the field (Table 9). This difference may be due to various sources of variation, i.e., the model used to calculate dbh of trees obtained R2 of 0.51, which means that a large quantity of data are not explained with this model. Another source of variation was the canopy structure (closed canopy), which affects tree identification in the orthomosaic and measurement of crown diameter and tree height, which ultimately impacts the AGB value. Diverse studies worldwide have used different image segmentation logarithms that allow tree identification and better results in calculating crown diameter and tree height [60,61,62,63,64], which was not explored in this research for two main reasons. Firstly, crown segmentation algorithms, as Yun et al. [65] mention, are impacted by several factors, among which the following stand out: precision in detecting the tree crown, the degree of convexity of the upper tree crown and crown intersection of trees resulting from competition. Secondly, Wagner et al. [66] mentions that normally these algorithms are used when working in areas larger than 100 ha, whereas, in small areas, as in the present work, crown identification or delimitation can be performed manually.

4. Conclusions

As no differences were observed in AGB between the spacings studied, in SPS it is convenient to use the spacing that requires a smaller quantity of trees and produces larger sizes, which was achieved with a spacing of 2.5 × 3 m. The comparison between the aboveground biomass (AGB) and carbon from the field data and the data obtained by means of UAV in the silvopastoral system (SPS) showed significant differences. Evidently, the model of prediction of diameter at breast height (dbh) from crown diameter (dc) must be improved in future research, and procedures to improve dc measurement in the UAV-generated orthomosaic should be considered. The use of UAVs in plantations or stands where canopy closure is not marked is recommended, in order to facilitate tree identification in the orthomosaic, crown diameter measurement, and height of the trees. In the case of plantations with high crown coverage, more flight tests at a height of less than 100 m are recommended, as greater spatial resolution would facilitate tree identification. However, the flight carried out at an 80 m height could not be processed in this work; therefore only the photographs corresponding to sampling plots where image processing and measurements on the photos are viable should be processed.

Author Contributions

Conceptualization, J.H.-C., E.O.-M. and R.M.; methodology, J.H.-C., E.O.-M., R.M. and O.M.; validation, J.H.-C.; E.O.-M. and R.M.; formal analysis, J.H.-C.; E.O.-M. and R.M.; investigation, J.H.-C., R.M. and O.M.; resources, R.M.; writing—original draft preparation, J.H.-C.; E.O.-M. and R.M.; writing—review and editing, J.H.-C. SPS availability, E.O.-M. All authors have read and agreed to the published version of the manuscript.

Funding

This research was funded by Vicerrectoría de Investigación y Extensión of the Instituto Tecnológico de Costa Rica.

Institutional Review Board Statement

Not applicable.

Informed Consent Statement

Not applicable.

Acknowledgments

The authors are grateful for the support of the Hacienda Azul S.A., who contributed the materials for this research.

Conflicts of Interest

The authors declare no conflict of interest.

References

  1. Braghiroli, F.L.; Passarini, L. Valorization of Biomass Residues from Forest Operations and Wood Manufacturing Presents a Wide Range of Sustainable and Innovative Possibilities. Curr. For. Rep. 2020, 6, 172–183. [Google Scholar] [CrossRef]
  2. Tursi, A. A review on biomass: Importance, chemistry, classification, and conversion. Biofuel Res. J. 2019, 6, 962–979. [Google Scholar] [CrossRef]
  3. Lauri, P.; Havlik, P.; Kindermann, G.; Forsell, N.; Böttcher, H.; Obersteiner, M. Woody biomass energy potential in 2050. Energy Policy 2014, 66, 19–31. [Google Scholar] [CrossRef]
  4. Smit, A.; Huijgen, W. Effective fractionation of lignocellulose in herbaceous biomass and hardwood using a mild acetone organosolv process. Green Chem. 2017, 19, 5505–5514. [Google Scholar] [CrossRef] [Green Version]
  5. Rosillo-Calle, F. A review of biomass energy—Shortcomings and concerns. J. Chem. Technol. Biotechnol. 2016, 91, 1933–1945. [Google Scholar] [CrossRef]
  6. Tenorio, C.; Moya, R.; Ortiz-Malavassi, E.; Arias, D. Production and Regression Models for Biomass and Carbon Captured in Gmelina arborea Roxb. Trees in Short Rotation Coppice Plantations in Costa Rica. Forests 2019, 10, 593. [Google Scholar] [CrossRef] [Green Version]
  7. Mola-Yudego, B.; Arevalo, J.; Díaz-Yáñez, O.; Dimitriou, I.; Haapala, A.; Filho, A.C.F.; Selkimäki, M.; Valbuena, R. Wood biomass potentials for energy in northern Europe: Forest or plantations? Biomass Bioenergy 2017, 106, 95–103. [Google Scholar] [CrossRef]
  8. Luedeling, E.; Kindt, R.; Huth, N.I.; Koenig, K. Agroforestry systems in a changing climate—challenges in projecting future performance. Curr. Opin. Environ. Sustain. 2014, 6, 1–7. [Google Scholar] [CrossRef] [Green Version]
  9. Viswanath, S.; Lubina, P.A. Traditional Agroforestry Systems. Agroforestry 2017, II, 91–119. [Google Scholar] [CrossRef]
  10. Paciullo, D.S.C.; Pires, M.F.A.; Müller, M.D. Opportunities and challenges of integrated systems in animal pro-duction: Emphasis on silvopastoral systems. Arch. Latinoam. Prod. Anim. 2017, 25, 25–35. [Google Scholar]
  11. Dash, J.P.; Marshall, H.M.; Rawley, B. Methods for estimating multivariate stand yields and errors using k-NN and aerial laser scanning. Forestry 2015, 88, 237–247. [Google Scholar] [CrossRef]
  12. Guerra-Hernández, J.; Cosenza, D.N.; Rodriguez, L.C.E.; Silva, M.; Tomé, M.; Díaz-Varela, R.A.; Gonzalez-Ferreiro, E. Comparison of ALS- and UAV(SfM)-derived high-density point clouds for individual tree detection in Eucalyptus plantations. Int. J. Remote Sens. 2018, 39, 5211–5235. [Google Scholar] [CrossRef]
  13. Couteron, P.; Pélissier, R.; Nicolini, E.A.; Paget, D. Predicting tropical forest stand structure parameters from Fourier transform of very high-resolution remotely sensed canopy images. J. Appl. Ecol. 2005, 42, 1121–1128. [Google Scholar] [CrossRef] [Green Version]
  14. Huang, H.; Gong, P.; Cheng, X.; Clinton, N.; Li, Z. Improving Measurement of Forest Structural Parameters by Co-Registering of High Resolution Aerial Imagery and Low Density LiDAR Data. Sensors 2009, 9, 1541–1558. [Google Scholar] [CrossRef] [PubMed]
  15. Bellarby, J.; Tirado, R.; Leip, A.; Weiss, F.; Lesschen, J.P.; Smith, P. Livestock greenhouse gas emissions and mitigation potential in Europe. Glob. Chang. Biol. 2012, 19, 3–18. [Google Scholar] [CrossRef]
  16. Vermeulen, S.J.; Campbell, B.M.; Ingram, J.S. Climate Change and Food Systems. Annu. Rev. Environ. Resour. 2012, 37, 195–222. [Google Scholar] [CrossRef] [Green Version]
  17. Montagnini, F.; Ibrahim, M.; Restrepo, E.M. Silvopastoral systems and climate change mitigation in Latin America. BOIS For. DES Trop. 2013, 316, 3–16. [Google Scholar] [CrossRef]
  18. Resende, L.D.O.; Müller, M.D.; Kohmann, M.M.; Pinto, L.F.G.; Junior, L.C.; De Zen, S.; Rego, L.F.G. Silvopastoral management of beef cattle production for neutralizing the environmental impact of enteric methane emission. Agrofor. Syst. 2020, 94, 893–903. [Google Scholar] [CrossRef]
  19. Trivelli, L.; Apicella, A.; Chiarello, F.; Rana, R.; Fantoni, G.; Tarabella, A. From precision agriculture to Industry 4.0: Unveiling technological connections in the agrifood sector. Br. Food J. 2019, 121, 1730–1743. [Google Scholar] [CrossRef]
  20. Berie, H.T.; Burud, I. Application of unmanned aerial vehicles in earth resources monitoring: Focus on evaluating potentials for forest monitoring in Ethiopia. Eur. J. Remote Sens. 2018, 51, 326–335. [Google Scholar] [CrossRef] [Green Version]
  21. Tang, L.; Shao, G. Drone remote sensing for forestry research and practices. J. For. Res. 2015, 26, 791–797. [Google Scholar] [CrossRef]
  22. Colomina, I.; Molina, P. Unmanned aerial systems for photogrammetry and remote sensing: A review. ISPRS J. Photogramm. Remote Sens. 2014, 92, 79–97. [Google Scholar] [CrossRef] [Green Version]
  23. Puliti, S.; Ørka, H.O.; Gobakken, T.; Næsset, E. Inventory of Small Forest Areas Using an Unmanned Aerial System. Remote Sens. 2015, 7, 9632–9654. [Google Scholar] [CrossRef] [Green Version]
  24. Moe, K.T.; Owari, T.; Furuya, N.; Hiroshima, T. Comparing Individual Tree Height Information Derived from Field Surveys, LiDAR and UAV-DAP for High-Value Timber Species in Northern Japan. Forests 2020, 11, 223. [Google Scholar] [CrossRef] [Green Version]
  25. Takagi, K.; Yone, Y.; Takahashi, H.; Sakai, R.; Hojyo, H.; Kamiura, T.; Nomura, M.; Liang, N.; Fukazawa, T.; Miya, H.; et al. Forest biomass and volume estimation using airborne LiDAR in a cool-temperate forest of northern Hokkaido, Japan. Ecol. Inform. 2015, 26, 54–60. [Google Scholar] [CrossRef]
  26. Goodbody, T.R.H.; Coops, N.C.; White, J.C. Digital Aerial Photogrammetry for Updating Area-Based Forest Inventories: A Review of Opportunities, Challenges, and Future Directions. Curr. For. Rep. 2019, 5, 55–75. [Google Scholar] [CrossRef] [Green Version]
  27. Lin, J.; Shu, L.; Zuo, H.; Zhang, B. Experimental observation and assessment of ice conditions with a fixed-wing unmanned aerial vehicle over Yellow River, China. J. Appl. Remote Sens. 2012, 6, 063586. [Google Scholar] [CrossRef]
  28. Peña, J.M.; de Castro, A.I.; Torres-Sánchez, J.; Andújar, D.; San Martín, C.; Dorado, J.; Fernández-Quintanilla, C.; López-Granados, F. Estimating tree height and biomass of a poplar plantation with image-based UAV technology. AIMS Agric. Food 2018, 3, 313–323. [Google Scholar] [CrossRef]
  29. Zhou, X.; Zhang, X. Individual Tree Parameters Estimation for Plantation Forests Based on UAV Oblique Photography. IEEE Access 2020, 8, 96184–96198. [Google Scholar] [CrossRef]
  30. Pádua, L.; Vanko, J.; Hruška, J.; Adão, T.; Sousa, J.J.; Peres, E.; Morais, R. UAS, sensors, and data processing in agroforestry: A review towards practical applications. Int. J. Remote Sens. 2017, 38, 2349–2391. [Google Scholar] [CrossRef]
  31. Surový, P.; Ribeiro, N.A.; Panagiotidis, D. Estimation of positions and heights from UAV-sensed imagery in tree plantations in agrosilvopastoral systems. Int. J. Remote Sens. 2018, 39, 4786–4800. [Google Scholar] [CrossRef]
  32. Gutiérrez, Á.G.; Schnabel, S.; Contador, F.L.; De Sanjosé, J.J.; Atkinson, A.D.J.; Fernández, M.P. Studying the influence of livestock pressure on gully erosion in rangelands of SW Spain by means of the UAV+SfM workflow. Boletin de La Asociacion de Geografos Espanoles. BAGE 2018, 78, 66–88. [Google Scholar] [CrossRef]
  33. Kumar, L.; Mutanga, O. Remote Sensing of Above-Ground Biomass. Remote Sens. 2017, 9, 935. [Google Scholar] [CrossRef] [Green Version]
  34. Kumar, L.; Sinha, P.; Taylor, S.; AlQurashi, A.F. Review of the use of remote sensing for biomass estimation to support renewable energy generation. J. Appl. Remote Sens. 2015, 9, 097696. [Google Scholar] [CrossRef]
  35. Serafín, F.A.-M. Potencial de Mejoramiento Genético en Dipteryx Panamensis Pittier (FABACEAE); Tesis de Maestría, Escuela de Ingeniería Forestal: Cartago, Costa Rica, 2018. [Google Scholar]
  36. Murillo, O.; Badilla, Y.; Rojas, F. GENFORES, from TEC to international business development. Investiga-TEC 2010, 9, 10–11. [Google Scholar]
  37. Araya, M.O.; Valverde, Y.B.; Madrigal, W.P.; Granados, C.C.; Gamboa, O.M. Costos de producción de teca (Tectona grandis) y melina (Gmelina arborea) en sistemas silvopastoriles de la zona norte de Costa Rica. Agron. Costarric. 2020, 44, 155–173. [Google Scholar] [CrossRef]
  38. ASTM International. D4442-07: Standard Test Methods for Direct Moisture Content Measurement of Wood and Wood-Base Materials; ASTM International: West Conshohocken, PA, USA, 2007. [Google Scholar]
  39. Pérez Cordero, L.D.; Kanninen, M. Aboveground Biomass of Tectona grandis plantations in Costa Rica. J. Trop. For. Sci. 2003, 15, 199–213. [Google Scholar]
  40. Rodríguez, M.; Arias, D.; Valverde, J.C.; Camacho, D. Ecuaciones alométricas para la estimación de la biomasa arbórea a partir de residuos de plantaciones de Gmelina arborea y Tectona grandis en Guanacaste, Costa Rica. Rev. For. Mesoam. Kurú 2018, 15, 60–66. [Google Scholar] [CrossRef]
  41. González, Z.M. Estimación de la Biomasa Aérea y la Captura de Carbono en Regeneración Natural de Pinus Maximinoi H. E. Moore, Pinus Oocarpa var. Ochoterenai Mtz. y Quercus sp. en el Norte del Estado de Chiapas-Mexico; CATIE: Turrialba, Costa Rica, 2008; pp. 1–97. [Google Scholar]
  42. Chave, J.; Réjou-Méchain, M.; Búrquez, A.; Chidumayo, E.; Colgan, M.S.; Delitti, W.B.; Duque, A.; Eid, T.; Fearnside, P.; Goodman, R.C.; et al. Improved allometric models to estimate the aboveground biomass of tropical trees. Glob. Chang. Biol. 2014, 20, 3177–3190. [Google Scholar] [CrossRef]
  43. Pérez, D.; Kanninen, M. Effect of thinning on stem form and wood characteristics of teak (Tectona grandis) in a humid tropical site in Costa Rica. Silva Fenn. 2005, 39, 217–225. [Google Scholar] [CrossRef] [Green Version]
  44. Ola-Adams, B. Influences of Spacing on Growth and Yield of Tectona grandis LINN.F (TEAK) and Terminalia Superba ENGL. & Diels (AFARA). J. Trop. For. Sci. 1990, 9, 517–519. [Google Scholar]
  45. Pachas, A.N.A.; Sakanphet, S.; Soukkhy, O.; Lao, M.; Savathvong, S.; Newby, J.C.; Souliyasack, B.; Keoboualapha, B.; Dieters, M.J. Initial spacing of teak (Tectona grandis) in northern Lao PDR: Impacts on the growth of teak and companion crops. For. Ecol. Manag. 2019, 435, 77–88. [Google Scholar] [CrossRef]
  46. Tun, T.N.; Guo, J.; Fang, S.; Tian, Y. Planting spacing affects canopy structure, biomass production and stem roundness in poplar plantations. Scand. J. For. Res. 2018, 33, 464–474. [Google Scholar] [CrossRef]
  47. Benomar, L.; DesRochers, A.; Larocque, G.R. Comparing growth and fine root distribution in monocultures and mixed plantations of hybrid poplar and spruce. J. For. Res. 2013, 24, 247–254. [Google Scholar] [CrossRef]
  48. Tenorio, C.; Moya, R.; Arias-Aguilar, D.; Briceño-Elizondo, E. Biomass yield and energy potential of short-rotation energy plantations of Gmelina arborea one year old in Costa Rica. Ind. Crop. Prod. 2016, 82, 63–73. [Google Scholar] [CrossRef]
  49. Hébert, F.; Krause, C.; Plourde, P.-Y.; Achim, A.; Prégent, G.; Ménétrier, J. Effect of Tree Spacing on Tree Level Volume Growth, Morphology, and Wood Properties in a 25-Year-Old Pinus banksiana Plantation in the Boreal Forest of Quebec. Forests 2016, 7, 276. [Google Scholar] [CrossRef] [Green Version]
  50. Sanquetta, C.R.; Mora, A.L.; Borsato, R.; Vidal MA, S.; Peixoto, A.M.; Chiaranda, R. Efeito do espaçamento de plantio em reflorestamentos ii. pinus taeda l. em jaguariaív. Rev. Acadêmica Ciências Agrárias Ambient. 2003, 1, 55–61. [Google Scholar]
  51. Cardoso, D.J.; Lacerda, A.E.B.; Rosot, M.A.D.; Garrastazú, M.C.; Lima, R.T. Influence of spacing regimes on the development of loblolly pine (Pinus taeda L.) in Southern Brazil. For. Ecol. Manag. 2013, 310, 761–769. [Google Scholar] [CrossRef] [Green Version]
  52. Toillon, J.; Fichot, R.; Dallé, E.; Berthelot, A.; Brignolas, F.; Marron, N. Planting density affects growth and water-use efficiency depending on site in Populus deltoides×P. nigra. For. Ecol. Manag. 2013, 304, 345–354. [Google Scholar] [CrossRef]
  53. Saglam, S.; Ozdemir, E.; Ozkan, U.Y.; Demirel, T.; Makineci, E. Biomass estimation of aboveground tree components for Turkey oak (Quercus cerris L.) in south-eastern Turkey. Environ. Monit. Assess. 2020, 192, 1–12. [Google Scholar] [CrossRef] [PubMed]
  54. Widagdo, F.R.A.; Xie, L.; Dong, L.; Li, F. Origin-based biomass allometric equations, biomass partitioning, and carbon concentration variations of planted and natural Larix gmelinii in northeast China. Glob. Ecol. Conserv. 2020, 23, e01111. [Google Scholar] [CrossRef]
  55. Zhou, W.; Cheng, X.; Wu, R.; Han, H.; Kang, F.; Zhu, J.; Tian, P. Effect of intraspecific competition on biomass partitioning of Larix principis-rupprechtii. J. Plant Interact. 2017, 13, 1–8. [Google Scholar] [CrossRef] [Green Version]
  56. Eloy, E.; Da Silva, D.A.; Caron, B.O.; Elli, E.F.; Schwerz, F. Effect of age and spacing on biomass production in forest plantations. Rev. Árvore 2018, 42. [Google Scholar] [CrossRef]
  57. Berra, E. Individual tree crown detection and delineation across a woodland using leaf-on and leaf-off imagery from a UAV consumer-grade camera. J. Appl. Remote Sens. 2020, 14, 1. [Google Scholar] [CrossRef]
  58. Mlenek, D.C.; Corte AP, D.; Rodrigues, D.; Sanqueta, C.R. Systematic Review of Literature on Tree Detection Using Remote Sensing. BIOFIX Sci. J. 2020, 5, 71–79. [Google Scholar] [CrossRef] [Green Version]
  59. Silva, C.A.; Hudak, A.T.; Vierling, L.A.; Loudermilk, E.L.; O’Brien, J.J.; Hiers, J.K.; Jack, S.B.; Gonzalez-Benecke, C.; Lee, H.; Falkowski, M.J.; et al. Imputation of Individual Longleaf Pine (Pinus palustris Mill.) Tree Attributes from Field and LiDAR Data. Can. J. Remote Sens. 2016, 42, 554–573. [Google Scholar] [CrossRef]
  60. Grznárová, A.; Mokroš, M.; Surový, P.; Slavík, M.; Pondelík, M.; Merganič, J. THE CROWN DIAMETER ESTIMATION FROM FIXED WING TYPE OF UAV IMAGERY. ISPRS Int. Arch. Photogramm. Remote Sens. Spat. Inf. Sci. 2019, XLII-2/W13, 337–341. [Google Scholar] [CrossRef] [Green Version]
  61. Guerra-Hernandez, J.; Gonzalez-Ferreiro, E.; Sarmento, A.; Silva, J.; Nunes, A.; Correia, A.C.; Fontes, L.; Tomé, M.; Díaz-Varela, R.A. Short Communication. Using high resolution UAV imagery to estimate tree variables in Pinus pinea plantation in Portugal. For. Syst. 2016, 25, eSC09. [Google Scholar] [CrossRef] [Green Version]
  62. Iizuka, K.; Yonehara, T.; Itoh, M.; Kosugi, Y. Estimating Tree Height and Diameter at Breast Height (DBH) from Digital Surface Models and Orthophotos Obtained with an Unmanned Aerial System for a Japanese Cypress (Chamaecyparis obtusa) Forest. Remote Sens. 2017, 10, 13. [Google Scholar] [CrossRef] [Green Version]
  63. Mohan, M.; Silva, C.A.; Klauberg, C.; Jat, P.; Catts, G.; Cardil, A.; Hudak, A.T.; Dia, M. Individual Tree Detection from Unmanned Aerial Vehicle (UAV) Derived Canopy Height Model in an Open Canopy Mixed Conifer Forest. Forests 2017, 8, 340. [Google Scholar] [CrossRef] [Green Version]
  64. Panagiotidis, D.; Abdollahnejad, A.; Surový, P.; Chiteculo, V. Determining tree height and crown diameter from high-resolution UAV imagery. Int. J. Remote Sens. 2017, 38, 2392–2410. [Google Scholar] [CrossRef]
  65. Yun, T.; Jiang, K.; Hou, H.; An, F.; Chen, B.; Jiang, A.; Li, W.; Xue, L. Rubber tree crown segmentation and property retrieval using ground-based mobile LiDAR after natural disturbances. Remote Sens. 2019, 11, 903. [Google Scholar] [CrossRef] [Green Version]
  66. Wagner, F.H.; Ferreira, M.P.; Sanchez, A.; Hirye, M.C.; Zortea, M.; Gloor, E.; Phillips, O.; Filho, C.R.D.S.; Shimabukuro, Y.E.; Aragão, L.E. Individual tree crown delineation in a highly diverse tropical forest using very high resolution satellite images. ISPRS J. Photogramm. Remote Sens. 2018, 145, 362–377. [Google Scholar] [CrossRef]
Figure 1. Location and design of the silvopastoral system evaluated. Three blocks and three tree spacings (2.5 × 1, 2.5 × 2 and 2.5 × 3). Finca la Vega, San Carlos, Costa Rica. Note: “X” represents spacing between trees (1, 2 or 3 m).
Drones 05 00047 g001
Figure 2. Aboveground biomass (AGB) (a), and Carbon (b) of Tectona grandis trees in the silvopastoral system at three different spacings in Costa Rica.
Drones 05 00047 g002
Figure 3. Relationship between four equations for aboveground biomass estimation and the real biomass of Tectona grandis trees in a silvopastoral system at three different spacings in Costa Rica. Source: (a) aboveground biomass equation adapted from [39]; (b) aboveground biomass equation adapted from [40]; (c) general aboveground biomass equation adapted from [41]; (d) aboveground biomass equation adapted from [42].
Drones 05 00047 g003
Table 1. Characteristics of DJI WAV Phantom 4 Pro model.
UAVFlight Speed and TimeLensCamera
Sensor
Image Size
Phantom 4 Pro model.50 a 72 km/h
20–30 min
Operation
distance: 3 km
FOV 84°
8.8 mm/24 mm
(35 mm format equivalent)
f/2.8-f/11 auto focus at 1 m-∞
1′′ CMOS
Effective pixels: 20M
3:2 Aspect Ratio:
5472 × 3648
4:3 Aspect Ratio:
4864 × 3648
16:9 Aspect Ratio:
5472 × 3078
Table 2. Parameters of flight conditions used for the silvopastoral system in La Vega, Costa Rica.
NameFlight Level (m)Lateral
Overlap (%)
Forward Overlap (%)Layout
Design
Ground Sample
Distance
(cm)
Flight 18070703D2.22
Flight 210070703D2.77
Flight 312070703D3.32
3D layout design is a double grid design.
Table 3. Trees per treatment and hectare and diameter and total height of Tectona grandis trees in the silvopastoral system at three different spacings in Costa Rica.
Spacing (m)Trees/TreatmentTrees/haDiameter at
1.30 m (cm)
Total Height (m)
2.5 × 1.02488817.1 A* (2.6)15.2 A (1.1)
2.5 × 2.01649617.7 A (2.4)15.3 A (1.4)
2.5 × 3.01735719.7 B (1.2)15.0 A (1.6)
* When the letters next to mean are different, then it indicates that there are statistical differences at 95% between spacings and the values between parentheses indicate standard deviation.
Table 4. Biomass in trunk, leaves and branch of Tectona grandis trees in the silvopastoral system at three different spacings in Costa Rica.
Spacing (m)Trunk (kg/ha)Leaves (kg/ha)Branches (kg/ha)Above Ground Biomass (kg/ha)
2.5 × 1.021,067 A* (10,391)1448 A (1044)3550 A (2188)26,065 A (12,965)
2.5 × 2.016,533 A (6684)1079 A (532)3436 A (1374)21,049 A (8239)
2.5 × 3.014,611 A (4188)1057 A (494)3557 A (1652)19,226 A (5615)
* When the letters next to mean are different, then it indicates that there are statistical differences at 95% between spacings and the values between parentheses indicate standard deviation.
Table 5. Biomass in trunk, leaves and branch of Tectona grandis trees in the silvopastoral system at three different spacings in Costa Rica.
Spacing (m)Trunk (kg/tree)Leaves (kg/tree)Branch (kg/tree)Above Ground Biomass (kg/tree)
2.5 × 1.023.1 A* (9.6)1.6 A (1.0)3.8 A (2.2)28.5 A (12.1)
2.5 × 2.033.6 AB (14.1)2.2 A (1.0)6.9 AB (2.6)42.7 AB (17.0)
2.5 × 3.040.8 A (11.3)2.9 A (1.3)9.9 B (4.6)53.7 B (15.2)
* When the letters next to mean are different, then it indicates that there are statistical differences at 95% between spacings and the values between parentheses indicate standard deviation.
Table 6. Comparison between the aboveground biomass (observed) and the aboveground biomass per tree (estimated) with the different equations.
Above Ground Biomass (Observed)Pérez and Kanninen Equation [39]Rodríguez et al. Equation [40]General
Equation [41]
Chave et al. Equation [42]
Average42.360.958.444.6
Pvaluen/a<0.00010.00370.2807
Significancen/a****
n/a: not applicable; *: significant differences at 95%; **: no significant differences at 95%.
Table 7. Proposed models for estimating dbh for Tectona grandis trees in the silvopastoral system at three different spacings in Costa Rica.
ModelR2SyxFISe%CV
dbh = 9.76 + 2.65 × dc0.451.830.451.8310.02
dbh = 7.70 + 9.20 × ln (dc)0.511.740.511.749.48
dbh = 2.29 × dc0.520.530.090.471.799.78
dbh (cm): diameter at 1.30; dc (m): crown diameter; R2: coefficient of determination; Syx: standard error; FI: fit index; Se: standard error in real units; %CV: coefficient of variation.
Table 8. Ground sample distance (GSD), Orthomosaic area and Orthomosaic quality.
FlightGround Sample
Distance (GSD)
Orthomosaic AreaOrthomosaic
Quality
1PFPFPF
22.774.701
33.324.651
PF: Processing failed in the software.
Table 9. Comparison between aboveground biomass and carbon of field data and UAV data.
ParameterAGB Field (kg/tree)AGB UAV (kg/tree)Carbon Field (kg/tree)Carbon UAV (kg/tree)
Average113.5386.1852.3239.71
p-value<0.0001 *<0.0001 *
* means significant differences at 95%.
Publisher’s Note: MDPI stays neutral with regard to jurisdictional claims in published maps and institutional affiliations.

