
Drones Classification by the Use of a Multifunctional Radar and Micro-Doppler Analysis


1
Department of Electronic Engineering, Tor Vergata University, Via del Politecnico 1, 00133 Rome, Italy
2
Rheinmetall Italia S.p.A, Via Affile 102, 00131 Rome, Italy
*
Author to whom correspondence should be addressed.
Drones 2022, 6(5), 124; https://0-doi-org.brum.beds.ac.uk/10.3390/drones6050124
Submission received: 29 April 2022
/
Revised: 6 May 2022
/
Accepted: 7 May 2022
/
Published: 11 May 2022
(This article belongs to the Special Issue Advances in UAV Detection, Classification and Tracking)
Abstract
:The classification of targets by the use of radars has received great interest in recent years, in particular in defence and military applications, in which the development of sensor systems that are able to identify and classify threatening targets is a mandatory requirement. In the specific case of drones, several classification techniques have already been proposed and, up to now, the most effective technique was considered to be micro-Doppler analysis used in conjunction with machine learning tools. The micro-Doppler signatures of targets are usually represented in the form of the spectrogram, that is a time–frequency diagram that is obtained by performing a short-time Fourier transform (STFT) on the radar return signal. Moreover, frequently it is possible to extract useful information that can also be used in the classification task from the spectrogram of a target. The main aim of the paper is comparing different ways to exploit the drone’s micro-Doppler analysis on different stages of a multifunctional radar. Three different classification approaches are compared: classic spectrogram-based classification; spectrum-based classification in which the received signal from the target is picked up after the moving target detector (MTD); and features-based classification, in which the received signal from the target undergoes the detection step after the MTD, after which discriminating features are extracted and used as input to the classifier. To compare the three approaches, a theoretical model for the radar return signal of different types of drone and aerial target is developed, validated by comparison with real recorded data, and used to simulate the targets. Results show that the third approach (features-based) not only has better performance than the others but also is the one that requires less modification and less processing power in a modern multifunctional radar because it reuses most of the processing facility already present.
1. Introduction
The identification of targets by radar has become a subject of great interest in recent years. The main motivations for the growth of this interest are related to the increased number of applications in which the target identification and classification could be useful: the ability to classify and identify targets is an important aspect in air traffic surveillance and in modern military applications. These applications require sensor systems able to identify threatening targets with high reliability and precision [1]. Thus, the target classification activity, that consists of giving to the system the ability to associate an object to a given class of targets, is a main area of development in both civil and defence systems.
Concerning the specific case of drone classification, radars are capable of detecting at longer ranges than other sensors and perform reliably in all weather conditions at any time of the day [2]. Moreover, modern multifunctional radars (MFR) have been developed recently and are able to perform several operations by dedicating specifically adapted waveforms to different tasks, including the target classification task [3,4]. Thus, with modern radar technologies, it is possible to perform the target classification task along with all the other classic radar operations, such as surveillance and tracking.
Concerning military and defence applications, several types of threat exist and today is mandatory to distinguish between aircraft and drones. In particular, fixed-wings (FW) aircraft and rotary-wings (RW) aircraft, such as helicopters, must be distinguished from drones. In fact, the increased military and civil use of drones and the possibility to use them as threatening weapons have caused drone’s detection and identification to be an important matter of public safety.
Radar sensors for drone tracking and classification have been extensively studied in the past [5,6,7] and several target identification and classification techniques are discussed in the literature [8]. Up to now, the most effective technique was considered to be the micro-Doppler analysis [9,10,11,12] that, used in conjunction with machine learning classification tools, allows researchers to solve target classification problems [13,14,15,16,17].
A micro-Doppler signature of a target is created when specific components of an object move with respect to the main body of the object itself, such as the rotating blades of a flying helicopter [9] or of a drone.
The micro-Doppler signatures of targets are usually represented in the form of the spectrogram, that is a time–frequency diagram that is obtained by performing a short-time Fourier transform (STFT) on the radar return signal [10]. Using a spectrogram, it is usually possible to extract useful information that can be used in the classification task, such as the spectrum width, that allows researchers to distinguish the rotary wings from the fixed wings, or the time distance between the vertical lines in the spectrograms, referred to as blade flashes, that is related to the rotation rate of the propeller blades.
Even in the case of the drones, that have very short and thin blades, the rotation of the propeller blades is sufficient to generate clear micro-Doppler signatures. In particular, the works in [5,6,18] showed that an analysis of the radar return can be used to distinguish drones from birds.
The final scope of this work is finding the best way to integrate a target classification task (with particular attention to the distinction of the drone from the other objects) into a multifunctional (not dedicated) radar. In multifunctional radars, the classification task is only one of the tasks of the radar (e.g., together with surveillance tasks, tracking tasks, etc.) and it is subjected to many constraints, such as, for example, a maximum time on-target, the computational power, the signal processing capabilities, etc. On the other hand, in MFR, some signal filters or signal processing facilities are already present for other purposes (see the following section) and can be reused for the target classification task without any additional cost.
To better understand which is the best possible approach and where to perform the target classification in a multifunctional radar, a comparison of three possible methods based on neural network classification applied at different stages of the radar processing chain was performed, also taking into account the processing block already present in the radar.
Summing up, the main aims and contributions of this paper are:
- A detailed model for the received radar signal from a drone is derived from the model presented in [19], where only a single blade was considered: in the new model, a given number of blades, rotors, and the body are considered, and the elevation angle under which the drone is seen by the radar is taken into account. The proposed model fits with real recorded data found in the literature and with signals recorded by a real multifunctional by Rheinmetall. Finally, this model is useful to train the machine learning algorithms and to simulate the radar signals;
- Three different approaches of classification suitable for a multifunctional radar are compared: exploiting the spectrogram of the target, exploiting the spectrum of the target, and exploiting a small number of features (extracted from the spectrum). Each approach is analytically derived from the signal model and a neural network classifier is trained and tested. The comparison of the different radar drone classification methods is the goal of the paper and, to the best knowledge of the authors, this has not been performed before for this type of radar. To simplify the comparison and to better understand the results, a well-known and simple neural network classifier is used; a more complex and high-performance classification algorithm will be selected in a future work.
The paper is organized as follows. In Section 2, the radar signal model is derived and the radar processing approach is introduced. In Section 3, the proposed model is compared with some past recorded data and with real data coming from the real multifunctional radar, where the classification task will be implemented. In Section 4, the three different approaches are evaluated using a neural network classifier and, last, some discussions and conclusions are reported in Section 5.
2. Radar Signal Model for Drones and Aircraft
In order to derive the characteristics of the drone to be used for the micro-Doppler-based target classification, the first step is the development of a mathematical model of the radar return.
Simply representing a generic radar signal with its analytic vector, as follows:
the echo of a simple scatterer is usually represented as follows (neglecting the delay due to the propagation):
where and . A and are the amplitude and the frequency of the transmitted waveform and and are the received amplitude (related to the distance of the target and to its capability to reflect the radio frequency signals) and the Doppler frequency due to the target radial velocity.
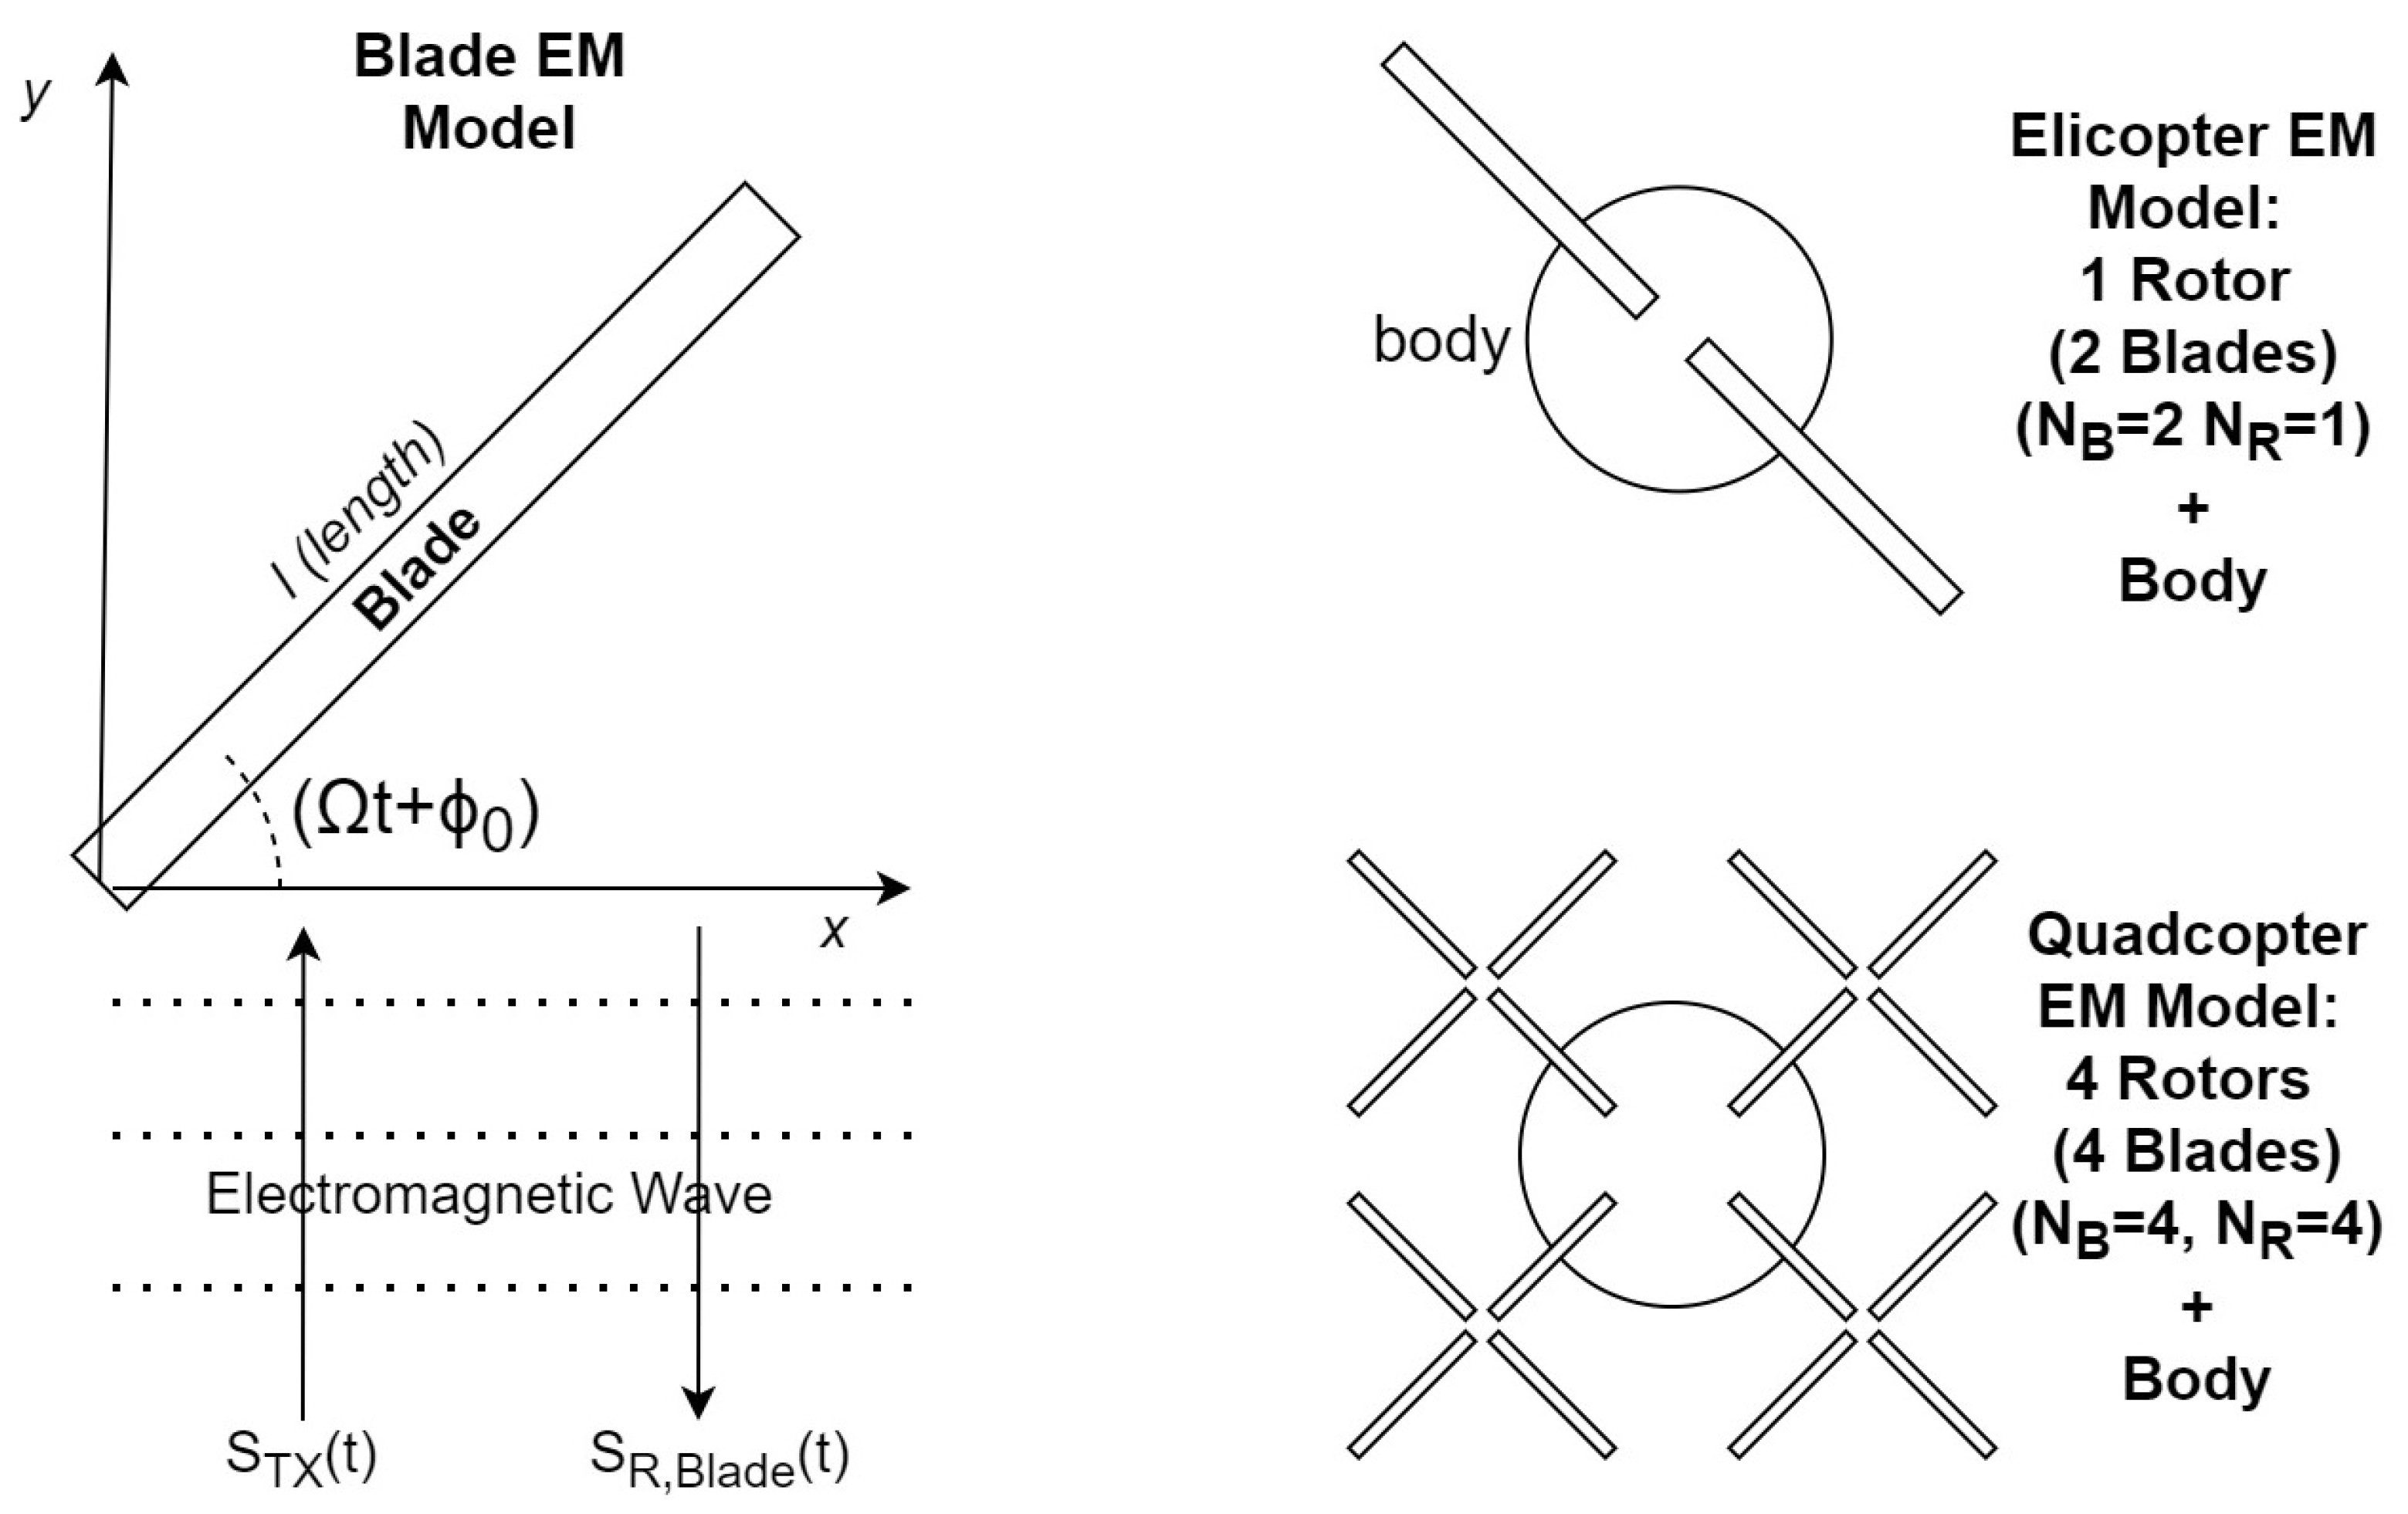
A mathematical model of the signal back-scattered by a single rotating rotor blade can be derived, as discussed in [19], modelling a blade as a stiff rod of a length, L, that changes its orientation in time due to its rotation velocity (see Figure 1).
During the time, t, it is seen under different angles by the radar:
with as the angular frequency of the radar transmitted wave, t as the time, c as the velocity of light, as the wavelength, as the initial phase of the rotor blade, and as the rotation rate of the rotor blade.
The model directly computes the total received signal of each part of the rod, by coherent integration on its length. The position of the rod change (and also the integral limits) due to its rotation.
In this paper, the model in (3) is improved by considering also the dependence on the elevation angle under which the rod is seen and, moving to base-band:
Now, considering a rotor with blades, in which each blade has its own initial rotation angle :
Before generalizing the model of a rotor to the model of a drone it must be noted that this formulation is more general and accurate then many other rotor models that are usually based on the derivation given in [9]. In fact, this model not only includes the dependency on the vertical aspect angle of the blade, but also the includes dependency of the reflected signal on the blade horizontal aspect angle. In particular, the reduction in the blade reflecting area is taken into account solving the integral in the interval .
Observing both the formulations, it is possible to understand that the instantaneous Doppler frequency shift induced by the k-th blade is a sinusoidal contribution, representing the fact that the Doppler frequency is modulated by the rotation rate through sinusoidal functions. Moreover, concerning the amplitude of the received signal in (5), the maximum level occurs when the blade is orthogonal to the radar beam, then the amplitude tends to drop sharply while the blade rotates. When the blade is orthogonal to the radar, it is possible to appreciate the presence of blade flashes, that are vertical lines in the time–frequency diagram of the rotating blades.
Finally, concerning the spectrum of a rotor with blade, it can be represented, as described in [20], with the following expression:
with f as the frequency of the transmitted signal, as the Doppler frequency, and as the frequency of rotation of the blade. The coefficient has a complex expression that depends on the number of blades, on the blade length, on the angle between the plane of rotation of the blade and the line of sight of the radar and on the wavelength. The important consideration is that, according to the expression in (6), the spectrum of rotating rotor blades is a train of Diracs, being the received signal periodic in the time-domain. Thus, the distance between the frequency Diracs in the spectrum is related to the distance between the blade flashes in the spectrogram and, consequently, to the rotation rate . It follows that, in principle, the information derivable from the phase term of the returned signal can be used to derive the target characteristics and, taking some measurements on the spectrogram or on the spectrum of the target, it is possible to estimate some of the physical parameters representative for the target. A summary of the relationship between the signal, spectrogram, and spectrum parameters with the target physical characteristics is reported in Table 1.
Coming back to the model in (5), it can be used to represent a drone with more than one rotor (see Figure 1): considering a given number of rotors , with blades each, (5) becomes:
This model is valid for a generic continuous-wave signals reflected by a target.
In order to match the model in (7) to the case of a multifunctional pulsed radar, the typical radar processing chain and radar waveform parameters must be considered.
The generic radar processing chain is reported in Figure 2. The radar transmits a sequence of pulses and their echoes (produced by the target) are received from the radar receiver. In a modern radar, the echoes of the same target are processed together to improve the radar performance. Each echo of the target is related to the target properties.
Having N echoes coming from the same target, the most used approach is to process them together with the following steps (after the base-band conversions):
- Cancel the echoes from the ground by the use of a moving target indicator (MTI) that is a sort of notch filter centred at zero frequency;
- Distinguish between targets that have different radial velocities (moving target detector MTD) that is typically implemented by the use of a fast Fourier transform of the incoming signals;
- Last, the detection phase, compare the output of the MTD with a threshold to declare whether the target is present or not at a given Doppler frequency (constant false alarm rate—CFAR—detector).
In this context, the classification of the target can be performed at different levels exploiting part of the processing block already present in a multifunctional radar.
The first proposed approach (the most used in the literature [10]) is the spectrogram-based classification, in which the received signal from the target goes directly into a separated chain that implements the STFT processor (block in green in Figure 2). Once the spectrogram of the received signal is available, it can be used to classify the target with any classification algorithm. This approach needs a dedicated processing chain that computes the STFT from the raw data.
The second proposed approach is a spectrum-based classification (block in red in Figure 2), in which the signal representing the target is picked up after the moving target indicator (MTI) and moving target detector (MTD) blocks. This can be performed because, in its most simple implementation, the MTD gives the discrete Fourier transform samples of the received signal, that is, it gives the target spectrum, which is useful to perform the classification task.
The third proposed approach is a features-based classification, in which discriminating features are extracted after the radar detection mechanism. In that case, the received signal from the target undergoes into all the processing steps. The CFAR is used to appropriately set a threshold on the received signal spectrum and to declare whether a target is present and, if there, in which velocity windows (i.e., which spectrum line) it falls. Observing in which spectrum lines the detections fall, it is still possible to extract some features (for example, the spectrum width, etc.) that can be used to classify the target (block in blue in Figure 2).
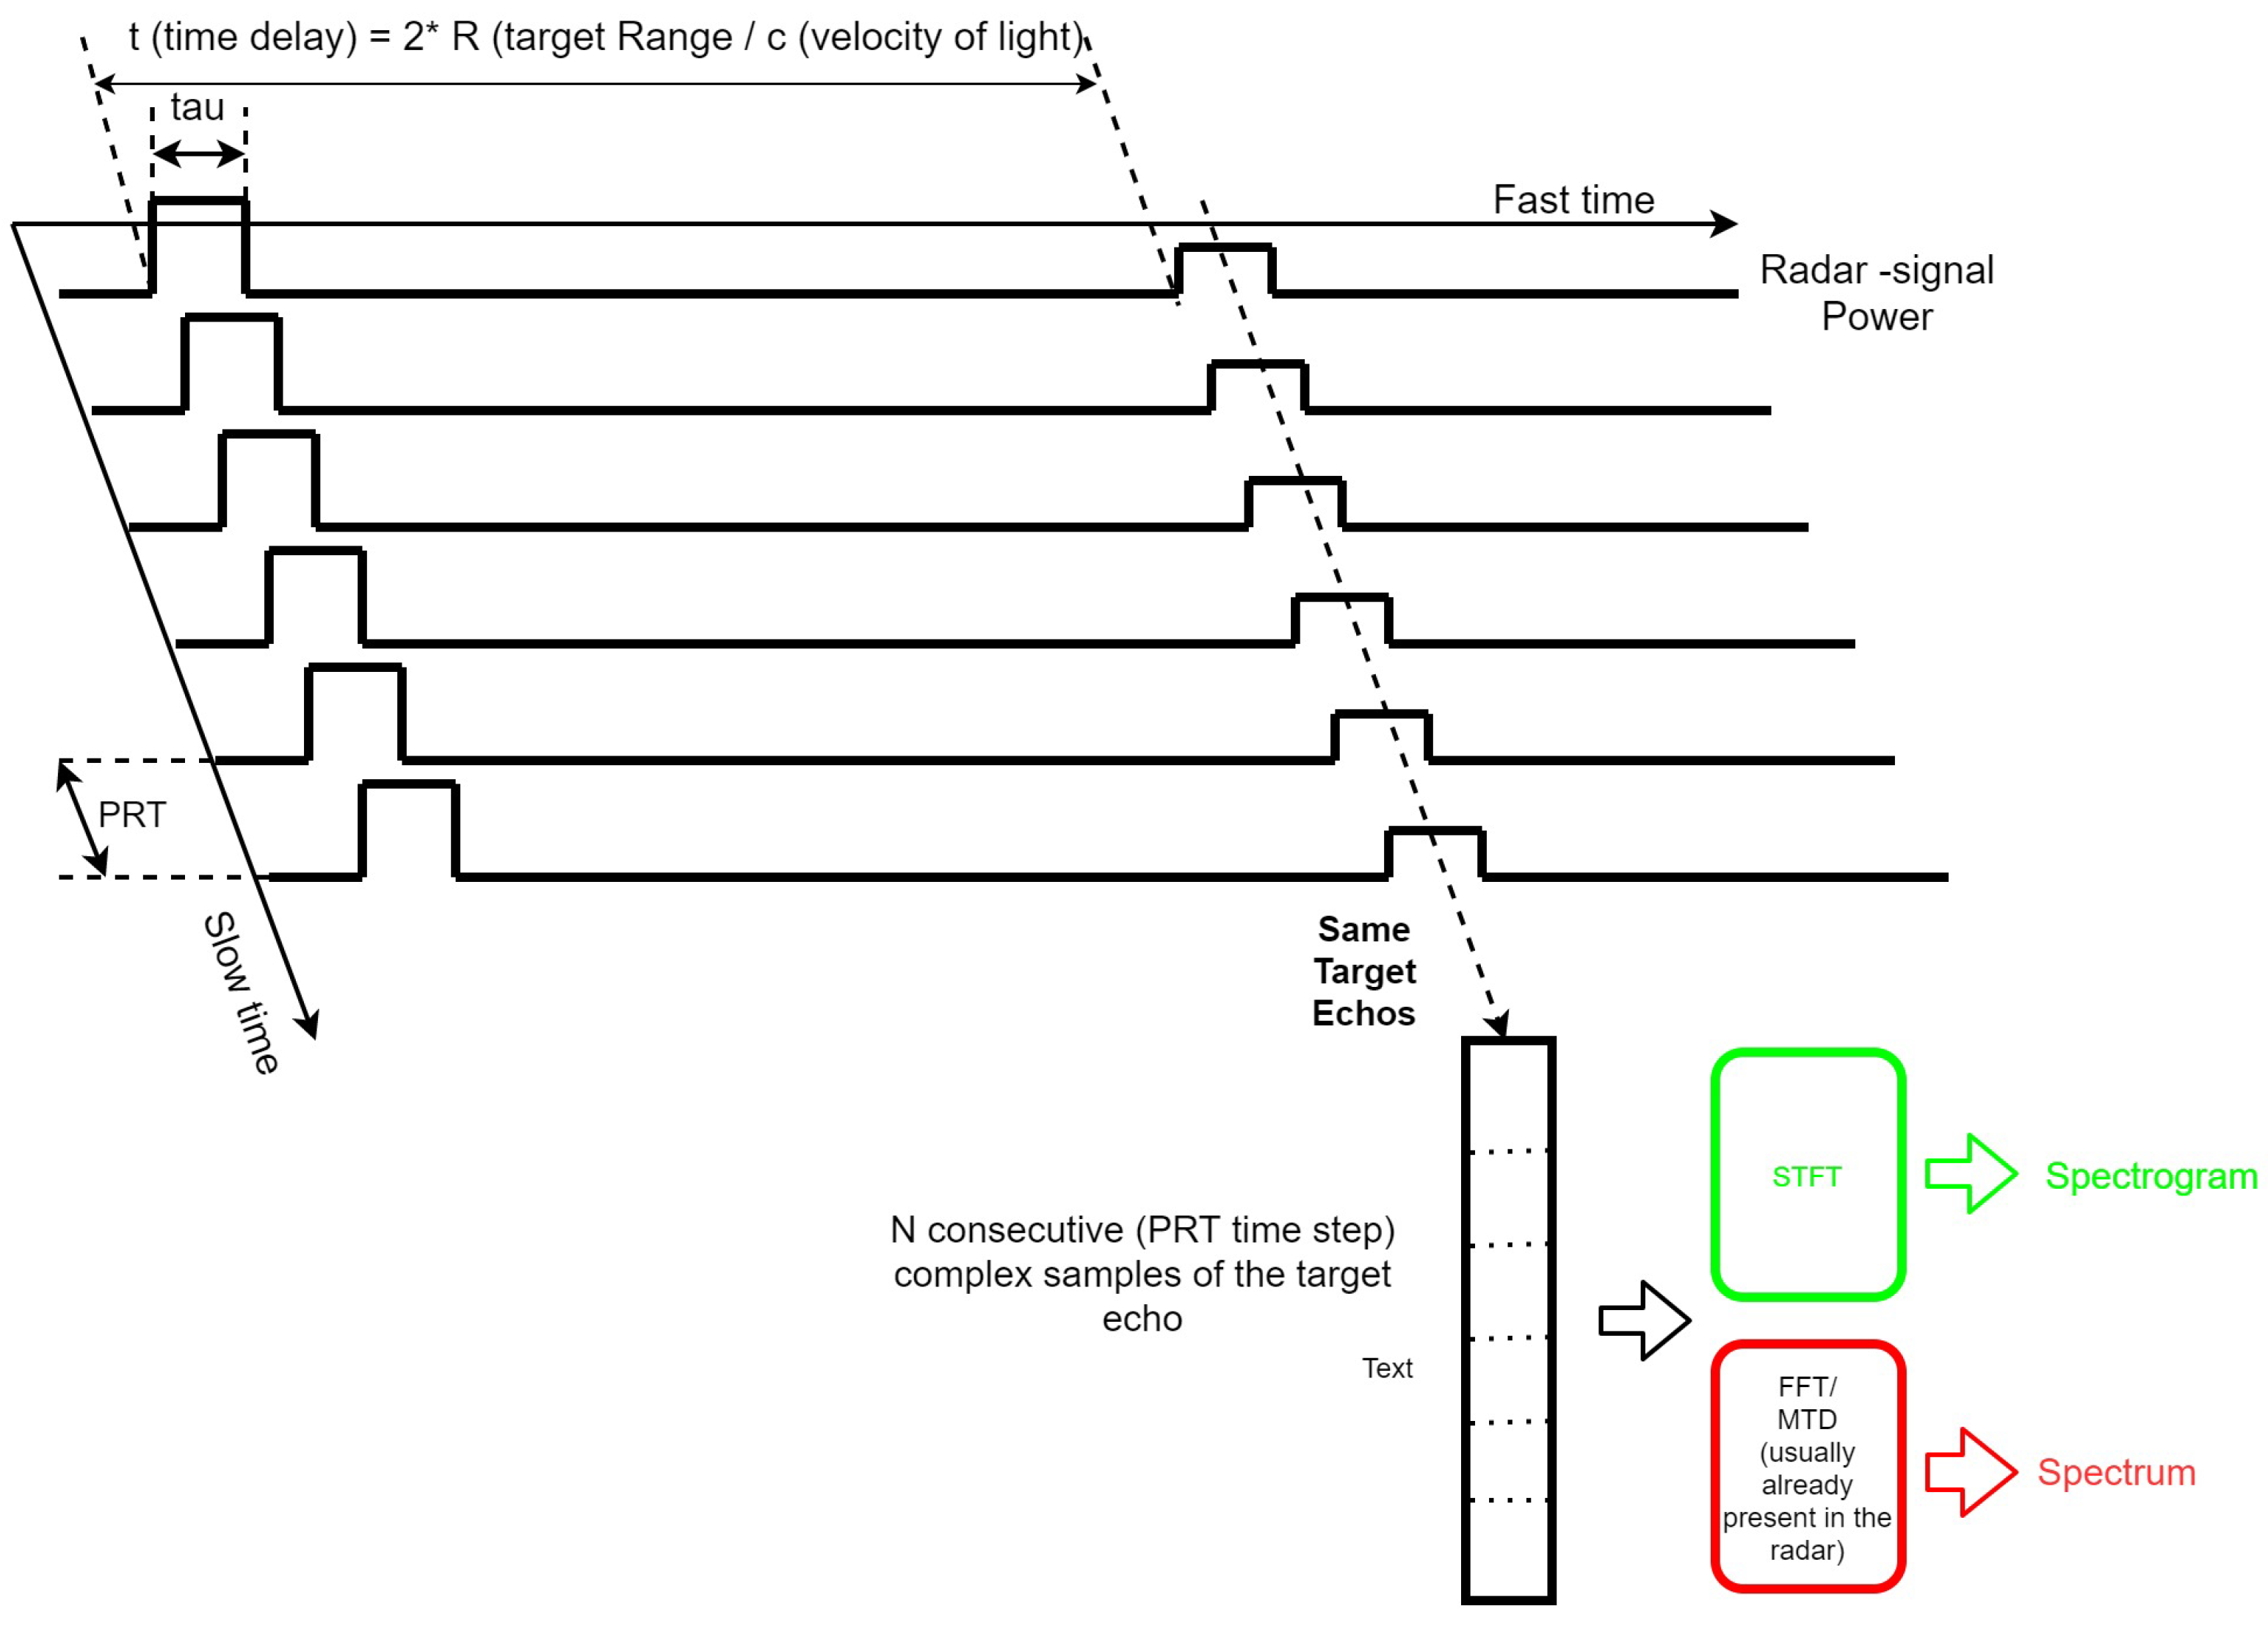
As described before, pulsed radars transmit pulses with nominal pulse width, , of the order of microseconds, at regular intervals in time called pulse repetition time——of the order of milliseconds. In that case, confusing the pulse shape with a Dirac, the echo signal from the target can be considered as sampled with sampling rate equal to PRT (see Figure 3):
Finally, the non-rotating part of the drone must also be considered and, adding the body with its own Doppler frequency, , due to the target radial velocity, the model of the received signal becomes:
with
In (9), the terms and represent the fractional part of the total RCS of the blades and of the body of the drone, respectively, and . The radar cross section (RCS) of the target is the capability of the target to back-scatter the incoming signal [3], it depends on several parameters, such as the direction of the incident wave, the polarization of the incident wave, the material of which the target is made, the wavelength, and many others.
As shown in the following, this model can be used to represent both drones and aircraft by appropriately defining their parameters, such as the number of rotors, the length of the blades, the rotation rate of the rotors, the relative dimension (in terms of RCS) of the body and of the blades, etc.
3. Model Comparison with Real Recorded Data
The proposed model was evaluated by comparison with both data coming from the analysis of the literature and real recorded data. In particular, once defined the type of target, the model can be used to simulate the target echo and the related spectrogram and/or spectrum.
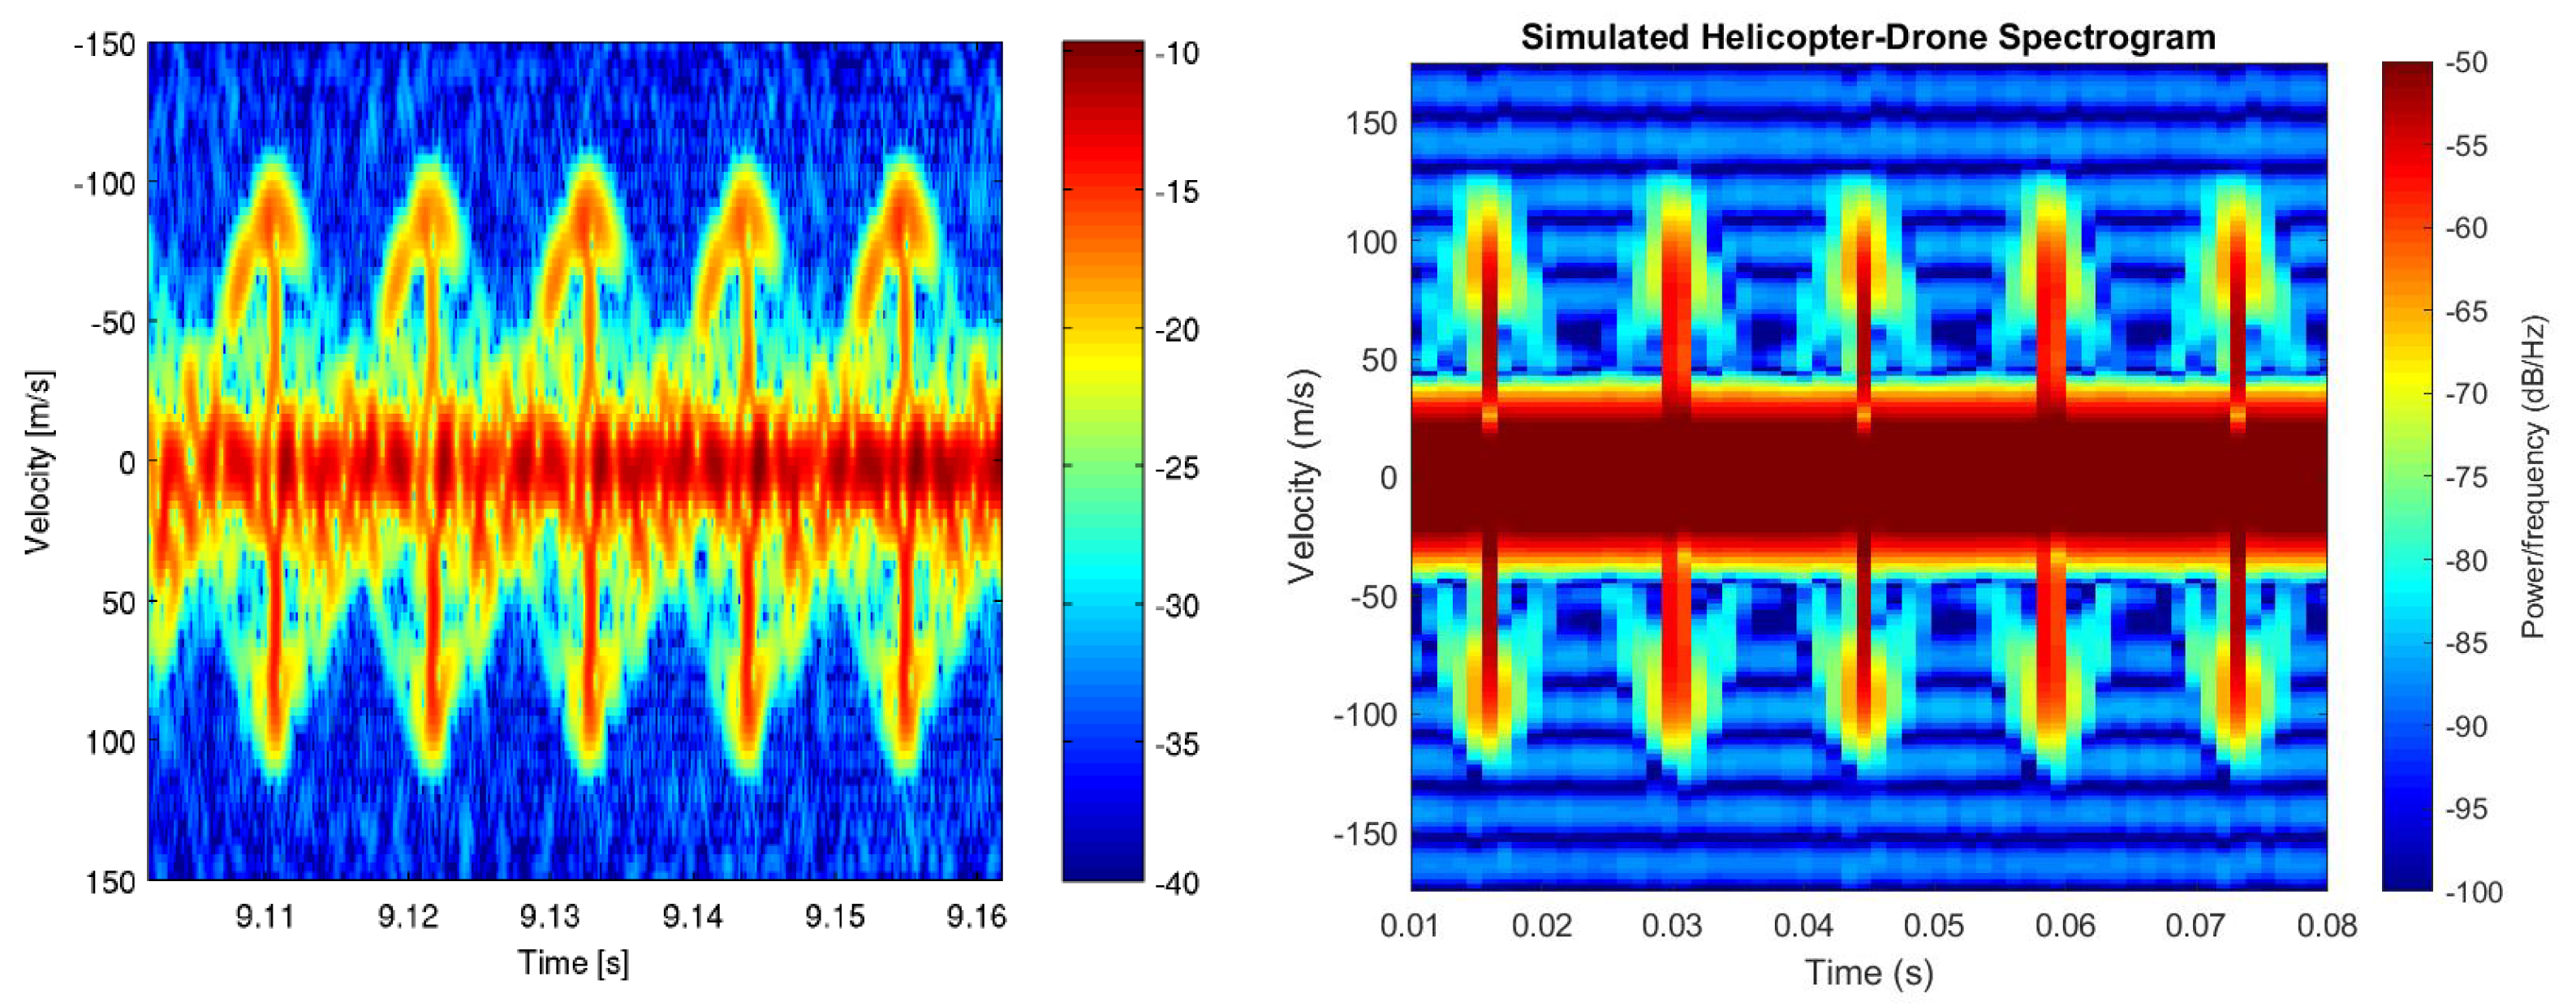
A comparison of a real T-REX 450 single-rotor helicopter drone with blades, from the work in [21], with the simulated helicopter drone spectrogram, by using the proposed model, is shown in Figure 4. The real T-REX 450 helicopter drone is characterized by a blade length about cm and a rotation rate of the rotor blades about rev/s. In the spectrograms, it is possible to note the sinusoidal modulation due to the blades rotation; moreover, when the blade is orthogonal to the radar view, a blade flash appears, while for other angles, the amplitude drops sharply. As mentioned before, the amplitude of the sinusoidal modulation is related to the blade tip and the distance between the blade flashes is related to the rotation rate of the rotor blades.
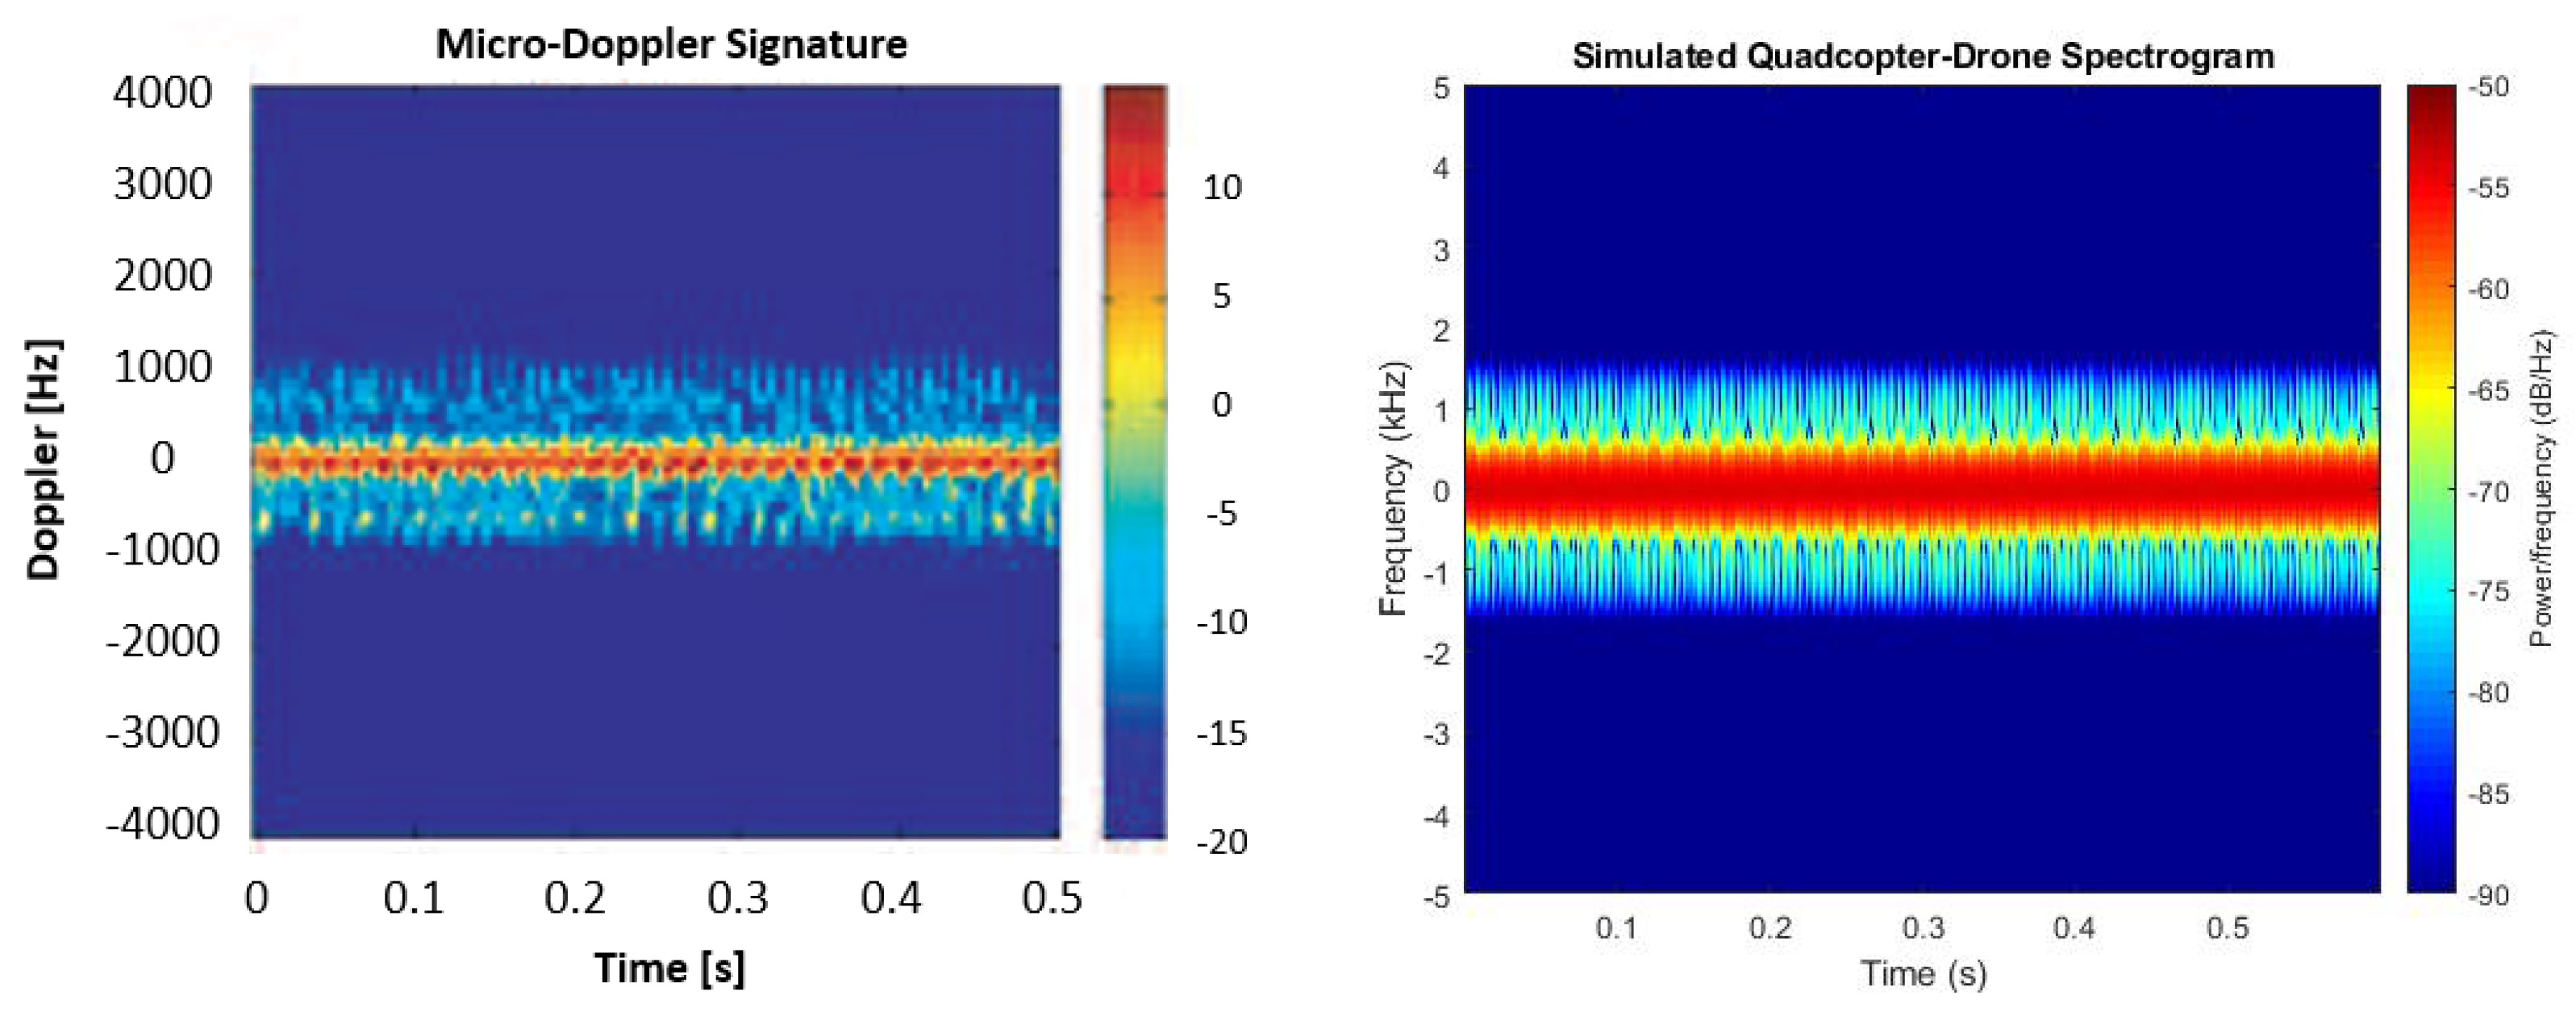
Another comparison is reported in Figure 5 where the spectrogram of a real quadcopter drone with blades for each rotor, from the work in [22], is compared with the simulated quadcopter drone spectrogram, by using the proposed model. The real quadcopter drone is characterized by a blade length about cm and a rotation rate of the rotor blades about rev/s. In the spectrograms it is possible to appreciate the contribution of the main body, centred at the Doppler frequency Hz, and the micro-Doppler contributions of the blades represented by the blade flashes.
Note that, in general, the time resolution and the frequency resolution that characterize the spectrogram of a target are related to the radar waveform parameters introduced in the previous section. In particular, by computing the STFT with a window of N pulses that is shifted of pulses at each FFT computation, the spectrogram resolutions have the following expressions:
With fixed N, if the PRT is increased, then the time resolution gets worse, up to the loss of the blade flashes information in the spectrogram; instead, if the PRT is reduced, then the frequency resolution gets worse, up to the loss of the ability to discriminate the micro-Doppler contributions from the Doppler contribution of the body.
Thus, in general, it is important to find the best trade-off on the radar waveform parameters in order to preserve the characteristics of the spectrogram. In the particular case of a multifunction radar the time available to perform the task and the PRF have both an upper limit and this will limit the resolution of the spectrum and spectrogram that can be obtained with the radar (for example see the spectrograms reported in Figure 6, where the PRF and total time of observation has some restriction due to the radar setting).
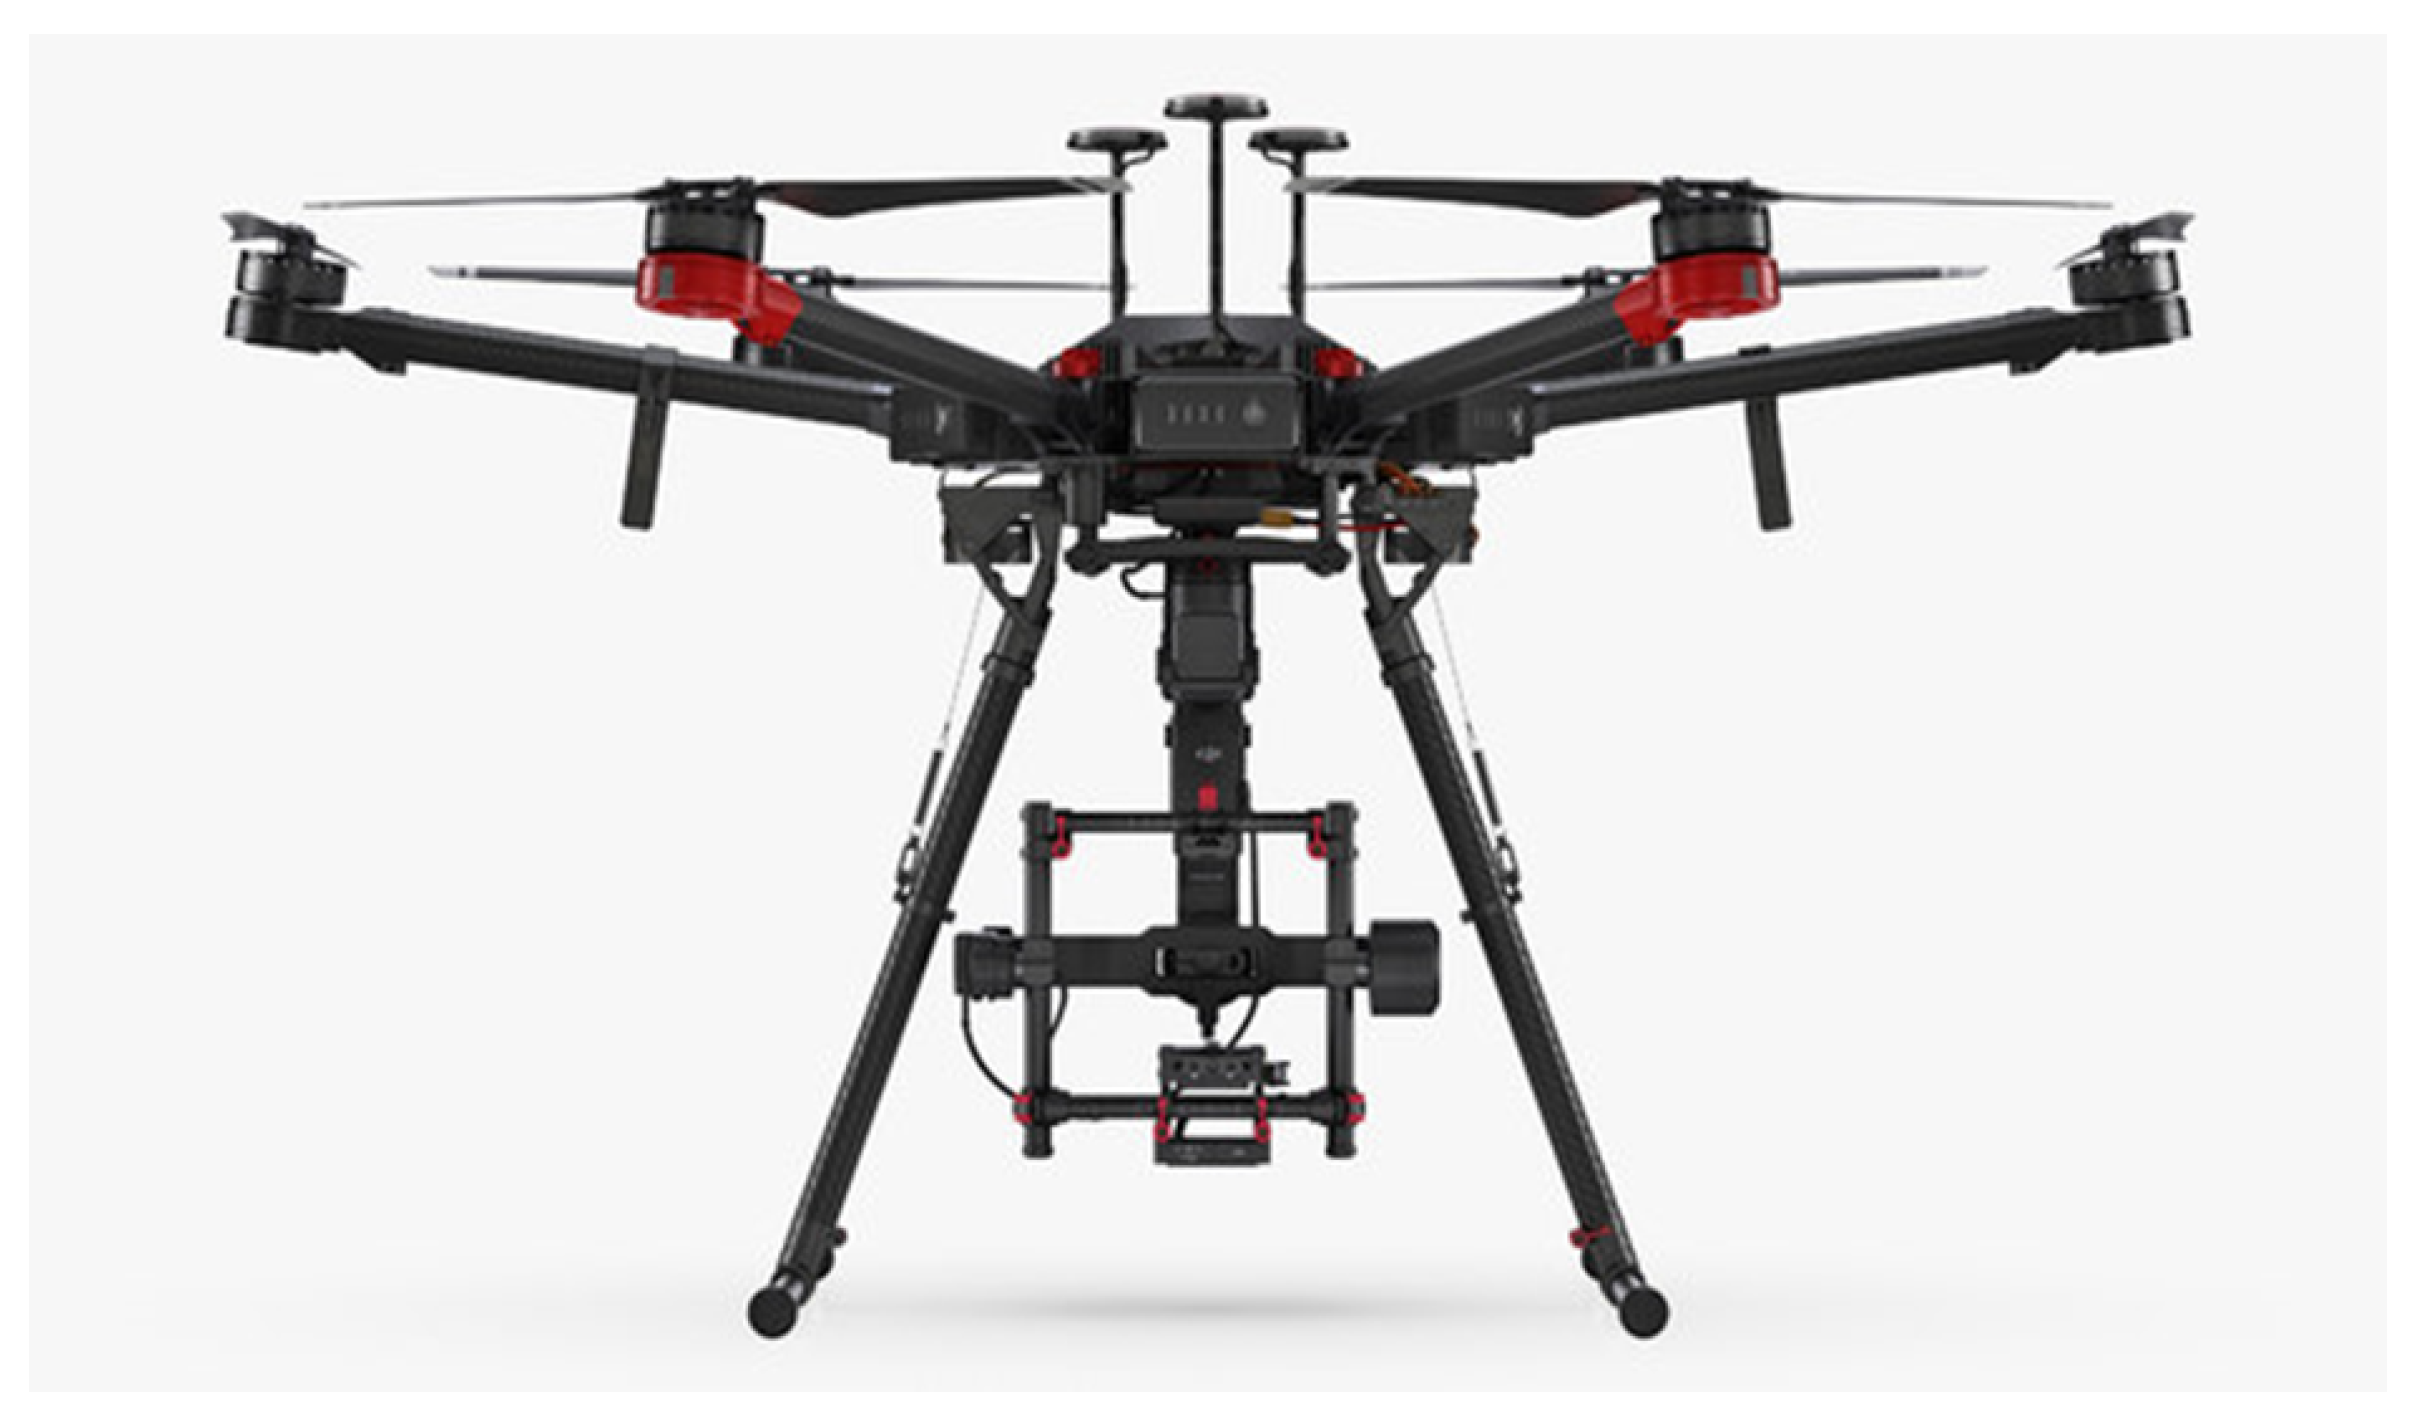
An additional analysis, based on real recorded data, was carried out by exploiting recorded data of a real DJI Matrice 600 drone (shown in Figure 7), coming from an S-band multifunctional radar. The measurement campaign was performed on December 2021 during clear and sunny days. The DJI Matrice 600 drone model type has the characteristics reported in Table 2.
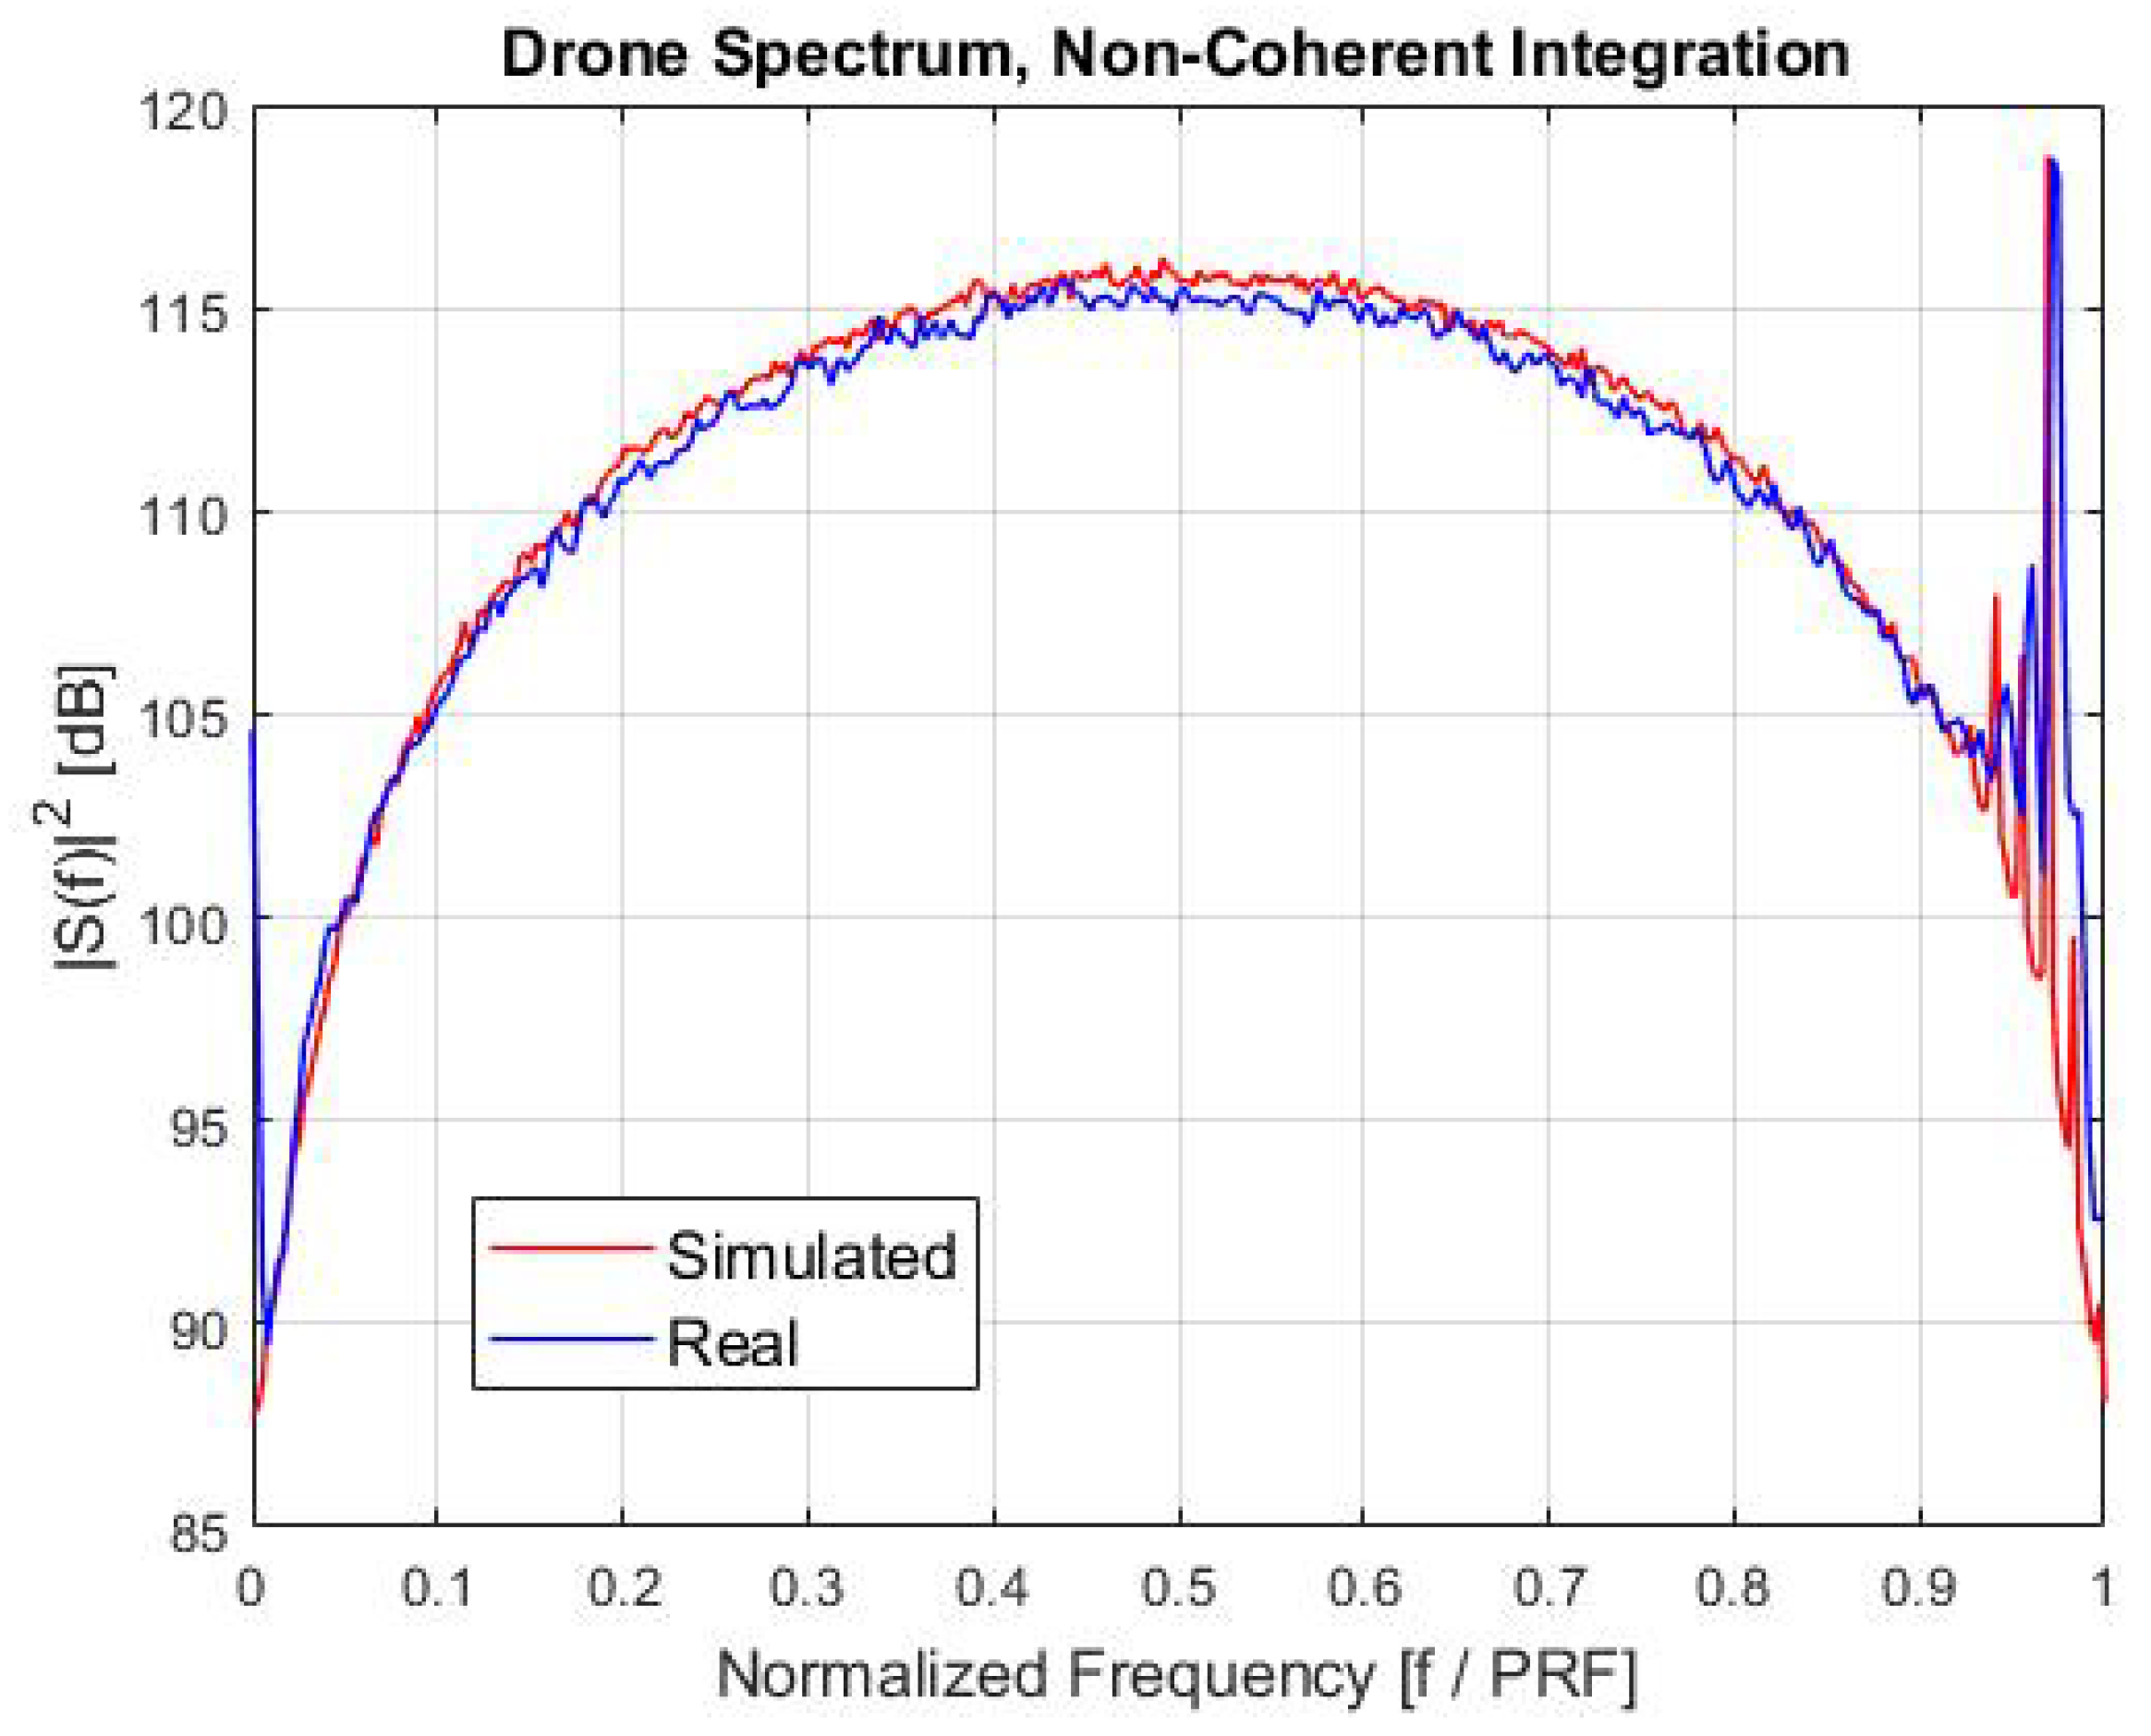
A comparison between the real drone spectrum and the drone spectrum that was obtained using the proposed model is shown in Figure 8. The spectra in Figure 8 were obtained after the radar MTI elaboration and integrating more detections.
In Figure 8, the drone spectrum shows both the body contribution, that is the main peak centred on the Doppler frequency related to the drone’s flight, and the blades micro-Doppler contributions, that are the secondary peaks around the main body peak. Moreover, by measuring the frequency distance between the secondary peaks, it is possible to derive the rotation rate of the rotor blades of the drone, by using the equations reported in Table 1. In this case, is about 50 rev/s, that is compatible with the DJI Matrice 600 model type.
4. Radar Processing and Target Classification
The developed mathematical model can be used to compute the reference signal for each target type to be classified. Then, computing the spectrogram and the spectrum of each type of target, it is possible to have a reference dataset for any possible machine learning classification algorithm.
The target classes that are considered in this paper are:
- Class 1: helicopter;
- Class 2: fixed-wings (FW) UAV or aircraft;
- Class 3: quadcopter drone (drone 1);
- Class 4: helicopter drone (drone 2).
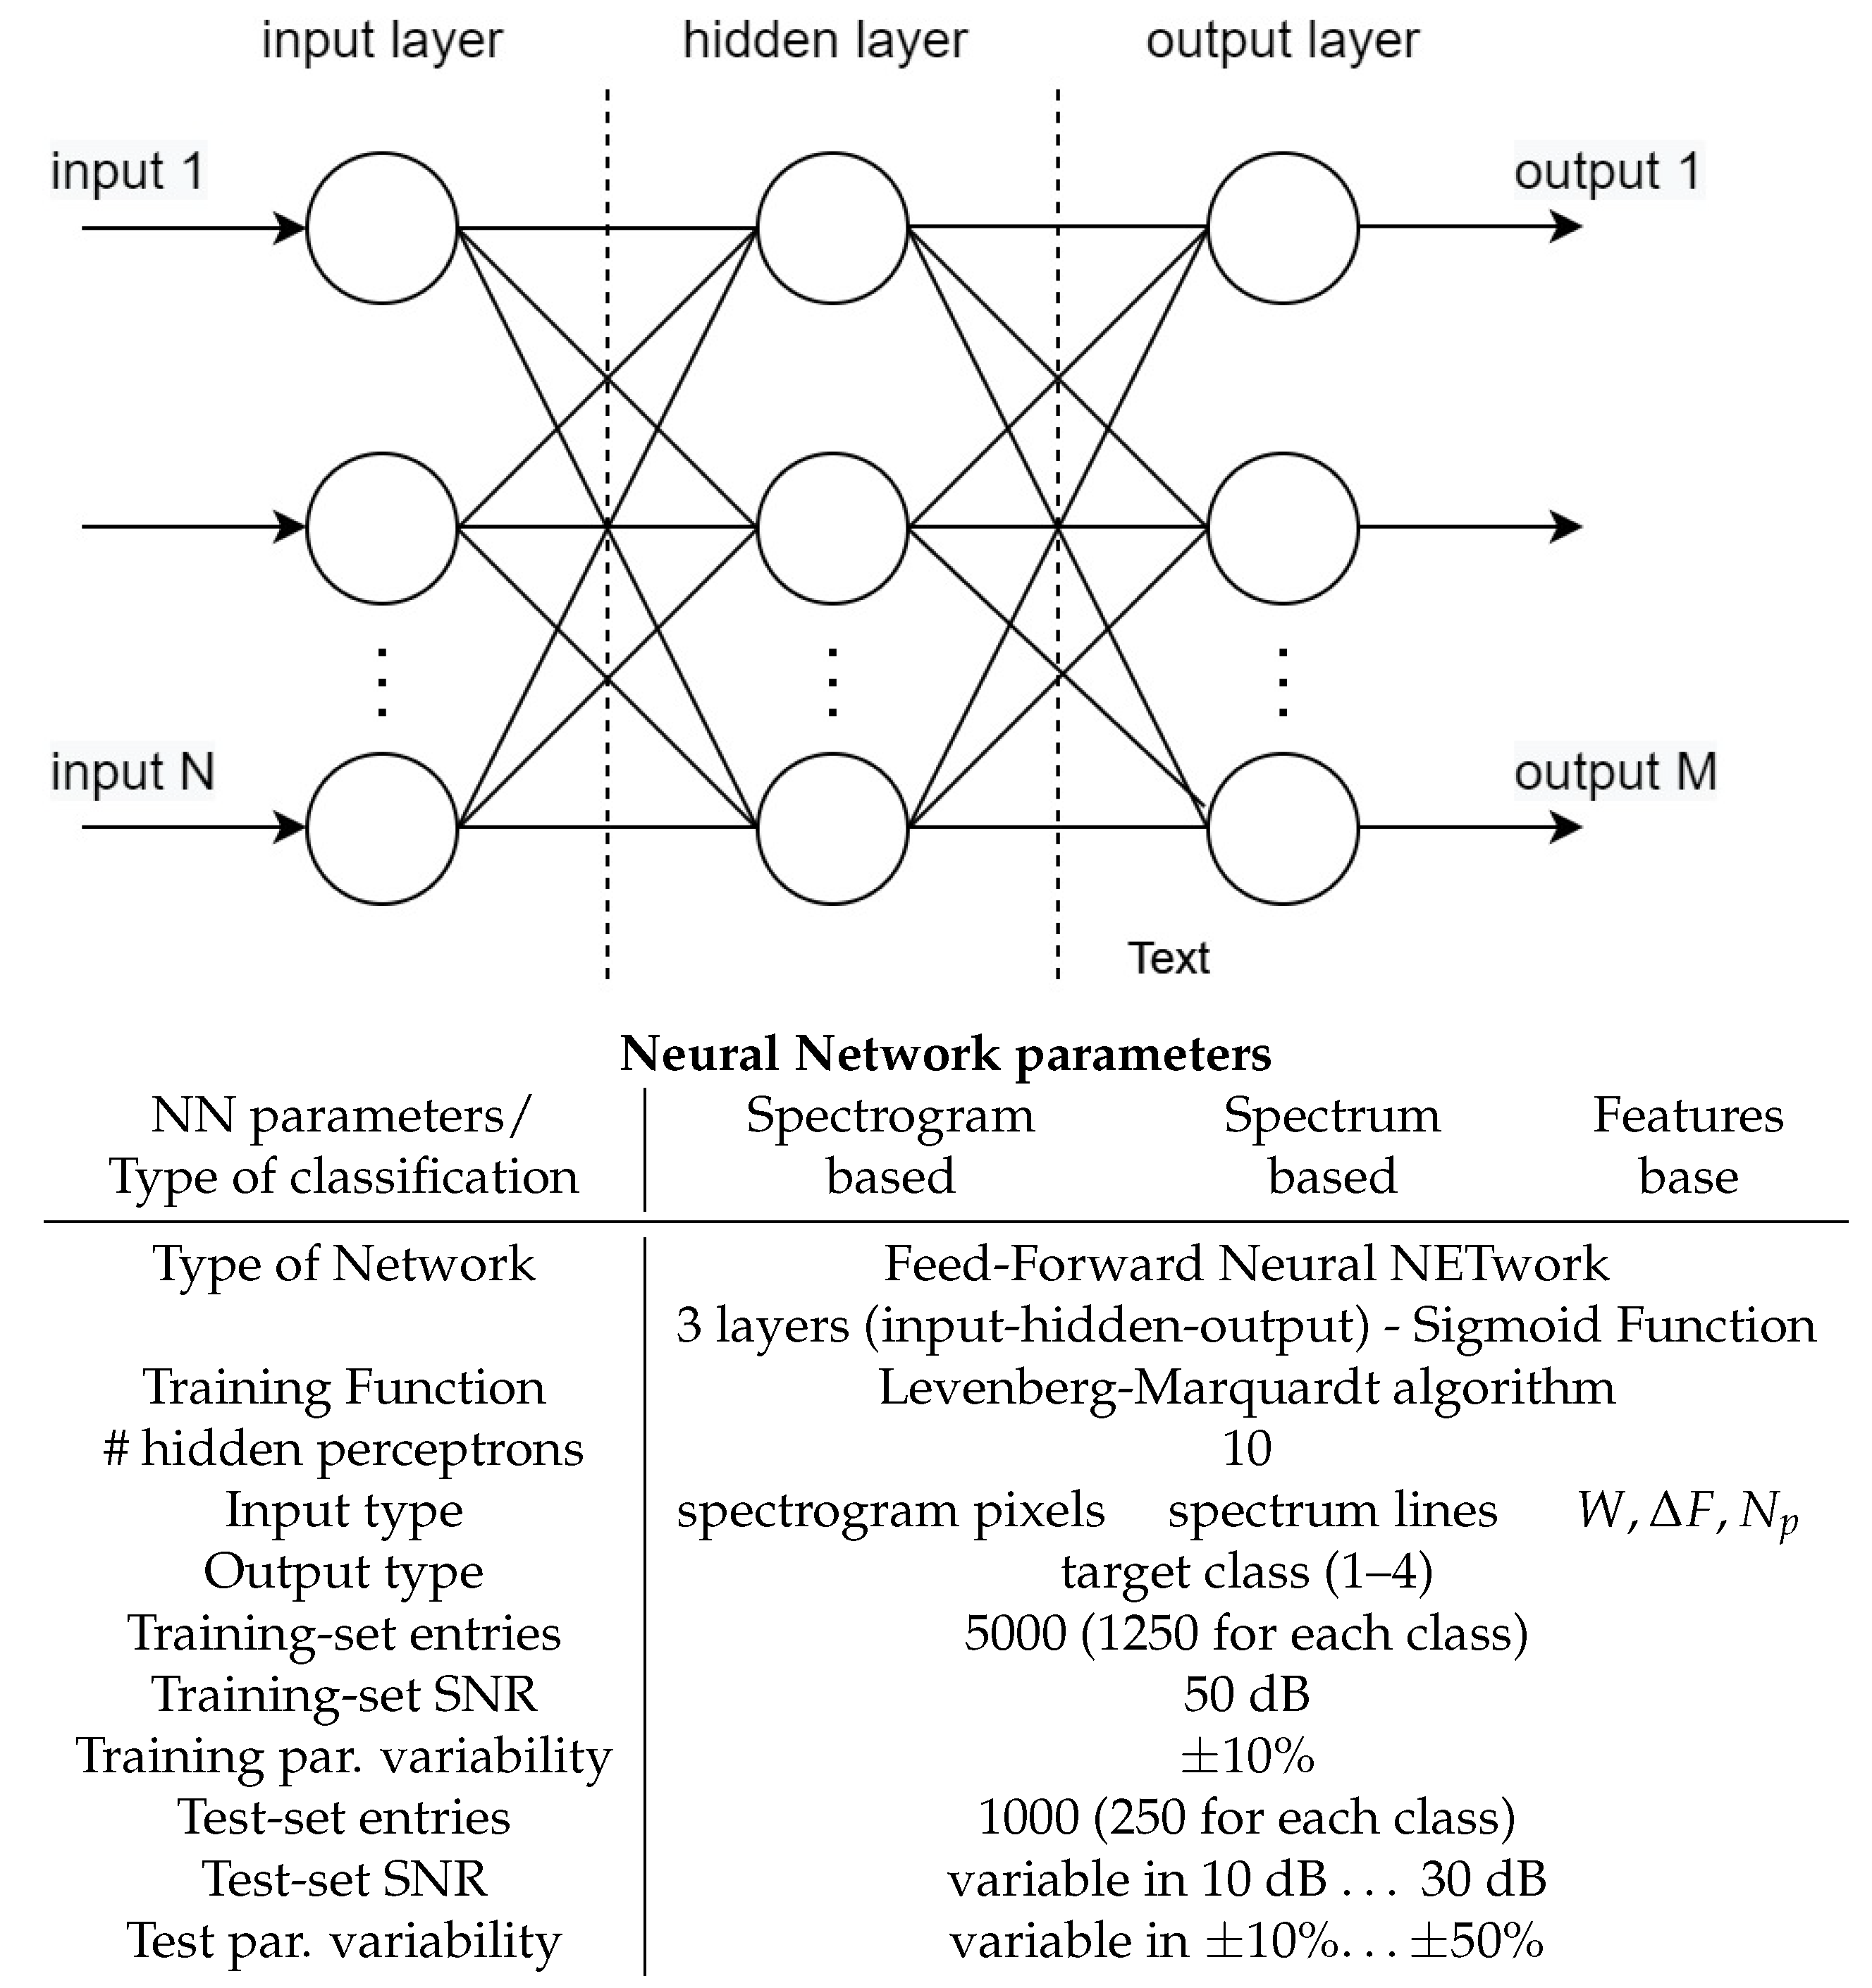
The machine learning tool that is considered for the classification is a classic feed-forward neural network (FFNNET) with 1 hidden layer composed of 10 neurons. The number of generated signals to train the neural network is , while the number of generated signals to test the neural network is . The classification results that are reported in the following are the average results that are obtained after 5 trainings of the neural network. As said, the FFNNET is trained and tested with three types of input representing the three possible classification algorithms at different stages of the radar processing chain:
- Spectrogram samples generated from the raw signal coming from the radar chain;
- Spectrum samples generated from the MTD processor;
- Features extracted after the detector.
Concerning the third approach, the following features are considered:
- Spectrum width (W): it allows researchers to discriminate between rotary-wing targets and fixed-wing targets. In fact, a rotary-wing target has rotating blades that introduce micro-Doppler contributions in the received signal, that make the spectrum wide. Instead, a fixed-wing target is always characterized by a narrow spectrum because no micro-Doppler contributions are present. The spectrum width feature is computed by measuring the maximum distances (in frequency) between the detections of the same target;
- Distance between two detections (): it allows researchers to discriminate between different categories of rotary-wing targets, such as helicopters and drones. In fact, the spectrum of a rotary-wing targets is a train of Diracs and the frequency distance between these Diracs is directly related to the rotation rate of the rotor blades; so, by measuring the frequency distance between the peaks in the spectrum, it is possible to classify the specific type of rotary-wing target;
- Number of peaks over threshold (): in addition to the frequency distance between Diracs, this feature may allow researchers to discriminate between different categories of rotary-wing targets.
In Table 3, the physical parameters used to generate the four classes are reported, and more details on the neural network used in the simulation are reported in Figure 9.
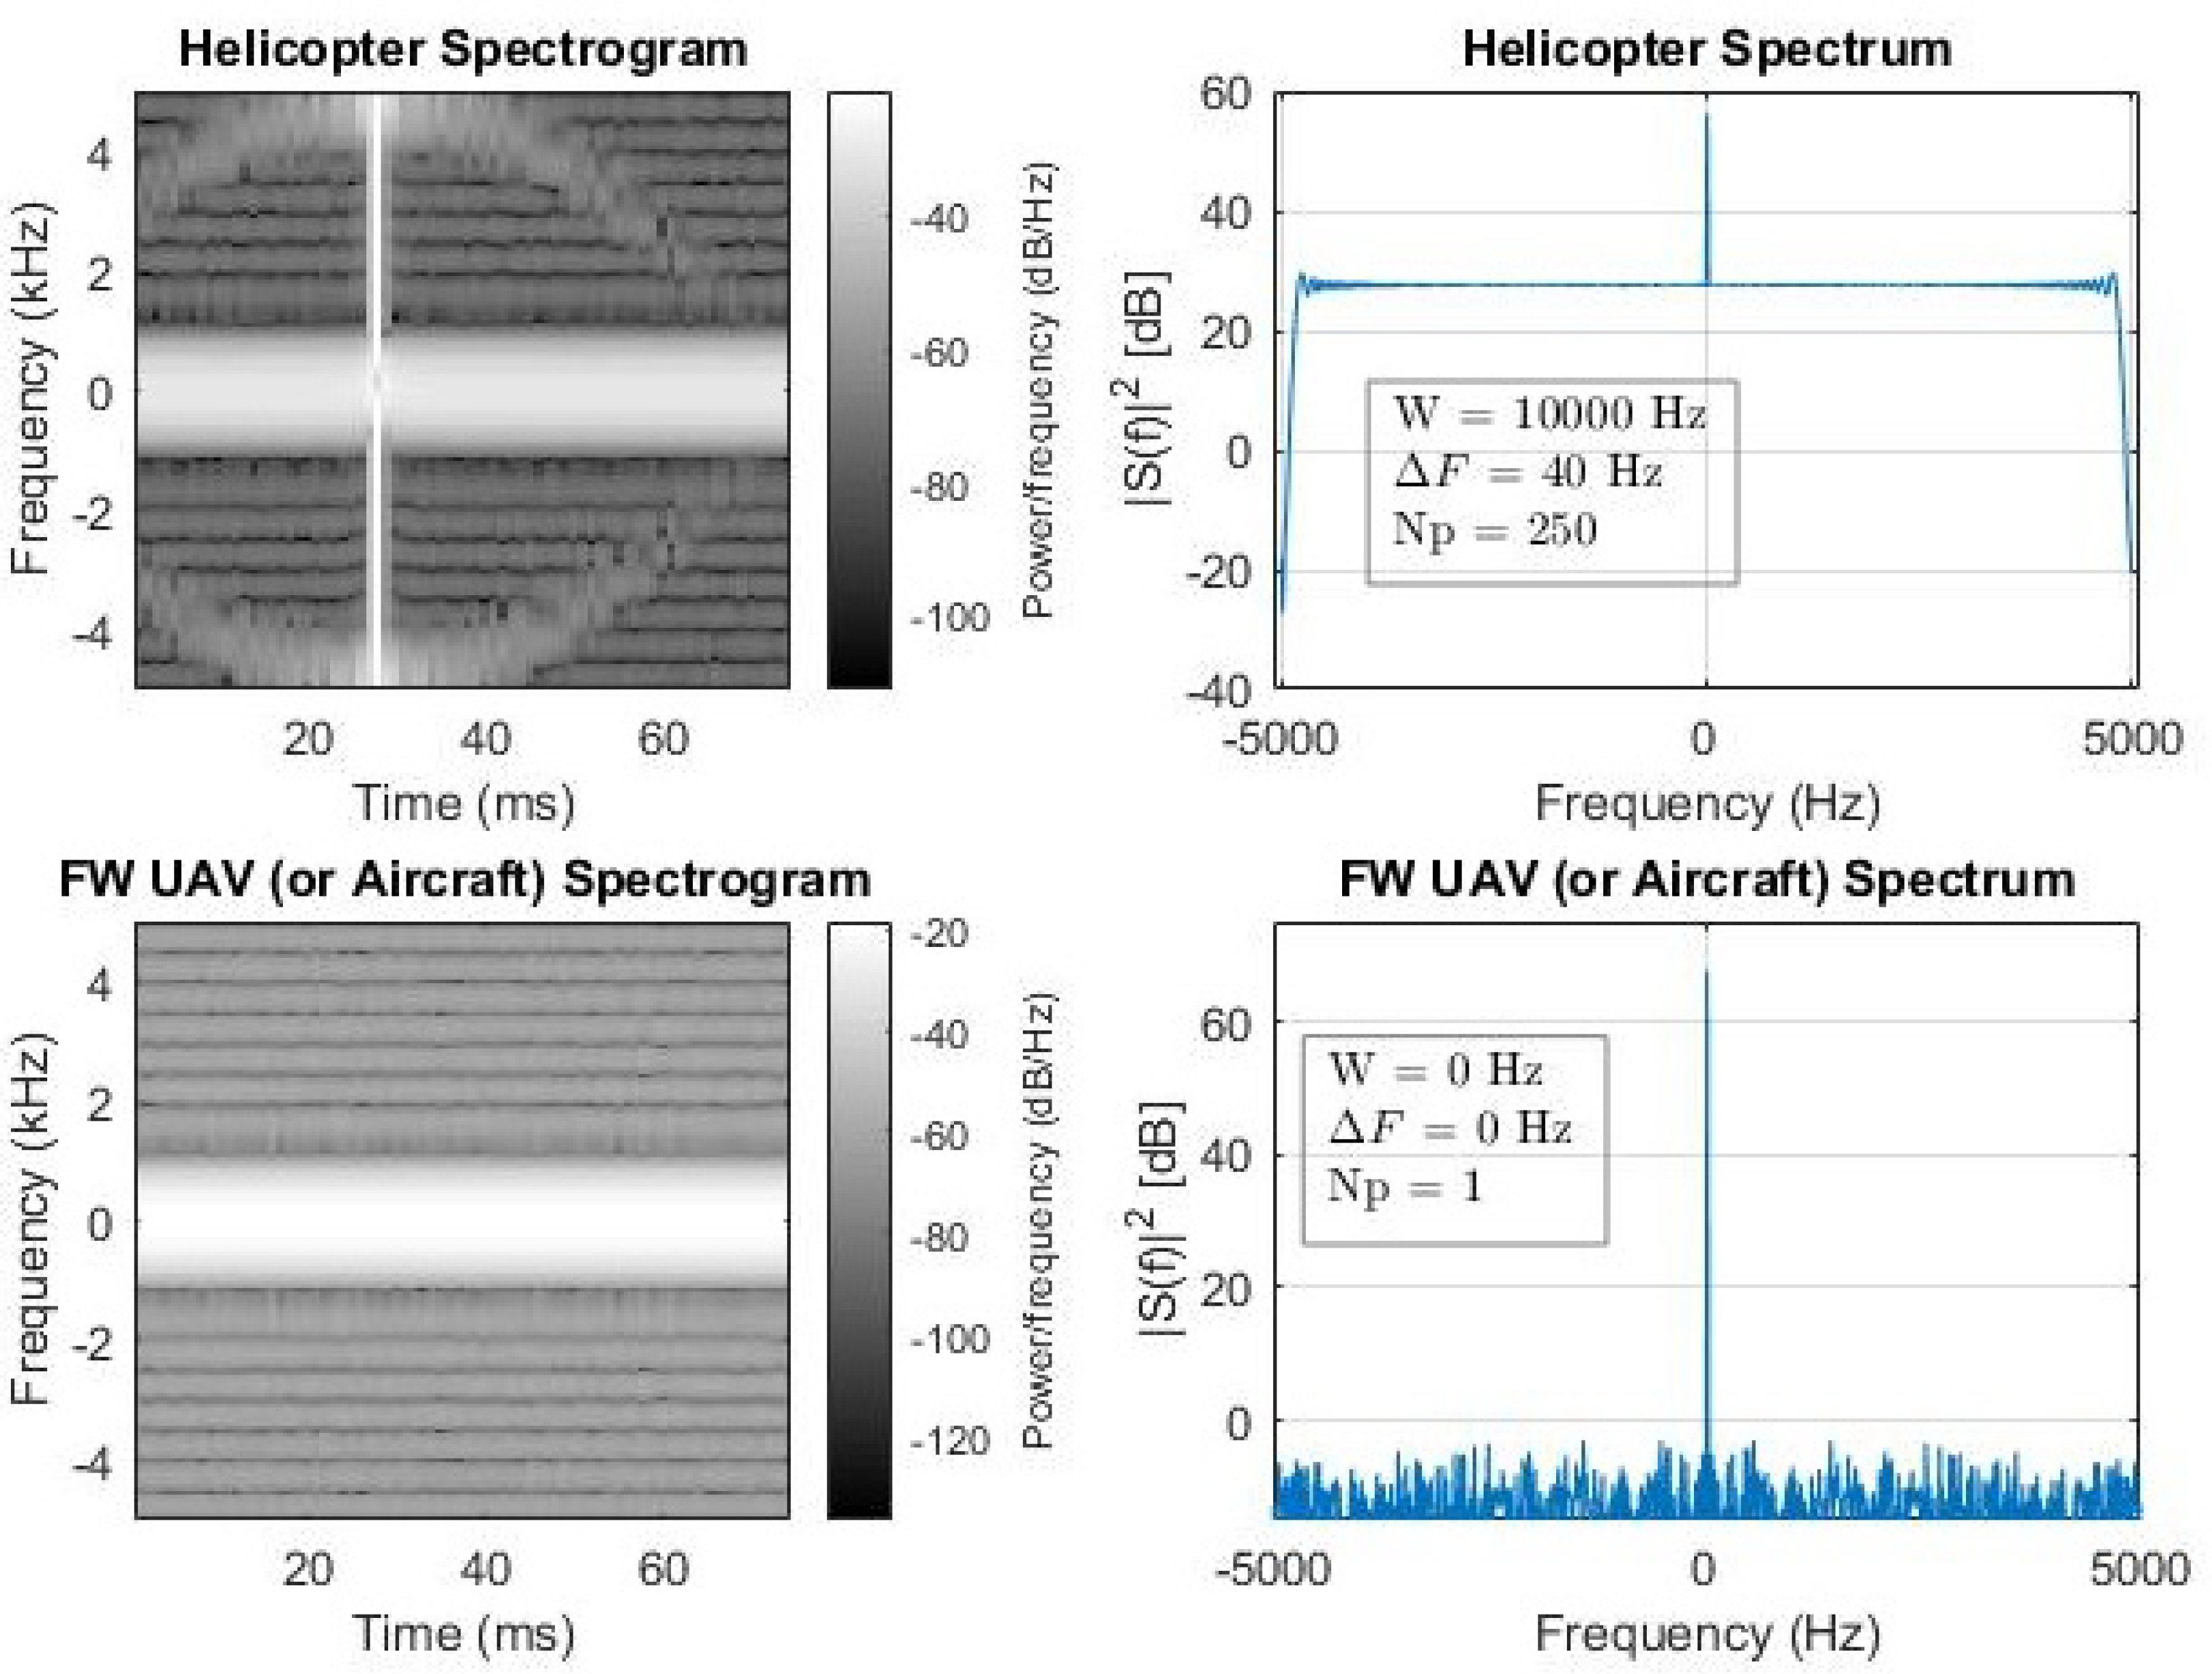
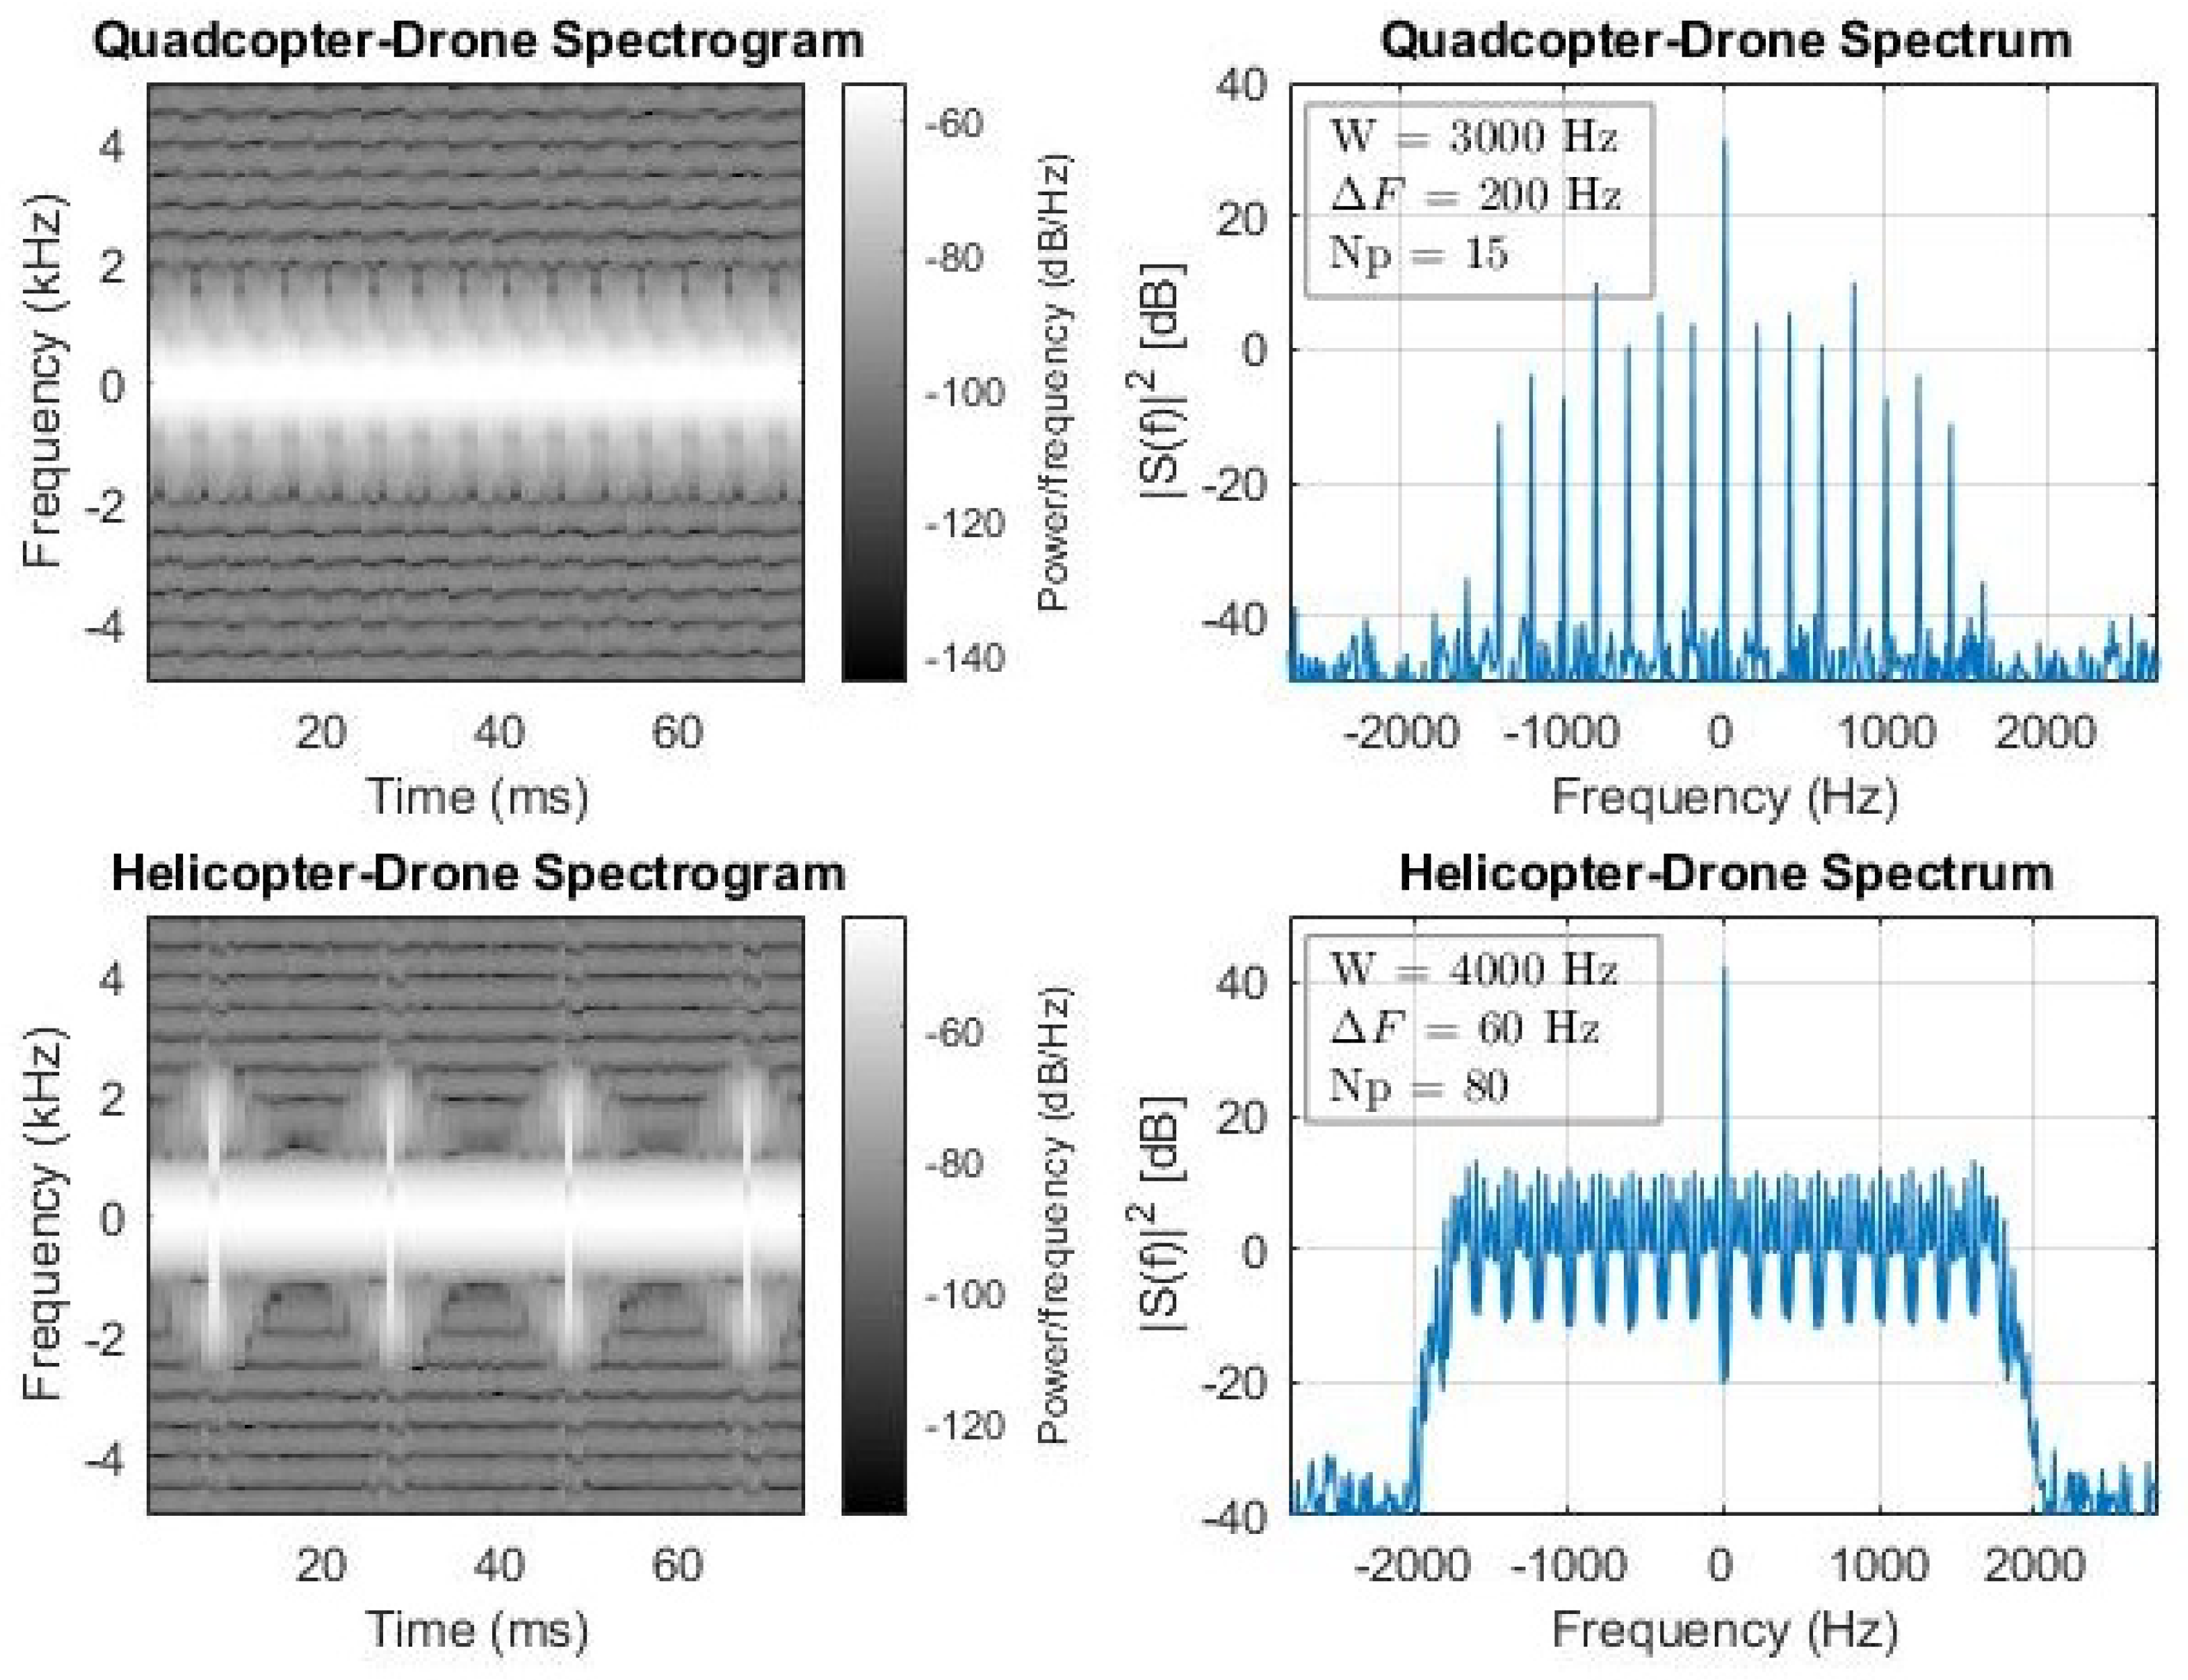
Note that in training the Doppler frequency of the target body is set to Hz, in order to avoid that the neural network identifies the Doppler of the target body as a discriminating feature for classification. Moreover, each target parameter is varied in a range of about ±10% around the reference value, in order to take care of the variability that can characterize different drones in the same class or different flight configurations. Last, but not least, the training dataset is generated by considering an additive white Gaussian noise (with = 50 dB) as regularization noise, in order to avoid that the neural network identifies as features the systematic errors that can be produced during the signal generation. Examples of the simulated spectrogram, spectrum, and features after detections of each target, used in the training phase, are shown in Figure 6.
Concerning the test dataset, the spectrogram and the spectrum of each target are generated by adding higher noise to the measurements (SNR in the range of 10 to 30 dB) and more variability to the physical parameters representing the targets (from 10% to 50%) and, finally, changing the observation time from 25 to 100 ms.
Moreover, in the test phase, the Doppler frequency of the target body is assumed to be different from zero, in order to take care of the fact that the real target can have its own velocity that must be estimated at the radar side. The target central frequency estimation is an important preprocessing step to be carried out before the classification, in order to remove it from the received signal and to come back to features that are similar to the ones used in the training phase. In any case, the residual error due to the not perfect estimation of the central frequency of the incoming signal becomes negligible after this preprocessing step.
The values of are imposed starting from the typical velocities of the targets of interest and using the following classic Doppler formula: .
Examples of classification results are reported in Table 4, Table 5 and Table 6, that report the confusion matrices for the three classification blocks, for a time on-target ms, for a in training equal to 50 dB, and for a in the test equal to 30 dB. Table 4 represents the confusion matrix in the spectrogram case, Table 5 represents the confusion matrix in the spectrum case, and Table 6 represents the confusion matrix in the features case.
The correct classification rate results to be % in the spectrogram case, % in the spectrum case, and % in the features case. Thus, the features-based classification allows researchers to reach slightly better performances than the spectrogram-based and spectrum-based classification, that instead have similar performances. However, by looking at the content of the confusion matrices, it is possible to note that some confusion is present, in particular in the distinction of the quadcopter drone with the helicopter drone and in the distinction of the helicopter with the FW-UAV (or aircraft). A deeper evaluation is carried out by evaluating the the -score for each configuration, by varying the SNR, the parameter variation span, and the time on-target in the test. The -score is defined as [23]:
where C represents the total number of classes (four in this paper). In Equation (13), is the precision of the c-th class and is the recall of the c-th class, defined as:
where is the number of true positives, is the number of false positives and is the number of false negatives, all of the c-th class.
With reference to the confusion matrix in Table 5, concerning the helicopter class, the recall is %, the precision is = 91.4%, and the relative -score is = 84.8%. The same can be carried out for the other classes and, by applying the formula in Equation (13), it is possible to derive the overall -score.
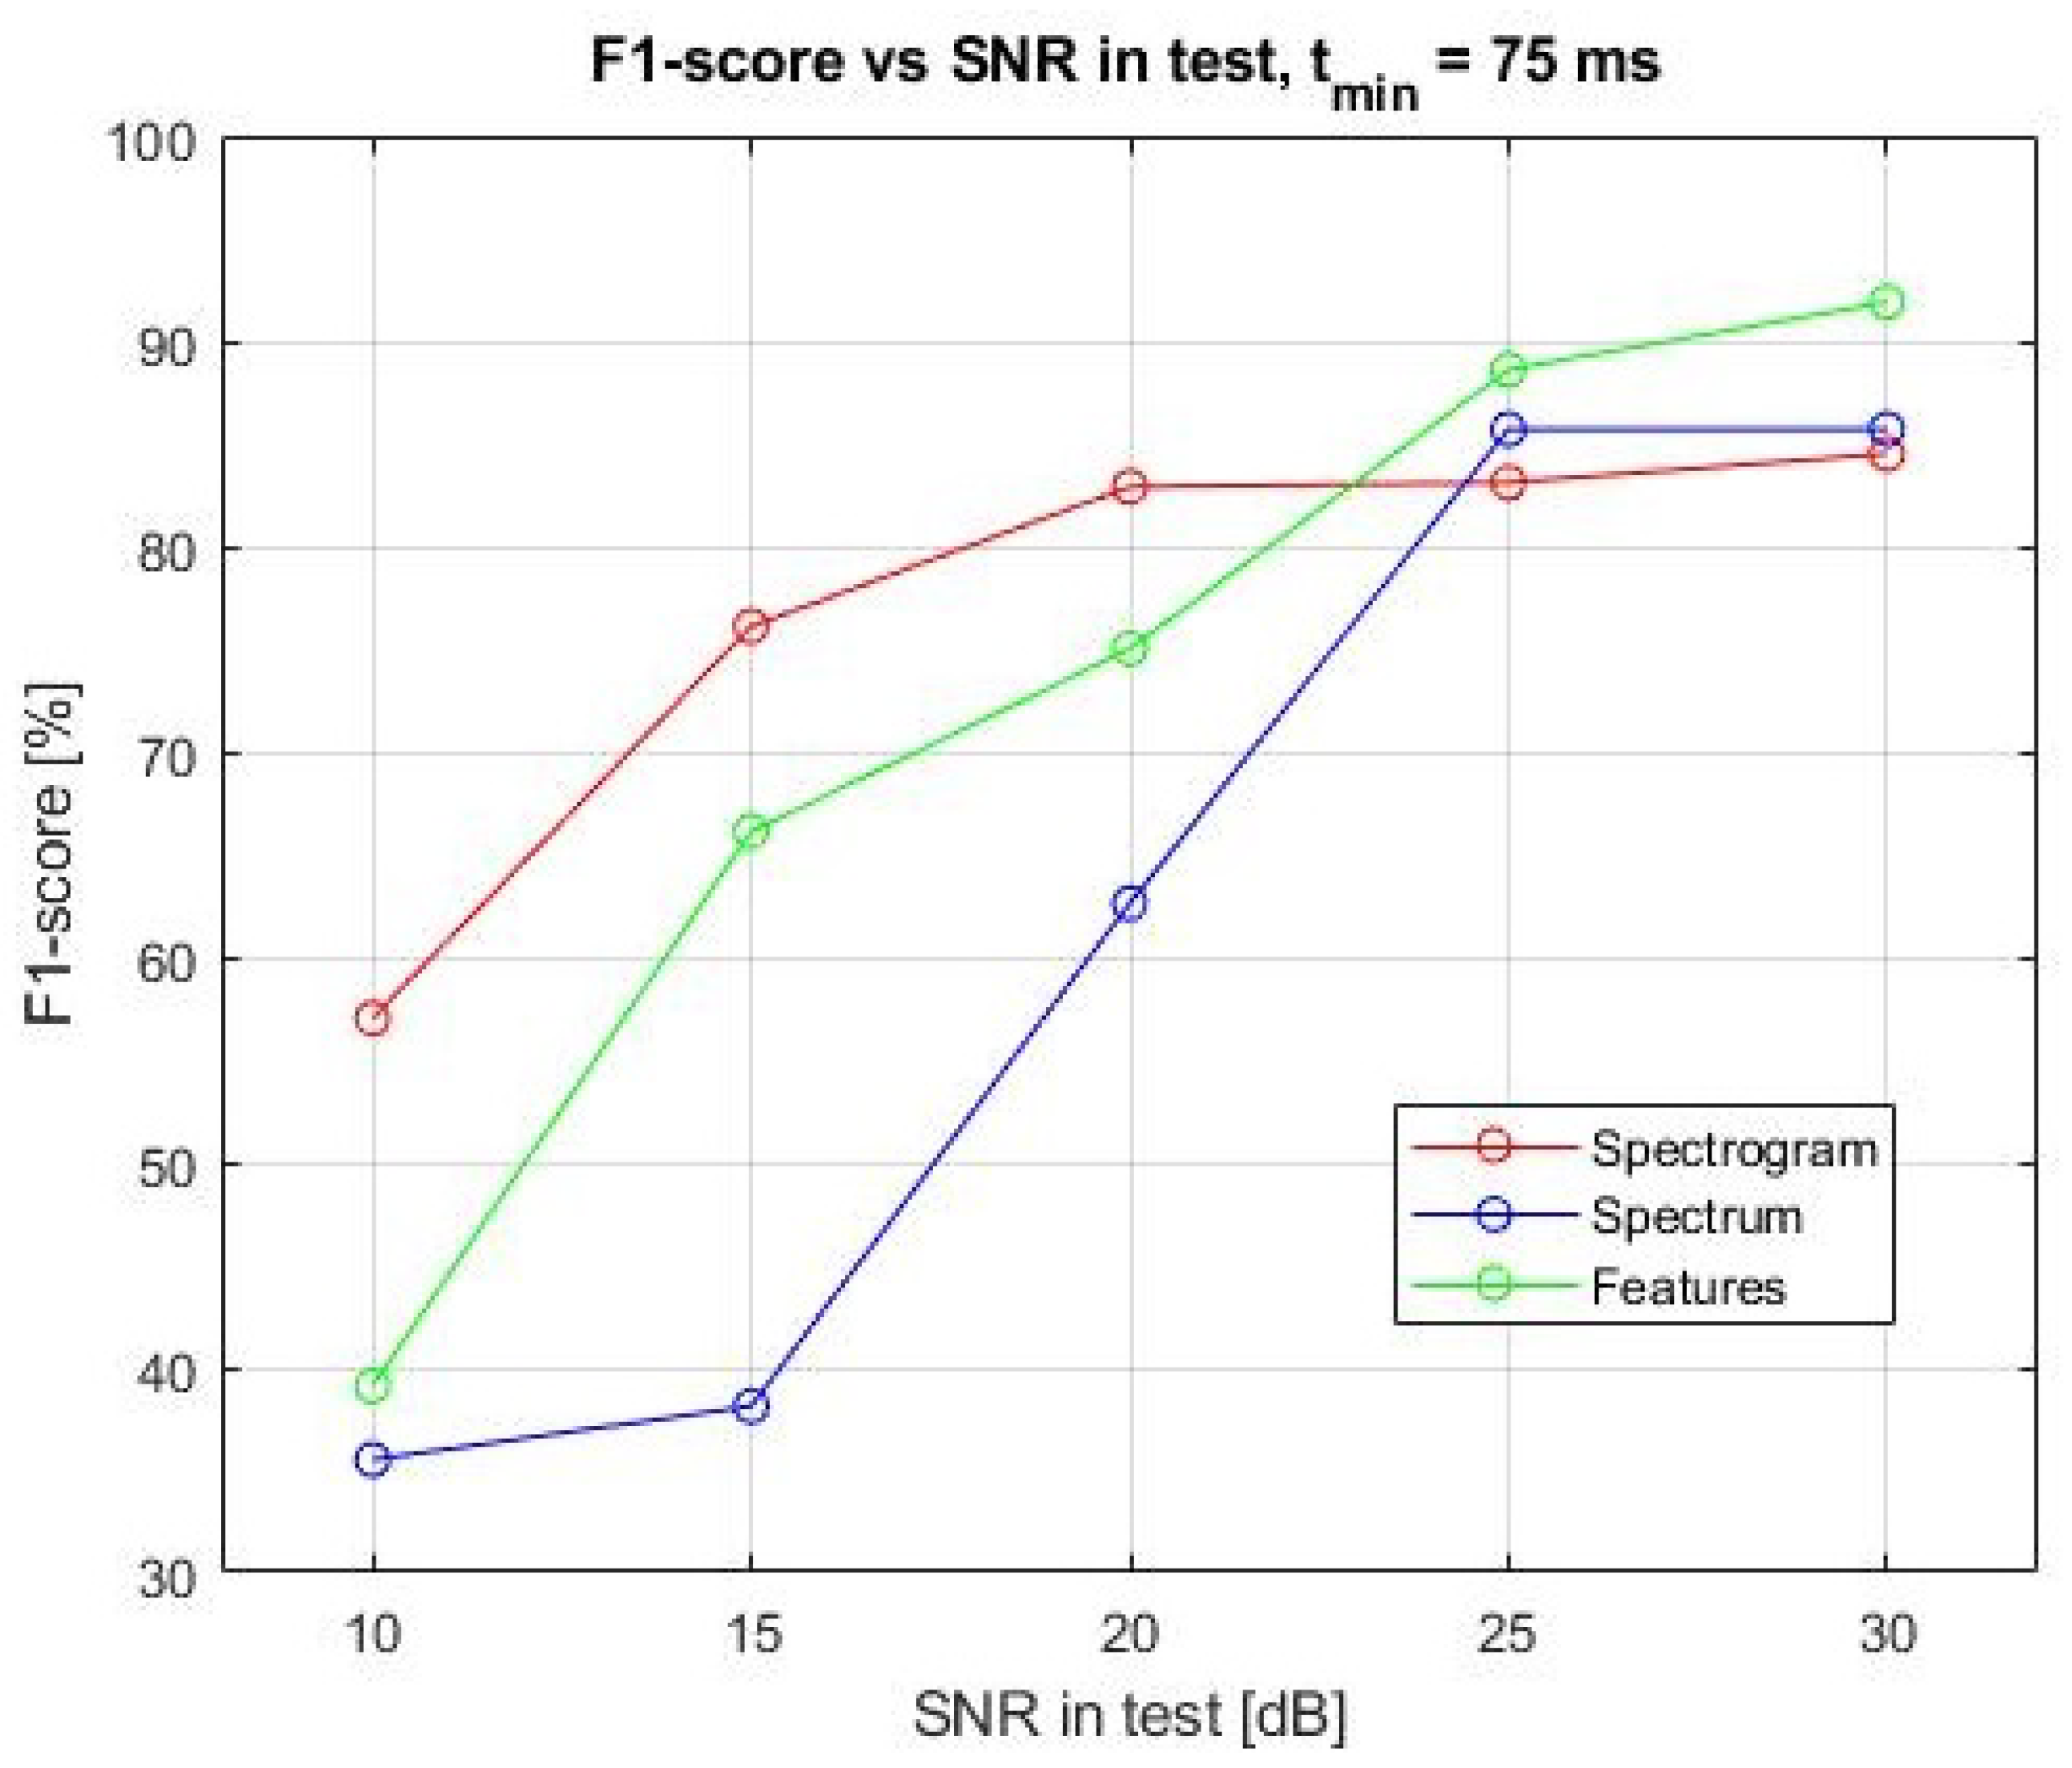
Performances when varying the in test are reported in Figure 10. It is possible to notice that, as expected, increasing the improves the performances of all the classifiers. In particular, for dB, the most performing approach results to be the one in which the spectrogram samples are given as input to the neural network. Instead, when the is sufficiently high to correctly reconstruct the spectrograms and spectra of the targets, the performances of the three approaches become comparable and stable around 85%, with the approach of the features that is slightly better than the spectrogram and spectrum approaches.
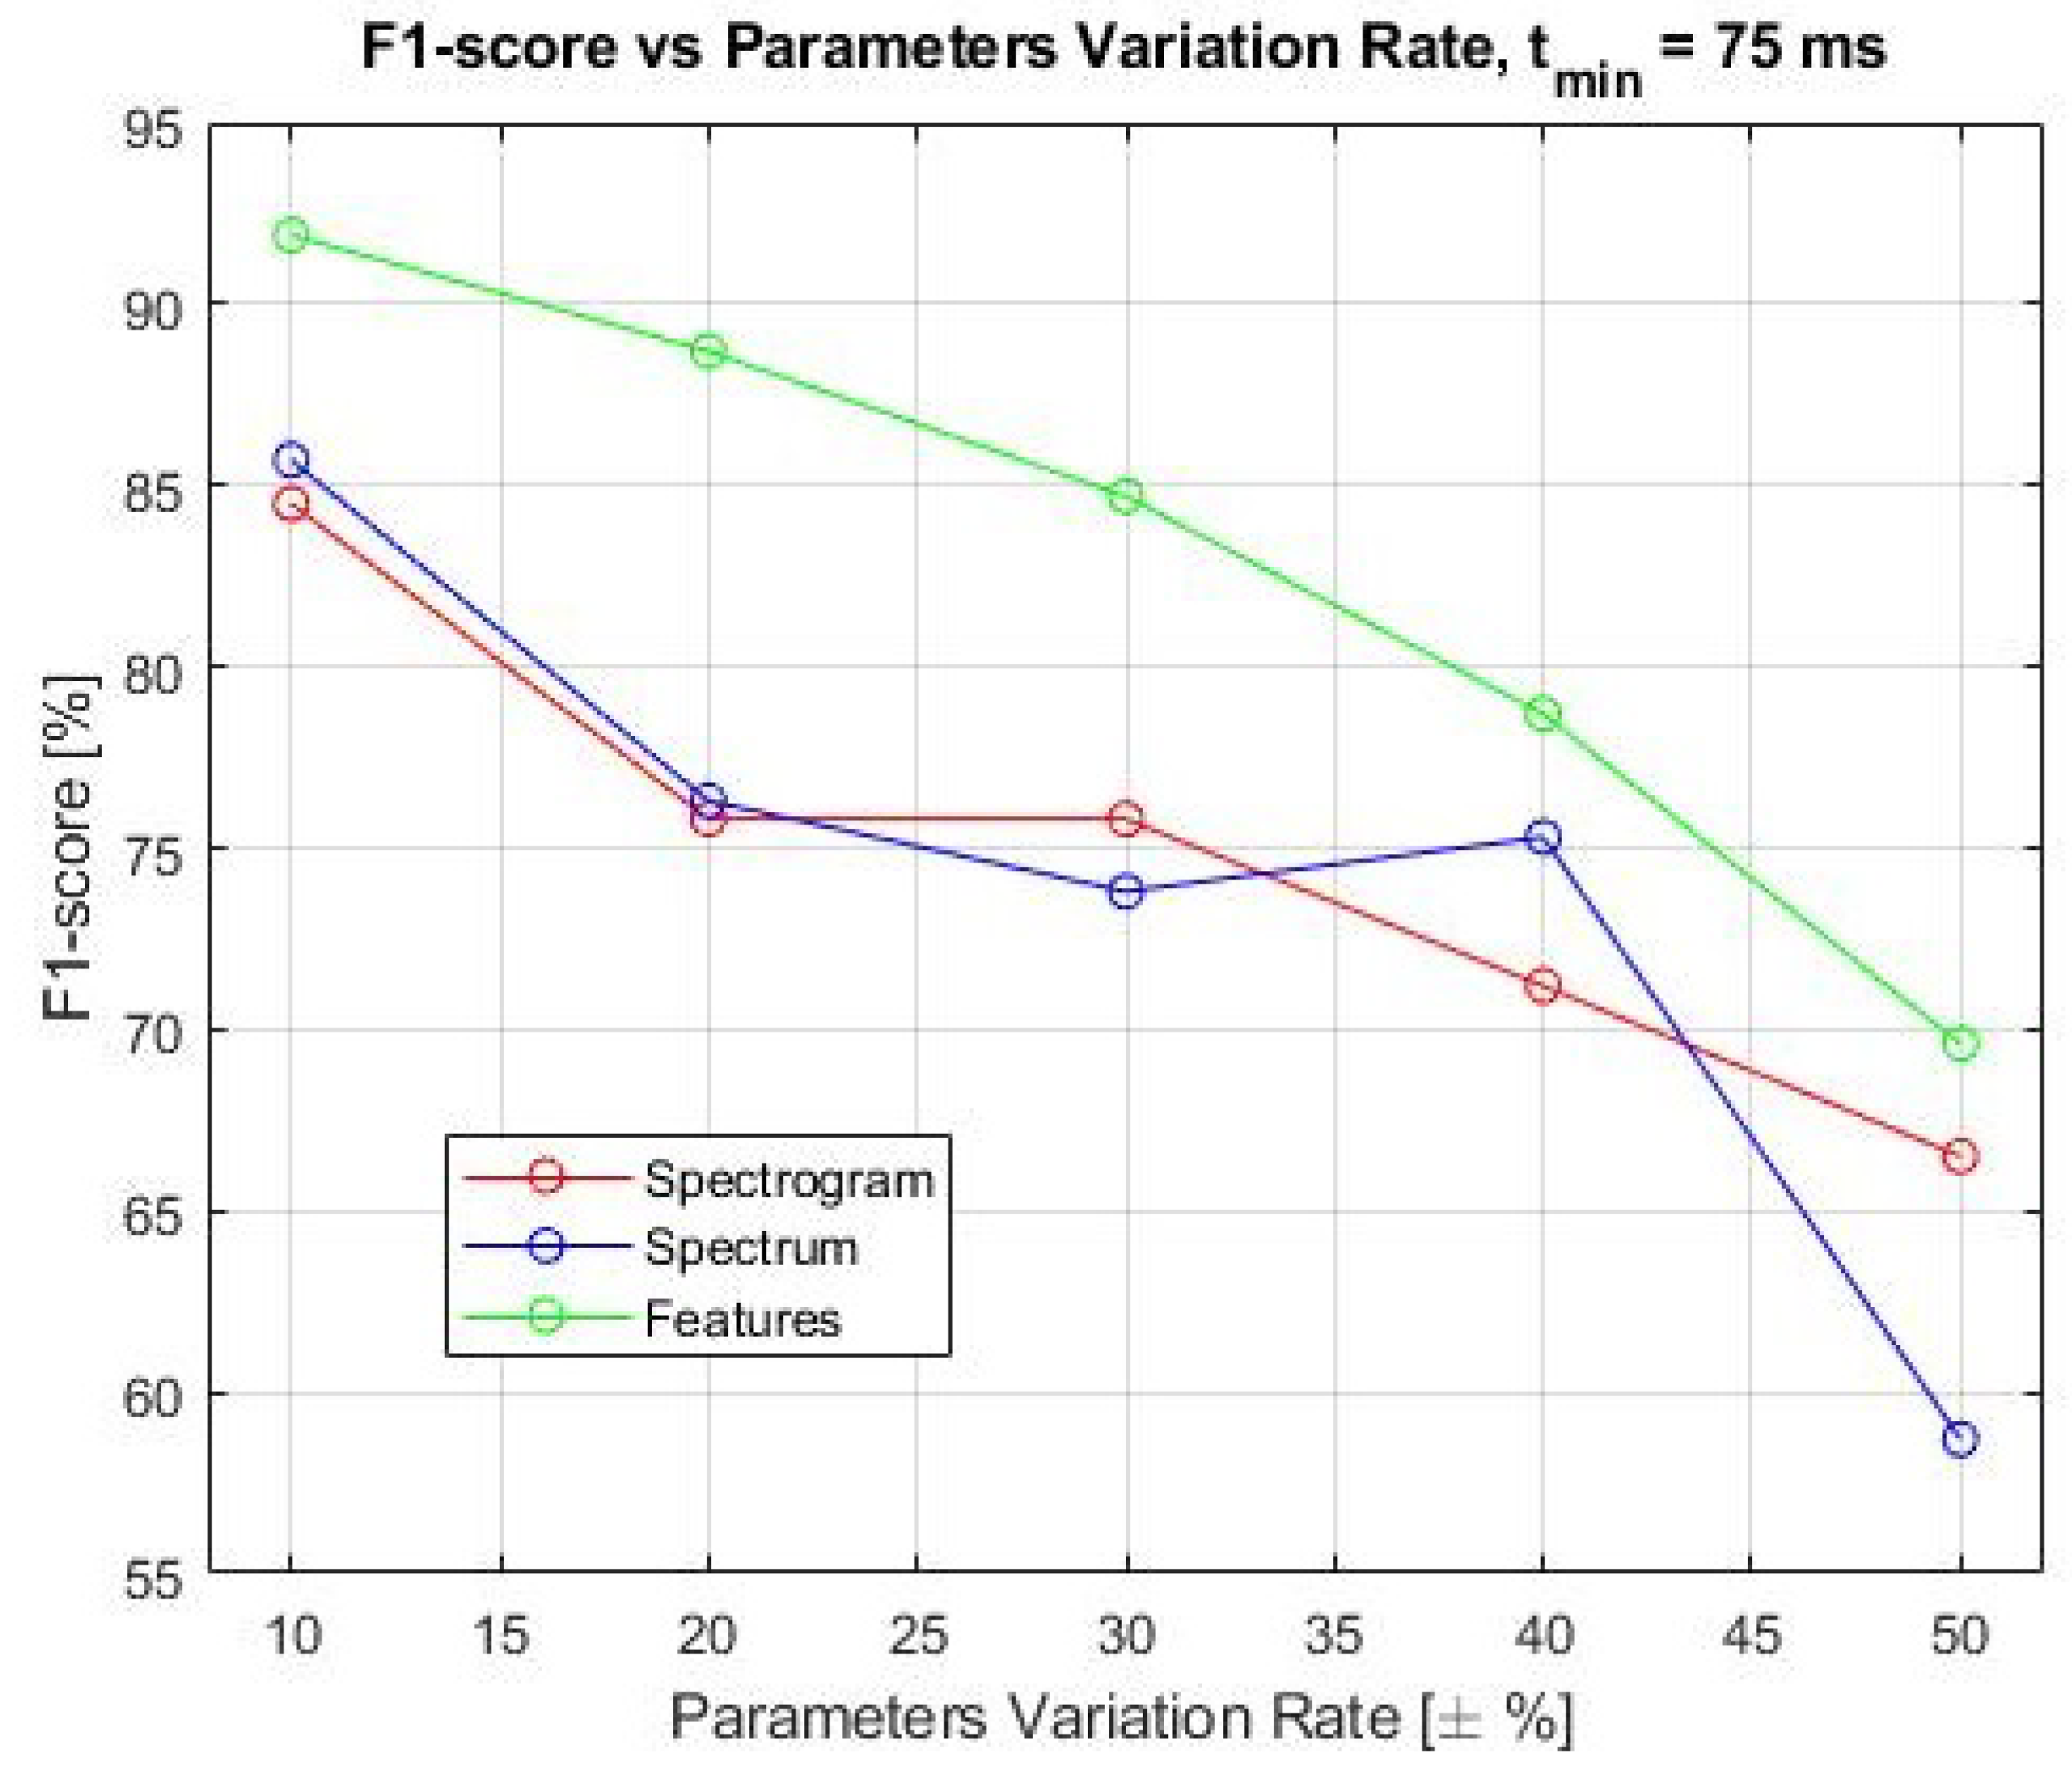
As mentioned before, the three approaches are also compared by varying the range of values of the target parameters in test, in order to emulate different drone models or flight behaviours. The -score versus the parameters variation in test is reported in Figure 11. As expected, the performances of the classifier get worse if the range of variation of the target parameters increases. In fact, the greater is the range of values in which a parameter varies, the more two different categories of targets tend to be confused. As an example, consider the case of the two drones: when the blade length of a quadcopter drone is varied of about ±50% with respect to its reference value, it is highly probable that the received signal from the quadcopter drone is similar to the received signal from the helicopter drone, leading to subsequent classification errors. It is also interesting to notice that, with the parameters variation rate fixed, the spectrogram and spectrum approaches have an almost equivalent behaviour, while the approach of the features gives much better classification results. In any case, the classification performance is still good also with a parameter variation of about 40%.
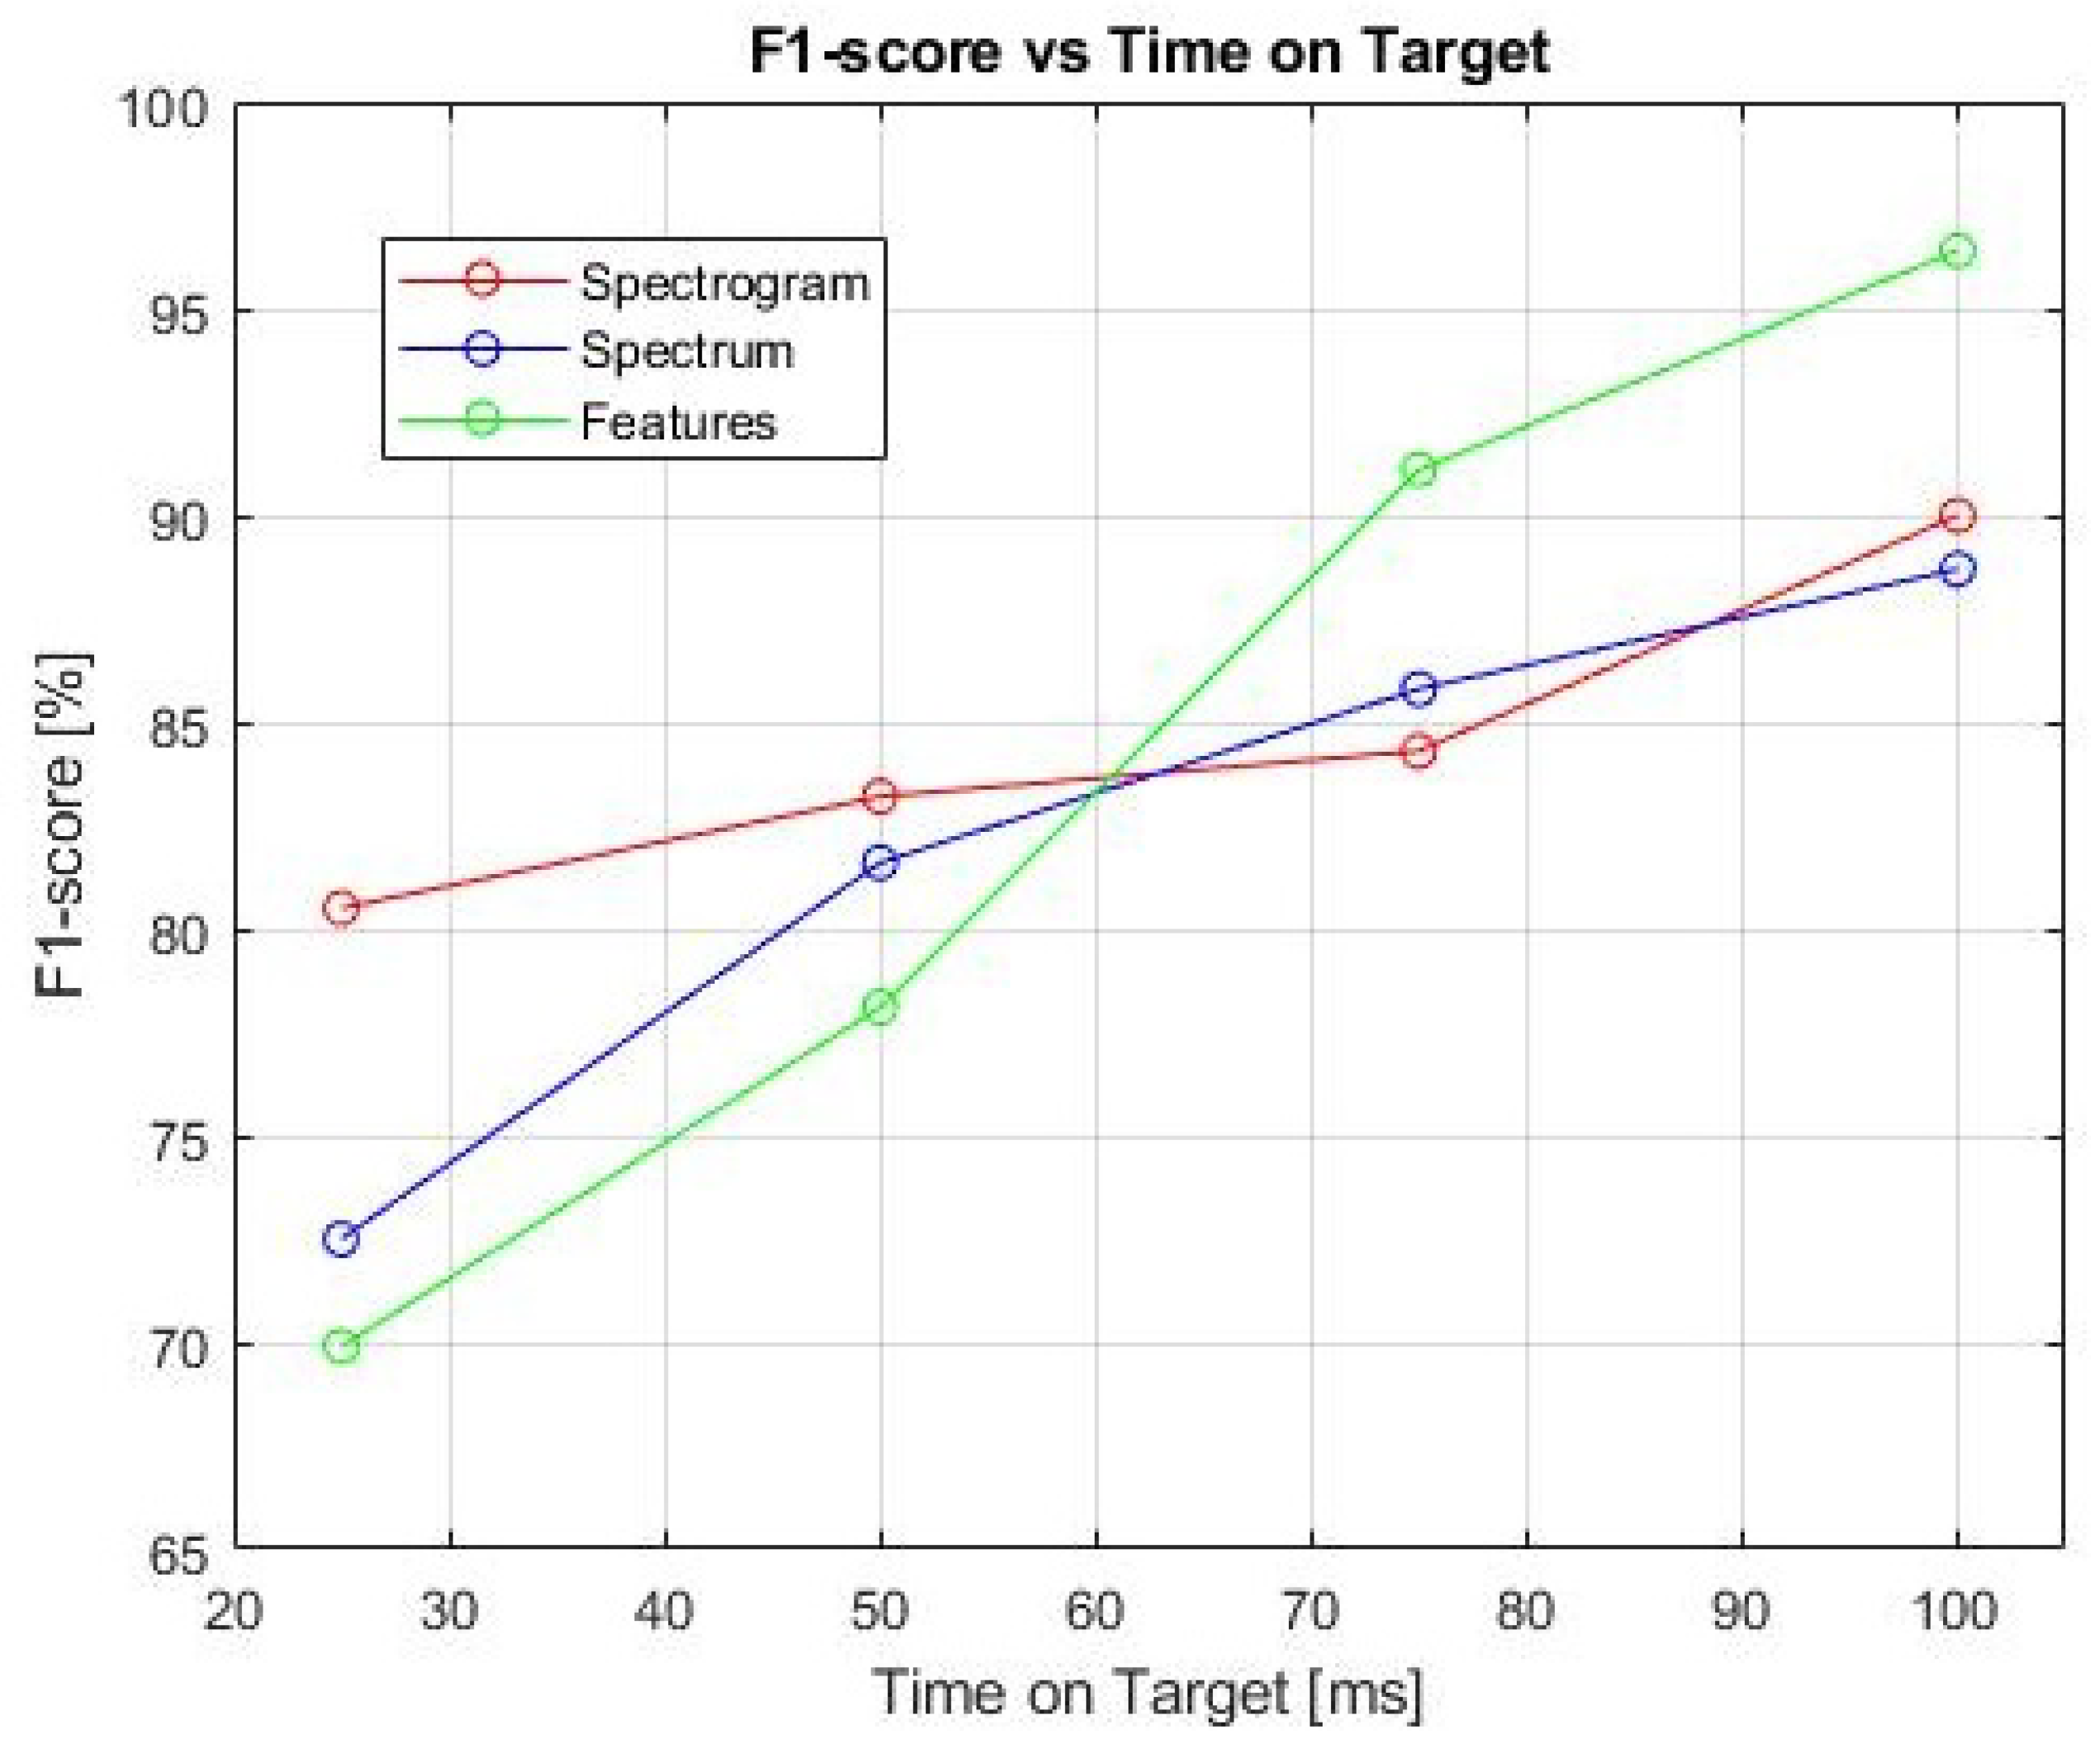
Last, the F1-score of the three approaches has been evaluated by varying the observation time (time on-target), as reported in Figure 12.
It is possible to notice that, as expected, the classification performances of all the three approaches improve when the time on-target increases. In fact, when the observation time is longer, the spectrogram and the spectrum of each target are reconstructed in a better way and, as a consequence, the classification performances improve. In particular, for a ms, the spectrogram-based approach and the spectrum-based approach allow researchers to reach an F1-score of about 90%, while the features-based approach has better results, with F1-score above 95%. However, it is important to remember that also time on-target is subject to a trade-off between the minimization of the task time and the classification performance.
Finally, it is clear that the approach of extracting features from the target spectrum and using them as input to a neural network is the most promising.
5. Conclusions
The aim of this paper was the exploration of possible ways to introduce drone and other flying object classification tasks into a multifunctional radar.
In order to reach this goal, a mathematical model of the received signal from a generic drone, having rotary parts or not, was developed. The proposed model can be specialized to any desired target category by simply adjusting its parameters. In fact, even though this paper considers just four target categories (helicopter, fixed-wings UAV (or aircraft), quadcopter drone, and helicopter drone), the developed model can be easily extended to other target categories, such as ballistic targets or other types of drone. Having the models of the targets, it is possible to use them for the training phase of any classifier tool.
The main goal of the paper was the comparison of the classification performance of three different approaches, from low-level to high-level signatures, with respect to the typical radar chain.
Simulation results shows that the three method lead to a similar results but the best classification performance is obtained, for the different tested scenarios, with the features-based classification after the radar detection mechanism and can be chosen as the preferred approach. Moreover, apart from the merely classification results, the features-based approach has also other advantages with regards to the other ones:
- It allows a very fast training of the neural network and a better reliability in the results, because, in general, neural networks perform better when the features to be processed are a small representative number;
- The features-based approach is the one that require the lowest additional processing power in the radar chain. In fact, it exploits all the huge signal processing (filtering, fast Fourier transformation, and thresholding) already present in any modern radar. On the contrary, additional signal processing blocks at lower level of the radar chain, as the spectrogram and spectrum computations are necessary for the other two approaches.
Finally, it is important to note that the proposed model can be used to include other classes in the classification task and that the classification method (FFNNET) can be substituted with any other more performing classification tool. In the authors’ opinion, this last step was not necessary at this level due to the need to maintain the results of the proposed comparison generally, which are simple to understand and not dependent on a specific optimized classification algorithm.
Future steps of the work will be the collection of a data-set of real recorded features of different drones to confirm the obtained results and to select a less generic classification method, tailored on the specific radar and feature characteristics.
Author Contributions
M.L. proposed the idea and gave the theoretical support, conceptualizations, and methodology; G.L. implemented the algorithm and contributed to the algorithm evaluation; E.P. supported the implementation and the comparison with real recorded data. All authors have read and agreed to the published version of the manuscript.
Funding
This research received no external funding.
Institutional Review Board Statement
Not applicable.
Informed Consent Statement
Not applicable.
Data Availability Statement
Not applicable.
Conflicts of Interest
The authors declare no conflict of interest.
References
- Neri, F. Introduction to Electronic Defense Systems; Artech House: Norwood, MA, USA, 2018. [Google Scholar]
- Fell, B. Basic Radar Concepts: An Introduction to Radar for Optical Engineers. In Effective Utilization of Optics in Radar Systems; International Society for Optics and Photonics: Huntsville, AL, USA, 1977. [Google Scholar]
- Skolnik, M. Radar Handbook, 2nd ed.; McGraw-Hill: New York, NY, USA, 1990. [Google Scholar]
- Barton, D. Radar System Analysis and Modeling; Artech House Radar Library: Norwood, MA, USA, 2005. [Google Scholar]
- Fuhrmann, L.; Biallawons, O.; Klare, J.; Panhuber, R.; Klenke, R.; Ender, J. Micro-Doppler analysis and classification of UAVs at Ka band. In Proceedings of the 2017 18th International Radar Symposium (IRS), Prague, Czech Republic, 28–30 June 2017; pp. 1–9. [Google Scholar] [CrossRef]
- Harmanny, R.I.A.; de Wit, J.J.M.; Cabic, G.P. Radar micro-Doppler feature extraction using the spectrogram and the cepstrogram. In Proceedings of the 2014 11th European Radar Conference, Rome, Italy, 8–10 October 2014; pp. 165–168. [Google Scholar] [CrossRef] [Green Version]
- Molchanov, P.; Harmanny, R.I.; de Wit, J.J.; Egiazarian, K.; Astola, J. Classification of small UAVs and birds by micro-Doppler signatures. Int. J. Microw. Wirel. Technol. 2014, 6, 435–444. [Google Scholar] [CrossRef] [Green Version]
- Galati, G. Advanced Radar Techniques and Systems; Peter Peregrinus Ltd., on behalf of the Institution of Electrical Engineers: London, UK, 1993. [Google Scholar]
- Chen, V. The Micro-Doppler Effect in Radar; Artech House: Norwood, MA, USA, 2011. [Google Scholar]
- Chen, V.; Tahmoush, D. Radar Micro-Doppler Signatures: Processing and Applications; IET Radar, Sonar and Navigation Series 34; IET Digital Library: London, UK, 2014. [Google Scholar]
- Zhang, Q. Micro-Doppler Characteristics of Radar Targets; Butterworth-Heinemann: Woburn, MA, USA; Elsevier: Amsterdam, The Netherlands, 2016. [Google Scholar]
- Gu, J.C. Short-Range Micro-Motion Sensing with Radar Technology; IET Control, Robotics and Sensors Series 125; IET Digital Library: London, UK, 2019. [Google Scholar]
- Kim, K.; Kim, J.H. Polynomial Regression Predistortion for Phase Error Calibration in X-Band SAR. IEEE Geosci. Remote Sens. Lett. 2022, 19, 4002705. [Google Scholar] [CrossRef]
- Brooks, D.; Schwander, O.; Barbaresco, F.; Schneider, J.Y.; Cord, M. Deep Learning and Information Geometry for Drone Micro-Doppler Radar Classification. In Proceedings of the 2020 IEEE Radar Conference (RadarConf20), Florence, Italy, 21–25 September 2020; pp. 1–6. [Google Scholar] [CrossRef]
- Brooks, D.A.; Schwander, O.; Barbaresco, F.; Schneider, J.Y.; Cord, M. Complex-valued neural networks for fully-temporal micro-Doppler classification. In Proceedings of the 2019 20th International Radar Symposium (IRS), Ulm, Germany, 26–28 June 2019; pp. 1–10. [Google Scholar] [CrossRef] [Green Version]
- Brooks, D.A.; Schwander, O.; Barbaresco, F.; Schneider, J.Y.; Cord, M. Temporal Deep Learning for Drone Micro-Doppler Classification. In Proceedings of the 2018 19th International Radar Symposium (IRS), Bonn, Germany, 20–22 June 2018; pp. 1–10. [Google Scholar] [CrossRef]
- Gérard, J.; Tomasik, J.; Morisseau, C.; Rimmel, A.; Vieillard, G. Micro-Doppler Signal Representation for Drone Classification by Deep Learning. In Proceedings of the 2020 28th European Signal Processing Conference (EUSIPCO), Amsterdam, The Netherlands, 18–21 January 2021; pp. 1561–1565. [Google Scholar] [CrossRef]
- Fioranelli, F. Monostatic and Bistatic Radar Measurements of Birds and Micro-Drone. In Proceedings of the IEEE Radar Conference (RadarConf), Philadelphia, PA, USA, 2–6 May 2016. [Google Scholar]
- Misiurewicz, J.; Kulpa, K.; Czekala, Z. Analysis of recorded helicopter echo. In Proceedings of the Radar 97 (Conf. Publ. No. 449), Edinburgh, UK, 14–16 October 1997; pp. 449–453. [Google Scholar] [CrossRef]
- Martin, J.; Mulgrew, B. Analysis of the theoretical radar return signal form aircraft propeller blades. In Proceedings of the IEEE International Conference on Radar, Arlington, VA, USA, 7–10 May 1990; pp. 569–572. [Google Scholar] [CrossRef]
- Bjorklund, S. Target Detection and Classification of Small Drones by Boosting on Radar Micro-Doppler. In Proceedings of the 15th European Radar Conference (EuRAD), Madrid, Spain, 26–28 September 2018. [Google Scholar]
- Zhang, P.; Yang, L.; Chen, G.; Li, G. Classification of drones based on micro-Doppler signatures with dual-band radar sensors. In Proceedings of the 2017 Progress in Electromagnetics Research Symposium-Fall (PIERS-FALL), Singapore, 19–22 November 2017; pp. 638–643. [Google Scholar] [CrossRef]
- Raval, D.; Hunter, E.; Hudson, S.; Damini, A.; Balaji, B. Convolutional Neural Networks for Classification of Drones Using Radars. Drones 2021, 5, 149. [Google Scholar] [CrossRef]
Figure 1.
Geometrical models to compute the radar returned signal: single blade (on the left), single rotor helicopter, and quadcopter on the right.
Figure 1.
Geometrical models to compute the radar returned signal: single blade (on the left), single rotor helicopter, and quadcopter on the right.

Figure 2.
Typical radar chain, composed of MTI, MTD, and CFAR, and related points, in which the spectrogram, spectrum, and features classification can be implemented.
Figure 2.
Typical radar chain, composed of MTI, MTD, and CFAR, and related points, in which the spectrogram, spectrum, and features classification can be implemented.

Figure 3.
Pictorial view of the radar echoes of a given target and. The radar signal can be folded every PRT and represented on the fast-slow time plane. Fixing the time from the transmitted pulse (fast time) is possible to fix the target distance that we are processing. Collection of the echoes along the slow time is possible to extract a time series representing the same target useful to estimate its spectrum and/or spectrogram.

Figure 4.
Real and simulated spectrogram of the helicopter drone. Adapted from [21].
Figure 4.
Real and simulated spectrogram of the helicopter drone. Adapted from [21].

Figure 5.
Real and simulated spectrogram of the quadcopter drone. Adapted from [22].
Figure 5.
Real and simulated spectrogram of the quadcopter drone. Adapted from [22].

Figure 6.
Simulated helicopter spectrogram, spectrum, and features (first row); simulated fixed-wings UAV (or aircraft) spectrogram, spectrum, and features (second row); simulated quadcopter drone spectrogram, spectrum, and features (third row); and simulated helicopter drone spectrogram, spectrum, and features (fourth row).


Figure 7.
DJI Matrix 600 drone model.

Figure 8.
Simulated spectrum (red) vs. real spectrum (blue) after non-coherent integration.

Figure 9.
Details of the neural network used in the simulation (block diagram and parameters).

Figure 10.
F1-score vs. SNR in test, time on-target ms.

Figure 11.
F1-score vs. parameters variation rate, time on-target ms.

Figure 12.
F1-score vs. time on-target.


Table 1.
Relationship between target physical characteristics and the signal, spectrogram, and spectrum parameters.
Table 1.
Relationship between target physical characteristics and the signal, spectrogram, and spectrum parameters.
| Target Physical Characteristic | Signal, Spectrogram, Spectrum Parameters |
|---|---|
| Rotation Rate, | Time Period of blade Flashes in spectrogram, |
| Blade Length, L | Frequency distance between spectrum Diracs, |
| Number of Blades, | Maximum Doppler Shift, |
| Blade Tip Velocity, |
Table 2.
DJI Matrix 600 drone’s main characteristics.
| Characteristics | DJI Matrix 600 |
|---|---|
| Weight [kg] | 10 |
| Max Speed [m/s] | 30 |
| Max Ascent Speed [m/s] | 5 |
| Max Descent Speed [m/s] | 3 |
| Hovering Time [min] | 30 |
| Max Angular Velocity [deg/s] | 250 |
| Diagonal Wheelbase [mm] | 1100 |
Table 3.
Target parameters considered in the neural network training phase. * In the case of UAV, the contribution of the propeller is considered negligible due to its relative small dimension and due to the fact that its plane of rotation is perpendicular to the line of sigh of the radar, producing almost zero Doppler frequency.
| Target Class | L [m] | [rev/s] | RCStot [m2] | ||
|---|---|---|---|---|---|
| Helicopter | 1 | 2 | 8 ± 10% | 5 ± 10% | 3 ± 10% |
| Fixed-Wings UAV * (or aircraft) | - | - | - | - | 10 |
| Quadcopter drone | 4 | 2 | 0.1± 10% | 100 ± 10% | 0.01 ± 10% |
| Helicopter drone | 1 | 2 | 0.6 ± 10% | 25 ± 10% | 0.1 ± 10% |
Table 4.
Confusion matrix: classification results with spectrogram samples, dB in test, ms.
| REAL/PRED | HELICOPTER | FW-UAV | QUAD-DRONE | HEL-DRONE | |
|---|---|---|---|---|---|
| HELICOPTER | 1215 | 35 | 0 | 0 | % |
| FW-UAV | 0 | 1250 | 0 | 0 | 100% |
| QUAD-DRONE | 0 | 0 | 750 | 500 | % |
| HEL-DRONE | 0 | 0 | 250 | 1000 | % |
| 100% | % | % | % | % |
Table 5.
Confusion matrix: classification results with spectrum samples, dB in test, ms.
| REAL/PRED | HELICOPTER | FW-UAV | QUAD-DRONE | HEL-DRONE | |
|---|---|---|---|---|---|
| HELICOPTER | 989 | 261 | 0 | 0 | % |
| FW-UAV | 93 | 1157 | 0 | 0 | % |
| QUAD-DRONE | 0 | 0 | 1153 | 97 | % |
| HEL-DRONE | 0 | 1 | 277 | 972 | % |
| % | % | % | % | % |
Table 6.
Confusion matrix: classification results with features, dB in test, ms.
| REAL/PRED | HELICOPTER | FW-UAV | QUAD-DRONE | HEL-DRONE | |
|---|---|---|---|---|---|
| HELICOPTER | 1034 | 206 | 8 | 2 | % |
| FW-UAV | 0 | 1241 | 9 | 0 | % |
| QUAD-DRONE | 0 | 158 | 1092 | 0 | % |
| HEL-DRONE | 0 | 1 | 58 | 1191 | % |
| 100% | % | % | % | % |
Publisher’s Note: MDPI stays neutral with regard to jurisdictional claims in published maps and institutional affiliations. |
© 2022 by the authors. Licensee MDPI, Basel, Switzerland. This article is an open access article distributed under the terms and conditions of the Creative Commons Attribution (CC BY) license (https://creativecommons.org/licenses/by/4.0/).
Share and Cite
MDPI and ACS Style
Leonardi, M.; Ligresti, G.; Piracci, E. Drones Classification by the Use of a Multifunctional Radar and Micro-Doppler Analysis. Drones 2022, 6, 124. https://0-doi-org.brum.beds.ac.uk/10.3390/drones6050124
AMA Style
Leonardi M, Ligresti G, Piracci E. Drones Classification by the Use of a Multifunctional Radar and Micro-Doppler Analysis. Drones. 2022; 6(5):124. https://0-doi-org.brum.beds.ac.uk/10.3390/drones6050124
Chicago/Turabian StyleLeonardi, Mauro, Gianluca Ligresti, and Emilio Piracci. 2022. "Drones Classification by the Use of a Multifunctional Radar and Micro-Doppler Analysis" Drones 6, no. 5: 124. https://0-doi-org.brum.beds.ac.uk/10.3390/drones6050124