
Influence of VF and SOR-Filtering Methods on Tree Height Inversion Using Unmanned Aerial Vehicle LiDAR Data
by
 , and
, and
Di Duan
1,2,3,4 ,
,
Yuncheng Deng
1,2,4,
Jianpeng Zhang
1,2,4,
Jinliang Wang
1,2,3,4,* and
Pinliang Dong
5 
1
Faculty of Geography, Yunnan Normal University, Kunming 650504, China
2
Key Laboratory of Resources and Environmental Remote Sensing for Universities in Yunnan, Kunming 650504, China
3
Southwest United Graduate School, Kunming 650092, China
4
Remote Sensing Research Laboratory, Center for Geospatial Information Engineering and Technology of Yunnan Province, Kunming 650504, China
5
Department of Geography and Environment, University of North Texas, Denton, TX 76203, USA
*
Author to whom correspondence should be addressed.
Drones 2024, 8(4), 119; https://0-doi-org.brum.beds.ac.uk/10.3390/drones8040119
Submission received: 30 January 2024
/
Revised: 19 March 2024
/
Accepted: 22 March 2024
/
Published: 23 March 2024
(This article belongs to the Section Drones in Agriculture and Forestry)
Abstract
:Forests, as the main body of the terrestrial ecosystem, have long been focal points for accurate structural parameter extraction. Among these parameters, tree height is a fundamental measurement factor that plays an important role in monitoring forest structure and biomass. The emergence of unmanned aerial vehicle light detection and ranging (UAV-LiDAR) technology has provided a strong guarantee of the acquisition of forest tree height parameters. However, UAV-LiDAR point cloud data have problems such as a large volume and data redundancy, and different point cloud data processing methods have different effects. Based on voxel filtering (VF) and statistical outlier removal (SOR)point cloud data processing experimental analysis, this study explored the influence of different filtering methods on the forest tree height inversion efficiency and accuracy. First, the point cloud data processed by VF is significantly better than that of SOR in terms of point cloud number, file size, running time, etc. The number of point clouds for VF decreased by an average of 96.91% compared with the original point clouds. Second, the VF tree height inversion accuracy was better than the tree height inversion data using SOR. The average accuracy of VF was 96.24%, while that of SOR was 94.17%. In summary, VF can effectively reduce data redundancy and improve tree height inversion accuracy.
1. Introduction
Forests constitute the main body of the global terrestrial ecosystem and are often referred to as the “lungs of the Earth”. As an important natural resource in the global climate system, forests have contributed to the realization of “green carbon banks” [1,2,3]. Forest resources have many ecological functions in the terrestrial ecosystem carbon cycle, such as regulating climate, conserving water resources, fixing carbon, releasing oxygen, and conserving biodiversity [4,5]. Forest structural parameters such as canopy cover, tree density, diameter at breast height, and tree height serve as important criteria characterizing the growth status of a forest, determining the rationality of the forest spatial structure, and evaluating the ecological functions of a forest. Tree height stands out as one of the most important forest structural parameters, and it is widely used to estimate terrestrial forest carbon reserves, as well as in biomass monitoring and forest health assessment [6,7,8].
Currently, the measuring of forest tree height is mainly achieved using the following methods:
(1) The traditional method of measuring tree height in the field uses some instruments to measure tree height, including the Blume-LEISS, mirror relascope Spiegel relaskop, DQW-2, and laser height meter [9]. Among them, the Blume-LEISS is widely used in forestry work around the world due to its ease of transport, simple operation, and high measurement accuracy [10]. However, these instruments have limitations in tree height measurement; for example, it is difficult for Blume-LEISS to observe tree tops and tree bases in dense forests, and the accuracy of readings is easily affected by the observation distance; the laser beam of a laser altimeter is easily affected by environmental restrictions, thus affecting the measurement efficiency and accuracy of tree height.
(2) The tree height is extracted based on the canopy height model (CHM) [11]. Tree height acquisition based on the CHM aims to directly estimate the tree height using the image target detection and recognition algorithms [12,13]. However, during the process of data collection using unmanned aerial vehicles (UAVs) owing to the mutual occlusion of the dense forest area, the data obtained for the canopy of the forest area are missing or redundant. Some holes are generated when the CHM is constructed. The height of these holes is lower than the surrounding pixels. As a result, the CHM produces leaky segmentation and over-segmentation during canopy segmentation leading to inaccurate tree height estimation using the CHM [14,15,16]. Although Zhang et al. [17] found that the pit-free CHM algorithm based on cloth simulation could effectively solve the problem of holes, the accuracy of extracting physical structure parameters of trees remains to be studied.
(3) Tree height inversion is also achieved based on light detection and ranging (LiDAR) [18,19,20]. According to different carrying platforms, LiDAR can be divided into spaceborne LiDAR, airborne LiDAR, shipborne LiDAR, and ground-based LiDAR [21]. Spaceborne LiDAR combines the advantages of LiDAR’s vertical information depiction and the characteristics of large-scale data acquisition. It has great advantages in the quantitative inversion of forest parameters at a large regional scale. It is one of the forest detection sensors focused on development by remote sensing agencies around the world. Wu [22] et al. used GLAS data to calculate tree height and combined it with multi-angle optical remote sensing image MISR data and applied the random forest model to establish a tree height map, achieving the expansion of tree height extraction from point to surface scale. However, for complex terrain conditions, this method requires further in-depth research. Xu et al. [23] explained the method of using GLAS data in forest canopy height inversion and found that terrain is one of the main factors affecting canopy height inversion. Although spaceborne LiDAR has made great progress in retrieving forest structure parameters, there are still many limitations, including under complex terrain conditions, the accuracy of forest structure parameters is easily affected, the data are discontinuous in spatial distribution, and the difficulty of obtaining forest level structure parameters. Yue et al. [24] pointed out that spaceborne LiDAR faces the following problems in the inversion research of forest structure parameters: low data coverage; serious information interference within the light spot; and low efficiency in integration with other loads.
Airborne LiDAR, also known as airborne laser scanning (ALS), is a technique that carries LiDAR on drones and other aircrafts to obtain the three-dimensional (3D) spatial information of objects [25]. Airborne LiDAR can be further divided into manned airborne LiDAR and unmanned aerial LiDAR. Li et al. [26] used UAV-LiDAR data combined with ground plot data to model the stand height of artificial forests. The results showed that UAV-LiDAR can be used to estimate stand height, but this study is not suitable for complex stands and forest type. The model has not been tested. Liu et al. [27] used UAV-LiDAR data to estimate the structural parameters of ginkgo, extracted parameters such as the tree height of ginkgo, and studied the impact of point clouds of different densities on ginkgo parameters. They found that point cloud density has little effect on tree height. Through the above research, it can be found that most of the current work focuses on parameter extraction and not much research has been conducted on point cloud data filtering. During LiDAR scanning, the instrument emits a laser beam and receives the reflected signal to measure the position and distance of the target object. These measurement results are organized as point clouds. After obtaining the UAV forest point cloud data, a series of processes such as denoising and filtering are performed on the point cloud data. After the processing is completed, the tree height is further extracted.
However, owing to the huge number of targets point clouds, several problems arise, including data redundancy, high requirements for computer hardware, a large segmentation operation load, slow processing speed, and difficulty developing the corresponding algorithms [28]. Discher et al. [29] use processing methods based on external storage and GPU to improve the processing efficiency of 4D point cloud, but they still need to use external storage and parallel processing to accelerate tasks, and there is no substantial improvement in the redundancy of point cloud data. In conclusion, compared with the traditional measurement methods and tree height measurement based on the CHM, the development of LiDAR technology offers new solutions for the measurement of tree height [30,31,32]. However, airborne LiDAR data redundancy is also one of the challenges faced in the tree height extraction process. How to ensure that the accuracy of tree height inversion is maintained at a high level with the smallest amount of data is an urgent problem that we need to solve.
In view of the current data redundancy problem faced by tree height extraction based on LiDAR technology, in the present study, the voxel filtering (VF) method and statistical outlier removal (SOR) method were used to de-redundantly process the airborne LiDAR data during the data processing stage. Combining these methods with the top–down regional growth algorithm, research was conducted on tree height inversion in sample plots, and the advantages and disadvantages of VF and the statistical filtering method in improving the efficiency of tree height inversion were explored based on a comparative analysis with the measured tree height results. This study aimed to explore the use of filtering methods to eliminate redundant LiDAR data and reliably extract accurate forest tree heights. The results indicate that the tree height can be extracted quickly and accurately using the VF filtering method, which effectively improves the data processing efficiency.
2. Materials and Methods
2.1. Study Area
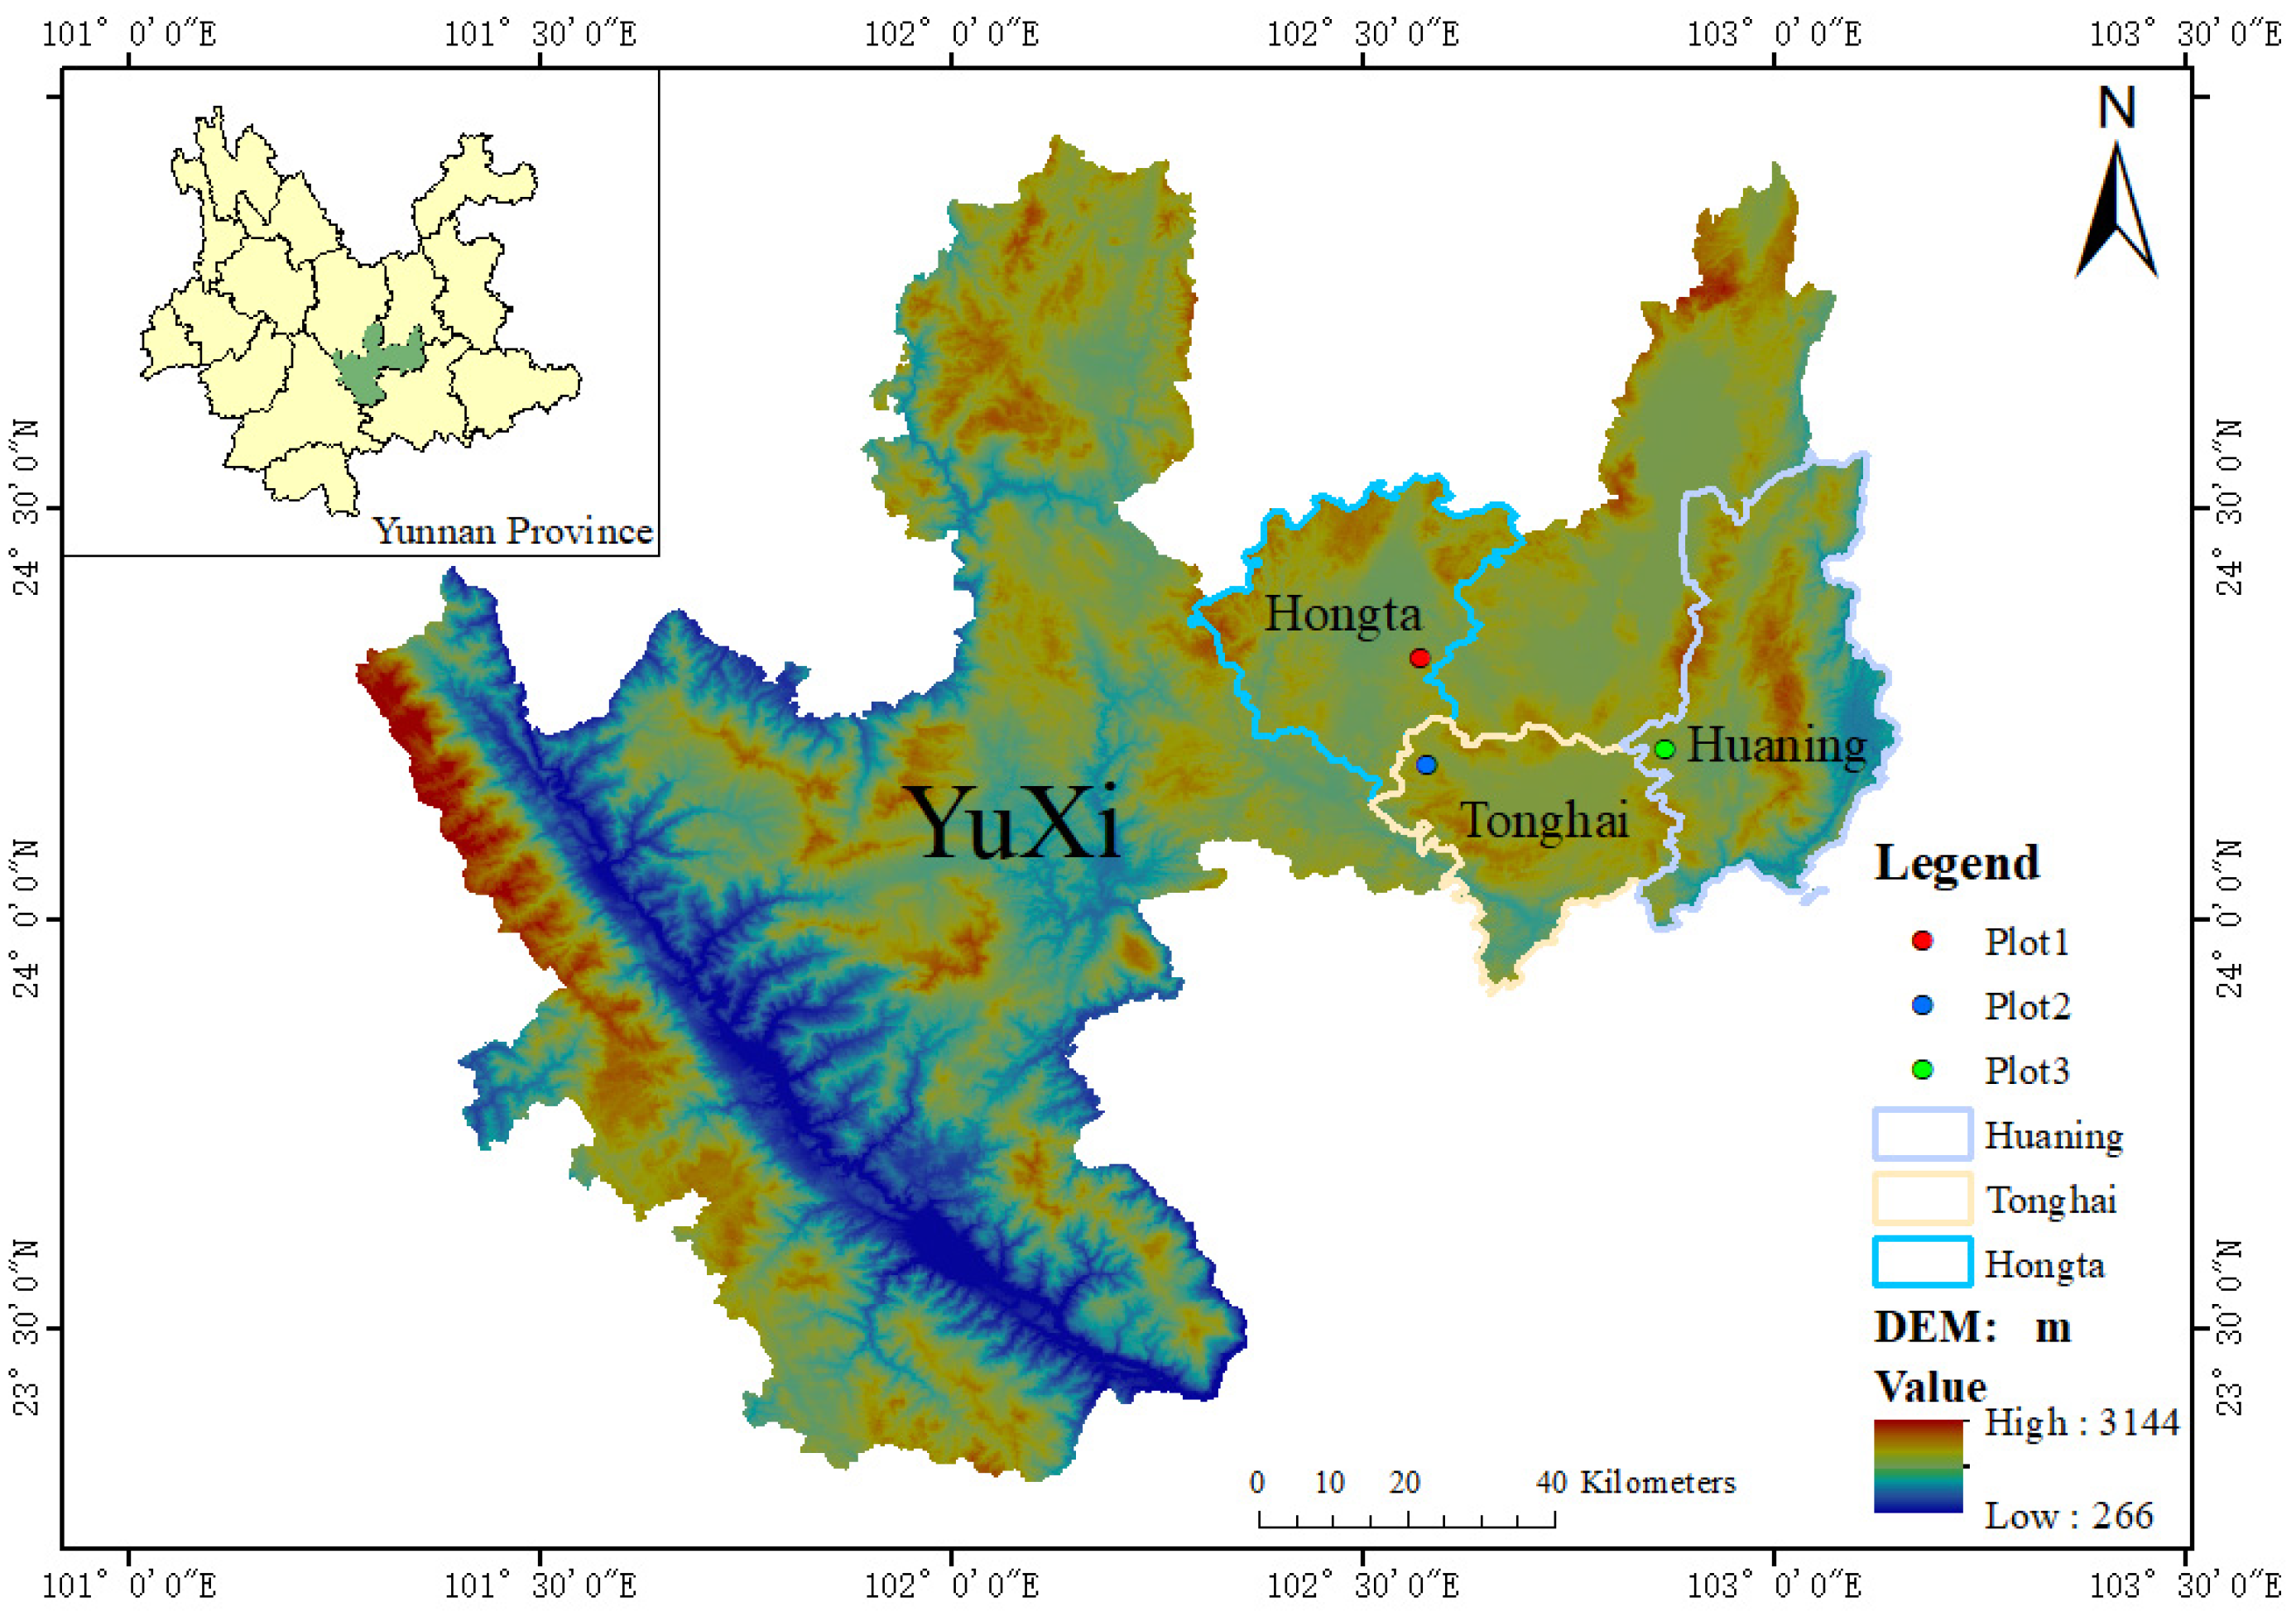
Yuxi City is located in the central part of Yunnan Province, which is high in the northwest and low in the southeast and features interconnected mountains, valleys, plateaus, and basins. It spans 172 km from east to west and 163.5 km from north to south. Yuxi City is located between 101°16′ E–103°09′ E and 23°19′ N–24°53′ N. The city’s total land area is 15,000 km2, putting it in 14th place in Yunnan Province. Most areas have an altitude of 1500–1800 m, with an average annual temperature of 16.4–24.6 °C and an average annual precipitation of 674–1023 mm. The study area exhibits a humid and cold winter plateau monsoon climate in the subtropical zone. The three-dimensional climate characteristics are noticeable, including mountain dams and valleys known as “natural greenhouses”. The forest area is 958,800 ha, and the forest coverage rate is 64.06%. The main vegetation consists of a Pinus yunnanensis forest, a wet evergreen broad-leaved forest, and a subhumid evergreen broad-leaved forest. As the dominant endemic local tree species, P. yunnanensis forest constitutes the main body of the forest stands in Yuxi City, accounting for 70% of the forest area of Yuxi City.
Three sample plots in Hongta, Tonghai, and Huaning were selected within Yuxi City, Yunnan Province, covering a total area of 2700 m2. The specific locations are shown in Figure 1 and the field data, and UAV-LiDAR point cloud data were collected for the three plots. The main tree species in these sample plots include P. yunnanensis, eucalyptus, and cypress. The forest stand structure and spatial structure of each sample plot are different. Sample plot 1 was located in a mixed P. yunnanensis and eucalyptus forest, with P. yunnanensis as the dominant species; sample plot 2 was located in a pure P. yunnanensis forest; and sample plot 3 was located in a pure cypress forest.
2.2. Field Data
The field data took place from the 3rd to 5th, July 2022. The sample plot size was set to 30 × 30 m. A random sampling method was used to select 30 trees in each sample plot, and these trees were systematically numbered. The position information of each numbered tree within the plot was measured using a handheld RTK. The height of each tree was measured three times with a Leica handheld altimeter, and the average value was used as the height of a single tree. The basic information of the study area plots is shown in Table 1.
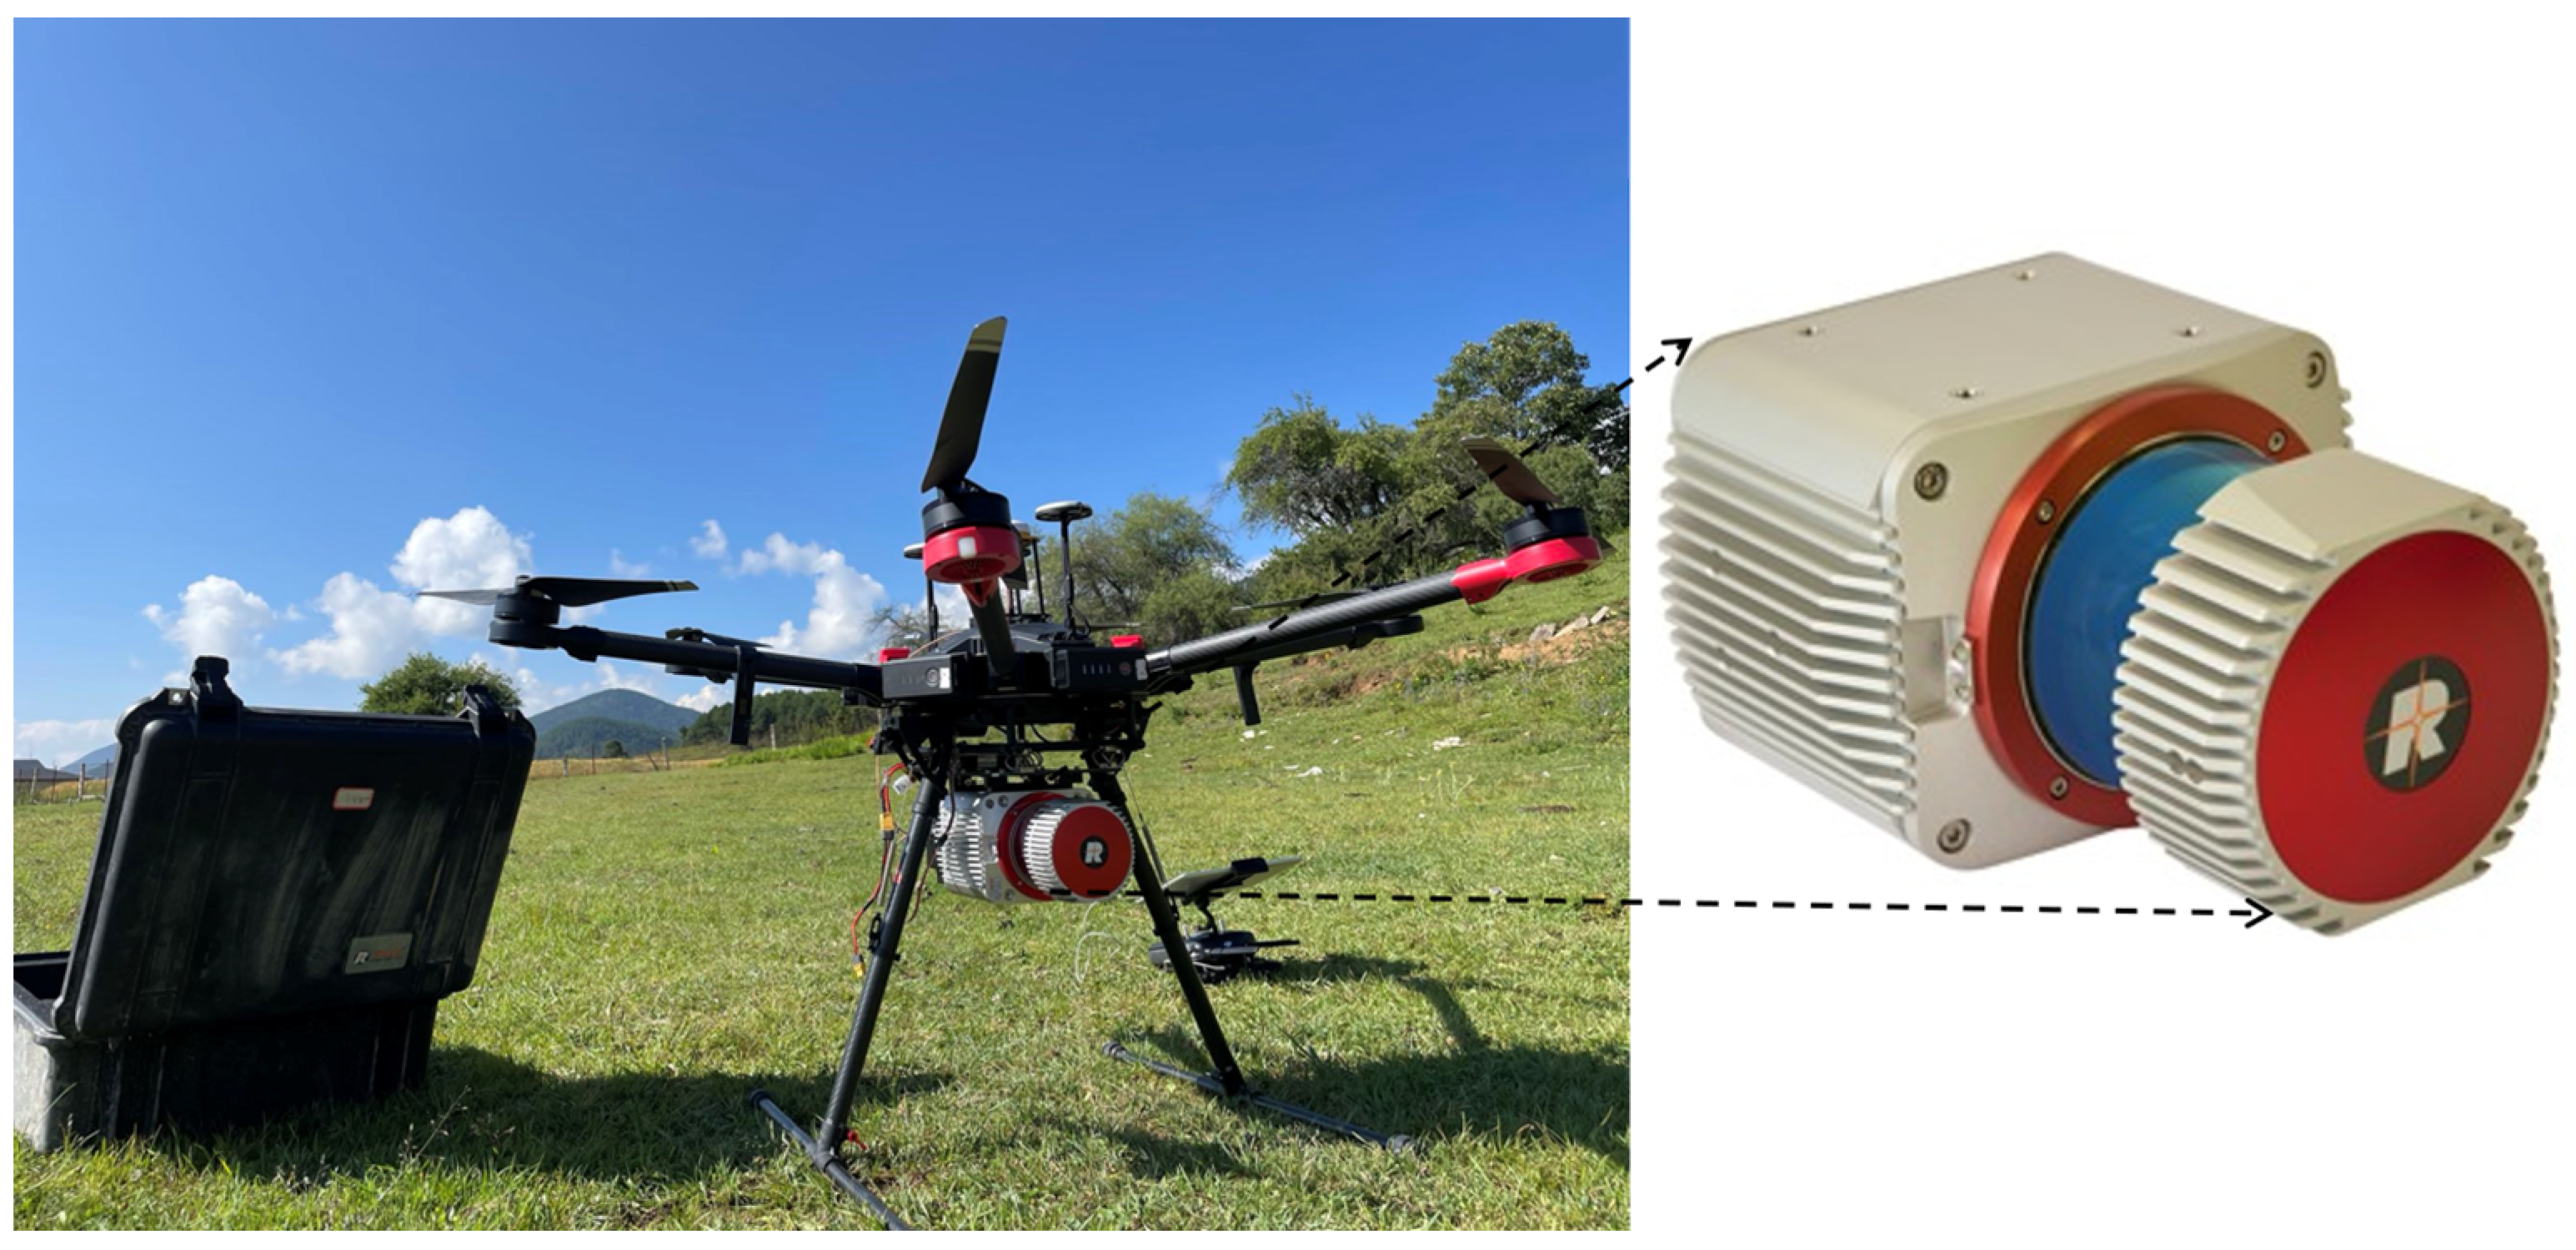
2.3. UAV-LiDAR Data
In our study, the raw UAV-LiDAR point clouds data were acquired from the 20th to 22th, November 2022 using a DJI M600 Pro multi-rotor UAV equipped with a RIEGL VUX-1UAV scanner (Figure 2). The specific parameters of the equipment are shown in Table 2 [33,34].
Under the planned route, the flight altitude of the UAV relative to the ground is 80 m, the flight speed is 5 m/s, the heading overlap rate is 80%, and the sidewise overlap rate is 70%. After obtaining the original point cloud data, a point cloud matching the sample plot size was cropped. The point cloud densities of the three plots were 1872.01 pts/m2, 3119.26 pts/m2, and 4774.83 pts/m2, respectively.
The main operations before filtering include point cloud coordinate conversion, cropping and elevation normalization. The purpose of performing elevation normalization on point cloud data is to eliminate the impact of rugged terrain on the accuracy of tree height inversion. Elevation normalization processing mainly refers to the process of subtracting the elevation of DEM and original point cloud data to obtain normalized raster point cloud data [35]. The process includes query and difference calculations. The coordinate values of x and y of the laser foot point are used to query the position of the point in the DEM grid, and the normalized elevation value H is obtained according to Formula (1):
where H represents the normalized elevation value, Hi represents the elevation value of the point searched for this location, and H0 represents the elevation value of the corresponding pixel. Therefore, elevation normalization of point clouds plays an important role in extracting individual tree parameters [36]. Finally, the data were processed using VF and SOR, and the tree height was extracted according to the processing results.
2.4. Methods
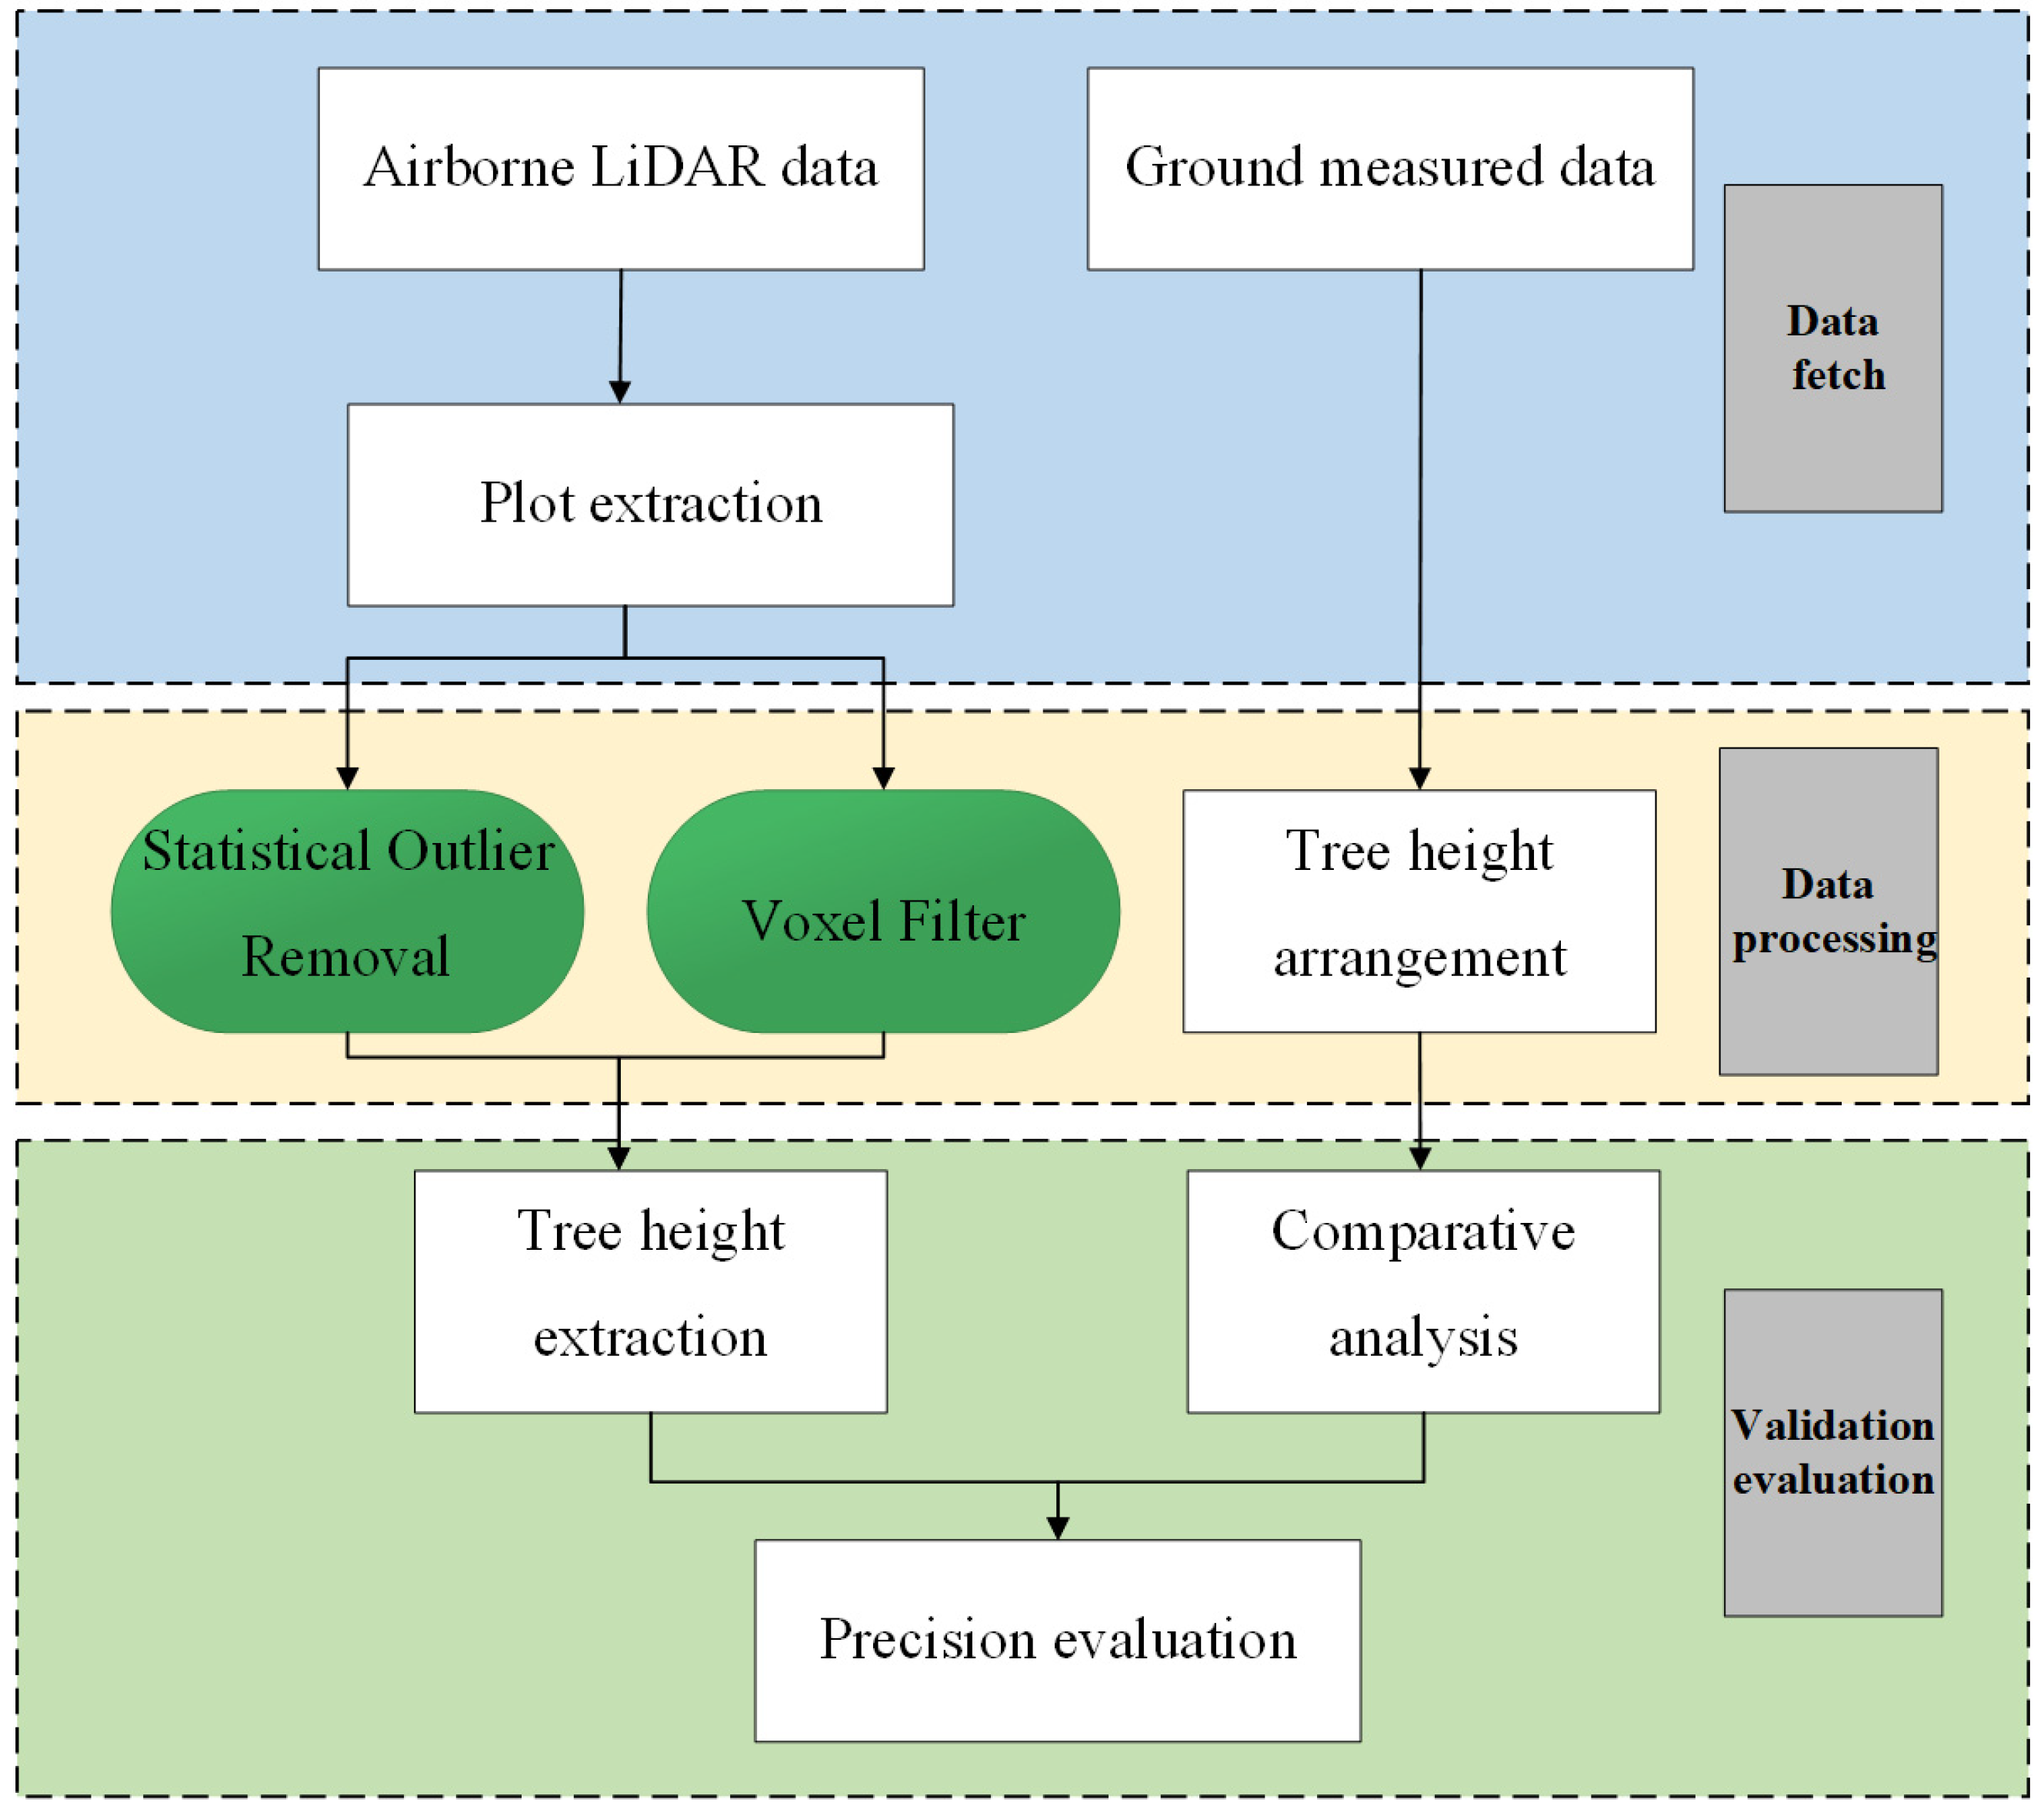
Python and Point Cloud Magic (PCM) software were employed to process the collected point clouds. Elevation normalization, filtering, digital elevation model generation, single-tree segmentation, tree height inversion, and other operations were performed. VF and SOR were used to filter the sample site cloud data, and the top–down region growth algorithm based on point clouds was used to segment individual trees and further reverse the tree height, aiming to reveal the influence of different filtering methods on the inversion of individual tree height. The flow of the study technique is shown in Figure 3.
2.4.1. SOR Algorithm
SOR is a filtering algorithm based on the statistical method that can be realized by the statistical analysis and processing of the data. When using this technique, it is assumed that the data points exhibit a Gaussian distribution, and the deviation from the average of the distance points is used as a standard to judge whether each point is an outlier. This deviation is calculated based on the standard deviation. If the point is far away from the average distance and exceeds the threshold, it is considered an outlier and removed. SOR can be expressed as follows: assuming that the distance between all neighboring points from point P is d1, d2, …, dn, then
In the formula, represents the average distance, n represents the number of adjacent points, S represents the standard deviation, Threshold represents the threshold parameter, and k represents the constant.
Regarding the threshold of SOR, it was found through experiments that when the number of neighborhood points is 6, the point cloud filtering effect is optimal. When the number of neighborhood points is between 1 and 6, the closer to 6, the better the effect. When the number of neighborhood points exceeds 6, the filtering effect will be poor and the running time will be longer. This is consistent with the threshold recommended by the PCM user manual [37]. So, we finally selected the neighborhood point number 6 as the threshold for SOR.
2.4.2. VF Algorithm
VF divides the space into cubes of equal volume, also known as voxels (Voxel Grid) and calculates the number of points included in each voxel [38]. Then, for each voxel, if the number of internal points exceeds the threshold, the voxel is retained; otherwise, all points among them are removed. By counting and analyzing the points inside each voxel, researchers can eliminate outliers and noise, and the point clouds can be smoothed. VF can be expressed as
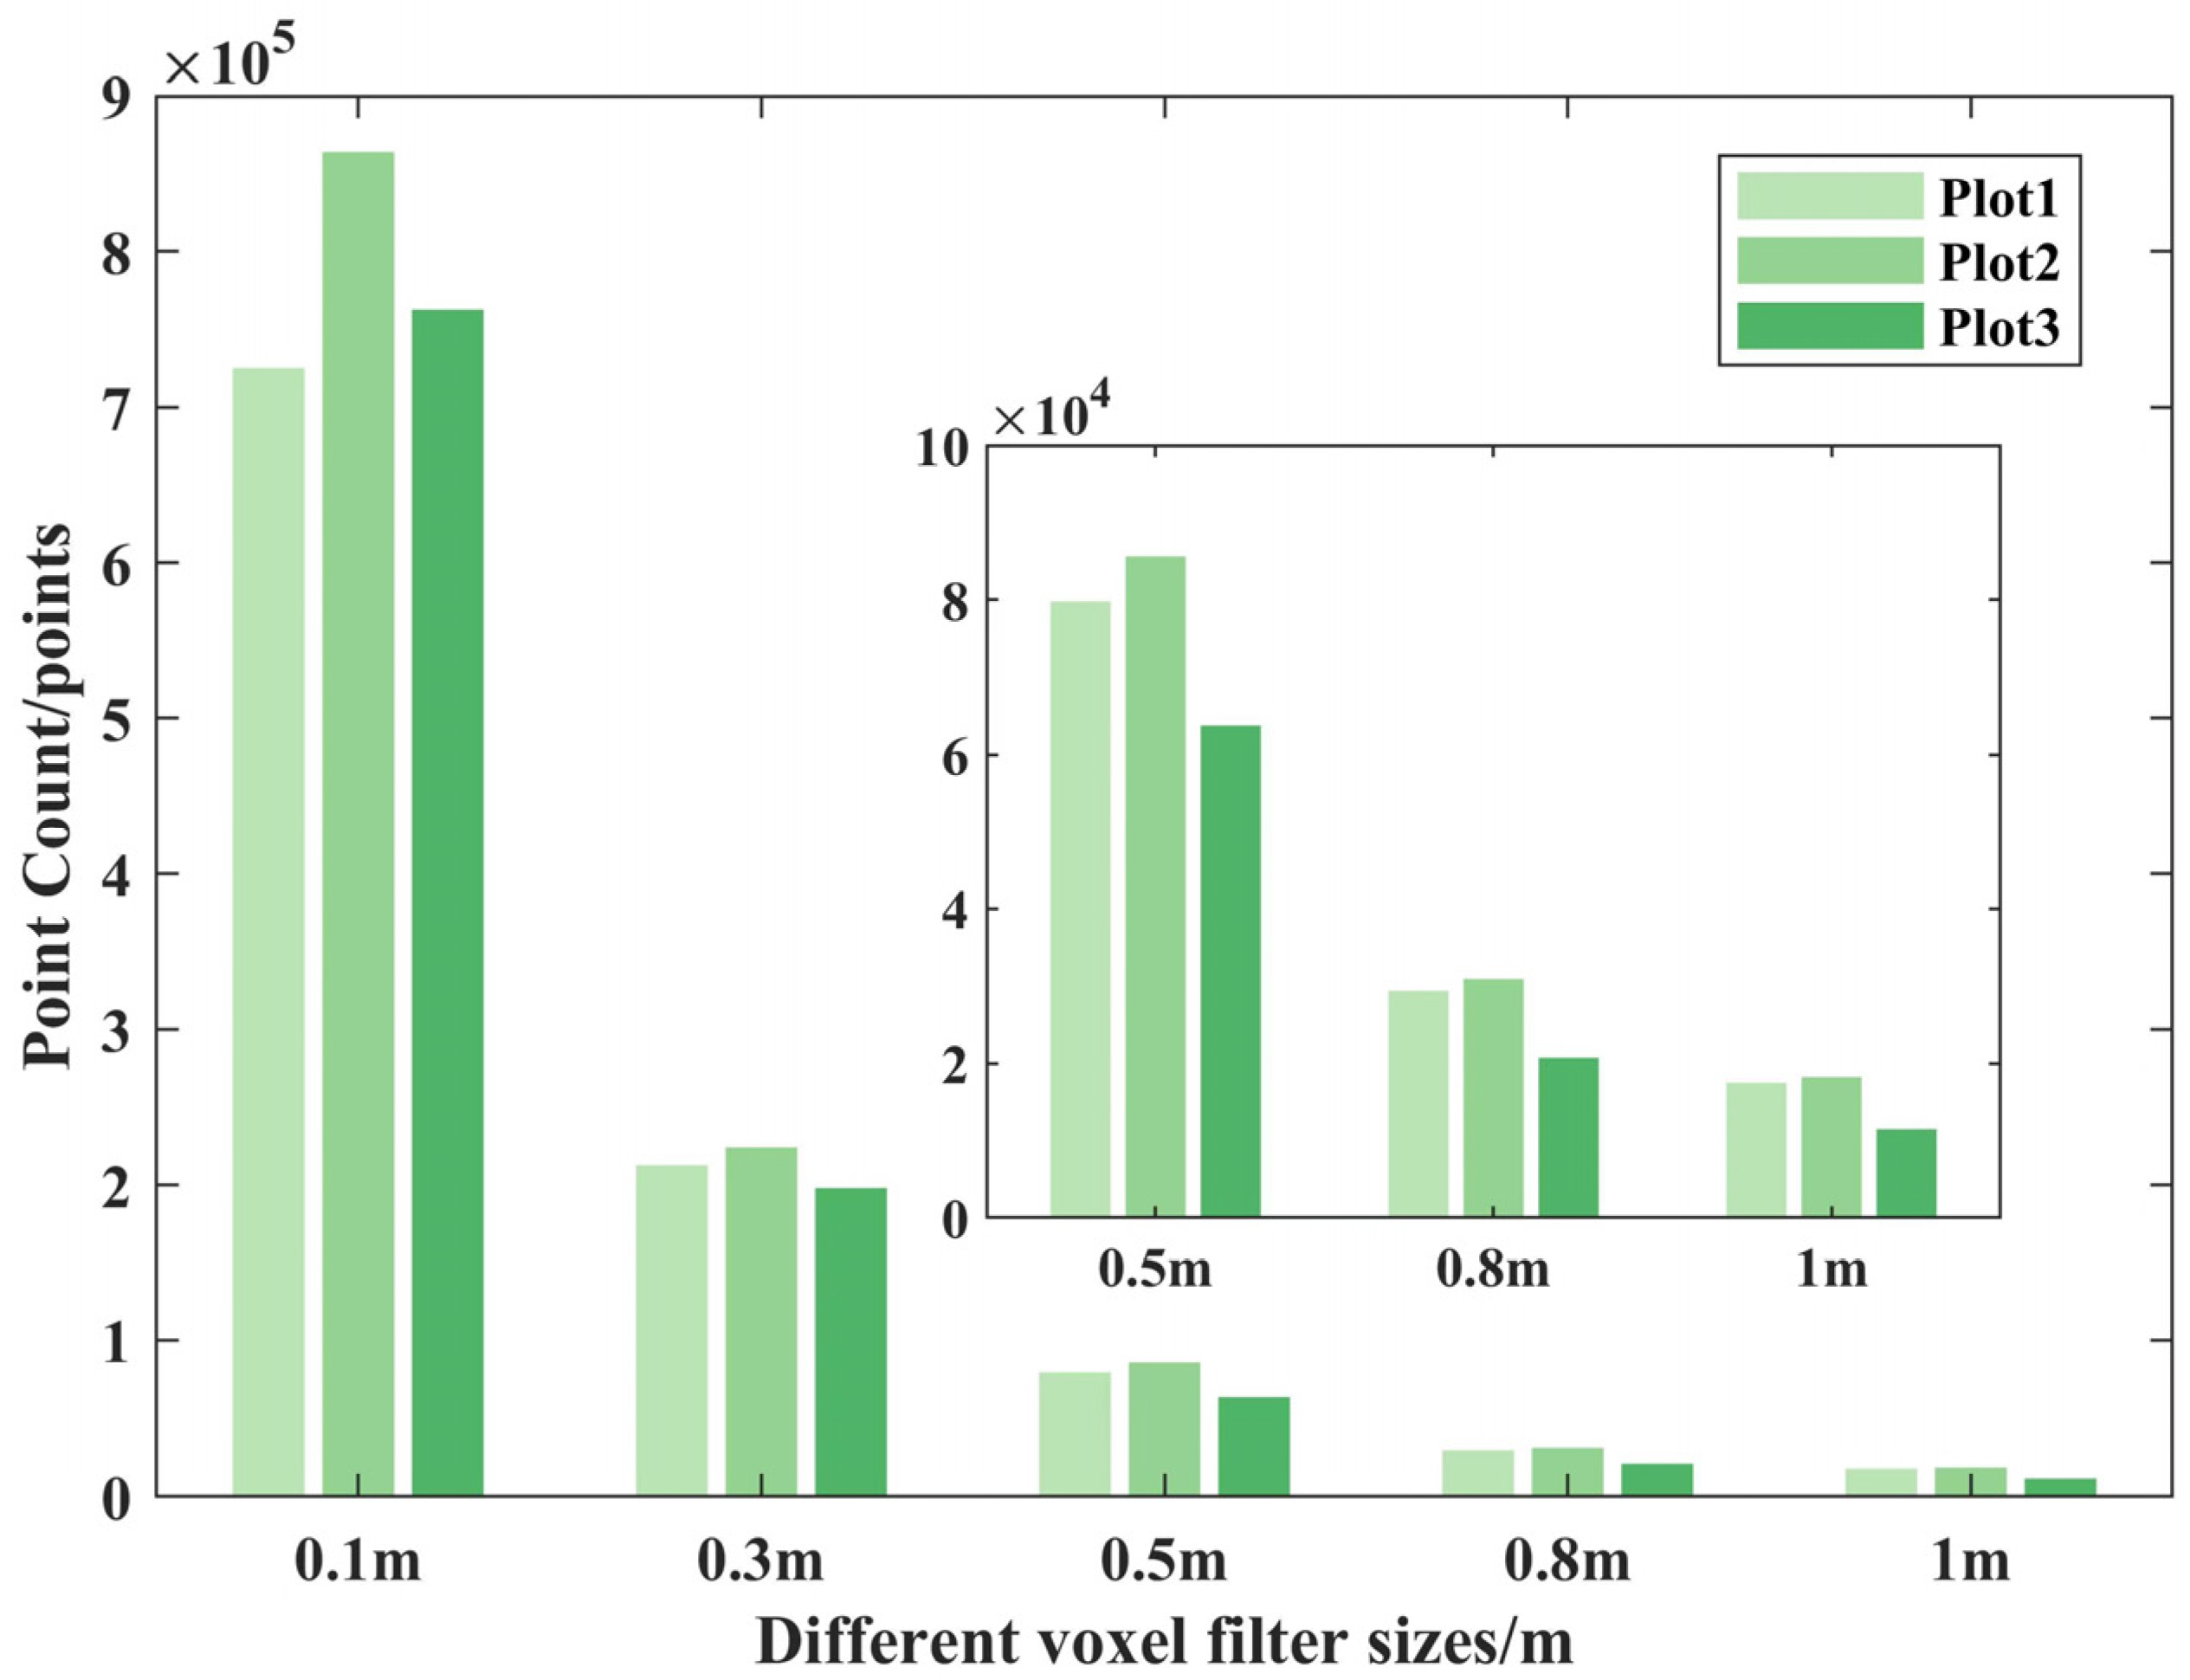
where P represents the set of input points; Q represents the set of output points; Vijk represents the voxels in row i, column j, and layer k; N (p) represents Vijk, the neighborhood; nk represents the number of points in N (p); and Threshold is the threshold parameter. The VF process can be described as follows: for the input point set P, if the number of points in the neighborhood exceeds the threshold, point p is retained in the output point set Q. The study determines the filtering threshold through the voxel filter size in open3d. Because it can adaptively retain the number of point clouds in the voxel and complete the filtering process according to the filter size, the number of point clouds in the voxel is not calculated.
Figure 4 shows the impact of different filter sizes on the number of point clouds. As the filter size increases, the density of point clouds gradually decreases, and the key features of the point cloud are still retained. However, when the filter is greater than 0.5 m, the number of point clouds decreases sharply; the plot information is distorted, only retaining the object features; and most of the data forest features are missing. Thus, the optimal filter size is 0.5 m.
2.4.3. Individual Tree Height Inversion
Research based on the UAV-LiDAR point cloud data uses the typically top–down regional growth algorithm combined with the threshold judgment method inversion tree height. Based on the relative spacing between all trees from the point cloud and single trees, the tree height is thus extracted. This algorithm from the highest tree to the shortest tree is ordered based on the point clouds, and according to the minimum spacing rules, each point is classified in terms of whether it belongs to a tree [39]. In each iteration, the algorithm removes points corresponding to the segmented tree from the point cloud until all trees have been segmented. This approach uses the local maximum filtering technique to identify the apex of the tallest tree. Points belonging to the tree are then clustered, and point cloud clusters corresponding to the target tree “grow” based on tree spacing [40]. The tree height is obtained by varying the Z value between the highest and lowest point of each tree. The calculation formula is
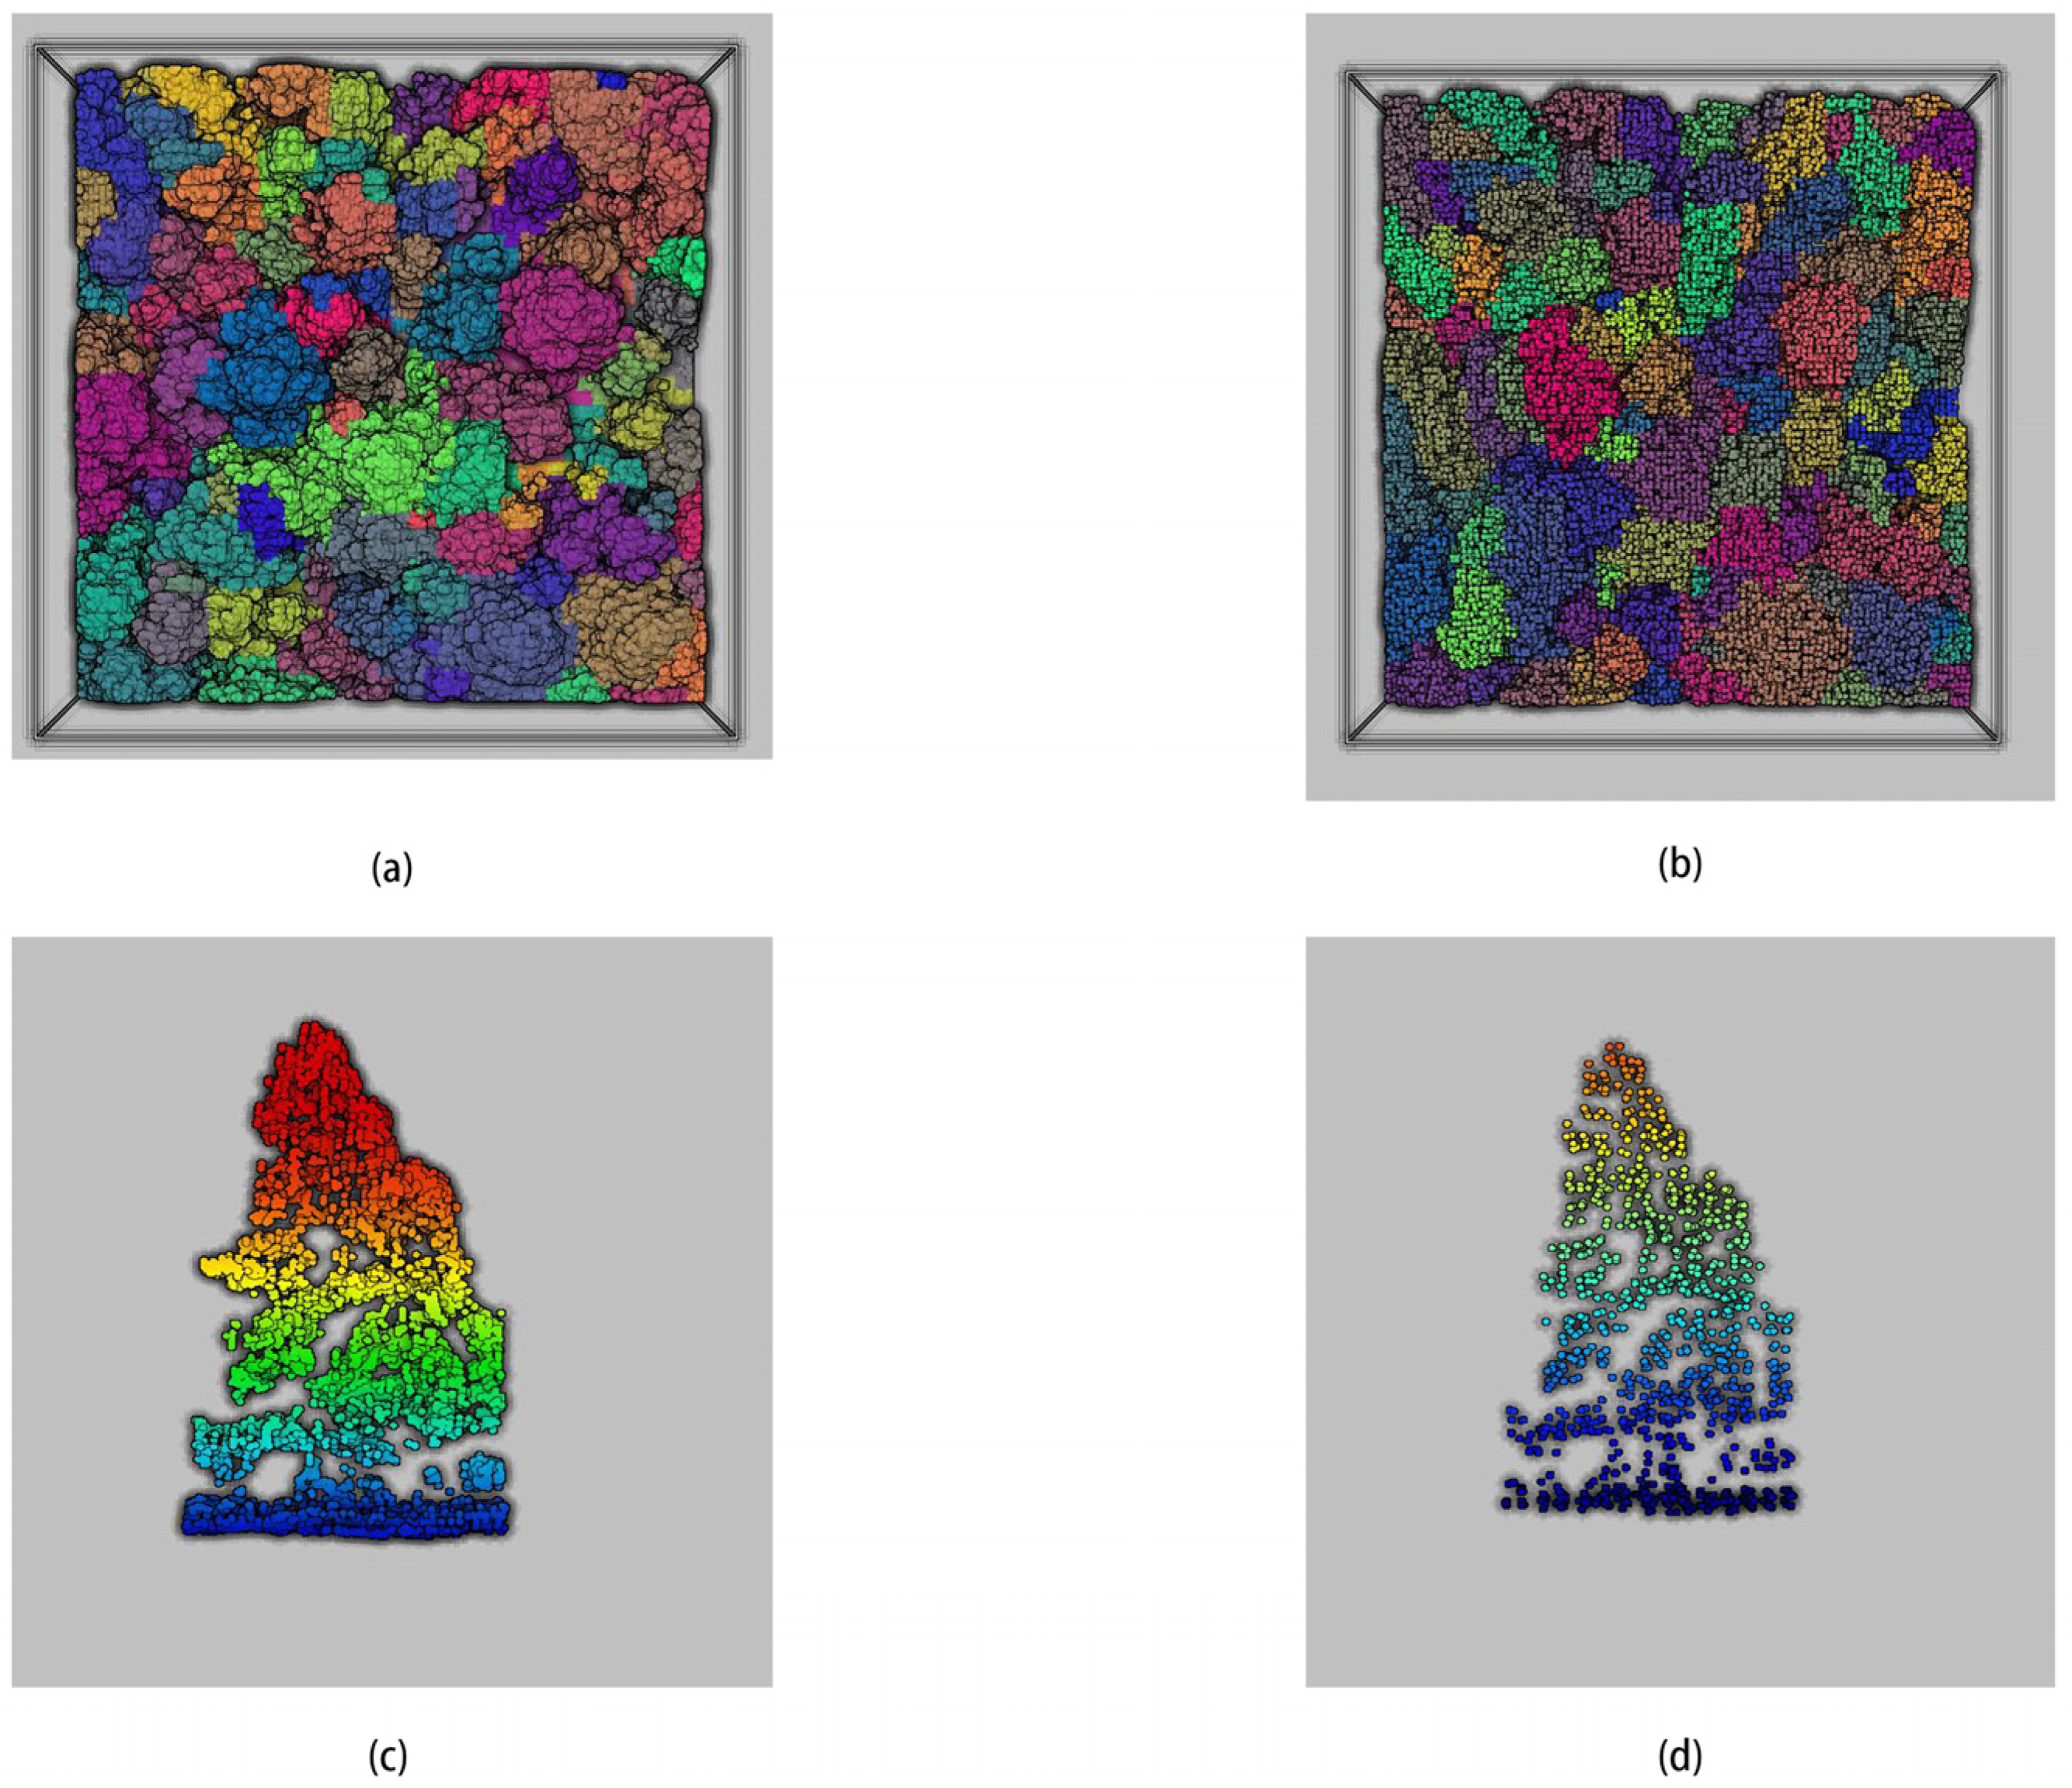
where H represents tree height, max (z) represents the z value of the highest point, and min (z) represents the z value of the lowest point. Figure 5 shows the top view of the single-tree point cloud segmentation in sample plot 1 after processing using two filtering methods and a comparison of selected single tree point clouds from the main view.
In the figure, (a) shows the top view of individual-tree segmentation after statistical outlier removal (SOR) processing, while (b) shows the top view of single-tree segmentation after voxel filtering (VF) processing. It can be seen that there are differences in the trees segmented using the two filtering methods; (c) and (d) show the same single tree segmented after processing, (c) is the single tree segmented after SOR processing, (d) is the single tree segmented after VF processing, and the key features of a single tree show little change.
3. Results
In this study, VF and SOR were used to process the UAV-LiDAR data and verify the influences of different filtering methods on tree height inversion by comparing the number of point clouds, scenes, computing efficiency, and height accuracy of the inversion trees.
3.1. Comparison of Point Cloud Number
Generally, the greater the density of the point cloud, the greater detail with which it can depict the features of ground objects and detect small targets, thereby reducing the dependence on interpolation algorithms and more accurately describing the features and laws of ground objects [41,42]. However, for tree height extraction, as long as the highest point and the lowest points of the tree are not filtered out, the accuracy of the tree height is generally unaffected. Processed through two filtering methods, we calculated the change in the number of processed point clouds relative to the original point clouds, and the percentage reduction in the number of point clouds can be calculated by Equation (7):
where, P represents the percentage reduction in the number of filtered point clouds compared with the original point cloud number, O represents the number of original point clouds, and F represents the number of filtered point clouds. The UAV-LiDAR data were processed using VF and SOR, and the number of point cloud changes was clear (Table 3).
Comparing the results shown in Table 3 revealed that in sample plots 1, 2, and 3, the number of point clouds after SOR processing decreased by 13.50%, 13.90%, and 12.18%, respectively, compared with the original point clouds, while the number of point clouds after VF processing decreased by 95.26%, 96.94%, and 98.52% compared with the original point clouds. This indicates that in terms of the number of point clouds, VF is better than SOR.
3.2. Impact of Tree Height Accuracy
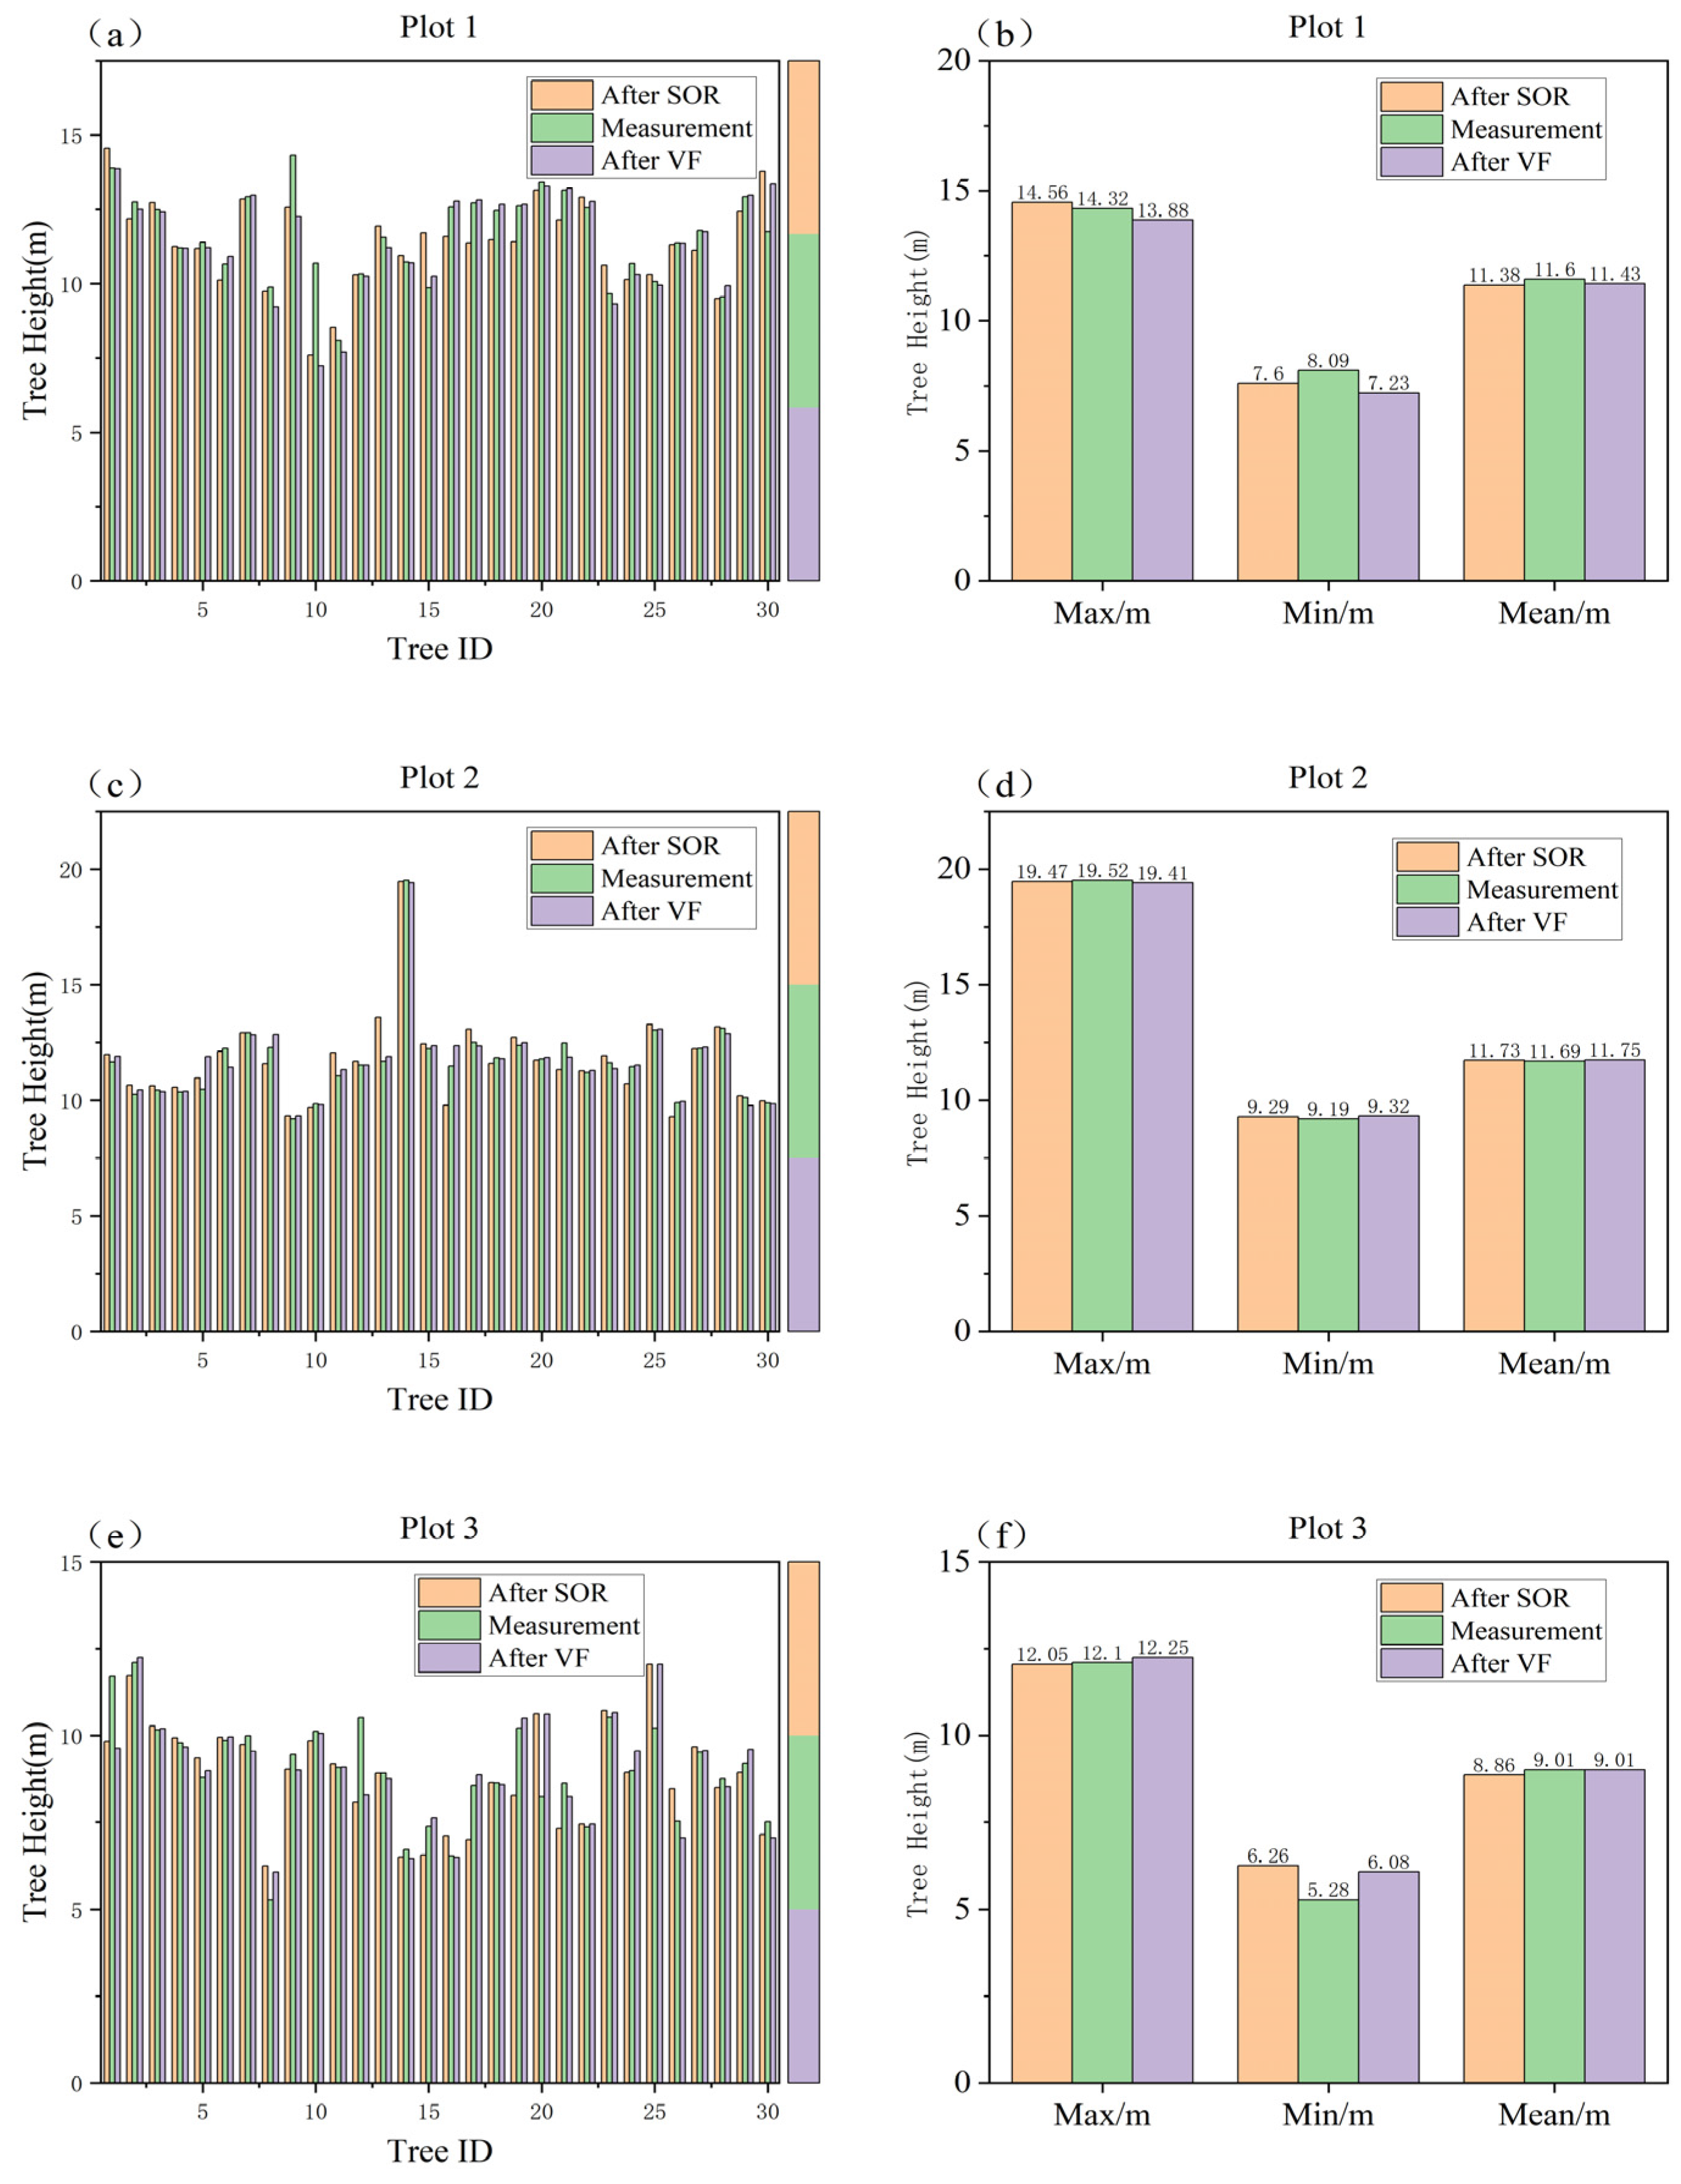
In sample plot 1, 84 trees were extracted after SOR, and 90 trees were extracted after VF, for a difference of six trees. For sample plot 2, 97 trees were extracted after SOR, and 102 trees were extracted after VF, for a difference of five trees. For sample plot 3, 89 trees were extracted after SOR, and 96 trees were extracted after VF, for a difference of seven trees. Each plot was separately matched to 30 measured trees through visual interpretation and compared with the measured tree heights of these 30 trees. Finally, the maximum, minimum, and mean values of the measured and extracted values were calculated, as shown in Figure 6.
The results show that compared with the measured values, the inversion results after VF processing were better than those after SOR processing. In sample plot 1, the mean tree heights extracted from the data processed by the two filtering methods were 11.38 m (by SOR) and 11.43 m (by VF). In sample plot 2, the mean tree heights extracted from the data processed by the two filtering methods were 11.73 m (by SOR) and 11.75 m (by VF). In sample plot 3, the mean tree heights extracted from the data processed by the two filtering methods were 8.86 m (by SOR) and 9.01 m (by VF). The smallest difference between the mean inversion tree height and the measured value after VF processing was found in sample plot 3, and the mean inversion tree height was equal to the mean measured value. The largest difference was detected in sample plot 1, and the difference was 0.17 m. The smallest difference between the mean tree height inversion after SOR processing and the actual measured value was obtained in sample plot 2, with a difference of 0.04 m, while the largest difference was found in sample plot 1, with a difference of 0.22 m. Generally, the tree inversion accuracy after VF could be maintained in a range close to the measured values, and the tree inversion accuracy of the three plots was better than the tree inversion accuracy after SOR processing.
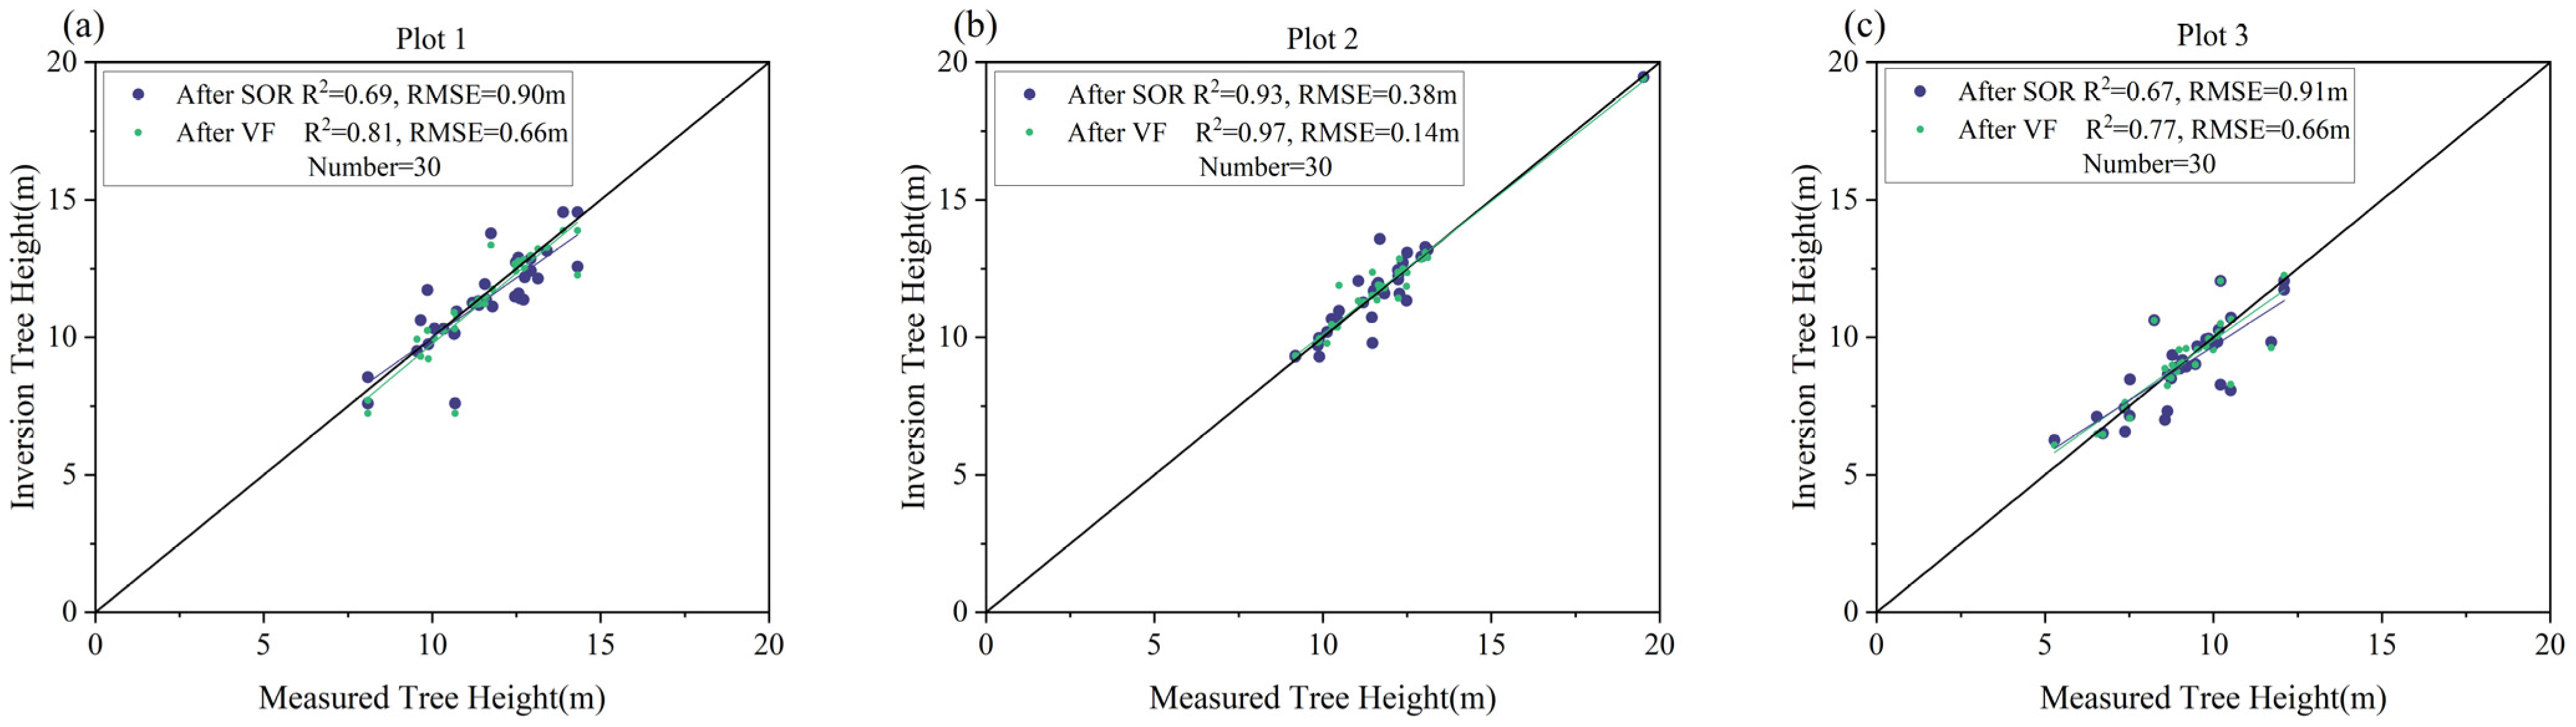
The accuracy of tree height extraction was evaluated by comparing the tree height of the inversion after VF and the tree height based on SOR filter inversion. The corresponding linear regression scatter plot was then created and can be seen in Figure 7. The tree height of the three plots’ inversion using the VF method had a high fit, with R2 values of 0.81, 0.97, and 0.77 (RMSE:0.66 m, 0.14 m, 0.66 m) for sample plots 1, 2 and 3, while the inversion tree height after SOR processing was consistent with the measured tree height, with R2 values of 0.69, 0.93, and 0.67 (RMSE:0.90 m, 0.38 m, 0.91 m). The VF method greatly reduced the data redundancy and maintained the accuracy of the data, indicating that processing data using the VF method was feasible in tree height inversion.
The suitability of different filtering methods was also evaluated by calculating the height accuracy of each tree extracted from the data processed using the two filtering methods. The accuracy calculation formula is
In this formula, HA represents the height precision of the extraction tree, MH represents the measured tree height, and H represents the inversion tree height.
Equation (8) was used to find the accuracy values of the two methods for the three plots (Table 4). The overall deviation between the tree estimation and the measured value, extracted based on the VF-processed data used in the study, was relatively small and more accurate than the SOR-processed data.
3.3. Scene Comparison
The UAV-LiDAR point cloud data were used to further calculate the average slope and forest stand density to analyze and discuss the applicability of the two filtering methods for forest scenes. The stand density can be calculated using Equation (9):
In this formula, D represents the stand density (in plants/ha), N represents the number of trees, and A represents the forest area. The forest density of the three plots was calculated using the number of trees segmented from the point cloud data processed using the two filtering methods, as detailed in Table 5.
As shown in Table 5, sample plots 1 and 3 had similar slopes, while plot 2 had a relatively steep slope, and the altitudes of the three plots were relatively similar. Sample plot 2 was located in a P. yunnanensis forest with an average slope of 22.22°, with the smallest difference in stand density of 55 plants/ha, and sample plot 3 was a cypress forest with an average slope of 14.84°, with the largest difference of 77.67 plants/ha. Combined with the calculated tree height mean accuracy, it was found that the VF method had the best effect in scenes mainly collected from a P. yunnanensis pure forest, followed by scenes from a mixed forest and other forest scenes.
3.4. Performance Comparison
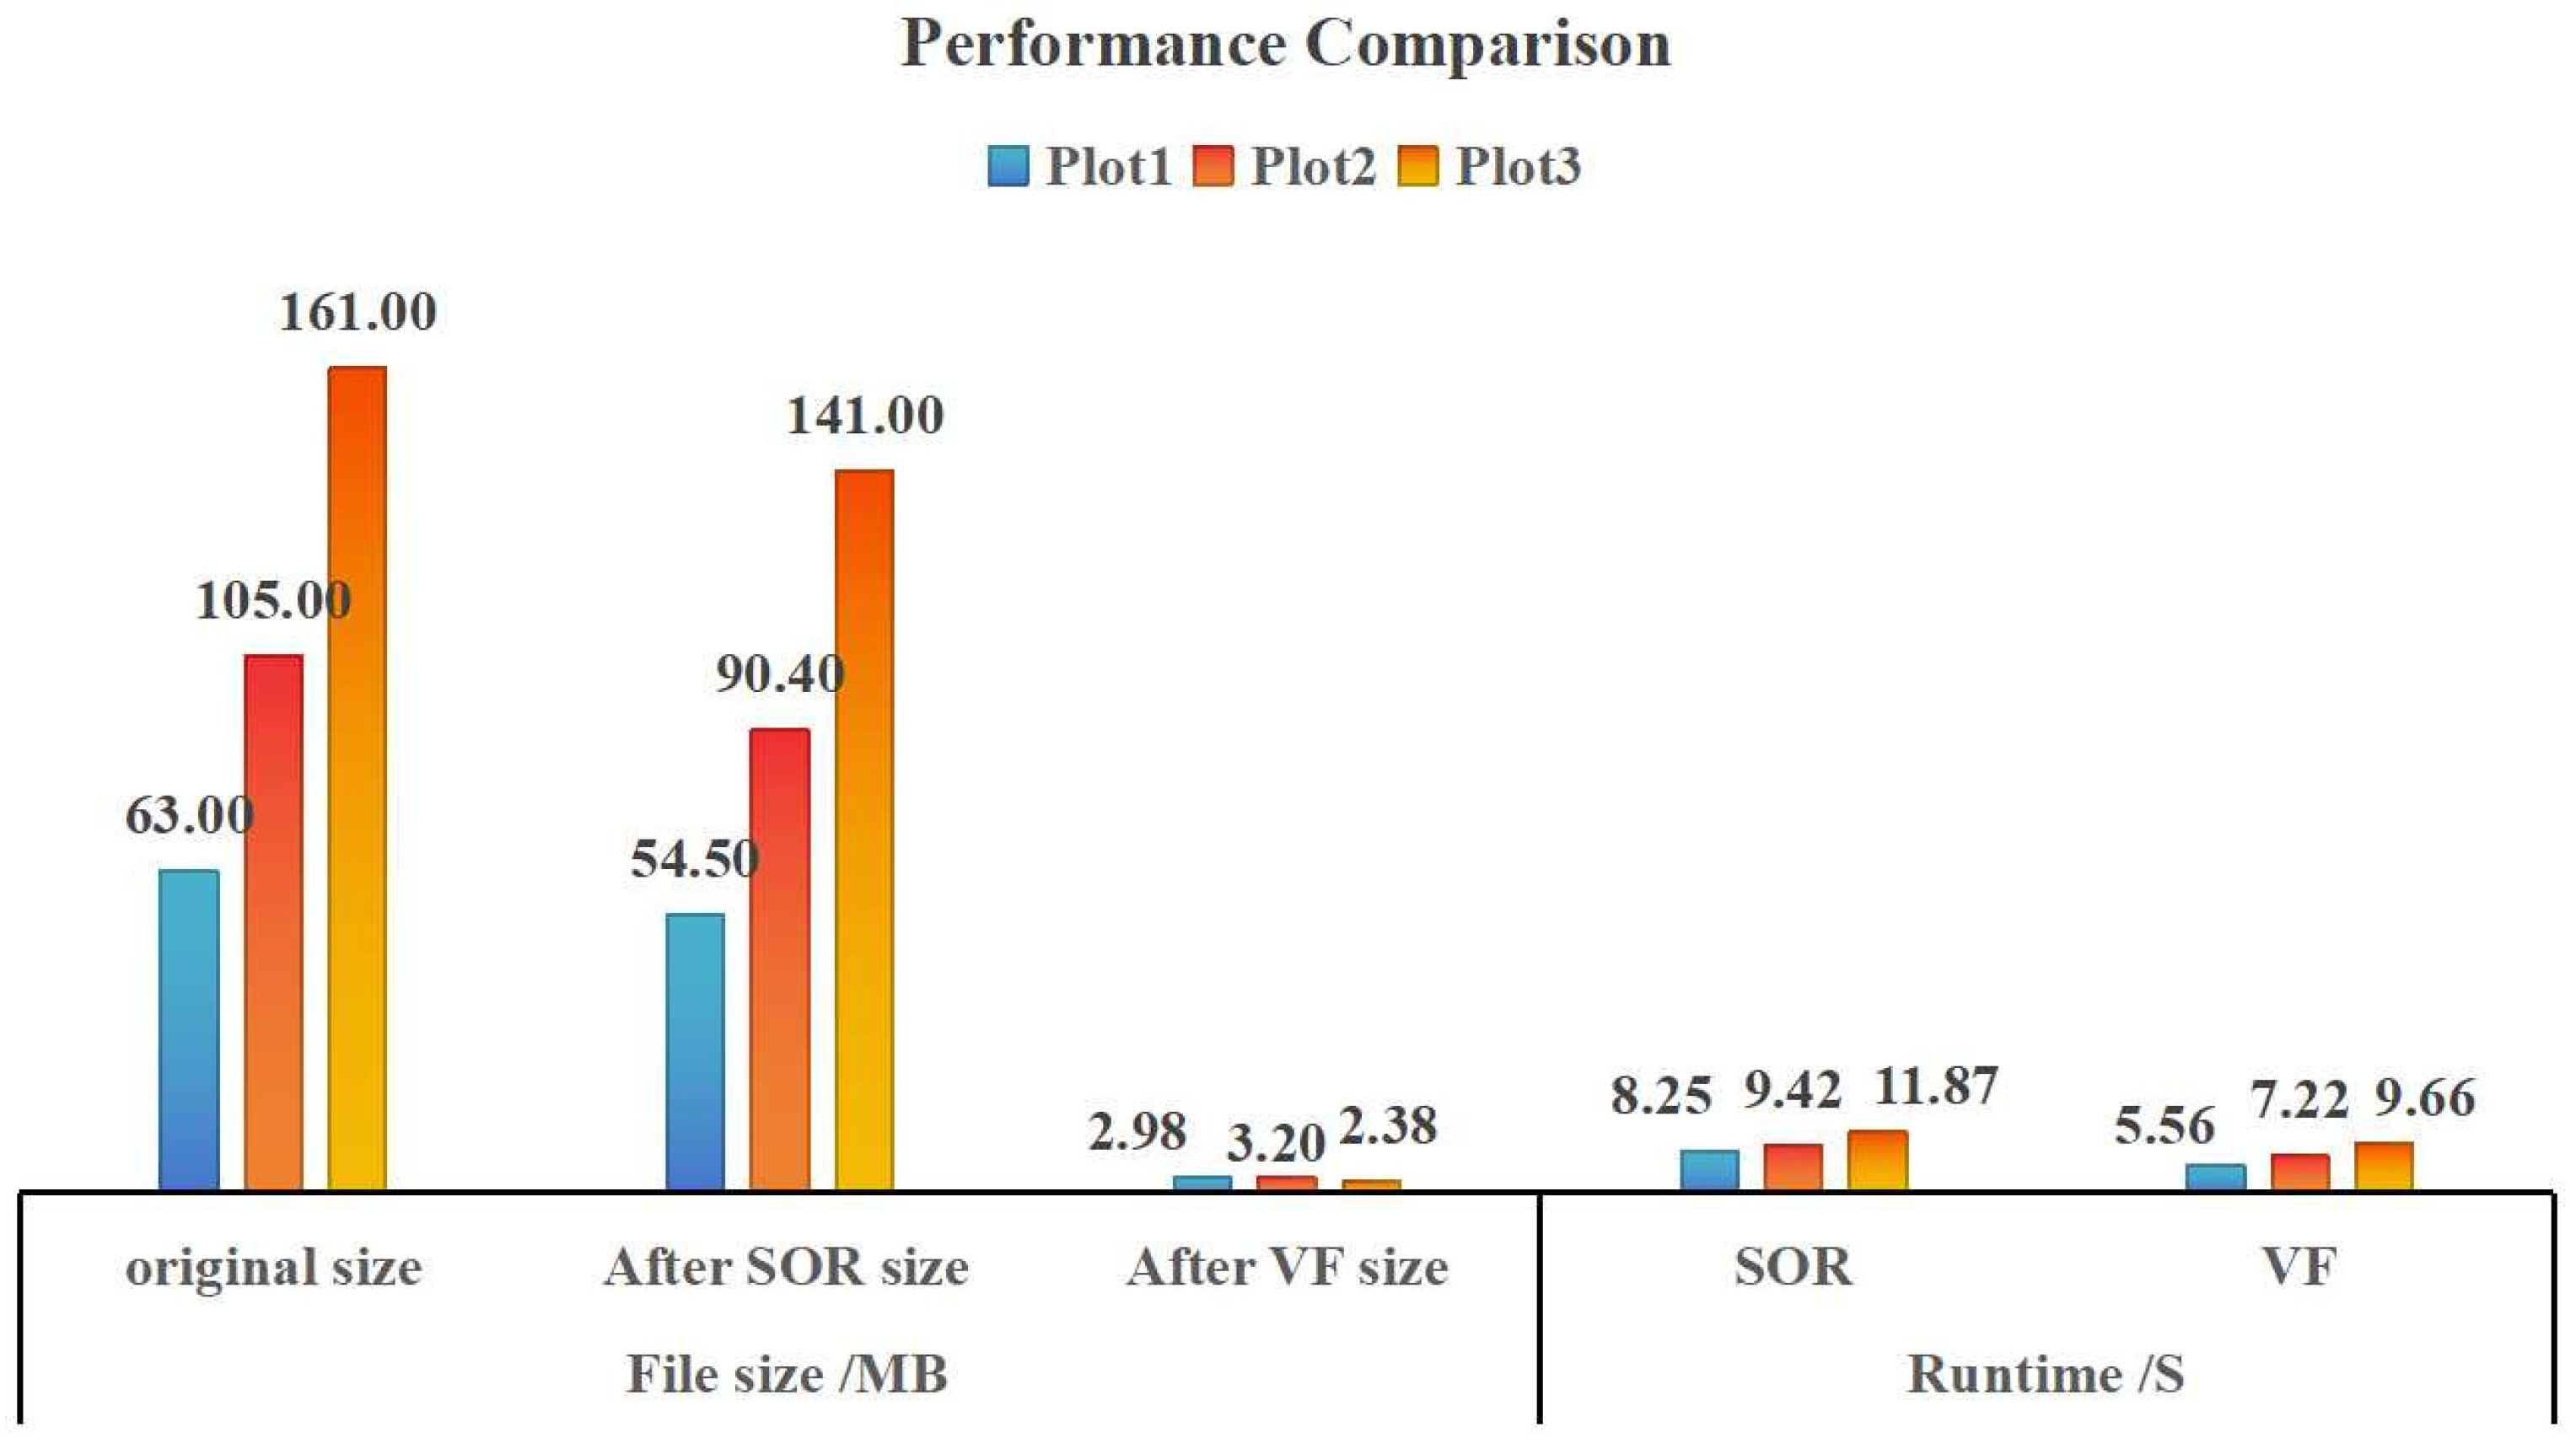
In addition, the performance of the two filtering methods could also be evaluated by comparing the file size and running time after different filtering methods (Figure 8). As shown in Figure 8, the VF method performed the best in terms of file size and running time. The file sizes of sample plots 1, 2, and 3 were 95.27%, 96.95%, and 98.52% less than those of the original files, while the file sizes after SOR were 13.49%, 13.90%, and 12.42% less than those of the original files. VF was also significantly better than SOR in terms of running time. Thus, the VF method has good performance, which can reduce the pressure on the computer processing hardware and environment as well as the operating cost.
4. Discussion
(1) Filtering method principles: VF divides the space into cubes of equal volume (voxels) to process the data, while SOR processes the data based on statistical characteristics. The greatest difference between the two methods is the principle. In this study, VF was used to reverse the tree height after preprocessing. By comparing the data inversion tree height with the SOR method, it was found that both filtering methods could be used to accurately extract the tree height, but that the effect of VF was better. The reason for this finding is that VF can ensure that the features of the object are not destroyed and can greatly reduce the number of point clouds [43], decrease the data redundancy, lessen the storage footprint, and improve the computing efficiency. The filter size used in this study was 0.5 m, which effectively removed excess points [44] and retained key ground features, thus enabling the efficient inversion of tree height. VF outperformed statistical filtering in terms of the point cloud number, tree accuracy, and performance.
(2) Effects of different filtering methods: VF has been shown to effectively reduce data redundancy and improve computing efficiency, as demonstrated by Xing et al. [45]. Aiming at the problem of redundant point cloud data, the present study found that the proposed feature extraction method was similar to VF and could improve the computing speed while effectively reducing the number of point clouds. The results of this study showed that VF could effectively improve point cloud processing efficiency while retaining key features to some extent, which is consistent with the results reported by He et al. [46]. After VF processing, the point cloud density decreased; however, the tree high inversion accuracy remained unaffected, in accordance with the research results of You [47] and Pang et al. [48,49].
(3) Error and accuracy: The data were measured using an altimeter. However, the laser point of the altimeter could not accurately illuminate the top of the tree crown, which resulted in a large deviation between some tree heights and the cloud extraction height of the airborne point. In regard to the coordinate problem, because the measured data and the airborne data adopted different measurement systems, there were systematic errors, resulting in a certain offset in the tree position. In regard to the difference in the tree segmentation, VF processing led to more data segmentation than SOR. The possible reason for this is through the VF after a sparse cloud density, the excessive segmentation phenomenon occurred; of course, we cannot rule out SOR after segmentation, because the measured data did not measure all the trees, so the problem needs to be verified. In the fine extraction of the stand parameters, this study only reversed the tree height. As for the extraction of other stand parameters, it remains unclear whether data processed using VF can still accurately extract the parameters.
(4) Method applicability: Theoretically, this research method is applicable to multiple forest situations. Considering the relatively small number of species and sampling plots examined, further exploration is needed to assess the algorithm’s applicability to a broader range of forest scenarios. In point cloud data forest parameter inversion research, no scholars have yet compared the height accuracy of data inversion trees after VF and SOR processing. This study conducted such research from the perspective of data processing. The experimental results validate the feasibility of the study method. However, the present research did not examine data under various experimental conditions, and the selected study areas were relatively concentrated. In the future, more areas and scenarios need to be tested to verify the reliability of this method and, thus, better serve the forestry industry by realizing the sustainable development of forests.
5. Conclusions
This study focused on typical natural forest plots for different tree species and different site conditions in Yuxi City, Yunnan Province, China. For the large volume of point cloud data and redundancy issues, the airborne LiDAR point cloud data were processed using VF and SOR, and the height parameters of a single tree were extracted in combination with the top–down regional growth algorithm. From the perspective of the number of point clouds, applicable scenarios, computing performance, and inversion accuracy, we explore the data de-redundancy effects of different filtering methods and their impact on tree height parameter inversion. It is believed that
(1) VF can reduce the number of point clouds at multiple levels and retain the key features of objects, enabling VF to not only reduced data redundancy but also ensure the accuracy of tree height inversion. This implies that VF has certain advantages in reducing data redundancy, and this method provides feasible ideas and solutions for point cloud data processing.
(2) Under the condition that the slope and forest stand density are not considerably different, combined with the comparison of the average accuracy of the inversion tree height, the plot effect in Yunnan pine pure forest was the best, followed by the mixed forest, and other pure forests. The overall accuracy of the three scenes in the study was high. VF was better than SOR in terms of both file size and running time, which improved the operating efficiency and reduced the cost to a certain extent.
(3) The high accuracy of data inversion using VF was better than that using SOR. VF ensures the stability and robustness of point cloud data and has great advantages and potential in point cloud data processing and feature extraction applications. In the future, tree height inversion can select a voxel filter size of 0.5 m for data processing.
The present study examined the problem of data redundancy during the inversion of the UAV-LiDAR tree height using SOR and VF. The results indicate that VF can effectively achieve reduced data redundancy and ensure tree height inversion accuracy, which provides a reference for the rapid processing of UAV-LiDAR data. However, the VF threshold needs to be set manually, and the number of inversion parameters is one. Future research will focus on the adaptive threshold of VF, the inversion of multiple parameters, and combining the two methods to process point cloud data.
Author Contributions
Conceptualization, D.D.; methodology, D.D. and J.Z.; software, D.D. and Y.D.; validation, D.D., Y.D. and J.Z.; formal analysis, D.D.; investigation, D.D., Y.D., J.Z. and J.W.; resources, J.W. and P.D.; data curation, D.D., Y.D., J.Z., J.W. and P.D.; writing—original draft preparation, D.D.; writing—review and editing, D.D., Y.D., J.Z., J.W. and P.D.; visualization, D.D. and Y.D.; supervision, Y.D., J.Z., J.W. and P.D.; project administration, J.W. and P.D. All authors have read and agreed to the published version of the manuscript.
Funding
This research was funded by the Science and Technology Major Project of Yunnan Province (Science and Technology Special Project of Southwest United Graduate School—Major Projects of Basic Research and Applied Basic Research): Vegetation change monitoring and ecological restoration models in Jinsha River Basin mining area in Yunnan based on multi-modal remote sensing (Grant No.: 202302AO370003), the Yunnan Province Science and Technology Talents and Platform Plan Project (no. 202305AO350003), the National Natural Science Foundation of China Project (no. 41961060), the Yunnan Province University Innovation Team (Yunnan Province University Plateau Mountain Resource Environment Remote Sensing Monitoring and Assessment Science and Technology Innovation Team), and the Scientific Research Fund Project of the Education Department of Yunnan Province (no. 2023Y0521).
Data Availability Statement
The data and code that support the findings of this study are available from the corresponding authors upon reasonable request. The data are not publicly due to ongoing analysis for publication.
Acknowledgments
We would like to express our sincere gratitude to all editors, reviewers, and staff who participated in the review of this article.
Conflicts of Interest
The authors declare no conflicts of interest.
References
- Xiong, J.; Zeng, H.; Cai, G.; Li, Y.; Chen, J.M.; Miao, G. Crown information extraction and annual growth estimation of a Chinese fir plantation based on unmanned aerial vehicle–light detection and ranging. Remote Sens. 2023, 15, 3869. [Google Scholar] [CrossRef]
- Liu, X. Application of airborne lidar technology in forest resource survey. J. Green Sci. Technol. 2019, 15, 244–245. [Google Scholar] [CrossRef]
- Liu, L.; Pang, Y.; Li, Z. Individual tree DBH and Height Extraction Using Terrestrial Laser Scanning (TLS) in a Subtropical Forest. Sci. Silvae Sin. 2016, 52, 26–37. [Google Scholar] [CrossRef]
- Li, Y.; Xie, D.; Wang, Y.; Jin, S.; Zhou, K.; Zhang, Z.; Li, W.; Zhang, W.; Mu, X.; Yan, G. Individual tree segmentation of airborne and uAV LiDAR point clouds based on the watershed and optimized connection center evolution clustering. Ecol. Evol. 2023, 13, e10297. [Google Scholar] [CrossRef]
- Matsugami, H.; Hiroaki, M.; Kenichi, W.; Yo, S.; Kenji, O. Accurate detection of tree apexes in coniferous canopies from airborne scanning light detection and ranging images based on crown-extraction filtering. J. Appl. Remote Sens. 2012, 6, 063502. [Google Scholar] [CrossRef]
- Zhou, R.; Sun, H.; Ma, K.; Tang, J.; Chen, S.; Fu, L.; Liu, Q. Improving estimation of tree parameters by fusing ALS and TLS point cloud data based on canopy gap shape feature points. Drones 2023, 7, 524. [Google Scholar] [CrossRef]
- Ozdemir, I.; Karnieli, A. Predicting Forest Structural Parameters Using the Image Texture Derived from WorldView-2 Multispectral Imagery in a Dryland Forest, Israel. Int. J. Appl. Earth Obs. Geoinf. 2011, 13, 701–710. [Google Scholar] [CrossRef]
- Xing, C.; Wang, H.; Zhang, Z.; Yin, J.; Yang, J. A Review of Forest Height Inversion by PolInSAR: Theory, Advances, and Perspectives. Remote Sens. 2023, 15, 3781. [Google Scholar] [CrossRef]
- Meng, X. Forest Measurement, 3rd ed.; China Forestry Publishing Textbook Center: Beijing, China, 2006; pp. 10–17. [Google Scholar]
- Da, L.; Yuan, G. Indoor correction of field tree error in Brrice alomeometer. Inn. Mong. For. Investig. Des. 1998, S1, 68–72. [Google Scholar]
- Wang, P.; Xing, Y.; Wang, C.; Xi, X. A graph cut-based approach for individual tree detection using airborne LiDAR data. J. Univ. Chin. Acad. Sci. 2019, 36, 385–391. [Google Scholar] [CrossRef]
- Lu, L.; Zhou, X.; Yu, Z.; Han, S.; Wang, X. Plot-level Forest Height Inversion Using Airborne LiDAR Data Based on the Random Forest. J. Geo-Inf. Sci. 2016, 18, 1133–1140. [Google Scholar] [CrossRef]
- Yu, X.; Hyyppä, J.; Holopainen, M.; Vastaranta, M. Comparison of Area-Based and Individual Tree-Based Methods for Predicting Plot-Level Forest Attributes. Remote Sens. 2010, 2, 1481–1495. [Google Scholar] [CrossRef]
- Liu, Y.; You, H.; Tang, X.; You, Q.; Huang, Y.; Chen, J. Study on Individual Tree Segmentation of Different Tree Species Using Different Segmentation Algorithms Based on 3D UAV Data. Forests 2023, 14, 1327. [Google Scholar] [CrossRef]
- Wang, Y.; Yue, T.; Zhao, M.; Du, Z.; Liu, X.; Liu, S.; Song, E.; Sun, Z.; Zhang, Y. Study of Factors Impacting the Tree height Extraction Based on Airborne LIDAR Data. J. Geo-Inf. Sci. 2014, 6, 958–964. [Google Scholar] [CrossRef]
- Wang, X.; Chen, C. Method for removing pits of canopy height model from airborne LiDAR data. Sci. Surv. Mapp. 2016, 41, 157–161. [Google Scholar] [CrossRef]
- Zhang, W.; Cai, S.; Liang, X.; Shao, J.; Hu, R.; Yu, S.; Yan, G. Cloth Simulation-Based Construction of Pit-Free Canopy Height Models from Airborne LiDAR Data. For. Ecosyst. 2020, 7, 1. [Google Scholar] [CrossRef]
- Li, D.; Yue, C. The Application of LiDAR in Inversion of the Forest Parameters. Geomat. Spat. Inf. Technol. 2011, 34, 54–58. [Google Scholar]
- Zhang, Y.; Liang, Y.; Wang, X.; Yu, H. A Tree Image Extraction Method Based on K-means and Close-Form. J. Northwest For. Univ. 2019, 34, 240–245. [Google Scholar] [CrossRef]
- Li, Q.; Hu, B.; Shang, J.; Li, H. Fusion Approaches to Individual Tree Species Classification Using Multisource Remote Sensing Data. Forests 2023, 14, 1392. [Google Scholar] [CrossRef]
- Wang, C.; Xi, X. Introduction to LiDAR Remote Sensing, 1st ed.; Higher Education Press: Beijing, China, 2022; pp. 3–4. [Google Scholar]
- Wu, D.; Fan, W. Forest canopy height estimation using LiDAR and optical multi-angler data. J. Beijing For. Univ. 2014, 36, 8–15. [Google Scholar] [CrossRef]
- Xu, J.; Shu, Q.; Yang, K.; Wu, J.; Zhang, Y. The Progress of Forestry Application Based on Spaceborne LiDAR. J. Fujian For. Sci. Technol. 2017, 44, 141–148. [Google Scholar] [CrossRef]
- Yue, C.; Zheng, Y.; Xing, Y. Technical and application development study of space-borne LiDAR in forestry remote sensing. Infrared Laser Eng. 2020, 49, 20200235. [Google Scholar] [CrossRef]
- Wieser, M.; Mandlburger, G.; Hollaus, M.; Otepka, J.; Glira, P.; Pfeifer, N. A Case Study of UAS Borne Laser Scanning for Measurement of Tree Stem Diameter. Remote Sens. 2017, 9, 1154. [Google Scholar] [CrossRef]
- Li, M.; Liu, Q.; Feng, Y. Analysis of estimation models of plantation stand heights using UAV LiDAR. Natl. Remote Sens. Bull. 2022, 12, 2665–2678. [Google Scholar] [CrossRef]
- Liu, K.; Shen, X.; Cao, L. Estimating Forest structural attributes using UAV-LiDAR data in Ginkgo plantations. ISPRS J. Photogramm. Remote Sens. 2018, 146, 465–482. [Google Scholar] [CrossRef]
- Hu, T.; Wang, T.; He, K.; Qu, Y.; Ma, Q.; Lu, J. Extraction of individual tree height using WorldView-3 remote sensing images and airborne LiDAR. J. Arid Land Resour. Environ. 2022, 36, 166–175. [Google Scholar] [CrossRef]
- Discher, S.; Richter, R.; Trapp, M.; Döllner, J. Service-Oriented Processing and Analysis of Massive Point Clouds in Geoinformation Management. In Service-Oriented Mapping; Döllner, J., Jobst, M., Schmitz, P., Eds.; Lecture Notes in Geoinformation and Cartography; Springer International Publishing: Cham, Switzerland, 2019; pp. 43–61. ISBN 978-3-319-72433-1. [Google Scholar]
- Liang, R.; Sun, Y.; Li, Y. Comparison of Deep Learning Traditional Models to Simulate the Height-DBH relationship of Chinese Fir. For. Res. 2021, 34, 65–72. [Google Scholar] [CrossRef]
- Yang, J.; Wang, F.; Song, Z. Development of Natural Forest Quercus mongolica Diameter-Height Curve Model Based on BLS. For. Eng. 2023, 38, 57–64. [Google Scholar] [CrossRef]
- Zhang, X.; Liu, Y.; Yu, S. Research on Extraction Method of Forest Tree Height Based on Unmanned Aerial Vehicle LiDAR and Multispectral Data. For. Eng. 2023, 39, 29–36. [Google Scholar] [CrossRef]
- Available online: https://dl.djicdn.com/downloads/m600%20pro/20180417/Matrice600ProUserManualv1CHS.pdf (accessed on 10 March 2024).
- Available online: http://www.riegl.com/uploads/tx_pxpriegldownloads/RIEGL_VUX-1UAV-22_Datasheet_2023-04-25.pdf (accessed on 10 March 2024).
- Wang, J.; Li, X.; Zhang, H. Terrain Adaptive Filtering Method Based on Elevation Normalization. Laser Optoelectron. Prog. 2022, 59, 1028008. [Google Scholar] [CrossRef]
- Lindberg, E.; Holmgren, J. Individual Tree Crown Methods for 3D Data from Remote Sensing. Curr. For. Rep. 2017, 3, 19–31. [Google Scholar] [CrossRef]
- Available online: http://www.lidarcas.cn/# (accessed on 6 December 2023).
- Tan, Y.; Liu, X.; Zhang, Y. A supervoxel-based active relearning framework for LiDAR point clouds classification. Bull. Surv. Mapp. 2022, 5, 79–83. [Google Scholar] [CrossRef]
- Li, W.; Guo, Q.; Jakubowski, M.K.; Kelly, M. A New Method for Segmenting Individual Trees from the Lidar Point Cloud. Photogramm. Eng. Remote Sens. 2012, 78, 75–84. [Google Scholar] [CrossRef]
- Wang, W.; Pang, Y.; Du, L.; Zhang, Z.; Liang, X. Individual tree segmentation for airborne LiDAR point cloud data using spectral clustering and supervoxel-based algorithm. Natl. Remote Sens. Bull. 2022, 26, 1650–1661. [Google Scholar] [CrossRef]
- Chen, X.; Wang, R.; Shi, W.; Li, X.; Zhu, X.; Wang, X. An Individual Tree Segmentation Method That Combines LiDAR Data and Spectral Imagery. Forests 2023, 14, 1009. [Google Scholar] [CrossRef]
- Li, Z.; Huang, B.; Lei, J. Analysis of the factors affecting the point cloud density of airborne LiDAR. Sci. Surv. Mapp. 2019, 44, 204–211. [Google Scholar] [CrossRef]
- Pang, Y.; Wang, W.; Du, L.; Zhang, Z.; Liang, X.; Li, Y.; Wang, Z. Nyström-Based Spectral Clustering Using Airborne LiDAR Point Cloud Data for Individual Tree Segmentation. Int. J. Digit. Earth 2021, 14, 1452–1476. [Google Scholar] [CrossRef]
- Jiang, T.; Zou, J. Point Cloud Denoising Algorithm of Voxel Filtering Based on Region Growing. J. Geomat. 2021, 46, 63–66. [Google Scholar] [CrossRef]
- Xing, Y.; Song, T.; Zhao, Y.; Liu, G.; Zheng, M. Point cloud reduction algorithm of 3D-SIFT feature point extraction and voxel filtering. Laser J. 2023, 44, 163–169. [Google Scholar] [CrossRef]
- He, X.; Qin, L. Based on combined improved voxel filtering algorithm and Gaussian filtering algorithm. Inf. Rec. Mater. 2022, 23, 229–231. [Google Scholar] [CrossRef]
- You, H.; Xing, Y.; Wang, Z.; Wang, R.; Sun, X. Effect of LiDAR Point Density on Tree Height Estimation in Plots Level. J. Northeast For. Univ. 2014, 42, 143–148. [Google Scholar] [CrossRef]
- Pang, Y.; Li, Z.; Tan, B.; Liu, Q.; Zhao, F.; Zhou, S. The effects of Airborne LiDAR Point Density on Forest Height Estimation. For. Res. 2008, 21, 14–19. [Google Scholar] [CrossRef]
- Pang, Y.; Zhao, F.; Li, Z.; Zhou, S.; Deng, G.; Liu, Q.; Chen, E. Forest Height Inversion using Airborne Lidar Technology. J. Remote Sens. 2008, 12, 152–158. [Google Scholar]
Figure 1.
Location of the study plots.

Figure 2.
UAV-LiDAR system.

Figure 3.
Data process flow.

Figure 4.
Comparison of the number of point clouds with different voxel filter sizes.

Figure 5.
(a,b) Top view of tree segmentation in sample plot 1, (c,d) single tree main view for comparison in sample plot 1.
Figure 5.
(a,b) Top view of tree segmentation in sample plot 1, (c,d) single tree main view for comparison in sample plot 1.

Figure 6.
Comparison of tree height.(a,c,e) comparison of single tree height inversion with measured tree height; (b,d,f) comparison of extreme values and mean values.
Figure 6.
Comparison of tree height.(a,c,e) comparison of single tree height inversion with measured tree height; (b,d,f) comparison of extreme values and mean values.

Figure 7.
Scatterplot of inversion tree height. (a) plot 1; (b) plot 2; (c) plot 3.

Figure 8.
Performance comparison.


Table 1.
Plot information.
| Plot | Tree Varieties | Number of Trees | Mean Height (m) | Max Height (m) | Min Height (m) | Center of Plot | ||
|---|---|---|---|---|---|---|---|---|
| Longitude | Latitude | Elevation (m) | ||||||
| 1 | Pinus yunnanensis, Eucalyptus | 30 | 11.60 | 14.32 | 8.09 | 102°34′12.23475″ E | 24°19′06. 21122″ N | 1801.57 |
| 2 | Pinus yunnanensis | 30 | 11.69 | 19.52 | 9.19 | 102°34′48.63694″ E | 24°11′16. 60312″ N | 2010.91 |
| 3 | Cypress | 30 | 9.01 | 12.10 | 5.28 | 102°52′05.31080″ E | 24°12′22. 55075″ N | 1818.79 |
Table 2.
Related parameters of UAV-LiDAR.
| Unmanned Aerial Vehicle | Scanner |
|---|---|
| Model: DJI M600 Pro | Model: RIEGL VUX-1UAV |
| Axles: 6 | Laser Class: 1 |
| Hover accuracy: vertical: ±0.5 m, horizontal: ±1.5 m | Accuracy/Repetitive accuracy: 15 mm/10 mm |
| Flight speed: 0–18 m/s | Scanning speed: 10–200 Lines/s |
| Maximum flight altitude: 2500 m | Maximum measurement range: 1415 m |
| Maximum pitch angle: 25° | Field of view: 360° |
Table 3.
Comparison of the number of point clouds before and after filtering.
| Plot | Original Number of Points | SOR Number of Points | VF Number of Points | P1 (%) | P2 (%) |
|---|---|---|---|---|---|
| 1 | 1,684,809 | 1,457,317 | 79,782 | 13.50 | 95.26 |
| 2 | 2,807,338 | 2,417,232 | 85,666 | 13.90 | 96.95 |
| 3 | 4,297,350 | 3,773,955 | 63,802 | 12.18 | 98.52 |
Table 4.
Tree height inversion accuracy.
| Filter Method | Plot | Mean Accuracy (%) | Max Accuracy (%) | Min Accuracy (%) | All Plot Mean Accuracy (%) |
|---|---|---|---|---|---|
| VF | 1 | 96.41 | 99.92 | 67.70 | 96.24 |
| 2 | 97.87 | 100.00 | 86.52 | ||
| 3 | 94.45 | 99.94 | 71.21 | ||
| SOR | 1 | 93.84 | 99.74 | 71.16 | 94.17 |
| 2 | 96.42 | 99.95 | 93.82 | ||
| 3 | 92.24 | 99.96 | 71.10 |
Table 5.
Forest stand density.
| Plot | Varieties of Trees | Average Slope (°) | Elevation (m) | SD1 1 (Plants/ha) | SD2 2 (Plants/ha) |
|---|---|---|---|---|---|
| 1 | Pinus yunnanensis, Eucalyptus | 14.74 | 1801.57 | 1000.00 | 933.00 |
| 2 | Pinus yunnanensis | 22.22 | 2010.91 | 1133.33 | 1078.00 |
| 3 | Cypress | 14.84 | 1818.79 | 1066.67 | 989.00 |
1 Voxel filtering (VF) stand density; 2 Statistical outlier removal (SOR) stand density.
Disclaimer/Publisher’s Note: The statements, opinions and data contained in all publications are solely those of the individual author(s) and contributor(s) and not of MDPI and/or the editor(s). MDPI and/or the editor(s) disclaim responsibility for any injury to people or property resulting from any ideas, methods, instructions or products referred to in the content. |
© 2024 by the authors. Licensee MDPI, Basel, Switzerland. This article is an open access article distributed under the terms and conditions of the Creative Commons Attribution (CC BY) license (https://creativecommons.org/licenses/by/4.0/).
Share and Cite
MDPI and ACS Style
Duan, D.; Deng, Y.; Zhang, J.; Wang, J.; Dong, P. Influence of VF and SOR-Filtering Methods on Tree Height Inversion Using Unmanned Aerial Vehicle LiDAR Data. Drones 2024, 8, 119. https://0-doi-org.brum.beds.ac.uk/10.3390/drones8040119
AMA Style
Duan D, Deng Y, Zhang J, Wang J, Dong P. Influence of VF and SOR-Filtering Methods on Tree Height Inversion Using Unmanned Aerial Vehicle LiDAR Data. Drones. 2024; 8(4):119. https://0-doi-org.brum.beds.ac.uk/10.3390/drones8040119
Chicago/Turabian StyleDuan, Di, Yuncheng Deng, Jianpeng Zhang, Jinliang Wang, and Pinliang Dong. 2024. "Influence of VF and SOR-Filtering Methods on Tree Height Inversion Using Unmanned Aerial Vehicle LiDAR Data" Drones 8, no. 4: 119. https://0-doi-org.brum.beds.ac.uk/10.3390/drones8040119