Article

Characterization and Modeling of Surface Roughness and Burr Formation in Slot Milling of Polycarbonate

1
Department of Mechanical Engineering, University of Kentucky, Lexington, KY 40506, USA
2
Institute for Sustainable Manufacturing, University of Kentucky, Lexington, KY 40506, USA
3
Department of Mechanical and Manufacturing Engineering, Miami University, Oxford, OH 45056, USA
*
Author to whom correspondence should be addressed.
J. Manuf. Mater. Process. 2020, 4(2), 59; https://0-doi-org.brum.beds.ac.uk/10.3390/jmmp4020059
Submission received: 4 May 2020 / Revised: 18 June 2020 / Accepted: 19 June 2020 / Published: 23 June 2020
(This article belongs to the Special Issue Advanced Manufacturing and Machining Processes)

Abstract

:
Thermoplastic materials hold great promise for next-generation engineered and sustainable plastics and composites. However, due to their thermoplastic nature and viscoplastic material response, it is difficult to predict the properties of surfaces generated by machining. This is especially problematic in micro-channel machining, where burr formation and excessive surface roughness lead to poor component-surface integrity. This study attempts to model the influence of size effects, which occur due to the finite sharpness of any cutting tool, on surface finish and burr formation during micro-milling of an important thermoplastic material, polycarbonate. Experimental results show that the depth of cut does not affect either surface finish or burr formation. A proposed new sideflow model shows the dominant effect of cutting-edge radius and feed rate on surface finish, while tool edge roughness, coating and feed rate have the most pronounced influence on burr formation. Overall, a good agreement between the experimental data and the proposed size effect model for the machining of thermoplastic material was found. Based on these results, tool geometry and process parameters may be optimized for improved surface integrity of machined thermoplastic components.

1. Introduction

1.1. Background and Relevance of Thermoplastic Materials

Thermoplastic materials are of particular interest for next-generation engineered plastics and composite materials, due to their inherent ability to be recycled and reused without significant loss to their mechanical and physical properties. Rather than thermosetting plastics, which offer increased strength but are inherently non-recyclable, thermoplastics can be recovered by simple heating to melt and liberate the material from other constituents. Alauddin et al. [1] studied the machining behavior of plastics, including thermoplastics and elastomers. As a result of their low melting point, Jahan et al. [2] showed that these materials are prone to burr formation and undesirable plastic deformation during (thermo-)mechanical processing, such as machining.
Alauddin et al. [1] confirmed that the machining behavior of plastics is fundamentally different from that of metallic materials. While metals generally feature crystalline microstructures, with high-strength covalent bonds and coherent atomic arrangement within individual crystalline grains, plastics are generally not crystalline. Rather, plastics, also known as polymers, are comprised of long chains of monomers, which feature carbon/carbon covalent bonds. When long polymeric chains are intertwined without permanent bonds attaching these chains, the material response is thermoplastic, i.e., the material will readily flow plastically when sufficient heat is supplied (typically at relatively low temperatures). The cross-linking of individual polymer chains suppresses this thermoplastic response, which is the reason for the improved strength and melting points observed in thermosetting materials.
While thermoplastic materials are typically molded, some high-precision applications, such as lenses, biomedical and micro-fluidic devices and aerospace components, require some finish machining processes. Eriksen [3] noted that conventional machining practices will often lead to poor outcomes in terms of surface quality and tolerances, so a precise understanding of the interaction between process parameters (feeds, speeds, tool geometry, etc.) and the material behavior (viscoelastic properties, melting point, viscoplastic flow behavior, etc.) is required. To this end, the present study will attempt to provide an improved understanding, to guide both researchers and industrial practitioners in the selection of appropriate machining parameters and tools in order to achieve improved product quality in thermoplastics.

1.2. Machining of Polycarbonates

Bendler [4] mentioned that polycarbonates, as an important group of thermoplastic polymers, have found many important industrial applications because of their strength and toughness, impact resistance, thermal resistance, and optical properties. Some of the major applications of polycarbonates are in optical lenses, safety glasses, bullet-proof glass, CD and DVDs, and exterior lighting fixtures. Bendler [4] also noted that another important area of application for polycarbonates in recent years is their use as a matrix for fiber-reinforced polymer composites. Higgins and Brittain [5] showed the higher electrical conductivity property of polycarbonate and carbon nanofiber composites, while Kim and Macosko [6] showed the better reinforcement stability of polycarbonate composites reinforced with functionalized graphene sheets and graphene. Eitan et al. [7] highlighted that polycarbonate’s thermoplastic properties give it a processing and recycling advantage. It is important to understand the machinability of thermoplastic materials like polycarbonates, as it not only generates scientific knowledge for creating parts and components using polycarbonates, but will also lay the foundation for the machining of fiber-reinforced thermoplastic polymer composites. The size effect in the micro-scale machining of polycarbonates will add fundamental knowledge to a new and growing application of polycarbonates in microfluidics. The effects of tool geometry and micromachining parameters have a significant influence on the surface finish and burr formation in the micro-channels that ensure smooth delivery of fluids.
There have been many different approaches for machining and/or processing polycarbonates. Lithography-based microfabrication processes were used for the fabrication of micro-features and channels for micro-fluidics applications. Mekaru and Takahashi [8] studied a micro-needle fabricated on a polycarbonate, using X-ray lithography and Ni electroforming process. Mekaru et al. [9] also created nanopatterns on a polycarbonate surface using ultrasonic vibration and nanoimprint lithography. However, lithography-based microfabrication processes are quite slow, hazardous, costly, and may not be appropriate for producing a large volume of polycarbonate parts. Liu et al. [10] used another popular process: compression molding to fabricate micro-scale parts for microfluidics and DNA analysis; however, this requires expensive die making for changes in the shape of the parts. Moreover, the authors found compression molding to be more suitable for thermoset polymers.
In recent years, several non-conventional machining processes have been used to machine polycarbonates. Rey-García et al. [11] used laser ablation machining to carry out internal machining/engraving in polycarbonate. Nd: YVO4 laser nano pulses were focused on an alumina disc, and the reflected beam was used to engrave the interior of a polycarbonate part. Successfully machining 3D structures, besides engraving images, on a polycarbonate workpiece was reported. However, Mutapcic et al. [12] observed that during the machining of polycarbonates using laser ablation, overlay and stitching errors were common. It was reported that overlay errors can be reduced by 80% by controlling overlapping areas and selecting an optimum number of laser shots. Karazi and Brabazon [13] highlighted the use of a pulsed Nd:YVO4 laser in machining micro-channels on polycarbonates, while artificial neural network predictive modeling could help predict the micro-channel dimensions with laser process parameters as input. Gruescu et al. [14] mentioned the use of laser machining for gear cutting in polycarbonates with optimizing parameters, using the Taguchi method. Zheng et al. [15] used the femtosecond laser to fabricate micro-channels on polycarbonates, while Chen and Hu [16] used the CO2 laser. For both cases, the dimensional accuracy of micro-channels on the polycarbonate was found to depend on laser power and the velocity of the laser beam.
Abrasive water jet machining (AWJM) is another non-traditional process for machining polycarbonates. Guo and Ramulu [17] reported that the finite element method (FEM) can successfully model displacement fields of polycarbonates in AWJM. It is found in modeling that shear, rather than normal pressure, contributed more in the contoured patterns of displacement. AWJM was used to machine micro-channels in polycarbonates in several studies; Getu et al. [18] used 25-µm Al 2 O 3 particles at different angles of impact to machine masked holes on polycarbonate samples, while Mohaupt and Burns [19] applied sapphire nozzles at high pressure to fabricate sheet samples of polycarbonates and polymethylmethacrylate (PMMA). Khan [20] reported magneto-rheological nano-finishing as another innovative non-traditional process used for obtaining a nanoscale surface finish on polycarbonates using various abrasive particles. Average surface roughness ( R a ) as low as 30 nm was obtained using the proposed magneto-rheological nano-finishing process. Lee et al. [21], in a similar study, used magnetic-assisted polishing to reduce the surface roughness of polycarbonates, from 11.23 µm to 0.013 µm R a . Although the magnetic-assisted finishing processes provided improved surface finish, they are very slow compared to traditional machining processes. The laser machining, on the other hand, can be a faster process, but results in a heat affected zone beneath the machined surface. The AWJM suffers from the limitation of miniaturization due to the minimum nozzle size, which is dependent on abrasive particle size.
Among the conventional machining processes, single point diamond turning (SPDT) was the most-approached process for machining polycarbonates, mainly due to its capability of generating a high-quality surface finish. Several studies have focused on optimizing the machining conditions for achieving nano-level surface finish: Bolat [22] studied the effects of vibration and cutting parameter on the SPDT surface finish of polycarbonate samples; Saini et al. [23] suggested a lower feed for lower R a values, and developed an empirical formula for predicting the surface roughness value; Singh et al. [24] developed an artificial neural network capable of surface texture measurement in turning operations; and Khatri et al. [25] found that the average surface roughness for the SPDT process was about 2.7 nm in polycarbonates. During SPDT, the feed rate had the greatest impact, followed by spindle speed, in achieving a nano-level surface finish. Gindy [26] developed an empirical shear angle relationship, based on the minimum energy criterion in yielding thermoplastic material for predicting the mechanical behavior of polycarbonates and nylon during SPDT. Barwasser [27] used combined turning and grinding processes to simultaneously machine lenses, as well as finish the edges of the lenses. Raffaelli [28] used a similar approach to the edge and polish of polycarbonate lenses, without the use of coolants. It was found that combined processes in a single setup allowed the complete fabrication of lenses in a single machine, by carrying out finish machining and edging at the same time.
While high-quality micro-channels can be produced using conventional micro-milling process, studies on polycarbonate machining using this approach are few. This could be associated with the challenge of controlling the burr formation, while obtaining a high-quality surface finish at the bottom and sidewalls of the micro-channels. Chen et al. [29] studied the impact of selected machining parameters on the surface quality during the micro-milling of polycarbonates, and an average surface roughness of 127 nm was obtained using a depth of cut of 10 µm, feed rate of 0.039 mm/rev, and a spindle speed of 20,000 rpm. Samuel et al. [30] carried out a comparative study on the micro-milling machinability of pure polycarbonates and carbon nanotube (CNT) fiber-reinforced polycarbonate. It was found that the machinability was improved due to the addition of CNT fiber, resulting in lower cutting forces, better surface finish, and continuous chip formation. The improved machinability was associated with the high thermal conductivity of CNT. Dikshit et al. [31] proposed a continuum-based predictive model for simulating the microstructure of a CNT-reinforced polycarbonate composite at different loadings of CNT. The strain rate of the polycarbonate obtained from the compression test was used in the model to predict machining-induced microstructure changes, with an accuracy of 10%.
Very few studies have considered studying the size effect during the polycarbonate micro-milling process. Understanding the size effect would help achieve a high-quality surface finish while minimizing the edge burrs during the machining of micro-channels in polycarbonates. This work aims to investigate the impact of size effect on surface quality and burr formation during micro-milling of polycarbonate, which will open the path for understanding the machining behavior of thermoplastic polymers and composites at a micro-scale. Besides, the proposed predictive modeling will allow for the predicting of average surface roughness of polycarbonates during micro-milling, and will broaden the use of polycarbonates in microfluidics applications.

1.3. Size Effects in Machining

Childs [32] stated the significant influence of size effects in finish machining operations when both uncut chip thickness and cutting-edge radius have the same order of magnitude. Since finishing operations often generate functional surfaces, these processes have a direct impact on product quality and functional performance, which in turn affects the overall sustainability of a machined product. Vollertsen [33] states that “Size effects are deviations from intensive or proportional extrapolated extensive values of a process which occur when scaling the geometrical dimensions.” The researchers established density, shape and microstructure effects, as the three size effects categories. The common observation of an increase in specific cutting energy when decreasing uncut chip thickness is a microgeometry effect and a subgroup of the microstructure category. For example, in the machining of powdered metal, Schoop et al. [34] found a significant impact of the cooling/lubricating strategy, specifically cryogenic cooling, on product quality and sustainability, through the elimination of a previously required post-processing step.
While size effects have been extensively studied in metallic materials and for micro-machining operations, there has been little work dedicated to establishing the relevance of size effects in the machining of thermoplastic materials. Therefore, the present study attempts to qualitatively and quantitatively investigate how size effects affect surface generation during the machining of thermoplastic materials, including effects on as-machined surface roughness and burr formation.

2. Materials and Methods

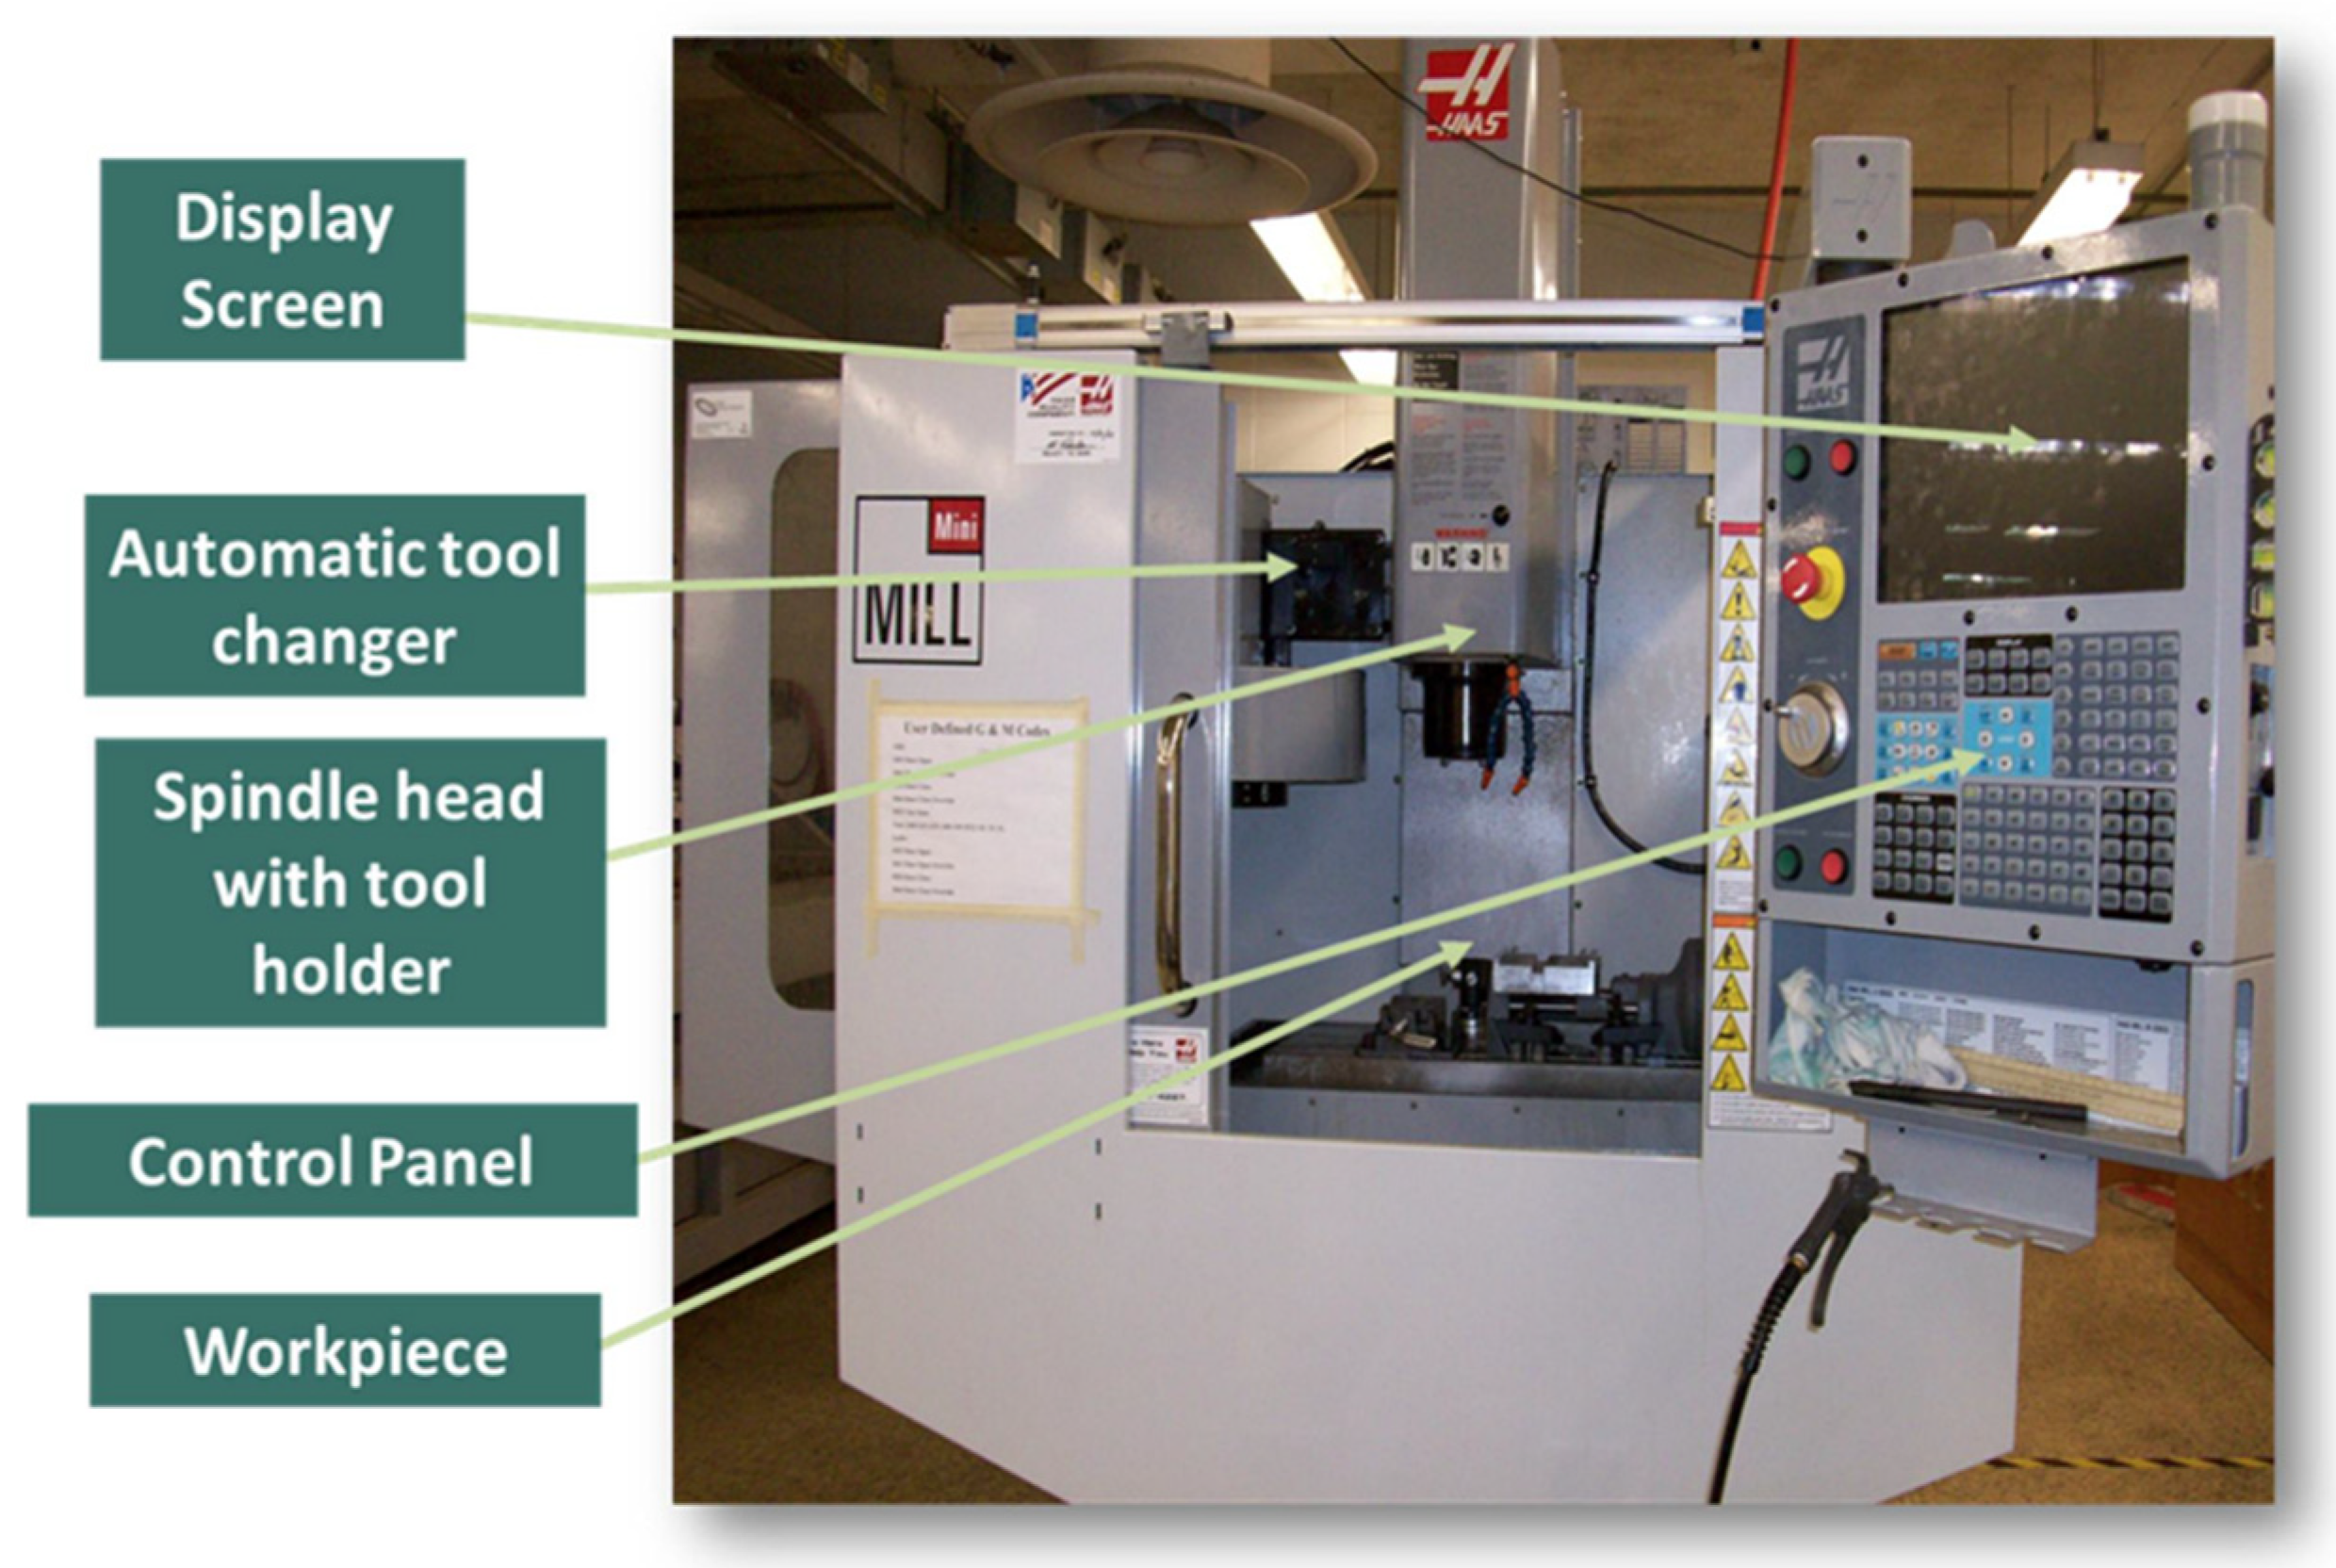
2.1. Experimental Setup and Method

All polycarbonate machining experiments were carried out on the Haas CNC milling machine illustrated in Figure 1. Uncoated, Titanium Nitride (TiN)-coated and Titanium Aluminum Nitride (TiAlN)-coated carbide tools (WC/Co cemented carbide—6% Co) were used for creating slots on the polycarbonate surface at various machining conditions. The workpiece, end mills and cutting conditions information is provided in Table 1. The machining experiments were carried out at a constant spindle speed of 7680 rpm, with varying depth of cut of 0.1, 0.2, 0.3 and 0.5 mm, and feed rates of 0.025, 0.05, 0.075 and 0.10 mm/rev. The feed rates (i.e., chip load) were calculated as 0.00625, 0.0125, 0.01875 and 0.025 in mm/tooth. As shown in the experimental matrix in Table 2, three 25.4-mm long slots were machined for each set of cutting speed, feed rate and depth of cut, with the cutting forces measured using a Kistler 9129AA Piezo-Multicomponent Force Dynamometer and measuring range between −10 and +10 kN in all directions. This experimental matrix was repeated for each of the tools. The rated sensitivities in F x ,   F y ,   a n d   F z   are approximately −8.1, −4.1 and −9.1 pc/N (Pico Coulombs per Newton), respectively.

2.2. Characterization

The arithmetic mean surface roughness ( R a ) of the polycarbonate slots made at different feeds and depth of cut was characterized using the Zygo profilometer with a 5× objective and 20-µm scan depth. The resulting profile surface roughness measurement and deviation at the slot bottom face were taken at five (5) different locations, on Zygo, for each of the slots. Furthermore, the average heights of the burrs formed under varying conditions were measured after slicing the samples at the center of each slot, using an automatic cut-off machine (Struers Discotom 5 at a feed rate of 0.2 mm/s) and polished using an automatic polisher (Struers Rotoforce 3) with different steps and abrasive grit size. Sectioning and polishing was carried out to minimize the influence of sample preparation, in order to clearly observe the effect of the milling process on the resulting slot and burr morphology. Samples were polished with a 600-grit size abrasive, followed by an 800- and 1200-grit abrasive. Samples were further finely polished using a 9-µm diamond solution and a 2-µm silicon carbide. The resulting sample’s face exposed the burrs and images were taken using an optical microscope, with a 5× objective and a dark view lighting. Corresponding burr heights were measured using ImageJ software are shown in later sections of this work.

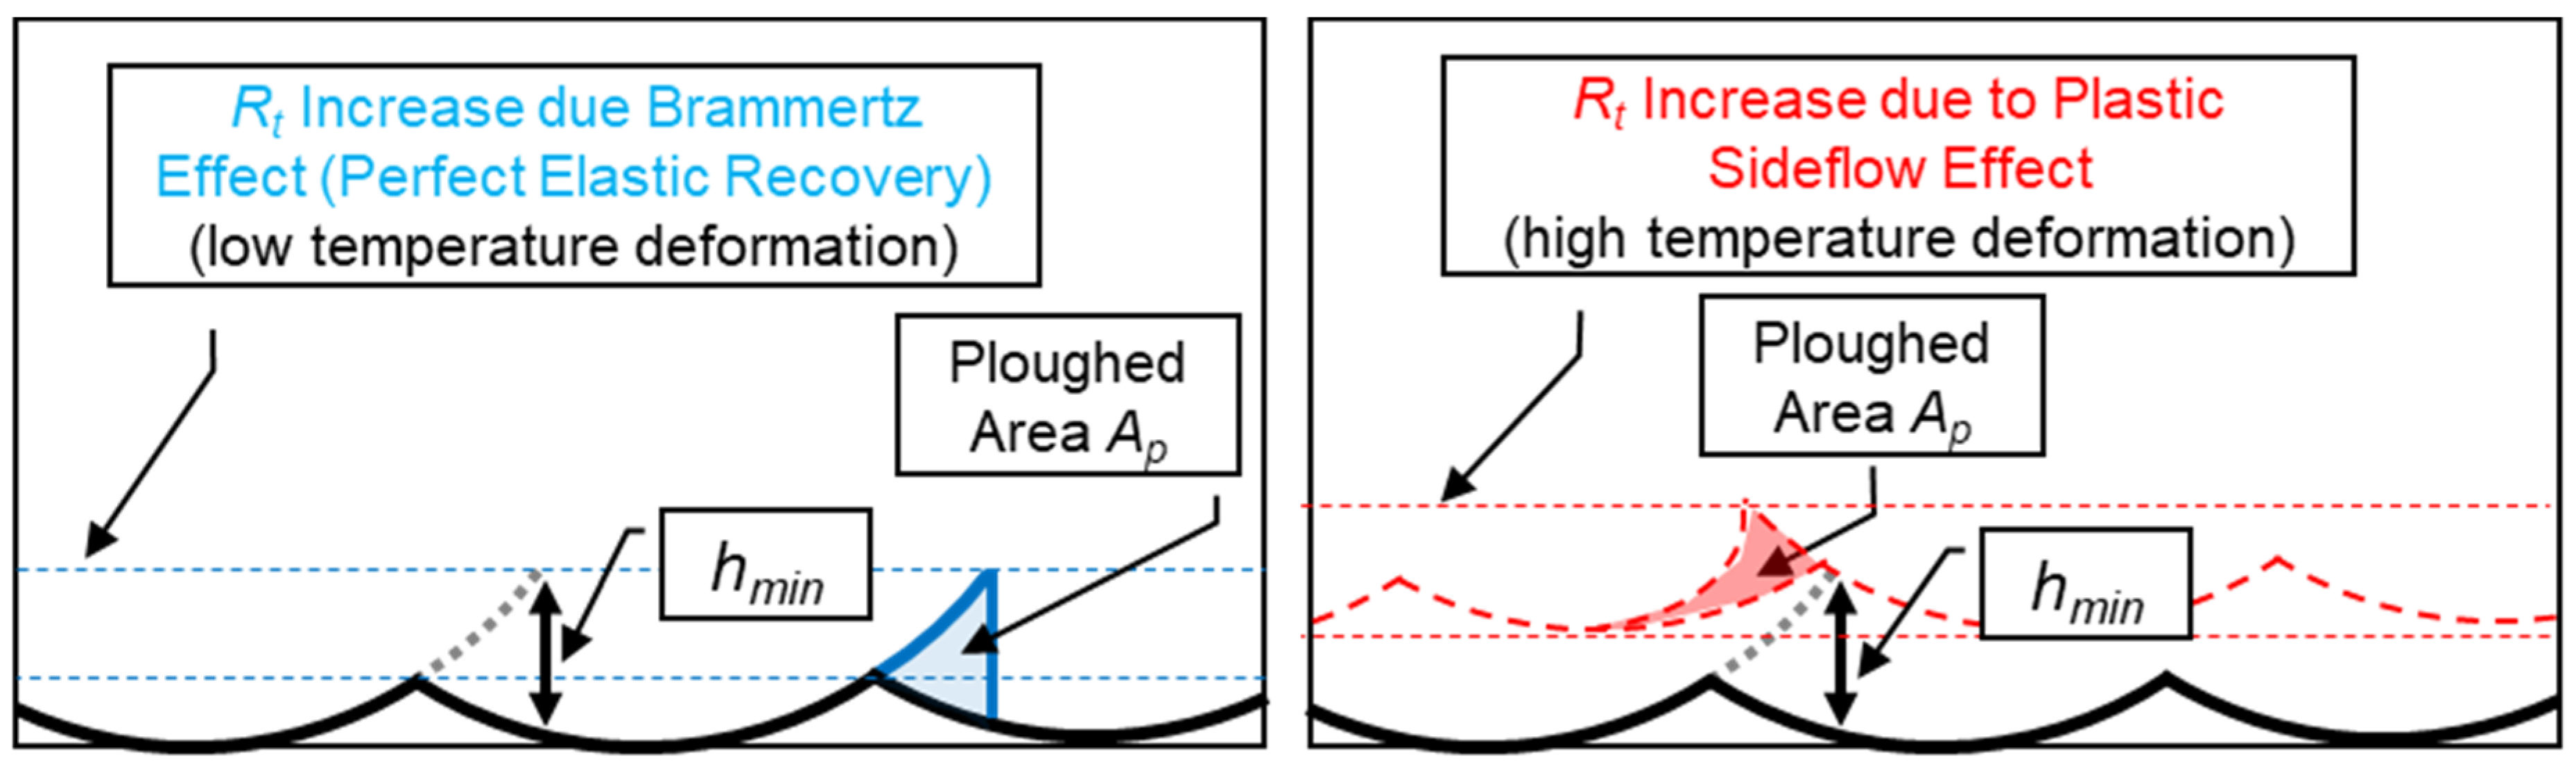
3. Modeling Discussion

Vollertsen et al. [35] stated that in cutting processes, size effects are typically related to non-linear scaling relationships between the cutting-edge radius, the value of uncut chip thickness and relevant microstructural features (grains, pores, etc.). For surface generation, the minimum chip thickness effect could be considered as one of the most important size effects. This effect arises due to the finite sharpness of the cutting edge, which will transition from cutting to ploughing at a critical minimum value of the uncut chip thickness, h m i n . Liu and Melkote [36] noted that, since all values of uncut chip thickness smaller than h m i n   are not cut, an equivalent ploughed area, A p , will be subject to either elastic springback (i.e., the Brammertz Effect) or plastic (side-) flow. Malekian et al. [37] showed the great influence of tool geometry and material property on the h m i n   value, as a result of the edge radius and friction coefficient, while Aramcharoen and Mativenga [38] found that an increased ratio between the tool edge radius and uncut chip thickness gives a reduction in burr size in the micro-milling of hardened tool steel. In another study, Denkena et. al. [39] confirmed that cutting edge rounding influences the workpiece’s sub-surface residual stresses and surface burrs.
Since the cutting tool can be considered as a rigid constraint, it is unlikely that perfectly elastic springback will occur. Rather, the workpiece material will be displaced and flow through the sub-surface into an adjacent ‘scallop’, which was generated by the tool radius during the previous pass. This behavior is equivalent to the mechanics of burnishing, where ploughing is dominant, and no cutting occurs. Under finish machining conditions, feed is low, and so the values of the uncut chip thickness near the final machined surface will be extremely low. Therefore, even the sharpest cutting tool, perhaps with a single-digit micron edge radius, will induce some ploughing and sideflow. Contrary to most previously conceived models, the transition from ploughing to cutting does not invalidate the minimum chip thickness effect at values greater than h m i n . Rather, the final amount being cut will be equal to the uncut chip thickness, minus the minimum chip thickness. Thus, a thin ‘ploughed layer’, shown in Figure 2 as the area between the dashed red line (top of final machined surface) and black line (geometric position of tool tip), will be present along the entire 2D geometry of the uncut chip, in geometrically complex processes such as milling, drilling and turning.
Modeling of the increase in arithmetic mean surface roughness   ( R a ) , due to (unrealistic) perfect elastic springback according to the model of Brammertz, is geometrically straightforward. Without any ploughing, i.e., for a perfectly sharp tool cutting, the kinematic roughness would be given using Equation (1):
R t ( k ) = 4 × R a ( k ) = f 2 8 × r t
where Rt(k) is the kinematic peak-to-peak roughness, Ra(k) the kinematic arithmetic mean roughness, f is the feed rate and rt is the tool corner radius. For any real tool, there will be a finite edge radius, and thus some value, h m i n . The near-triangular region of the ploughed area protrudes beyond the theoretical kinematic surface profile by a value of Δ R t , which is given in Equation (2):
Δ R t ( B r a m m e r t z ) = h m i n 2 ( 1 + h m i n × r t f 2 )
By adding the kinematic roughness to the increase due to ploughing, assuming elastic springback [33], it is then possible to model the roughness as a function of feed (f); tool radius (rt) and the value of minimum chip thickness (hmin) are given by Equation (3):
R t ( B r a m m e r t z ) = R t ( k ) + Δ R t ( B r a m m e r t z ) = f 2 8 × r t + h m i n 2 ( 1 + h m i n × r t f 2 )
R a ( B r a m m e r t z ) R t ( B r a m m e r t z ) 4
To model the more physically realistic, yet geometrically complex, condition of plastic sideflow, it is first necessary to accurately define several geometric variables associated with the geometry of the uncut chip, as shown in Figure 3. To do this, the uncut chip can be evaluated in terms of the lead angle kappa (κ), which by definition is zero when the radius of the tool is normal to the machined surface. The uncut chip geometry varies along κ, with a small portion of the chip geometry being on the secondary cutting edge (negative κ), and the majority of the chip at some positive value κ.
We shall define the extreme point of zero chip thickness of the secondary cutting edge by the variable κ 0 in Equation (5)
κ 0 = c o s 1 ( ( r t R t ( k ) ) r t )
Likewise, the angle κ h m i n , at which h = h m i n , can be defined by Equation (6):
κ h m i n = c o s 1 ( ( r t R t ) r t ) + 2 κ 0
Due to sideflow, the ploughed area Ap will be displaced to the point of clearance between the tool radius and the previously-generated machined surface, as shown in Figure 3. Assuming the workpiece material is incompressible, the furthest angle to which this material will flow can be estimated with Equation (7):
κ s = 2 κ h m i n κ 0
It follows that the increase in height above the previously-generated surface will then be given by Equation (8):
h s = ( r t h m i n ) × κ s × t a n | κ s 2 |
The distance, from the point on the tool where the sideflow terminates at κ s to the theoretical kinematic profile, may be defined with Equation (9):
h k = r t + r t 2 + f 2 + 2 r t f × s i n ( κ s )
Finally, for a material that follows the underlying assumption that sideflow occurs in a manner equivalent to that of a liquid, which could be a reasonable assumption for thermoplastic materials, the maximum increase in roughness due to sideflow will be given by h m i n . Beyond a certain critical feed, the roughness increase will be given by the sum of the increase in height h s , and the additional effect of raised roughness peaks, due to the uniformly distributed layer of ploughed material, given by the difference between h k and h m i n , multiplied by the cosine of the angle κ s , as shown in Equation (10):
Δ R t ( s ) = { l i m i t i n g   c a s e :   Δ R t ( s ) = h m i n   ( h k h m i n ) × cos | κ s | + h s

4. Results and Discussion

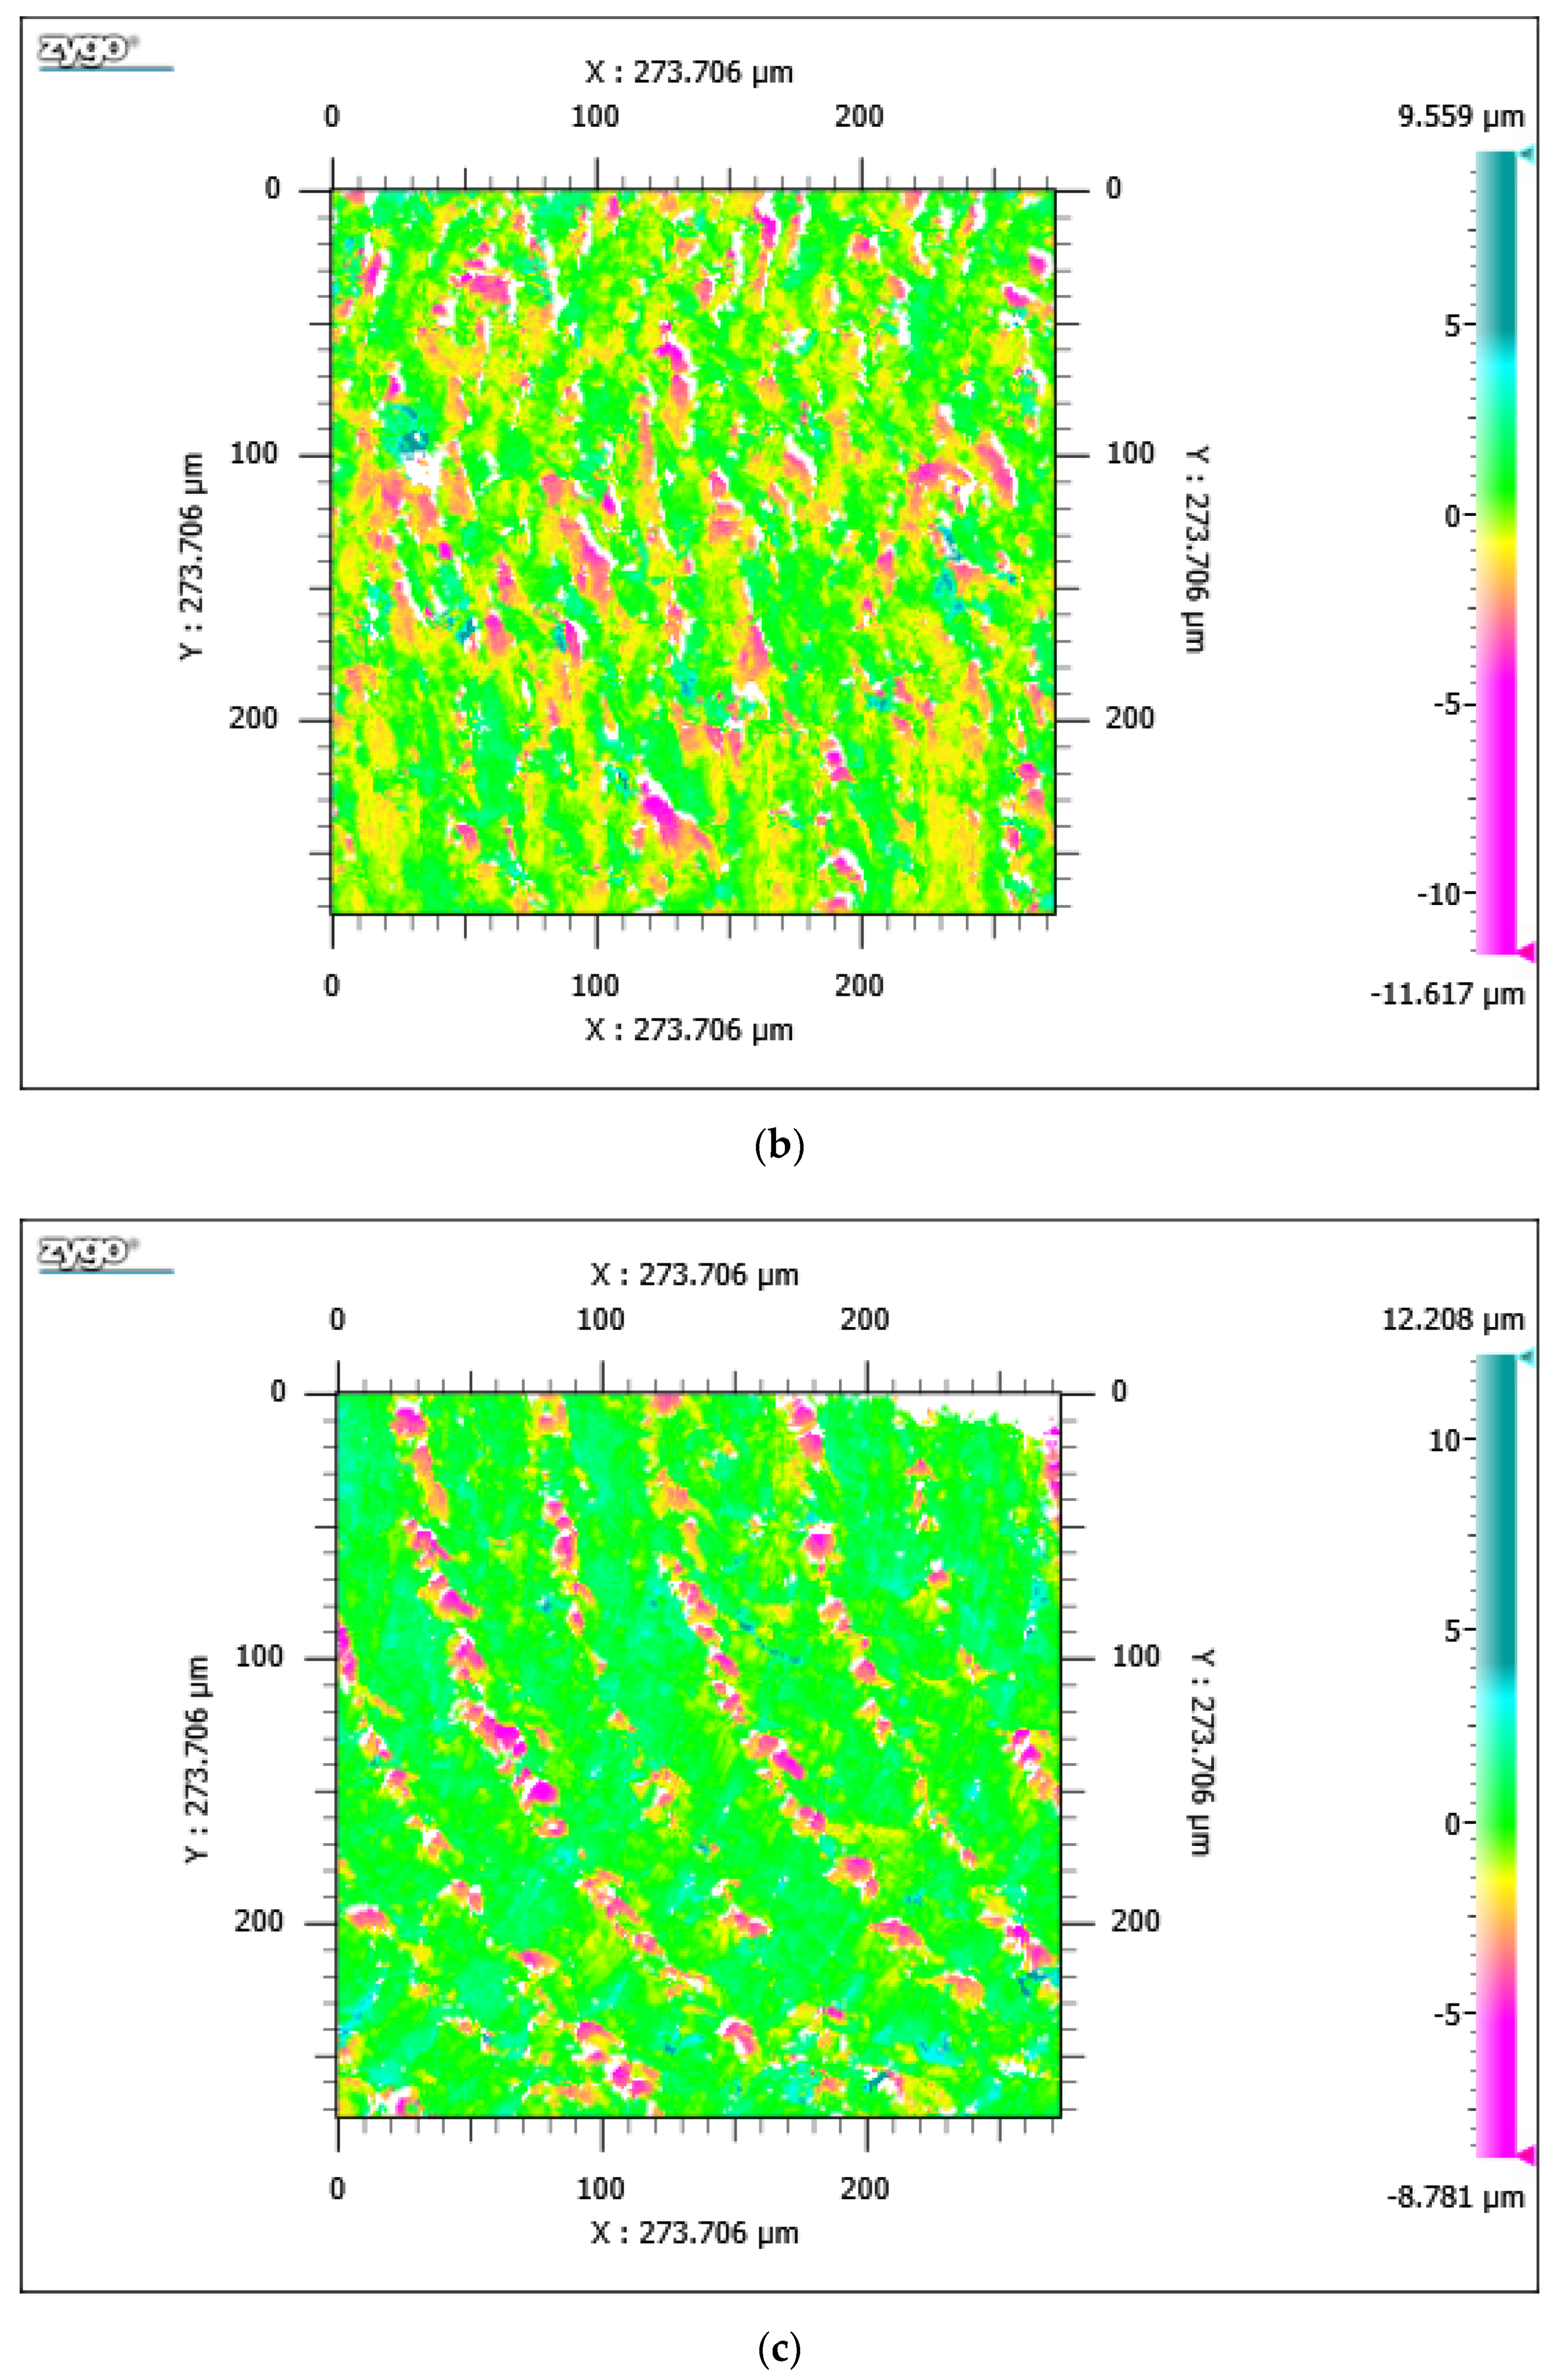
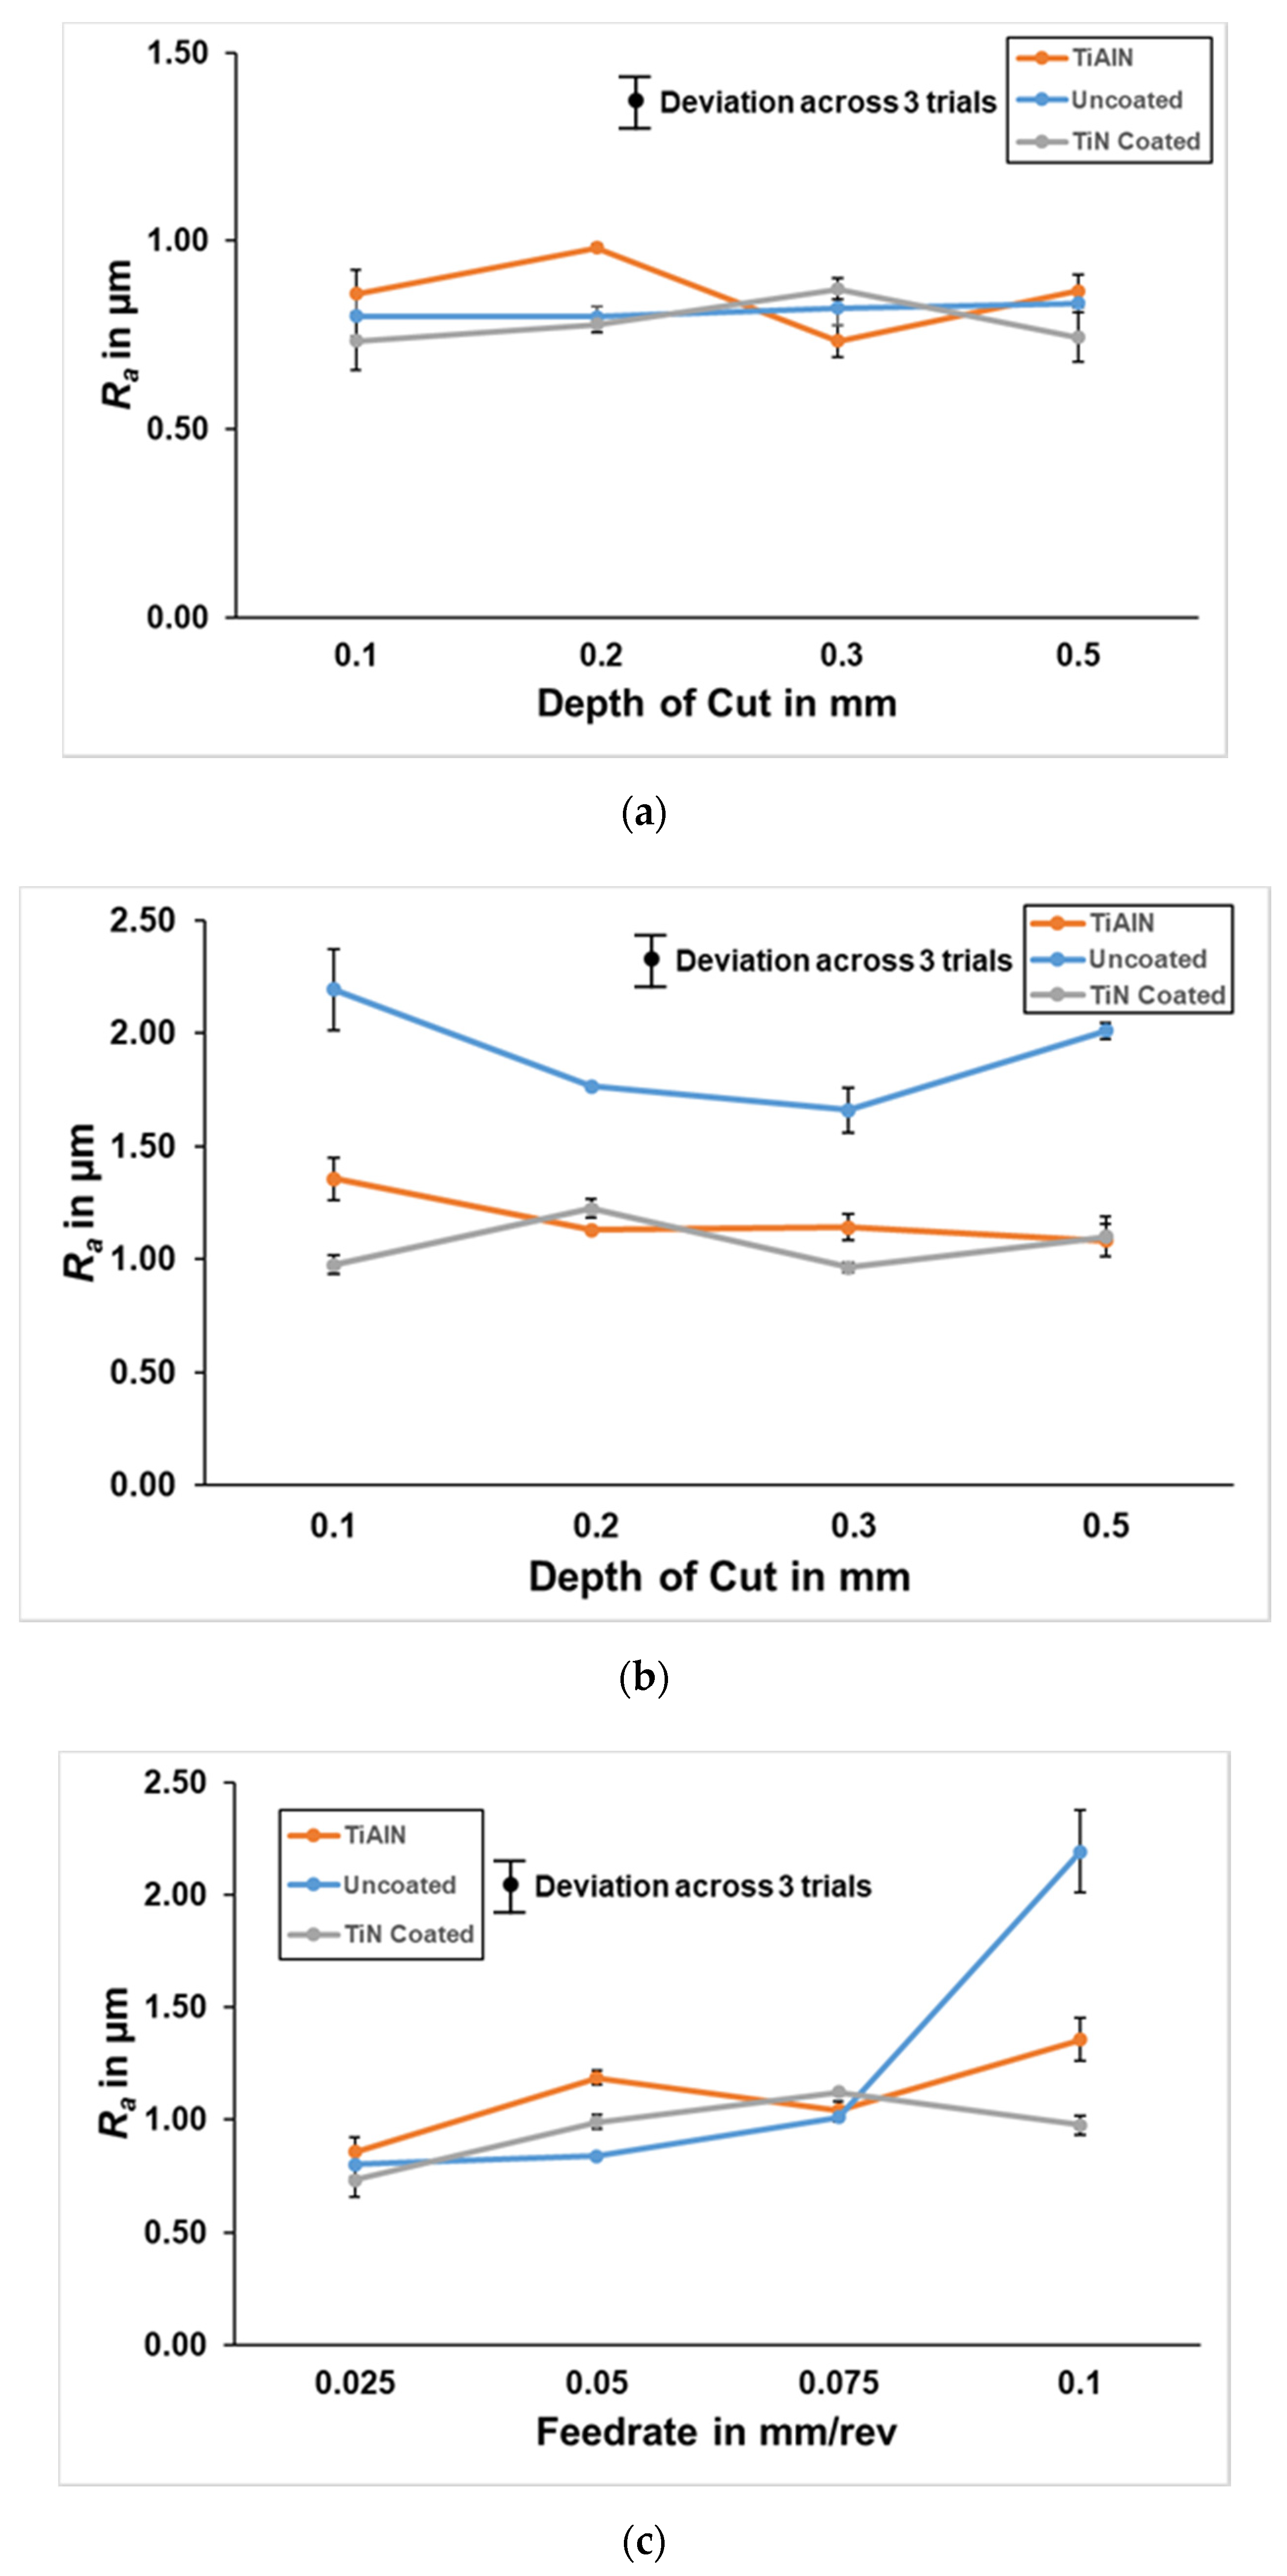
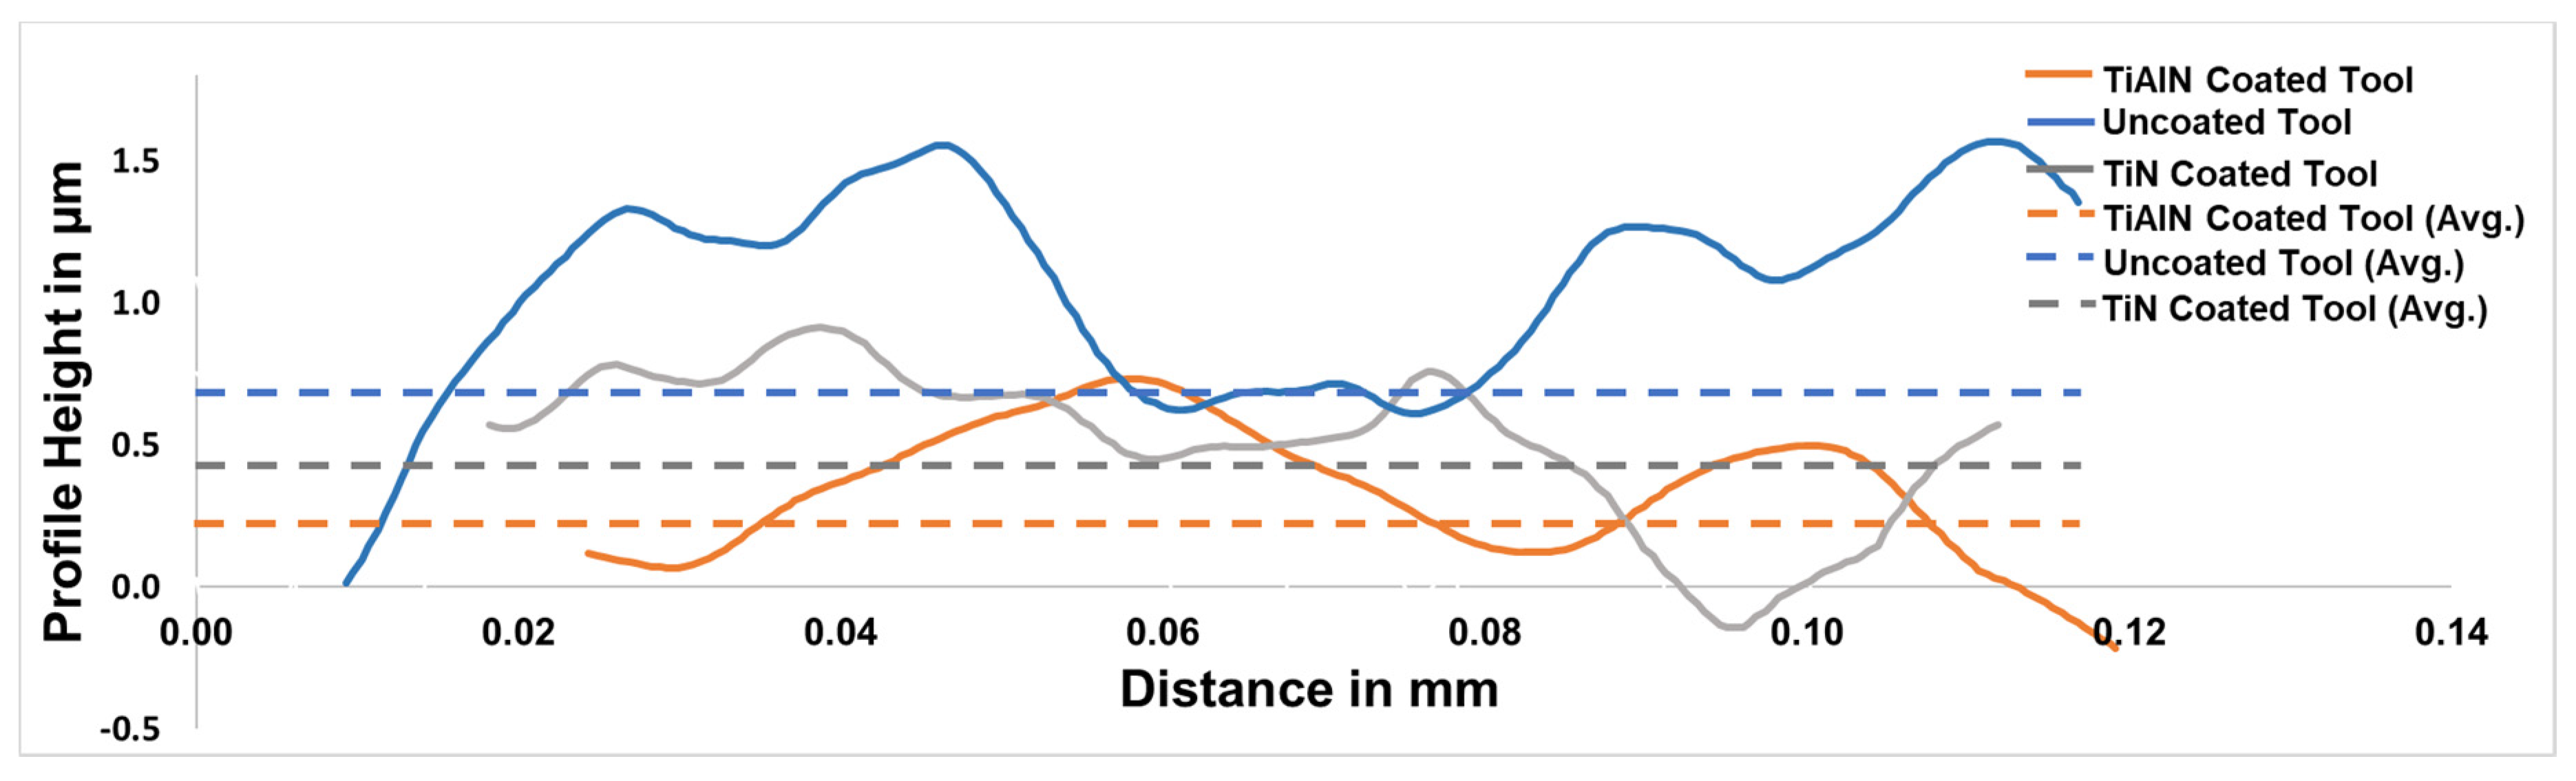
4.1. Surface Integrity Characterization Results

In this work, readings from the Zygo profiler and optical microscope with ImageJ software were used to determine the influence of the varying cutting conditions on both the surface finish and burr formation behavior. For each condition, three different slots (i.e., repeats) were machined and systematically measured to obtain the average surface finish and burr height values. Figure 4a–c shows three measured surface profiles, captured using the Zygo microlite application for slots machined using a TiAlN-coated tool, at a cutting speed of 7680 rpm and 0.3-mm depth of cut, but different feed rates, while Figure 4d–f shows their corresponding slot optical microscope images after polishing. There is a presence of burr on the slots at a feed-rate of 0.025 and 0.075 mm/rev, while there was no burr formed at the highest feed of 0.10 mm/rev. Besides, the captured surface profile depicts a form of squishing or ploughing at a feed rate of 0.025 and 0.075 mm/rev, while the distinctive marks of milling are clearly evident at a feed rate of 0.10 mm/rev. Therefore, surface formation at feeds lower than 0.10 mm/rev is hypothesized to be primarily influenced by factors other than the kinematic profile of the tool being ‘copied’ onto the workpiece surface. Indeed, the surface generation at low feeds appears to be governed by the non-linear size effect that arises due to the finite sharpness of the tool edge radius, as laid out in the previous (modeling) section.
Based on our subsequent analysis of surface roughness and burr formation, we will attempt to show that while tool edge radius is the primary variable controlling surface roughness, burr formation is also strongly influenced by the cutting edge roughness (notchedness), which is highest for untreated/as-ground (uncoated) tools. First, we will focus on the evolution of surface roughness with feed and depth of cut, for the three tool types under investigation.
The arithmetic mean surface roughness   ( R a ) measurements were also plotted against varying parameters (the feed rate and depth of cut) to establish the effect of these parameters on the final surface finish of the polycarbonate slot. Figure 5a,b shows the surface roughness against feed-rates plot at 0.1 mm and 0.2 mm depth of cut, while Figure 5c,d shows the surface roughness against the depth of cuts, at feed-rate of 0.025 and 0.10 mm/rev for TiN-coated, TiAlN-coated and uncoated cutting tools. The uncoated tool plot shows the surface roughness increasing as the feed-rate is increased, however, there is no consistent increase or decrease in roughness values as the depth of cut is varied. Similarly, the TiN- and TiAlN-coated tools’ plots show an increasing trend in the surface roughness values as the feed rate is increased, and no consistent increase or decrease is seen for a varied depth of cut. The increase in surface roughness values for feed rate may be explained by the ploughing effect at low feed rates, with the actual cutting taking place at a high feed rate. The ploughing effect tends to smooth out the generated surface, thereby leaving a random or unpredictable surface finish.
Comparing the effect tool coatings have on the surface finish generated, it can be seen from Figure 5b that coated tools produced a much better surface finish at a higher feed rate when compared with an uncoated tool, while at a lower feed rate the effect is not pronounced, which may be due to the sideflow and ploughing effect observed at low feed-rates. The TiN-coated tool gave the best surface finish when compared to both the TiAlN and the uncoated tool. The TiN-coated tool also arguably gave a better surface finish than the TiAlN-coated and the uncoated tools at a low depth of cut, while a similar trend was observed at a 0.5-mm depth of cut. This observation is likely due to the lack of depth of cut, which plays a significant role on surface finish, is shown in the close similarity between Figure 5c,d.
Furthermore, it is observed that the uncoated tool gives a good surface finish at low feed rates, however, the surface finish becomes poor as the feed rate increases, regardless of the depth of cut. The effect is however most pronounced for the uncoated tool, which is hypothesized to be a direct result of the significantly higher cutting edge roughness of these as-ground (untreated) tools. At increasing feeds (still well-within the finishing regime), the ‘sawtooth’ action of the sharp edges resulting from the tool edge will introduce a significant additional roughness. This effect is hypothesized to decrease with further increases in feed, as the relative value of the edge roughness and the kinematic roughness will lead to the kinematic effect becoming dominant at very large (non-finishing) feeds. The discussed observations have been summarized in Table 3, and the TiN-coated tool appears to be the best across all the tested conditions.

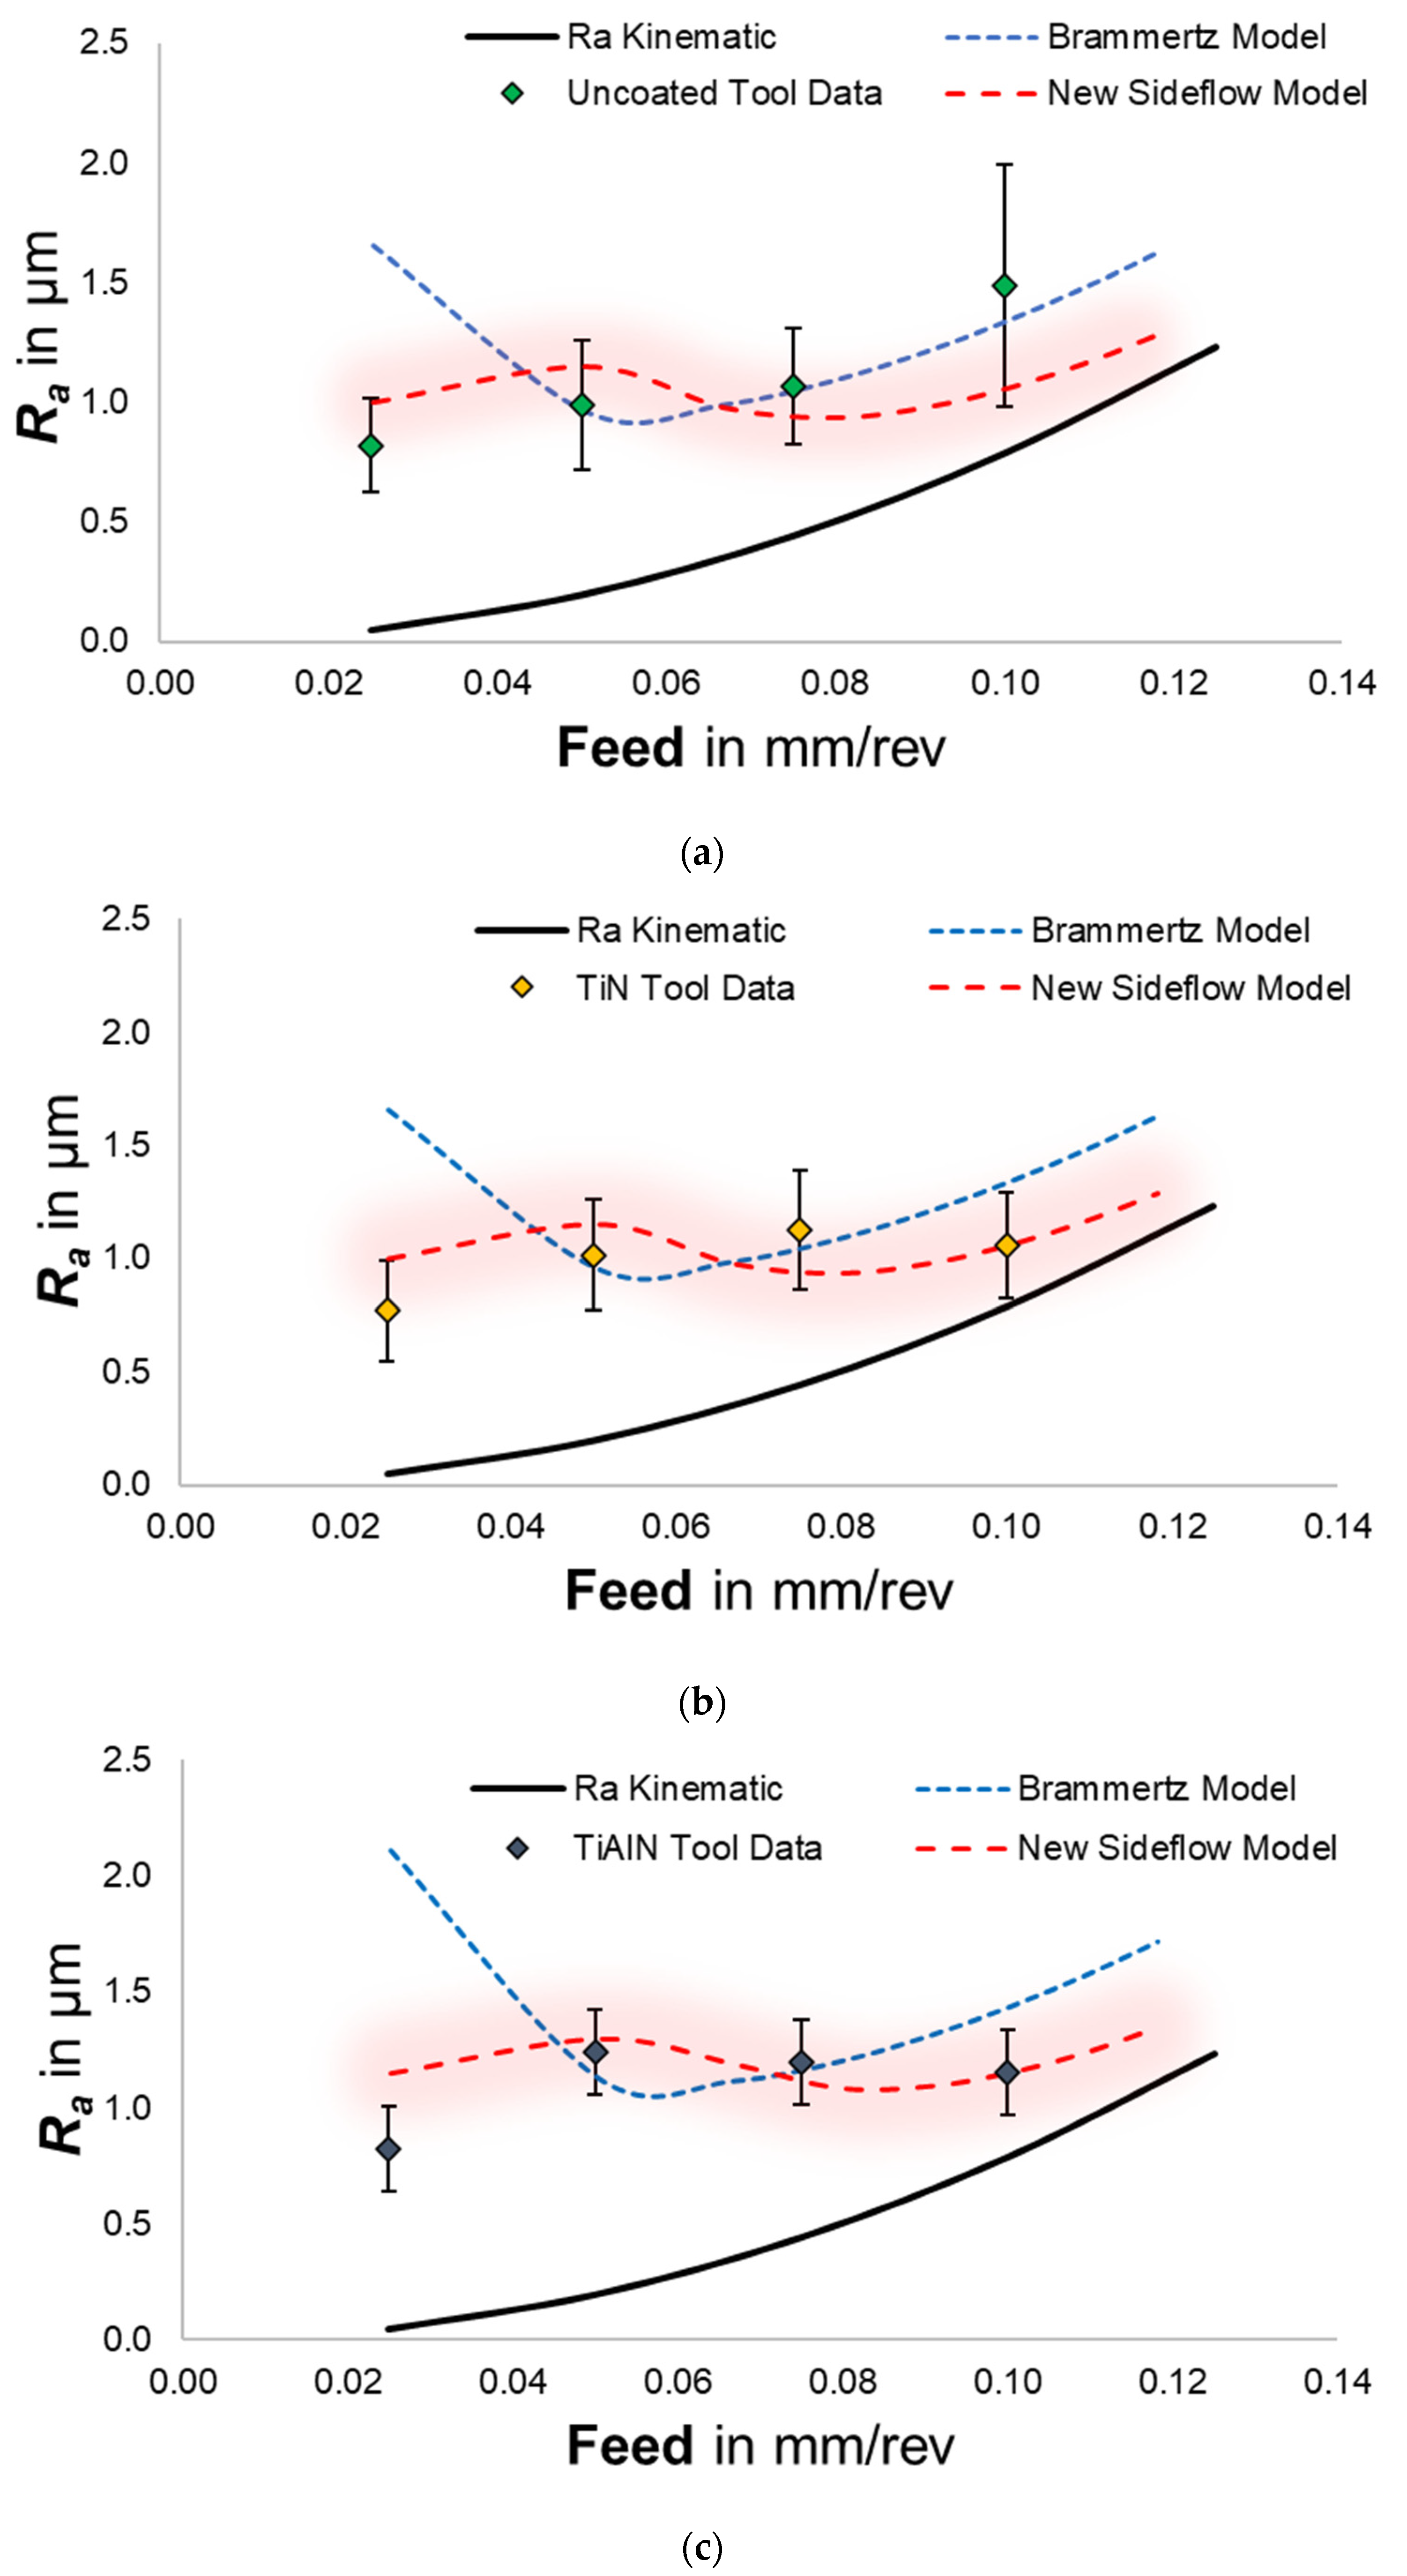
4.2. Modeling of Surface Finish Based on Size Effects: Comparison of Experimental and Calculated
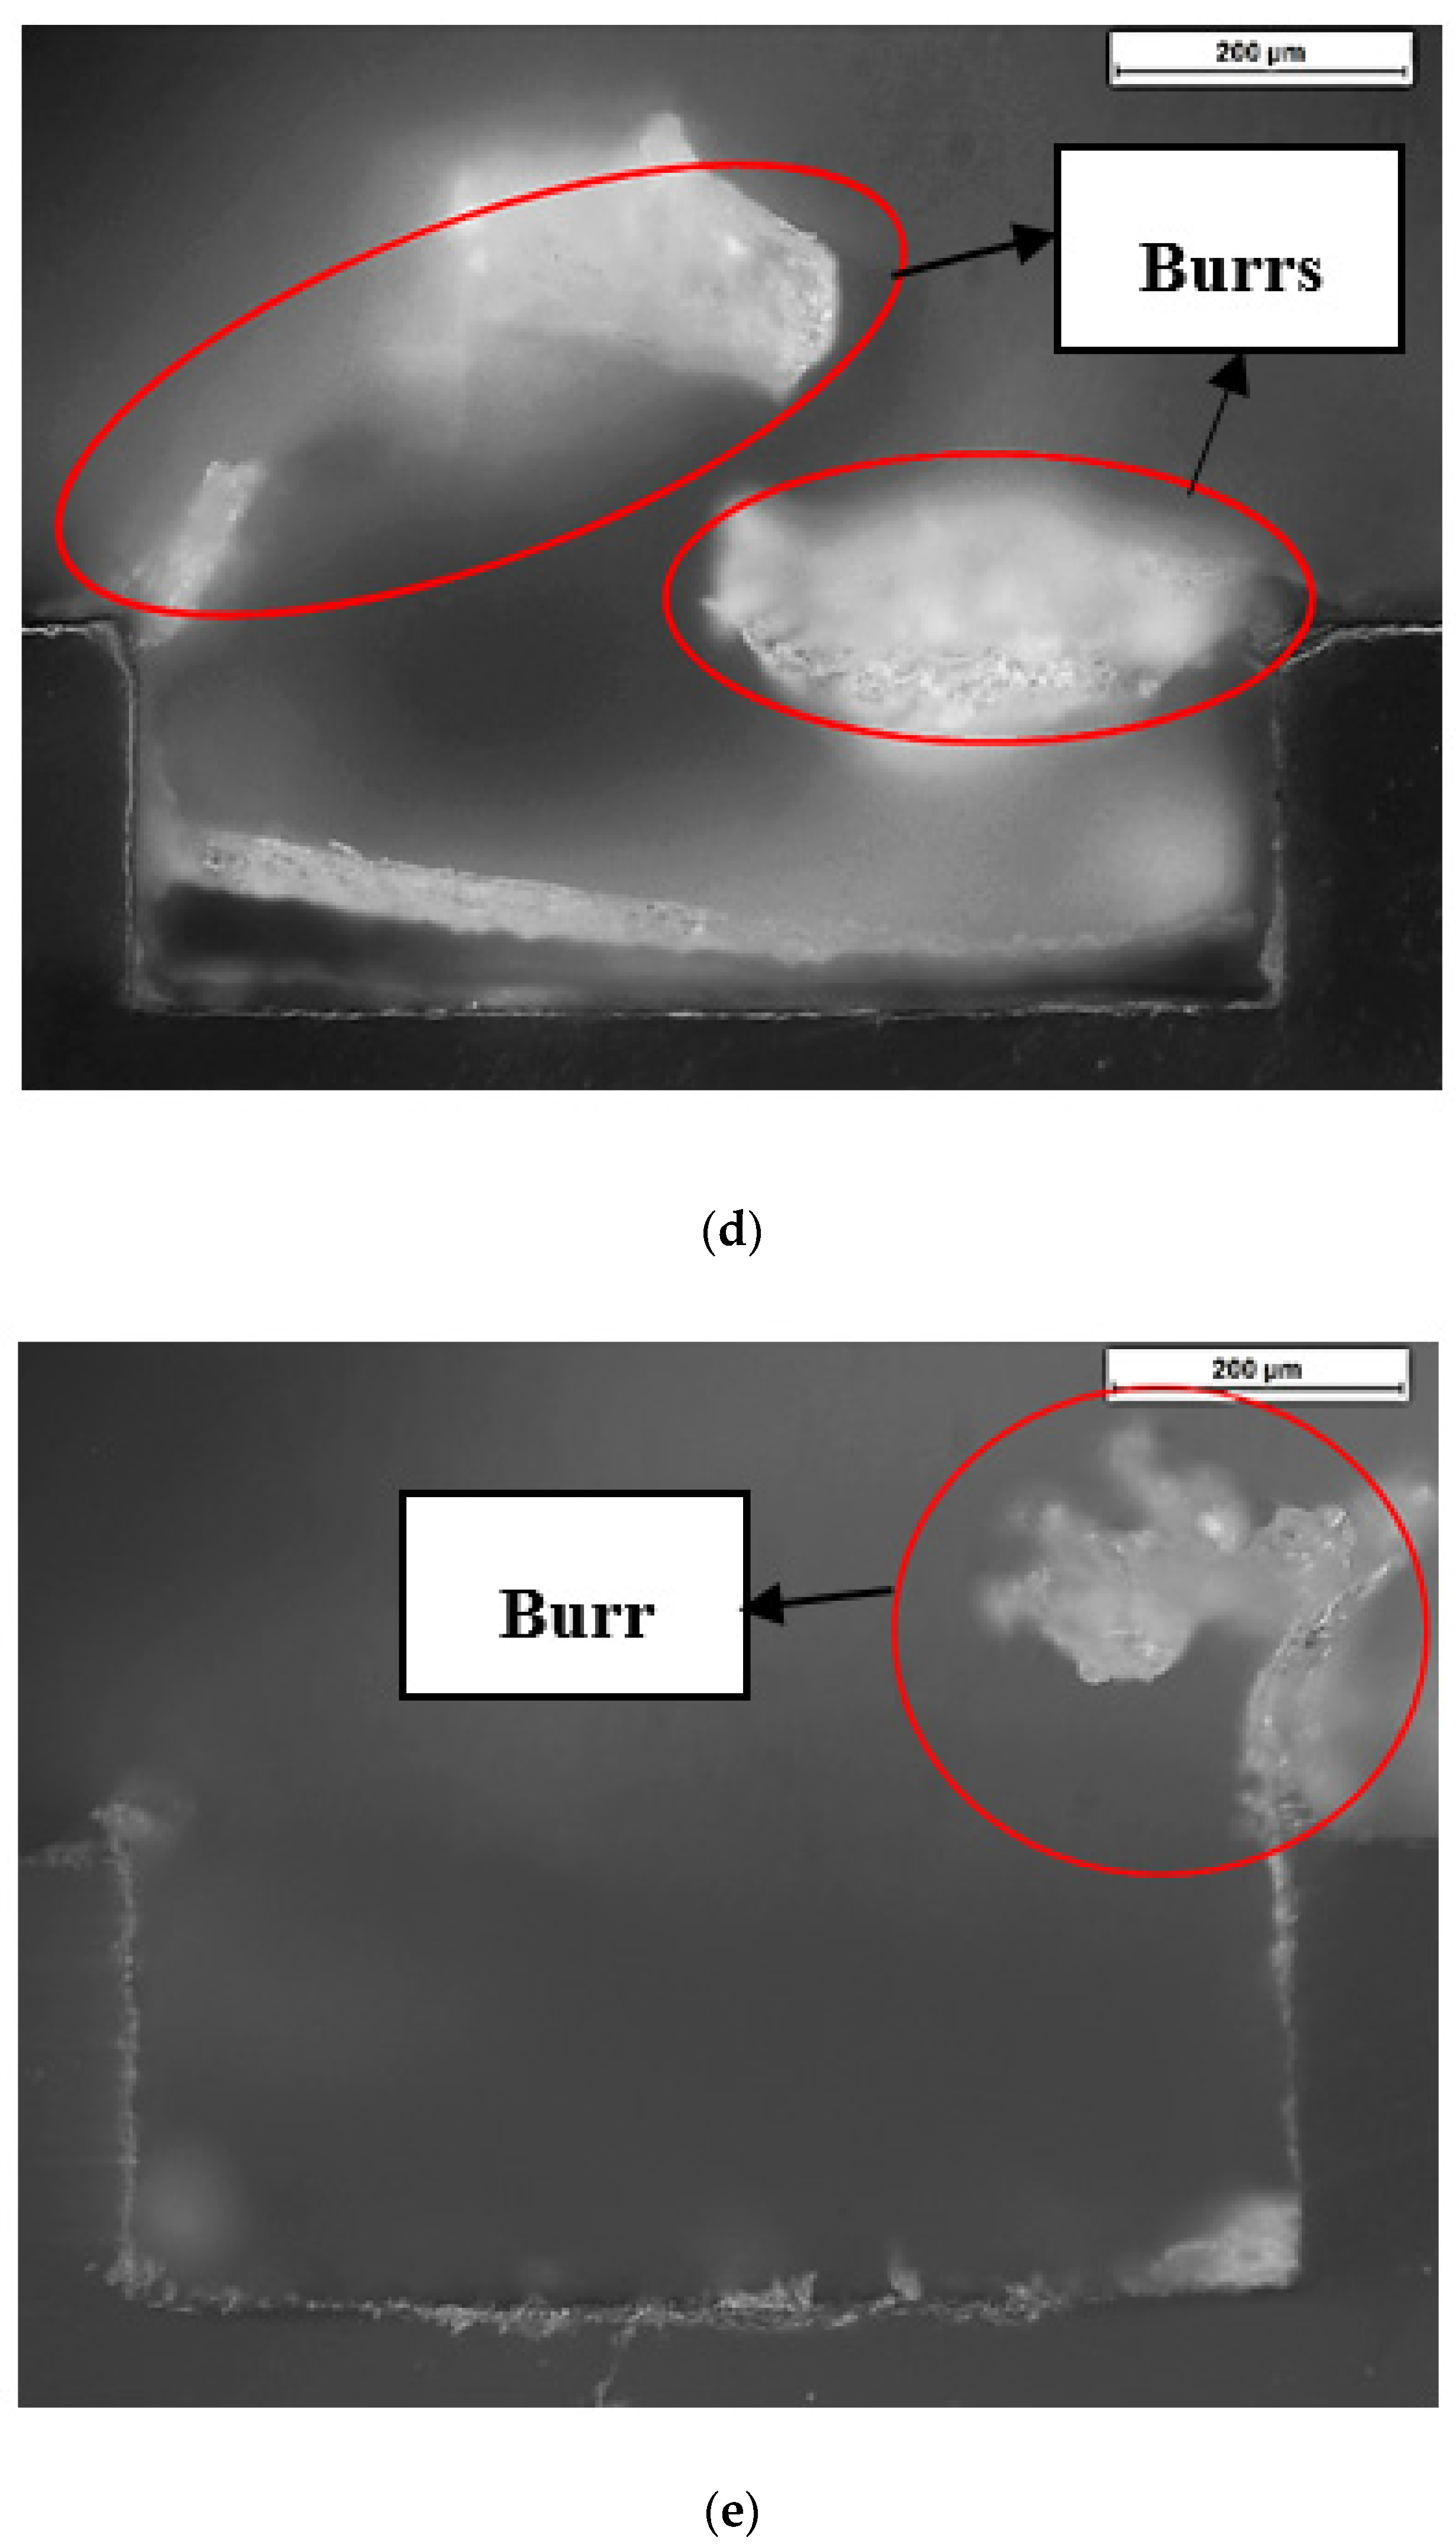
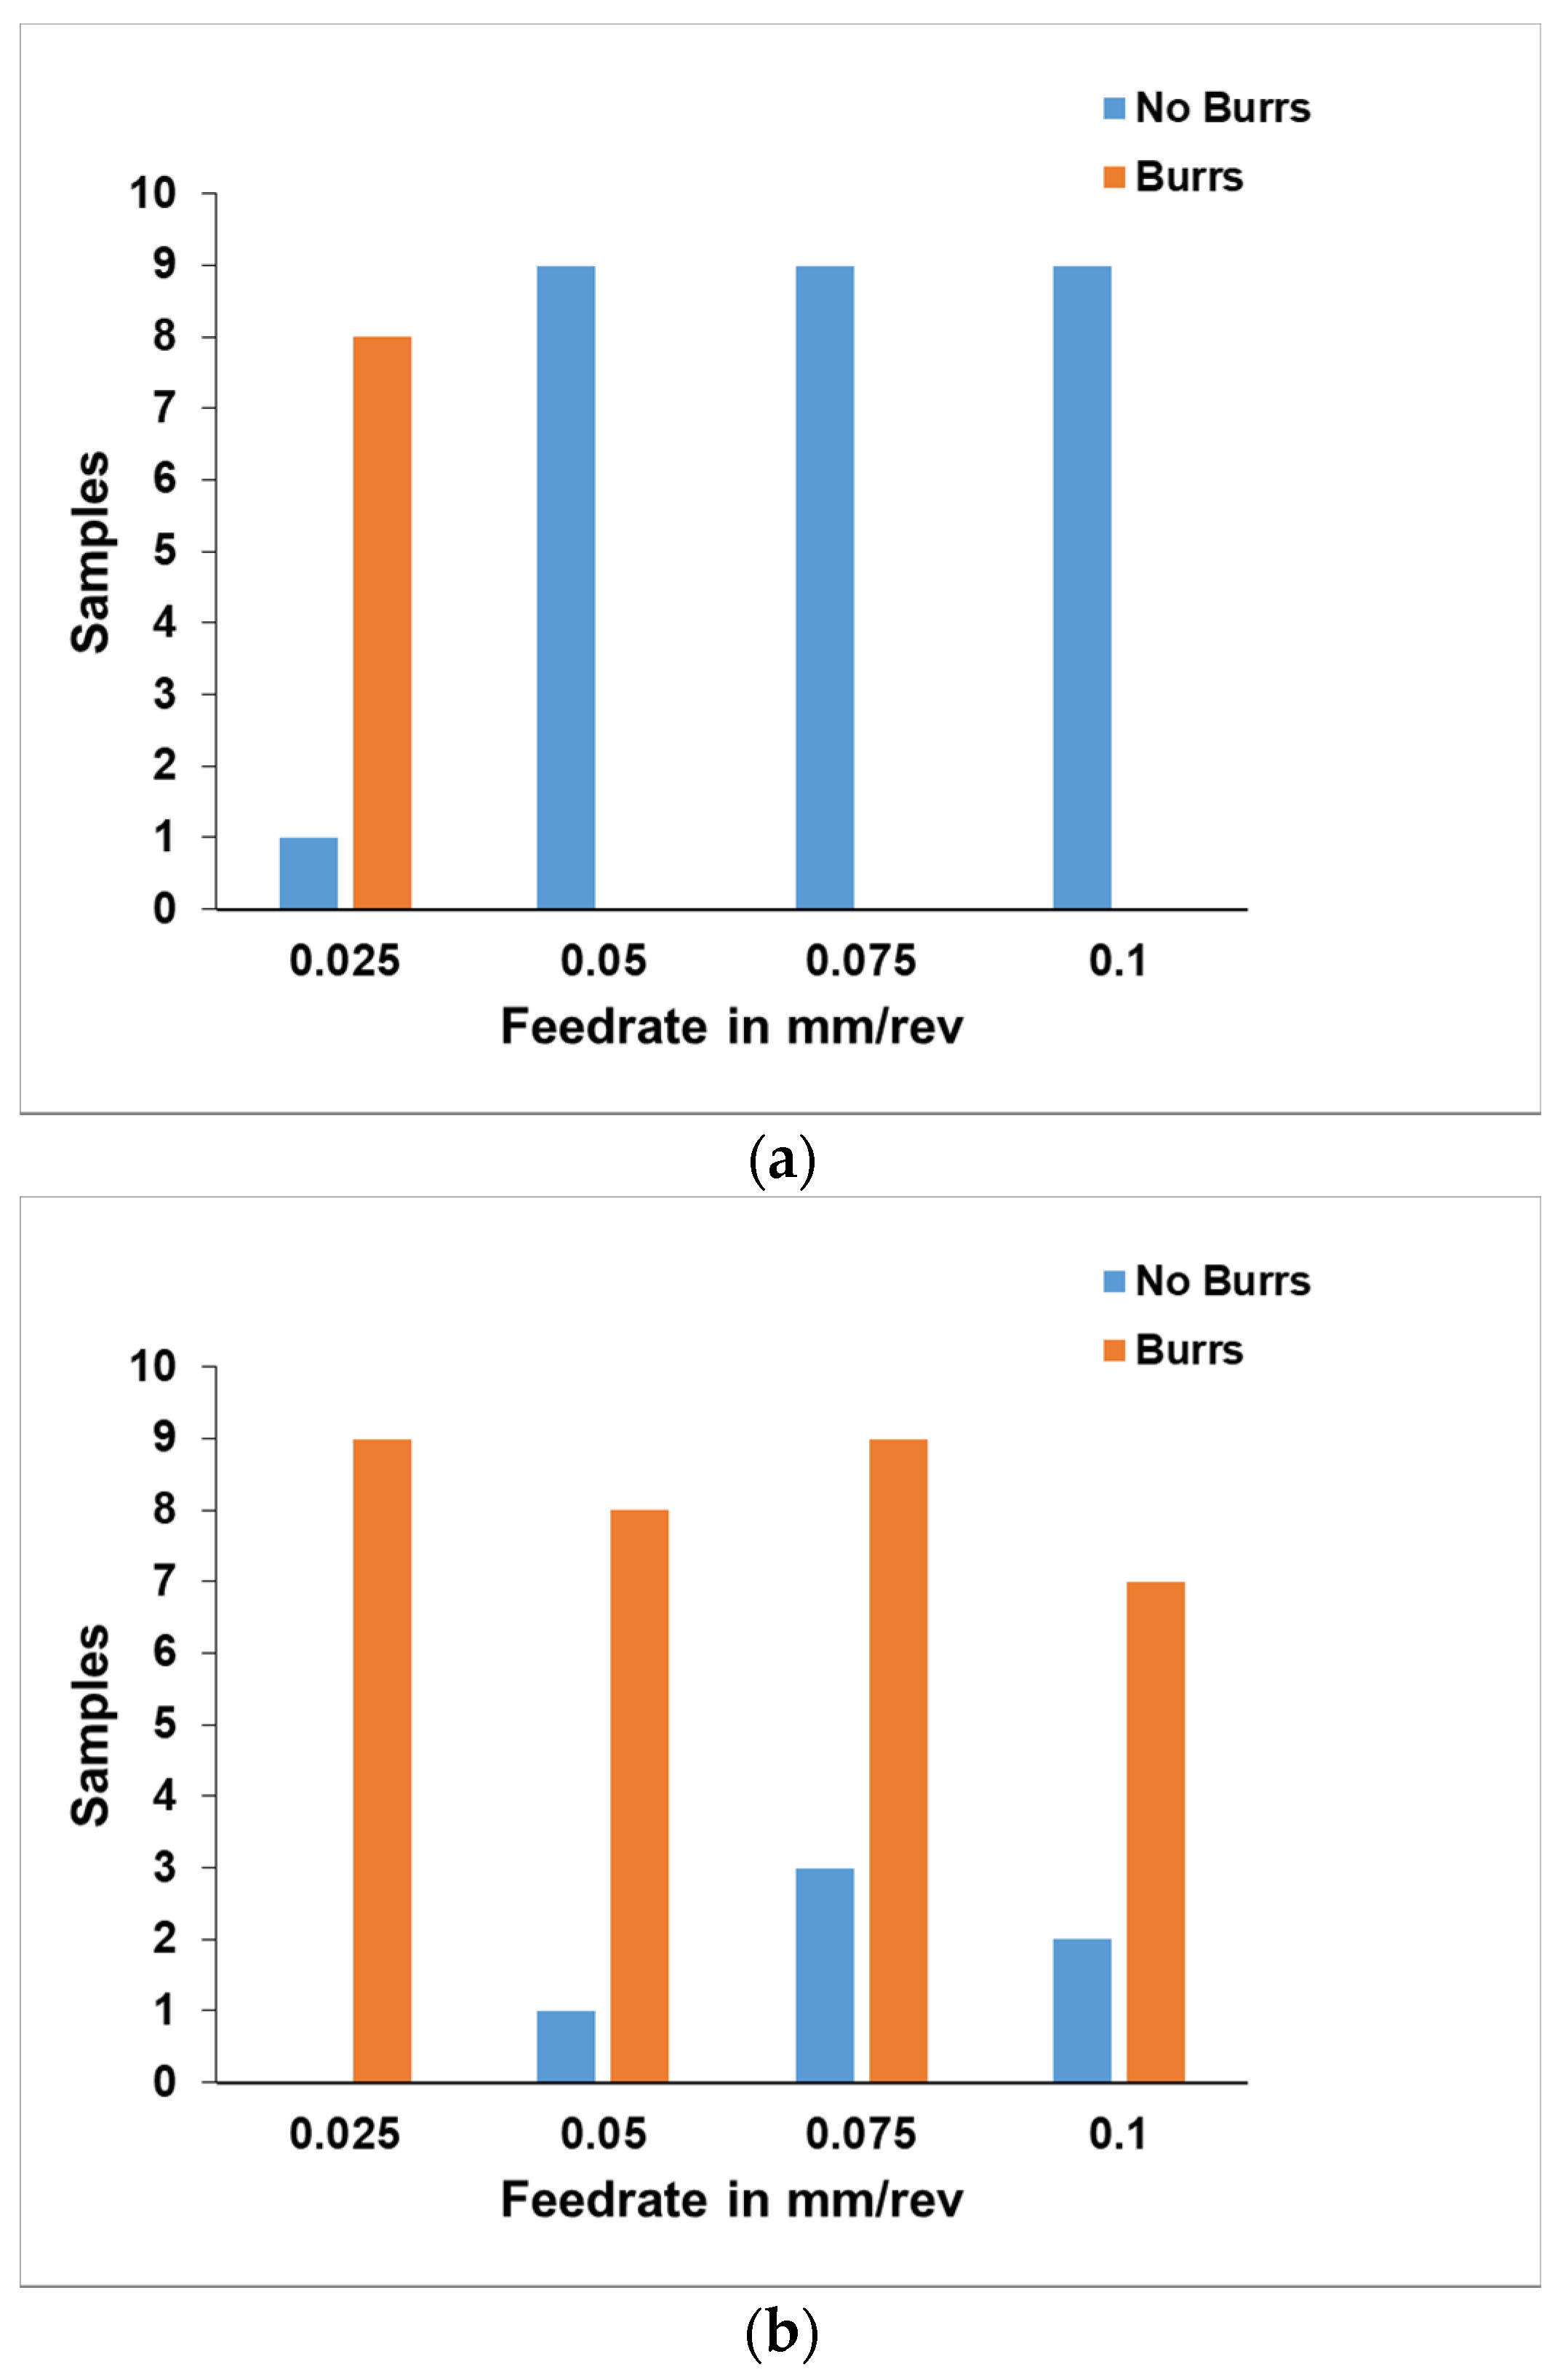
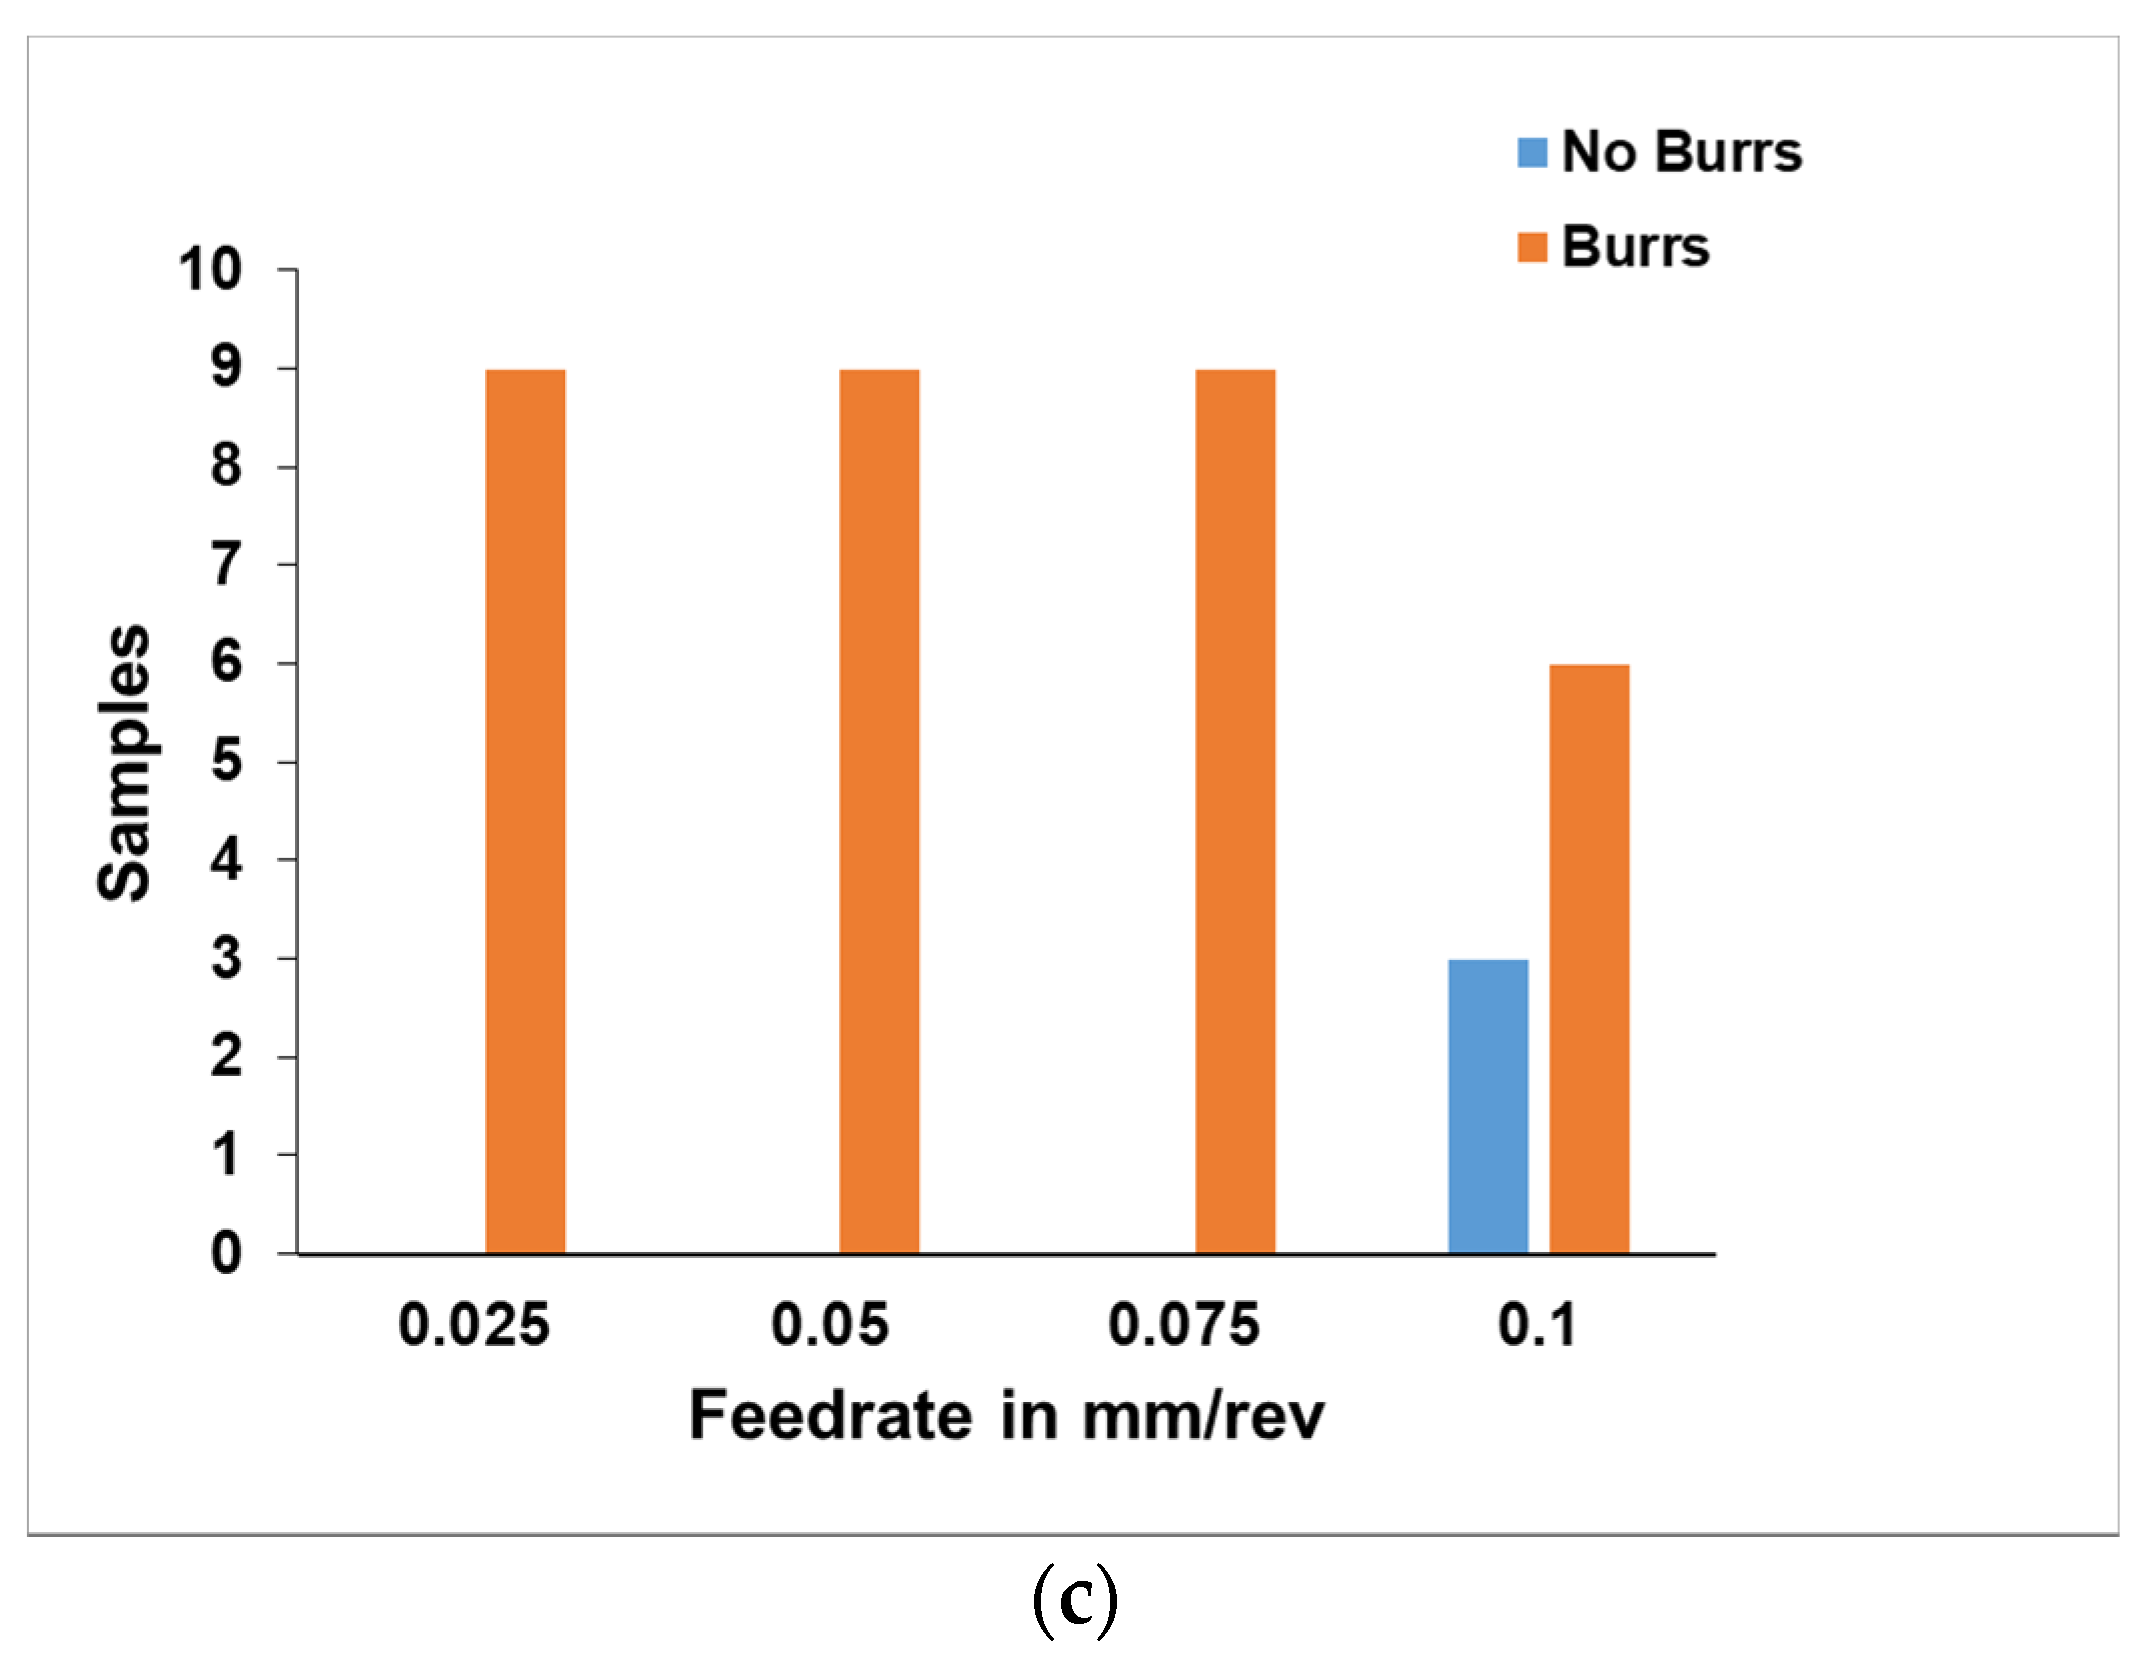
 R a

Based on the sideflow model of surface roughness previously discussed, modeling of the experimental roughness results was conducted by estimating the value of the minimum chip thickness, h m i n , based on a best-fit regression between the experimental data and model-predicted roughness values. In other words, modeling was used to inversely determine the minimum chip thickness value for each of the three tool types used in this study. The results of this analysis, along with measured cutting-edge radii ( r β ) for each tool, the ratio between the minimum chip thickness and edge radius, as well as the equivalent minimum rake angle   γ m i n , are summarized in Table 4 below.
As can be seen in Table 4, all three tool types resulted in similar ratios of h m i n / r β , suggesting consistent (near-linear) scaling of this particular size effect. Interestingly, the uncoated tool used during this study featured a larger edge radius than the TiN-coated tool, the latter of which is a CVD coating, typically applied to honed tools. Clearly, in addition to general trends (e.g., uncoated tools tend to be sharper than coated tools), the difference between the substrate grades and coating techniques of different manufacturers plays a significant effect in determining the sharpness of different tool types. Moreover, the roughness of each cutting edge, as representatively shown in Figure 6, was significantly higher for the uncoated tool. Since coated tools typically require some preparation (e.g., honing, blasting, brushing, etc.), such tools are not only expected to feature (slightly) higher cutting edge radii, but also significantly ‘smoother’, i.e., more uniform, edge profiles. Indeed, improved edge profiles are one of the key reasons why edge preparation (honing) is well-known to increase tool-life in the machining of high-strength metals.
The ‘effective sharpness’ of any tool will be a combination of the (average) cutting edge radius and the (lateral) cutting edge roughness, the latter of which introduces localized stress concentrations, promoting a sawtooth-like cutting action. As will be discussed later, this sawtooth cutting mechanism is hypothesized to be particularly relevant with respect to burr formation (or rather, the lack thereof). Regardless of this observation, the experimental results were captured quite well by the proposed sideflow model. Figure 7a–c below summarize these results, including the predicted roughness trends from the elastic springback Brammertz model.
Figure 7 shows that the well-documented deviation between experimental and theoretical kinematic roughness was also observed during the milling of the thermoplastic material. However, the modeling of this deviation based on the minimum chip thickness effect was not possible using the traditional model of Brammertz, which assumes elastic springback and neglects plastic sideflow. The new, geometric-based sideflow model proposed here appears to accurately capture the relatively complex evolution of surface roughness with increasing feed, which is interpreted as evidence for the strong effect of sideflow in the machining of polycarbonate, and by extension, similar thermoplastics.
As feed is increased, the increase in surface roughness due to sideflow becomes significantly diminished, to the point that the kinematic roughness may be achieved within some reasonable tolerance (e.g., 10% deviation at 0.12 mm/rev feed). The maximum deviation between kinematic and experimental roughness occurred at the transition between ‘saturated sideflow’, i.e., the point at which the roughness increases due to sideflow reaching its limiting/maximum value of h m i n , to the more complex roughness evolution with increasing feed. This critical transition occurred around 0.06 mm/rev of feed for all three tool types, which were all approximately on the same order of magnitude for both their cutting-edge radii and minimum chip thickness values (see Table 4).
While the proposed model currently neglects higher-order kinematic effects, which may influence the roughness evolution at very low values of feed, the simple model nevertheless performed particularly well in this regime. Since h m i n   is the dominant factor determining roughness in the low feed (i.e., finishing) regime, this suggests that reducing h m i n   is the most direct course of action towards reducing roughness in the machining of thermoplastics. Practically, such reduction may be achieved by simply reducing the cutting-edge radius, since there appears to be a ratio between h m i n and the edge radius (see Table 4). Moreover, the effect of coatings on the roughness evolution, when correcting for edge radius effects, was not significant, particularly at lower feed values. Therefore, very sharp (e.g., laser-machined nanograin carbide, or poly-crystalline diamond (PCD), mono-crystalline diamond (MCD)) tools are expected to perform particularly well. Because of the low shear strength of thermoplastics, tool-wear should likewise not be a significant concern, despite the relatively low strength of very sharp tool edge micro geometries. One may also further increase the effective sharpness (reduce effective edge radius) by increasing both rake and flank clearance angles, to reduce elastic springback and rubbing while reducing the cross-section of the cutting-edge wedge. Future work will consider developing such engineered tools for the high-performance machining of thermoplastics, including advanced composites based on thermoplastic matrix material [e.g., graphene fiber-reinforced plastics (GFRP) and carbon fiber-reinforced plastics (CFRP)].

4.3. Burr Formation

The sideflow and ploughing effect observed at lower feed-rates tend to push the cut material towards the wall of the slot, due to the low melting point and flow common to thermoplastic materials, which subsequently results in the formation of burrs on the top surface of the slots, as discussed in Section 4.2. Table 5, Table 6 and Table 7 show the burr heights and Figure 8a–c shows the burr frequency plots for different tools and feed rates. The uncoated tool burr plot (Figure 7a) shows burr formations at a low feed rate when using the uncoated tool, however, at higher feed rates, there are no burrs formed on the slot surface. The TiN-coated burr plot (Figure 8b) shows a different trend, several burrs were formed across all the feed rates and depth of cut, with a lower burr formation rate at a high feed rate of 0.10 mm/rev. The TiAlN-coated tool burr plot (Figure 8c) also shows a similar trend, which can be seen to have more burrs formed across all the feed rates. Since both the uncoated and TiN-coated tool featured similar edge radius values (see Table 3), it is hypothesized that the tribological behavior of the TiN coating sliding against the polycarbonate workpiece material gave rise to the observed behavior. Specifically, the significantly lower surface (edge) roughness and coefficient of friction of coated tools together allow for a more even distribution of (localized) cutting forces.
In metal cutting, the lubricating and smoothing effect of tool coatings (and associated tool preparation steps, e.g., honing or brushing) is highly desirable, as frictional heat generation and thermomechanical loads on the cutting tool are reduced. However, in the cutting of polymers, the micro-roughness of an uncoated (as-ground) cutting tool may act like a microscopic saw, i.e., the serrations left by the tool grinding process increase local contact pressures to separate the burr with each pass, rather than allowing a continuous/smooth burr to slide over the cutting edge without getting cut. Indeed, the local cutting edge radius of the microscopic serrations on an uncoated cutting tool is typically on the order of hundreds of nanometers (about an order of magnitude less than the overall cutting edge radius), allowing for ‘cleaner’ cutting, much like the action of a sharp saw, with less ploughing and sliding of the plastic chip and workpiece material than for a smooth edge of comparable sharpness.
Figure 6 further supports the ‘sawtooth’ hypothesis of burr reduction, as the uncoated tool (blue profile) exhibits significantly higher absolute edge roughness, with pronounced local peaks of low radius. Based on this same reasoning, it is also possible to explain that coated tools resulted in ‘better’ surface finish (lower roughness at increase feeds), compared to the uncoated tool, due to the presence of sideflow or the lubricating effect that the extra layer of coating provides. However, as mentioned earlier, there is no correlation between the depth of cut values and burr formation. Indeed, depth of cut does not affect the geometric shape of the uncut chip in the region of surface generation, so this observation is consistent with well-established trends and the reasoning laid out in this section.

5. Conclusions

Based on the results presented and discussed in this manuscript, the following conclusions can be drawn:
  • Depth of cut had no significant impact on either surface roughness or burr formation, while feed and tool type were the most significant factors during the machining of thermoplastic polycarbonates.
  • Based on a proposed model of sideflow, which attempts to capture thermoplastic material response, the effect of the cutting-edge radius was determined to have a dominant effect on surface roughness, leading to increased roughness for larger edge hones.
  • Burr formation was least pronounced with uncoated tools, particularly at higher feed rates. This suggests that the lubricating effect of coatings promotes sideflow, which leads to an increase in burr formation.
  • Based on the experimental and analytical findings, an uncoated tool with the lowest possible edge radius (i.e., as sharp as possible) would be expected to result in minimum surface roughness, with little to no burr formation, particularly at higher feeds.
  • Burr formation was significantly lower for uncoated tools, despite the similar order-of-magnitude of the cutting edge radius when compared with coated tools. As uncoated/untreated (as-ground) tools feature significantly higher (lateral) cutting edge roughness, it is hypothesized that this (generally undesirable) edge roughness promoted a sawtooth-like cutting mechanism, which effectively suppressed burr formation
  • Future work should consider reducing the undesirable thermoplastic material response through targeted cooling, to further reduce plastic sideflow and burr formation, both of which are considered to be plastic flow phenomena that manifest at elevated (cutting) temperatures. Together with engineered cutting-edge geometries (sharp, uncoated), we hypothesized that such an integrated approach could yield a significantly improved surface quality, which the authors plan to validate experimentally in the near future.

Author Contributions

Conceptualization, M.J. and J.S.; methodology, D.A. and S.G.; software, D.A., and S.G.; validation, J.S., M.J. and D.A.; formal analysis, M.J., and J.S.; investigation, D.A.; resources, J.S.; data curation, D.A.; writing—original draft preparation, J.S., D.A., M.J.; writing—review and editing, M.J., C.H.; visualization, J.S.; supervision, J.S.; project administration, J.S.; funding acquisition, M.J., and C.H. All authors have read and agreed to the published version of the manuscript.

Funding

Purchase of materials and supplies for this research was funded by Western Kentucky University, Internal Grant RCAP 17-8057.

Acknowledgments

The authors also thank Greg Arbuckle in the running of preliminary machining experiments.

Conflicts of Interest

The authors declare no conflict of interest. The funders had no role in the design of the study; in the collection, analyses, or interpretation of data; in the writing of the manuscript, or in the decision to publish the results.

References

  1. Alauddin, M.; Choudhury, I.; El Baradie, M.; Hashmi, M. Plastics and their machining: A review. J. Mater. Process. Technol. 1995, 54, 40–46. [Google Scholar] [CrossRef]
  2. Jahan, M.P.; Ma, J.; Hanson, C.; Chen, X.; Arbuckle, G.K. Experimental and numerical investigation of cutting forces in micro-milling of polycarbonate glass. Mach. Sci. Technol. 2019, 24, 366–397. [Google Scholar] [CrossRef]
  3. Eriksen, E. Influence from production parameters on the surface roughness of a machined short fibre reinforced thermoplastic. Int. J. Mach. Tools Manuf. 1999, 39, 1611–1618. [Google Scholar] [CrossRef]
  4. Bendler, J.T. Handbook of Polycarbonate Science and Technology; CRC Press: Boca Raton, FL, USA, 1999. [Google Scholar]
  5. Higgins, B.A.; Brittain, W. Polycarbonate carbon nanofiber composites. Eur. Polym. J. 2005, 41, 889–893. [Google Scholar] [CrossRef]
  6. Kim, H.; Macosko, C.W. Processing-property relationships of polycarbonate/graphene composites. Polymer 2009, 50, 3797–3809. [Google Scholar] [CrossRef]
  7. Eitan, A.; Fisher, F.T.; Andrews, R.; Brinson, L.C.; Schadler, L. Reinforcement mechanisms in MWCNT-filled polycarbonate. Compos. Sci. Technol. 2006, 66, 1162–1173. [Google Scholar] [CrossRef]
  8. Mekaru, H.; Takahashi, M. Imprinting a needle array on a polycarbonate substrate. Int. J. Precis. Eng. Manuf. 2009, 10, 79–83. [Google Scholar] [CrossRef]
  9. Mekaru, H.; Noguchi, T.; Goto, H.; Takahashi, M. Nanoimprint Lithography Combined with Ultrasonic Vibration on Polycarbonate. Jpn. J. Appl. Phys. 2007, 46, 6355–6362. [Google Scholar] [CrossRef]
  10. Liu, Y.; Ganser, D.; Schneider, A.; Liu, R.; Grodzinski, P.; Kroutchinina, N. Microfabricated Polycarbonate CE Devices for DNA Analysis. Anal. Chem. 2001, 73, 4196–4201. [Google Scholar] [CrossRef]
  11. Rey-García, F.; Bao, C.; Gómez-Reino, C.; Fuente, G.D.L. Laser 3D Internal Machining of Polymers. In Proceedings of the EOS Annual Meeting (EOSAM), Aberdeen, UK, 25–28 September 2012. [Google Scholar]
  12. Mutapcic, E.; Iovenitti, P.; Hayes, J.P. Overlay Error Effects on Polycarbonate Structures Produced by 248 nm UV Laser Ablation Tool. In Proceedings of the 3rd Asia-Pacific Forum on Precision Surface Finishing and Deburring Technology, Melbourne, Australia, 26–28 March 2003; pp. 269–280. [Google Scholar]
  13. Karazi, S.M.; Brabazon, D. Evaluation of the Effect of Nd: YVO4 Laser Parameters on Internal Micro-Channel Fabrication in Polycarbonate. Int. Conf. Evol. Comput. Theory Appl. 2011, 1, 254–259. [Google Scholar]
  14. Gruescu, C.M.; Ionescu, C.L.; Nicoarǎ, I.; Lovasz, A. Experimental optimization of process parameters in laser cutting of polycarbonate gears. Mechanics 2012, 18, 233–238. [Google Scholar] [CrossRef]
  15. Zheng, H.; Liu, H.; Wan, S.; Lim, G.; Nikumb, S.; Chen, Q. Ultrashort pulse laser micromachined microchannels and their application in an optical switch. Int. J. Adv. Manuf. Technol. 2005, 27, 925–929. [Google Scholar] [CrossRef]
  16. Chen, X.; Hu, Z. An effective method for fabricating microchannels on the polycarbonate (PC) substrate with CO2 laser. Int. J. Adv. Manuf. Technol. 2017, 92, 1365–1370. [Google Scholar] [CrossRef]
  17. Guo, Z.; Ramulu, M. Investigation of displacement fields in an abrasive waterjet drilling process: Part 2. Numerical analysis. Exp. Mech. 2001, 41, 388–402. [Google Scholar] [CrossRef]
  18. Getu, H.; Ghobeity, A.; Spelt, J.K.; Papini, M. Abrasive jet micromachining of acrylic and polycarbonate polymers at oblique angles of attack. Wear 2008, 265, 888–901. [Google Scholar] [CrossRef]
  19. Mohaupt, U.H.; Burns, D.J. Machining unreinforced polymers with high-velocity water jets. Exp. Mech. 1974, 14, 152–157. [Google Scholar] [CrossRef]
  20. Khan, D.A.; Kumar, J.; Jha, S. Magneto-rheological nano-finishing of polycarbonate. Int. J. Precis. Technol. 2016, 6, 89. [Google Scholar] [CrossRef]
  21. Lee, Y.-C.; Kim, K.-S.; Kwak, T.-S.; Lee, J.-R. An experimental study on magnetic assisted polishing of polycarbonate plate for recycling. J. Korean Soc. Manuf. Process Eng. 2013, 12, 1–6. [Google Scholar]
  22. Bolat, M. Machining of Polycarbonate for Optical Applications; Middle East Technical University: Ankara, Turkey, 2013. [Google Scholar]
  23. Saini, V.; Sharma, D.; Kalla, S.; Chouhan, T. Optimisation of process parameter in ultra-precision diamond turning of polycarbonate material. In Proceedings of the International Conference on Manufacturing Excellence MANFEX, Noida, India, 29–30 March 2012. [Google Scholar]
  24. Singh, H.S.H.; Vaishya, R.O.; Sing, K.; Mishra, V.; Sarepaka, R.V. Analysis of Surface Roughness and Waviness During Diamond Turning of Polycarbonate. Int. J. Sci. Res. 2012, 2, 268–270. [Google Scholar] [CrossRef] [Green Version]
  25. Khatri, N.; Mishra, V.; Sarepaka, R.G.V. Optimization of Process Parameters to Achieve Nano Level Surface Quality on Polycarbonate. Int. J. Comput. Appl. 2012, 48, 39–44. [Google Scholar] [CrossRef]
  26. Gindy, N.N.Z. Minimum energy criterion applied to the orthogonal machining of polymers. Int. J. Prod. Res. 1988, 26, 1769–1778. [Google Scholar] [CrossRef]
  27. Barwasser, G. Turning Tool for Machining the Edges of Plastic Lenses. U.S. Patent 4,841,676, 27 June 1989. [Google Scholar]
  28. Raffaelli, D.R. Process to Edge and Polish Polycarbonate and CR 39 Lenses with Diamond Wheels. U.S. Patent 5,711,700, 27 January 1998. [Google Scholar]
  29. Chen, P.-C.; Pan, C.-W.; Lee, W.-C.; Li, K.-M. Optimization of micromilling microchannels on a polycarbonate substrate. Int. J. Precis. Eng. Manuf. 2014, 15, 149–154. [Google Scholar] [CrossRef]
  30. Samuel, J.; Devor, R.E.; Kapoor, S.G.; Hsia, K.J. Experimental Investigation of the Machinability of Polycarbonate Reinforced With Multiwalled Carbon Nanotubes. J. Manuf. Sci. Eng. 2005, 128, 465–473. [Google Scholar] [CrossRef]
  31. Dikshit, A.; Samuel, J.; Devor, R.E.; Kapoor, S.G. A Microstructure-Level Material Model for Simulating the Machining of Carbon Nanotube Reinforced Polymer Composites. J. Manuf. Sci. Eng. 2008, 130, 031110. [Google Scholar] [CrossRef]
  32. Childs, T.H.C. Surface energy, cutting edge radius and material flow stress size effects in continuous chip formation of metals. CIRP J. Manuf. Sci. Technol. 2010, 3, 27–39. [Google Scholar] [CrossRef]
  33. Vollertsen, F. Categories of size effects. Prod. Eng. 2008, 2, 377–383. [Google Scholar] [CrossRef]
  34. Schoop, J.; Ambrosy, F.; Zanger, F.; Schulze, V.; Balk, T.; Jawahir, I.S. Cryogenic machining of porous tungsten for enhanced surface integrity. J. Mater. Process. Technol. 2016, 229, 614–621. [Google Scholar] [CrossRef]
  35. Vollertsen, F.; Biermann, D.; Hansen, H.N.; Jawahir, I.; Kuzman, K. Size effects in manufacturing of metallic components. CIRP Ann. 2009, 58, 566–587. [Google Scholar] [CrossRef]
  36. Liu, K.; Melkote, S.N. Effect of plastic side flow on surface roughness in micro-turning process. Int. J. Mach. Tools Manuf. 2006, 46, 1778–1785. [Google Scholar] [CrossRef]
  37. Malekian, M.; Mostofa, M.; Park, S.S.; Jun, M. Modeling of minimum uncut chip thickness in micro machining of aluminum. J. Mater. Process. Technol. 2012, 212, 553–559. [Google Scholar] [CrossRef]
  38. Aramcharoen, A.; Mativenga, P. Size effect and tool geometry in micromilling of tool steel. Precis. Eng. 2009, 33, 402–407. [Google Scholar] [CrossRef]
  39. Denkena, B.; Koehler, J.; Rehe, M. Influence of the Honed Cutting Edge on Tool Wear and Surface Integrity in Slot Milling of 42CrMo4 Steel. Procedia CIRP 2012, 1, 190–195. [Google Scholar] [CrossRef] [Green Version]
Figure 1. The Haas Milling Machine used for running the experiments.
Jmmp 04 00059 g001
Figure 2. Schematic illustration of the difference between elastic material response (left/blue) and plastic sideflow (right/red), the latter of which is proposed to represent typical thermoplastic material response during machining.
Jmmp 04 00059 g002
Figure 3. Geometry of the uncut chip in turning, milling and grinding, including sideflow effects.
Jmmp 04 00059 g003
Figure 4. Surface profile and slot images for TiAlN at different feed rates: (a) Surface profile at 0.025 mm/rev feed rate. (b) Surface profile at 0.075 mm/rev feed-rate. (c) Surface profile at 0.10 mm/rev feed-rate. (d) Slot image at 0.025 mm/rev feed rate. (e) Slot image at 0.075 mm/rev feed rate. (f) Slot image at 0.10 mm/rev feed rate.
Jmmp 04 00059 g004aJmmp 04 00059 g004bJmmp 04 00059 g004cJmmp 04 00059 g004d
Figure 5. Plots of arithmetic mean surface roughness ( R a ) against feed-rates and depths of cut; (a) 0.025 mm/rev feed rate, (b) 0.10 mm/rev feed-rate, (c) 0.1 mm depth of cut, (d) 0.5 mm depth of cut.
Jmmp 04 00059 g005aJmmp 04 00059 g005b
Figure 6. Lateral edge roughness plots for three tool types.
Jmmp 04 00059 g006
Figure 7. Arithmetic mean surface roughness ( R a ) plots of experimental data for (a) Uncoated, (b) TiN-coated and (c) TiAlN-coated tools, including modeling of theoretical/kinematic roughness (black lines) and increased roughness, due to elastic springback (blue dashed lines) and the proposed plastic sideflow model (red dashed lines).
Jmmp 04 00059 g007
Figure 8. Burr formation plots across tools: (a) Uncoated Tool, (b) TiN-coated Tool, (c) TiAlN-coated Tool.
Jmmp 04 00059 g008aJmmp 04 00059 g008b
Table 1. Experimental conditions and machining parameters.
WorkpiecePolycarbonate
Size: 50.8 mm × 50.8 mm × 12.7 mm
Cutting toolWC/Co cemented carbide—6% Co
Uncoated, TiN-coated, TiAlN-coated
Dimension: 0.8 mm, 4 Flutes
Cutting fluid “Koolrite 2290” metalworking coolant
Spindle speed (rpm)7680
Feed rate (mm/rev)0.025, 0.05, 0.075 and 0.10
Depth of cut (mm)0.1, 0.2, 0.3, 0.5
Machining processFull-width slot milling
Table 2. Experimental matrix for each tool type (1/32 Uncoated, 1/32 TiN- and 1/32 TiAlN-coated carbide tool).
Experimental ConditionCutting Speed (rpm)Feed (mm/rev)Depth of Cut (mm)Repeats
176800.0250.13
276800.0250.23
376800.0250.33
476800.0250.53
576800.050.13
676800.050.23
776800.050.33
876800.050.53
976800.0750.13
1076800.0750.23
1176800.0750.33
1276800.0750.53
1376800.100.13
1476800.100.23
1576800.100.33
1676800.100.53
Total Experimental Trials (Samples):48
Table 3. Tool surface finish best performance summary.
Low Feed Rate (0.025 mm/rev)High Feed Rate (0.075 mm/rev)
Low depth of cut (0.1 mm)TiN-CoatedTiN Coated
High depth of cut (0.5 mm)TiN-CoatedTiN & TiAlN Coated
Table 4. Cutting edge radii and inversely determined h m i n values for three tool types.
Tool Type Cutting   Edge   Radius   r β     ( µ m ) Minimum   Chip   Thickness   h min     ( µ m ) h min   / r β   Rt (Edge)
Uncoated5.163.466%0.61 (σ = 0.065)
TiN (CVD)-Coated6.433.859%0.33 (σ = 0.047)
TiAlN (PVD)-Coated7.404.459%0.4 (σ = 0.113)
* CVD: Chemical Vapor Deposition, PVD: Physical Vapor Deposition, σ: measurement standard deviation.
Table 5. Burr heights for uncoated tool samples.
Depth of CutFeed Rates
0.025 mm/rev0.05 mm/rev0.075 mm/rev0.10 mm/rev
0.1 mm0.26 mm (σ = ±0.02)NNN
0.2 mm0.54 mm (σ = ±0.07)NNN
0.3 mm0.16 mm (σ = ±0.02)NNN
Table 6. Burr heights for TiAlN-coated tool samples.
Depth of CutFeed Rates
0.025 mm/rev0.05 mm/rev0.075 mm/rev0.10 mm/rev
0.1 mm0.54 mm (σ = ±0.11)0.52 mm (σ = ±0.02)0.55 mm (σ = ±0.03)0.39 mm (σ = ±0.12)
0.2 mm0.41 mm (σ = ±0.12)0.07 mm (σ = ±0.01)0.34 mm (σ = ±0.02)N
0.3 mm0.35 mm (σ = ±0.09)0.41 mm (σ = ±0.02)0.30 mm (σ = ±0.08)0.06 mm (σ = ±0.01)
Table 7. Burr heights for TiN-coated tool samples.
Depth of CutFeed Rates
0.025 mm/rev0.05 mm/rev0.075 mm/rev0.10 mm/rev
0.1 mm0.54 mm (σ = ±0.04)0.051 mm (σ = ±0.04)N-
0.2 mm0.24 mm (σ = ±0.06)0.15 mm (σ = ±0.10)0.41 mm (σ = ±0.02)-
0.3 mm0.22 mm (σ = ±0.05)0.10 mm (σ = ±0.05)0.09 mm (σ = ±0.04)-
* N: No burr present, σ = measurement standard deviation.

