How the Mix Factors Affect the Dynamic Modulus of Hot-Mix Asphalt

Department of Engineering Technology, Colorado State University, Pueblo, CO 81001, USA
*
Author to whom correspondence should be addressed.
J. Compos. Sci. 2019, 3(3), 72; https://0-doi-org.brum.beds.ac.uk/10.3390/jcs3030072
Submission received: 8 June 2019
/
Revised: 30 June 2019
/
Accepted: 2 July 2019
/
Published: 10 July 2019
Abstract
:Hot-mix asphalt (HMA) is a composite material consisting of stone-aggregates, sand, asphalt binder and additives. The properties of this combined material are dependent on the volumetric parameters used in the mix design. This study investigates the effects of volumetric mix factors on the dynamic moduli (E*) of eleven categories of HMAs. For each category of asphalt mixture, the variations in dynamic modulus for different contractors, binder types, effective binder content (Vbe), air void (Va), voids-in-mineral aggregates (VMA), voids-filled-with asphalt (VFA) and asphalt content (AC) are assessed statistically. Results show that the S(100) mixture (nominal size of 19 mm, 100 gyrations) with the Performance Grade (PG) binder of PG 64-22 has the highest value of E* at low temperature or high reduced frequency. At high temperature or lower reduced frequency, S(100) PG 76-28 has the highest E* value. The SX(75) mixture (nominal size of 12.5 mm, 75 gyrations) with the binder of PG 64-28 has the lowest E* value at high temperature or lower reduced frequency. At low temperature or high reduced frequency, SX(75) PG 58-34 has the lowest E* value. The Stone Mix Asphalt (SMA) mix has a lower E* compared to S(100) and SX(100) mixes ((nominal size of 12.5 mm, 100 gyrations) with the Performance Grade (PG) binder of) at low temperature. The E* increases with an increase in Vbe, Va, and VFA, and decreases with an increase in VMA and AC. The E* of a mix can vary from 200 ksi (1380 MPa) to about 1000 ksi (6900 MPa) for a particular frequency (10 Hz) and temperature (21.1 °C), even if samples are from the same contractor.
1. Introduction
Hot-Mix Asphalt (HMA) is a viscoelastic composite material consisting of stone-aggregates, sand, viscous asphalt binder and additives. Dynamic modulus is the primary material property used in the mechanistic-empirical pavement design procedure. The dynamic modulus defines the stress–strain relationship of linear viscoelastic materials like HMA under a continuous sinusoidal loading. Mathematically, it is the ratio of the applied peak dynamic stress (σo) to the peak recoverable axial strain (εo) and can be expressed as follows:
where |E*| is the dynamic modulus, σo is the peak dynamic stress and εo is the peak recoverable axial strain.
The |E*| of HMA depends on many mix factors: aggregate, binder, air voids, specimen size, etc. Many researchers developed empirical based |E*| models to address these factors and to predict the dynamic modulus of HMA [1,2,3,4,5,6,7,8,9,10]. These models try to predict the |E*| values using the aggregate gradation, viscosity, shear modulus, etc. However, using these models, it is too difficult to identify the sensitivity of |E*| for different mix factors. In fact, not all the volumetric mix factors are included in these models. Several studies tried to find out the effects of different mix factors on the |E*| values. For example, Robinette and Williams [11] examined the effects of sawing or coring on the dynamic modulus of asphalt concrete and concluded that the two factors do not affect the dynamic modulus significantly. Tandon et al. [12] evaluated the effect of height-to-diameter ratio on the dynamic modulus of asphalt concrete and found that specimens with a diameter of 152 mm instead of the standard 102 mm provided more consistent results. Shah et al. [13] measured the dynamic modulus on eleven mixes and reported that it was sensitive to binder content.
However, none of the studies investigated the sensitivity of |E*| to different mix factors such as voids in mineral aggregates (VMA), void-filled with asphalt (VFA), effective binder content (Vbe), contractors, mix gradation, and binder types at a time to have a comprehensive understanding. This study is thus motivated to study these factors at a time. Therefore, the main objectives of this research are:
1. To analyze the effects of VMA, VFA, Vbe, AC, contractors, mix gradation, and binder types on the E* of asphalt concrete.
2. To determine the most economic and durable Hot-Mix Asphalt (HMA) mixtures for high temperature for pavement design based on the E* comparison.
Asphalt content (AC) is the percent of the total amount of asphalt binder used in the mix with respect to the total mix by weight. Air void (Va) is the percent of total volume of air in the mix compared to the bulk volume of the compacted mixture. The intergranular space occupied by asphalt and air in a compacted asphalt mixture is known as VMA. The VFA is the percentage of voids in the compacted aggregate mass that are filled with asphalt cement. The total asphalt binder content of the mix that is coated on the aggregate surface (deducting any absorbed binder) is called the effective asphalt content (Vbe).
2. Materials
Eleven different types of asphalt mixes were studied in this research. These are listed in Table 1. Two different nominal maximum aggregate sizes (NMASs) of 0.75 in. (19 mm) and 0.50 in. (12.5 mm) of aggregates and two different numbers of gyrations (100 and 75) were used in the mix design. Different types of performance grade (PG) binders were used. The abbreviations used to represent the mixes are listed below:
- The letter ‘S’ means the NMAS of 0.75 in. (19 mm).
- The letter ‘SX’ means the NMAS of 0.5 in. (12.5 mm).
- The numbers in the parenthesis such as 75 and 100 are the numbers of gyrations used in the mix design.
- The first numbers in the PG binder such as 58 and 64, are the average seven-day maximum pavement temperature (°C)
- The second numbers in the PG binder such as −22 or −28 are the minimum pavement design temperature likely to be experienced (°C).
Thus, a S(100) PG 64-22 means a mix with the NMAS of 0.75 in. (19 mm) and a binder of PG 64-22 meaning the average seven-day maximum pavement temperature is 64 °C and the expected minimum pavement temperature is −22 °C.
All the specimens are collected from real field coring. The mixtures were produced by the contractors in their plants.
3. Dynamic Modulus (E*) Testing
The E* testing on collected real field cores is conducted by CDOT’s Asphalt Material Unit using AASHTO TP 62 [14] test protocol and the Asphalt Mixture Performance Tester (AMPT) testing device. The diameter of the cores collected from the sites is 150 mm. The 50-mm diameter and 110-mm in height cores were cut horizontally out of the collected field cores. According to the AASHTO TP 62 procedure, samples of 4-in. (100-mm) diameter and 6-in. (150-mm) height are prepared in the laboratory or field cores are collected. Then, using the AMPT testing device, sinusoidal compression loading is applied uniaxially at three different temperatures of 4 °C, 20 °C, and 40 °C. The testing frequencies are 0.1 Hz, 1 Hz, and 10 Hz at each temperature with the exception that another (4th) frequency of 0.01 Hz is adopted for 40 °C.
4. Analysis of the Effects of Mix Factors on the Dynamic Modulus
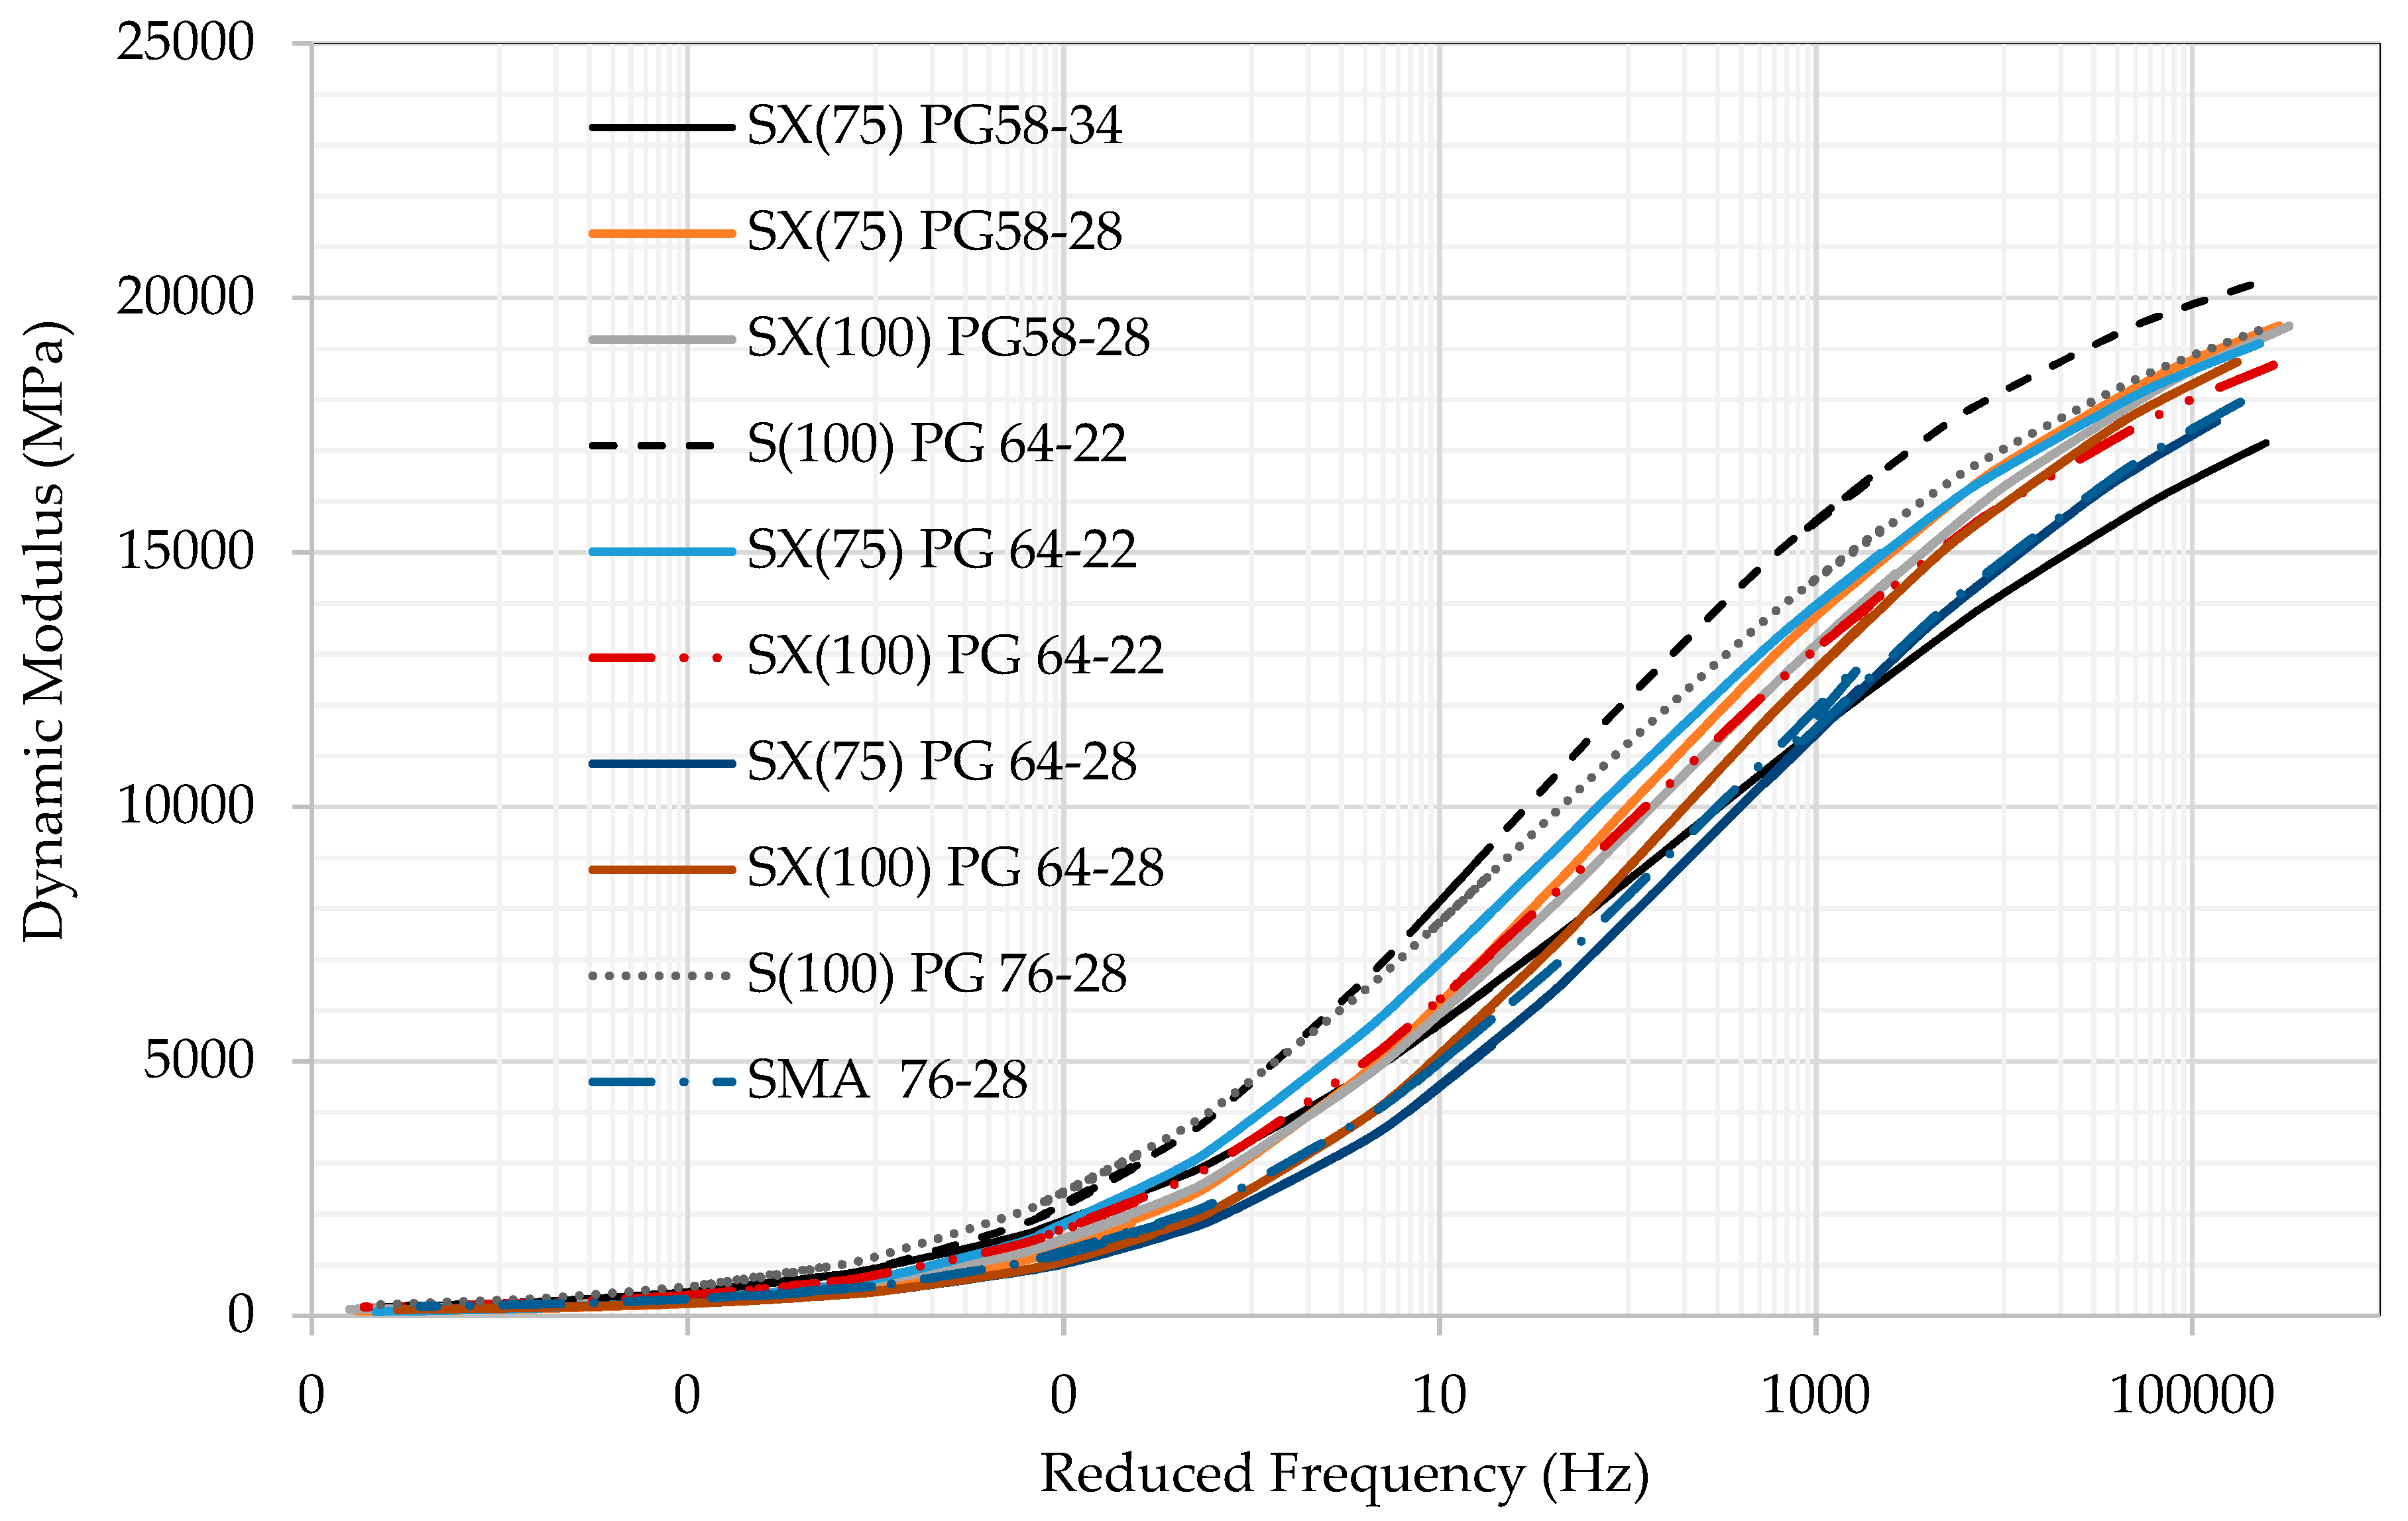
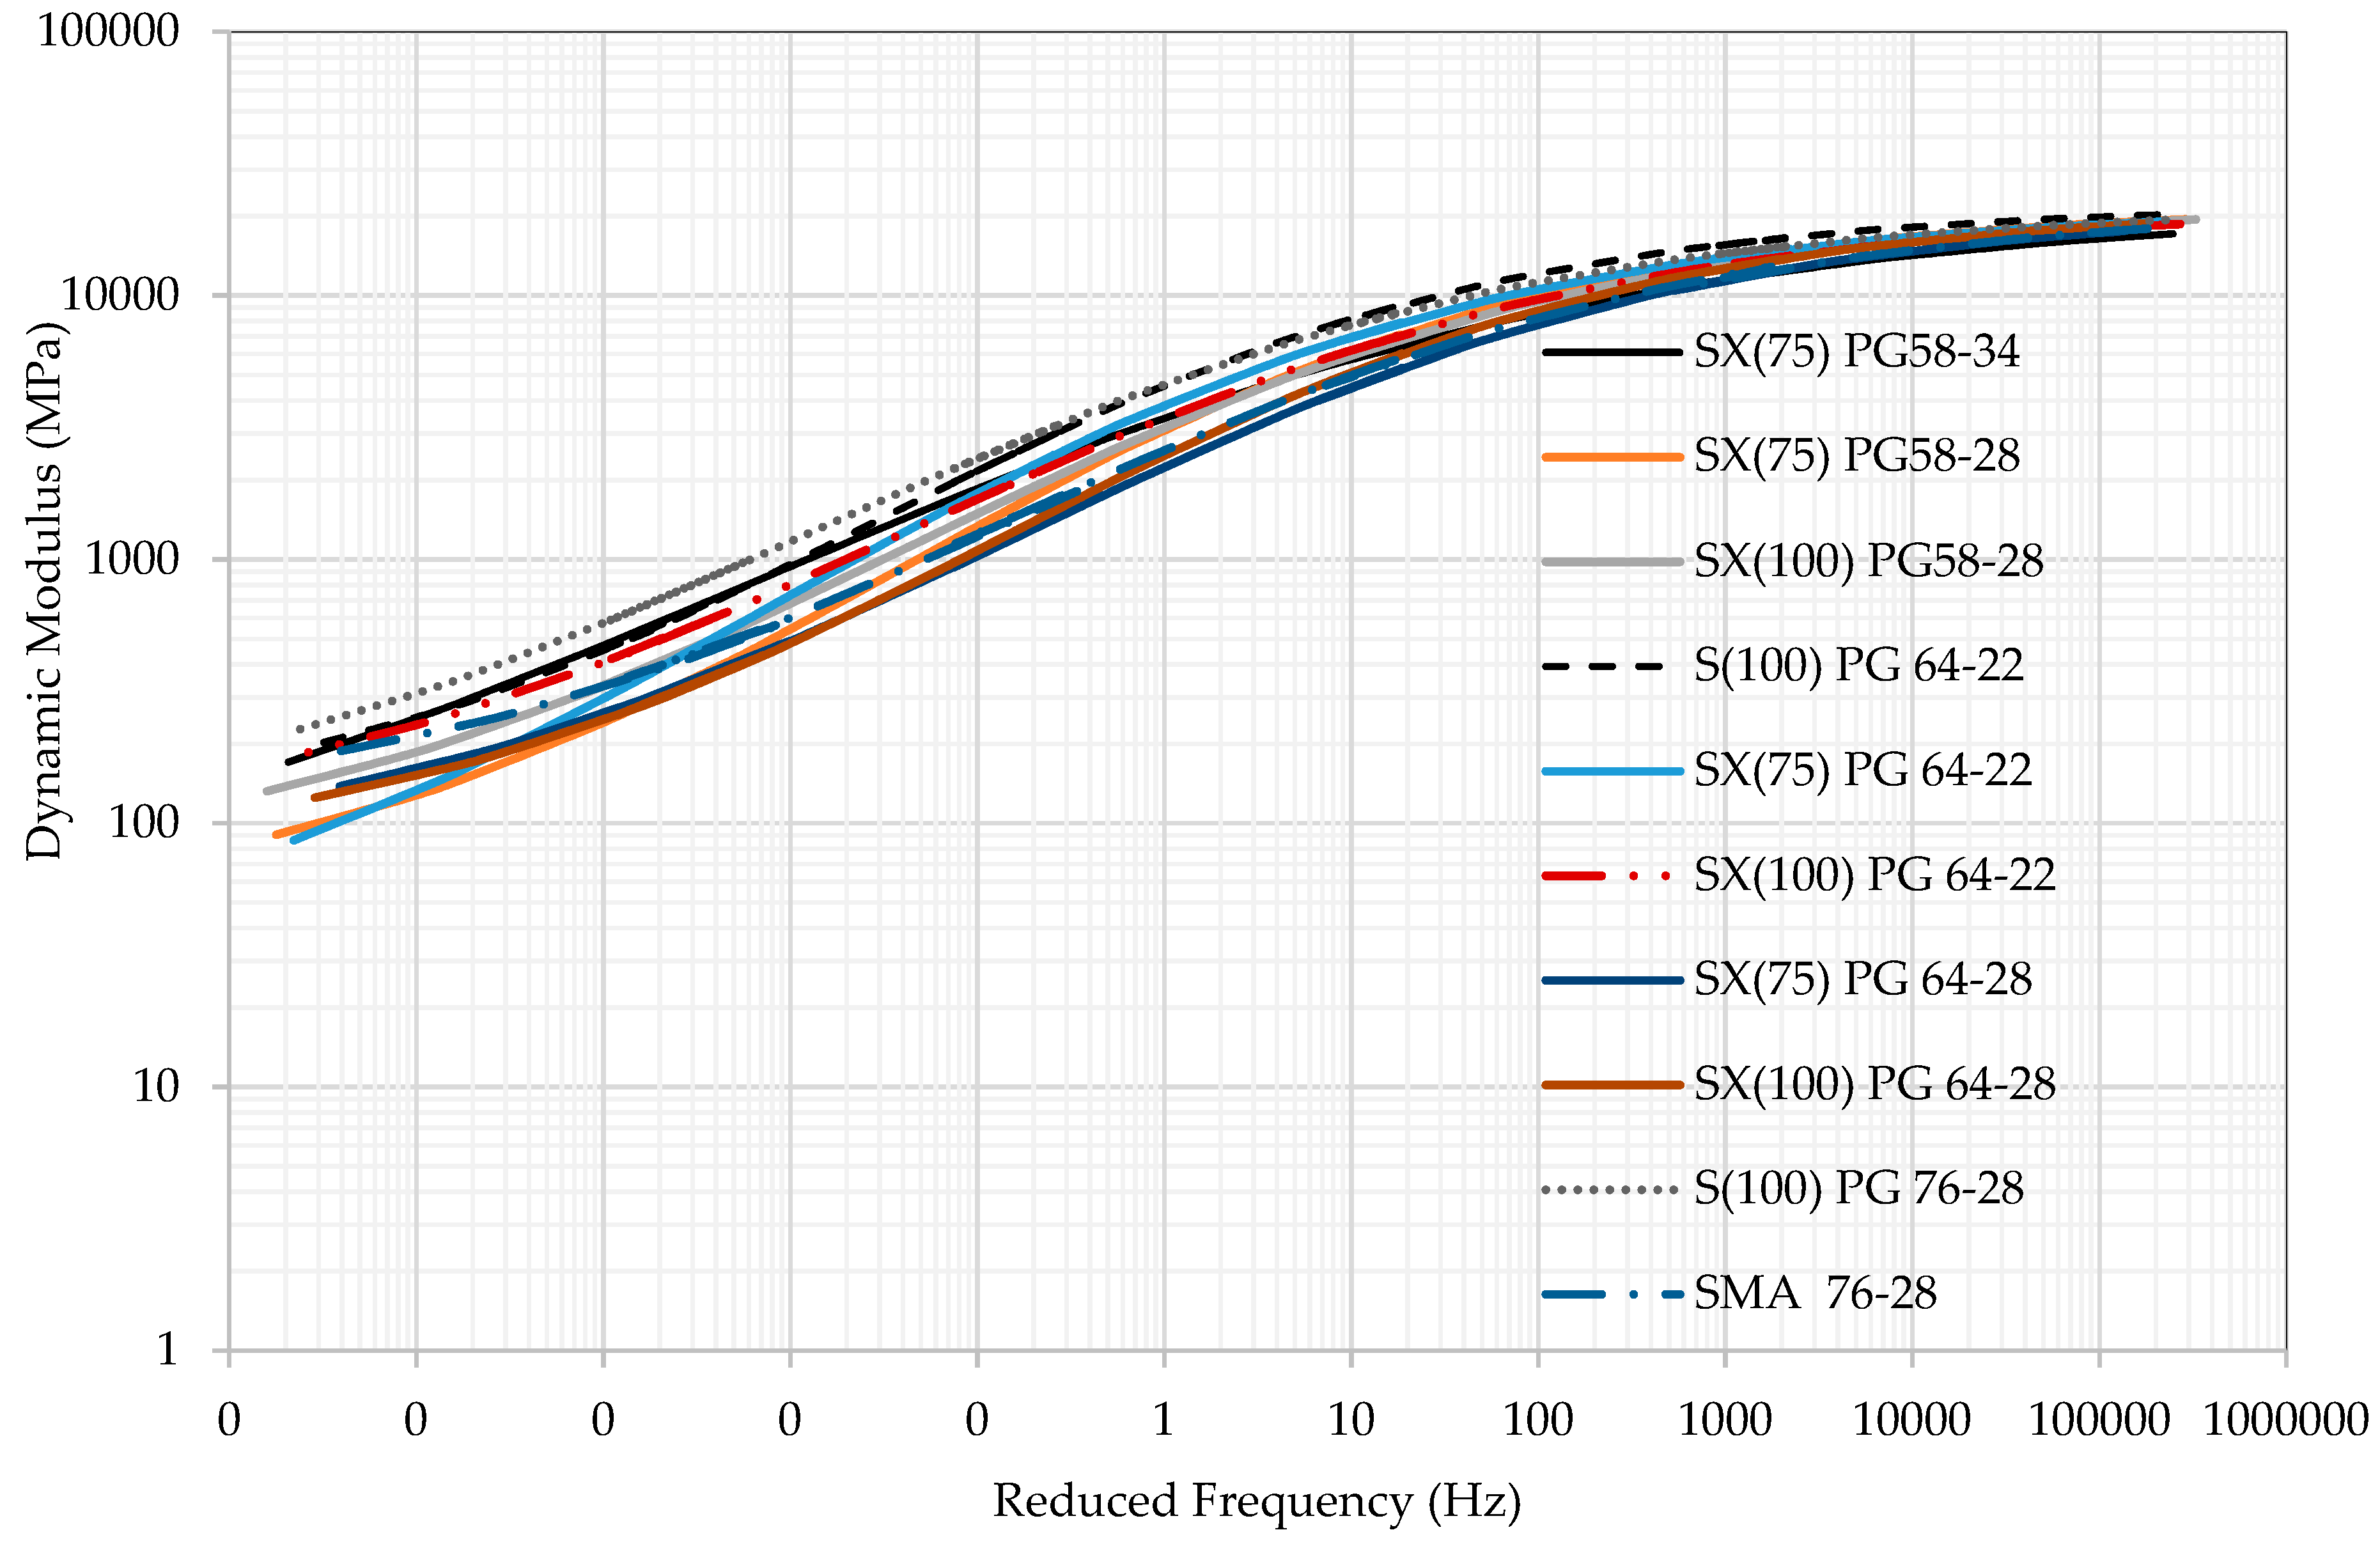
Rutting is caused during hot seasons. At high temperature, asphalt becomes soft and its modulus decreases. Then, asphalt material deforms easily after applying load. Therefore, a mixture is very susceptible to rutting if it has less modulus at high temperature and vice-versa. Bottom-up or top-down fatigue cracking is dependent not only on the modulus but also other parameters. To find out which mix is good for rutting and transverse cracking, a group-wise comparison is made here. The average of the fitted parameters from each group has been chosen and plotted together as shown in Figure 1 and Figure 2 to compare among the groups. More clearly, the model was applied separately on each specimen and then the means of the model parameters were calculated. The model used is MasterSolver to determine the master curve of a dynamic modulus using the following equation:
where:
- = dynamic modulus
- ωr = reduced frequency, Hz
- Max = limiting maximum modulus, ksi
- Min = limiting minimum modulus, ksi
- β and γ = fitting parameters
The reduced frequency is computed using the Arrhenius equation given below:
where:
- ωr = reduced frequency at the reference temperature
- ω = loading frequency at the test temperature
- Tr = reference temperature, K
- T = test temperature, K
- ∆Ea = activation energy (treated as a fitting parameter)
The combination of the above two equations gives the following:
The shift factors for each temperature are given by the following equation:
where:
- a(T) = shift factor at temperature T
The maximum limiting modulus is estimated from mixture volumetric properties using the Hrisch model shown below, and a limiting binder modulus of 1 GPa:
where:
- limiting maximum dynamic modulus, psi
- VMA = voids in mineral aggregates, %
- VFA = voids filled with asphalt, %
The model was applied separately to each specimen and then the means of the model parameters were calculated and plotted in Figure 1 and Figure 2.
Figure 1 and Figure 2 show that the E* value varies greatly amongst the different binders. For example, at 10 Hz of loading, the E* of SX(75) PG 64-28 mix is about 600 ksi (4150 MPa), whereas the S(100) PG 64-22 mix has a value of 1200 ksi (8300 MPa) (an increase of 100%). It is also apparent that the S(100) PG 64-22 mixture has the highest value of E*, especially at low temperature or high reduced frequency. Thus, the S(100) PG 64-22 mix has the greatest potential for the transverse cracking. At high temperature or lower reduced frequency, the S(100) PG 76-28 mix has the highest E* value and is the best mix for minimal rutting. The SX(75) PG 64-28 mix has the lowest E* value at high temperature or lower reduced frequency. At low temperature or high reduced frequency, the SX(75) PG 58-34 mix has the lowest E* value. The average fitted SMA mix has a lower E* value compared to the S(100) and SX(100) mixes at low temperature, and thus, would likely have lower predicted transverse cracking than S(100) and SX(100) mixes. A summary of the analysis’ finding for the most durable and worst mixes for rutting is presented in Table 2.
Transverse cracking is caused during winter seasons. At low temperature, asphalt contracts due to decrease in temperature. Then, thermal stress is developed. If the developed thermal stress exceeds the capacity of the mix, transverse cracking occurs. Therefore, it is expected that a mixture is very susceptible to transverse cracking if it has high modulus at low temperature and vice-versa. In this study, the S(100) PG 64-22 mixture has the highest value of E*, especially at low temperature or high reduced frequency. Thus, the S(100) PG 64-22 mix is expected to have the greatest potential for showing the transverse cracking. On the other hand, at low temperature or high reduced frequency, the SX(75) PG 58-34 mix has the lowest E* value and thus the mix is expected to be the best against the transverse cracking. However, Bodley et al. [15] clearly showed that there is no correlation between the dynamic modulus data and the field cracking performance in cold climates. Therefore, the effect of dynamic modulus on the transverse cracking cannot be concluded from this study; a future study is recommended to clarify this controversy.
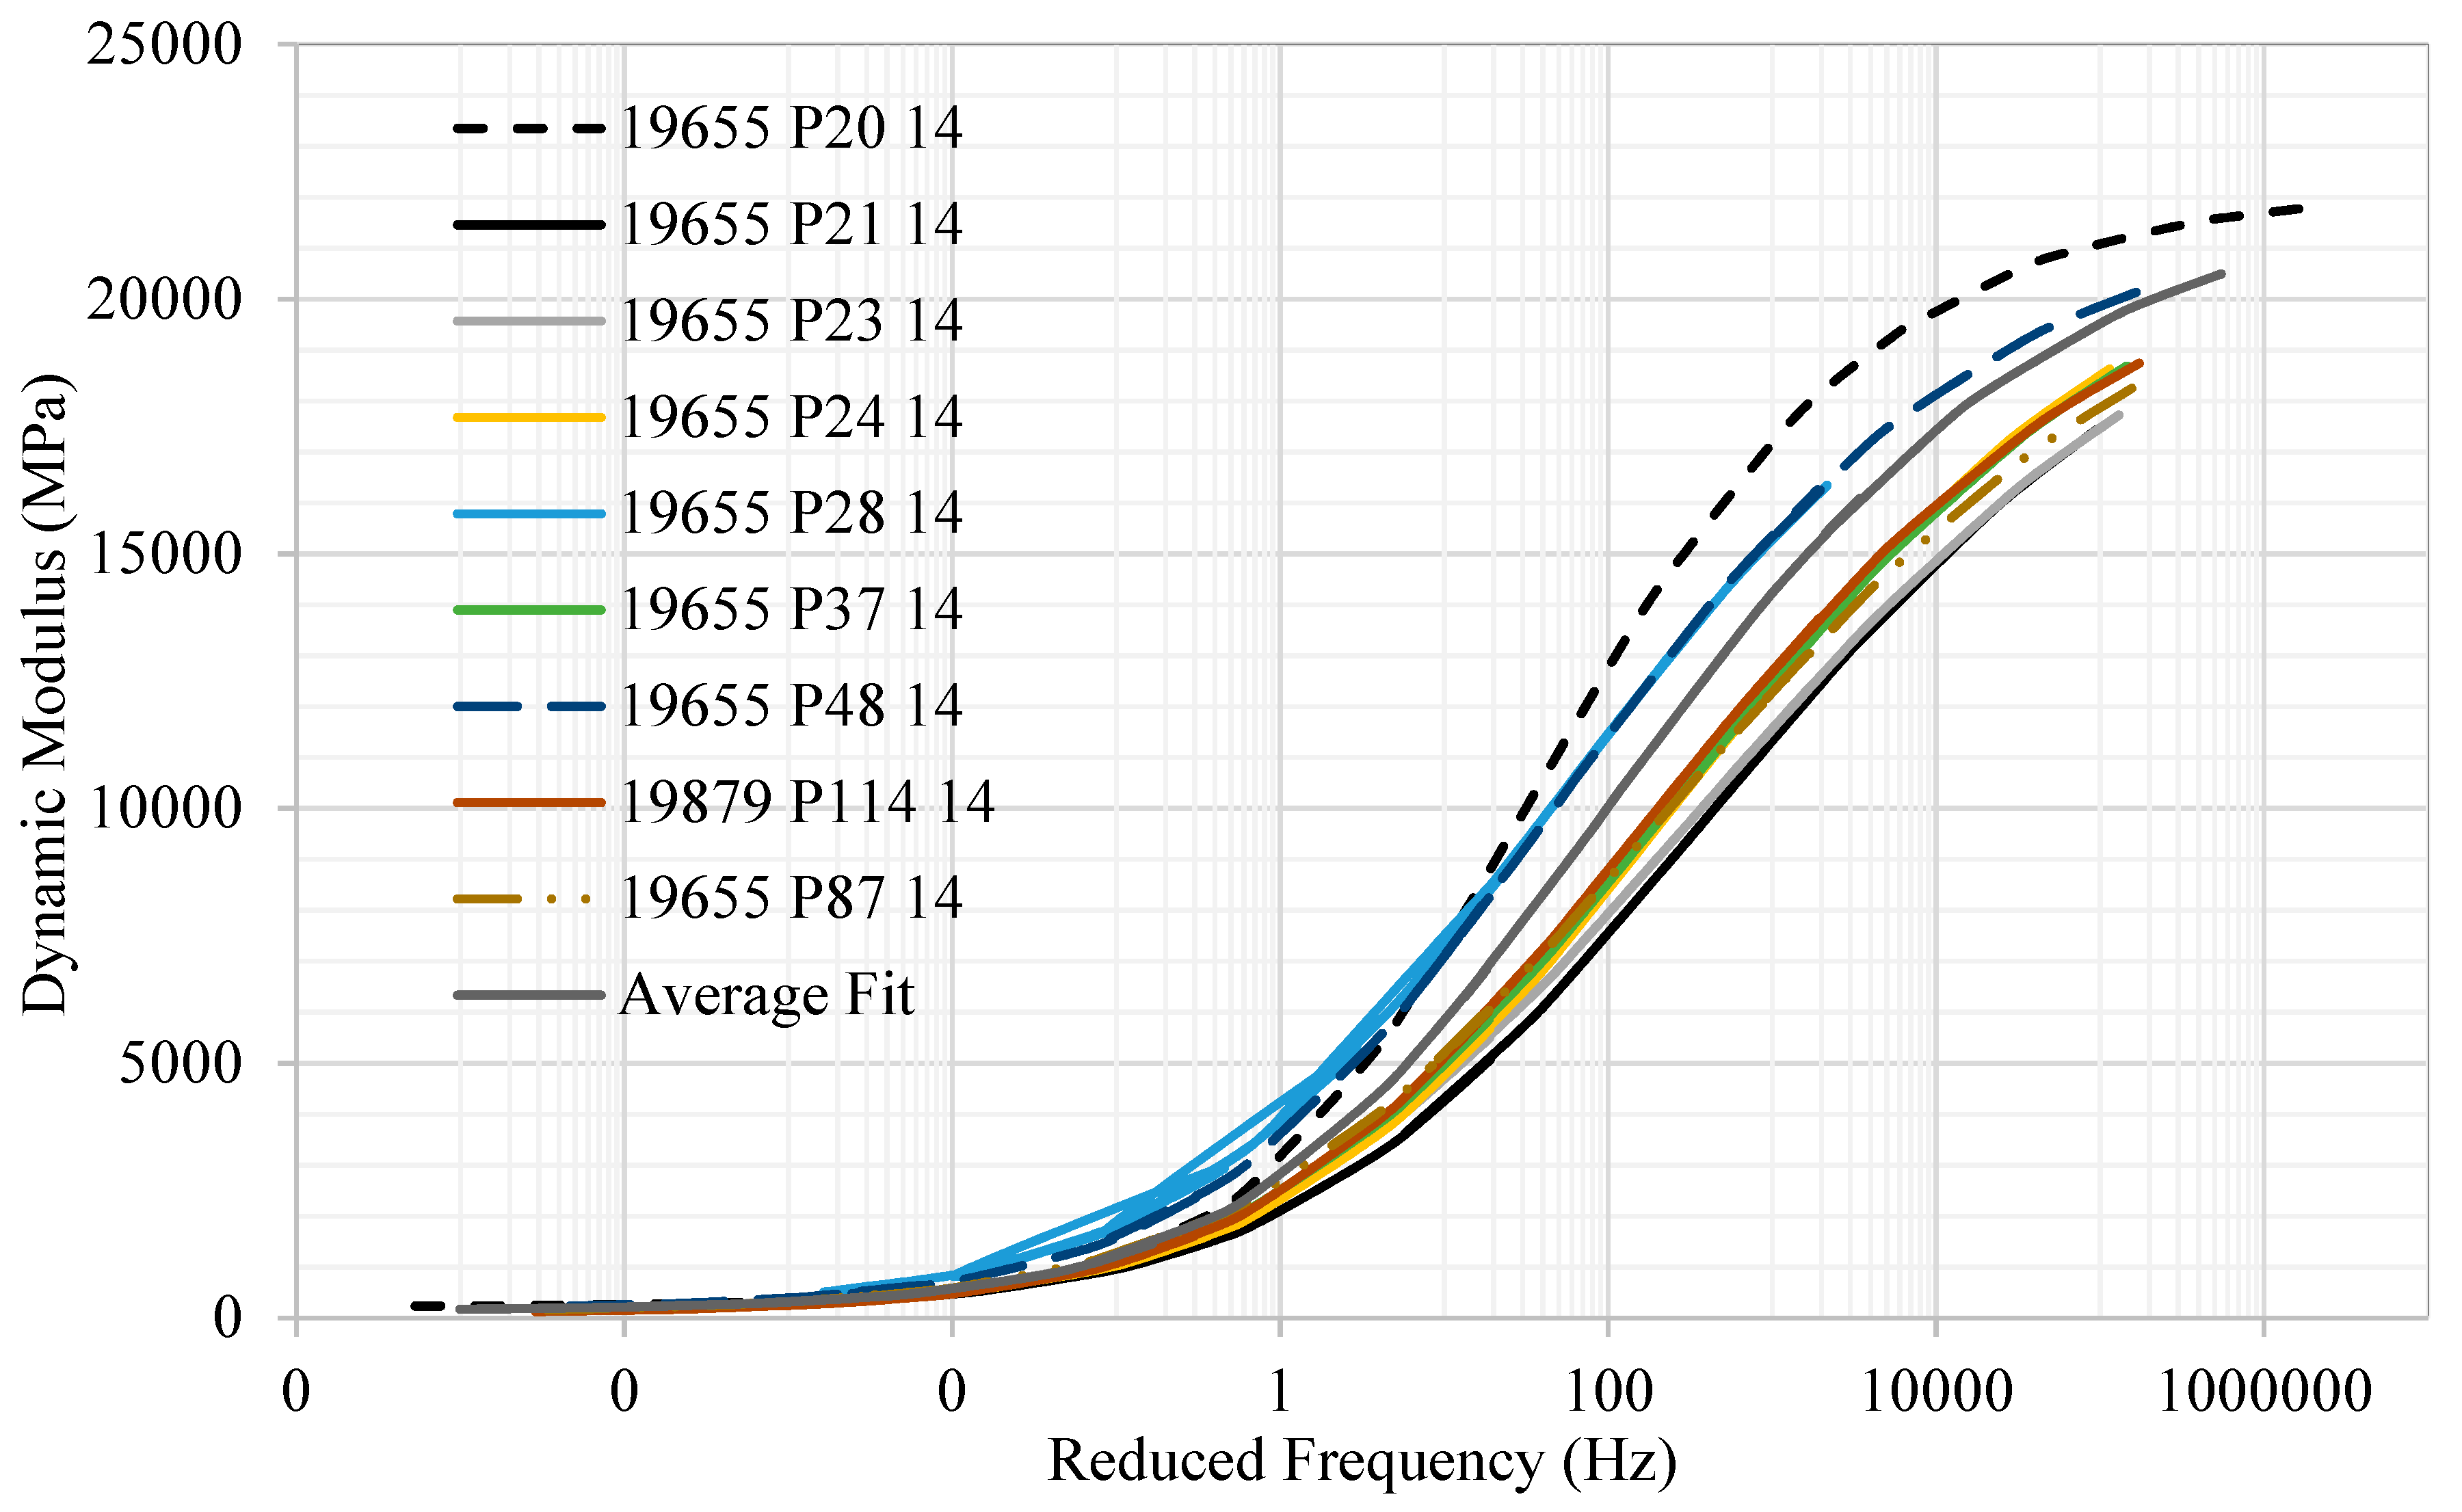
In the next step of the analysis, the effect of individual mix factor has been investigated. As an example, the analysis for a single mix is presented here. A similar procedure has been followed for other mixes. The dynamic modulus of the SX(100) PG 64-28 mix is presented in Figure 3. The dynamic modulus values can differ by more than 5500 MPa (800 ksi) from specimen to specimen as shown in Figure 3, except for tests conducted at high temperature or low frequency of loading. Note that both the extreme moduli data (19655 P2014, and 19655 P2114) are produced from mixes manufactured by the same contractor. In fact, all the specimens of this group are cored from the field but the mix was originally produced at the same contractor’s plant using the same binder source and the same aggregate pit. Note that the first numbers of the specimen, such as 19655, 19879, etc., are the contractors’ number and those with the letter P, such as P20 14, P21 14, etc., are the specimen numbers.
Statistical t-test was conducted to determine whether the dynamic moduli are statistically different or not. The null hypothesis is that the data are statistically equal. The obtained p-values show that the highlighted mixes in Table 3 produce statistically the same dynamic modulus as each other. It can also be seen that mixes produced by the same contractor have statistically different dynamic moduli. For example, see the contractor number, 19655. The specimens collected from this contractor are P2014, P21 14, P23 14, P24 14, P28 14, P37 14, P48 14 and P87 14. However, the dynamic moduli of P23 14, P24 14, P37 14 and P87 14 are statistically equal. The other specimens, P2014, P21 14, P28 14 and P48 14, have statistically different dynamic moduli. The volumetric information of the SX(100) PG 64-28 mix is listed in Table 3 to compare the mix factors.
A regression analysis was conducted to determine the influence of Vbe, Va, VMA, VFA, and AC, on E*. The E* in ksi at 10 Hz of loading at 20 °C was used as the dependent variable and the following correlation was obtained with the R2 of 0.74. The regression equation below shows that the E* increases with an increase in Vbe and Va, and decreases with an increase in VMA, VFA and AC.
E* = 1681.9 + 31.82 Vbe + 149.8 Va − 63.4 VMA − 16 VFA − 35.7 AC
This analysis procedure is followed to analyze all the eleven mixes. The sensitivity analysis summary from the analysis of the all eleven types of mixes presented in Table 4 shows that the effects of Vbe, Va, VMA, VFA, and AC on the E* are inconsistent. For example, five mixes show that the E* increases with Vbe, three mixes show the opposite, and three mixes show it is insensitive to Vbe. This inconsistency is true for Va, VMA, VFA, and AC as well. The reason behind this may be the effects of paving contractor, manufacture date, and/or aggregate source. Using the most scores, the E* increases with an increase in Vbe, Va, and VFA, and decreases with an increase in VMA and AC. However, the effects of VFA and AC on E* are less sensitive compared to Vbe, Va, and VFA.
5. Conclusions
This study evaluates the effects of mix factors such as VMA, VFA, effective binder content, contractors, etc., on the E* of asphalt concrete. Laboratory testing was performed, and test results were analyzed using the statistical tools. It was found that S(100) PG 76-28 is the most durable mix for rutting, and SX(75) PG 64-28 is the most susceptible mix for rutting based on the E* value. The dynamic modulus of an HMA mix can differ by 200 ksi (1380 MPa) to about 1000 ksi (6900 MPa) for a particular frequency and temperature. The E* increases with an increase in Vbe, Va, and VFA, and decreases with an increase in VMA and AC. However, the effects of VFA and AC on E* are less sensitive compared to Vbe, Va, and VFA. The results of this study are obtained studying the common mixtures used in Colorado, USA. As asphalt materials and pavement performance vary greatly from region to region for different local factors, local study is always recommended. All the results are valid for the study ranges used in this study.
Author Contributions
M.R.I. is the primary investigator of the research. He is the lead researcher with collecting the research ideas, pursuing funding, execution, delivery and publication. S.A.K. supervised all aspects of the research including editing the article. G.M. helped in proofreading the article.
Funding
This research is funded by the Colorado Department of Transportation (CDOT), Grant No. CDOT 417.01.
Acknowledgments
The Colorado State University—Pueblo (CSU-Pueblo) research team appreciates the research funding by the Colorado Department of Transportation (CDOT). It would like to express its sincere gratitude and appreciation to Jay Goldbaum, Michael Stanford, Aziz Khan, Melody Perkins, Keith Uren, Vincent Battista, Skip Outcalt, Bill Schiebel, and Roberto DeDios from the CDOT. The help of Shelby K. Nesselhauf to analyze and proofread the works is also appreciated.
Conflicts of Interest
The authors declare no conflict of interest.
References
- Christensen, D.W.; Pellinen, T.K.; Bonaquist, R.F. Hirsch Model for Estimating the Modulus of Asphalt Concrete. J. Assoc. Asph. Paving Technol. 2003, 72, 97–121. [Google Scholar]
- Mohammad, L.N.; Wu, Z.; Myers, L.; Cooper, S.; Abadie, C. A Practical Look at Simple Performance Tests: Louisiana’s Experience. J. Assoc. Asph. Paving Technol. 2005, 74, 557–600. [Google Scholar]
- Ceylan, H.; Schwartz, C.; Kim, S.; Gopalakrishnan, K. Accuracy of Predictive Models for Dynamic Modulus of Hot-Mix Asphalt. J. Mater. Civ. Eng. 2009, 21, 286–293. [Google Scholar] [CrossRef] [Green Version]
- Birgisson, B.; Sholar, G.; Roque, R. Evaluation of Predicted Dynamic Modulus for Florida Mixtures. In Proceedings of the 84th Annual Meeting of the Transportation Research Board, Paper No. 05-1309, Washington, DC, USA, 9–13 January 2005. [Google Scholar]
- Sakhaeifar, M.; Kim, Y.; Kabir, P. New predictive models for the dynamic modulus of hot mix asphalt. Constr. Build. Mater. 2015, 76, 221–231. [Google Scholar] [CrossRef]
- Kim, Y.R.; King, M.; Momen, M. Typical Dynamic Moduli Values of Hot Mix Asphalt in North Carolina and Their Prediction. In Proceedings of the 84th Annual Meeting of the Transportation Research Board, Paper No. 05-2568, Washington, DC, USA, 9–13 January 2005. [Google Scholar]
- Hu, H.; Shen, S. An Investigation of Dynamic Modulus and Flow Number Properties of Asphalt Mixtures in Washington State; Final Report, No. 709867, USDOT; Office of the Secretary of Transportation: Washington, DC, USA, 2012.
- Clyne, T.R.; Li, X.; Marasteanu, M.O.; Skok, E.L. Dynamic and Resilient Modulus of Mn/DOT Asphalt Mixtures; Report No. MN/ RC-2003-09; Minnesota Department of Transportation: St. Paul, MN, USA, 2003.
- Tran, N.H.; Hall, K.D. Evaluating the Predictive Equation in Determining Dynamic Moduli of Typical Asphalt Mixtures Used in Arkansas. J. Assoc. Asph. Paving Technol. 2005, 74, 1–17. [Google Scholar]
- Rahman, A.; Islam, M.R.; Tarefder, R.A. Modifying the Viscosity Based Witczak Model and Developing Phase Angle Predictive Model for New Mexico’s Superpave Mixes. In Proceedings of the Transportation Research Board (TRB) 95th Annual Meeting, Arehington, DC, USA, 10–14 January 2016. Paper ID. 16-3180. [Google Scholar]
- Robinette, C.; Williams, R.C. The Effects of the Testing History and Preparation Method on the Superpave Simple Performance Test. J. Assoc. Asph. Paving Technol. 2006, 75, 297–317. [Google Scholar]
- Tandon, V.; Bai, X.; Nazarian, S. Impact of Specimen Geometry on Dynamic Modulus Measurement Test Setup. J. Mater. Civ. Eng. 2006, 18, 477–484. [Google Scholar] [CrossRef]
- Shah, A.; McDaniel, R.; Gallivan, V. Evaluation of Mixtures using Dynamic Modulus Tester: Results and Practical Considerations. J. Assoc. Asph. Paving Technol. 2005, 74, 1–21. [Google Scholar]
- AASHTO TP 62. Standard Method of Test for Determining Dynamic Modulus of Hot Mix Asphalt (HMA); American Association of State Highway and Transportation Officials (AASHTO): Washington, DC, USA, 2007; pp. 1–21. [Google Scholar]
- Bodley, T.; Andriescu, A.; Hesp, S.; Tam, K. Comparison between Binder and Hot Mix Asphalt Properties and Early Top-Down Wheel Path Cracking in a Northern Ontario Pavement Trial. J. Assoc. Asph. Paving Technol. 2007, 76, 345. [Google Scholar]
Figure 1.
Groupwise comparison in a semi-log graph.

Figure 2.
Groupwise comparison in a log–log graph.

Figure 3.
Dynamic modulus of the SX(100) PG 64-28 mix.


Table 1.
Eleven mixtures used in this study.
| Mix ID | NMAS, in. (mm) | Binder | Number of Gyrations |
|---|---|---|---|
| S(100) PG 64-22 | 0.75 (19) | PG 64-22 | 100 |
| S(100) PG 76-28 | 0.75 (19) | PG 76-28 | 100 |
| SMA PG 76-28 | 0.50 (12.5) | PG 76-28 | 100 |
| SX(75) PG 58-28 | 0.50 (12.5) | PG 58-28 | 75 |
| SX(75) PG 58-34 | 0.50 (12.5) | PG 58-34 | 75 |
| SX(75) PG 64-22 | 0.50 (12.5) | PG 64-22 | 75 |
| SX(75) PG 64-28 | 0.50 (12.5) | PG 64-28 | 75 |
| SX(100) PG 58-28 | 0.50 (12.5) | PG 58-28 | 100 |
| SX(100) PG 64-22 | 0.50 (12.5) | PG 64-22 | 100 |
| SX(100) PG 64-28 | 0.50 (12.5) | PG 64-28 | 100 |
| SX(100) PG 76-28 | 0.50 (12.5) | PG 76-28 | 100 |
Table 2.
Summary of the most durable and worst mixes for rutting.
| Mix Type | Property | Comments |
|---|---|---|
| S(100) PG 76-28 | Highest at high temperature | Best mix for rutting |
| SX(75) PG 64-28 | Lowest at high temperature | Worst for rutting |
Table 3.
Volumetric information of the SX(100) PG 64-28 mix.
| Specimen No. | Vbe (%) | Va (%) | VMA (%) | VFA (%) | AC (%) |
|---|---|---|---|---|---|
| 19655 P20 14 | 10.59 | 6.06 | 17.0 | 64.0 | 5.58 |
| 19655 P21 14 | 10.85 | 6.06 | 17.1 | 63.5 | 5.80 |
| 19655 P23 14 | 10.56 | 6.06 | 16.7 | 65.1 | 5.70 |
| 19655 P24 14 | 10.97 | 6.06 | 16.0 | 64.2 | 5.78 |
| 19655 P28 14 | 10.71 | 6.06 | 16.1 | 63.0 | 5.61 |
| 19655 P37 14 | 10.48 | 6.06 | 15.8 | 62.4 | 5.65 |
| 19655 P48 14 | 13.18 | 6.60 | 17.4 | 62.0 | 5.50 |
| 19655 P87 14 | 13.18 | 6.30 | 17.1 | 63.2 | 5.50 |
| 19879 P114 14 | 10.05 | 6.90 | 17.5 | 63.5 | 4.90 |
Note: The highlighted mixes produce statistically the same dynamic modulus as each other.
Table 4.
Summary of the mix factors on the dynamic modulus of hot-mix asphalt (HMA).
| Mix ID | Vbe (%) | Va (%) | VMA (%) | VFA (%) | AC (%) |
|---|---|---|---|---|---|
| S(100) PG 64-22 | Decreases | Increases | Decreases | Increases | Decreases |
| S(100) PG 76-28 | -- | Increases | Decreases | Decreases | -- |
| SMA PG 76-28 | Decreases | Increases | Increases | Increases | Increases |
| SX(75) PG 58-28 | Increases | Decreases | Decreases | Increases | Increases |
| SX(75) PG 58-34 | NA | NA | NA | NA | NA |
| SX(75) PG 64-22 | Increases | Decreases | Increases | Decreases | Increases |
| SX(75) PG 64-28 | Increases | Decreases | -- | Increases | -- |
| SX(100) PG 58-28 | NA | NA | NA | NA | NA |
| SX(100) PG 64-22 | Increases | Increases | Decreases | Decreases | Decreases |
| SX(100) PG 64-28 | Increases | Increases | Decreases | Decreases | Decreases |
| SX(100) PG 76-28 | Decreases | Increases | Decreases | Increases | Decreases |
| Summary | 5 Increases 3 Decreases 1 Insensitive | 6 Increases 3 Decreases | 2 Increases 6 Decreases 1 Insensitive | 5 Increases 4 Decreases | 3 Increases 4 Decreases 2 Insensitive |
© 2019 by the authors. Licensee MDPI, Basel, Switzerland. This article is an open access article distributed under the terms and conditions of the Creative Commons Attribution (CC BY) license (http://creativecommons.org/licenses/by/4.0/).
Share and Cite
MDPI and ACS Style
Islam, M.R.; Kalevela, S.A.; Mendel, G. How the Mix Factors Affect the Dynamic Modulus of Hot-Mix Asphalt. J. Compos. Sci. 2019, 3, 72. https://0-doi-org.brum.beds.ac.uk/10.3390/jcs3030072
AMA Style
Islam MR, Kalevela SA, Mendel G. How the Mix Factors Affect the Dynamic Modulus of Hot-Mix Asphalt. Journal of Composites Science. 2019; 3(3):72. https://0-doi-org.brum.beds.ac.uk/10.3390/jcs3030072
Chicago/Turabian StyleIslam, Md Rashadul, Sylvester A. Kalevela, and Guy Mendel. 2019. "How the Mix Factors Affect the Dynamic Modulus of Hot-Mix Asphalt" Journal of Composites Science 3, no. 3: 72. https://0-doi-org.brum.beds.ac.uk/10.3390/jcs3030072