
Effects of Resin/Filler Adhesion on the Thermal and Electrical Conductivity of Polyimide Nanocomposites


Research Institute for Materials Science and Technology, Waseda University, 2-8-26 Nishiwaseda, Shinjuku-ku, Tokyo 169-0051, Japan
*
Author to whom correspondence should be addressed.
J. Compos. Sci. 2021, 5(10), 272; https://0-doi-org.brum.beds.ac.uk/10.3390/jcs5100272
Submission received: 10 September 2021
/
Revised: 30 September 2021
/
Accepted: 4 October 2021
/
Published: 14 October 2021
(This article belongs to the Special Issue Feature Papers in Journal of Composites Science in 2021)
Abstract
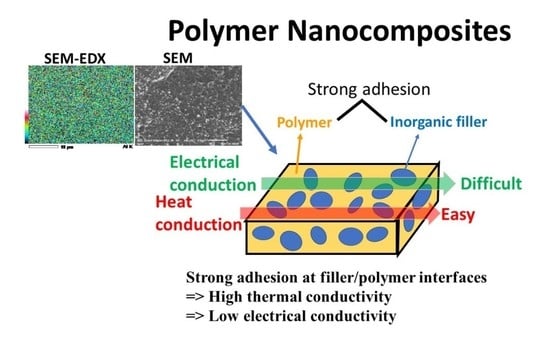
:With an aim to develop a good coil winding insulation film, fillers of boehmite alumina in the shape of a roughly rectangular plate were added with ratios of 10 and 20 wt% to polyimide. The filler surface was untreated or treated with a methacrylic or an epoxy silane coupling agent. Such prepared polyimide nanocomposites were subjected to various tests to measure the tensile strength, elastic modulus, complex permittivity, and thermal conductivity. It was found that samples with fillers treated using the methacrylic silane coupling agent have the strongest adhesion at the filler/polyimide interfaces and the lowest dielectric loss factor at high temperatures. A positive relationship between the filler/polyimide adhesion and the thermal conductivity is also indicated. These findings are significant since they indicate that the adhesion status at the filler/polymer interface exerts a strong influence on the thermal and electrical conduction processes in the polymer.
1. Introduction
Industrially important thermosetting resins such as epoxy resin have been used widely for a long time for various purposes, including electrical insulation, especially with the addition of inorganic fillers. The polyimide used in this research is one of such thermosetting resins and contains an imide group in its chemical structure as a repeating unit. Polyimide possesses excellent heat resistance, low dielectric permittivity, and good stretchability, despite being a thermosetting resin. Therefore, it is used as electrically insulating materials, films, heat-resistant paints, and so on.
On the other hand, polymer nanocomposites (NCs), or polymers, into which inorganic nanofillers are dispersed uniformly have recently attracted much attention for industrial purposes since their potential abilities in various aspects have been clarified [1,2,3,4,5,6]. Examples of industrial applications of NCs in several pieces of power apparatus are reported in references [1,2]. In addition, together with general aspects of NCs, examples of innovative electrical insulation realized industrially have been discussed in a comprehensive review paper [7] focusing on power cable insulations. One of the authors of the present paper (YO) also reported the details of the applications of the NC technology in Japan as solid-state insulated DC power cables and coil windings [8,9,10,11,12].
Funded by a public organisation, we have been conducting two research projects with a goal to develop good electrical insulations that can reduce the insulation thickness of coil windings used in power generators. One of the two projects concerns generators up to the 1.5-kVA class, while the other concerns larger ones [6,13,14,15]. In order to contribute to the project for generators up to the 1.5-kVA class, we are searching for the best nanofiller to add to polyimide. So far, it has been found that incorporating nanofiller into polyimide improves the partial discharge resistance [16]. The effectiveness of boehmite alumina as a nanofiller [17] has also been found in this project.
Regarding the above, the objective of the present work is to experimentally investigate the degree of adhesion at the interfaces between the polyimide and the boehmite alumina filler and its effect on the NC’s electrical insulation performance. Finding the most effective surface treatment is also the research objective.
2. Samples
Table 1 shows the details of the samples used in this experiment. The base polymer was made using a solution supplied from a chemical company. Although the detailed structure of the solution has not been disclosed, the polymer seems to be a kind of copolymer of Kapton and UPILEX. The filler is boehmite alumina with the shape of a roughly rectangular plate, having the average size as listed in Table 1. This paper is related to the aforementioned project with a manufacturing company of power generators up to the 1.5-kVA class. The company had already conducted many preliminary tests to select candidate fillers from various aspects such as partial-discharge resistance, breakdown strength, dielectric lifetime, moldability, durability, and compatibility to the company’s engineering skills. In such tests, the company found that boehmite alumina is superior [17]. One obvious point of selecting boehmite alumina is its high thermal conductivity compared to more general fillers such as SiO2 [18].
The filler surface was treated with either a methacrylic silane coupling agent or an epoxy-based silane coupling agent. The filler was mixed into a mother resin of polyimide at a ratio of 10 to 20 wt% by the sol method and then defoamed by a planetary centrifugal mixer for 5 min. It is generally accepted that the addition of too much filler exerts unfavorable effects on various properties such as mechanical and dielectric ones [2]. The maximum filler content was set to 20 wt% in an account of the results of preliminary tests. Lastly, NC samples with the shape of a sheet, with a thickness ranging from 50 to 100 μm were obtained with a blade coater.
In this study, the pristine polyimide sample with no filler is referred to as N, and the NC sample with the non-surface-treated filler is referred to as A. On the other hand, the NC sample is called AM when the filler surface is treated with the methacrylic silane coupling agent, while it is called AE when the filler surface is treated with the epoxy-based silane coupling agent. Next to the letters A, AM, and AE, the filler content in wt% was added, for example, as A10.
3. Experimental Methods
The surface of each sample was observed with a scanning electron microscope (SEM, IT-100LA, JEOL, Tokyo, Japan), and a dynamic mechanical analysis (DMA) spectrum was obtained with an analyzer (DMA242E, Netzsch Japan, Yokohama, Japan). In addition, tensile tests were performed using a tensile machine (AGS-1kNX, Shimadzu, Kyoto, Japan) three times in a vertical direction at a speed of 1.00 mm/min in air at room temperature. The sample piece for the tensile test was a dumbbell shape of 7.5 cm long with an initial mark spacing of 2.0 cm.
Furthermore, the complex relative permittivity or its real part εr′ and imaginary part εr″ were measured using a sample piece with a thickness of about 50 to 100 μm and a size of about 4 × 4 cm by applying an AC voltage of 3 V in vacuum, using an impedance analyzer (SI126096, Solartron, Leicester, UK). The measurements were obtained in a frequency range from 10−2 to 106 Hz, using the internal mode at temperature intervals of 50 °C between 25 or 50 and 400 °C. In addition, the density, specific heat, and thermal diffusivity were measured, respectively, by water displacement, dynamic scanning calorimetry, and the flash method using a light flash apparatus (LFA 467 HT HyperFlash, Netzsch Japan, Yokohama, Japan) with a xenon flash tube to calculate the thermal conductivity as the product of the three physical quantities. These measurements were conducted four times for AE10 and AE20 and twice for other samples by changing the sample piece.
4. Experimental Results and Discussion
4.1. SEM Images
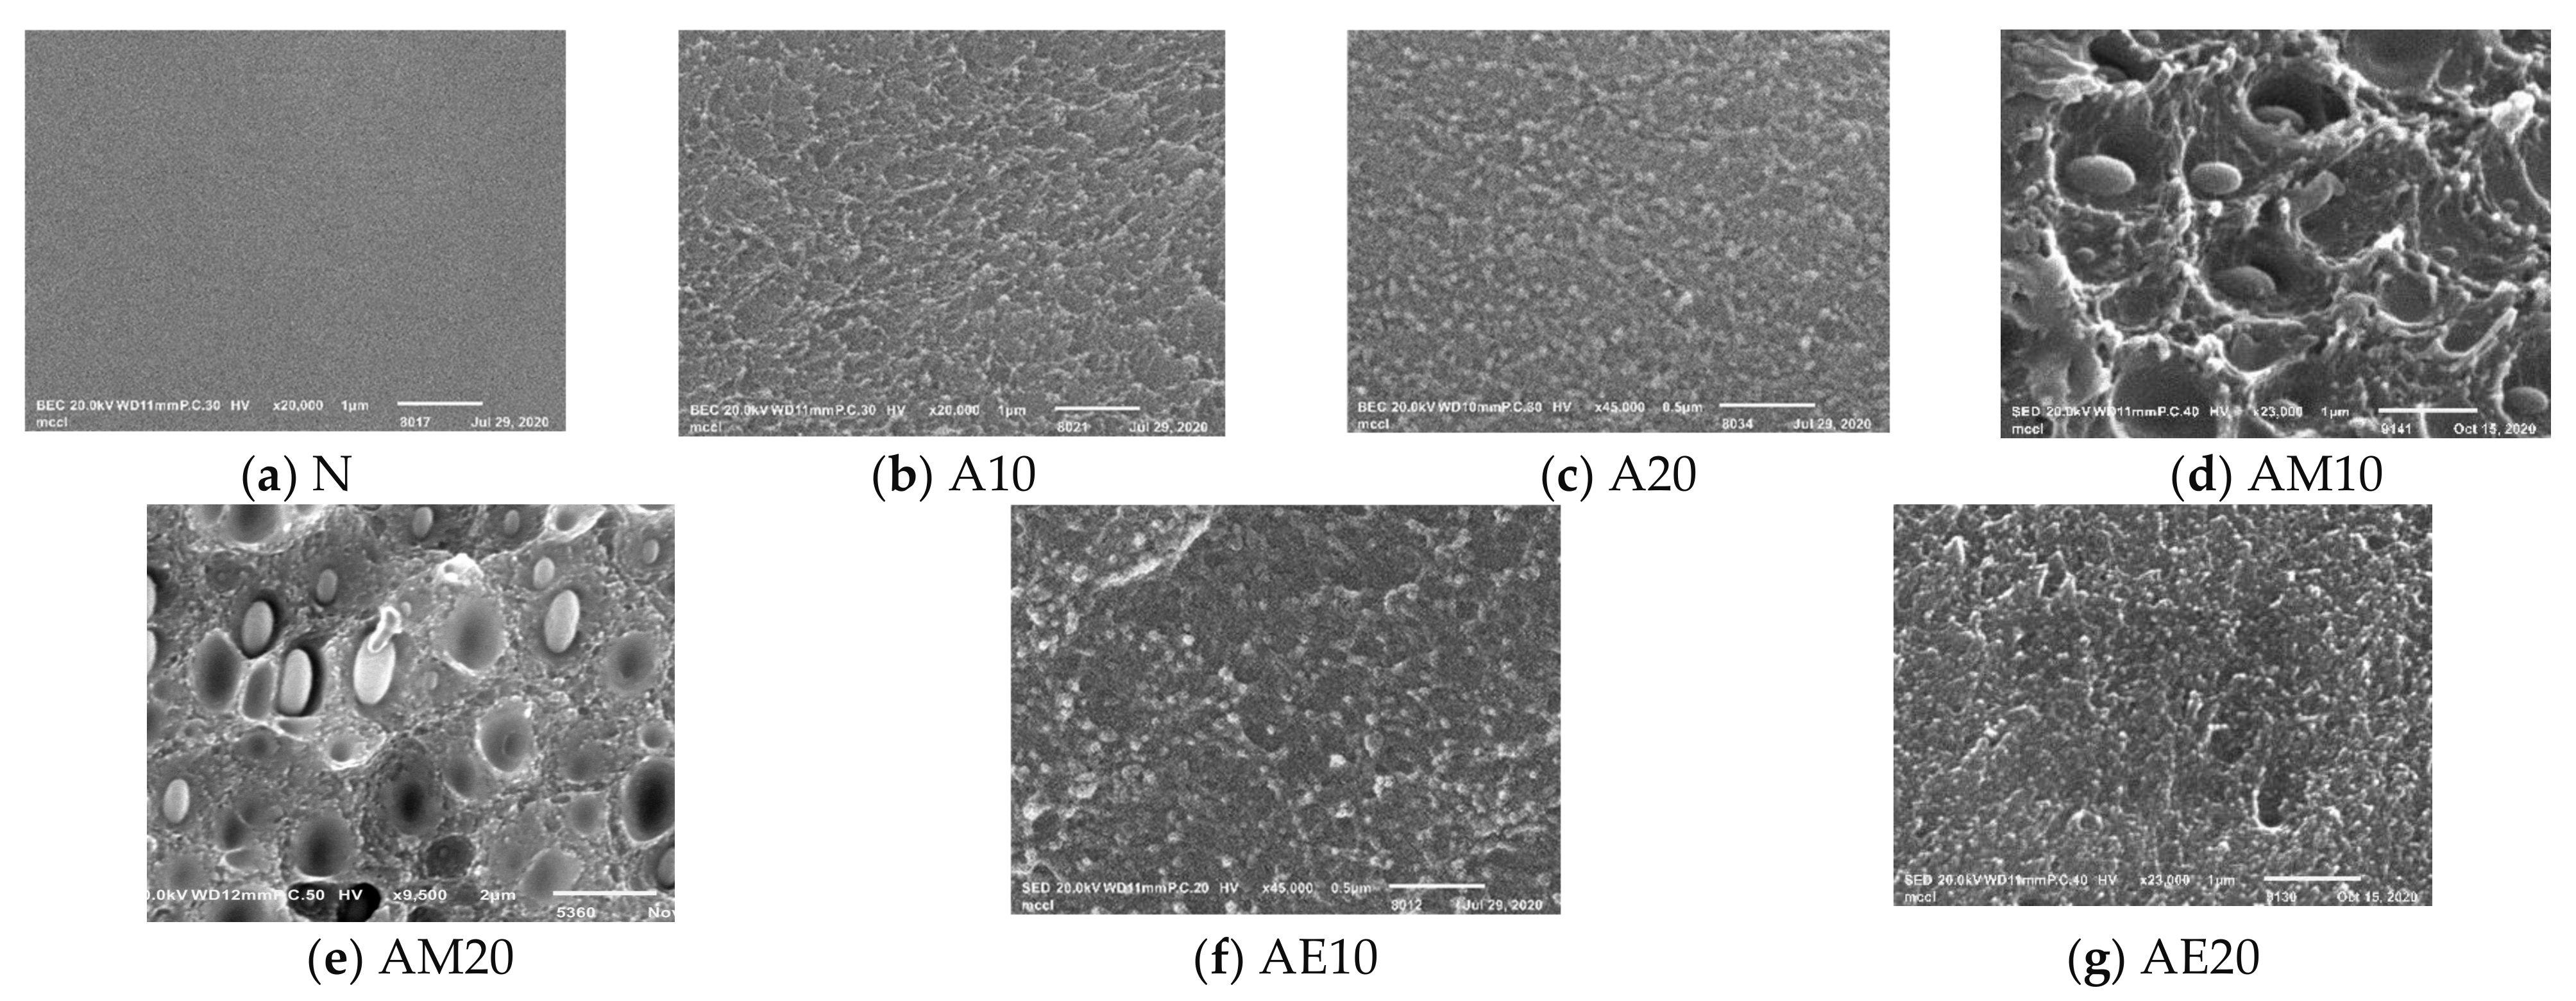
Figure 1 shows the SEM image of the cross-section of each sample. Egg-like objects of several μm are seen in AM10 and AM20.
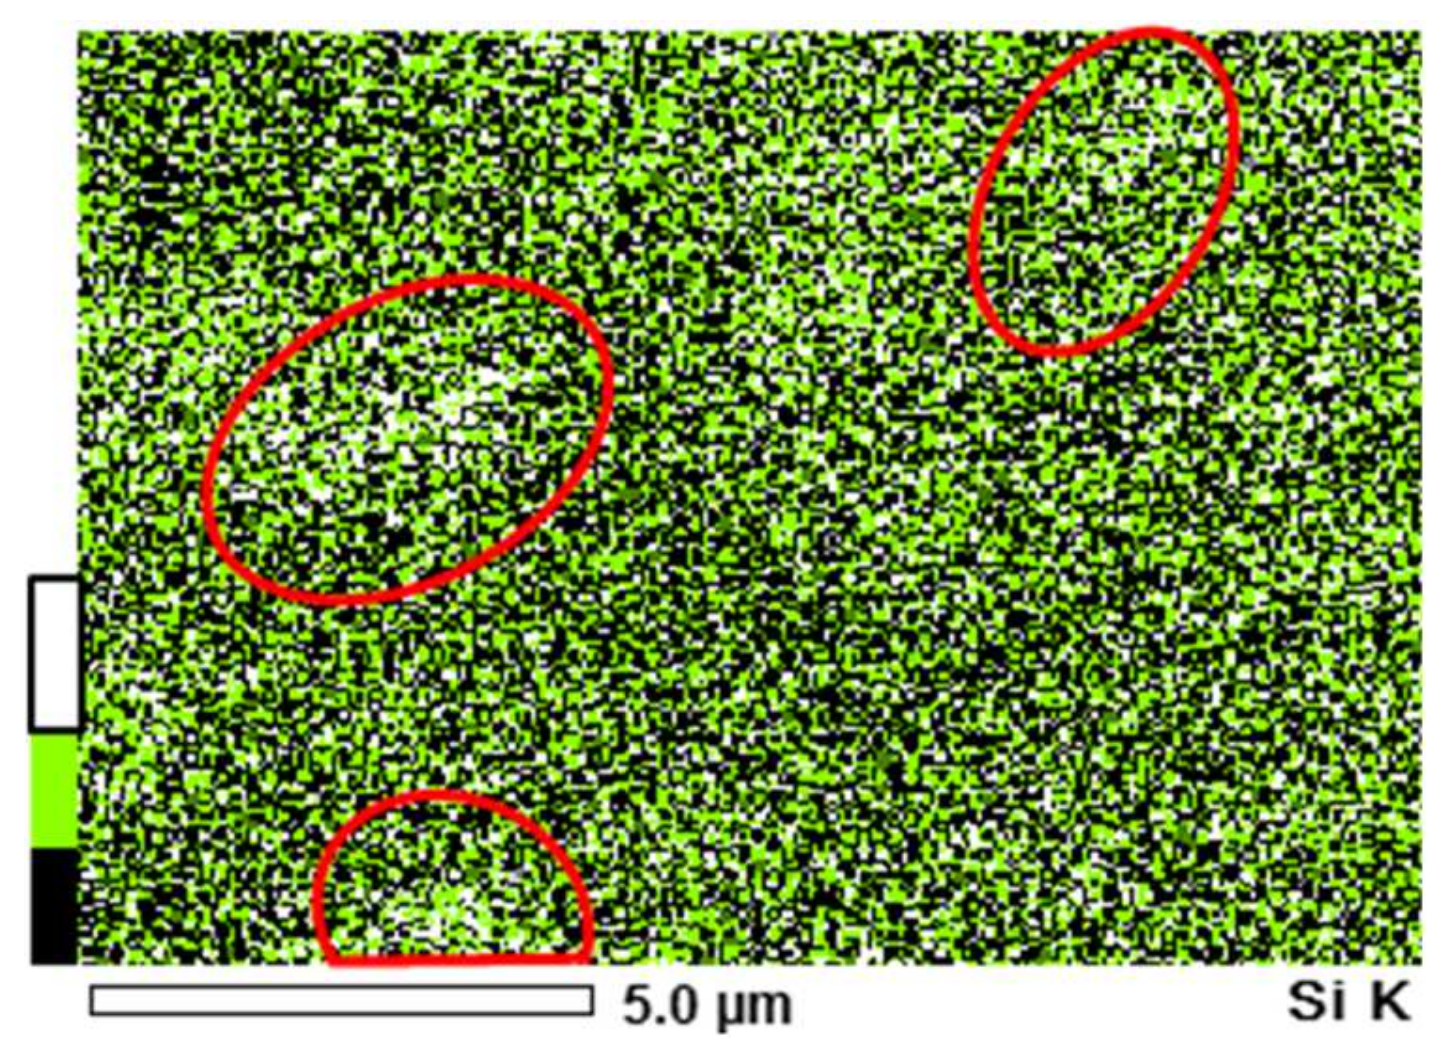
Regarding the above, SEM energy dispersive X-ray (EDX) spectral mapping conducted for sample AM20 is shown in Figure 2. The color bar beside the image represents the intensities of characteristic X-rays that correspond to the abundance of Si atoms. Here, the black and the white bars mean the lowest and highest intensity levels, respectively, while the green one shows their intermediate. The portions where Si atoms are rich seem to agree with those of the egg-like objects. Although the mapping shown in Figure 2 is not so clear, the EDX mapping images, taken sophisticatedly with various magnifications by a collaborative researcher, revealed clearly that the elements abundantly present in the objects are Si and O. From these results, the egg-like objects are derived from the methacrylic silane coupling agent used for the surface treatment.
More SEM-EDX images, which indicate the abundance of Al [19], show that the distribution of Al atoms is almost the same as the parts where the fillers seem to be present in the SEM images. Regarding the above, it can be said that the boehmite alumina filler is dispersed nearly uniformly in all the NC samples, despite the residue of the treatment agent remaining in AM10 and AM20.
4.2. Tensile Test
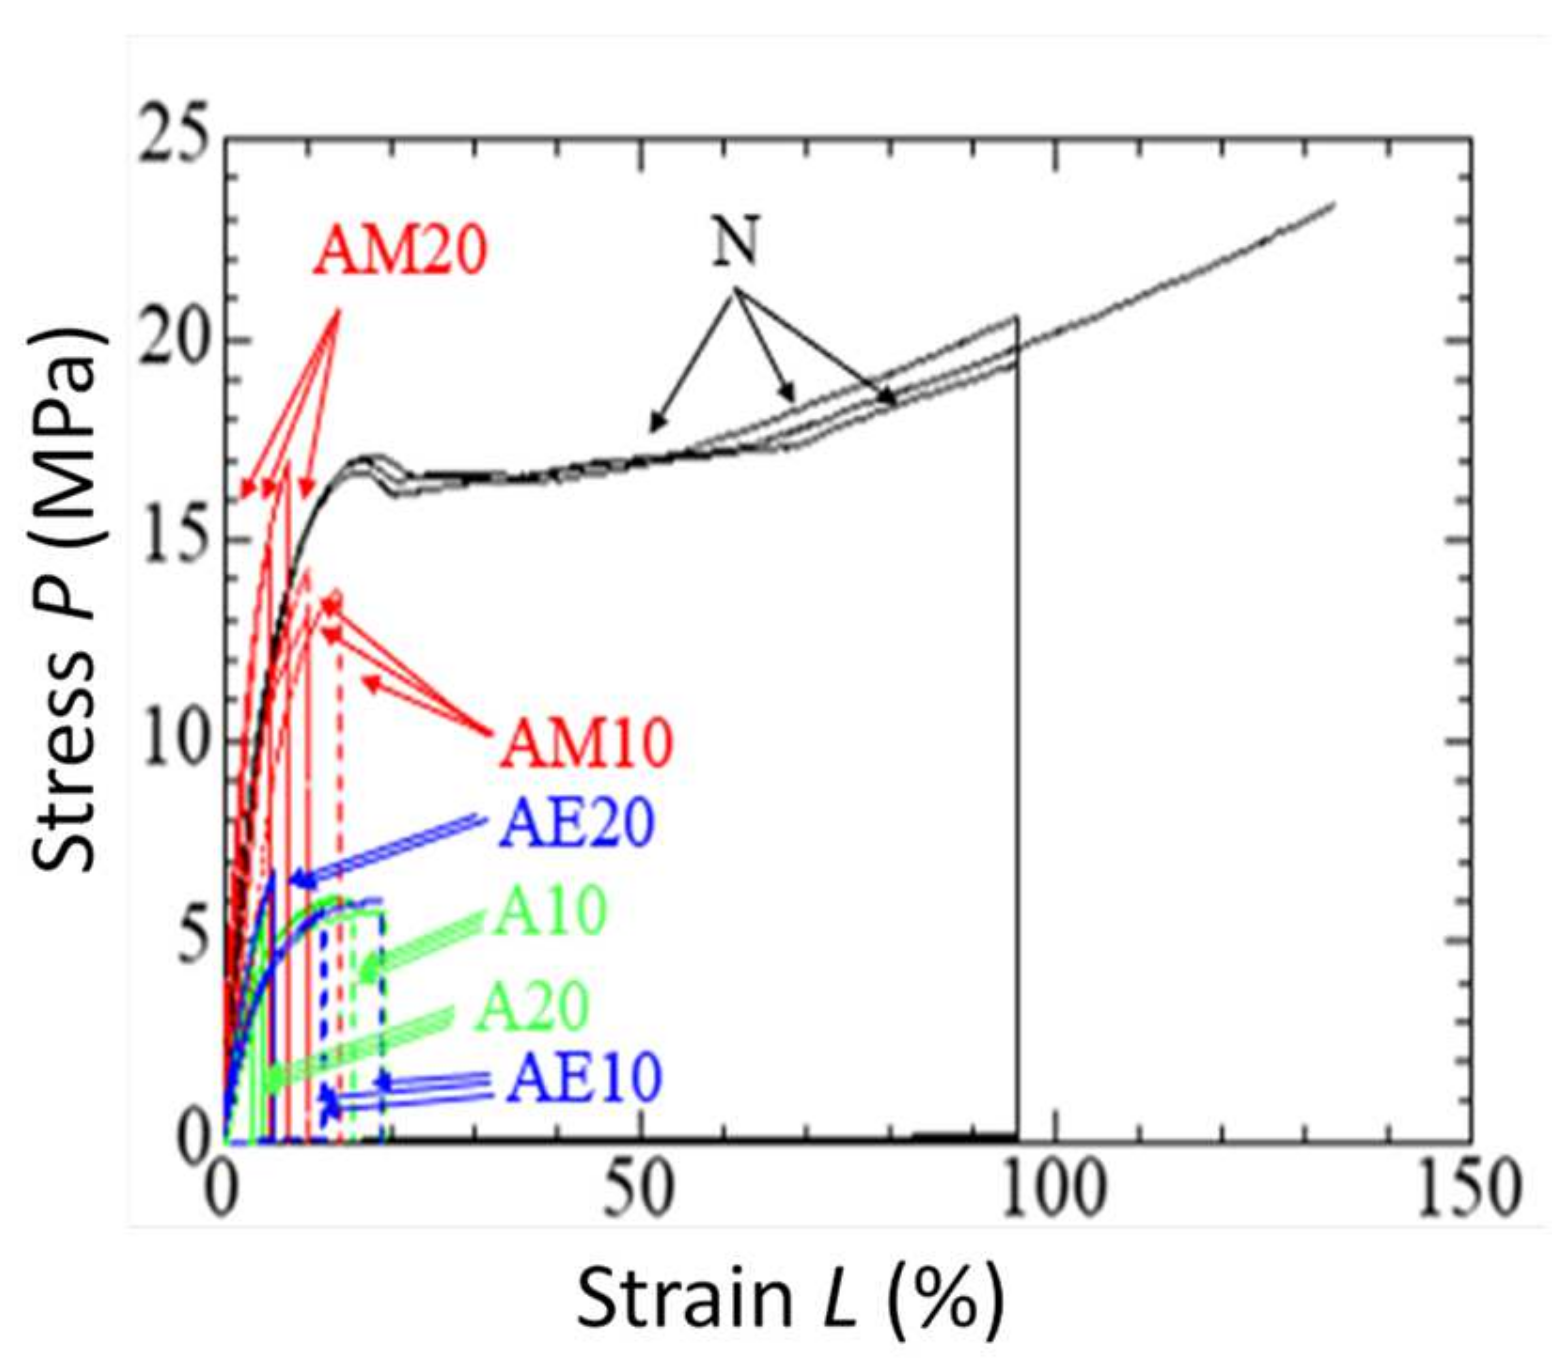
In the tensile test, the relation between the stress P given to the sample piece and its strain L is measured, taking the form of a stress-strain (S-S) curve with L on the horizontal axis and P on the vertical axis. Figure 3 shows such a S-S curve acquired for each sample. Since sample N is the pristine polyimide with no fillers, it stretches easily, giving high strain values. When we add fillers, the samples become difficult to stretch, providing the polymer/filler adhesion is good.
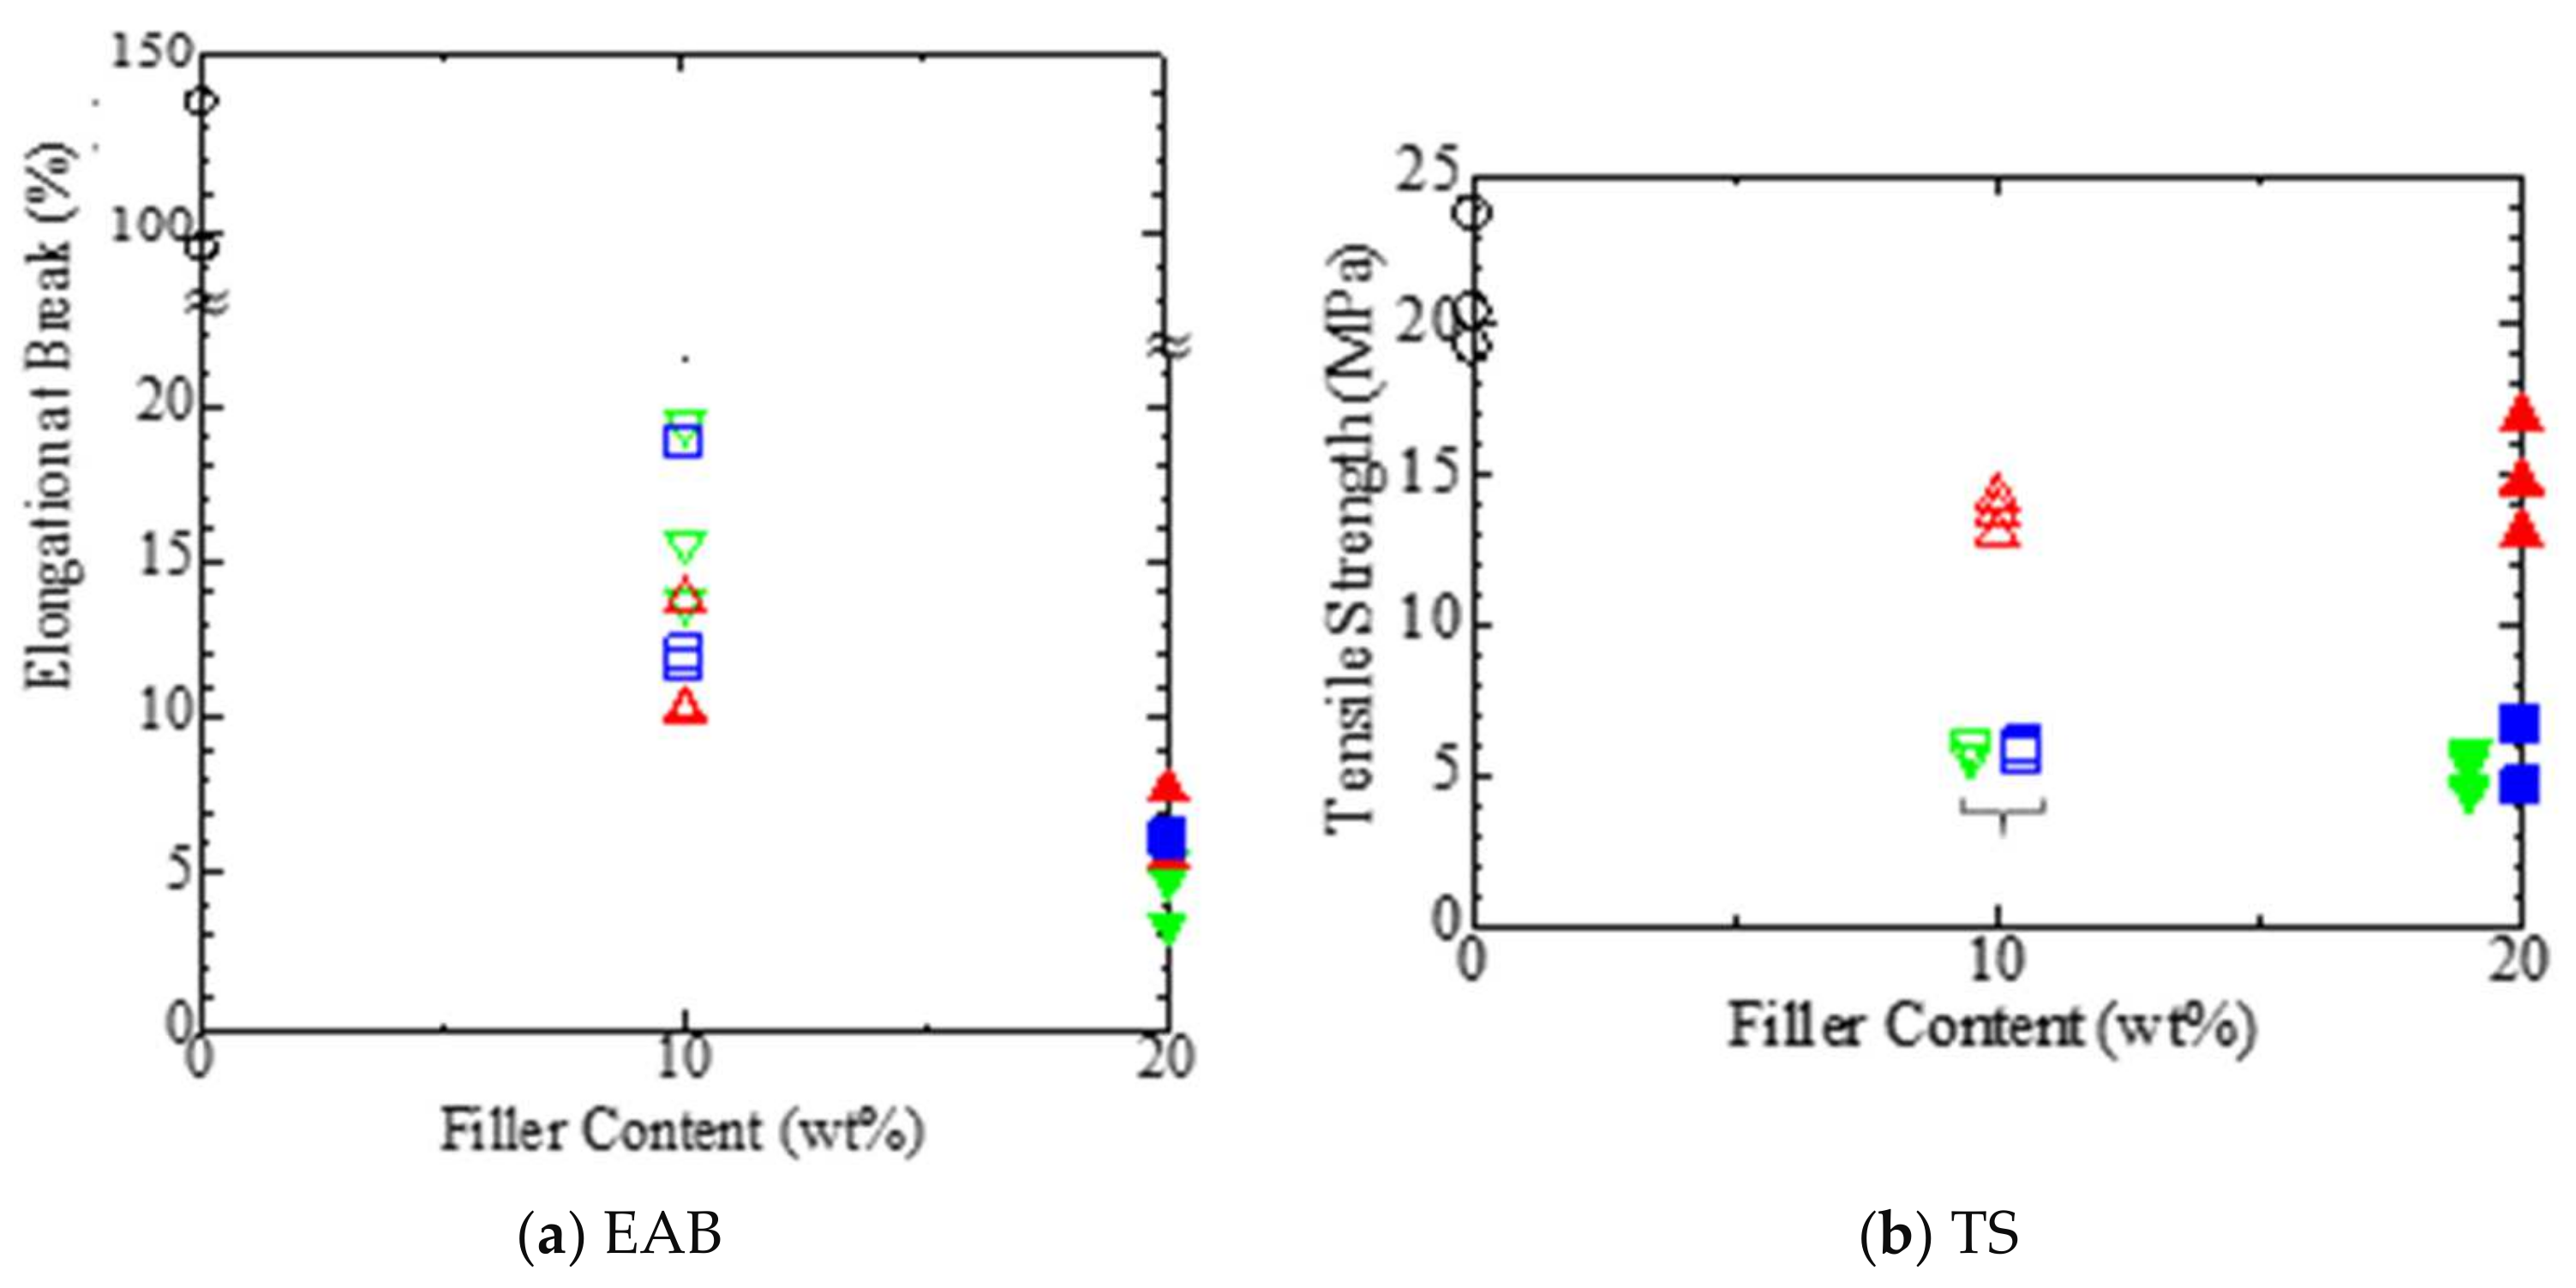
In addition, Figure 4 shows the elongation at break (EAB) and the tensile strength (TS) of each sample estimated from each S-S curve shown in Figure 3. It is obvious from Figure 4a that EAB decreases significantly when the filler is added to polyimide. Among the samples with the filler content of 10 wt%, sample A10 exhibits the highest EAB, while AM10 exhibits the lowest. Furthermore, EAB is the highest and lowest in samples AM20 and A20, respectively, when the filler content is 20 wt%. From Figure 4b, TS is significantly lower in the filler-added samples than in sample N with no fillers, but it is obviously high in AM10 and AM20 compared to the other samples with fillers.
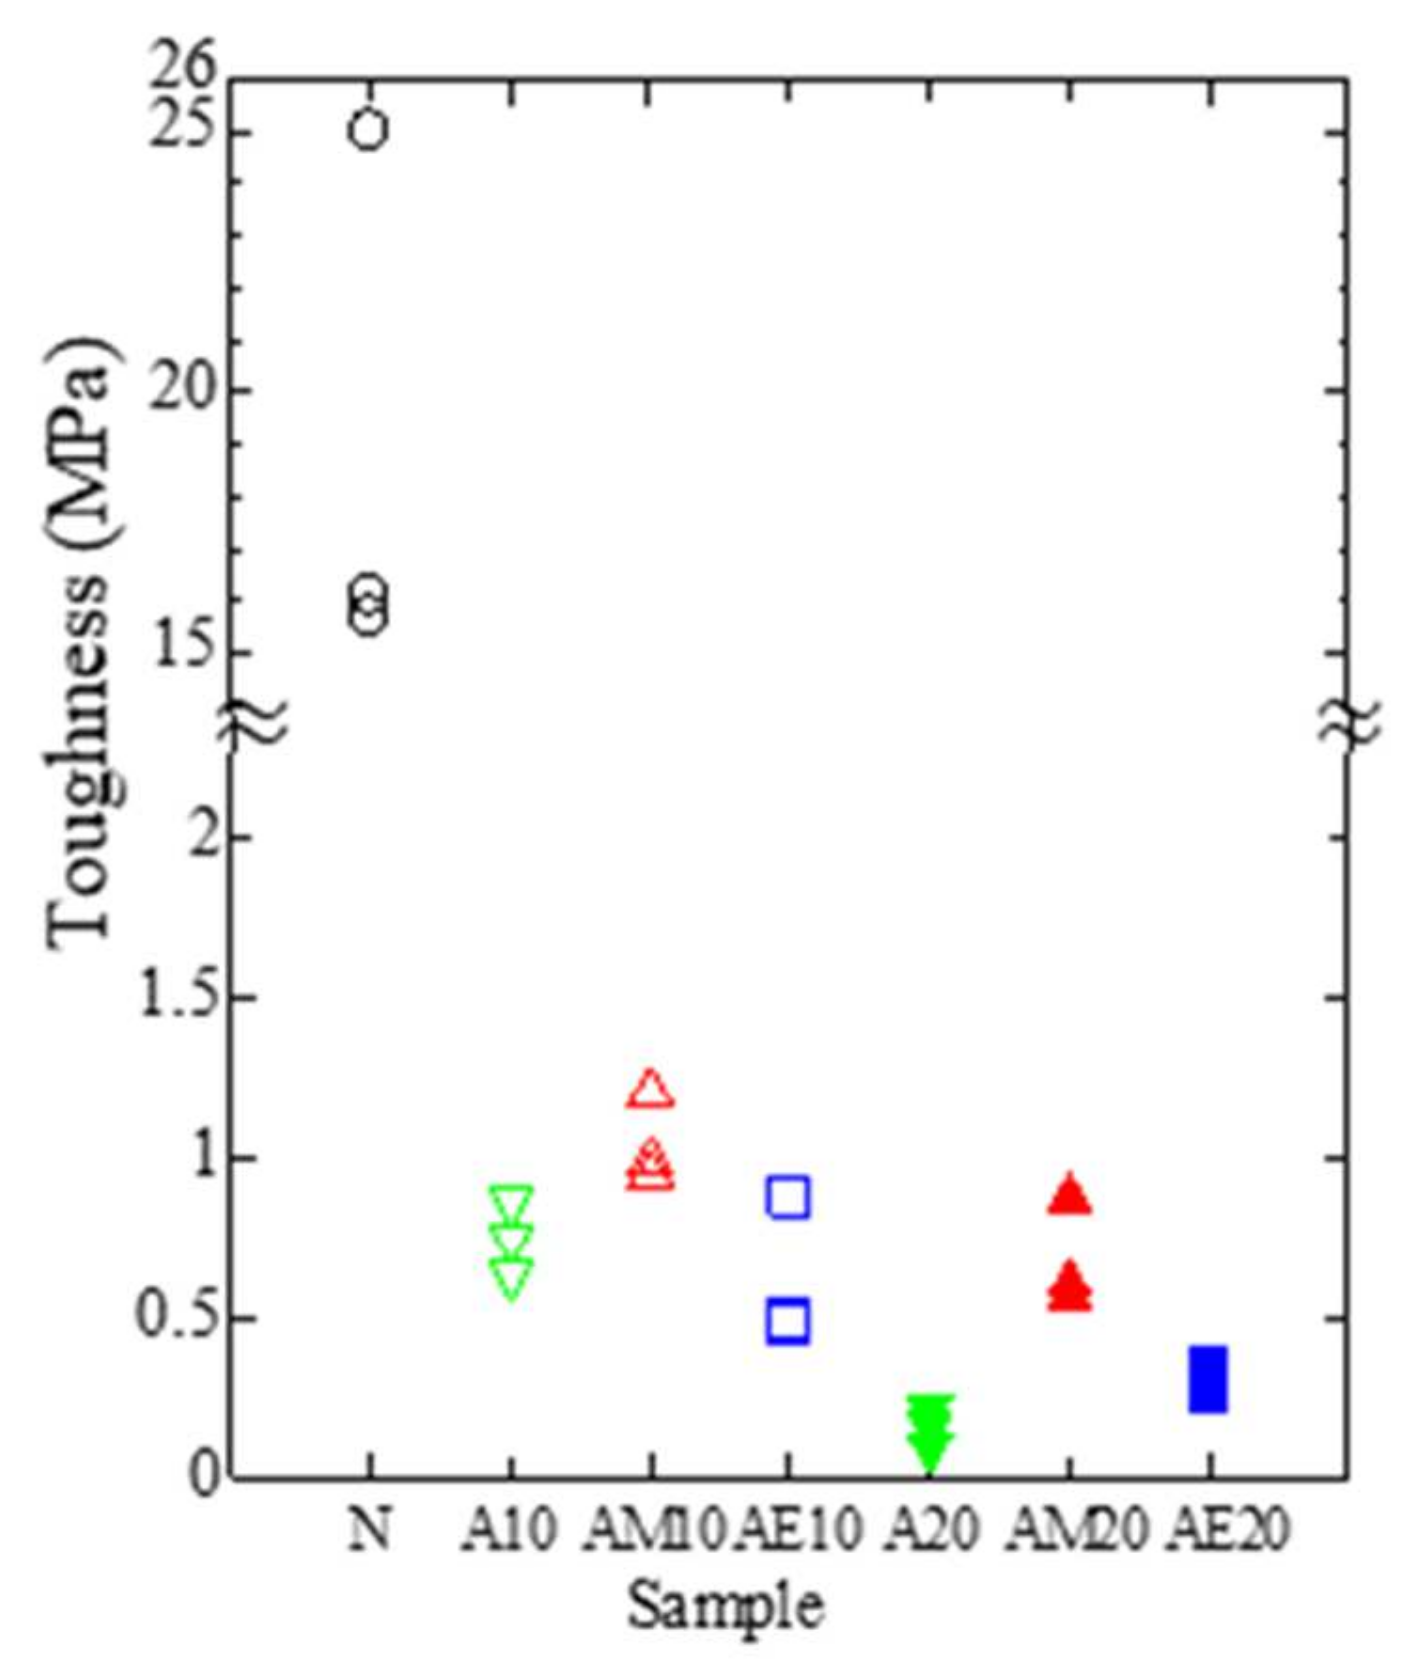
Next, the toughness defined as the integral of the S-S curve is calculated by the following equation:
here, is the strain at break. Figure 5 shows the toughness of each sample. The toughness is significantly decreased by the addition of the filler. It is the highest in AM10 and the lowest in A20 among the filler-added samples.
In polymer NCs, polymers have higher EAB and lower TS than fillers. Therefore, it is reasonably assumed that EAB should become lower, and TS should maintain a high value if the adhesion between the filler and the resin is good. On the other hand, if the sample is not good as a NC for some reason, for example, if the amount of filler added is too rich or the compatibility between the filler and the resin is not good due to poor affinity to the surface treatment agent, both EAB and TS should be extremely low. Regarding this, the toughness can be an indicator of the adhesion between the filler and the resin.
If this assumption is the case, the adhesion between the filler and the resin is weak in samples A10 and A20, to which the filler with no surface treatment was added. Therefore, only the resin was stretched in the test piece of A10, while the entire test piece of A20 became brittle. Compared to samples A10 and A20, it seems that the adhesion between the filler and the resin is the best in the methacrylic-treated samples AM10 and AM20. It is also indicated that the adhesion of the two epoxy-treated AE samples is in between that of two A samples and that of two AM samples.
4.3. DMA and Complex Permittivity Spectra
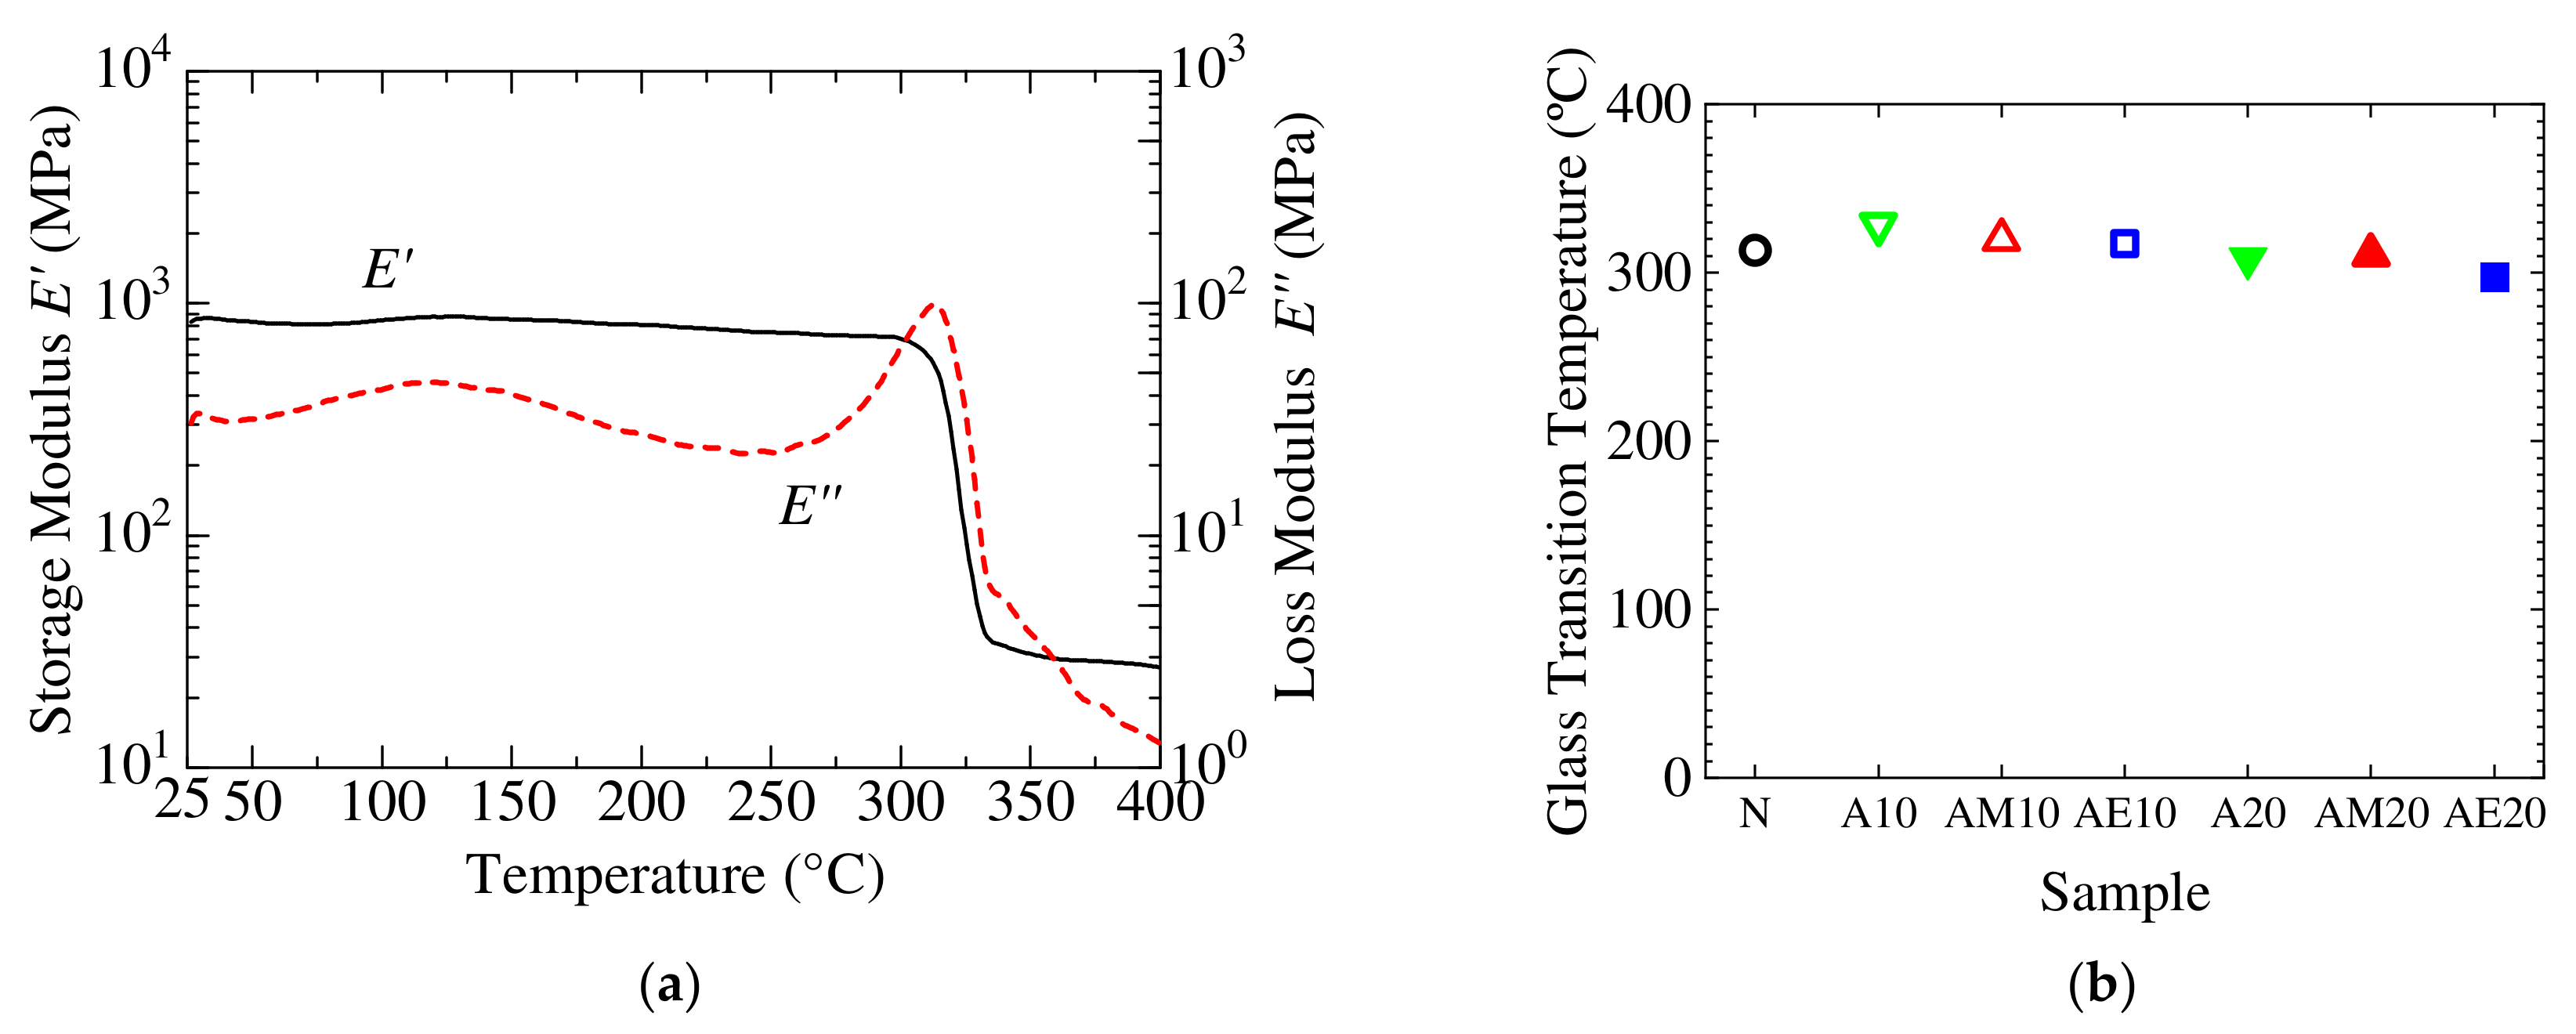
Figure 6a shows the DMA spectra measured for sample N with no fillers. Among many thermal parameters measurable in insulating polymers, the glass transition temperature Tg is one of the most influential ones that dominate the dielectric behavior of the polymers [4,6]. In this regard, using Figure 6a together with the DMA spectra measured for other NC samples with fillers [19], the glass transition temperature Tg was estimated as the temperature at which the storage elastic modulus E′ falls and the associated peak of loss elastic modulus E″appears. As shown in Figure 6b, Tg is around 313 °C in sample N, and it hardly changes by the addition of nanofillers.
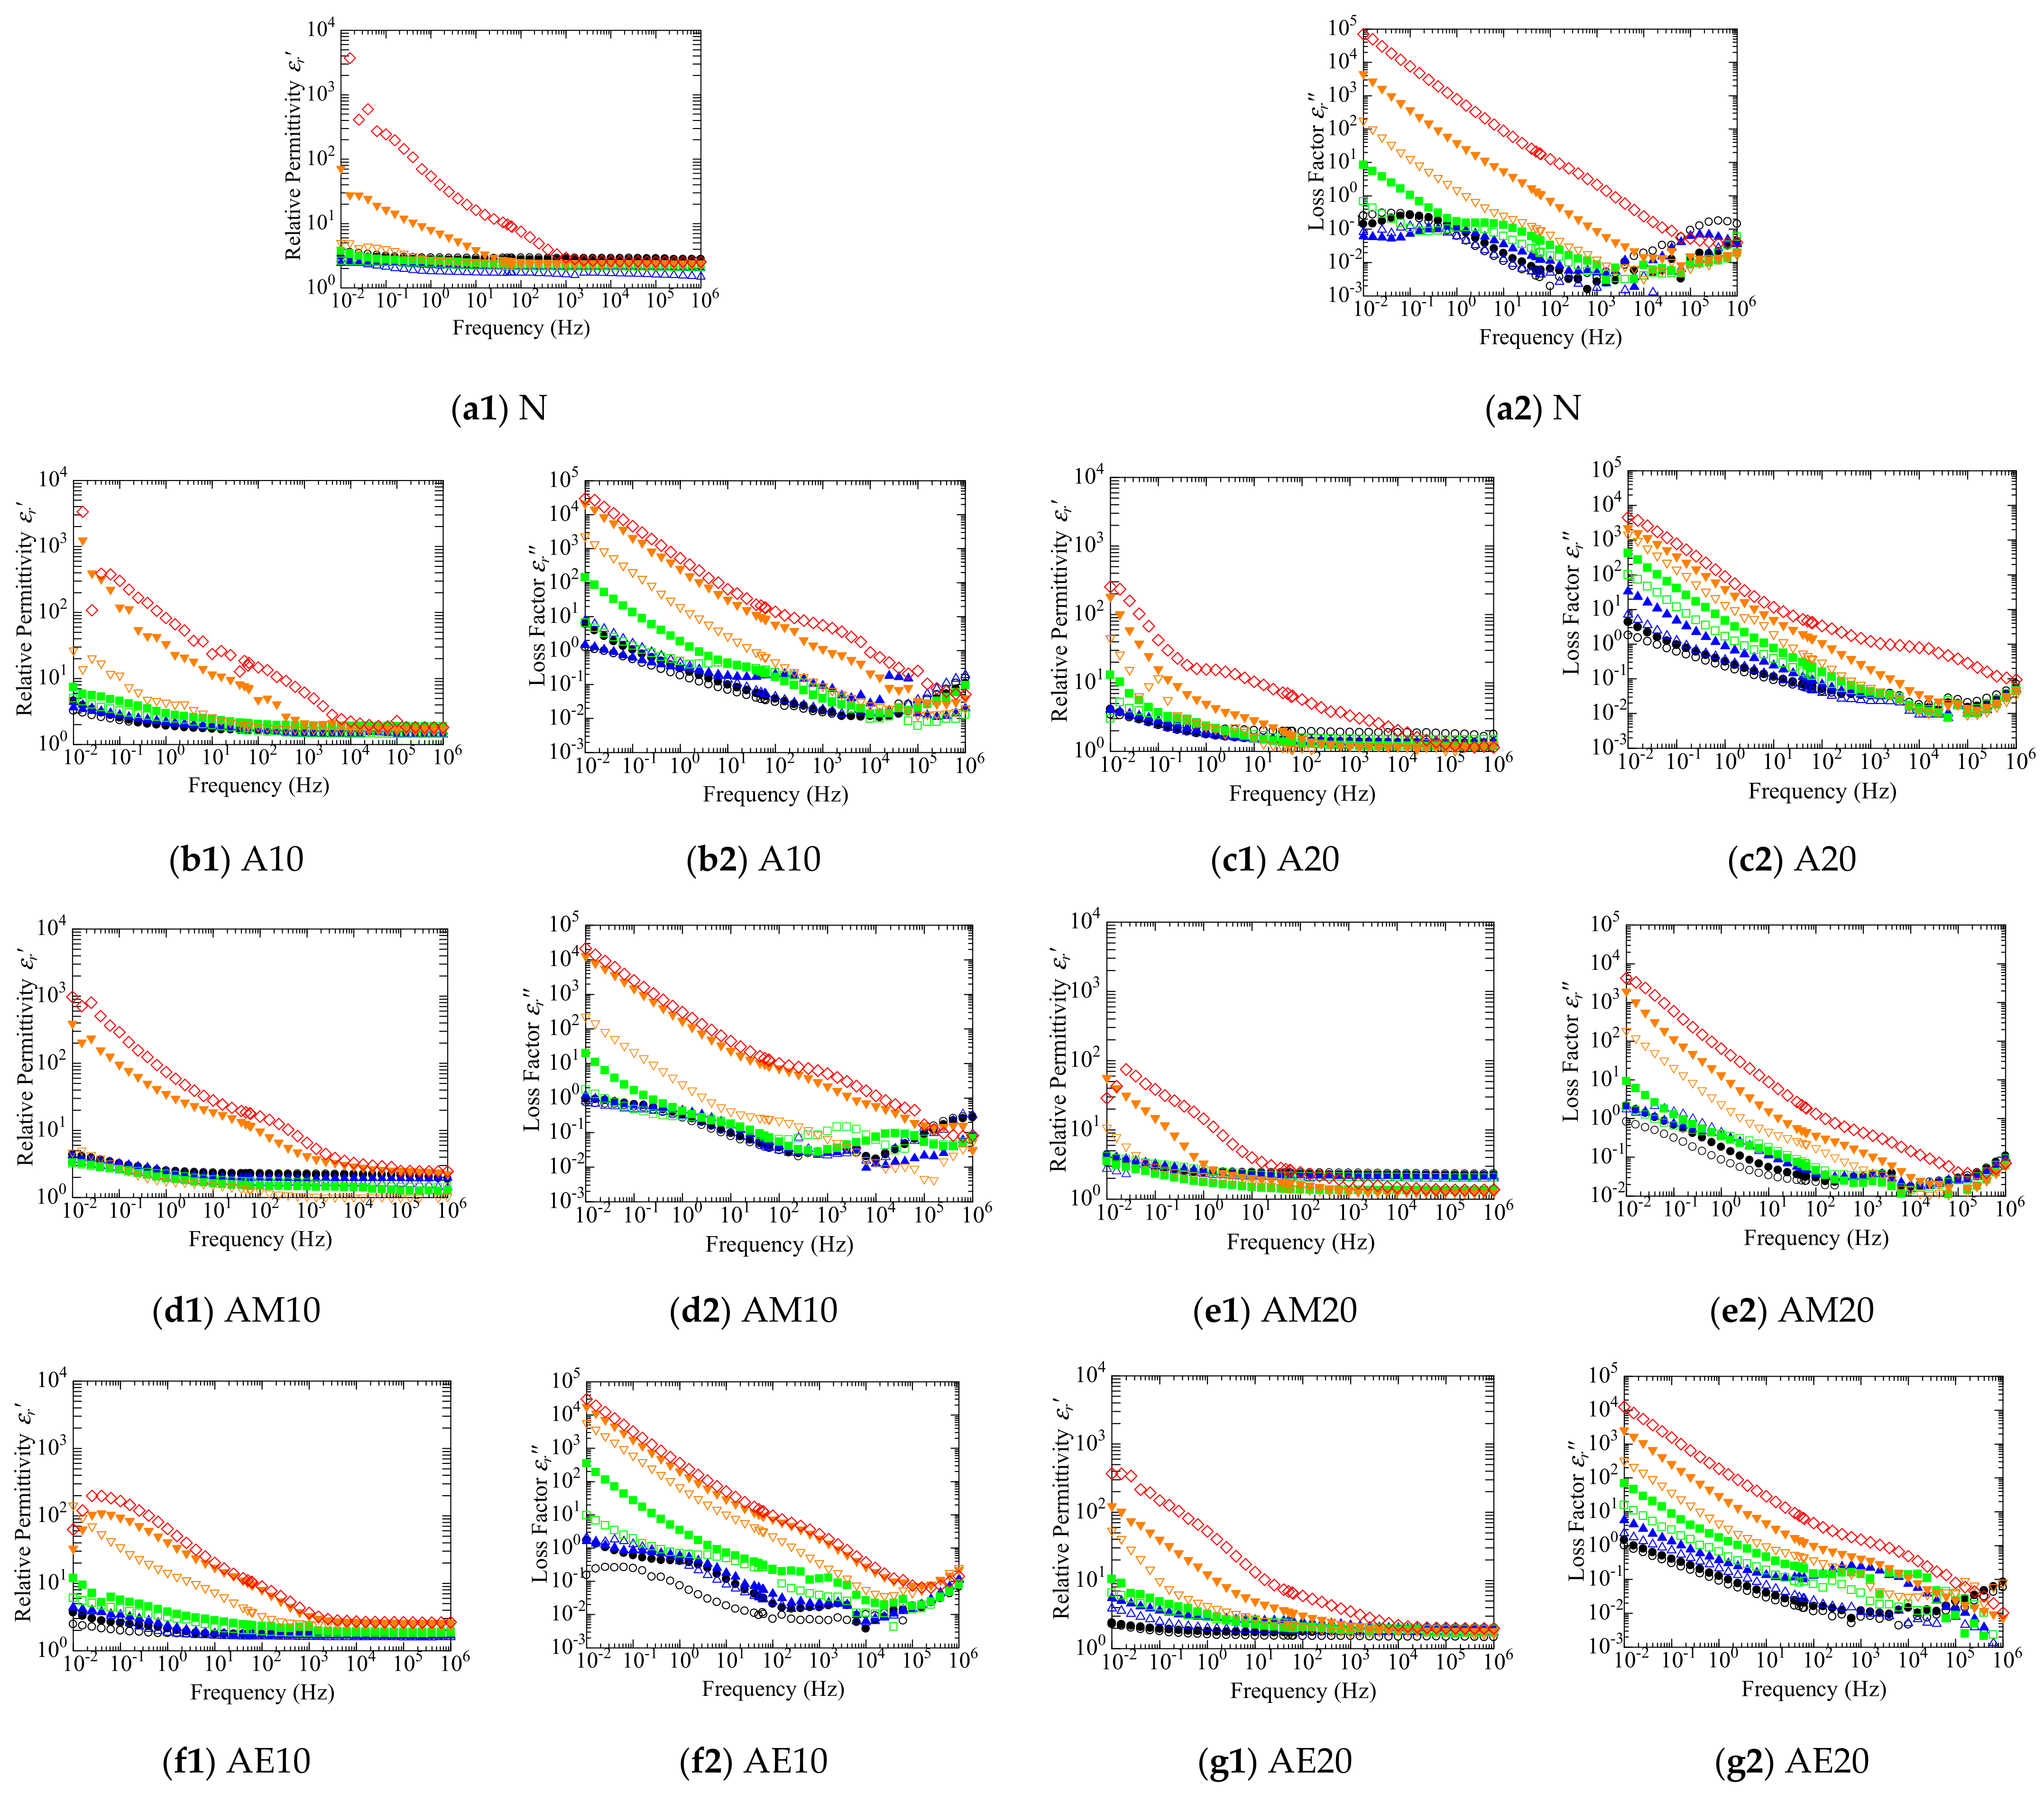
Figure 7 shows the frequency spectra of the relative permittivity εr′ or the real part of the complex relative permittivity and the dielectric loss factor εr″ or the imaginary part, measured for all samples at 25 to 400 °C. It is obvious that εr′ and εr″ increase significantly when the measurement temperature exceeds 300 °C.
Since Tg is around 315 °C for all the samples, the increase in εr′ and εr″ is attributable to the temperature elevation above Tg. A similar increase in εr′ and εr″ at temperatures above Tg has been observed in many polymers [20,21,22,23]. The cause of the increase in εr′ is a phenomenon called electrode polarization, or the accumulation of hetero space charge [20]. That is, if charge carriers approach an electrode with the polarity opposite to that of the charge carriers and accumulate in its front, the amount of the charge on the electrode increases, inducing a higher value of εr′. Since the principal carrier species in polymers, especially at temperatures above Tg, is ions, the charge transport would be accelerated if the molecular motion becomes active, which in turn increases εr′.
Furthermore, εr″ increases in Figure 7 with a slope of −1 on the log-log graph with the increase in frequency f at relatively high temperatures and low frequencies. That is, the increment of εr″, Δεr″, satisfies the following Equation (2):
Here, σ is the conductivity. This indicates that Δεr″ is caused by the generation of Joule heat induced by the transport of charge carriers inside the sample [20,21,22,24,25].
As mentioned above, both the increase of εr′ and that of εr″ shown in Figure 7 are attributable to the activation of the transport of charge carriers, most likely ionic, in each sample induced by the transition to the rubber state. However, the increase of εr′ should be influenced by various processes such as the charge exchange or conversion from ions to electrons on the electrodes in addition to the charge transport that has also many influencing factors. In other words, even if the charge transport is activated so vividly, εr′ does not increase if charge carriers are swept away to the electrode and no heterocharge layer is formed in its front. In contrast, the conductivity σ of the sample can be estimated almost accurately as long as Equation (2) or is satisfied for εr″.
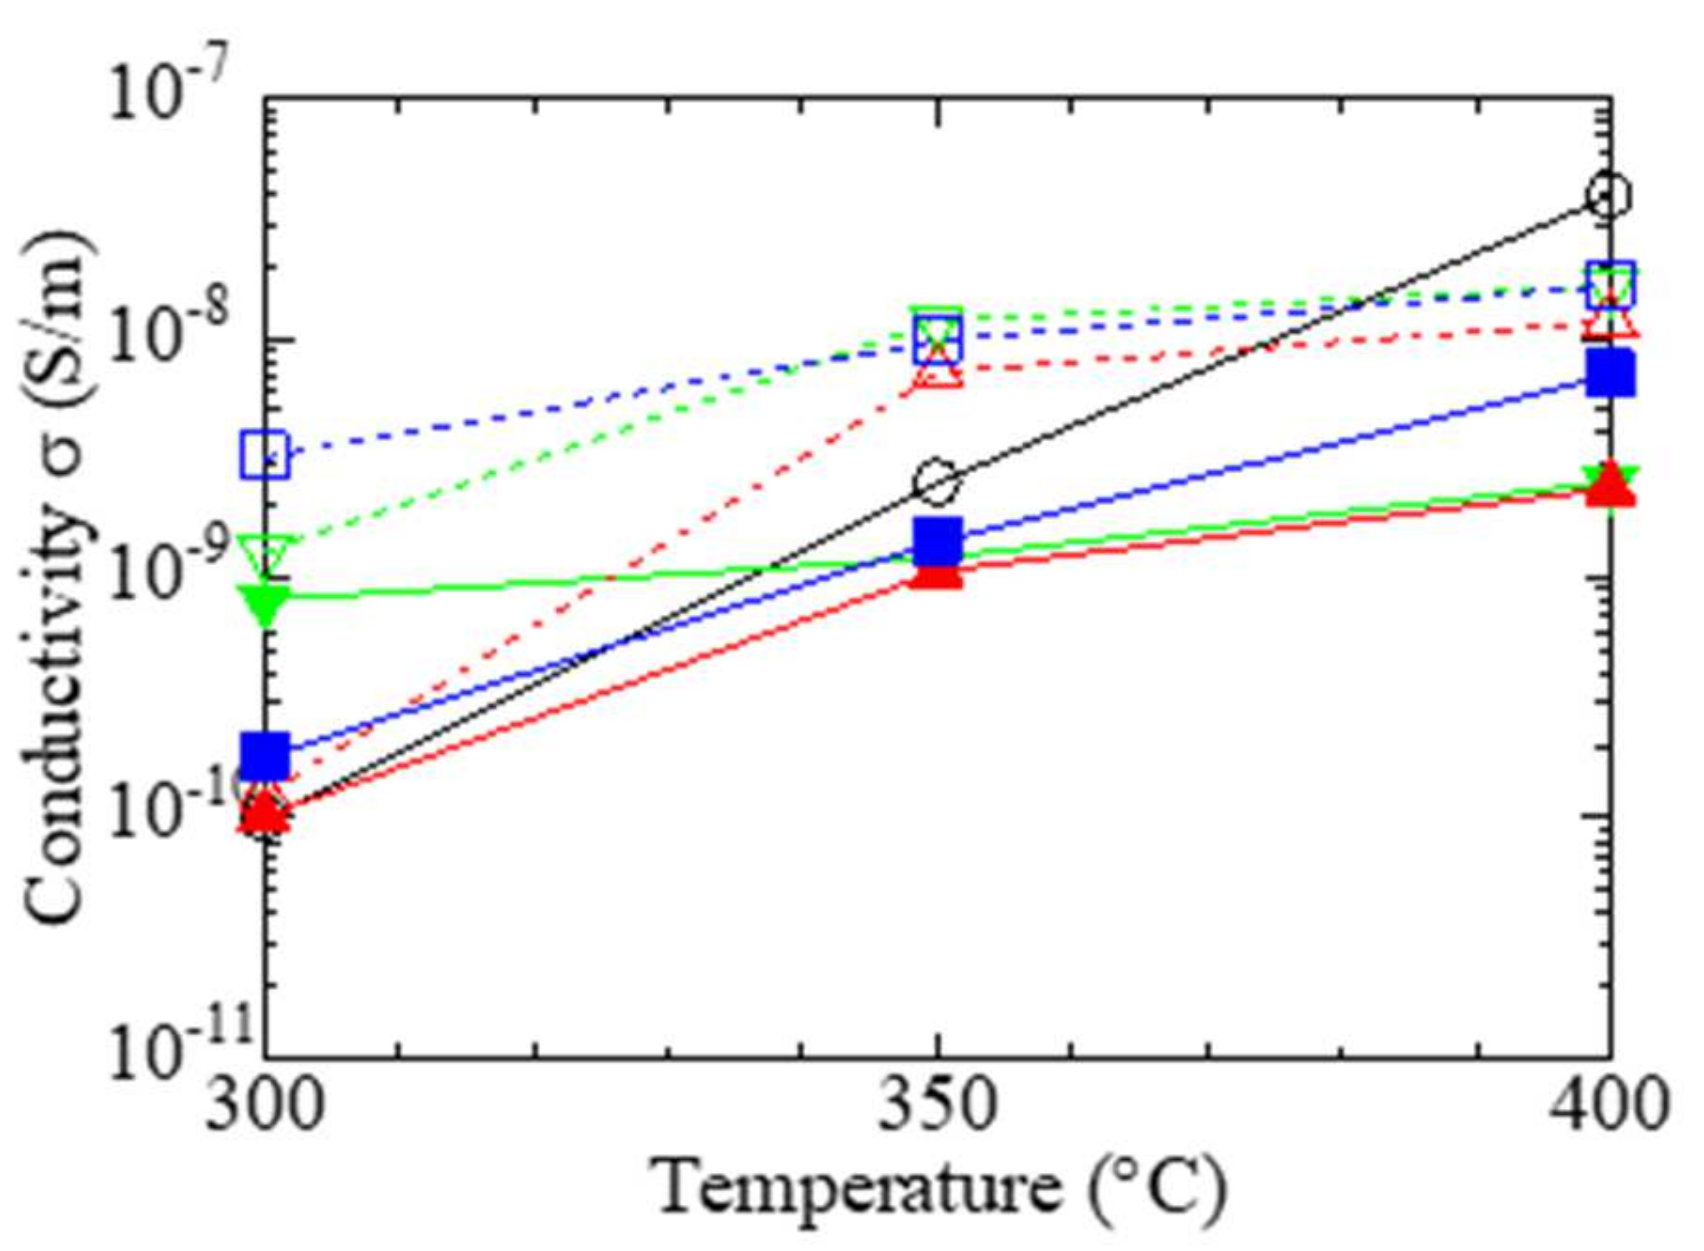
Figure 8 shows the values of σ calculated for all the samples, using Equation (2) at the measurement temperatures of 300 °C and higher where an inverse proportional relationship is observed between log εr″ and log f in Figure 7. The charge transport process in polymers is, in general, very complicated. Probably reflecting this, the magnitude relationship of σ among sample N with no fillers and the six NC samples is not the same at measurement temperatures of 300, 350, and 400 °C. However, σ at 300 °C is the lowest in AM10 and AM20, along with N.
In addition, when comparing three types of NCs with the same filler content, AM, containing the filler surface-treated with the methacrylic silane coupling agent, shows the lowest σ in both cases of 10 and 20 wt%. As mentioned above, the tensile test results shown in Figure 3, Figure 4 and Figure 5 indicate that the adhesion between the filler and the resin is the strongest in AM10 and AM20. Then, it can be said that a good NC with low conductivity at high temperatures is the one with strong filler/resin adhesion. In other words, if a NC possesses strong filler/resin adhesion, it should have a high ability as an insulating material with low conductivity.
4.4. Electric Modulus Spectra
The discussion developed above based mainly on the complex permittivity spectra can be further expanded more clearly using complex electric modulus spectra [20,22,24,25]. The complex electric modulus is defined by the following equation as the reciprocal of complex permittivity [25]:
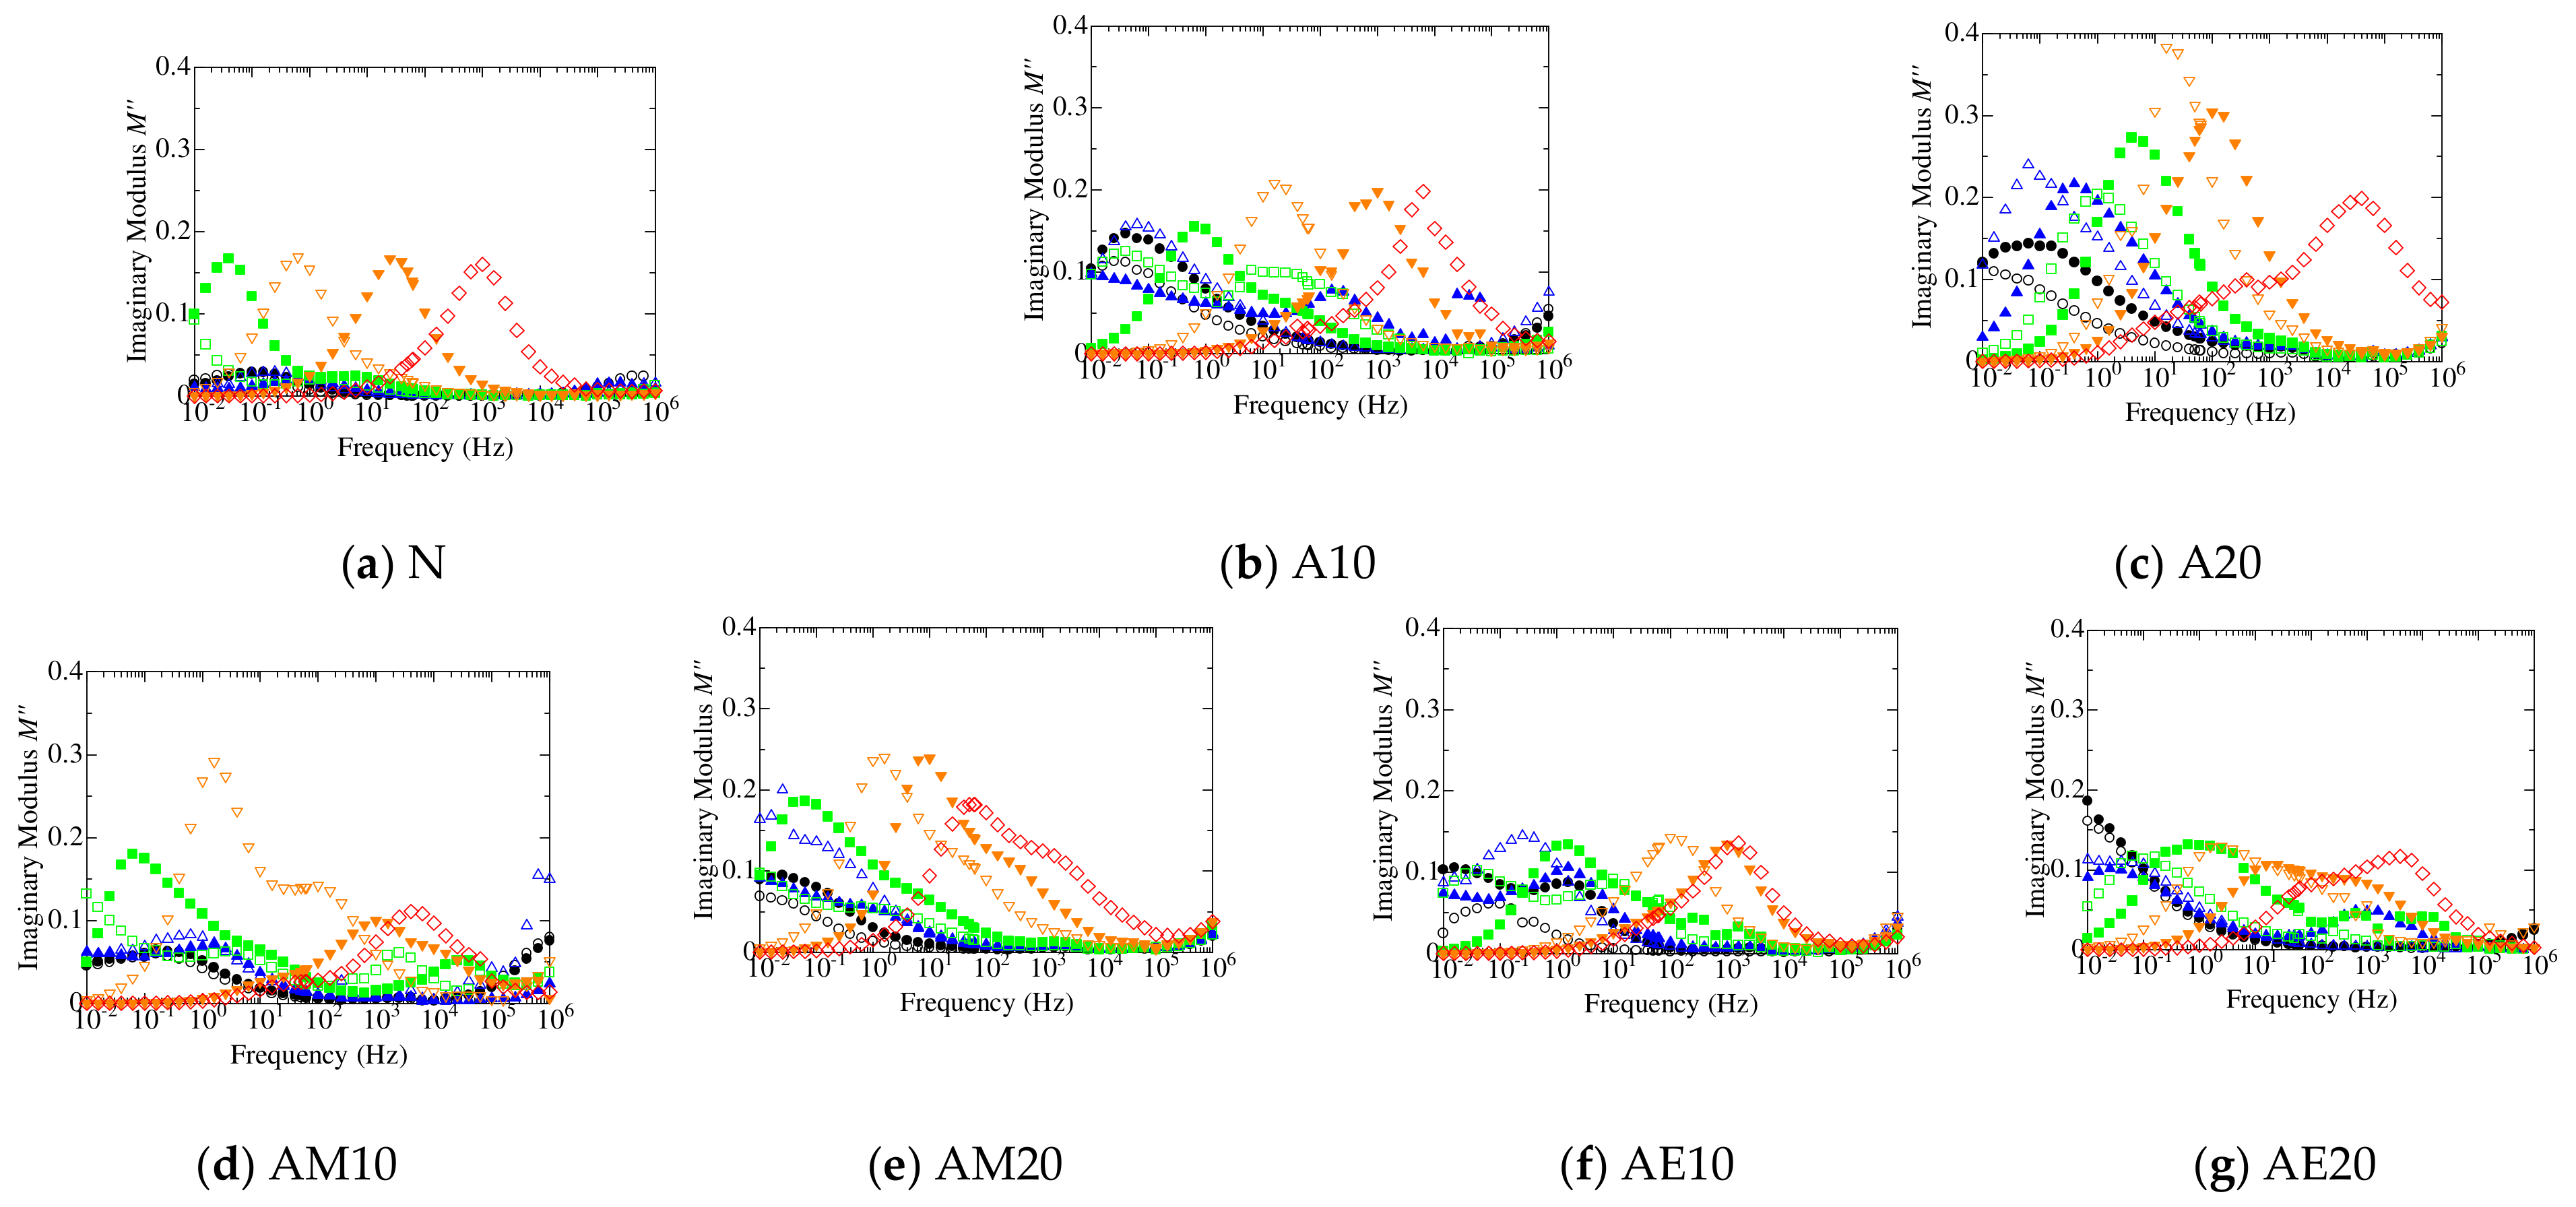
In general, the frequency spectra of or the real part of provide less valuable information on dielectric phenomena than those of the imaginary part Regarding this, Figure 9 shows the frequency spectra of of each sample.
In all samples, a peak appears on the spectra above a certain temperature. This temperature is almost the same as the temperature at which εr″ begins to increase with a slope of −1 on the above-mentioned log εr″ vs log f graphs shown in Figure 7. Therefore, it is possible from these peaks to read the temperatures at which the conduction of mobile charge carriers is activated. The summit of a peak appears first at 250 °C in N, at a lower temperature of 25 °C in A10, and 50 °C in A20. Peaks are seen at 250 °C and above in AM10 and AM20, and they are broader in AM20 than in AM10. While AE10 has peaks at 25 °C or higher, AE20 has ones at 150 °C or higher. Below 150 °C, becomes higher in AE20 than in AE10 at low frequencies. In addition, the peaks in AE20 are broader than those in AE10.
In general, if a peak of appears at a relatively high frequency in a temperature range lower than Tg, it is likely due to dipolar relaxation [20,24]. However, since the measurement temperature dependence of the peak is continuous in Figure 9, the peaks of appearing at temperatures below Tg (≈313 °C) of the present samples are considered to be induced by the same origin as those above Tg, namely conduction of charge carriers. In addition, the reason for the peak becoming broader when the filler content is higher seems to be due to the emergence of many conduction species and/or many conduction processes.
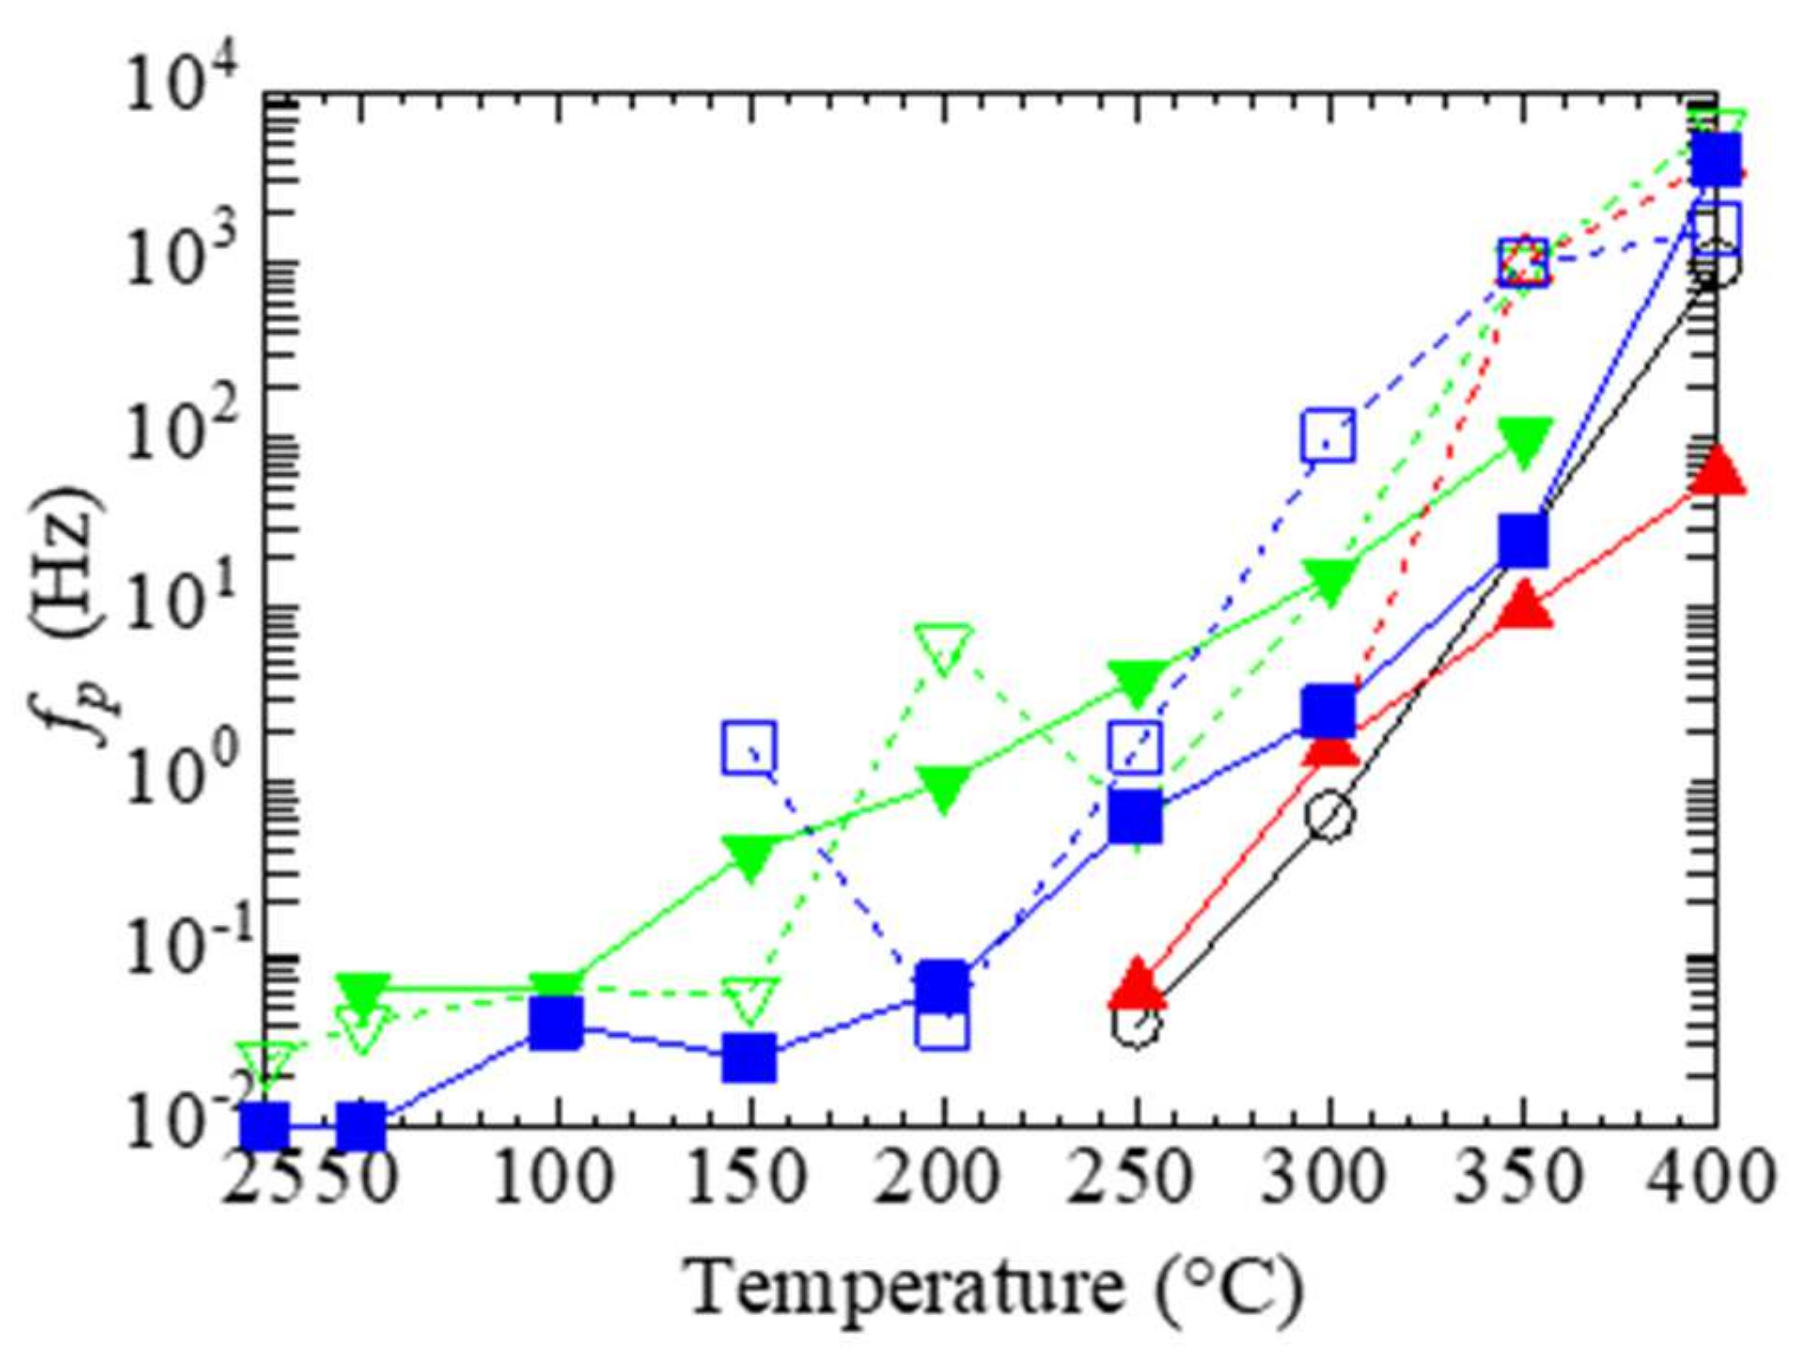
Figure 10 shows the temperature dependence of the peak frequency fp of . At 300 °C or lower, fp appears in the filler-added samples on the higher frequency side than N, but at 350 °C or higher, fp becomes the lowest in AM20. The appearance of fp at a lower frequency indicates that the conduction of charge carriers, most likely ions, is suppressed [6,26,27]. Therefore, the molecular motion and the resultant conduction of charge carriers are suppressed in AM20 at 350 °C or higher, although such movement is enhanced in the filler-added samples at temperatures lower than 350 °C. This is consistent with the above-mentioned finding that the NCs with fillers surface-treated by the methacrylic silane coupling agent exhibit the improved insulation performance at high temperatures such as 350 and 400 °C.
It can be mentioned based on the results of the tensile test that the filler surface-treated by the methacrylic silane coupling agent has the best adhesion between the filler and the resin compared to the untreated filler and the filler treated by the epoxy-based agent. Therefore, it is assumed that the improvement of the insulation performance is due to the good resin/filler adhesion.
4.5. Thermal Conductivity
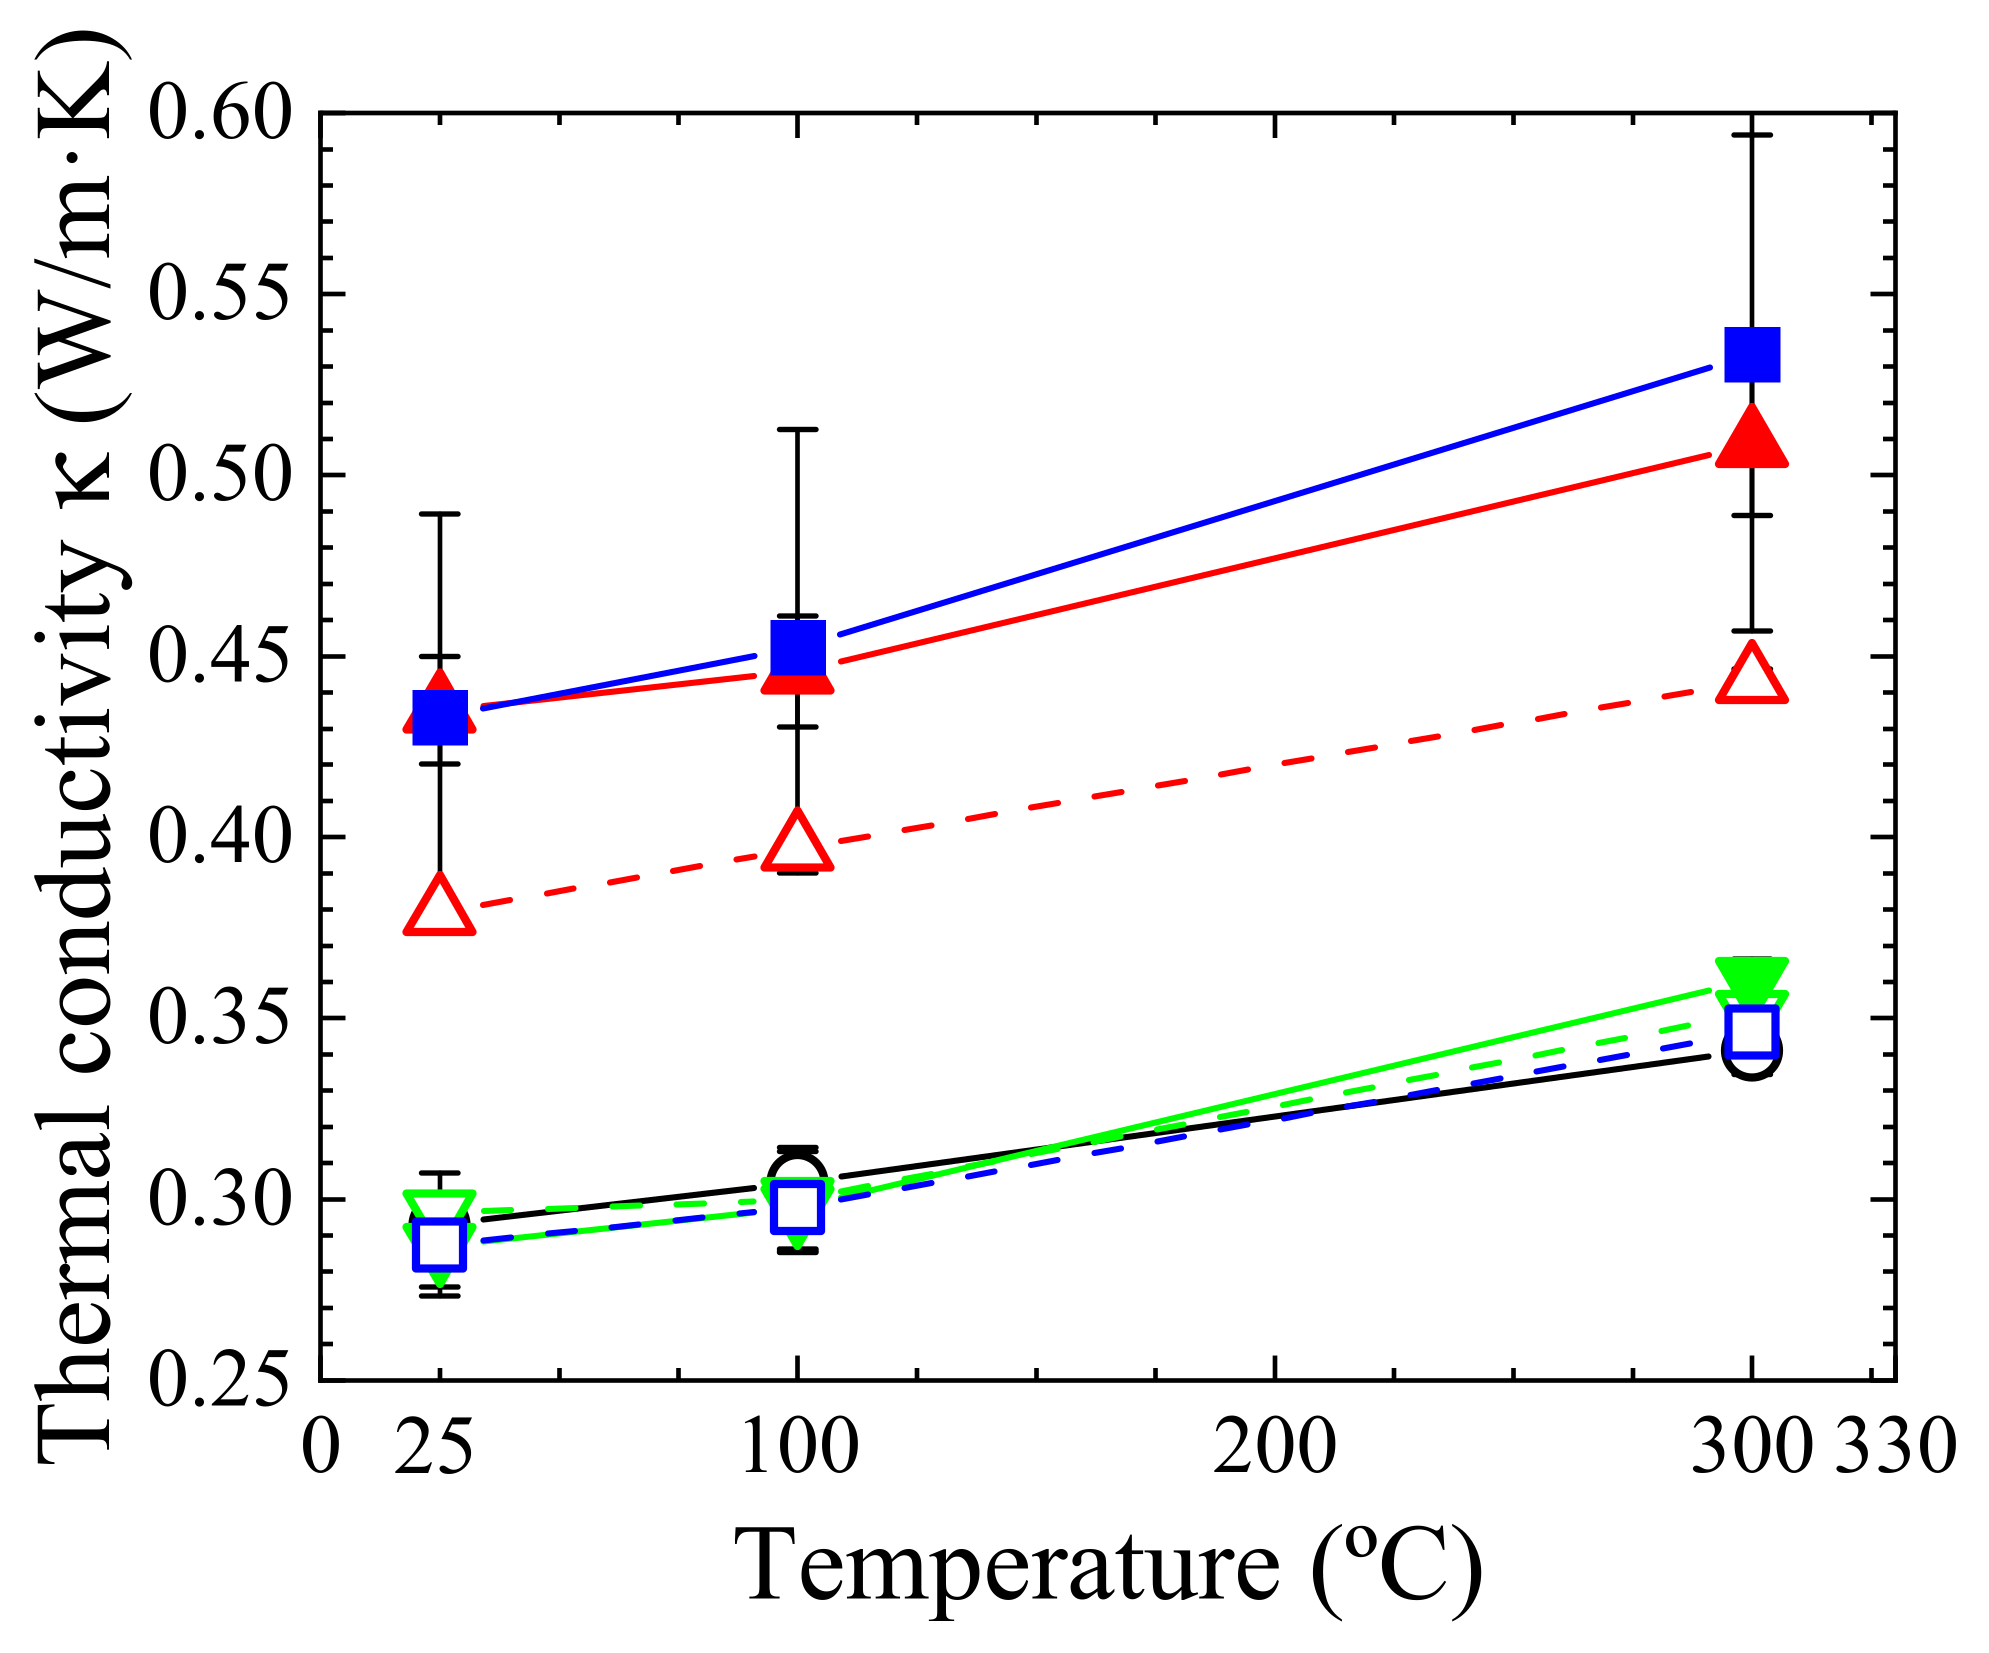
Figure 11 shows the maxima, minima, and averages of the thermal conductivity κ measured four or two times for each sample at 25, 100, and 300 °C.
Heat can be transferred easily through inorganic substances such as the present filler compared to organic polymers, giving the formers high κ values. Therefore, in polymer composites, the addition of inorganic fillers with a high κ will contribute to the increase in thermal conductivity. However, using fillers of a smaller size increases the total interfacial area between the resin and the filler that should act as a barrier to the heat conduction. With this in mind, it is reasonably assumed that good adhesion between the resin and the filler should make the heat conduction easier. If we compare the values of κ among the three NCs with the filler content of 10 wt%, sample AM10 shows the highest κ. This result, as well as the high κ value of AM20, is consistent with this thought. However, it is unclear why κ is higher in AE20 than in AM20.
One point to consider concerning Figure 1 and Figure 2 is that samples AM10 and AM20 have egg-like objects. Then, these two samples can be regarded as a kind of nano-microcomposite rather than a simple NC. This is not in line with the original intention of this research. Moreover, there is a possibility that the egg-like objects were induced by some sort of incompatible nature among the polymer, the filler, and the methacrylic silane coupling agent. Regarding the above, the mechanism underlying the high κ values of AM10 and AM20 remains a topic of future research.
5. Conclusions
We made NC samples of polyimide with boehmite alumina fillers and investigated their mechanical, dynamic mechanical, and dielectric properties experimentally, focusing on the effect of the adhesion between the resin and the filler on the electrical insulating ability. We have obtained the following findings.
(1) With the addition of fillers to polyimide, EAB, TS, and toughness decreases significantly, indicating that the sample becomes hard to stretch. Among the filler-added samples, the one with the fillers surface-treated with a methacrylic silane coupling agent has low EAB, high TS, and high toughness, which indicates that the adhesion between the filler and the resin of this sample is strong.
(2) In the high-temperature region such as 350 to 400 °C, the increase in εr′ and εr″ is suppressed by the addition of the fillers. It seems that the molecular motion is suppressed and the current flow due to ions is reduced resultantly. This effect appears more evidently in the NC with the filler surface-treated by the methacrylic silane coupling agent than in those with untreated filler and the filler treated by the epoxy silane coupling agent. This result indicates that the filler treated with the methacrylic silane coupling agent provides the best insulation performance.
(3) Good adhesion between the filler and the resin brings about the improvement of the insulation performance.
(4) Of the three types of NCs with the filler content of 10 wt%, the filler surface-treated by the methacrylic silane coupling agent yields significantly higher thermal conductivity than the two other fillers. This result suggests that good adhesion between the filler and the resin is crucial for improving thermal conductivity.
Author Contributions
The two authors, Y.O. and N.H., conducted all the 14 roles listed in CRediT, sharing equal ratios. Both authors have read and agreed to the published version of the manuscript.
Funding
This work was partly supported by a project, Innovation Program for Energy Conservation Technologies (JPNP12004), of the New Energy and Industrial Technology Development Organization (NEDO).
Acknowledgments
The authors would like to thank Emiri Nagase and Karen Kawada for sharing their experimental results. Emiri Nagase and Karen Kawada, former students supervised by Y.O., conducted parts of the experiments. Part of sample preparation and the measurements of several experimental data were conducted by outside companies.
Conflicts of Interest
The authors declare no conflict of interest.
References
- Tanaka, T.; Vaughan, A.S. Tailoring of Nanocomposite Dielectrics—From Fundamentals to Devices and Applications, 1st ed.; Pan Stanford: Singapore, 2017; ISBN 978-981-4669-80-1. [Google Scholar]
- Tanaka, T.; Imai, T. Advanced Nanodielectrics—Fundamentals and Applications, 1st ed.; Pan Stanford: Singapore, 2017; ISBN 978-981-4745-02-4. [Google Scholar]
- Nelson, J.K. Dielectric Polymer Nanocomposites, 1st ed.; Springer: New York, NY, USA, 2010; ISBN 978-1-4419-1590-0. [Google Scholar]
- Mori, K.; Hirai, N.; Ohki, Y.; Otake, Y.; Umemoto, T.; Muto, H. Effects of Interaction between Filler and Resin on the Glass Transition and Dielectric Properties of Epoxy Resin Nanocomposites. IET Nanodielectr. 2019, 2, 92–96. [Google Scholar] [CrossRef]
- Mori, K.; Seki, T.; Hirai, N.; Ohki, Y. Terahertz absorption spectra of several polymer nanocomposites indicating polymer-filler interactions. AIP Adv. 2019, 9, 105109. [Google Scholar] [CrossRef]
- Nagase, E.; Iizuka, T.; Tatsumi, K.; Hirai, N.; Ohki, Y.; Yoshida, S.; Umemoto, T.; Muto, H. Filler-dependent Changes in Thermal, Dielectric, and Mechanical Properties of Epoxy Resin Nanocomposites. IEEJ Trans. Electr. Electron. Eng. 2020, 16, 15–20. [Google Scholar] [CrossRef]
- Pleşa, I.; Noţingher, P.V.; Stancu, C.; Wiesbrock, F.; Schlög, S. Polyethylene nanocomposites for power cable insulations. Polymers 2019, 11, 24. [Google Scholar] [CrossRef] [PubMed] [Green Version]
- Ohki, Y. Development of XLPE-insulated cable for high-voltage dc submarine transmission line (2) [News from Japn]. IEEE Electr. Insul. Mag. 2013, 29, 85–87. [Google Scholar] [CrossRef]
- Ohki, Y. Development of XLPE-insulated cable for high-voltage dc submarine transmission line (1) [News from Japn]. IEEE Electr. Insul. Mag. 2013, 29, 65–67. [Google Scholar] [CrossRef]
- Ohki, Y. World’s first dc 400-kV XLPE cable system [News from Japn]. IEEE Electr. Insul. Mag. 2020, 36, 50–52. [Google Scholar] [CrossRef]
- Ohki, Y. A new 250-kV HVDC XLPE cable system in Japan [News from Japn]. IEEE Electr. Insul. Mag. 2019, 35, 43–45. [Google Scholar] [CrossRef]
- Ohki, Y. Development of new nanocomposite-based enameled wire for inverter-fed motor coils [News from Japn]. IEEE Electr. Insul. Mag. 2013, 35, 71–74. [Google Scholar] [CrossRef]
- Kurimoto, M.; Yoshida, S.; Umemoto, T.; Mabuchi, T.; Muto, H. Breakdown Strength of TiO2/Epoxy Nanocomposites Using Centrifugation Agglomerate Removal. IEEE Trans. Dielectr. Electr. Insul. 2021, 28, 74–81. [Google Scholar] [CrossRef]
- Umemoto, T.; Yoshida, S.; Muto, H.; Kurimoto, M. Critical Agglomerate Size for Electrical Insulation Lifetime Extension of Epoxy/TiO2 Nanocomposite with a Void Defect. IEEE Trans. Dielectr. Electr. Insul. 2021, 28, 282–289. [Google Scholar] [CrossRef]
- Tohyama, K.; Iizuka, T.; Tatsumi, K.; Otake, Y.; Umemoto, T.; Mabuchi, T.; Muto, H. Electroluminescence of epoxy resin nanocomposite under AC high field. In Proceedings of the IEEE Conference on Electrical Insulation and Dielectric Phenomena, Richland, WA, USA, 20–23 October 2019; pp. 78–81. [Google Scholar] [CrossRef]
- Hayashizaka, N.; Kawasaki, K.; Yamashita, M.; Ebina, T.; Ishida, T.; Hattori, S. Electrical Insulating Resin Composition for Partial-Discharge Resistance. United States Patent Application Publication US20180201804A1, 19 July 2018. [Google Scholar]
- Matsuzoe, T.; Kita, N.; Nishigaki, Y.; Abe, T.; Kubo, T.; Nakano, Y.; Kozako, M.; Hikita, M.; Fujimoto, N.; Hayashizaka, N.; et al. Dielectric and Insulation Properties of Polyimide-based Boehmite Nanocomposite Material. In Proceedings of the 2019 IEEE Electrical Insulation Conference (EIC), Calgary, AB, Canada, 16–19 June 2019. [Google Scholar] [CrossRef]
- Lide, D.R. CRC Handbook of Chemistry and Physics, 74th ed.; CRC: Boca Raton, FL, USA, 1973; pp. 12–139. ISBN 0-8493-0474-1. [Google Scholar]
- Nagase, E.; Hirai, N.; Ohki, Y. Effects of Surface Treatment of Fillers on the Dielectric Properties of Polyimide Nanocomposites. In Proceedings of the IEEE 3rd International Conference Dielectrics, Online, 5–31 July 2020; pp. 197–200. [Google Scholar] [CrossRef]
- Tian, F.; Ohki, Y. Charge Transport and Electrode Polarization in Epoxy Resin at High Temperatures. J. Phys. D Appl. Phys. 2014, 47, 045311. [Google Scholar] [CrossRef]
- Fuse, N.; Sato, H.; Ohki, Y.; Tanaka, T. Effects of Nanofiller Loading on the Molecular Motion and Carrier Transport in Polyamide. IEEE Trans. Dielectr. Electr. Insul. 2009, 16, 524–530. [Google Scholar] [CrossRef]
- Li, X.; Masuzaki, Y.; Tian, F.; Ohki, Y. Space Charge Formation and Charge Transport in Epoxy Resin at Varied Temperatures. IEEJ Trans. Fundam. Mater. 2015, 135, 88–93. [Google Scholar] [CrossRef]
- Laghar, A.; Mabrouk, A.B.; Arous, M.; Boufi, S.; Kallel, A. Dielectric Properties of Nanocomposites Based on Cellulose Nanocrystals (CNCs) and Poly(styrene-co-2-ethyl hexylacrylate) Copolymer. Polymer 2017, 125, 76–89. [Google Scholar] [CrossRef]
- Yang, P.; Tian, F.; Ohki, Y. Dielectric properties of poly(ethylene terephthalate) and poly(ethylene 2,6-naphthalate). IEEE Trans. Dielectr. Electr. Insul. 2014, 21, 2310–2317. [Google Scholar] [CrossRef]
- Tian, F.; Ohki, Y. Electric Modulus, Powerful Tool for Analyzing Dielectric Behavior. IEEE Trans. Dielectr. Electr. Insul. 2014, 21, 929–931. [Google Scholar] [CrossRef]
- Katayama, J.; Ohki, Y.; Fuse, N.; Kozako, M.; Tanaka, T. Effects of nanofiller materials on the dielectric properties of epoxy nanocomposites. IEEE Trans. Dielectr. Electr. Insul. 2013, 20, 157–165. [Google Scholar] [CrossRef]
- Ulański, J.; Friedrich, K.; Boiteux, G.; Seytre, G. Evolution of ion mobility in cured epoxy-amine system as determined by time-of-flight method. J. Appl. Polym. Sci. 1997, 65, 1143–1150. [Google Scholar] [CrossRef]
Figure 1.
SEM images of fractured surfaces observed for seven kinds of NC samples.

Figure 2.
SEM-EDX mapping image indicating the abundance of Si, taken for sample AM20.

Figure 3.
Stress-strain curves measured in samples N (─), A10 (- - -), A20 (─), AM10 (- - -), AM20 (─), AE10 (- - -), and AE20 (─).
Figure 3.
Stress-strain curves measured in samples N (─), A10 (- - -), A20 (─), AM10 (- - -), AM20 (─), AE10 (- - -), and AE20 (─).

Figure 4.
Filler-content dependence of EAB and TS, measured in samples N (○), A10 (▽), A20 (▼), AM10 (△), AM20 (▲), AE10 (□), and AE20 (■). Note that several data overlap each other.
Figure 4.
Filler-content dependence of EAB and TS, measured in samples N (○), A10 (▽), A20 (▼), AM10 (△), AM20 (▲), AE10 (□), and AE20 (■). Note that several data overlap each other.

Figure 5.
Toughness measured in samples N (○), A10 (▽), A20 (▼), AM10 (△), AM20 (▲), AE10 (□), and AE20 (■). Note that several data overlap each other.
Figure 5.
Toughness measured in samples N (○), A10 (▽), A20 (▼), AM10 (△), AM20 (▲), AE10 (□), and AE20 (■). Note that several data overlap each other.

Figure 6.
Storage modulus (E′) and loss modulus (E″) spectra measured by DMA and Tg estimated from the spectra. (a) E′ and E″ spectra observed in samples N. (b) Glass transition temperature Tg of each sample.
Figure 6.
Storage modulus (E′) and loss modulus (E″) spectra measured by DMA and Tg estimated from the spectra. (a) E′ and E″ spectra observed in samples N. (b) Glass transition temperature Tg of each sample.

Figure 7.
Frequency spectra of the real part () and the imaginary part ( ) of complex permittivity, observed for samples N (a), A10 (b), A20 (c), AM10 (d), AM20 (e), AE10 (f), and AE20 (g) at 25 (○), 50 (●), 100 (△), 150 (▲), 200 (□), 250 (■), 300 (▽), 350 (▼), and 400 (♢) °C. Note that several data overlap each other.

Figure 8.
Conductivity of the samples N (○), A10 (▽), A20 (▼), AM10 (△), AM20 (▲), AE10 (□), and AE20 (■) as a function of measurement temperature, calculated based on shown in Figure 7 and Equation (2). Note that several data overlap each other.
Figure 8.
Conductivity of the samples N (○), A10 (▽), A20 (▼), AM10 (△), AM20 (▲), AE10 (□), and AE20 (■) as a function of measurement temperature, calculated based on shown in Figure 7 and Equation (2). Note that several data overlap each other.

Figure 9.
Frequency spectra of imaginary part () of the complex electric modulus observed for N (a), A10 (b), A20 (c), AM10 (d), AM20 (e), AE10 (f), and AE20 (g) at 25 (○), 50 (●), 100 (△), 150 (▲), 200 (□), 250 (■), 300 (▽), 350 (▼), and 400 (♢) °C. Note that several data overlap each other.
Figure 9.
Frequency spectra of imaginary part () of the complex electric modulus observed for N (a), A10 (b), A20 (c), AM10 (d), AM20 (e), AE10 (f), and AE20 (g) at 25 (○), 50 (●), 100 (△), 150 (▲), 200 (□), 250 (■), 300 (▽), 350 (▼), and 400 (♢) °C. Note that several data overlap each other.

Figure 10.
Peak frequency of , as a function of measurement temperature, observed for samples N (○), A10 (▽), A20 (▼), AM10 (△), AM20 (▲), AE10 (□), and AE20 (■). Note that several data overlap each other.
Figure 10.
Peak frequency of , as a function of measurement temperature, observed for samples N (○), A10 (▽), A20 (▼), AM10 (△), AM20 (▲), AE10 (□), and AE20 (■). Note that several data overlap each other.

Figure 11.
Maxima, minima, and averages of the thermal conductivity measured in the samples N (○), A10 (▽), A20 (▼), AM10 (△), AM20 (▲), AE10 (□), and AE20 (■). Note that the maximum and minimum are very close in some samples and within each average symbol.
Figure 11.
Maxima, minima, and averages of the thermal conductivity measured in the samples N (○), A10 (▽), A20 (▼), AM10 (△), AM20 (▲), AE10 (□), and AE20 (■). Note that the maximum and minimum are very close in some samples and within each average symbol.


Table 1.
Details of samples and their fillers.
| Sample Name | Symbol | Curve | Filler Content (wt%) Boehmite Alumina | Surface Treatment | Particle Size (nm) |
|---|---|---|---|---|---|
| N | ○ | ─ | 0 | ― | ― |
| A10 | ▽ | - - - | 10 | ― | 10 × 50 |
| A20 | ▼ | ─ | 20 | ||
| AM10 | △ | - - - | 10 | Methacrylic silane coupling agent | 20 |
| AM20 | ▲ | ─ | 20 | ||
| AE10 | □ | - - - | 10 | Epoxy silane coupling agent | 10 × 50 |
| AE20 | ■ | ─ | 20 |
The symbol colors and lines do not apply for Figures 1, 2, 6a, 7 and 9.
Publisher’s Note: MDPI stays neutral with regard to jurisdictional claims in published maps and institutional affiliations. |
© 2021 by the authors. Licensee MDPI, Basel, Switzerland. This article is an open access article distributed under the terms and conditions of the Creative Commons Attribution (CC BY) license (https://creativecommons.org/licenses/by/4.0/).
Share and Cite
MDPI and ACS Style
Ohki, Y.; Hirai, N. Effects of Resin/Filler Adhesion on the Thermal and Electrical Conductivity of Polyimide Nanocomposites. J. Compos. Sci. 2021, 5, 272. https://0-doi-org.brum.beds.ac.uk/10.3390/jcs5100272
AMA Style
Ohki Y, Hirai N. Effects of Resin/Filler Adhesion on the Thermal and Electrical Conductivity of Polyimide Nanocomposites. Journal of Composites Science. 2021; 5(10):272. https://0-doi-org.brum.beds.ac.uk/10.3390/jcs5100272
Chicago/Turabian StyleOhki, Yoshimichi, and Naoshi Hirai. 2021. "Effects of Resin/Filler Adhesion on the Thermal and Electrical Conductivity of Polyimide Nanocomposites" Journal of Composites Science 5, no. 10: 272. https://0-doi-org.brum.beds.ac.uk/10.3390/jcs5100272