Article

3D Printed Hierarchical Honeycombs with Carbon Fiber and Carbon Nanotube Reinforced Acrylonitrile Butadiene Styrene

by
Michel Theodor Mansour
1,
Konstantinos Tsongas
2 and
Dimitrios Tzetzis
3,*
1
School of Production Engineering and Management, Technical University of Crete, 73100 Chania, Greece
2
Department of Mechanical Engineering, Aristotle University of Thessaloniki, 54124 Thessaloniki, Greece
3
School of Science and Technology, International Hellenic University, 14km Thessaloniki—N. Moudania, 57001 Thermi, Greece
*
Author to whom correspondence should be addressed.
Submission received: 31 January 2021 / Revised: 17 February 2021 / Accepted: 19 February 2021 / Published: 21 February 2021
(This article belongs to the Special Issue 3D Printing Composites)

Abstract

:
The mechanical properties of Fused Filament Fabrication (FFF) 3D printed specimens of acrylonitrile butadiene styrene (ABS), ABS reinforced with carbon fibers (ABS/CFs) and ABS reinforced with carbon nanotubes (ABS/CNTs) are investigated in this paper using various experimental tests. In particular, the mechanical performance of the fabricated specimens was determined by conducting compression and cyclic compression testing, as well as nanoindentation tests. In addition, the design and the manufacturing of hierarchical honeycomb structures are presented using the materials under study. The 3D printed honeycomb structures were examined by uniaxial compressive tests to review the mechanical behavior of such cellular structures. The compressive performance of the hierarchical honeycomb structures was also evaluated with finite element analysis (FEA) in order to extract the stress-strain response of these structures. The results revealed that the 2nd order hierarchy displayed increased stiffness and strength as compared with the 0th and the 1st hierarchies. Furthermore, the addition of carbon fibers in the ABS matrix improved the stiffness, the strength and the hardness of the FFF printed specimens as well as the compression performance of the honeycomb structures.

1. Introduction

Nowadays, additive manufacturing (AM)/3D printing processes are gathering great momentum throughout the world. Over the last few years, 3D printing has developed speedily and significantly and can now perform critical roles in various manufacturing fields, such as the automotive industry, the construction industry, aerospace, computers and robotics, medicine and many others. There has been a lot of hype over the last decade when mentioning the potentials that can be accomplished by adopting 3D printing as one of the main manufacturing technologies, and this terrific achievement could be attributed primarily to the outstanding capability of directly fabricating intricate components without exceptional instruments to significantly reduce material waste, and due to the reduction in the cost and time of fabrication for pioneering products and small quantity productions [1].
Thermoplastic polymers have been generally utilized in additive manufacturing by one of the most widespread 3D printing methods, which is Fused Filament Fabrication (FFF). FFF is an extrusion procedure where the object is developed by depositing melted material layer upon layer on the build-plate of the 3D printer [2]. The vast majority of the thermoplastics used in FFF 3D printing machines are ordinary and affordable printing materials such as polymers, including ABS (acrylonitrile butadiene styrene), PLA (polylactic acid), PETG (polyethylene terephthalate glycol-modified) and Nylon (also known as polyamide), each one with particular material specifications [1,2,3,4]. For instance, polymers such as ABS, PLA and Nylon have bulk strengths between 30 and 100 MPa and E-moduli between 1.3 and 3.6 GPa, while these values have been critically reduced in 3D printed parts [5]. However, composite and nanocomposite filaments have been introduced recently in 3D printing procedures, and pioneer materials are now manufactured reinforced with additives with exceptional mechanical properties [6,7]. The FFF technique exploits such pioneer materials fabricated by mixing the matrix material with additives in precise concentrations. Specifically, short carbon fibers have been combined with unfilled thermoplastics to enhance the performance of the base polymer and, as a consequence, to potentially improve the mechanical properties of the printed parts. For example, Ning et al. [8] conducted experiments to examine the mechanical behavior of ABS 3D printed specimens reinforced with 0–15% carbon fiber contents. The results demonstrated that the incorporation of carbon fibers in the ABS polymer matrix increased the Young’s modulus of the printed specimens up to 31.6%, the tensile strength up to 22%, and the bending strength up to 11.8%. In this study, the peak of the average tensile strength was at 5% of fiber weight content. Another study from Love et al. [9] showed that ABS filaments reinforced with carbon fibers significantly increased the strength and the stiffness of FFF printed parts. The composite samples showed 70.69 MPa of tensile strength while the stiffness was 8.91 GPa, as compared to 29.31 MPa and 2.05 GPa from unfilled ABS tensile samples. Moreover, they introduced the fact that the incorporation of carbon fibers in the base polymer reduced the deformation of the printed ABS parts. This was partially attributed to the improved thermal conductivity as compared to unfilled ABS. Additionally, Tekinalp et al. [10] conducted tensile experiments with an ABS filament reinforced with carbon fiber at various fiber weight contents. The carbon fiber filled ABS filament displayed an enhancement in tensile modulus and tensile strength, which was equal to 700% and 115%, respectively, while they showed that the FFF process induced high fiber alignment along the direction of the print path. Shofner et al. [11] developed composites of ABS polymer matrix reinforced with nano-fiber through the FFF method. Feedstock filaments consisted of single-walled carbon nanotubes and ABS plastics. The results showed that there was an increase of nearly 40% and 60% in tensile strength and tensile modulus, respectively, at a nano-fiber loading of 10 wt%, as compared to unfilled ABS samples. Yang et al. [12] fabricated composite samples using ABS reinforced with 10 wt% continuous carbon fiber (CCF) through the 3D printing method. These samples improved their flexural strength and tensile strength to 127 MPa and 147 MPa, respectively, in comparison with unfilled ABS samples. In addition, Zhong et al. [13] investigated the mechanical performance of an ABS filament reinforced with three different glass fiber contents. The outcomes disclosed that the addition of glass fibers in the polymer matrix could significantly enhance the tensile strength and surface rigidity of the ABS filament.
The combination of composite materials with 3D printing techniques allows for the fabrication of novel structures with advanced design features based on hierarchical orders. In nature, structures of nanometer to macroscopic length scales are often hierarchically organized, offering inspiring designs [3,4,14]. These structures usually show complex hierarchical order, and every level of hierarchy contributes to the mechanical steadiness and robustness of the resulting design [14,15]. There are numerous cases that confirm the great significance and requirement of hierarchy, varying from polymers with micro and nano level hierarchical structures [16] to sandwich plates with foams or composite lattice structures as cores. In such circumstances, a hierarchical structure can provide outstanding mechanical tailorable properties. More specifically, the various unit cell lengths and levels of hierarchy govern the mechanical performance of these cellular structures. Increasing the levels of hierarchy leads to structures with improved mechanical behavior while being lightweight. In general, honeycomb structures have been utilized in various fields, such as the automotive industry, the aerospace industry, architecture, biomedicine and specifically in several applications containing structural protection, impact energy absorption, thermal insulation, as well as the core of lightweight sandwich panels [17]. The bending deformation of cell walls and the relative density of the honeycombs greatly affect the in-plane stiffness and strength of these cellular structures [3,4,18]. For such structures and under uniform transverse loading, the maximum bending moment in each cell wall occurs at the honeycomb vertices (i.e., cell wall corners); therefore, shifting material from the middle part of each wall closer to the vertices can potentially enhance the transverse stiffness and strength [3,4,19].
The objective of the present study was to investigate the mechanical properties of ABS filaments reinforced with carbon fibers (ABS/CFs) and carbon nanotubes (ABS/CNTs), as well as to design and fabricate hierarchical honeycomb structures using such ABS composite filaments. Initially, the fabricated specimens were characterized by compression tests, cyclic compression tests and nanoindentation tests in order to verify the mechanical performance of the materials under study. Then, 3D printed honeycomb structures were fabricated and examined by uniaxial compression tests assisted and compared with predictions from finite element analysis (FEA).

2. Materials and Test Methods

2.1. Materials and Manufacturing of FFF Printed Specimens

The materials under investigation were supplied by 3DXTECH, USA. In particular, the materials that have been used in the current paper are acrylonitrile butadiene styrene (ABS), which was reinforced with carbon fibers (denoted as ABS/CFs) in a weight percentage of 15%, and acrylonitrile butadiene styrene reinforced with carbon nanotubes (denoted as ABS/CNTs), whose weight percentage was proprietary information, not revealed from the producer. The production of FFF printed specimens was accomplished by using a commercial open source Ultimaker 2+ 3D printer through the FFF printing technique with a 2.85 mm extrusion nozzle and utilizing the Cura software. In the current study, the specimens were cylindrical, with a diameter of 29 mm as well as a height of 12.5 mm. For the whole samples, four layers were printed on the perimeter to form the exterior shell, which is representative in FFF prints. Moreover, the basic printing parameters were printing temperature and build-plate temperature of 240 °C and 100 °C, respectively, as well as a printing speed of 35 mm/s. Additionally, all samples were manufactured in room temperature conditions.

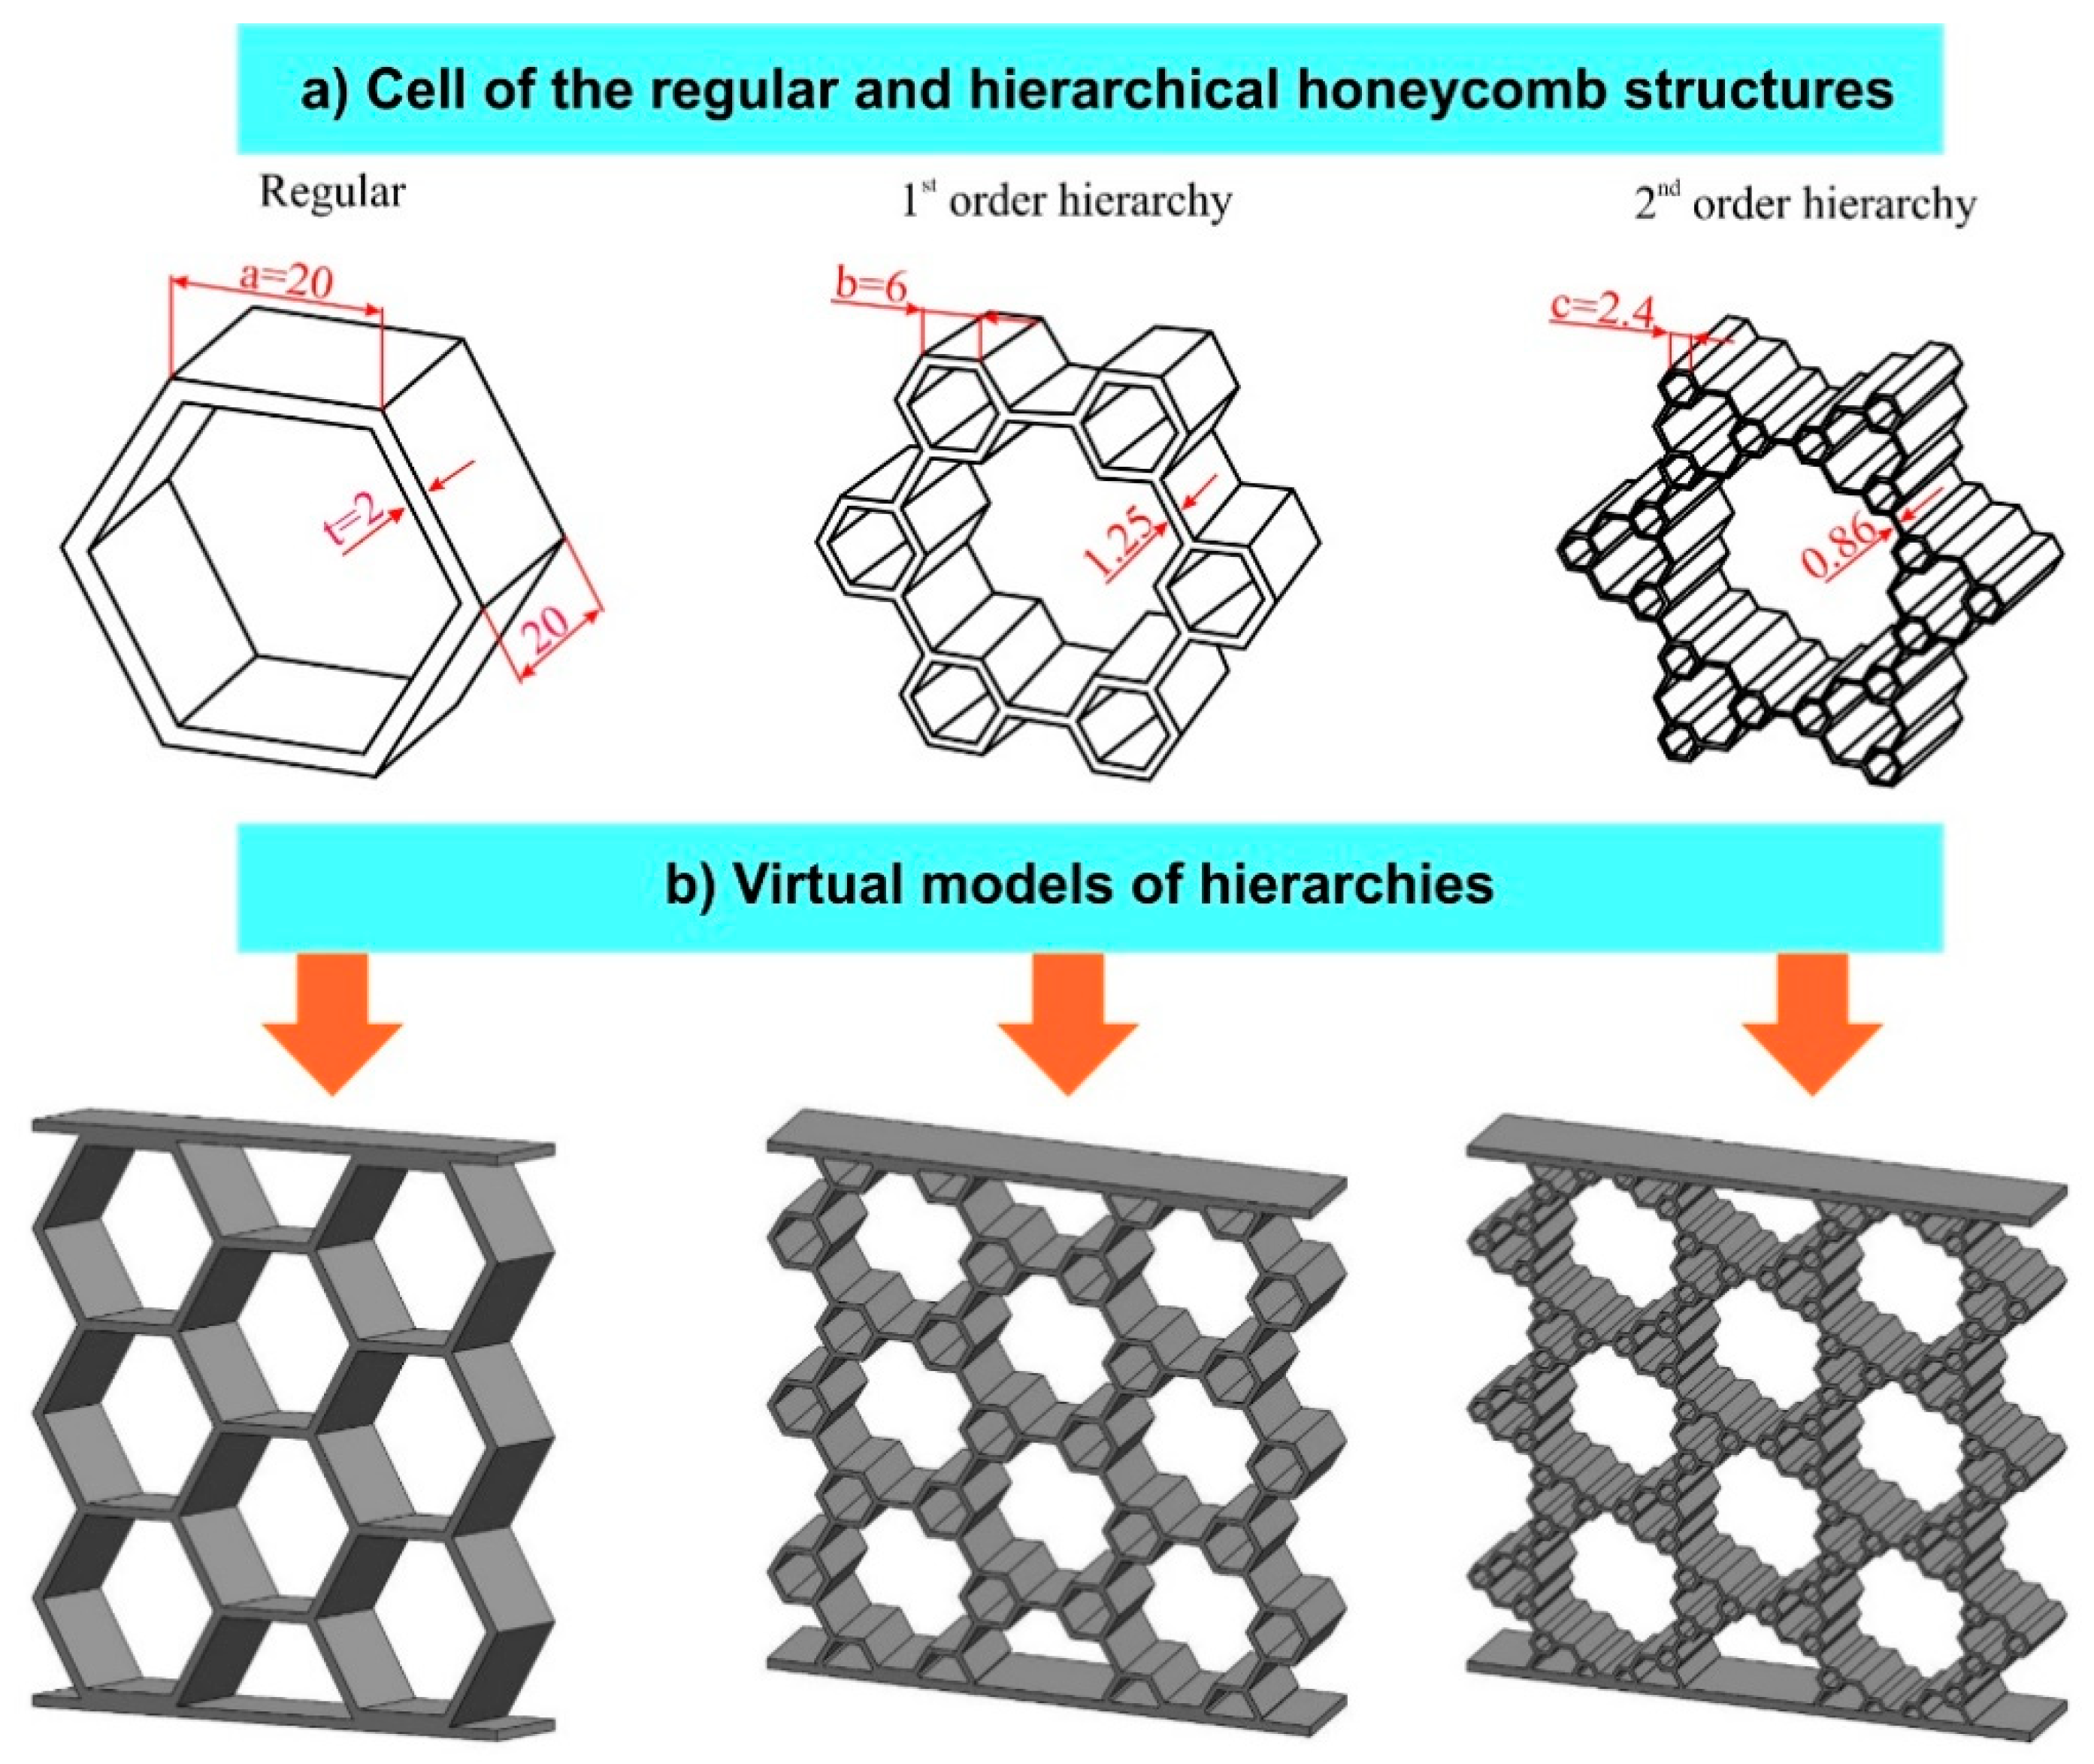
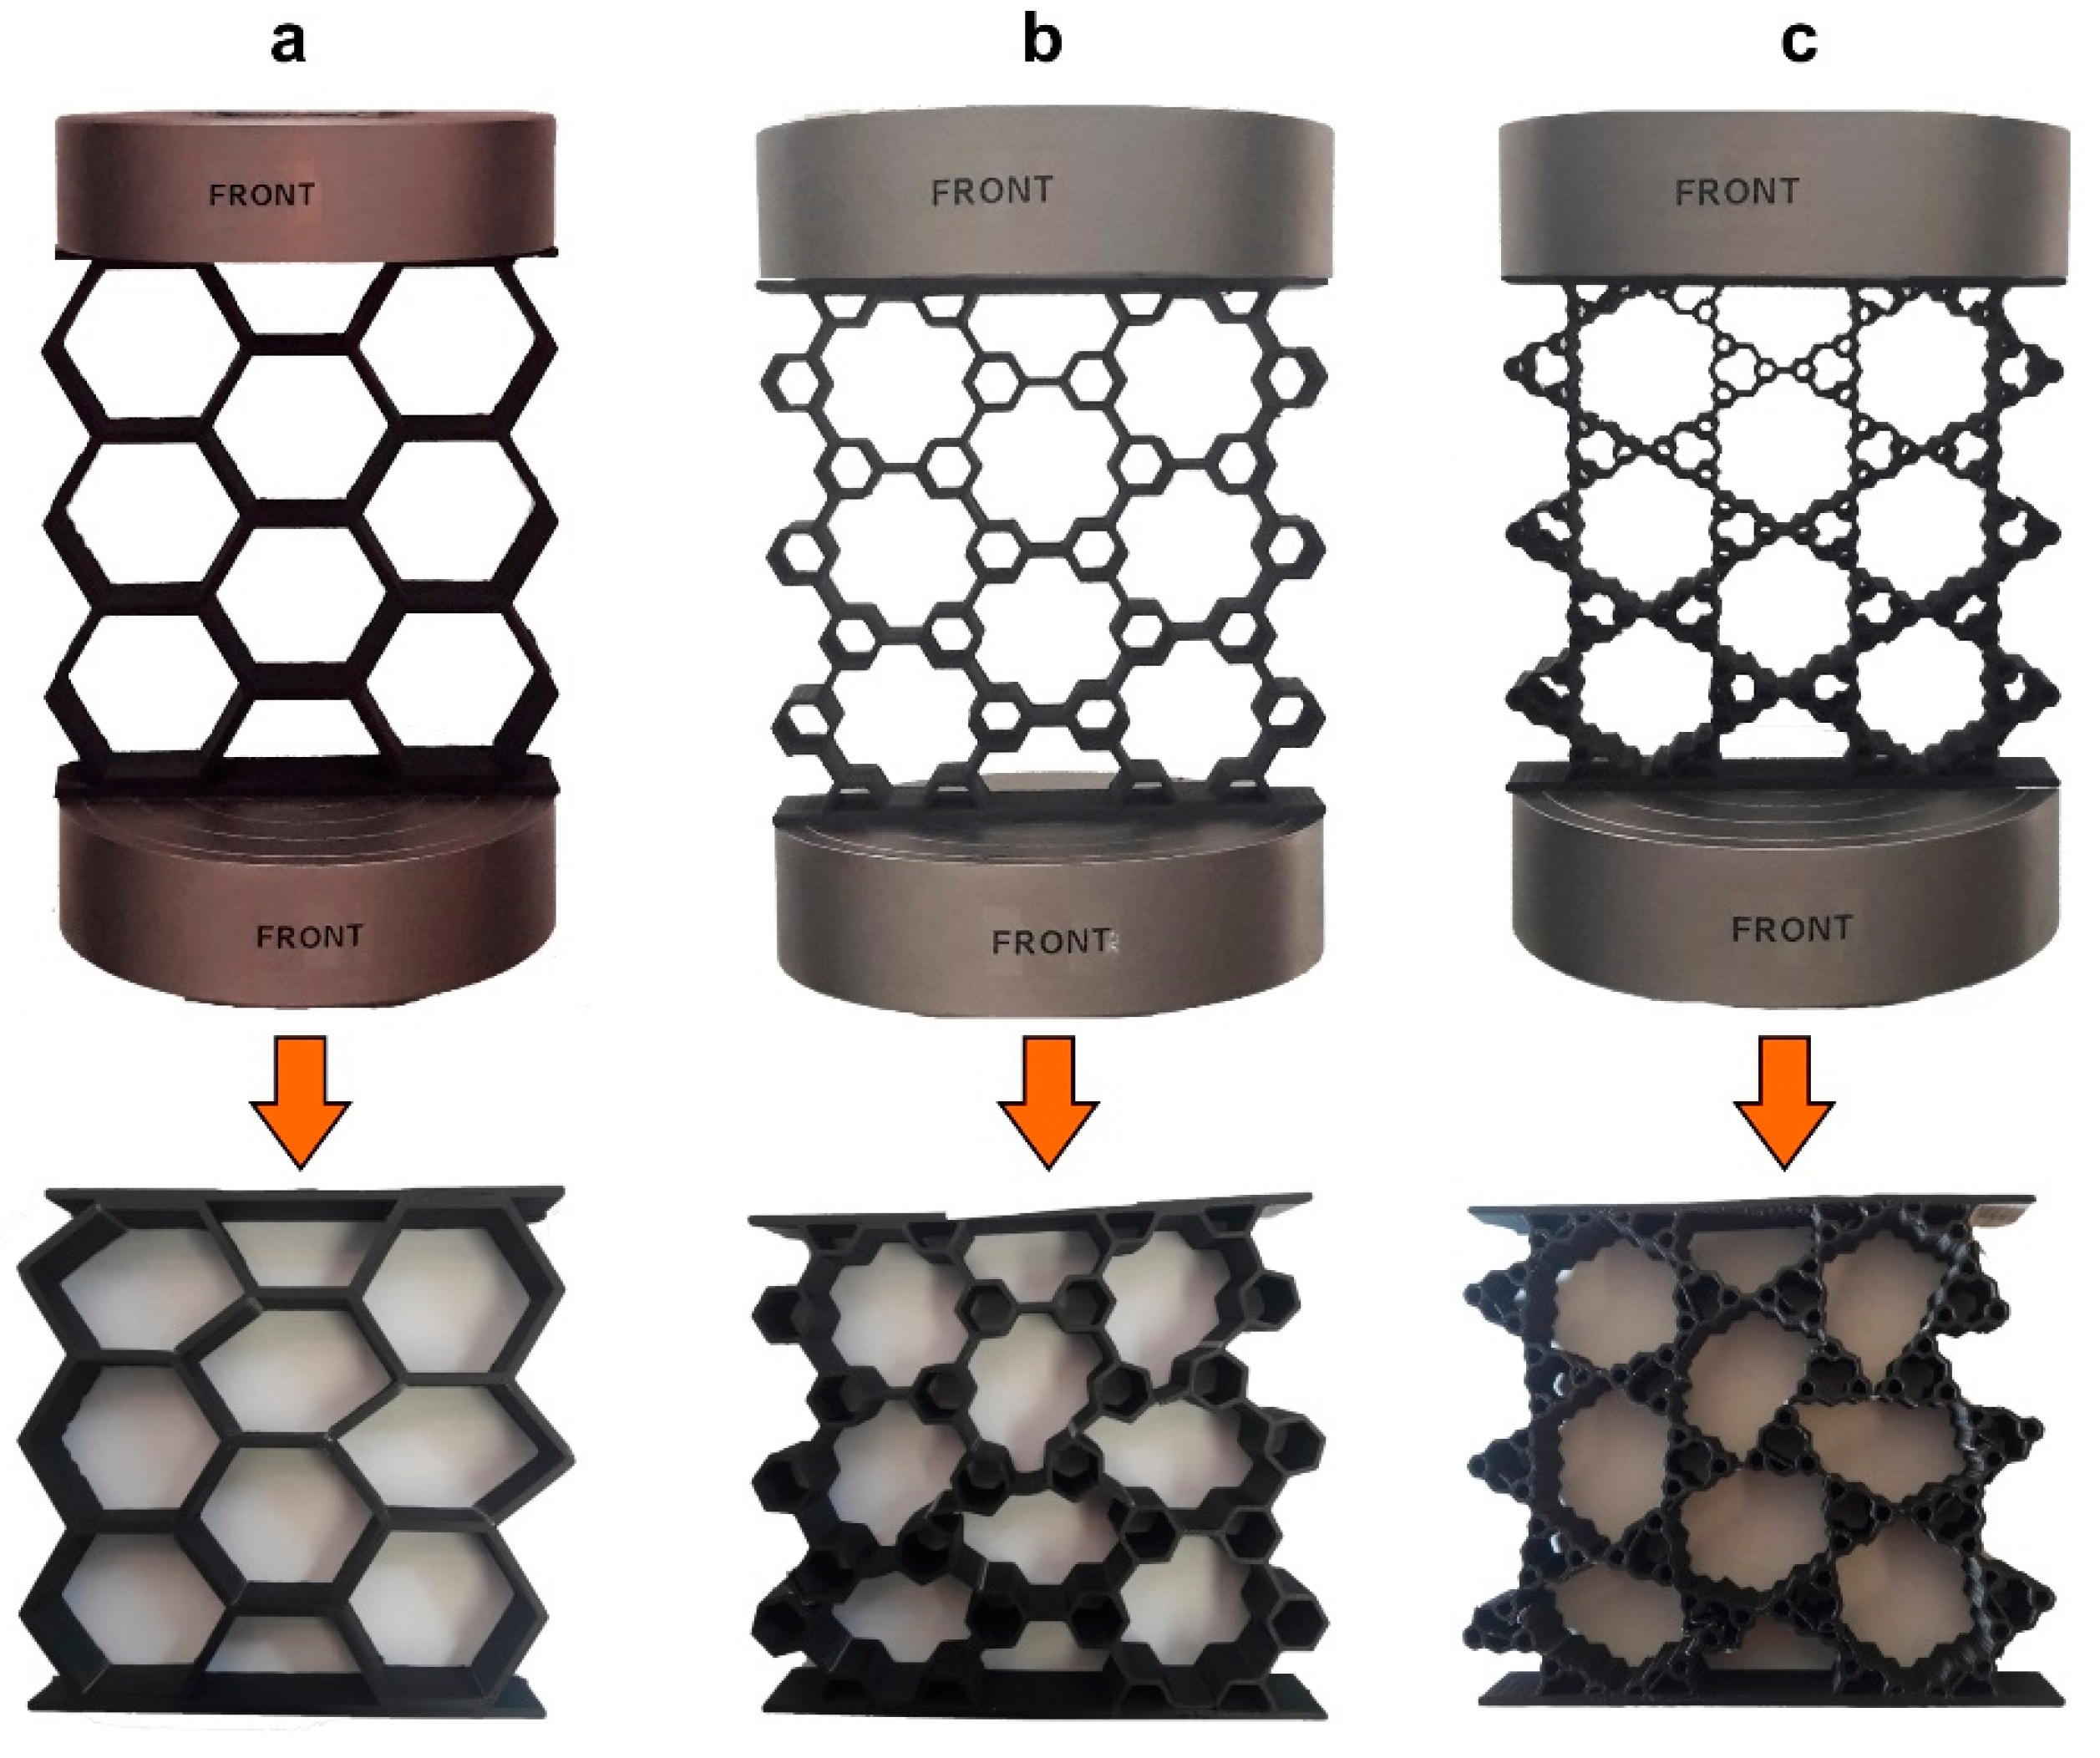
2.2. Design and Fabrication of FFF Printed Honeycomb Structures

In the current investigation, the vertices of a regular hexagonal lattice structure were replaced with smaller hexagons to attain level one hierarchy in the final shape of the structure. At the same time, the thickness of the honeycomb’s walls was reduced in order to maintain the overall density. Higher hierarchies demonstrate increased strength and stiffness compared to their regular hexagonal counterpart with equal relative density. Based on this approach, fractal appearing honeycombs can be accomplished with higher levels of structural hierarchy, if this replacement procedure for three-edge vertices is repeated. Figure 1a illustrates the cell of the regular and hierarchical honeycombs. The structural organization of the honeycomb for each level of hierarchy can be defined as the ratio of the introduced hexagonal edge length ( b for the 1st level of hierarchy and c for the 2nd level of hierarchy) to the regular hexagonal edge length, a , as described in Figure 1a, i.e., γ 1   = b / a and γ 2   = c / a [19]. For a 1st order honeycomb structure, 0 b a / 2 and, thus, 0 γ 1   0.5 . Where γ 1   = 0 , it denotes a regular honeycomb. For a 2nd order honeycomb structure, two geometrical constraints are introduced, 0 c b and c a / 2 b . In terms of the ratio parameters, the constraints are 0 γ 2   γ 1 if γ 1   0.25 and 0 γ 2   ( 0.5 γ 1 ) if 0.25 γ 1   0.50 . The dimensionless relative density can be calculated in terms of t / a
ρ = 2 3   × ( 1 + 2 γ 1 + 6 γ 2 ) × t a
where t is the cell wall thickness. For different values of γ 1 , γ 2 the relative density can be calculated, especially in the case where γ 2 ,   γ 1   = 0 can be related directly to the thickness and the original hexagon’s edge length. Thus, for regular honeycomb, the relative density can be calculated by ρ = 2 3   × t a , for first order hierarchy honeycomb, ρ = 2 3   × ( 1 + 2 γ 1 ) × t a and lastly for honeycomb with second order hierarchy, ρ = 2 3   × ( 1 + 2 γ 1 + 6 γ 2 ) × t a . This relation clearly presents that t / a must be reduced to maintain fixed relative density as γ 1 , γ 2 are increased.
The fabrication of hierarchical honeycomb structures was achieved as well as the 3D printed specimens by using an Ultimaker 2+ 3D printer through the FFF printing technique with a 2.85 mm extrusion nozzle and utilizing Cura software for precisely adjusting the printed honeycomb structures, as shown in Figure 1b. In particular, the basic 3D printing parameters of FFF printed structures were a deposition line (layer) height of 0.28 mm, a deposition line width of 0.56 mm, a printing temperature and a build-plate temperature of 240 °C and 100 °C, respectively, and also a printing speed of 35 mm/s. The extrusion head speed was kept constant in order to avoid any variabilities on the 3D printed parts and, additionally, all specimens were 3D printed in room temperature conditions. All honeycomb structures shown in Figure 1b had a constant relative density ρ = 0.12. The hexagon’s edge length of the regular honeycomb was a = 20 mm, and the thickness of the cell wall was measured as t = 2 mm. The 1st order of honeycomb structures had γ1 = 0.3 and t = 1.25 mm, and in the same way the honeycomb structure with 2nd order hierarchy had γ1 = 0.3, γ2 = 0.12 and t = 0.86 mm. In addition, the cell wall thickness was reduced with the increase in the level of hierarchy in order to maintain the overall relative density constant. These geometrical attributes were kept similar for the FEA simulations undertaken in the following sections.

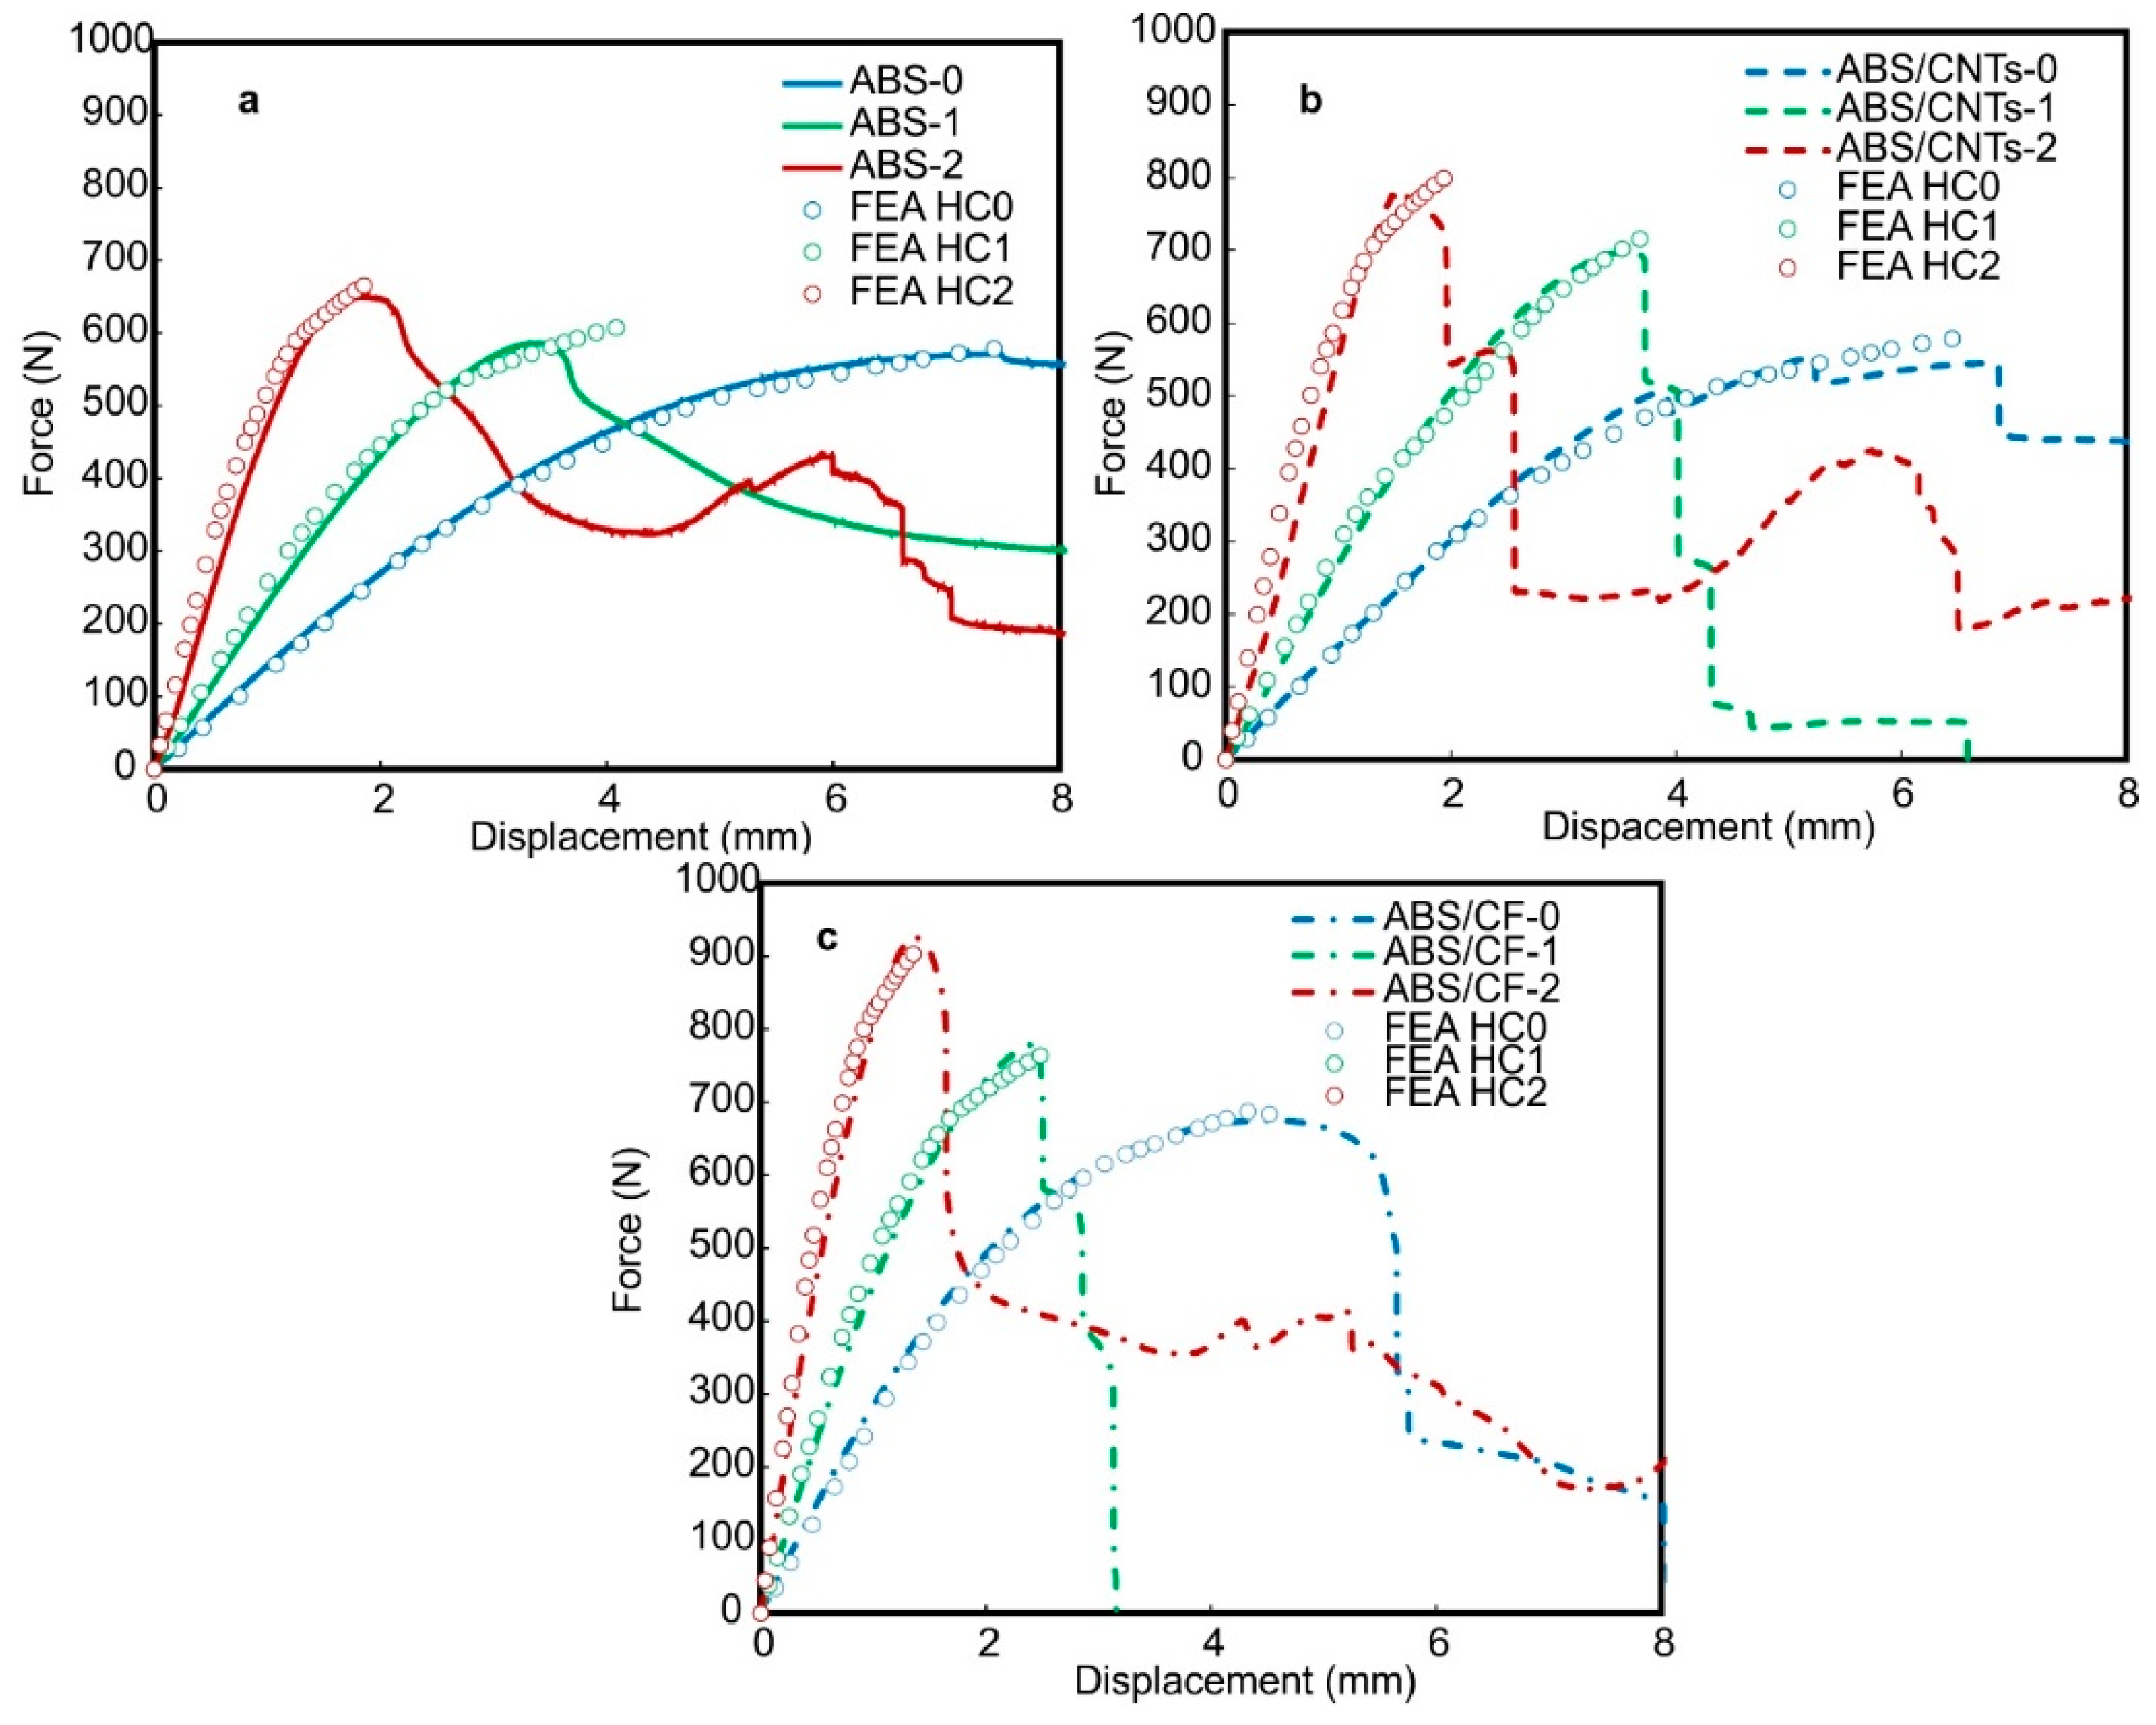
2.3. Compression Experiments Assisted by FEA

The compressive performance of the 3D printed specimens was examined by a universal mechanical testing machine (Testometric, UK) equipped with a 50 kN load cell. The 3D printed composites and nanocomposite specimens were compressed between the plate of the load cell and a hardened steel compression plate. The 3D printed specimens were positioned between the moving platen and fixed platen of the test apparatus. In addition, the specimens were tested at a strain rate of 5 mm/min. The stress–strain test was repeated five times for ABS, ABS/CF and ABS/CNT specimens, respectively.
In the same way, the compressive behavior of the FFF hierarchical honeycomb constructs was investigated using the same experimental setup as described previously for the 3D printed composite cylindrical specimens. Furthermore, the strain rate was constant at 5 mm/min and at least three specimens were examined for the same level of hierarchy. After experimentation, there was a calculation of the load-displacement curves so as to directly be in comparison with the computer generated data from the FEA. ANSYS™ software was used for the finite element analysis, and a static structural module was selected to simulate the static loading.

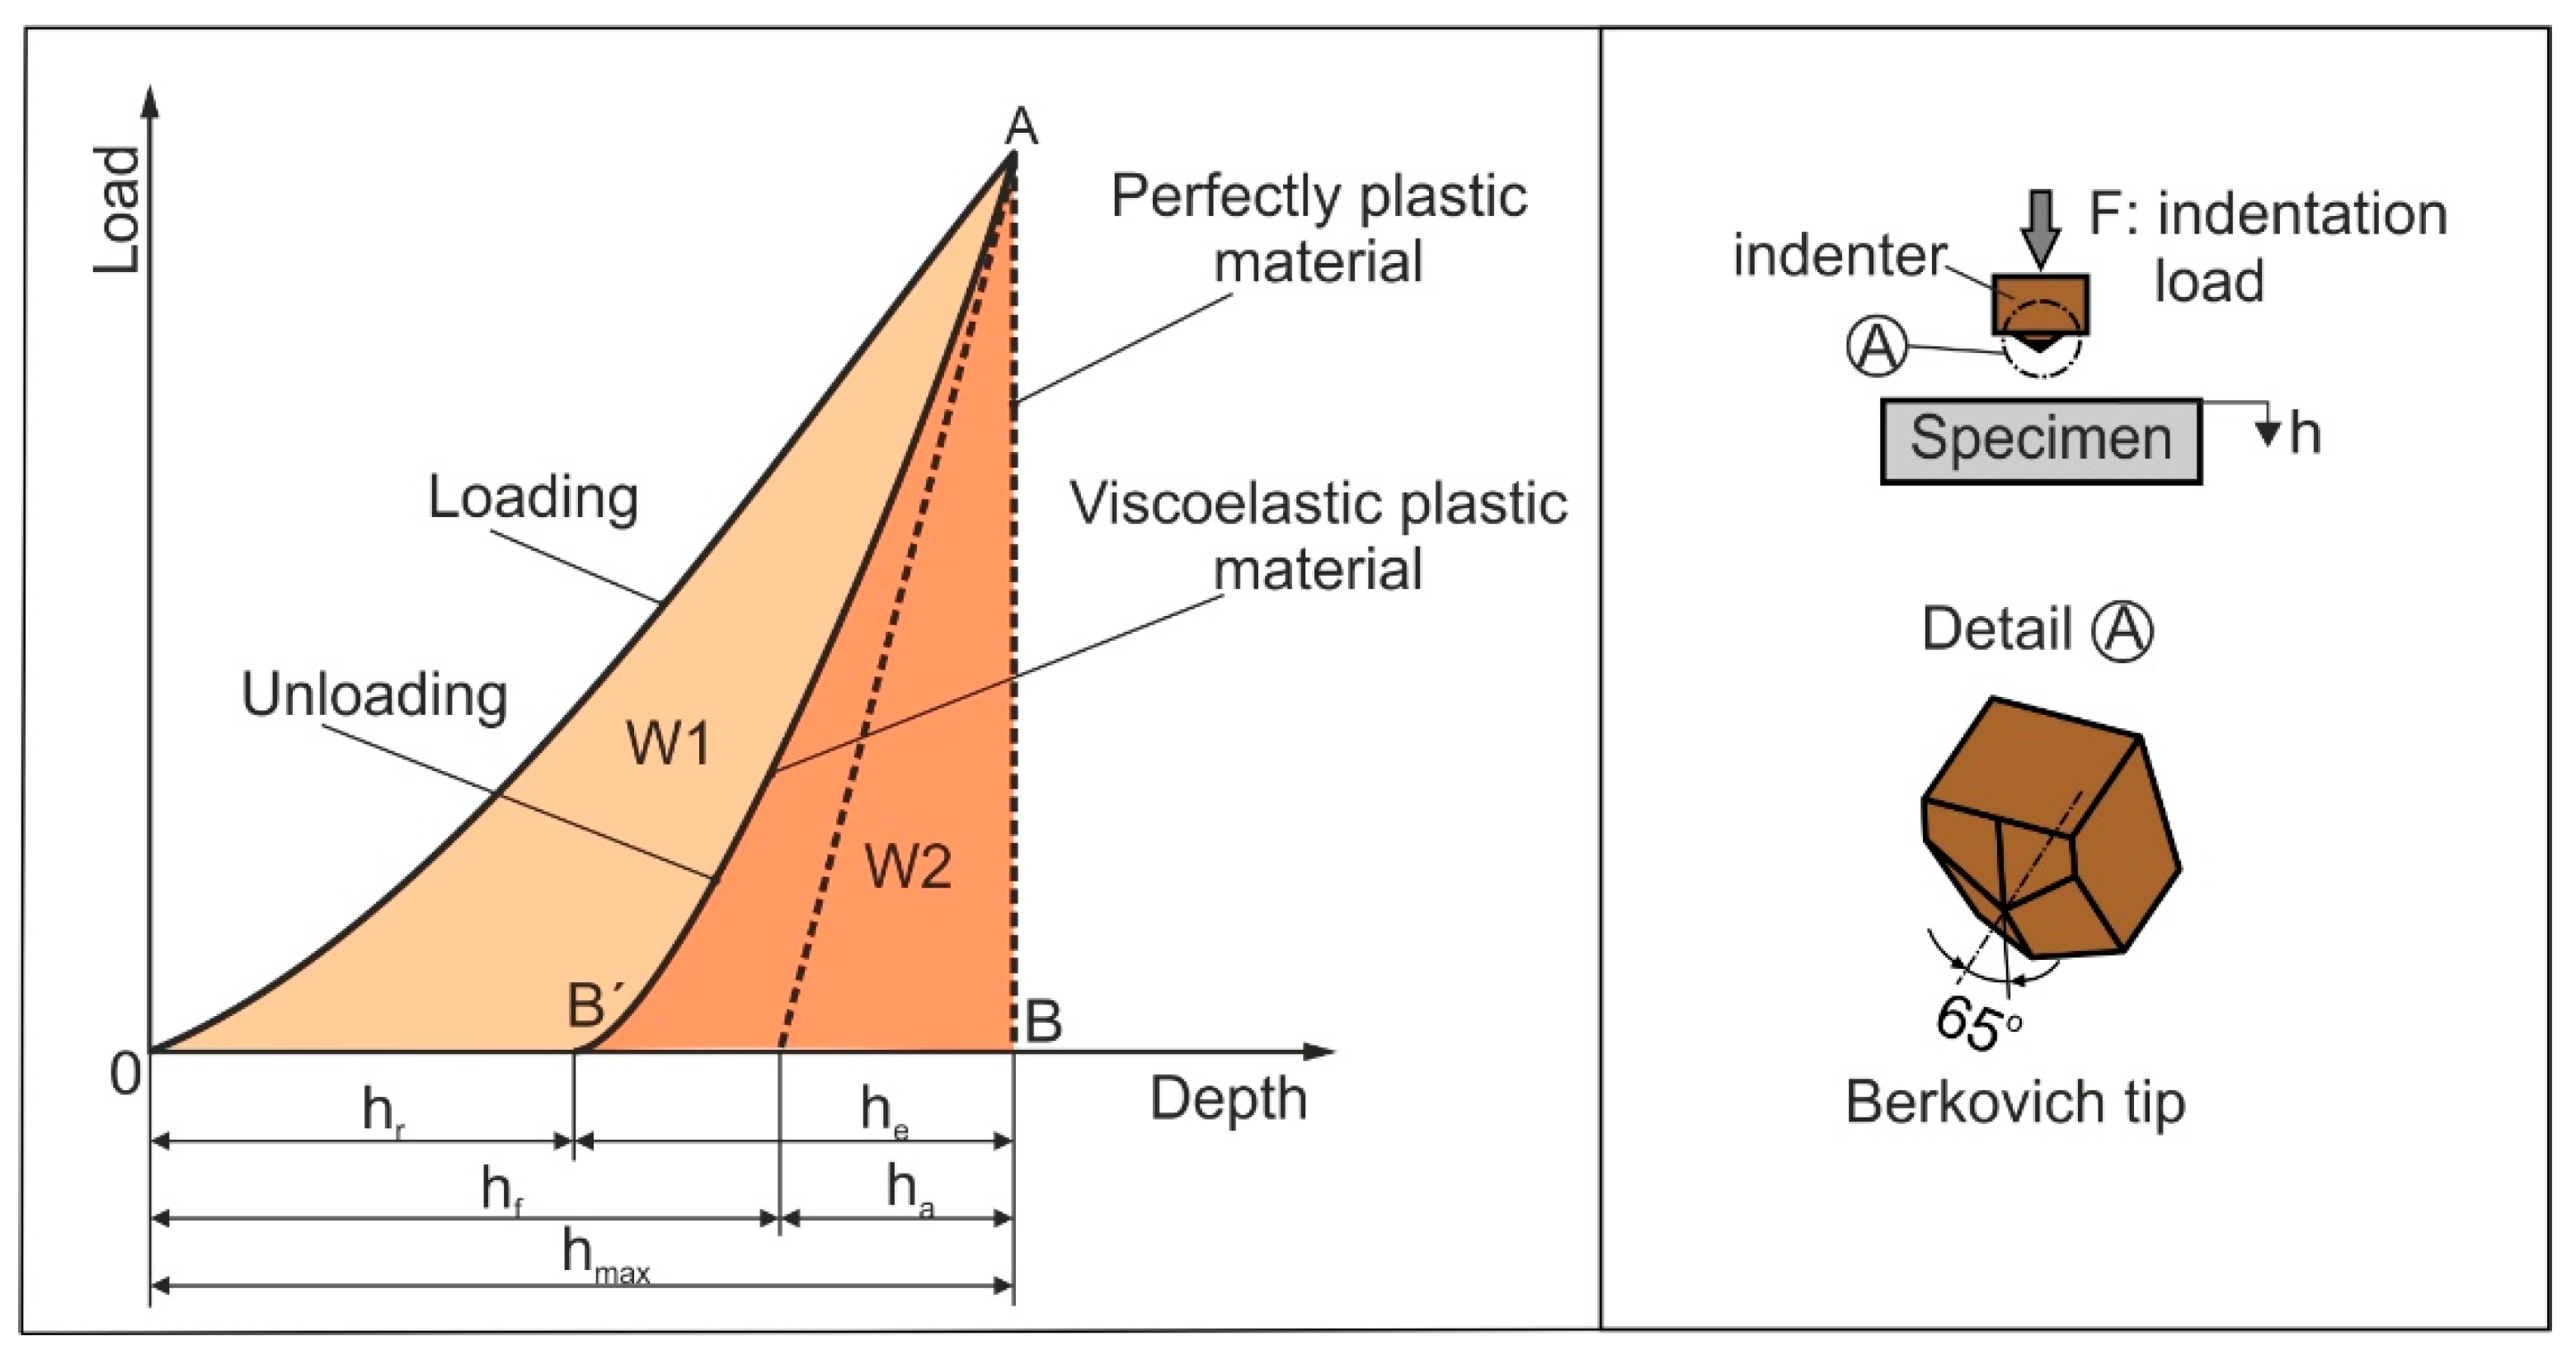
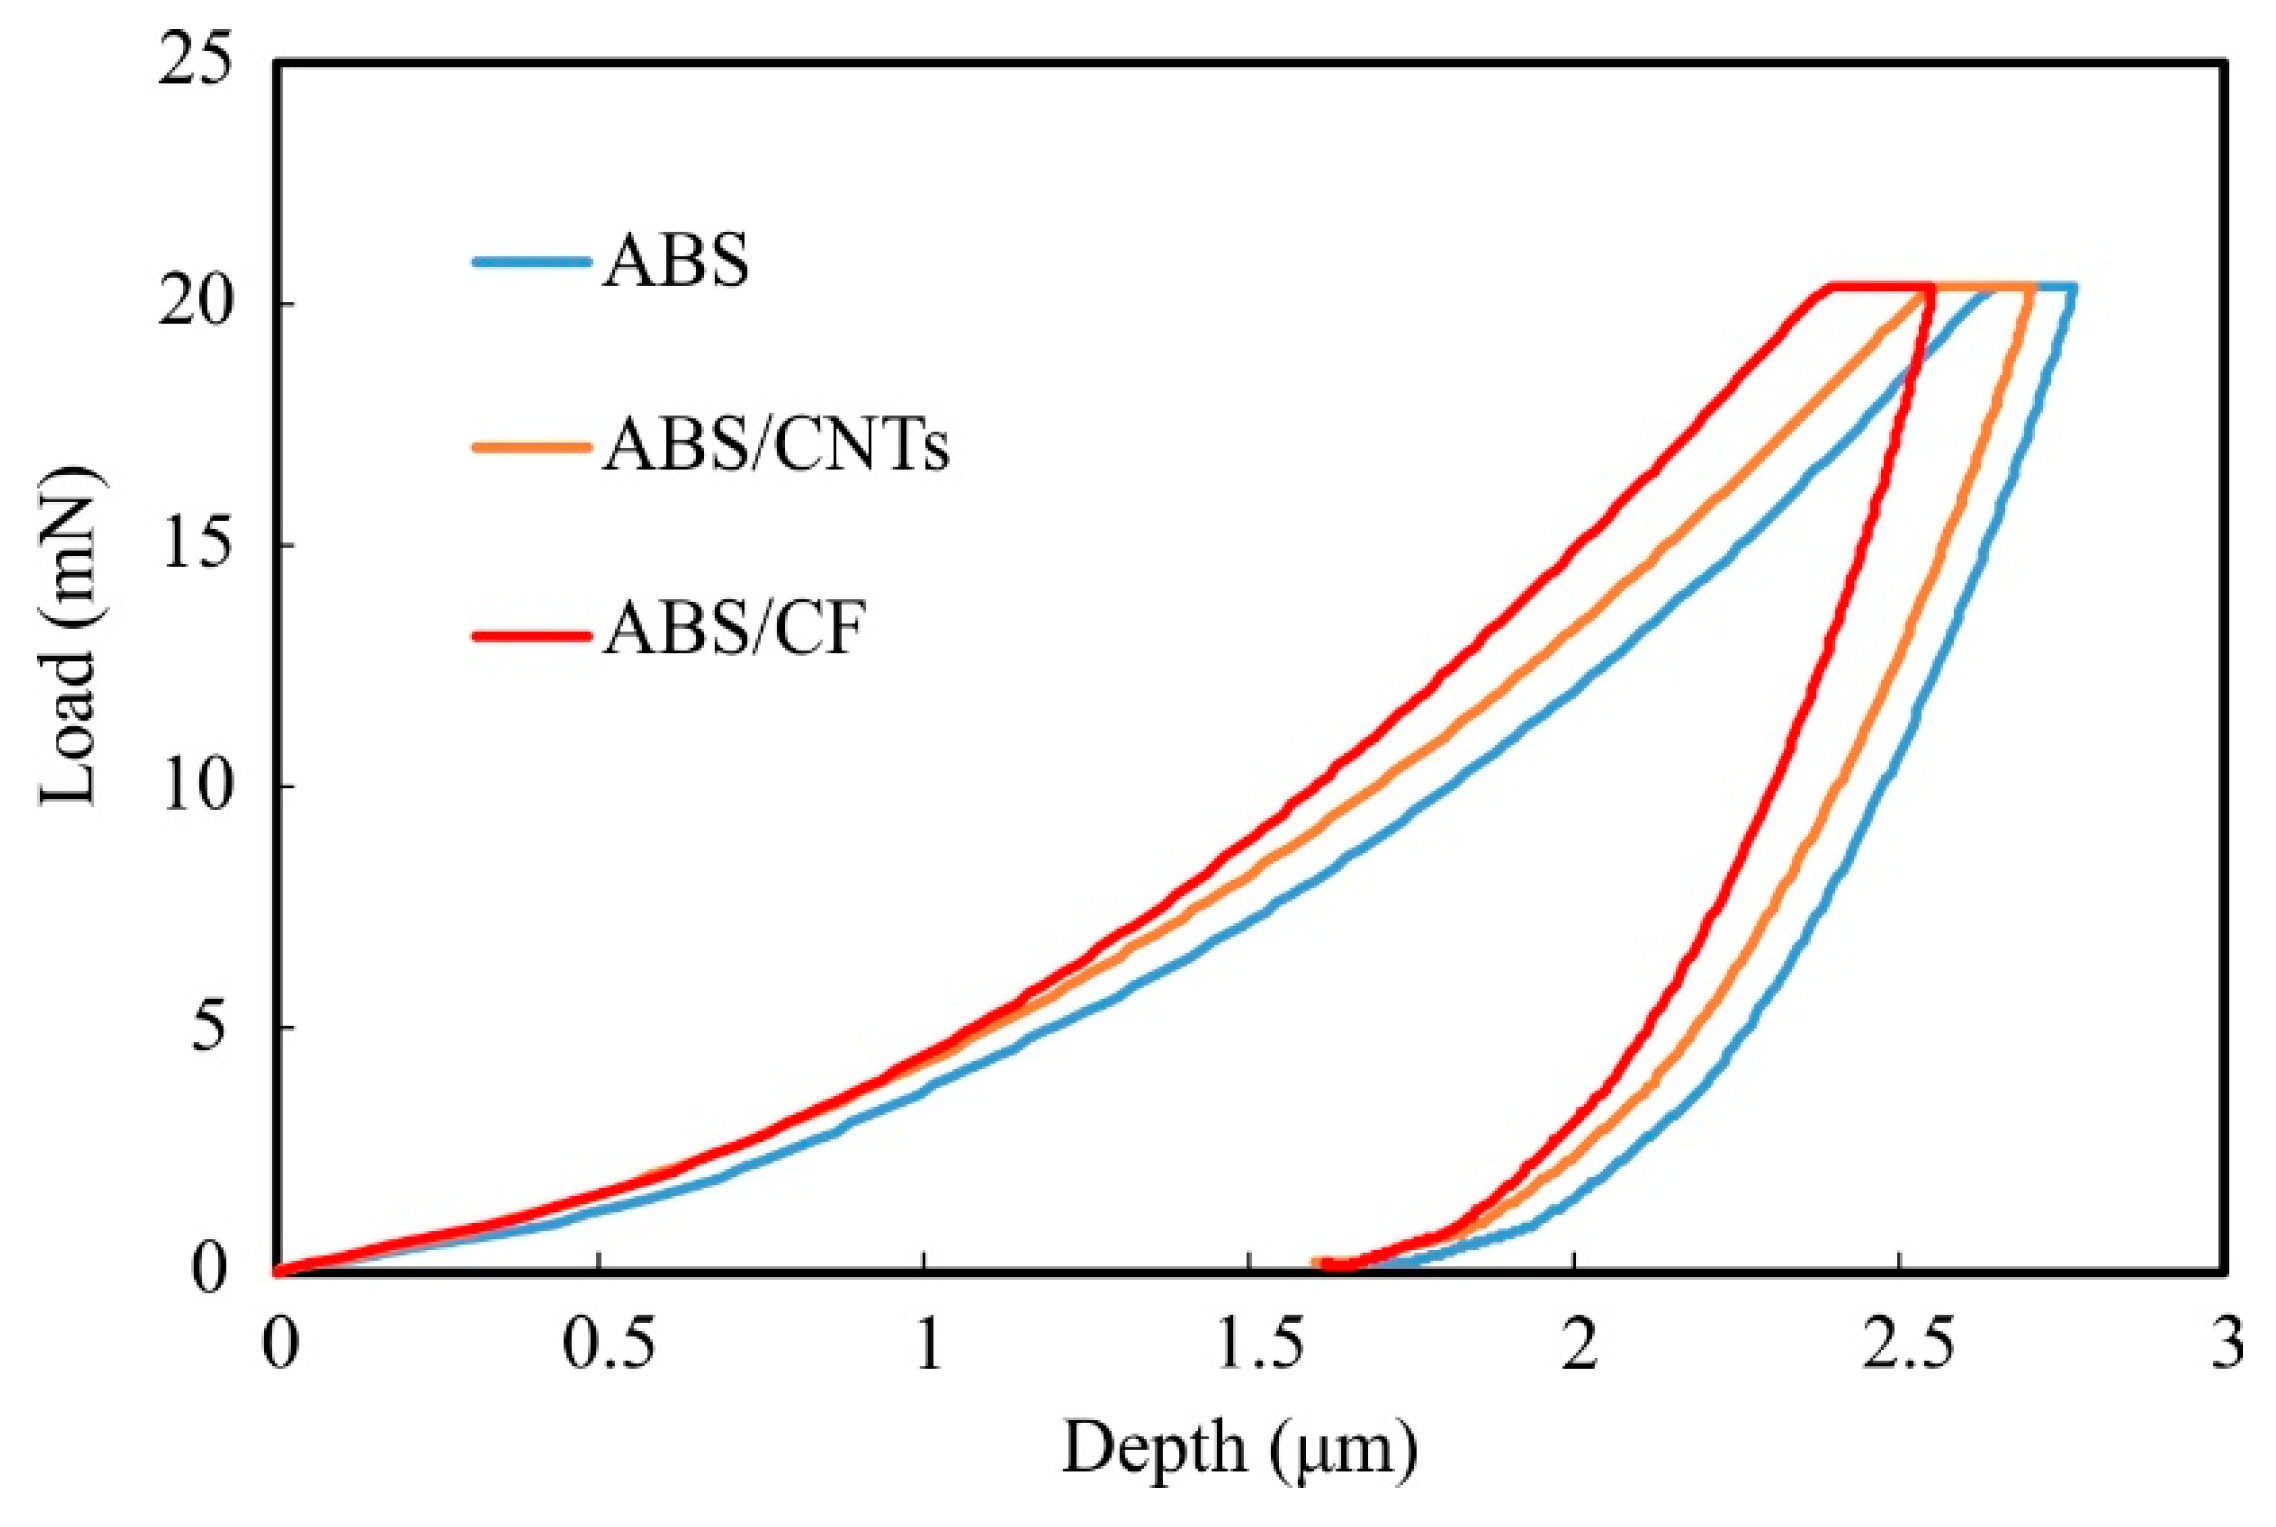
2.4. Nanoindentation Experiment

The mechanical performances of 3D printed cylindrical composite specimens and the hierarchical honeycomb structures were investigated through nanoindentation testing for the characterization of the mechanical behavior of polymers. There are several studies comparing the nanoindentation results with the traditional tensile test data, particularly for the elastic modulus calculation [20,21,22]. Nanoindentation experiments include the contact of an indenter on a material’s surface, and it is indented up to a specified load or depth. The load is measured as a function of penetration depth. Figure 2 illustrates a representative loading-unloading curve, as well as demonstrating the parameters that characterize the contact geometry. Figure 2 demonstrates a viscoelastic-plastic material response, where OA is the loading section and AB’ represents the unloading section. Area W1 (OAB’) corresponds to the plastic work for a viscoelastic-plastic scenario, whereas the elastic work recovered during the unloading is represented by area W2 (ABB´). Considering the scenario of a purely plastic material model, the unloading curve is a straight line (AB) and hr = hmax (W2 = 0). Further information on nanoindentation experimental techniques on polymers can be found in references [23,24,25].
In this paper, the nanoindentation experiments were performed with a Shimadzu DUH211S (Kyoto, Japan) with a resolution of 0.196 μN. The testing device utilizes a Berkovich diamond tip indenter (the tip shape is a three-sided pyramid, with a triangular projected geometry and an included angle of 65°; tip radius 100 nm). This instrumented technique enables the selection of various points using an optical microscope equipped in the nanoindentation instrument, which were intentionally scattered on the surface of the 3D printed specimens. Exactly 10 measurements were performed on the surface of each 3D printed specimen. Under computer control, the indenter was driven towards the specimen, to a depth of between 2.5 and 2.7 μm, at a loading rate of 0.35 mN/s, with a peak load of 20 mN. This peak load was then held for 5 s (in order to minimize the effect of the viscoelastic deformation of the specimens, notably creep, on property measurements) and then the indenter was unloaded, to a load of zero. Afterwards, the indenter was unloaded with the same rate.
The calculation method to define the elastic modulus and hardness of the composite materials utilized for the 3D printed specimens was based on Oliver and Pharr [26] and previous work [1,2,20,21,22,27].

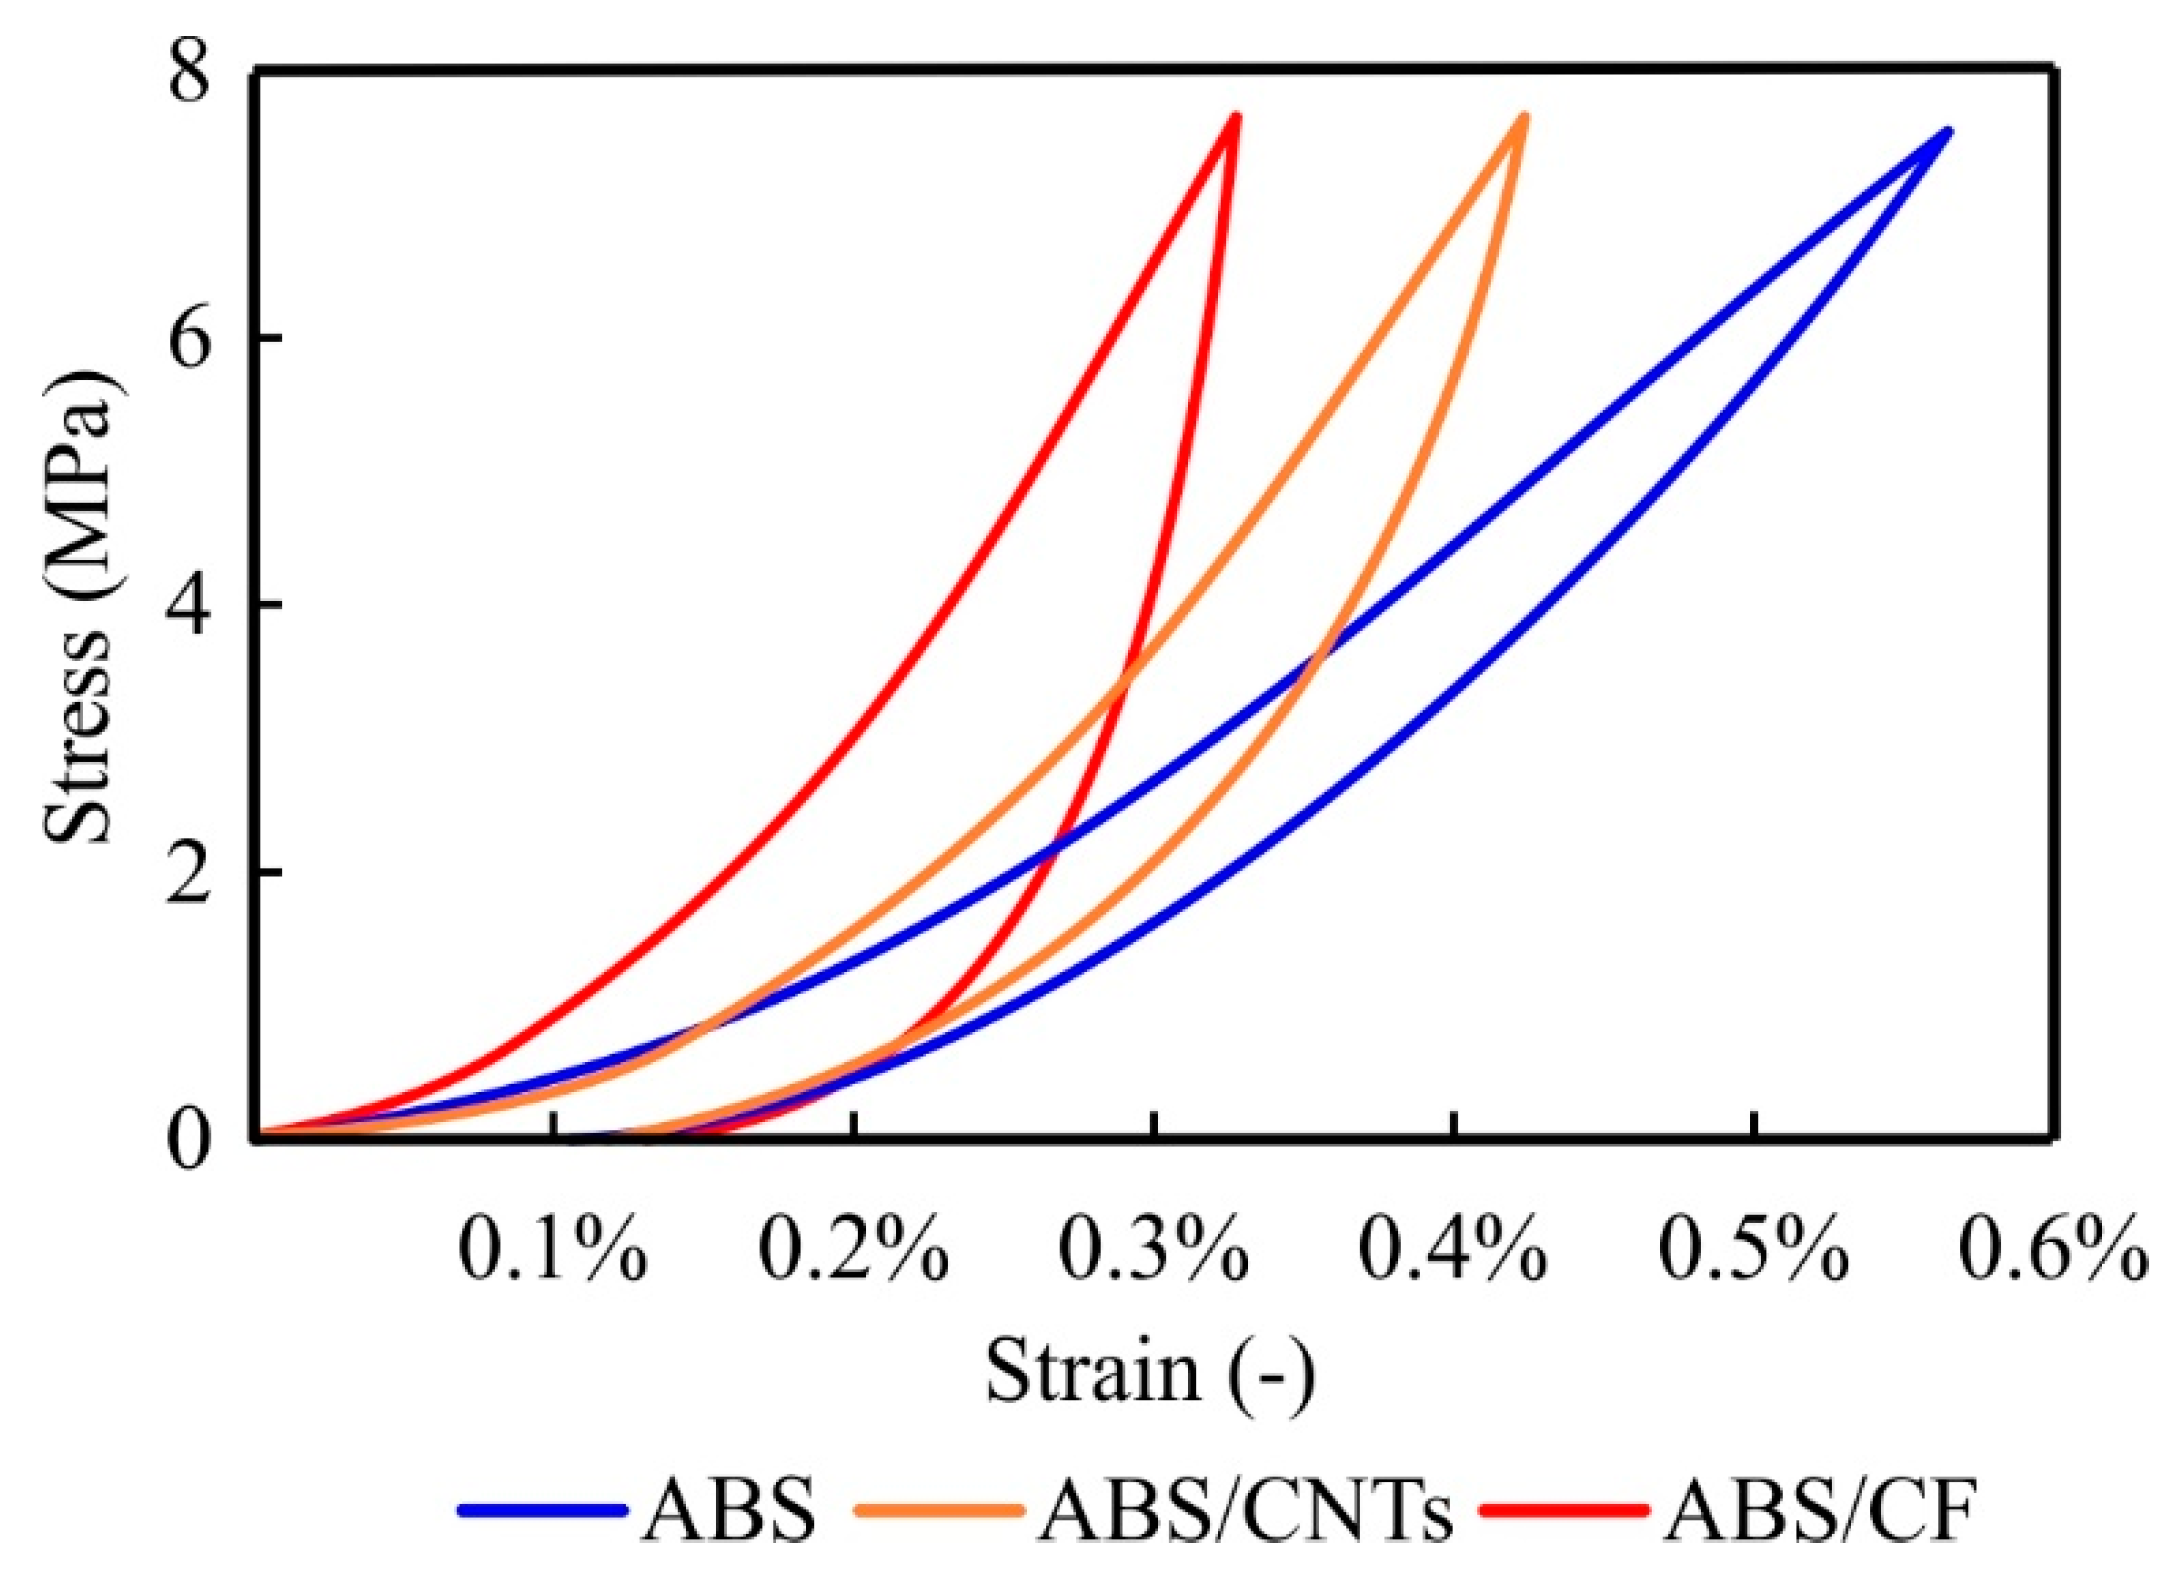
2.5. Cyclic Compression Experiments

Cyclic compression tests were conducted with a constant strain rate for the loading and unloading phase and, also, all experiments were performed at ambient temperature. In particular, all measurements were performed using a universal testing machine (Testometric, equipped with a 50 kN load cell) with a peak load up to 5 kN and with a frequency of 0.01 Hz. The speed of the load cell during the loading and unloading phase was set constant with an exact value of 5 mm/min. In addition, the dimensions of the FFF printed cylindrical samples for cyclic compression testing were the same as those used in compression tests. At least five 3D printed samples were investigated under the cyclic compressive regime. In this quasi-static regime, the stress-strain performance was acquired during the loading-unloading stage, and all of the samples displayed hysteretic behavior. The energy loss in each loading cycle was measured by the area of the corresponding hysteresis loops.

3. Results and Discussion

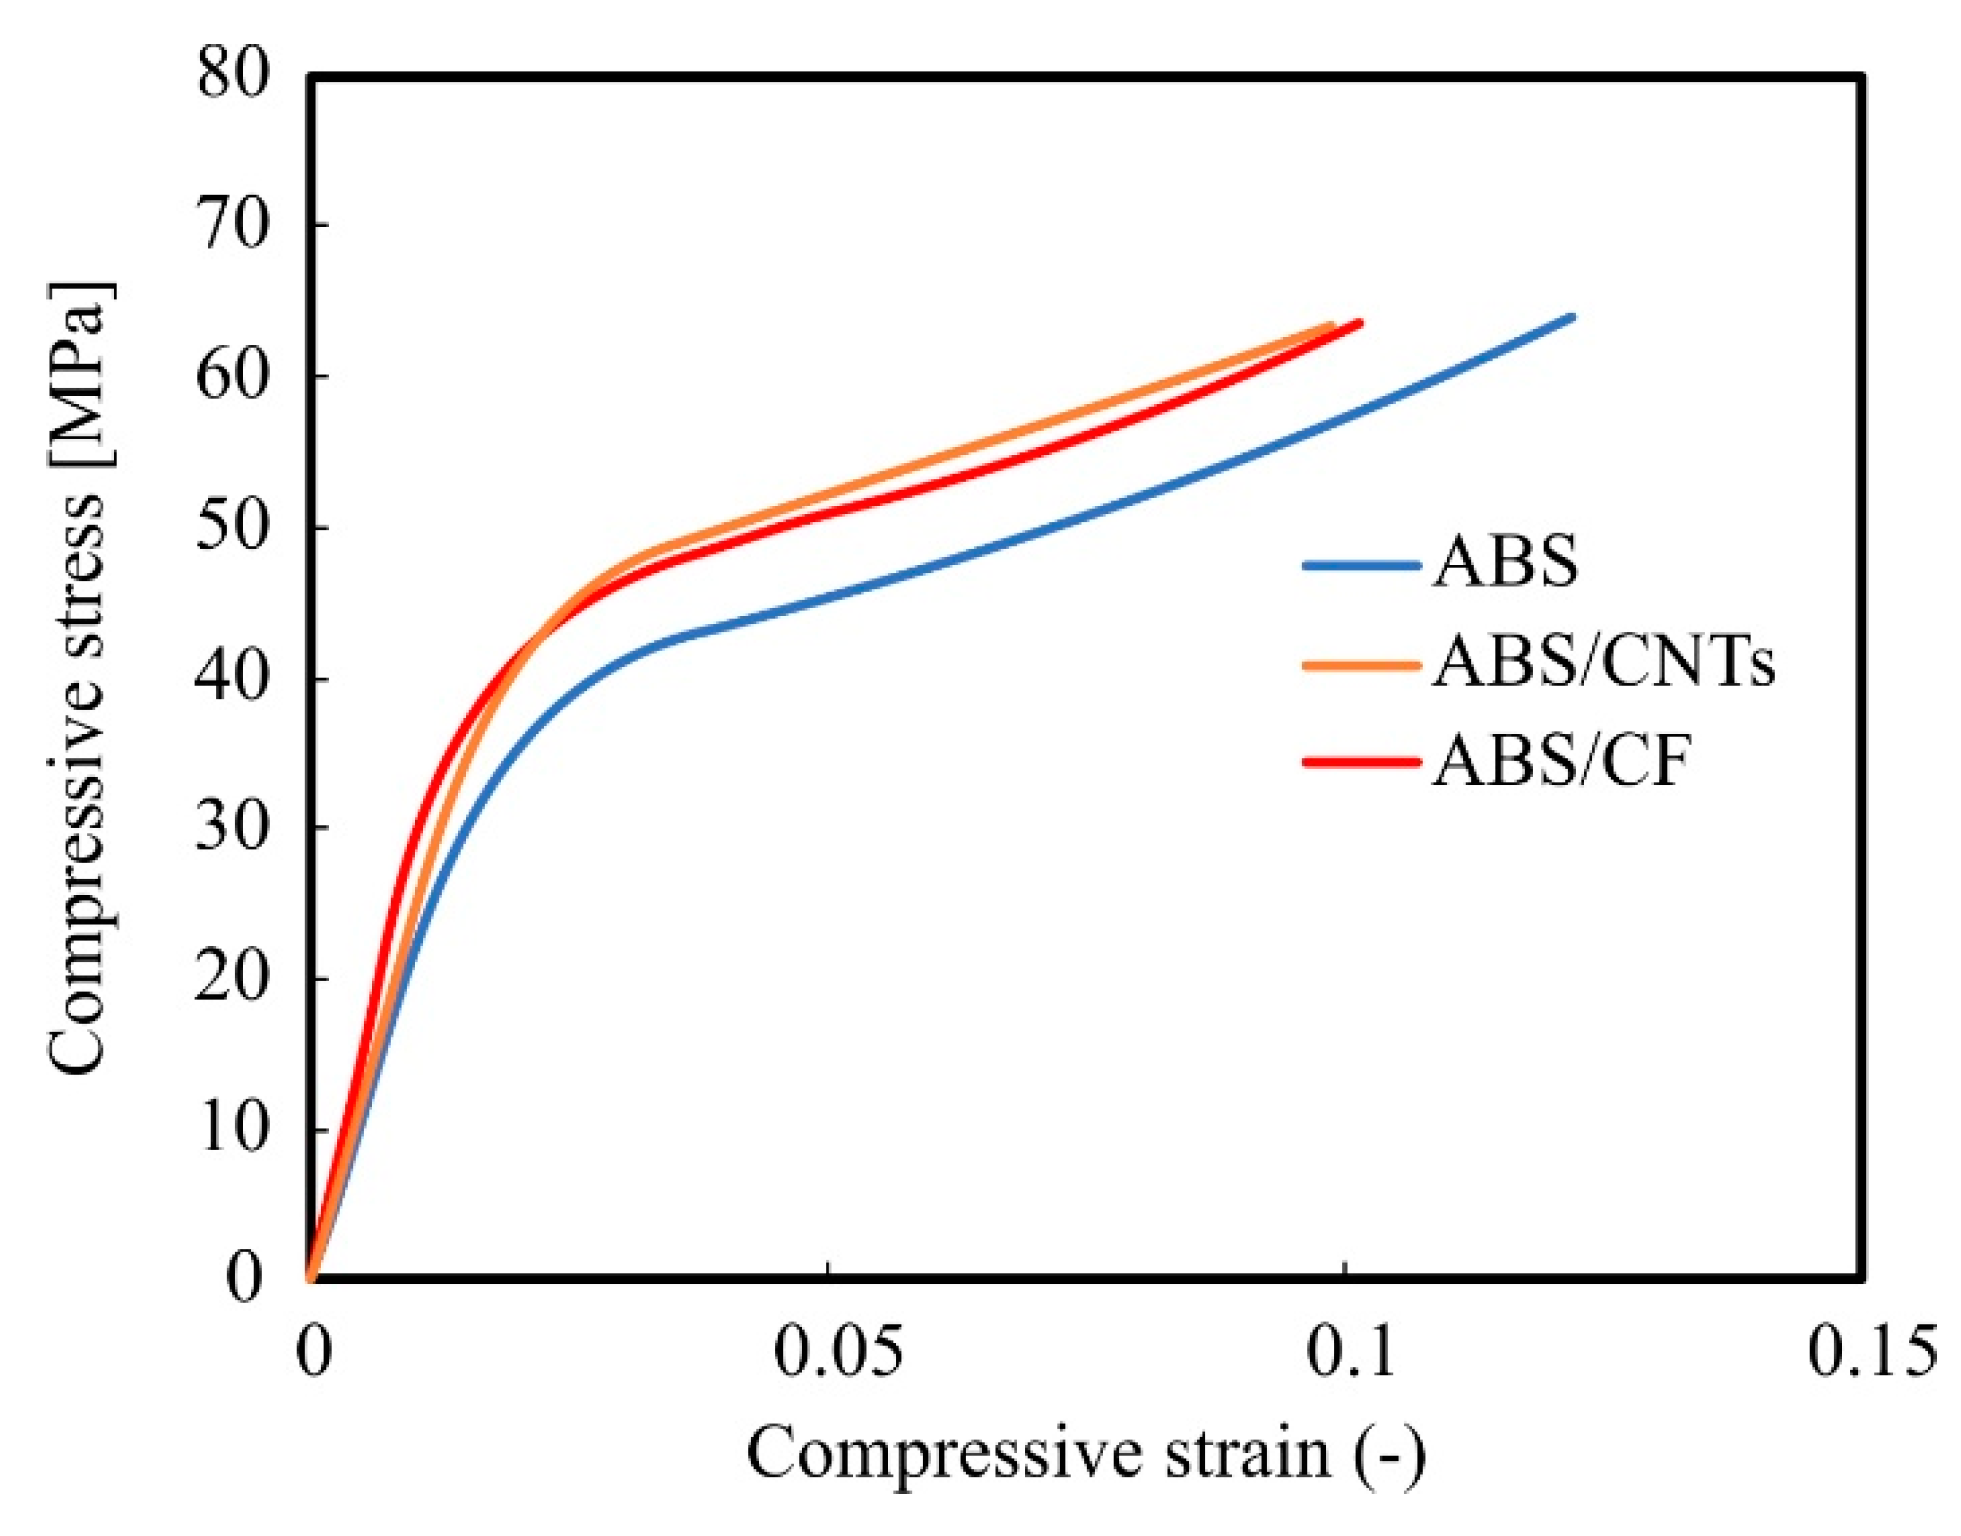
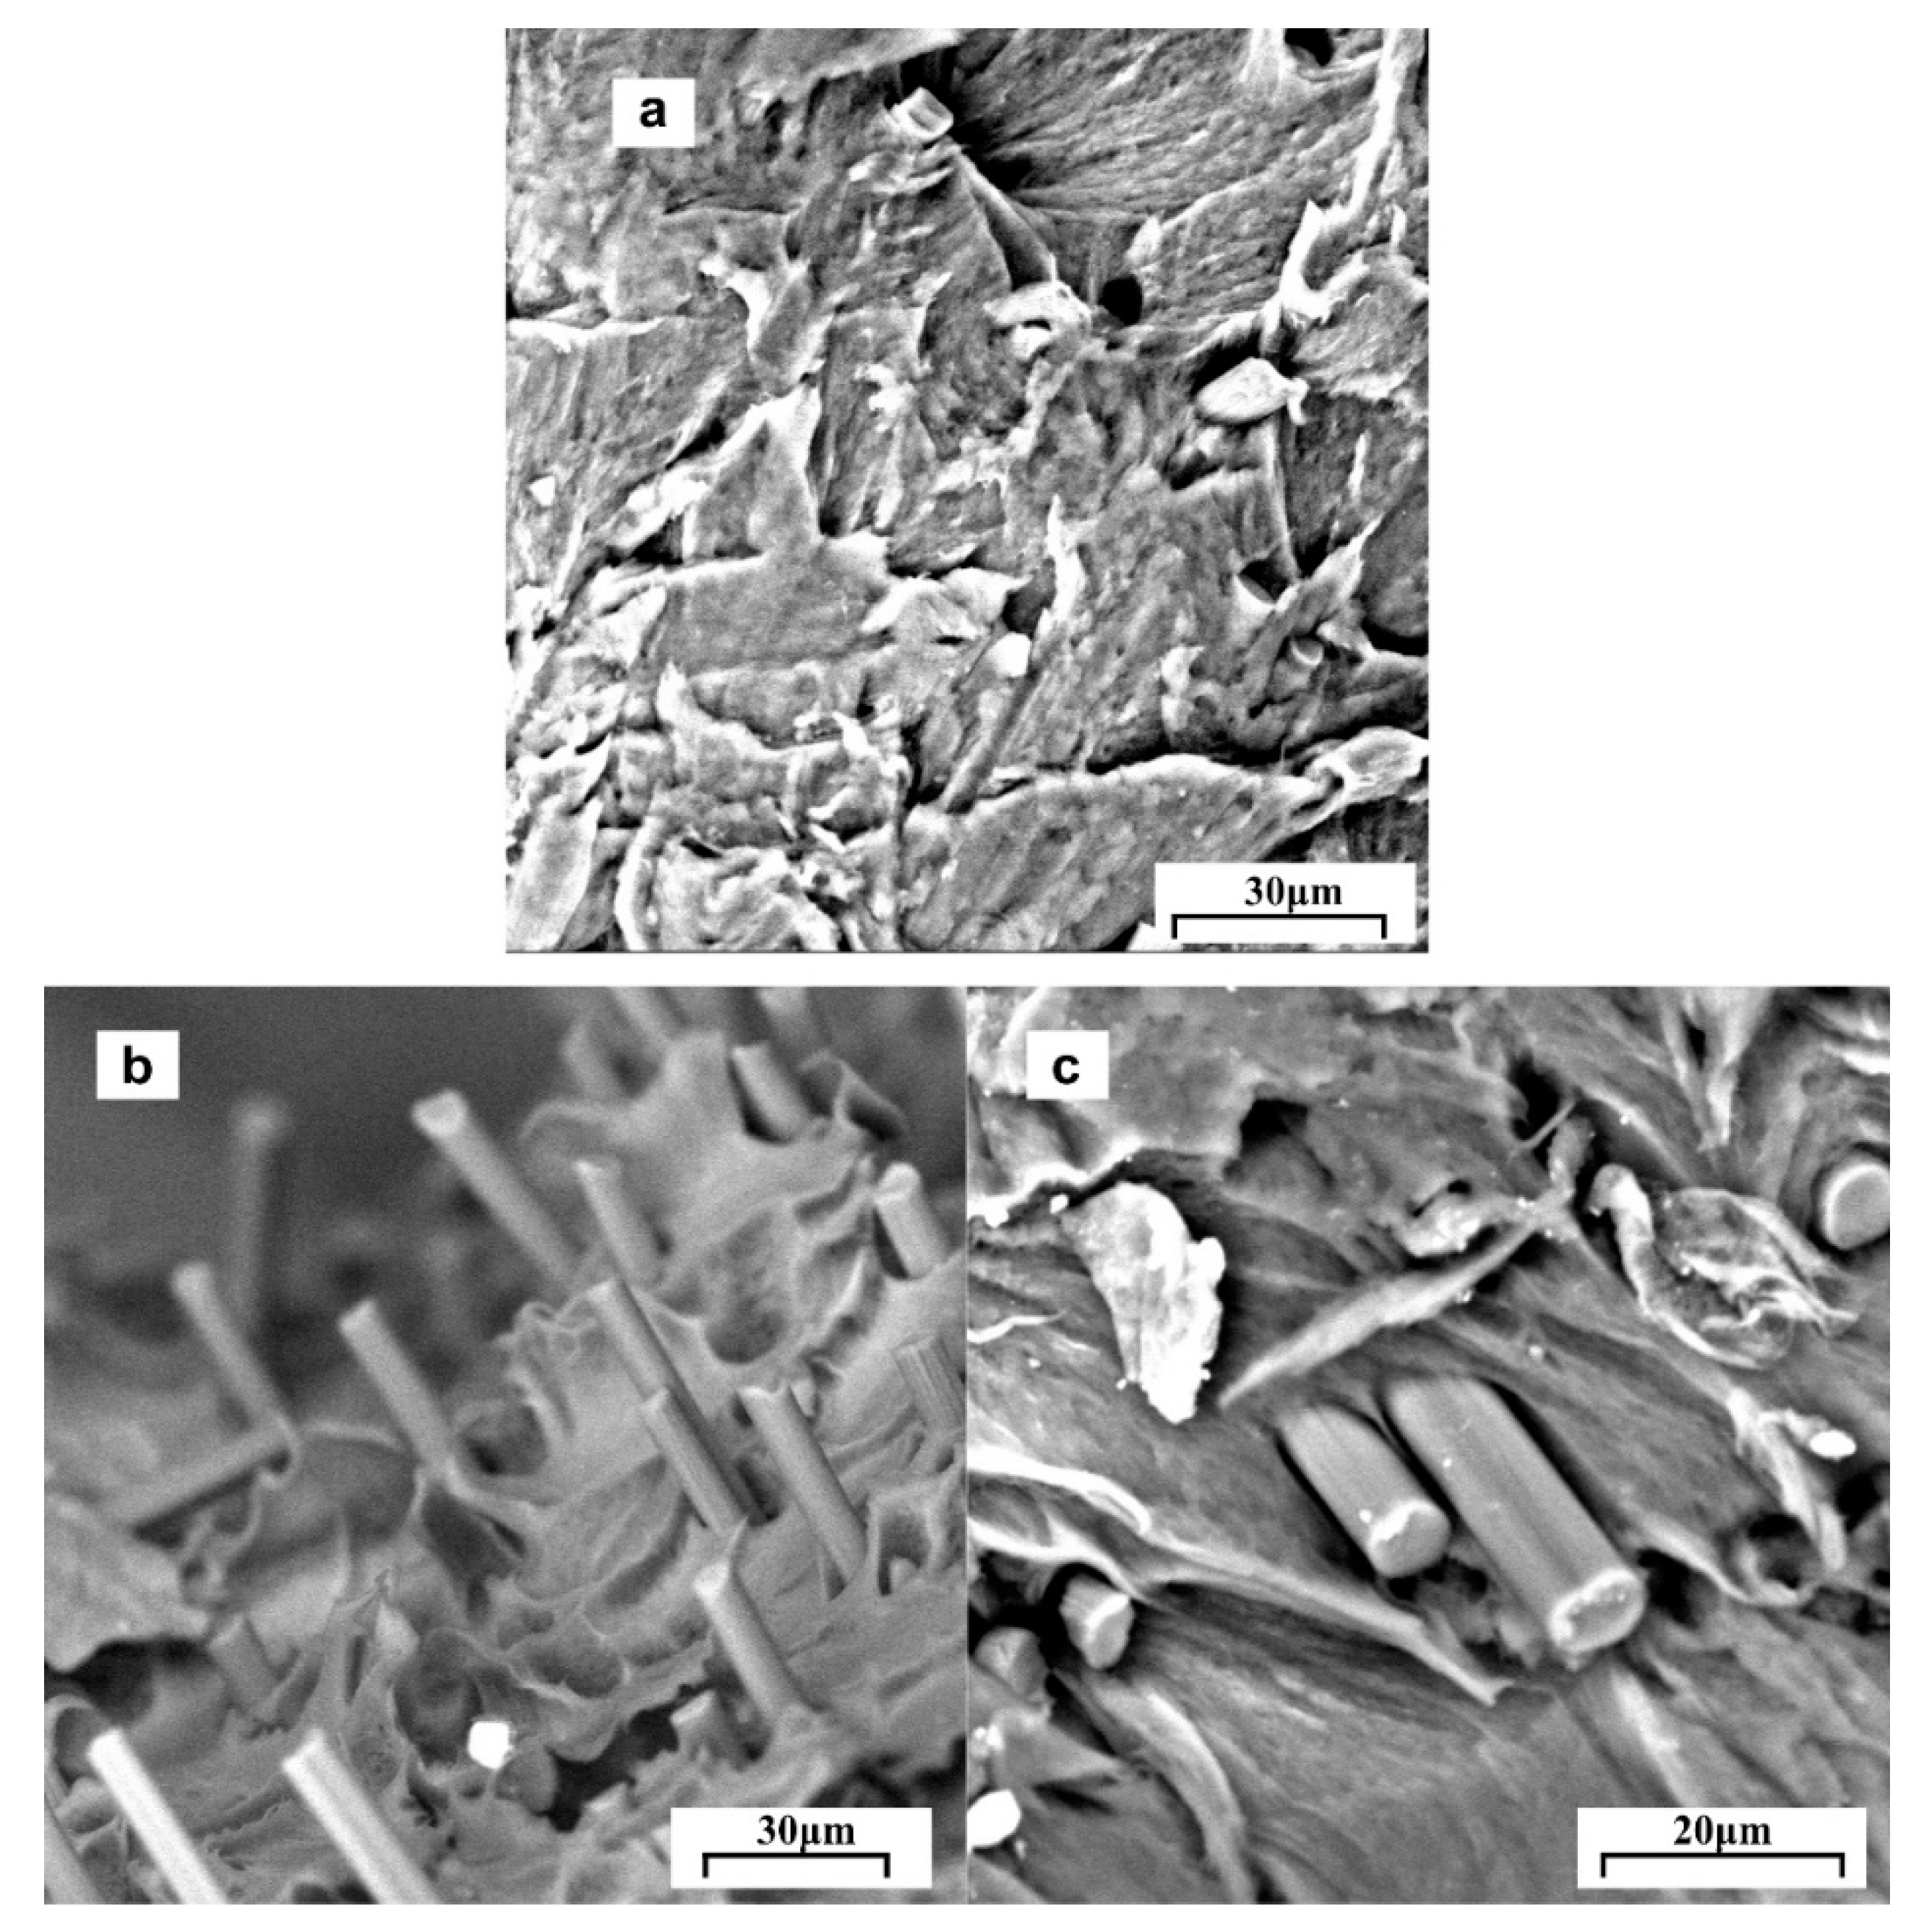
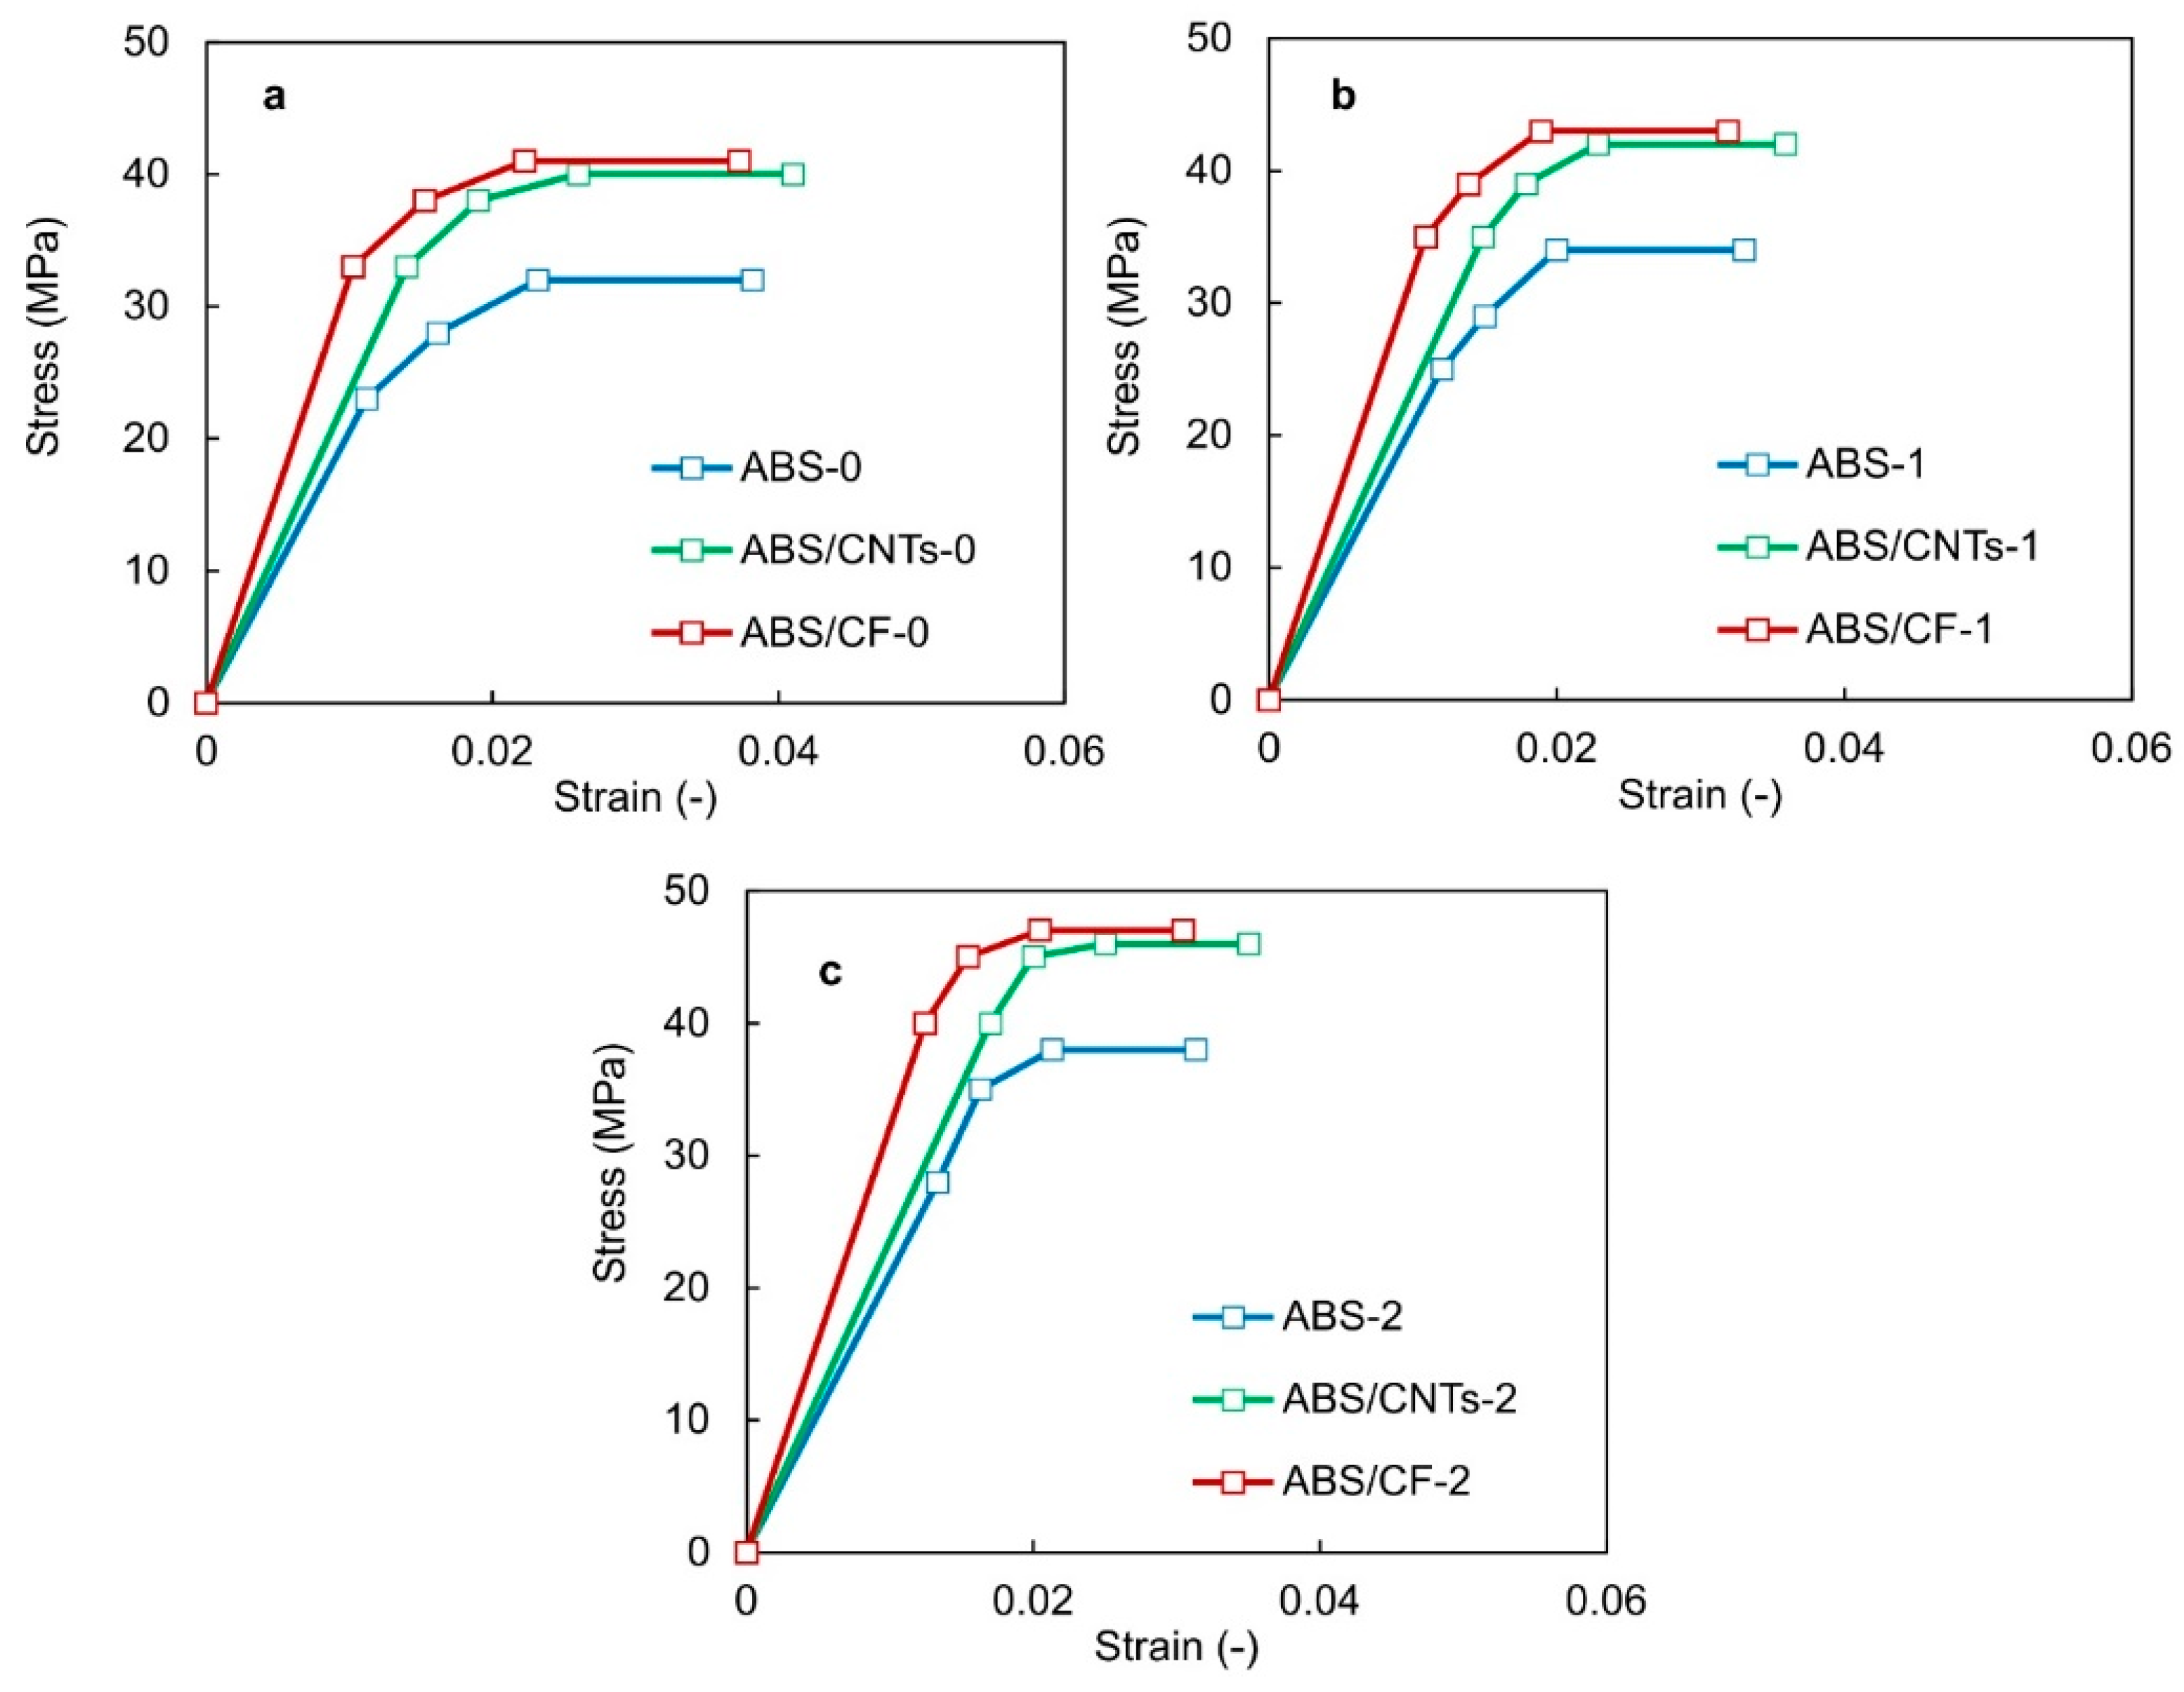
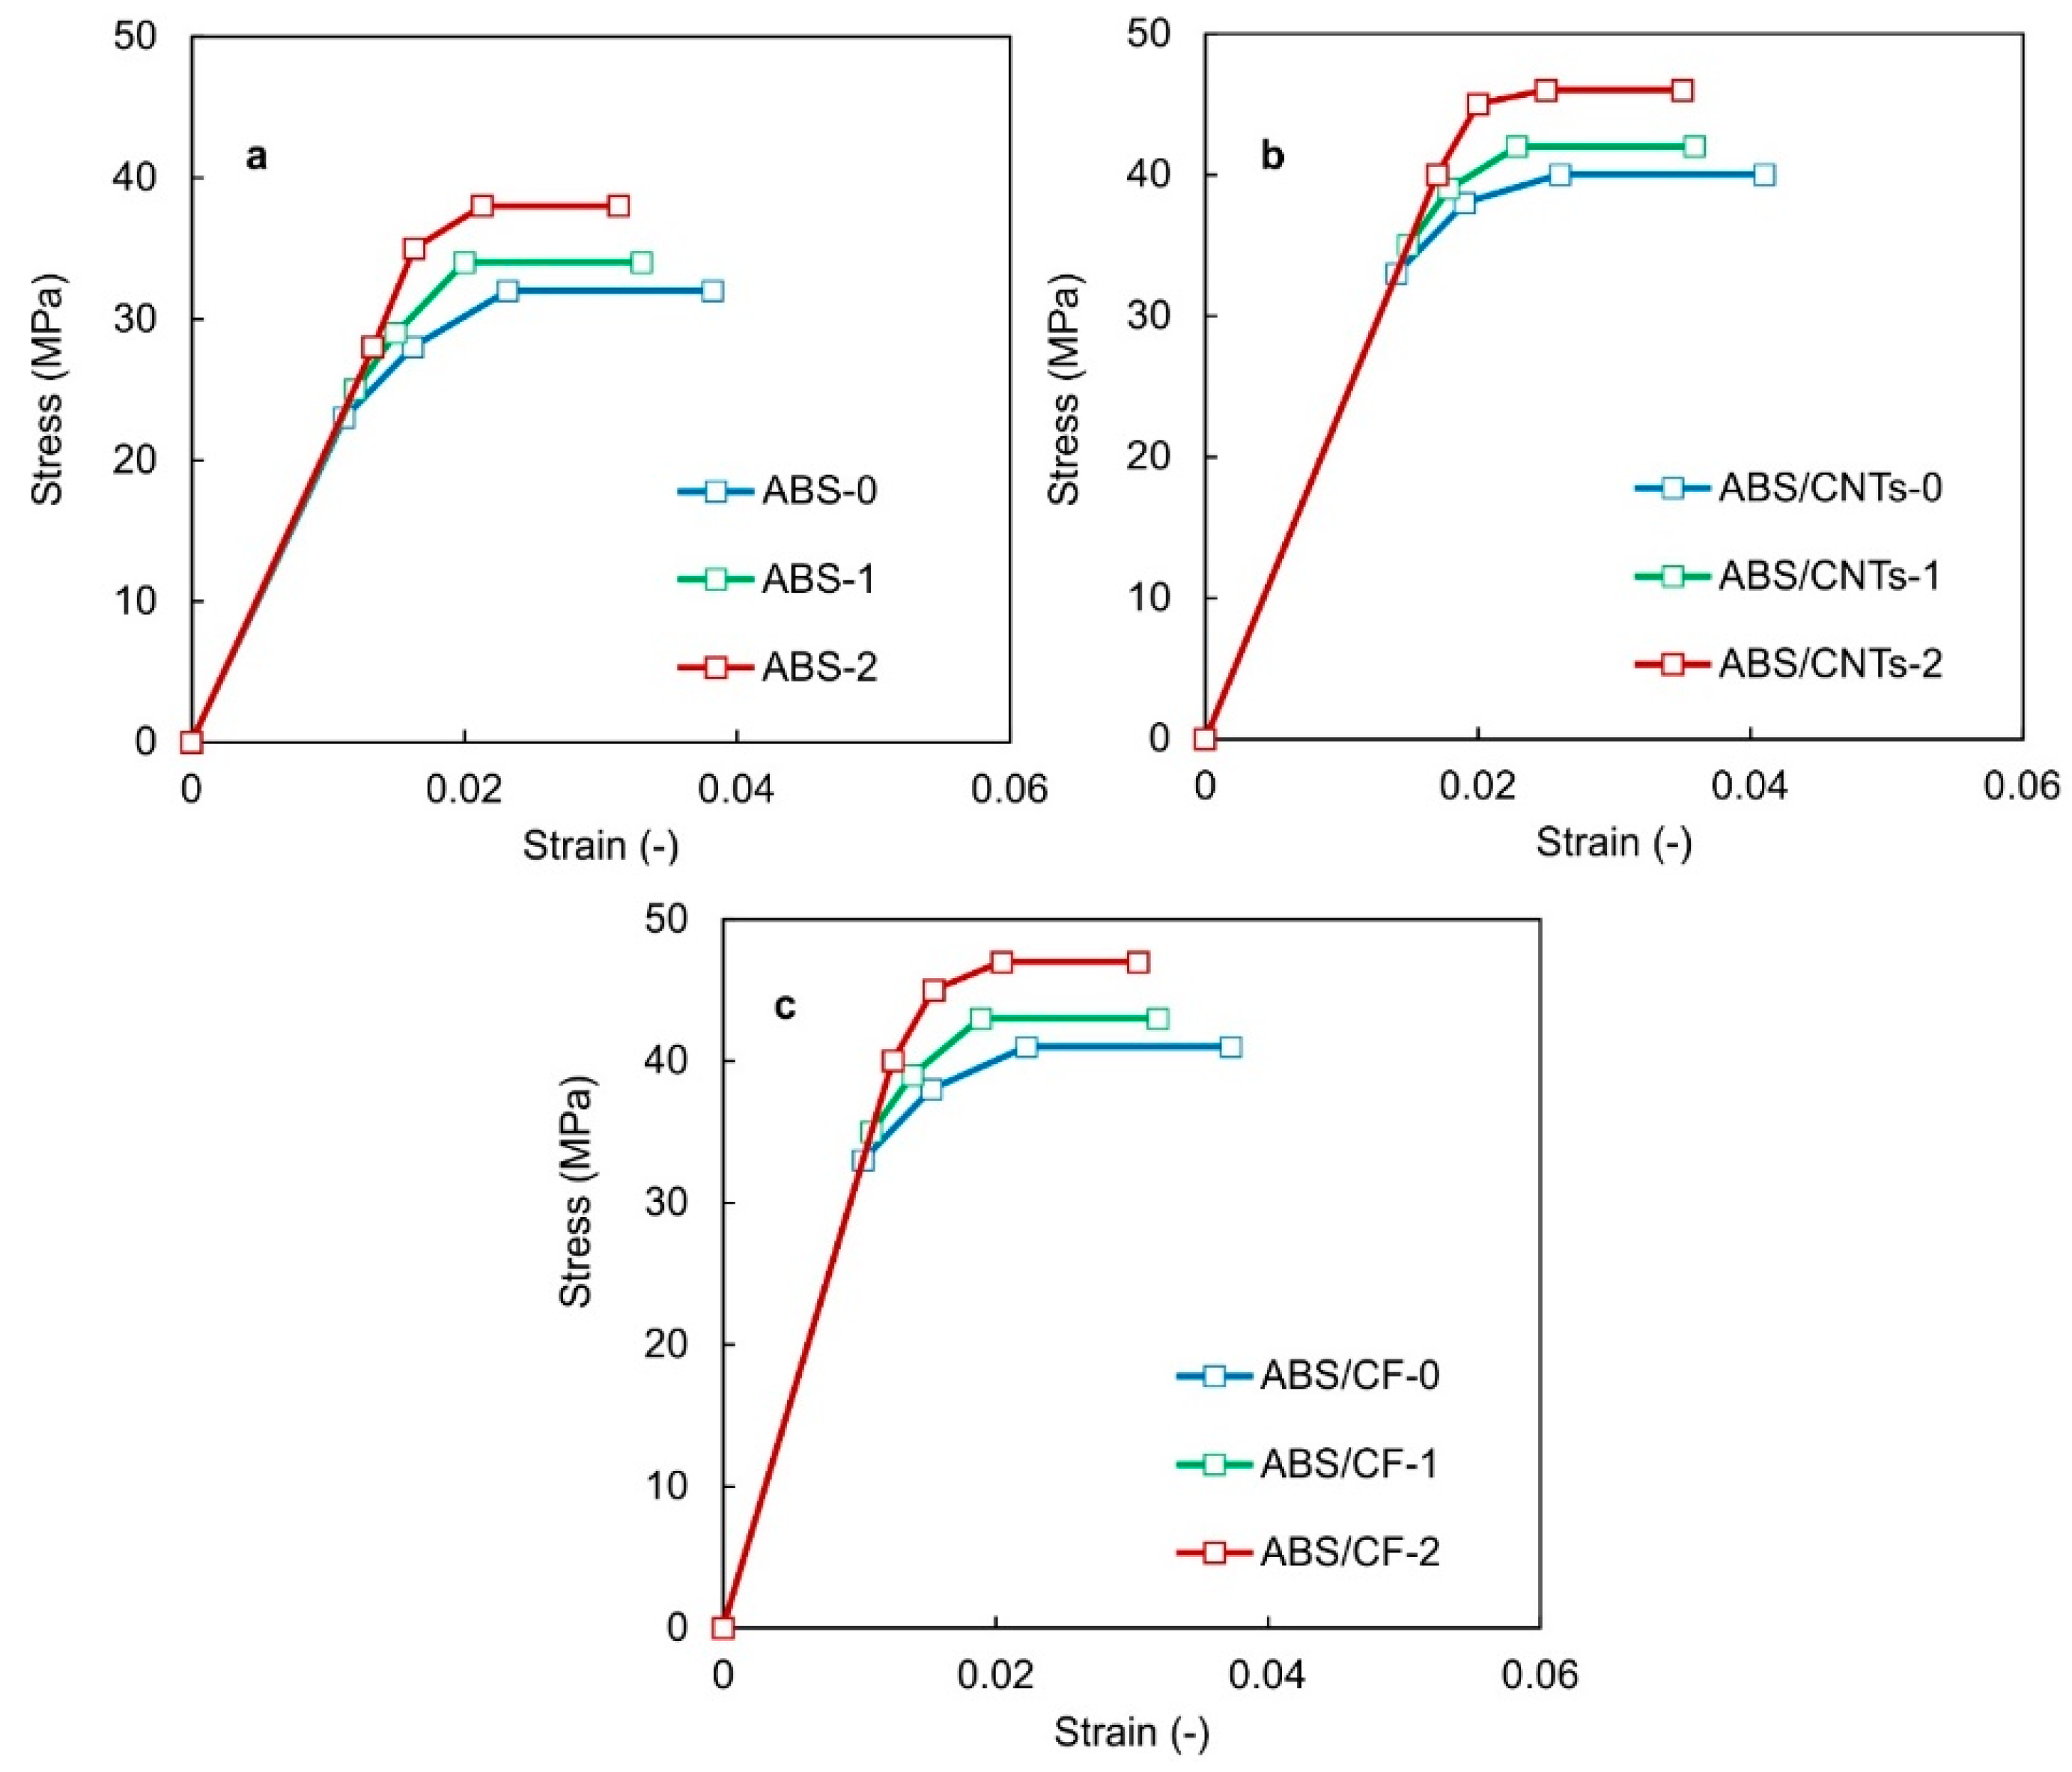
3.1. Characterization of the Mechanical Behavior of FFF Printed Composite Specimens

Figure 3 demonstrates the stress-strain curves of unfilled ABS and CNTs-CF filled polymer matrix FFF printed specimens under uniaxial compression. It is observed that for almost the same strain, the corresponding stress of the composites is higher than that of unfilled ABS. The E-modulus of unfilled ABS was calculated as 2100 MPa, and after the incorporation of carbon nanotubes (CNTs) as well as carbon fibers (CFs) in the polymer matrix, there was an improvement of up to 2400 and 3273 MPa, respectively, as shown in Table 1. Therefore, the addition of CNTs in ABS led to an increase of 14%, whereas the incorporation of CFs resulted in an increase of 56% compared to the control specimens of unmodified ABS. The yield strength of ABS specimens was calculated to be 30 MPa. The ABS reinforced with CNTs revealed the highest yield strength among the cylindrical compression specimens and acquired a value of 35 MPa. The ABS/CF cylindrical composite specimens demonstrated a quite similar yielding response with ABS/CNTs, with a yield stress value of 33 MPa. The percentage differences of the ABS yield stress compared to ABS/CNTs and ABS/CFs were 17% and 10%, respectively.
Figure 4 illustrates scanning electron micrographs using a Phenom ProX (ThermoFisher Scientific, Waltham, MA, USA) scanning electron microscope instrument of ABS/CNT and ABS/CF materials from the compression samples. The samples show the typical fracture surface of a polymeric material. Specifically, no aggregates of CNTs have been observed in Figure 4a for the permissible attained magnifications, indicating a rather good dispersion. Figure 4b reveals that the ABS/CF material, which showed improved compression strength and modulus, has produced high fiber alignment along the direction of the print path in accordance with what has been observed in another study [10]. Additionally, Figure 4c reveals that carbon microfibers have been debonded from the ABS matrix.
The nanoindentation experimental data are demonstrated in Table 1. The typical nanoindentation load–penetration depth curves of the FFF printed ABS, ABS/CF and ABS/CNT specimens are displayed in Figure 5. The load-depth curves were acquired during the loading and unloading of the indenter against the surface of the FFF printed specimens. The nanoindentation load–penetration depth curves of the FFF printed specimens demonstrated creep phenomenon at a peak load of 20 mN. There were no discrepancies in creep behavior among the 3D printed specimens since no discontinuities or step loading were identified on the curves, revealing that no cracks were developed throughout the nanoindentation procedure. Moreover, the maximum nanoindentation depths at the peak load of 20 mN varied approximately between 2.5 and 2.7 μm. The highest depth was observed for the ABS specimens, where the indenter reached a mean depth value of 2.7 μm. The ABS/CNT specimens responded with a maximum mean depth value of 2.6 μm. The stiffer behavior was observed in the case of ABS/CF specimens, where the maximum mean depth was measured to be 2.5 μm. The indentation E-modulus of the unfilled ABS samples was 2579 MPa. After the incorporation of CNTs and CFs in the polymer matrix, there was a modulus increase up to 2657 and 3652 MPa, respectively, which correspond to an increase of 3% and 41%, respectively. The E-modulus values are in accordance with the moduli calculated with compression testing. Furthermore, the hardness of unfilled ABS was 137.4 MPa, and the values of ABS/CNTs and ABS/CFs were 152.4 MPa (11% increase) and 155.5 MPa (13% increase), respectively.

3.2. Hysteresis Behavior of the FFF Printed Composite Specimens

The area within the hysteresis loop is related to the loss energy. For polymeric damping materials, a larger hysteresis loop represents higher damping, meaning that it can efficiently reduce the level of vibration [28]. The damping parameters may be extracted by the area enclosed by the hysteresis loops. Based on the free vibration model, the vibration isolation capacity of materials can be determined from the hysteresis damping characteristics.
The specific damping capacity (SDC) is given by:
S D C = Δ W W × 100 %   =   (   σ d ε / ω t = 0 π / 2 σ d ε ) × 100 %
where σ defines the stress, Δ W represents the energy dissipated in any one cycle and W corresponds to the maximum energy related to that cycle [29]. The specific damping capacity can be associated with the loss factor [30,31,32] by the following equation:
n = Δ W 2 π   W
Figure 6 demonstrates the typical hysteresis loops curves of 3D printed composite specimens under compressive vibration at 0.01 Hz with a maximum load of 5 kN. Considering Equations (2) and (3), the energy loss over a cycle ( Δ W ), the maximum energy of that cycle ( W ), as well as the loss factor ( n ) were calculated in order to measure the material damping of the loading–unloading experiments, as shown in Table 2. Furthermore, Δ W denotes that the antivibration property of ABS/CFs is increased as compared to unfilled ABS. Although the Δ W is decreased with the addition of CNTs into ABS, the W property was decreased, leading to a higher loss factor. This decrease in W energy can be attributed to the higher stiffness of ABS/CNTs compared to ABS specimens. Therefore, the ABS/CF material is expected to improve the ability to transform its kinetic energy to thermal dissipation upon the application of an external force. The highest damping constant n , which is the ratio of Δ W to W , was calculated for ABS/CF specimens. This observation shows faster energy dissipation at particular vibration amplitudes, and the system becomes stable with less vibration cycles. The loss factor for the ABS specimens was calculated as 2.5%, 3.7% for ABS/CNT specimens, and the highest loss factor was measured for ABS/CF specimens, which was 10%. The addition of CNTs indicated an increase of 48% of the loss factor of the unmodified ABS. The highest percentage increase in damping was achieved by ABS/CF specimens, with a value of 300%.

3.3. Mechanical Properties of the FFF Printed Honeycomb Structures Using FEA-Supported Compression Tests

Three different hierarchical honeycomb structures have been FFF printed in order to study their mechanical performance: HC0, which represents the zero level of hierarchy (regular honeycomb); HC1, which represents the first level of hierarchy; and HC2, which represents the second level of hierarchy. Figure 7 illustrates the typical load-displacement response of each hierarchical honeycomb structure under investigation under compressive loading [4]. In Figure 7a–c the ultimate compression load for the unfilled ABS was measured to be 571 N, 586 N and 650 N for the regular honeycomb, the first order hierarchy and second order hierarchy, respectively. Similarly, such effect was detected for ABS/CNT 3D printed structures with maximum forces of 554 N, 699 N and 784 N. Similarly, ABS/CF FFF printed structures reached up to 675 N, 779 N and 925 N, with respect to the level of hierarchy. The highest deformation was measured to be up to 8 mm. The results clearly portray that the ABS/CF structures with second order hierarchy show higher stiffness values compared to the other levels and materials. Such an occurrence was anticipated since the effective elastic modulus is expressed by the equation [19]:
E E S = ( t a ) 3 f ( γ 1 )
where
f ( γ 1 ) = 3 / ( 0.75 3.525 γ 1 + 3.6 γ 1 2 + 2.9 γ 1 3 )
Ajdari et al. [19] investigated the maximum normalized elastic modulus for the 1st level of hierarchy with constant relative density, and they realized that t / a has to be excluded from Equation (4), using through Equation (1) the relative density expression. The expression of Ε / E s is a ρ 3 times function of γ 1 , while placing ( ( E E s ) / γ 1 ) ρ = 0 results in E 1 / E s = 2.97 ρ 3 , which is two times the stiffness of the zeroth level of hierarchy honeycomb structure, since E 0 / E s = 1.5 ρ 3 (by setting γ 1 = 0 in Equation (4), and using Equation (1) to eliminate t / a the regular honeycomb’s effective modulus can be calculated). Additionally, a stiffness almost three point five times that of regular honeycomb was observed for the 2nd order hierarchical structure. For the unfilled ABS FFF printed honeycombs, the experimental load-displacement data were in agreement with these theoretical values; 1.9 times greater stiffness for the 1st level of hierarchy and 3.3 times for the 2nd level, compared with the stiffness of the regular honeycomb. Contemplating the honeycombs fabricated using ABS/CNTs, the stiffness increase was 1.9 and 3.3 for the 1st and 2nd level of hierarchy, respectively. Such values were 2.0 and 3.5 in the case of honeycombs fabricated from PLA reinforced with short carbon fibers [33].
The result of shifting the hierarchy from zero to second level has also been investigated in order to determine the stress-strain behavior of FFF printed hierarchical honeycombs. This was accomplished by curve fitting the compressive experimental results with FEA generated data. A computational model was developed using the commercial code ANSYS, performing a static structural analysis. Assumptions of material values stress, strain and moduli of the multilinear stress-strain curves of the honeycombs were used in the FE model. An imposed displacement was step applied and the reaction force was calculated at the bottom of each hierarchical honeycomb structure, at a fixed boundary condition. The input value of this displacement was acquired by the measured compression tests. Given these deformation values, force data were calculated in FEA and contrasted with the measured forces. If the calculated force values do not fit with the experimental, then the initial values of stress, strain and moduli are approximated and the FE model is solved again. The mesh consisted of hexahedrals for the honeycomb and hierarchical structures, as well as for the upper and lower plates. In order to ensure the mesh-independent response, a convergence study was performed. Based on the convergence results performed for an elastic response of the honeycomb structures, a minimum element size of 0.86 mm was considered to be adequate to obtain acceptable accuracy in the calculated responses. The curve-fitted force-displacement data obtained from the FEA are shown in Figure 7a–c, where it can clearly be seen that these values are in agreement with the measure curves [4]. Therefore, the initial values of the multilinear stress-strain model of the honeycomb structures were correct assumptions.
FE analyses were performed for three levels of hierarchy of honeycomb structures, as demonstrated in Figure 8 [4]. In Figure 8a, the change in terms of modulus and strength can be easily illustrated for the regular honeycomb under different reinforcements. Figure 8b,c shows the stress-strain behavior regarding the first level and second level of hierarchies, respectively. Thus, the stress strain behavior of unfilled ABS was compared with the ABS/CNTs and ABS/CFs at different levels of hierarchy. Regarding the regular honeycomb, the elastic modulus was calculated by the initial slope at the elastic region [4]. For the unreinforced ABS as well as for the ABS reinforced with CNTs and CFs, the elastic moduli values were 2050 MPa, 2350 MPa and 3200 MPa, respectively. The elastic moduli values, in the case of the first level of hierarchy, were 2080 MPa, 2370 MPa and 3205 MPa, respectively, showing a non-significant increase. Moreover, for the second level of hierarchical honeycomb, the elastic moduli values were calculated as 2100 MPa, 2390 MPa and 3210 MPa for the unreinforced ABS and for the ABS with CNTs and CFs, respectively, revealing again a further small increase.
As shown in Figure 9, it can be realized that the Young’s modulus was not significantly affected by the increasing level in hierarchy. The first and second level hierarchical structures revealed higher stress than the regular honeycomb while maintaining the ultimate strain. In Figure 9, the ultimate strength can be easily demonstrated for the same material with alternating levels of hierarchy. For ABS, the ultimate strength values were 32 MPa, 34 MPa and 38 MPa with respect to zeroth, first and second level of hierarchy. For ABS/CNTs, the ultimate strength values were 40 MPa, 42 MPa and 46 MPa with respect to zeroth, first and second level of hierarchy. For ABS/CFs, the ultimate strength values were 41 MPa, 43 MPa and 47 MPa with respect to zeroth, first and second level of hierarchy. The highest ultimate stress was observed for ABS/CFs with a value of 47 MPa.
Figure 10 presents the typical deformation behavior of each hierarchical honeycomb structure prior to and after the applied compressive loads. Figure 10a–c portrays the condition of regular honeycomb, first hierarchical honeycomb and second hierarchical honeycomb, respectively. Figure 10a–c shows the specimens after the test with characteristic shear failure patterns and stress concentration regions. This is more profound for the 1st level and 2nd level of hierarchy structures, which showed localized buckling of the honeycomb cells.

4. Conclusions

The mechanical performance of ABS, ABS/CNT and ABS/CF FFF printed specimens was characterized by compression and cyclic compression testing and nanoindentation tests. The mechanical properties of unmodified and reinforced ABS polymer materials and three levels of hierarchical honeycombs were assessed through static compression tests. Additionally, a technique is introduced in order to extract the hierarchical honeycombs’ stress-strain behavior based on the curve fitting of uniaxial compression test data through a developed FEA simulation. The FE model utilizes the compression test results as input data to the described model and extracts the constitutive law of the FFF printed hierarchical honeycombs. The results presented increased stiffness and strength for ABS/CFs and the 2nd order hierarchy of honeycomb structures in comparison with unfilled ABS and ABS/CNTs as well as the 0th and the 1st hierarchies, respectively.

Author Contributions

Conceptualization, M.T.M., K.T. and D.T.; methodology, M.T.M. and K.T.; software, M.T.M., K.T.; formal analysis, M.T.M., K.T. and D.T.; investigation, M.T.M., K.T. and D.T.; resources, M.T.M.; data curation, M.T.M.; writing—original draft preparation, M.T.M.; writing—review and editing, K.T. and D.T.; supervision, M.T.M., K.T. and D.T.; project administration, M.T.M., K.T. and D.T. All authors have read and agreed to the published version of the manuscript.

Funding

This research is co-financed by Greece and the European Union (European Social Fund—ESF) through the Operational Programme «Human Resources Development, Education and Lifelong Learning» in the context of the project “Strengthening Human Resources Research Potential via Doctorate Research—2nd Cycle” (MIS-5000432), implemented by the State Scholarships Foundation (ΙΚΥ).

Conflicts of Interest

The authors declare no conflict of interest.

References

  1. Mansour, M.; Tsongas, K.; Tzetzis, D.; Antoniadis, A. Mechanical and Dynamic Behavior of Fused Filament Fabrication 3D Printed Polyethylene Terephthalate Glycol Reinforced with Carbon Fibers. Polym. Plast. Technol. Eng. 2018, 57, 1715–1725. [Google Scholar] [CrossRef]
  2. Mansour, M.; Tsongas, K.; Tzetzis, D. Measurement of the mechanical and dynamic properties of 3D printed polylactic acid reinforced with graphene. Polym. Plast. Technol. Mater. 2019, 58, 1234–1244. [Google Scholar] [CrossRef]
  3. Mansour, M.T.; Tsongas, K.; Tzetzis, D.; Antoniadis, A. The in-plane compression performance of hierarchical honeycomb additive manufactured structures. In Proceedings of the IOP Conference Series: Materials Science and Engineering, Pitesti, Romania, 22–24 May 2019. [Google Scholar] [CrossRef]
  4. Mansour, M.T.; Tsongas, K.; Tzetzis, D. The mechanical performance of 3D printed hierarchical honeycombs using carbon fiber and carbon nanotube reinforced acrylonitrile butadiene styrene filaments. In Proceedings of the MATEC Web of Conferences, 7th International Conference of Materials and Manufacturing Engineering (ICMMEN 2020), Thessaloniki, Greece, 2–3 July 2020. [Google Scholar] [CrossRef]
  5. Tymrak, B.; Kreiger, M.; Pearce, J. Mechanical Properties of Components Fabricated with Open-Source 3-D Printers under Realistic Environmental Conditions. Mater. Des. 2014, 58, 242–246. [Google Scholar] [CrossRef] [Green Version]
  6. Chizari, K.; Arjmand, M.; Liu, Z.; Sundararaj, U.; Therriault, D. Three-Dimensional Printing of Highly Conductive Polymer Nanocomposites for EMI Shielding Applications. Mater. Today Commun. 2017, 11, 112–118. [Google Scholar] [CrossRef]
  7. Yang, Y.; Chen, Z.; Song, X.; Zhang, Z.; Zhang, J.; Shung, K.K.; Zhou, Q.; Chen, Y. Biomimetic Anisotropic Reinforcement Architectures by Electrically Assisted Nanocomposite 3D Printing. Adv. Mater. 2017, 29, 1–8. [Google Scholar] [CrossRef] [PubMed]
  8. Ning, F.; Cong, W.; Qiu, J.; Wei, J.; Wang, S. Additive Manufacturing of Carbon Fiber Reinforced Thermoplastic Composites using Fused Deposition Modeling. Comp. Part B Eng. 2015, 80, 369–378. [Google Scholar] [CrossRef]
  9. Love, L.J.; Kunc, V.; Rios, O.; Duty, C.E.; Elliott, A.M.; Post, B.K.; Smith, R.J.; Blue, C.A. The Importance of Carbon Fiber to Polymer Additive Manufacturing. J. Mater. Res. 2014, 29, 1893–1898. [Google Scholar] [CrossRef] [Green Version]
  10. Tekinalp, H.L.; Kunc, V.; Velez-Garcia, G.M.; Duty, C.E.; Love, L.J.; Naskar, A.K.; Blue, C.A.; Ozcan, S. Highly Oriented Carbon Fiber Polymer Composites via Additive Manufacturing. Comp. Sci. Technol. 2017, 105, 144–150. [Google Scholar] [CrossRef] [Green Version]
  11. Shofner, M.L.; Lozano, K.; Rodríguez-Macías, F.J.; Barrera, E.V. Nanofiber-reinforced polymers prepared by fused deposition modeling. J. Appl. Polym. Sci. 2003, 89, 3081–3090. [Google Scholar] [CrossRef]
  12. Yang, C.; Tian, X.; Liu, T.; Cao, Y.; Li, D. 3D printing for continuous fiber reinforced thermoplastic composites: Mechanism and performance. Rapid Prototyp. J. 2017, 23, 209–215. [Google Scholar] [CrossRef]
  13. Weihong, Z.; Fan, L.; Zuoguang, Z.; Lulu, S.; Zhimin, L. Short fiber reinforced composites for fused deposition modeling. Mater. Sci. Eng. A 2001, 301, 125–130. [Google Scholar] [CrossRef]
  14. Aizenberg, J.; Weaver, J.C.; Thanawala, M.S.; Sundar, V.C.; Morse, D.E.; Fratzl, P. Skeleton of Euplectella sp.: Structural hierarchy from the nanoscale to the macroscale. Science 2005, 309, 275–278. [Google Scholar] [CrossRef] [Green Version]
  15. Gibson, L.J.; Ashby, M.F.; Harley, B.A. Cellular Materials in Nature and Medicine; Cambridge University Press: Cambridge, UK; New York, NY, USA, 2010; 309p. [Google Scholar]
  16. Lakes, R. Materials with structural hierarchy. Nature 1993, 361, 511–515. [Google Scholar] [CrossRef]
  17. Ajdari, A.; Nayeb-Hashemi, H.; Vaziri, A. Dynamic crushing and energy absorption of regular, irregular and functionally graded cellular structures. Int. J. Solids Struct. 2011, 48, 506–516. [Google Scholar] [CrossRef]
  18. Gibson, L.J.; Ashby, M.F. Cellular Solids: Structure and Properties, 2nd ed.; Cambridge University Press: Cambridge, UK; New York, NY, USA, 1997; 510p. [Google Scholar] [CrossRef]
  19. Ajdari, A.; Jahromi, B.H.; Papadopoulos, J.; Nayeb-Hashemi, H.; Vaziri, A. Hierarchical honeycombs with tailorable properties. Int. J. Solids Struct. 2012, 49, 1413–1419. [Google Scholar] [CrossRef] [Green Version]
  20. Mansour, G.; Tzetzis, D.; Bouzakis, K.D. A Nanomechanical Approach on the Measurement of the Elastic Properties of Epoxy Reinforced Carbon Nanotube Nanocomposites. Tribol. Ind. 2013, 35, 190–199. [Google Scholar]
  21. Tzetzis, D.; Mansour, G.; Tsiafis, I.; Pavlidou, E. Nanoindentation Measurements of Fumed Silica Epoxy Reinforced Nanocomposites. J. Reinf. Plast. Compos. 2013, 32, 160–173. [Google Scholar] [CrossRef]
  22. Mansour, G.; Tzetzis, D. Nanomechanical Characterization of Hybrid Multiwall Carbon Nanotube and Fumed Silica Epoxy Nanocomposites. Polym. Plast. Technol. Eng. 2013, 52, 1054–1062. [Google Scholar] [CrossRef]
  23. VanLandingham, M.R. Review of Instrumented Indentation. J. Res. NIST 2003, 108, 249–265. [Google Scholar] [CrossRef]
  24. Briscoe, B.J.; Fiori, L.; Pelillo, E. Nano-Indentation of Polymeric Surfaces. J. Phys. D Appl. Phys. 1998, 31, 2395–2405. [Google Scholar] [CrossRef]
  25. VanLandingham, M.R.; Villarrubia, J.S.; Guthrie, W.F.; Meyers, G.F. Nanoindentation of Polymers: An Overview. Macromol. Symp. 2001, 167, 15–43. [Google Scholar] [CrossRef]
  26. Oliver, W.C.; Pharr, G.M. An Improved Technique for Determining Hardness and Elastic-Modulus using Load and Displacement Sensing Indentation Experiments. J. Mater. Res. 1992, 7, 1564–1583. [Google Scholar] [CrossRef]
  27. Tzetzis, D.; Tsongas, K.; Mansour, G. Determination of the Mechanical Properties of Epoxy Silica Nanocomposites through FEA-Supported Evaluation of Ball Indentation Test Results. J. Mater. Res. 2017, 20. [Google Scholar] [CrossRef] [Green Version]
  28. Piersol, A.G.; Paez, T.L. Harris’ Shock and Vibration Handbook, 6th ed.; Mcgraw-Hill: New York, NY, USA, 2009. [Google Scholar]
  29. Wevers, M. Listening to the Sound of Materials: Acoustic Emission for the Analysis of Material Behaviour. NDT E Inter. 1997, 30, 99–106. [Google Scholar] [CrossRef]
  30. Ge, T.S. Theoretical Basis of Solid Internal Friction; Science Press: Beijing, China, 2000; pp. 24–28. [Google Scholar]
  31. Mansour, G.; Tsongas, K.; Tzetzis, D.; Tzikas, K. Dynamic mechanical characterization of polyurethane/multi-walled carbon nanotube composite thermoplastic elastomers. Polym. Plast. Technol. Eng. 2017, 56, 1505–1515. [Google Scholar] [CrossRef]
  32. Tsongas, K.; Tzetzis, D.; Mansour, G. Mechanical and Vibration Isolation Behavior of Acrylonitrile-Butadiene Rubber/Multi-Walled Carbon Nanotube Composite Machine Mounts. J. Plast. Rubber Compos. 2017, 46, 458–468. [Google Scholar] [CrossRef]
  33. Ferreira, R.T.L.; Amatte, I.C.; Dutra, T.A.; Bürger, D. Experimental characterization and micrography of 3D printed PLA and PLA reinforced with short carbon fibers. Compos. Part B Eng. 2017, 124, 88–100. [Google Scholar] [CrossRef]
Figure 1. Hierarchical honeycomb structures: (a) cell of the regular and hierarchical honeycombs and (b) virtual models of hierarchies.
Jcs 05 00062 g001
Figure 2. Schematic of a typical nanoindentation load-depth curve of a viscoelastic-plastic material where hmax: the maximum depth, he: the elastic depth rebound, hr: the residual impression depth, ha: the displacement of the surface at the perimeter, and hf: the contact indentation depth.
Jcs 05 00062 g002
Figure 3. Stress-strain curves of acrylonitrile butadiene styrene (ABS), ABS/carbon nanotube (CNT) and ABS/carbon fiber (CF) specimens.
Jcs 05 00062 g003
Figure 4. Scanning electron micrographs of (a) ABS/CNT (b) and (c) ABS/CF materials.
Jcs 05 00062 g004
Figure 5. Load-depth curves of ABS, ABS/CNT and ABS/CF Fused Filament Fabrication (FFF) printed specimens.
Jcs 05 00062 g005
Figure 6. Hysteresis loops of ABS, ABS/CNT and ABS/CF FFF printed specimens.
Jcs 05 00062 g006
Figure 7. Typical experimental load displacement curves and the curve-fit utilizing an FE model of HC0, HC1 and HC2 structures for (a) ABS, (b) ABS/CNT and (c) ABS/CF materials.
Jcs 05 00062 g007
Figure 8. Comparison of the stress-strain curves for (a) regular honeycomb, (b) 1st level of hierarchy and (c) 2nd level of hierarchy for different materials: ABS, ABS/CNTs and ABS/CFs.
Jcs 05 00062 g008
Figure 9. Finite element analysis (FEA) generated stress-strain curves of different levels of hierarchy for (a) ABS, (b) ABS/CNT and (c) ABS/CF materials.
Jcs 05 00062 g009
Figure 10. Comparison of the deformation behavior prior to and after compression testing for (a) regular honeycomb, (b) 1st level of hierarchy and (c) 2nd level of hierarchy.
Jcs 05 00062 g010
Table 1. Compressive and nanoindentation properties of the ABS, ABS/CNT and ABS/CF specimens.
MaterialsCompressionNanoindentation
E-Modulus (MPa)E-Modulus (MPa)Hardness (MPa)
ABS2100 ± 1022579 ± 247137.4 ± 18
ABS/CNTs2400 ± 2342657 ± 157152.4 ± 12
ABS/CFs3273 ± 2473652 ± 436155.5 ± 19
Table 2. Hysteretic damping properties of the ABS, ABS/CNT and ABS/CF FFF printed specimens.
MaterialsHysteretic Compression
Loss Factor, n Energy Loss over a Cycle, ΔWMaximum Energy of that Cycle, W
ABS2.5%0.0174660.224442
ABS/CNTs3.7%0.0164030.142183
ABS/CFs10.0%0.0322120.102366
Publisher’s Note: MDPI stays neutral with regard to jurisdictional claims in published maps and institutional affiliations.

