Article

Modified Polylactic Acid with Improved Impact Resistance in the Presence of a Thermoplastic Elastomer and the Influence of Fused Filament Fabrication on Its Physical Properties

1
ITheMM EA 7548, Université de Reims Champagne Ardenne, 51097 Reims, France
2
Materia Nova, 3 Avenue Nicolas Copernic, 7000 Mons, Belgium
*
Author to whom correspondence should be addressed.
J. Compos. Sci. 2021, 5(9), 232; https://0-doi-org.brum.beds.ac.uk/10.3390/jcs5090232
Submission received: 21 July 2021 / Revised: 25 August 2021 / Accepted: 28 August 2021 / Published: 2 September 2021
(This article belongs to the Special Issue Sustainable Biocomposites)

Abstract

:
The standard polylactic acid (PLA), as a biodegradable thermoplastic polymer, is commonly used in various industrial sectors, food, and medical fields. Unfortunately, it is characterized by a low elongation at break and low impact energy. In this study, a thermoplastic copolyester elastomer (TPCE) was added at different weight ratios to improve the impact resistance of PLA. DSC analysis revealed that the two polymers were immiscible. A good balance of impact resistance and rigidity was reached using the formulation that was composed of 80% PLA and 20% TPCE, with an elongation at break of 155% compared to 4% for neat PLA. This new formulation was selected to be tested in a fused filament fabrication process. The influence of the nozzle and bed temperatures as printing parameters on the mechanical and thermal properties was explored. Better impact resistance was observed with the increase in the two thermal printing parameters. The crystallinity degree was not influenced by the variation in the nozzle temperature. However, it was increased at higher bed temperatures. Tomographic observations showed an anisotropic distribution of the porosity, where it was mostly present between the adjacent printed filaments and it was reduced with the increase in the nozzle and bed temperatures.

1. Introduction

Fused filament fabrication (FFF), as one of the additive manufacturing technologies, creates a three-dimensional physical product from a digital design by adding the used material layer-by-layer until a full three-dimensional shape is created [1]. It is mostly used to prepare prototypes and functional parts for different sectors, including farming, medical fields, and aerospace [2]. It has various advantages, such as the minimal waste of material, low cost, easy-to-use process, and the possibility to fabricate three-dimensional products with complex geometries that other conventional processes cannot prepare. Thermoplastic polymers in the filament form are usually used as the raw material for this technology. The filament is heated, extruded through a nozzle, and deposited on the build plate of the 3D printer. The most common and popular filaments are polylactic acid (PLA) [3] and polyacrylonitrile butadiene styrene (ABS) [4].
PLA is a biodegradable thermoplastic polyester that is obtained from renewable and natural resources. It is generally manufactured from corn or sugar beets [5] and is used in packaging, biomedicine, and many industrial applications due to its biocompatibility, compostability, abrasion resistance, rigidity, and good processability [6]. However, there still are some weaknesses of PLA that need to be overcome first: it has a low elongation at break and low impact resistance compared to some other conventional polymers. These disadvantages limit the use of PLA in various applications that require materials with some flexibility at higher stresses [7]. Multiple studies were realized to enhance the impact resistance of PLA, which was possible by changing the mixture formulation via adding a plasticizer [8] or a copolymer [3], or by changing the process conditions, such as the optimization of annealing time of injected parts [5] or the modification of the FFF printing parameters [9,10].
FFF technology parameters, including the nozzle temperature, bed temperature, infill density, layer thickness, raster orientation, and printing speed, have an influence on the mechanical properties, filling quality, and internal porosity distribution of printed parts. In the literature, the influence of printing parameters on the mechanical properties mostly concerned ABS-based products [11,12]. The nozzle and bed temperatures can also have an effect on the crystallinity behavior of crystalline and semi-crystalline polymers. C. Benwood et al. [10] and L. Wang et al. [9] confirmed that the mechanical properties and crystallinity degree of printed PLA increased with the increase of the bed temperature. In addition, they found that the nozzle temperature did not show any noticeable influence on the mechanical and thermal properties of PLA. A higher layer thickness negatively influenced the impact resistance of PLA [9]. Printed parts had higher porosity compared to other parts that were fabricated using other conventional processes, such as injection molding, which negatively influenced the mechanical properties of printed samples [13].
The modification of mixture composition by adding a plasticizer or a copolymer, as a solution to improve the impact resistance of PLA, depends on the application of the modified material, e.g., in the food field, it requires materials with nontoxic modifiers. Various plasticizers for PLA were tested, such as triacetine, tributylcitrate, acetyl tributyl citrate, triethyl citrate, and acetyl triethyl citrate [14]. Higher plasticizer contents were recommended to enhance the impact resistance. In parallel, it had some limits that need to be avoided in medical applications, including the evaporation of plasticizers at higher temperatures, which induces a return of the brittle behavior of the material, and the migration of plasticizers to the surface, which can cause the contamination of materials.
The addition of a flexible polymer to PLA is an alternative and promising solution to improve its impact resistance but it has some limits that are generally related to the compatibility between the compounds. J. V. Ecker et al. added an amorphous polyhydroxyalkanoate (PHA) copolymer; as a result, the rigidity of PLA decreased and the impact energy was significantly improved [15]. They also found that the printed samples had less rigidity than injected samples due to the presence of porosity between the printed layers. The elongation at break of PLA was 21 times higher after the addition of caprolactone (PCL) [16]. M. Kumar et al. slowly increased the impact strength of PLA as the content of polybutylene adipate terephthalate (PBAT) increased [17]. The impact strength of PLA/PBAT was three times higher in the presence of the plasticizer glycidyl methacrylate (GMA).
In the same context as those studies presented previously, thermoplastic copolyester elastomers (TPCEs) could be a reasonable and attractive solution for the fragility of PLA. They are composed of hard segments in a semi-crystalline form and long flexible segments in an amorphous state [18]. TPCEs are known for their excellent flexibility, high impact strength, good resistance to tearing, and simple processing characteristics. They were added to improve the ductility of some thermoplastics polymers, such as polycarbonate (PC) polymer and polyethylene terephthalate (PET) polymer [19].
The aim of this study was to improve the impact resistance of PLA by adding a TPCE. This article presents the thermal and mechanical properties of the neat PLA and PLA/TPCE blends with different ratios of TPCE. A PLA/TPCE blend exhibiting a good balance of higher impact energy and elongation at break with enough rigidity was selected to be tested using a 3D printing process. The influence of nozzle and bed temperatures as thermal printing conditions on the mechanical and thermal properties of the printed PLA/TPCE blend was explored. Tomographic observations were carried out to determine the internal porosity and pore distribution in printed samples.

2. Materials and Methods

2.1. Materials

The PLA/TPCE compounds were prepared using neat PLA 4032D from NatureWorks and distributed by Resinex (Arendonk, Belgium) and a thermoplastic polyester elastomer (TPCE) named Hytrel® 3046 NC010 from DuPont (Le Grand-Saconnex, Switzerland). This TPCE was composed of hard segments that were based on poly(butylene terephthalate) and soft segments that were based on poly(tetramethylene ether) glycol (Figure S1 in Supplementary Files). Later in this study, this thermoplastic elastomer is referred to as “Hytrel” and the two kinds of segments are referred to as “PBT” and “PTMG.” From the 1H NMR analysis on Hytrel, the mass fraction of the hard and soft segments were 25 wt% and 75 wt%, respectively. Some of its physical properties provided by the supplier were: Young’s modulus of 24 MPa, tensile strength at break of 20 MPa, and no break was observed during izod impact tests at +23 °C according to ISO 179/1eA (thermomechanical behavior of Hytrel in Figure S2 in Supplementary Files). PLA was a semi-crystalline polymer with a glass transition temperature between 55 and 60 °C and a melting point between 150 and 170 °C. Its commercial mechanical properties from the technical sheet were: Young’s modulus of 3.5 GPa, a tensile strength of 60 MPa, elongation at break of 6%, and an izod impact energy of 16 J/m.

2.2. Elaboration of Blends

The PLA/Hytrel compounds were prepared using an extrusion process on a Leistritz co-rotating twin-screw extruder (Leistritz ZSE 18, D = 18 mm, L/D = 50, Germany). PLA pellets (PLA 4032D) and Hytrel pellets were dried in a hot air oven at 60 °C for 24 h. The composition of PLA/Hytrel blends with different percentages of Hytrel is listed in Table 1. The screw rotation speed was set to 250 rpm with a residence time of 4 min. The temperatures profile was 200 °C (feeding)/210 °C/190 °C (die). The specimens for tensile and impact tests were prepared using a compression molding process (mold temperature between 220 and 240 °C, the first step at 10 bars for 3 min, the second step at 150 bars for 2 min, and the cooling step at 50 bars for 4 min). The tensile tests were prepared according to ASTM D638 type V with a thickness of 0.55 mm. The dimensions of the rectangular impact test specimens were 62.6 mm × 12.2 mm × 3.1 mm. Five tensile and impact test specimens were prepared using the same conditions.

2.3. 3D Printing

The PLA/Hytrel blend samples were all printed using a Raise 3D N1 (Raise3D, Irvine, CA, USA). Tensile test specimens were printed using the nominal dimensions from the ASTM D638 type IV with a thickness of 3.2 mm. The digital design of specimens was prepared using computer-aided design software (Catia Dassault Systems, Vélizy-Villacoublay, France). The STL file was exported from the digital design and then transferred into 3D printing slicing software named IdeaMaker (Raise3D, USA) to generate the G-code file that was loaded in the 3D printer. Impact test specimens were printed using the same 3D printer and using the following dimensions: 65 mm × 12.8 mm × 3.2 mm. Except for the nozzle and bed temperatures, all other printing conditions were kept constant and are presented in Table 2. For the tensile and impact test specimens, five samples were printed separately under the same printing conditions. Examples of the printed parts are presented in Figure 1.

2.4. Characterizations

Scanning electron microscopy (SEM, Hitachi SU8020, Tokyo, Japan) with an acceleration voltage of 5 kV was used to observe the morphology of the PLA/Hytrel blends using in the fractured impact test specimens and to evaluate the miscibility between these two polymers. The magnification was set at ×5.00 k using secondary electrons.
Differential scanning calorimetry (DSC) analysis was used to determine the characteristic temperatures (glass transition, melting, and crystallization temperatures) and the crystallinity percentage of the PLA/Hytrel blends. This technique was also used to evaluate the influence of the nozzle and bed temperatures on the crystallinity behavior of the selected PLA/Hytrel blend for the 3D printing process. This thermal analysis was composed of 2 cycles of heating and then cooling between −80 °C and 250 °C, with a heating (and a cooling) rate of 10 °C/min applied to approximately 5 mg of samples placed in hermetic aluminum pans with a 50 mL/min nitrogen rate flow. These experiments were conducted using a DSC Q20 from TA instruments (New Castle, DE, USA). The crystallinity of the PLA was calculated using the following Equation (1), where ∆Hm and ∆Hcc are, respectively, the melting enthalpy and the cold crystallization enthalpy of PLA calculated from DSC curves. ω f is the mass fraction of the PLA in the PLA/Hytrel blends. Δ H m ° is the melting enthalpy of 100% crystalline PLA, which is theoretically 93 J/g [20].
χ c ( % ) = Δ H m Δ H c c ω f × Δ H m ° × 100
Mechanical characterizations were realized to evaluate the influence of Hytrel on the mechanical properties of the PLA prepared using compression molding and to explore the influence of the two thermal printing conditions on the mechanical properties of the printed specimens. Tensile tests were realized using an Instron 3382 universal machine (Norwood, MA, USA) at room temperature. The crosshead speed was set to 5 mm/min with a 10 kN capacity load cell. The impact tests were realized using a Ray-Ran 2500 universal pendulum impact tester (Ray-Ran, New Castle, DE, USA) following ASTM D256. An energy of 4 J was sufficient to break all specimens. The average value of five samples of each mechanical parameter, including Young’s modulus, the ultimate tensile strength, the strain at ultimate tensile strength, and the impact energy, are presented in different figures.
Porosity was determined to investigate the effect of the thermal printing parameters on the fill quality of the printed PLA/Hytrel specimens. It was calculated from the relative density according to Equation (2), where ρ and ρ s are, respectively, the measured density and the density of the PLA/Hytrel blends (i.e., 1.2 g/cc). The measured density was determined by weighing and measuring the dimensions of the tensile test specimens using, respectively, an analytical Balance Mettler Toledo (AE 240, Mettler Toledo, Columbus, OH, USA) with a precision of 0.03 mg and an electronic digital Caliper (500-181-30, Mitutoyo Caliper, Tokyo, Japan) with a precision of 0.02 mm.
Porosity   ( % ) = ( 1 ρ ρ s ) × 100
Tomographic observations were carried out to calculate the internal porosity and to qualify the microstructure of the specimens that were printed with different nozzle and bed temperatures using a microtomograph (µCT) DeskTom 150 (RX-solutions, Chavanod, France). The specimens were scanned with a resolution of around 20 µm. The tube voltage and the tube current were set, respectively, to 60 kV and 500 µA. The 3D volume was reconstructed from 2D images using X-Act software (RX-solutions, Chavanod, France). The data treatment of the porosity percentage and pore size distribution was conducted using VG Studio Max3.0 software (Volume Graphics, Heidelberg, Germany). The scanned area of the printed tensile test specimens is illustrated in Figure 2.

3. Results and Discussion

3.1. Influence of the Formulation of Blends

3.1.1. Thermal Properties
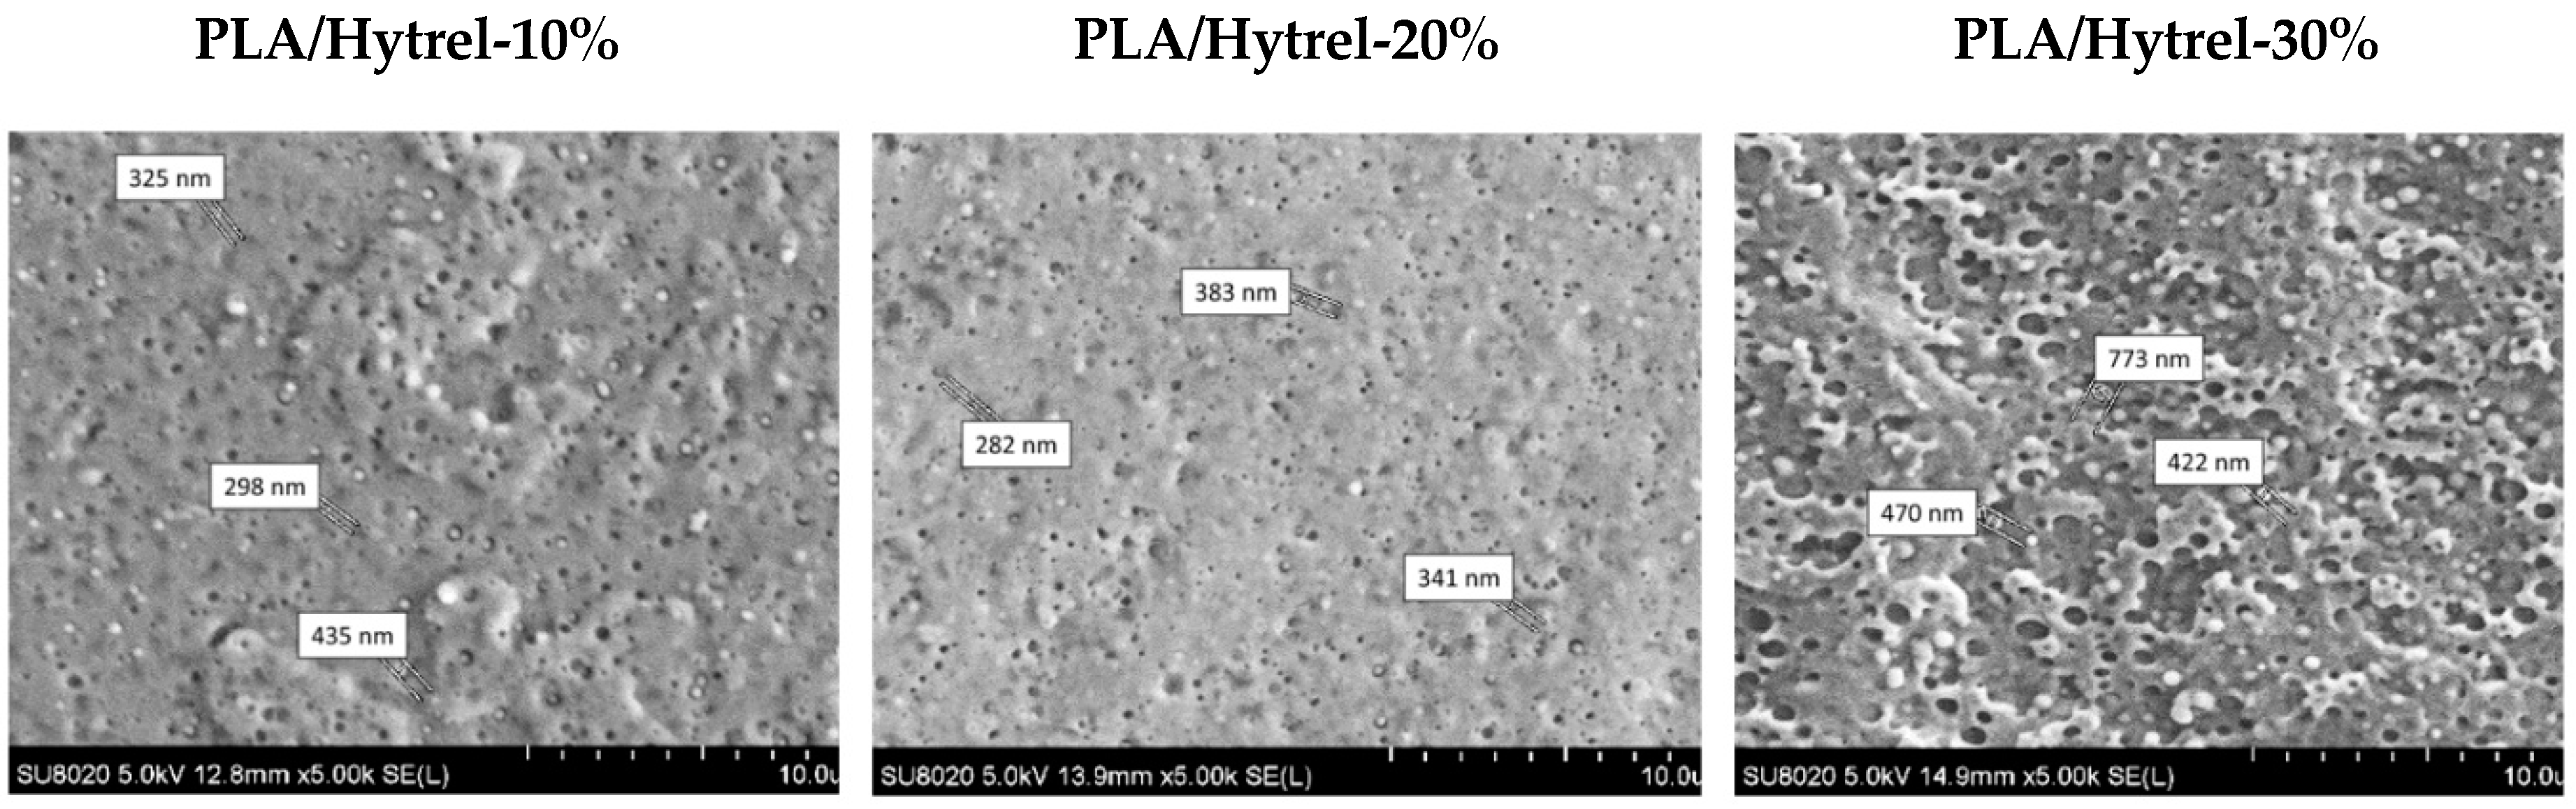
A typical DSC thermogram during the second heating cycle of different blends is presented in Figure 3. A melting endotherm of Hytrel (near 9 °C) could be observed, as well as the glass transition of PLA (near 60 °C), the cold crystallization endotherm of PLA (near 105 °C), and the melting endotherm of PLA (near 168 °C). Table 3 shows that the increase in Hytrel content had no substantial influence on the glass transition and melting temperatures of PLA. Consequently, the DSC analysis of the blends revealed that PLA and Hytrel were immiscible. On the other hand, the cold crystallization temperature of PLA remained constant. Therefore, the Hytrel content did not substantially influence the crystallinity rate of the PLA. Then, concerning the crystallinity percentage of the PLA, it was difficult to establish a link between the composition and the crystallinity because the results of crystallinity presented show significant standard deviations. The only thing that was sure was that the crystallinity of the PLA in the blends was low; it did not exceed 6.6%. This value was low compared to the value (45%) of the crystallinity of the PLA 4032D when this one is highly crystallized. Consequently, we could conclude that Hytrel did not have a significant influence on PLA crystallinity in the blends. Similar results were presented by Yan et al. [21] with PLA/eSEPS blends and by Bernades et al. [22] with PLA/TPU and PLA/ethylene elastomer blends, where little variation in thermal properties was observed.
The crystallinity percentage of the impact test samples was calculated from the first heating cycle. The crystallinity percentage of PLA according to the Hytrel content in the impact test bars is shown in Figure 4. The crystallinity percentage was low regardless of the Hytrel content in the blends. As an example, when PLA 4032D was highly crystallized, after an annealing step, the crystallinity percentage was around 45%.

3.1.2. Morphology

DSC analysis verified that PLA and Hytrel were immiscible. The morphology of different blends could be visualized using SEM technology. Figure 5 presents SEM images of the PLA/Hytrel blends for different contents of Hytrel (10%, 20%, and 30%). All formulations had a biphasic system that was based on PLA and Hytrel. Hytrel was dispersed in a spherical form in the dominant phase of the PLA matrix. The diameters of the Hytrel spheres were around 250 nm and 450 nm for Hytrel fractions of 10% and 20%, respectively. The diameter was increased with the increase in Hytrel content; it was between 420 and 780 nm for 30% Hytrel in PLA. The interface between PLA and Hytrel clearly appeared at higher Hytrel contents, showing that the two polymers had poor miscibility. These results are in agreement with those presented by Yan et al. [21] with PLA/eSEPS blends and by Deng et al. [23] with PLA/EVA blends.

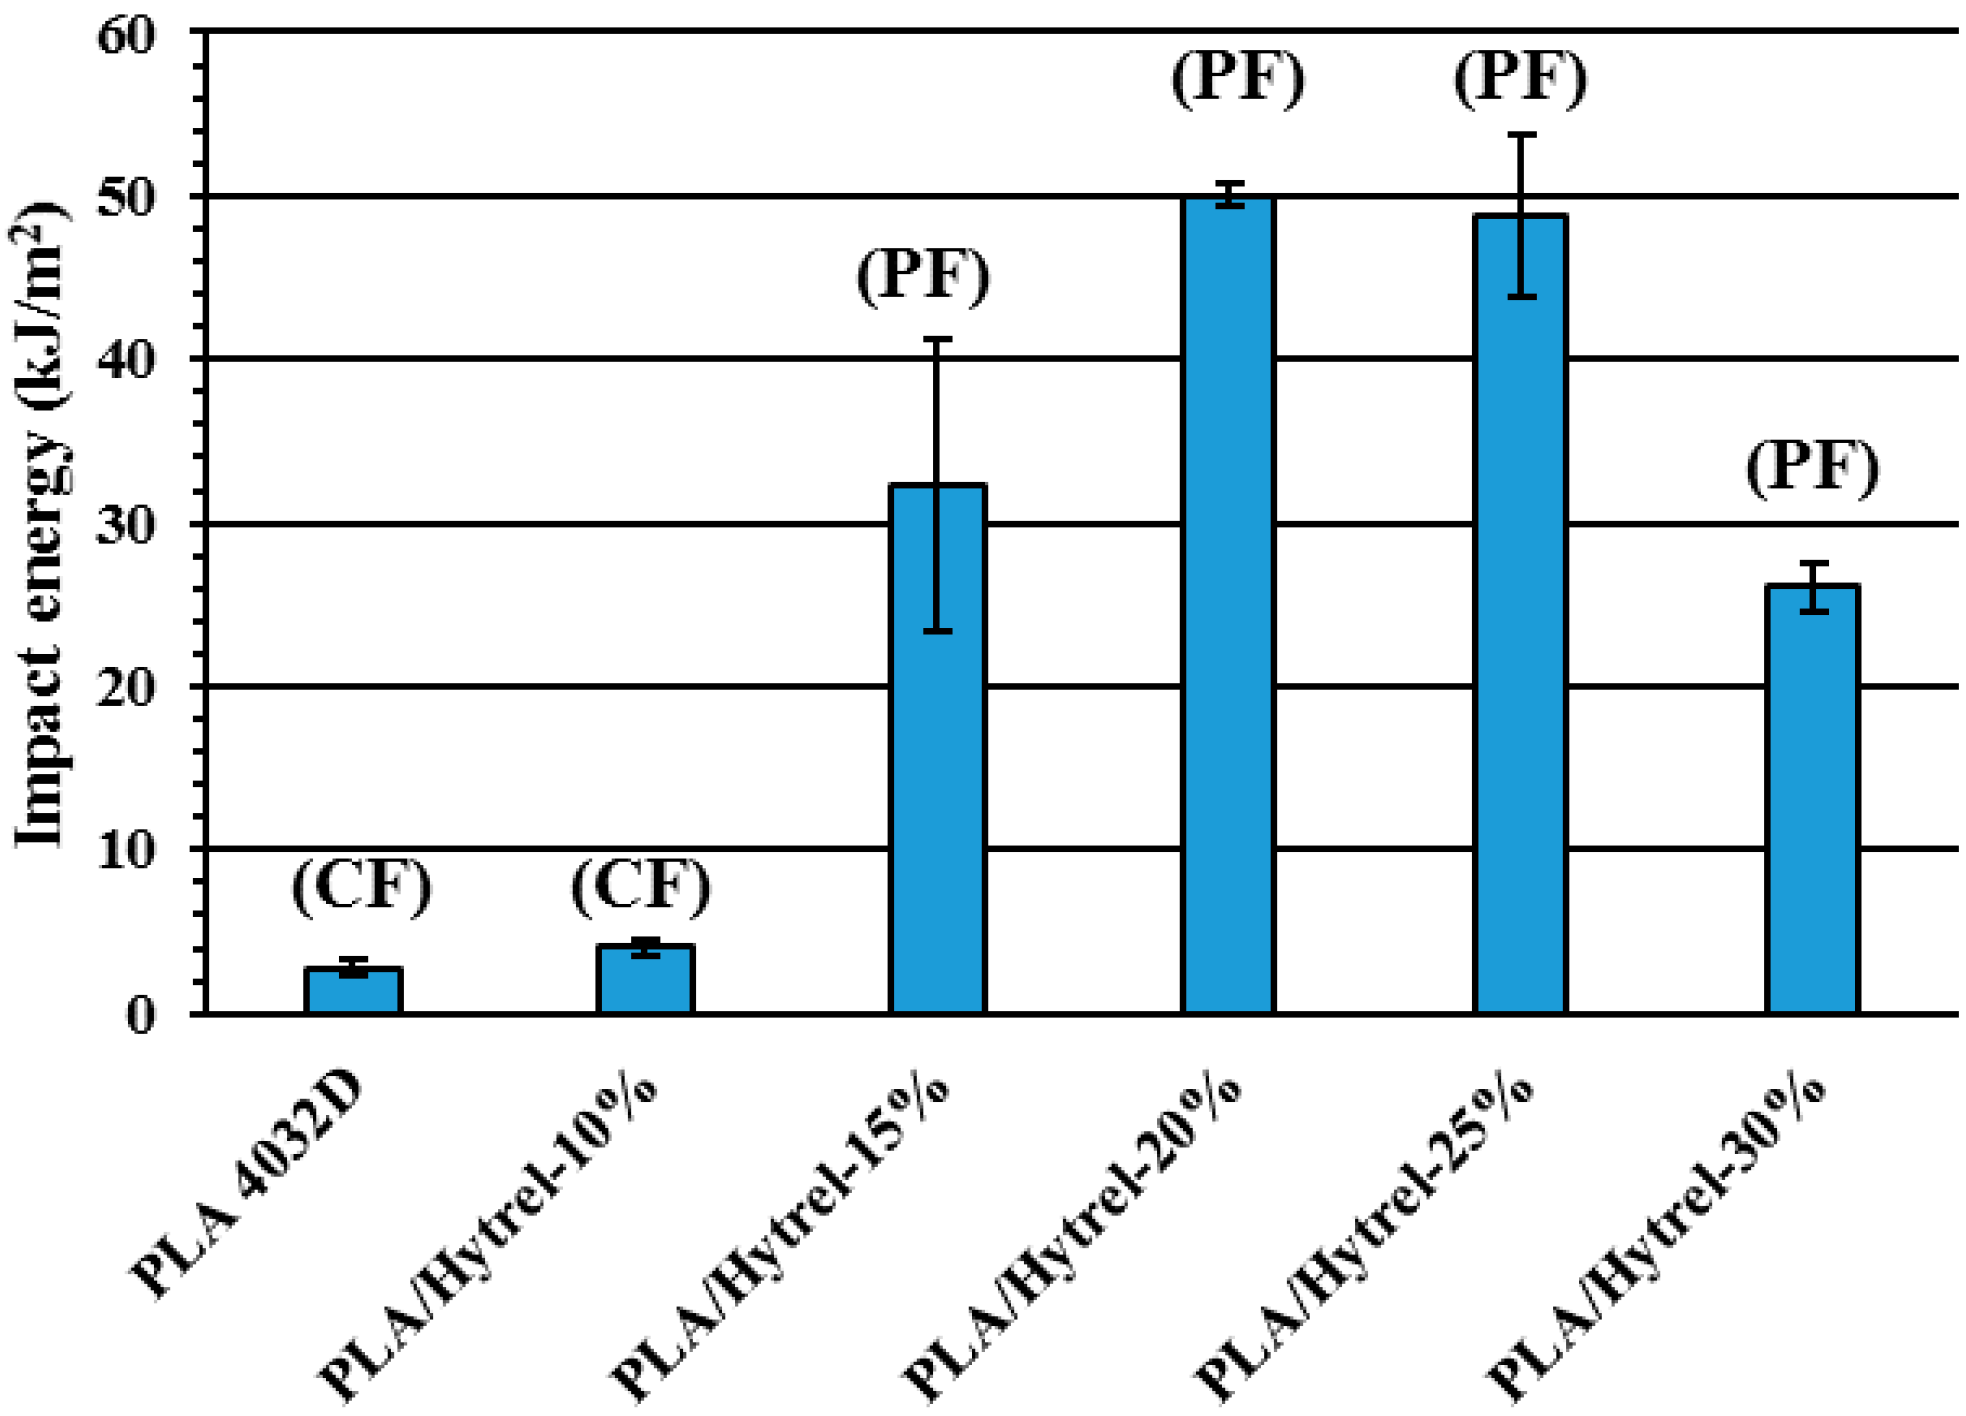
3.1.3. Mechanical Properties

The mechanical properties, Young’s modulus, and the elongation at break of the PLA 4032D and PLA/Hytrel blends are presented in Figure 6. Young’s modulus of the blends decreased with the rise in Hytrel percentage, from 3380 MPa for PLA 4032D to 1900 MPa for compounded PLA with 25% of Hytrel. This reduction was normal due to the addition of a soft polymer to a rigid one. Kang et al. [24] showed similar mechanical behavior with a PLA/biobased polyester elastomer. On the other hand, an improvement in the ductility of PLA was observed after the addition of Hytrel. The maximum elongation at break was 182%, which was obtained with 15% Hytrel in PLA (ductile behavior) compared to a 4% maximum elongation for PLA 4032D (brittle behavior). Good values of the elongation at break were also reached at 20% and 30% Hytrel in the blends. Therefore, a small amount of Hytrel was able to improve the ductility of PLA without a major reduction in Young’s modulus: when 10% Hytrel was added to PLA, the elongation at break of the PLA/Hytrel-10% blend reached 102%, 25 times higher than its value for PLA 4032D and Young’s modulus for PLA/Hytrel-10% was 3020 MPa compared to 3380 MPa for PLA 4032D. At an ambient testing temperature, Hytrel was above its glass transition temperature; therefore, it provided higher flexibility and chain mobility to the blends.
The impact energy of neat PLA and the PLA/Hytrel blends was measured and is presented in Figure 7. The impact energy of PLA was greatly enhanced after the addition of Hytrel. The highest value was obtained at 20% and 25% Hytrel; it was around 50 kJ/m2, 18 times higher than its value for the PLA 4032D. The flexibility and chain mobility of Hytrel at ambient temperature revealed the high energy absorbed by the PLA/Hytrel blends. Then, the impact energy decreased to 26.1 kJ/m2 for PLA/Hytrel-30%. Higher Hytrel contents induced the agglomeration of particles and the formation of voids due to the non-miscibility between PLA and Hytrel. Consequently, the impact resistance decreased. Similar observations were found by J. Cai et al., who worked on PLA and poly(ether-block-amide) copolymer [25] and by Deng et al. [23], who worked on PLA/EVA. During the impact test, a complete fracture was present in the PLA 4032D samples and PLA/Hytrel-10% blend. However, as the content of Hytrel increased, partial break behavior was exhibited.
Figure 8 shows an example of a partial break that was present in the PLA/Hytrel-20% samples. A stress-whitening zone was present around the crack tip (contoured in black in Figure 8). This phenomenon was the result of some cavities around rubber particles, microvoids, and crazies that appeared during the deformation process caused by the non-miscibility between PLA and Hytrel [26].
According to the previous results, the compounded PLA with 20% Hytrel exhibited a good impact resistance with enough rigidity and higher elongation at break. This PLA/Hytrel-20% formulation was tested in the 3D printing process to explore the influence of the two thermal printing parameters, namely, nozzle temperature and bed temperature, on the mechanical properties, crystallinity behavior, and microstructure of the printed specimens.

3.2. Influence of 3D Printing Parameters on PLA/Hytrel-20%

3.2.1. Mechanical Properties

The influence of the bed temperature on the mechanical parameters (Young’s modulus, ultimate tensile strength, and strain at the ultimate tensile strength) and porosity of the PLA/Hytrel-20% printed samples is presented in Figure 9. With the increase of the bed temperature, Young’s modulus and the ultimate tensile strength were significantly improved and the porosity was reduced, respectively, from 1600 MPa and 30 MPa at 30 °C with a porosity of 27% to 2200 MPa and 42 MPa at 110 °C with a porosity of 6%. On the other hand, no significant influence of the bed temperature on the strain at the ultimate tensile strength was observed; it was around 2.5% for different bed temperatures. The increase in mechanical performance at higher bed temperatures was due to the 3D printing process. Indeed, at higher bed temperatures above the glass transition temperature of PLA, the deposited material cooled slowly and the macromolecular chains had higher mobility. Consequently, the diffusion and adhesion between adjacent printed layers became higher and easier, providing a better filling quality and good mechanical properties. Similar conclusions were found by L. Wang et al., who worked on PLA [9]. Furthermore, the bed temperature could influence the crystallization behavior of the printed PLA/Hytrel blend. At higher bed temperatures, the lower temperature gradient between the nozzle and bed temperatures, and hence slow cooling, led to producing more crystallites, which improved the mechanical performance of the PLA/Hytrel blend. This point is developed later in the thermal characterization section of this article.
Figure 10 presents the variation of Young’s modulus, the ultimate tensile strength, the strain at the ultimate tensile strength, and the porosity at three different nozzle temperatures (210 °C, 230 °C, and 250 °C). Young’s modulus and the ultimate tensile strength increased with the rise of the nozzle temperature, respectively, from 1650 MPa and 36 MPa at 210 °C to 2300 MPa and 57 MPa at 250 °C. The improvement in the mechanical properties was accompanied by a reduction in the porosity from 17% at 210 °C to 4% at 250 °C. Due to the presence of porosity, Young’s modulus of the printed parts was lower than its value for compression-molded samples. No significant variation in the strain at the ultimate tensile strength at different nozzle temperatures was found; it was around 2.4%. The improvement of mechanical performance at higher nozzle temperatures was explained by a reduction in the melt viscosity that led to obtaining a better filling quality during the printing process. The filament deposited on the lower layer, at a higher temperature, partially melted to the older one, which provided a stronger adhesion between the adjacent printed layers. Therefore, lower porosity and better material rigidity were obtained at higher nozzle temperatures. The same conclusions were found by B. Vo et al., who worked on polypropylene samples [27].
The influence of the nozzle and bed temperatures on the impact energy of the PLA/Hytrel-20% printed samples is shown in Figure 11. The impact energy was positively influenced by the variation in the bed temperature. A small difference was present between 30 and 60 °C. However, the impact energy was greatly enhanced at 110 °C. It was around 4.8 kJ/m2 at 30 °C and increased to 12.3 kJ/m2 at 110 °C. The nozzle temperature had the same effect on the impact energy. When the nozzle temperature increased, the impact energy was also increased from 4.2 kJ/m2 at 210 °C to 6.3 kJ/m2 at 250 °C. The impact energy of printed samples was lower than the compression-molded samples due to the presence of porosity and lower adhesion between printed layers. The difference in the crystallinity degree between printed and molded parts can also have an effect on the impact energy. Indeed, crystallization depends on the arrangement of macromolecular chains and can be modified by the bed temperature, as was explored in previous studies on PLA [9,28]. In conclusion, the impact test results confirmed what was found in the tensile tests. The mechanical performance of the PLA/Hytrel-20% printed samples was enhanced with the increase in the bed and nozzle temperatures. The improvement in the rigidity and impact energy was due to the better adhesion between printed layers and the good filling quality during the printing process at higher bed and nozzle temperatures.

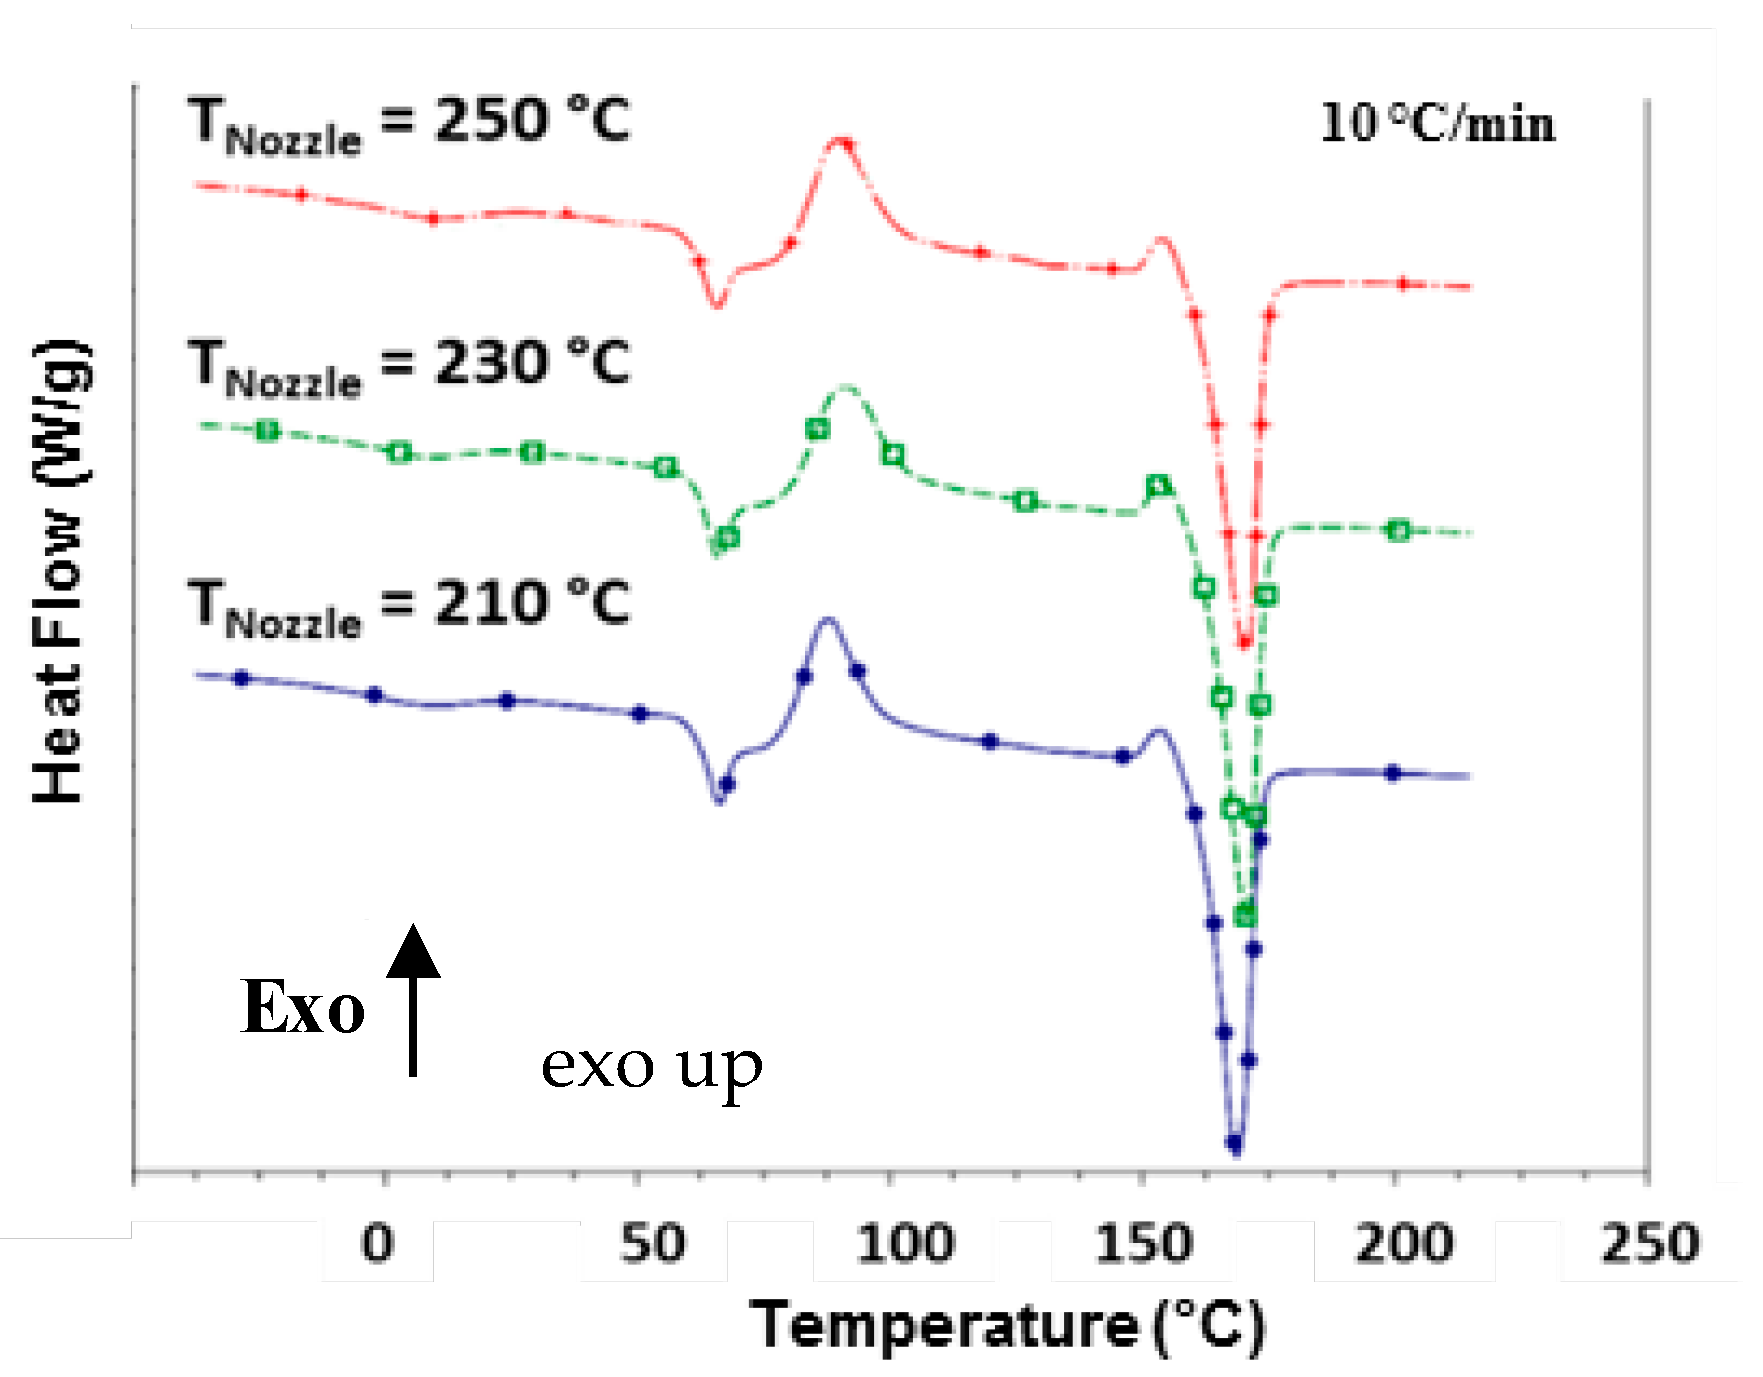
3.2.2. Thermal Properties
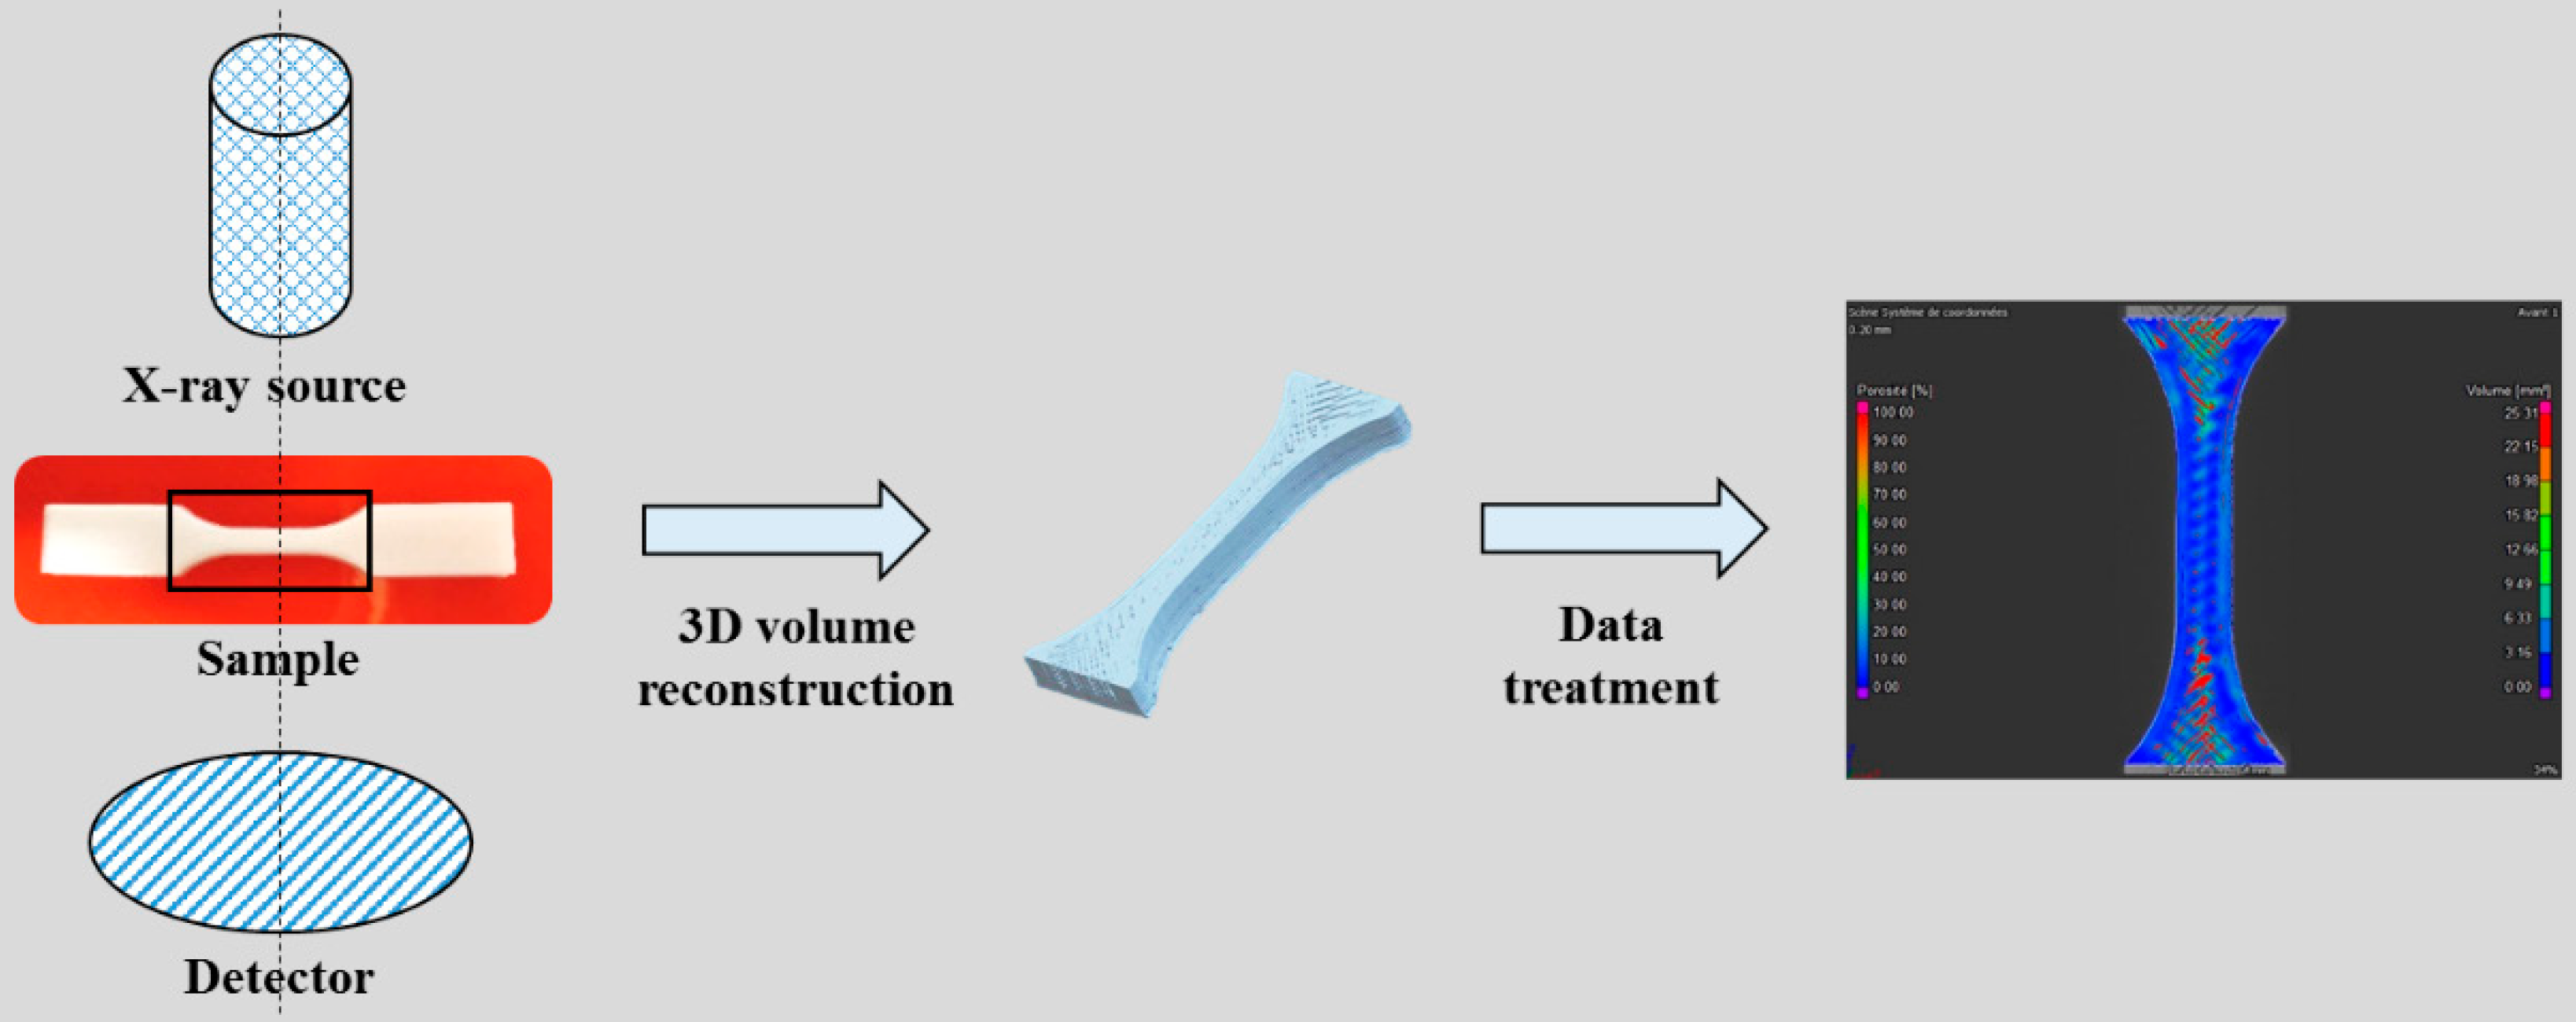
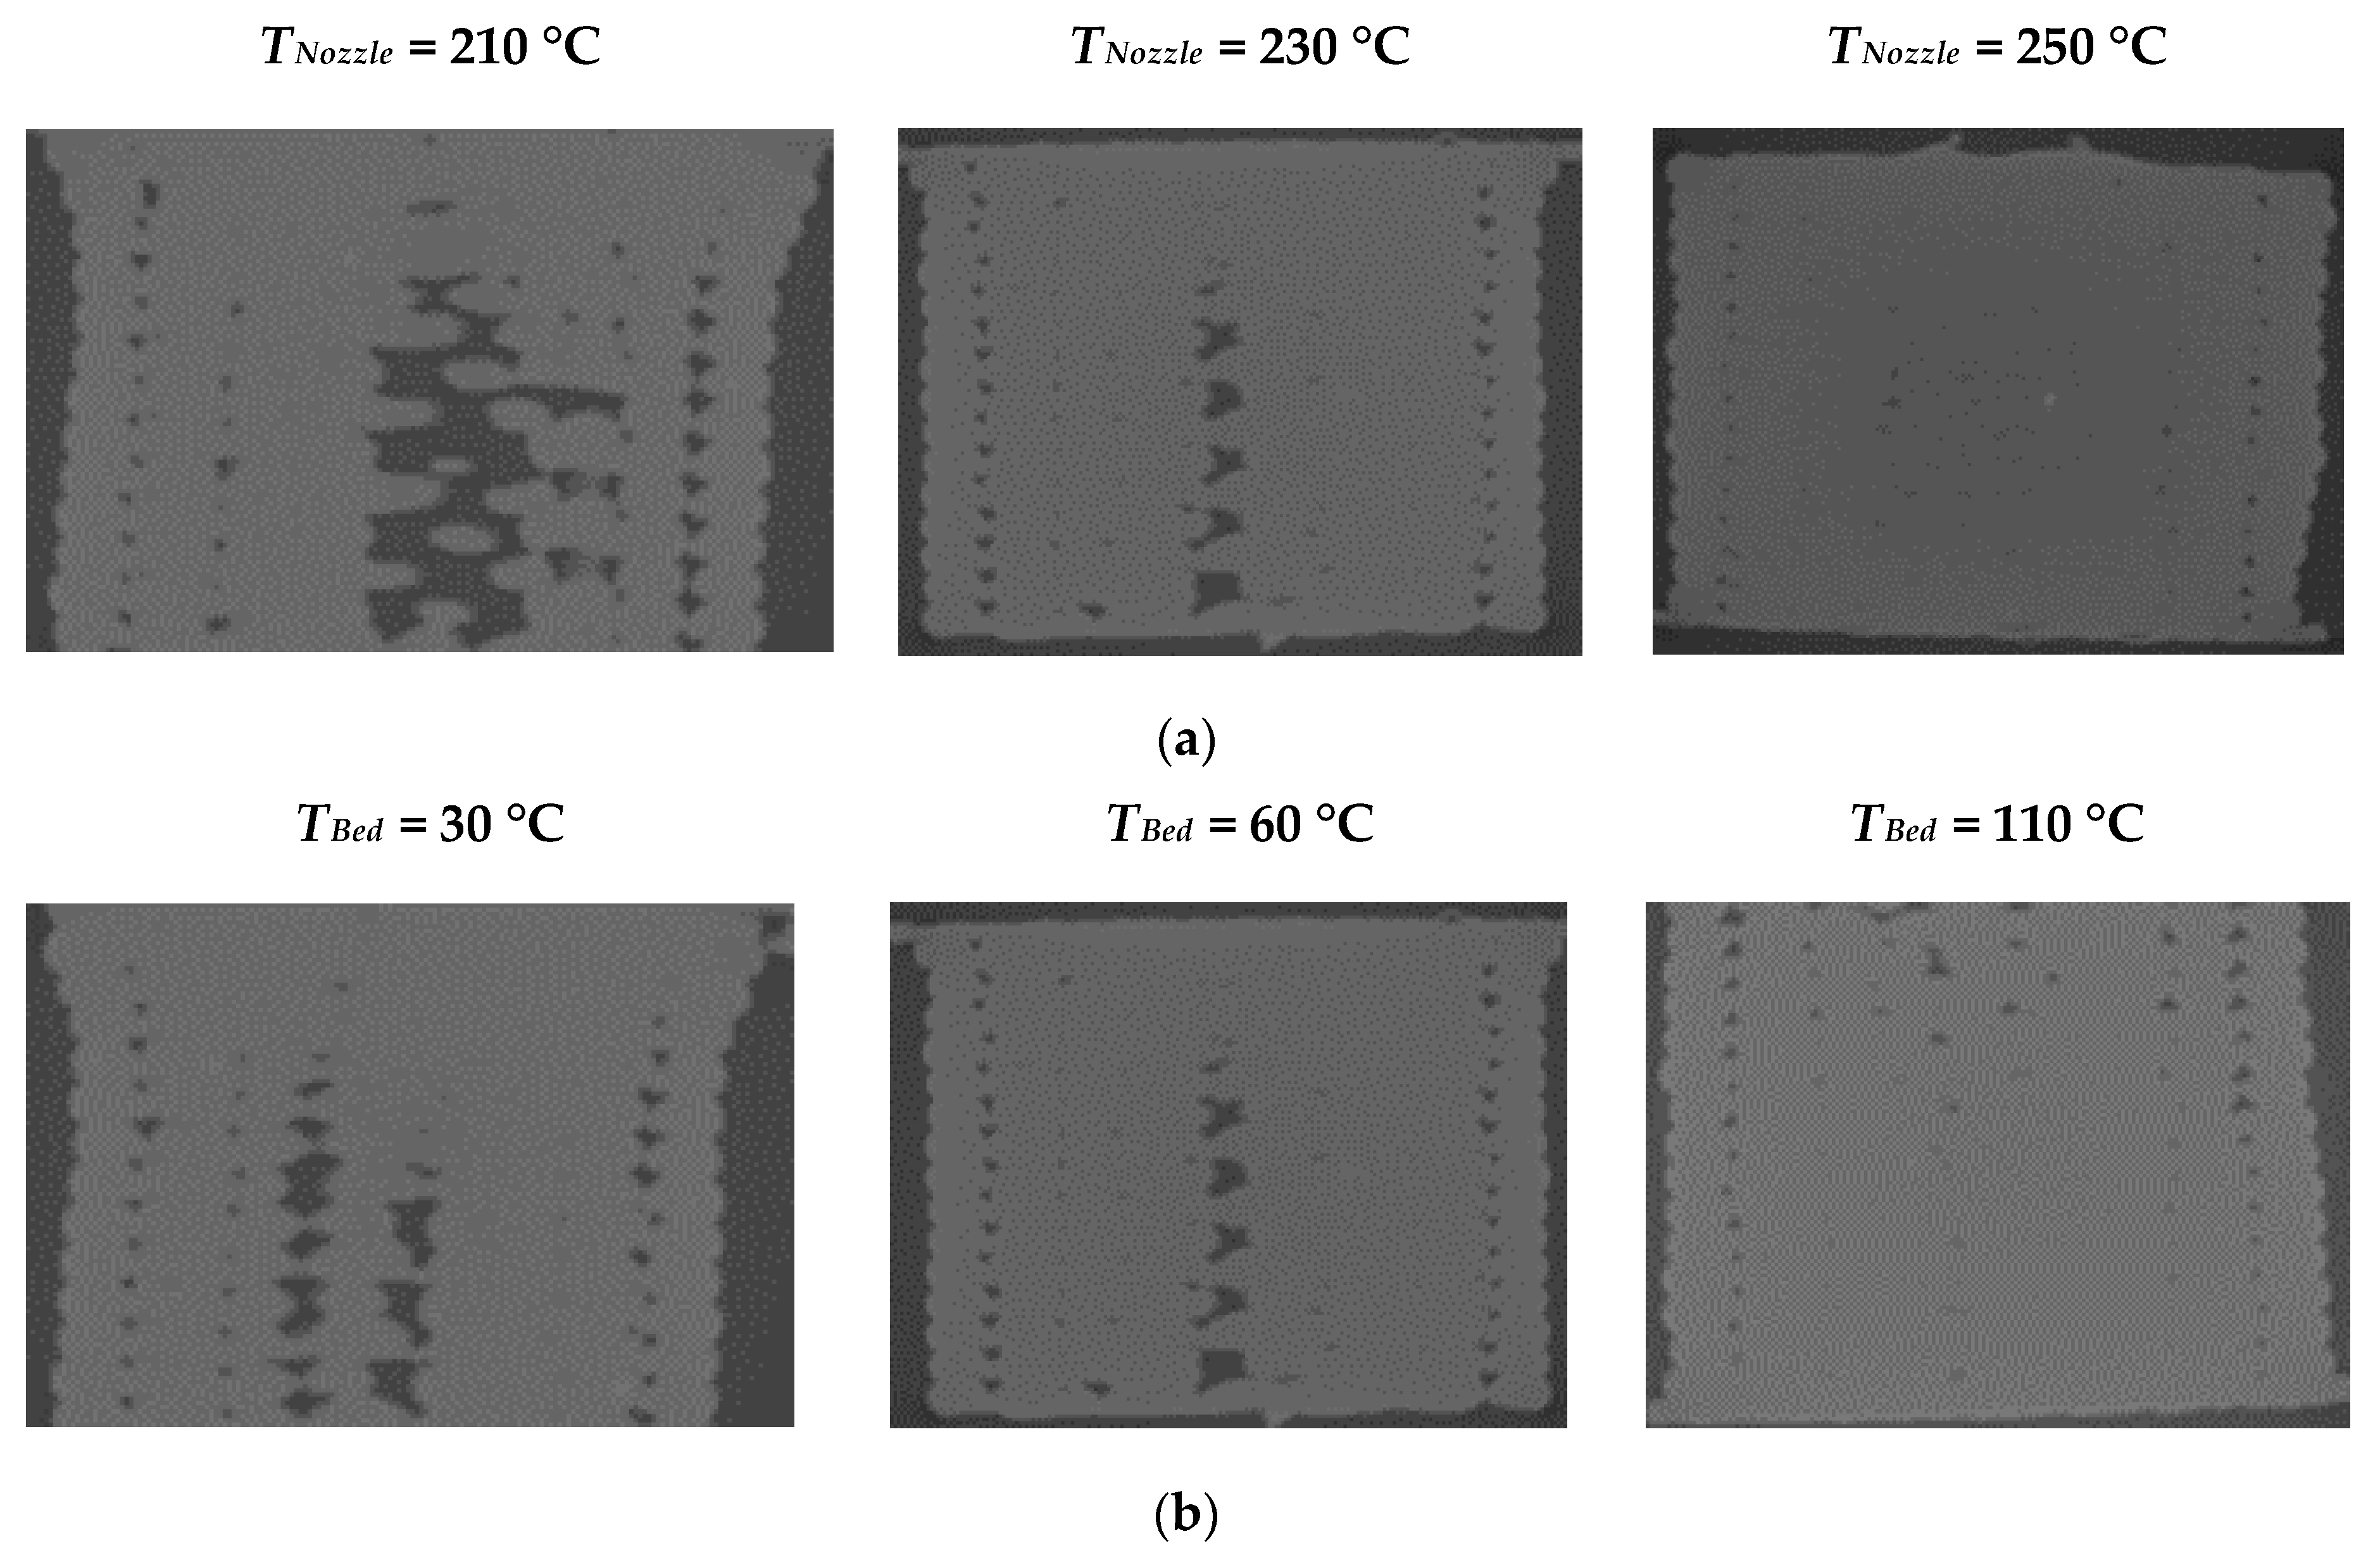
Thermal analysis was used to explore the influence of the bed and nozzle temperatures on the crystallinity degree of the printed samples that were based on the PLA/Hytrel-20% blend. The degree of crystallinity at different temperatures is presented in Figure 12. The nozzle temperature did not have a significant effect on the degree of crystallinity of PLA; it was around 10% at 210 °C, 230 °C, and 250 °C. With the increase in the nozzle temperature, the mechanical properties of PLA/Hytrel-20% were enhanced, as was found in the tensile and impact tests, even though the degree of crystallinity was still the same. This meant that there were several other factors related to the 3D printing process that influenced the mechanical properties without affecting the thermal properties, as was found by M. Behzadnasab et al. [29]. Figure 13 presents the DSC curves of the PLA/Hytrel-20% printed samples at various nozzle temperatures. The melting peak of PLA still appeared at the same temperature of around 168 °C. A small exothermic peak corresponded to a crystalline phase transition, which appeared at 155 °C before the melting peak of PLA. On the other hand, the degree of crystallinity was notably affected by the variation in the bed temperature. An increase in the bed temperature was followed by an increase in the degree of crystallinity from 9.8% at 30 °C to 14.8% at 110 °C. At a higher bed temperature above the glass transition temperature of PLA, the mobility of macromolecular chains with a low cooling rate at a lower temperature gradient increased, which contributed to a better rearrangement of chains and the formation of crystallites. In addition to the increase in the crystallinity degree, the quality of filling during the 3D printing process was also improved, where a lower porosity at a higher bed temperature was obtained. This explained the improvement in the mechanical performance in the tensile and impact tests.

3.2.3. Porosity

The mechanical properties depend on the material and the conditions of implementation. In the FFF process, the bonding strength and the quality of filling could affect the mechanical properties of the printed parts. The internal microstructure and porosity of the PLA/Hytrel-20% specimens printed at different nozzle and bed temperatures were measured using X-ray microtomography. The calculated porosity is presented in Figure 14. It followed the same trend as the porosity that was determined from the density measurements. A lower void fraction was found at higher nozzle and bed temperatures, from 14.7% at a nozzle temperature of 210 °C to 2.5% at 250 °C and from 10.2% at a bed temperature of 30 °C to 4.7% at 110 °C. It was found that the porosity was mostly present between the adjacent printed filaments and between the internal fill and the shells, as presented in Figure 15. In addition, reductions in the number and the size of pores at higher nozzle and bed temperatures were observed, which provided a better contact surface between the printed layers, as presented in Figure 16. Regarding the nozzle temperature effect, the maximum pore volume of 52 mm3 was obtained at a nozzle temperature of 210 °C and the lowest value was obtained at 250 °C of around 0.79 mm3. Concerning the bed temperature, the maximum pore volume was around 25.3 mm3 at a bed temperature of 30 °C, the lowest value of 7.55 mm3 was obtained at a bed temperature of 110 °C. At higher nozzle temperatures, the most recent printed layer had partially melted onto the old one and could facilitate the interpenetration of macromolecular chains [30]. Consequently, the adhesion between the printed layers increased. The adhesion strength also depended on the temperature gradient between the nozzle and bed temperature. At higher bed temperatures, the layer-to-layer contact temperature increased. Therefore, strong interfacial adhesion and intermolecular diffusion were dominant. Both the bed and nozzle temperatures had an influence on the interlayer adhesion. The bed temperature of 30 °C did not have a significant effect on the bonding strength because the processing temperature was lower than the glass transition temperature of PLA, which is around 59 °C. However, at bed temperatures of 60 °C and 110 °C, the processing temperature was above the glass transition temperature, which provided higher molecular mobility and strong interface adhesion [31].

4. Conclusions

This work explored the potential of Hytrel, as a thermoplastic copolyester elastomer, to improve the impact resistance of PLA. Different PLA/Hytrel compounds were prepared using an extrusion process with various Hytrel contents. The impact resistance of the PLA/Hytrel blends was enhanced with the rise of the Hytrel percentage. The maximum impact energy was obtained from the PLA/Hytrel-20% compound. This formulation also had a higher elongation at break, with enough rigidity and a higher degree of crystallinity. PLA/Hytrel-20% was tested in the 3D printing process with the variation of bed and nozzle temperatures. The mechanical performance in terms of Young’s modulus, the ultimate tensile strength, and impact energy were improved with the increase of bed and nozzle temperatures. The two printing parameters positively affected the filling quality during the 3D printing process. The porosity was reduced with the increase in the bed and nozzle temperatures. Because of this porosity, Young’s modulus of the printed parts was lower compared to Young’s modulus of parts prepared using compression molding. Furthermore, the bed temperature contributed to an increase in the degree of crystallinity. However, the nozzle temperature did not seem to have a remarkable influence on the thermal properties of PLA/Hytrel-20%.
Overall, all these results obtained in this study confirmed that the addition of a copolymer was an efficient solution to improve the impact resistance of PLA and that 3D printing parameters could have remarkable effects on the mechanical properties and the microstructure of printed parts. In the future, this study can be further developed by adding a compatibilizer agent to improve the adhesion between the PLA and Hytrel and by evaluating the influence of other 3D printing parameters on other physical properties.

Supplementary Materials

The following are available online at https://0-www-mdpi-com.brum.beds.ac.uk/article/10.3390/jcs5090232/s1, Figure S1: HNMR analysis on Hytrel [(A): 1H NMR spectrum in CDCl3, (B) identification of signals, (C) calculation of FPBT and FPTMG]. Figure S2: DSC thermogram (left) on Hytrel [heating cycle (10 °C/min) in blue then cooling cycle in red (10 °C/min)]—DMA thermogram (right) on Hytrel [tension film, 3 °C/min from −120 °C to 165 °C, 1 Hz, amplitude of 10 μm].

Author Contributions

Material processing and sample manufacturing, J.C., B.D.B. and S.K.; supervision of tomographic observations, E.L.; writing—original draft preparation, S.K.; writing—review and editing, S.K., S.A. and J.C.; project administration, S.A. and J.C.; funding acquisition, S.A. and J.C. All authors have read and agreed to the published version of the manuscript.

Funding

This work was funded by an FWV ELASTOPLAST Interreg Grant (EFRO convention number: 1.2.38).

Acknowledgments

The authors express deep thanks to all other partners of the Elasto-Plast project (IMT Mines-Douai, Armines, Ulille, Centexbel and KULAK) for their support and cooperation.

Conflicts of Interest

The authors declare no conflict of interest.

References

  1. Gibson, I.; Rosen, D.; Stucker, B. Additive Manufacturing Technologies. In 3D Printing, Rapid Prototyping, and Direct Digital Manufacturing; Springer: New York, NY, USA, 2015; ISBN 978-1-4939-2113-3. [Google Scholar]
  2. Hashmi, S.; Batalha, G.F.; Tyne, C.J.V.; Yilbas, B.S. Comprehensive Materials Processing; Elsevier: Amsterdam, The Netherlands, 2014; ISBN 978-0-08-096533-8. [Google Scholar]
  3. Leite, M.; Fernandes, J.; Deus, A.M.; Reis, L.; Vaz, M.F. Study of the Influence of 3D Printing Parameters on the Mechanical Properties of PLA. In Proceedings of the 3rd International Conference on Progress in Additive Manufacturing, Singapore, 14–17 May 2018; pp. 547–552. [Google Scholar] [CrossRef]
  4. Capote, G.A.M.; Redmann, A.; Osswald, T.A. Validating a Failure Surface Developed for ABS Fused Filament Fabrication Parts through Complex Loading Experiments. J. Compos. Sci. 2019, 3, 49. [Google Scholar] [CrossRef] [Green Version]
  5. Harris, A.M.; Lee, E.C. Improving Mechanical Performance of Injection Molded PLA by Controlling Crystallinity. J. Appl. Polym. Sci. 2008, 107, 2246–2255. [Google Scholar] [CrossRef]
  6. Aung, S.P.S.; Shein, H.H.H.; Aye, K.N.; Nwe, N. Environment-friendly biopolymers for food packaging: Starch, protein, and poly-lactic acid (PLA). In Bio-Based Materials for Food Packaging; Springer: Singapore, 2018; pp. 173–195. [Google Scholar] [CrossRef]
  7. Lim, L.T.; Auras, R.; Rubino, M. Processing Technologies for Poly(Lactic Acid). Mater. Sci. Eng. C 2008, 33, 820–852. [Google Scholar] [CrossRef]
  8. Ljungberg, N.; Andersson, T.; Wesslén, B. Film Extrusion and Film Weldability of Poly(Lactic Acid) Plasticized with Triacetine and Tributyl Citrate. J. Appl. Polym. Sci. 2003, 88, 3239–3247. [Google Scholar] [CrossRef]
  9. Wang, L.; Gramlich, W.M.; Gardner, D.J. Improving the Impact Strength of Poly(Lactic Acid) (PLA) in Fused Layer Modeling (FLM). Polym. J. 2017, 114, 242–248. [Google Scholar] [CrossRef]
  10. Benwood, C.; Anstey, A.; Andrzejewski, J.; Misra, M.; Mohanty, A.K. Improving the Impact Strength and Heat Resistance of 3D Printed Models: Structure, Property, and Processing Correlationships during Fused Deposition Modeling (FDM) of Poly(Lactic Acid). J. Am. Chem. Soc. 2018, 3, 4400–4411. [Google Scholar] [CrossRef]
  11. Samykano, M.; Selvamani, S.K.; Kadirgama, K.; Ngui, W.K.; Kanagaraj, G.; Sudhakar, K. Mechanical Property of FDM Printed ABS: Influence of Printing Parameters. Int. J. Adv. Manuf. Technol. 2019, 102, 2779–2796. [Google Scholar] [CrossRef]
  12. Maloch, J.; Hnátková, E.; Žaludek, M.; Kratky, P. Effect of Processing Parameters on Mechanical Properties of 3D Printed Samples. Mater. Sci. Forum 2018, 919, 230–235. [Google Scholar] [CrossRef]
  13. Sun, Q.; Rizvi, G.; Bellehumeur, C.T.; Gu, P. Effect of Processing Conditions on the Bonding Quality of FDM Polymer Filaments. Rapid Prototyp. J. 2008, 14, 72–80. [Google Scholar] [CrossRef]
  14. Ljungberg, N.; Wesslén, B. The Effects of Plasticizers on the Dynamic Mechanical and Thermal Properties of Poly(Lactic Acid). J. Appl. Polym. Sci. 2002, 86, 1227–1234. [Google Scholar] [CrossRef]
  15. Ecker, J.V.; Burzic, I.; Haider, A.; Hild, S.; Rennhofer, H. Improving the Impact Strength of PLA and Its Blends with PHA in Fused Layer Modelling. Polym. Test 2019, 78, 105929. [Google Scholar] [CrossRef]
  16. Wu, Y.; Qin, Y.; Yuan, M.; Li, L.; Chen, H.; Cao, J.; Yang, J. Characterization of an Antimicrobial Poly(Lactic Acid) Film Prepared with Poly(Ε-caprolactone) and Thymol for Active Packaging. Polym. Adv. Technol. 2014, 25, 948–954. [Google Scholar] [CrossRef]
  17. Kumar, M.; Nayak, S.K.; Parvaiz, M.R. Effect of Glycidyl Methacrylate (GMA) on the Thermal, Mechanical and Morphological Property of Biodegradable PLA/PBAT Blend and Its Nanocomposites. Bioresour. Technol. 2010, 101, 8406–8415. [Google Scholar] [CrossRef]
  18. Buck, W.H.; Cella, R.J.; Gladding, E.K.; Wolfe, J.J.R. Morphology and Physical Properties of Polyether-Ester Thermoplastic Elastomers. J. Polym. Sci. Polym. Symp. 2007, 48, 47–60. [Google Scholar] [CrossRef]
  19. Gaztelumendi, M.; Mondragón, I.; Nazábal, J. The Physical State of Polycarbonate/Hytrel Blends. Makromol. Chem. Macromol. Symp. 1988, 20–21, 269–275. [Google Scholar] [CrossRef]
  20. Müller, A.J.; Ávila, M.; Saenz, G.; Salazar, J. Crystallization of PLA-based Materials. In Poly (Lactic Acid) Science and Technology: Processing, Properties, Additives and Applications; The Royal Society of Chemistry: London, UK, 2015; ISBN 978-1-84973-879-8. [Google Scholar]
  21. Yan, J.; Spontak, R.J. Toughening poly (lactic acid) with thermoplastic elastomers modified by thiol–ene click chemistry. ACS Sustain. Chem. Eng. 2019, 7, 10830–10839. [Google Scholar] [CrossRef]
  22. Bernardes, G.P.; da Rosa Luiz, N.; Santana, R.M.C.; de Camargo Forte, M.M. Rheological behavior and morphological and interfacial properties of PLA/TPE blends. J. Appl. Polym. Sci. 2019, 136, 47962. [Google Scholar] [CrossRef]
  23. Deng, S.; Yao, J.; Bai, H.; Xiu, H.; Zhang, Q.; Fu, Q. A generalizable strategy toward highly tough and heat-resistant stereocomplex-type polylactide/elastomer blends with substantially enhanced melt processability. Polymer 2021, 224, 123736. [Google Scholar] [CrossRef]
  24. Kang, H.; Hu, X.; Li, M.; Zhang, L.; Wu, Y.; Ning, N.; Tian, M. Novel biobased thermoplastic elastomer consisting of synthetic polyester elastomer and polylactide by in situ dynamical crosslinking method. RSC Adv. 2015, 5, 23498–23507. [Google Scholar] [CrossRef]
  25. Cai, J.; Jiang, J.; Zhou, Z.; Zhang, Y.; Wang, F.; Han, C.; Guo, J.; Shao, Q.; Du, H.; Umar, A.; et al. Toughening Poly(Lactic Acid) by Melt Blending with Poly(Ether-Block-Amide) Copolymer. Sci. Adv. Mater. 2017, 9, 1683–1692. [Google Scholar] [CrossRef] [Green Version]
  26. Liu, G.C.; He, Y.S.; Zeng, J.B.; Xu, Y.; Wang, Y.Z. In Situ Formed Crosslinked Polyurethane Toughened Polylactide. Polym. Chem. 2014, 5, 2530–2539. [Google Scholar] [CrossRef]
  27. Vo, B.; Ajibade, A.; Rosengren, M.; Pena, K.; Moran, M. The Effect of 3D Printing Temperature on the Mechanical Properties of Polypropylene. J. Undergrad. Chem. Eng. Res. 2019. [Google Scholar] [CrossRef]
  28. Perego, G.; Cella, G.D.; Bastioli, C. Effect of Molecular Weight and Crystallinity on Poly(Lactic Acid) Mechanical Properties. J. Appl. Polym. Sci. 1996, 59, 37–43. [Google Scholar] [CrossRef]
  29. Behzadnasab, M.; Yousefi, A.A. Effects of 3D Printer Nozzle Head Temperature on the Physical and Mechanical Properties of PLA Based Product. In Proceedings of the 12th International Seminar on Polymer Science and Technology, Islamic Azad University, Tehran, Iran, 2–5 November 2016. [Google Scholar]
  30. Bellehumeur, C.; Li, L.; Sun, Q.; Gu, P. Modeling of Bond Formation Between Polymer Filaments in the Fused Deposition Modeling Process. J. Manuf. Process 2004, 6, 170–178. [Google Scholar] [CrossRef]
  31. Aliheidari, N.; Christ, J.; Tripuraneni, R.; Nadimpalli, S.; Ameli, A. Interlayer Adhesion and Fracture Resistance of Polymers Printed through Melt Extrusion Additive Manufacturing Process. Mater. Des. 2018, 156, 351–361. [Google Scholar] [CrossRef]
Figure 1. Parts printed from PLA/Hytrel blends (from left to right: tensile samples, impact test sample, 3D printable architectural parts).
Jcs 05 00232 g001
Figure 2. Schematic representation of the microtomographic analysis.
Jcs 05 00232 g002
Figure 3. Typical DSC thermogram of a PLA/Hytrel blend (second thermal cycle with a heating rate of 10 °C/min).
Jcs 05 00232 g003
Figure 4. Crystallinity percentage calculated from the first thermal cycle (DSC) of the impact test samples that were based on PLA/Hytrel blends.
Jcs 05 00232 g004
Figure 5. SEM images (magnification: ×5.00 k) of cryofractured surfaces of PLA/Hytrel blends for three different Hytrel contents (10%, 20%, and 30%).
Jcs 05 00232 g005
Figure 6. Young’s modulus and elongation at break of neat PLA and compounded PLA with different Hytrel contents (10%, 15%, 20%, 25%, and 30%).
Jcs 05 00232 g006
Figure 7. Impact energy of neat PLA and compounded PLA with various Hytrel contents (CF: complete fracture, PF: partial fracture).
Jcs 05 00232 g007
Figure 8. Fracture in PLA/Hytrel-20% impact test samples (stress-whitening zone contoured in black).
Jcs 05 00232 g008
Figure 9. Influence of bed temperature (30 °C, 60 °C, and 110 °C) on (a) Young’s modulus and porosity and (b) ultimate tensile strength and the strain at the ultimate tensile strength.
Jcs 05 00232 g009
Figure 10. Influence of the nozzle temperature (210 °C, 230 °C, and 250 °C) on (a) Young’s modulus and porosity and (b) ultimate tensile strength and the strain at the ultimate tensile strength.
Jcs 05 00232 g010
Figure 11. Influence of the nozzle temperature (210 °C, 230 °C, and 250 °C) and bed temperature (30 °C, 60 °C, and 110 °C) on the impact energy of the PLA/Hytrel-20% printed samples.
Jcs 05 00232 g011
Figure 12. Influence of the bed and nozzle temperatures on the crystallization percentage of PLA/Hytrel-20%.
Jcs 05 00232 g012
Figure 13. DSC curves of PLA/Hytrel-20% at different nozzle temperatures.
Jcs 05 00232 g013
Figure 14. Calculated porosity of the printed samples at different nozzle and bed temperatures using X-ray microtomography.
Jcs 05 00232 g014
Figure 15. Example of the porosity distribution between adjacent printed filaments at a nozzle temperature of 250 °C.
Jcs 05 00232 g015
Figure 16. Cross-sectional microtomography of printed specimens based on the PLA/Hytrel-20% prepared at different (a) nozzle temperatures (210 °C, 230 °C, and 250 °C) and (b) bed temperatures (30 °C, 60 °C, and 110 °C).
Jcs 05 00232 g016
Table 1. Composition of different PLA/Hytrel compounds that were prepared using an extrusion process.
NamePLA 4032D (wt%)Hytrel (wt%)
Extrusion processPLA/Hytrel-10%9010
PLA/Hytrel-15%8515
PLA/Hytrel-20%8020
PLA/Hytrel-25%7525
PLA/Hytrel-30%7030
Table 2. Printing conditions of tensile and impact tests specimens.
TNozzle (°C)TBed (°C)Other Parameters
3D printing21030Layers thickness (mm): 0.2
Infill density (%): 100
Printing speed (mm/s): 60
Raster orientation (°): 45/−45
Number of shells: 2
23060
250110
Table 3. Glass transition (Tg), melting (Tm), and crystallization temperatures (Tc), and the crystallinity percentage (χc) of PLA/Hytrel blends determined from the second thermal cycle with a heating rate of 10 °C/min.
Tm Hytrel (°C)Tg PLA (°C)Tm PLA (°C)Tc PLA (°C)χc (PLA) (%)
PLA/Hytrel-10%10.5 ± 0.860.0 ± 1.1168.9 ± 1.4105.0 ± 0.46.6 ± 4.8
PLA/Hytrel-15%9.1 ± 0.160.3 ± 0.2168.7 ± 0.1102.9 ± 2.33.9 ± 0.1
PLA/Hytrel-20%9.5 ± 0.360.3 ± 0.9168.6 ± 0.9105.6 ± 1.05.6 ± 4.2
PLA/Hytrel-25%8.7 ± 0.660.9 ± 0.1169.2 ± 0.1106.0 ± 0.91.9 ± 1.0
PLA/Hytrel-30%9.0 ± 0.360.5 ± 0.2169.0 ± 0.4106.8 ± 1.33.6 ± 3.5
Publisher’s Note: MDPI stays neutral with regard to jurisdictional claims in published maps and institutional affiliations.

