Article

Investigation of Specimen Size Effects on P-Quantile Diagrams and Normal Distributions of Critical Flaw Strengths in Fiber Tows

1
LMT-ENS, Université Paris-Saclay, 4, Avenue des Sciences, CS 30008, 91192 Gif-sur-Yvette, France
2
INSA-Lyon, MATEIS, 7 Avenue Jean Capelle, 69621 Villeurbanne, France
*
Author to whom correspondence should be addressed.
J. Compos. Sci. 2022, 6(6), 171; https://0-doi-org.brum.beds.ac.uk/10.3390/jcs6060171
Submission received: 26 April 2022 / Revised: 6 June 2022 / Accepted: 9 June 2022 / Published: 13 June 2022
(This article belongs to the Special Issue Feature Papers in Journal of Composites Science in 2022)

Abstract

:
The present paper proposes a model of the specimen size effect on the critical flaw strength distribution in fiber tows for composite reinforcement. The model is based on the basic assumption of brittle fracture that the failure probability at a given strength increases with specimen size in the p-quantile vs. strength relation and on the normal distribution. Empirical results derived from force–strain curves determined on tows made of 1000 and 500 Nicalon SiC filaments and with various gauge lengths show some discrepancy with predictions using the model. The empirical p-quantile diagrams and cumulative distributions of critical flaw strengths exhibited excellent reproducibility at longer gauge lengths, which suggests the absence of a size effect above a critical tow size. The reproducibility of flaw strength distributions at gauge lengths above 60 mm and the higher strengths obtained at lower gauge lengths despite structural effects were related to the features of the critical flaw distribution in tows of parallel fibers.

1. Introduction

Like most brittle materials, ceramic fibers contain populations of microstructural flaws that act as stress concentrators and initiate fracture at stresses far below the theoretical strength [1,2]. The flaws are generally distributed randomly, and they exhibit wide variability in severity as a result of variability in shape, nature, size and location. As a consequence, stress-induced fracture is a stochastic event, and fracture stress is a random variable.
Fiber composite materials’ strength is basically determined by the strength of their fibers, which carry mainly axial loads. Fiber tows control the ultimate failure of ceramic matrix composites with woven fiber reinforcement. The failure of a tow is caused by a critical filament that triggers the unstable fracture of filaments carrying the load [3,4,5]. The strength of a critical filament depends on the loading mode, stress state and matrix type [3,4]. Investigation and characterization of critical flaw strength distribution in fiber tows are of primary importance for better understanding and predicting the failure of continuous fiber-reinforced composites.
Various stochastic approaches to brittle fracture have been proposed for ceramics [2,6,7,8,9,10,11,12,13,14]. Fundamental approaches recognize the flaws as physical entities [9,10,11,12,13,14], while the severity of fracture-inducing flaws is measured using either flaw size or flaw strength. Flaw strength and flaw size are related by fracture toughness expression. In the so-called elemental strength approach [2,10,11,12,13,14], flaw strength is defined using the elemental strength, which is the critical local stress that causes the extension of a flaw. The critical flaw strength of a filament is given by the tensile stress or strain operating on the filament at failure.
The pertinence of the distribution of flaw strengths is a key issue for fracture and reliability analysis and the characterization of brittle materials. The power-law distribution of extreme values (often referred to as the Weibull distribution) is often used for the analysis of strength data and for probability-strength predictions. The Weibull distribution is very sensitive to statistical parameters. The estimated parameters generally exhibit variation. Much attention has been placed on this issue [15,16,17,18,19,20,21]. Furthermore, the authors raised questions about the validity of the Weibull distribution function for ceramic strength. Opposite conclusions on the applicability of different statistical distributions in analyzing the measured strengths of ceramic specimens have been reported in the literature [22,23,24,25,26]. Depending on the authors, it has been suggested that either the Weibull or normal distribution (or both) may fit the data, although no objective evidence has been produced that the data follow either of them.
Most of the distributions of fiber strengths have been determined on individual fibers extracted from multifilament tows and described using the Weibull distribution function [6]. They show a decrease in strength as filament length is increased [1,27,28,29,30,31,32,33,34,35,36,37,38]. For SiC fibers, the Weibull plots of filament strengths (logarithmic strength–length relationships) showed unexpected nonlinearity and a marked difference at low strength extremes [35,36,37]. This apparent size effect was not satisfactorily quantitatively related to fiber length.
Peirce assumed a Gaussian distribution for strengths in the locality of flaws [39]. Making some approximations, he obtained equations giving the mean strength and standard deviation for fibers with increased gauge length [39,40]. Sakai applied Pierce’s theory to nylon and acrylic yarns [41]. He concluded that it is a useful approximation. However, usually, Pierce’s relation deviates from experimental data [41]. Starting with a Gaussian probability density function for flaw strengths, Frenkel and Kontorova [42] found that the strength of specimens should decrease linearly with √logV.
The variability of estimated Weibull parameters results from various factors, including the method of analysis of experimental strength data [5,35,43] (i.e., the graphical method using the empirical Weibull plot, Maximum Likelihood Estimation relations and first-moment relations) and the sample size and selection of test specimens (sampling) from a tow [5,43,44]. Sampling exerts a major influence when small data sets are considered [43,44]. Variability may also result from diameter variability. Parthasarathy reported that more than 200 strength data points are needed for estimating accurate Weibull parameters using the mean diameter [45]. If the variation in diameter is narrow, Weibull parameters can be estimated accurately within about 60 data points [46,47]. Sutherland et al. [36] cited several examples that show that further extension of Weibull’s weakest link theory does not improve the results.
Filament strength distributions can also be derived from the tensile force–strain curve of fiber tows [43,46,47,48,49,50]. Fiber tow tests present at least one significant advantage over tests on individual filaments for the determination of flaw strength distribution: a single tow test can provide a very large number of filament failure data points (several hundred), whereas a comparable database would require many tests on single filaments. A set of filament failure strains can be extracted from the tensile force–strain curve of a tow measured under a constant loading rate [5]. When appropriate practical requirements are met, the filaments fail individually as the load increases, and their strains to failure provide the strengths of the critical flaws that induced the fracture of the corresponding filaments in the tow.
In a recent paper [5], it was shown that the linearity of the p-quantile vs. flaw strength relation is objective evidence that critical flaw strength in a fiber tow is a Gaussian variable. This approach was applied to various fiber types, including SiC, carbon, glass, basalt and alumina fibers [5]. The present paper proposes an approach based on the p-quantile–strength relation to predict size effects on the normal distribution of flaw strengths.
As far as is known to the authors, there are not many papers on size effects on very large flaw strength data sets obtained from tow tests. RMili [51] did not observe a significant size effect on the flaw strength distribution of E-glass fiber tows for gauge lengths > 30 mm when a single population of surface defects controlled fracture.
Sutherland et al. published an interesting literature review on the topic of size effects in fibers and composites [52]. According to Sutherland et al., the description of size effects by the statistical theories used is by no means conclusive, and an accurate quantitative description of such effects or even firm evidence of their existence has proved elusive.
For SiC/SiC composites, it was shown that composite strength dependence on stressed volume size is not significant and that the Weibull distribution function predicts inconsistent size effects [53,54]. K. Drechsler came to the conclusion that the strength of CMCs does not depend on component size [55].
The objective of the present paper was to investigate the influence of fiber length on the critical flaw strength distribution obtained on fiber tows. A theoretical approach based on the weakest link hypothesis for filament failure was developed for the prediction of p-quantile diagrams at various gauge lengths. The linearity of the p-quantile diagram provides objective evidence that the critical flaw strengths of tows have normal distributions. Weibull parameters were calculated using the first moment of the Weibull distribution for the mean and standard deviation given by the predicted p-quantile diagrams. Empirical p-quantile diagrams as well as normal and Weibull distributions were constructed from the sets of filament strengths extracted from the force–strain curves of SiC Nicalon fiber tows made of 1000 or 500 filaments and with various gauge lengths.

2. Theory

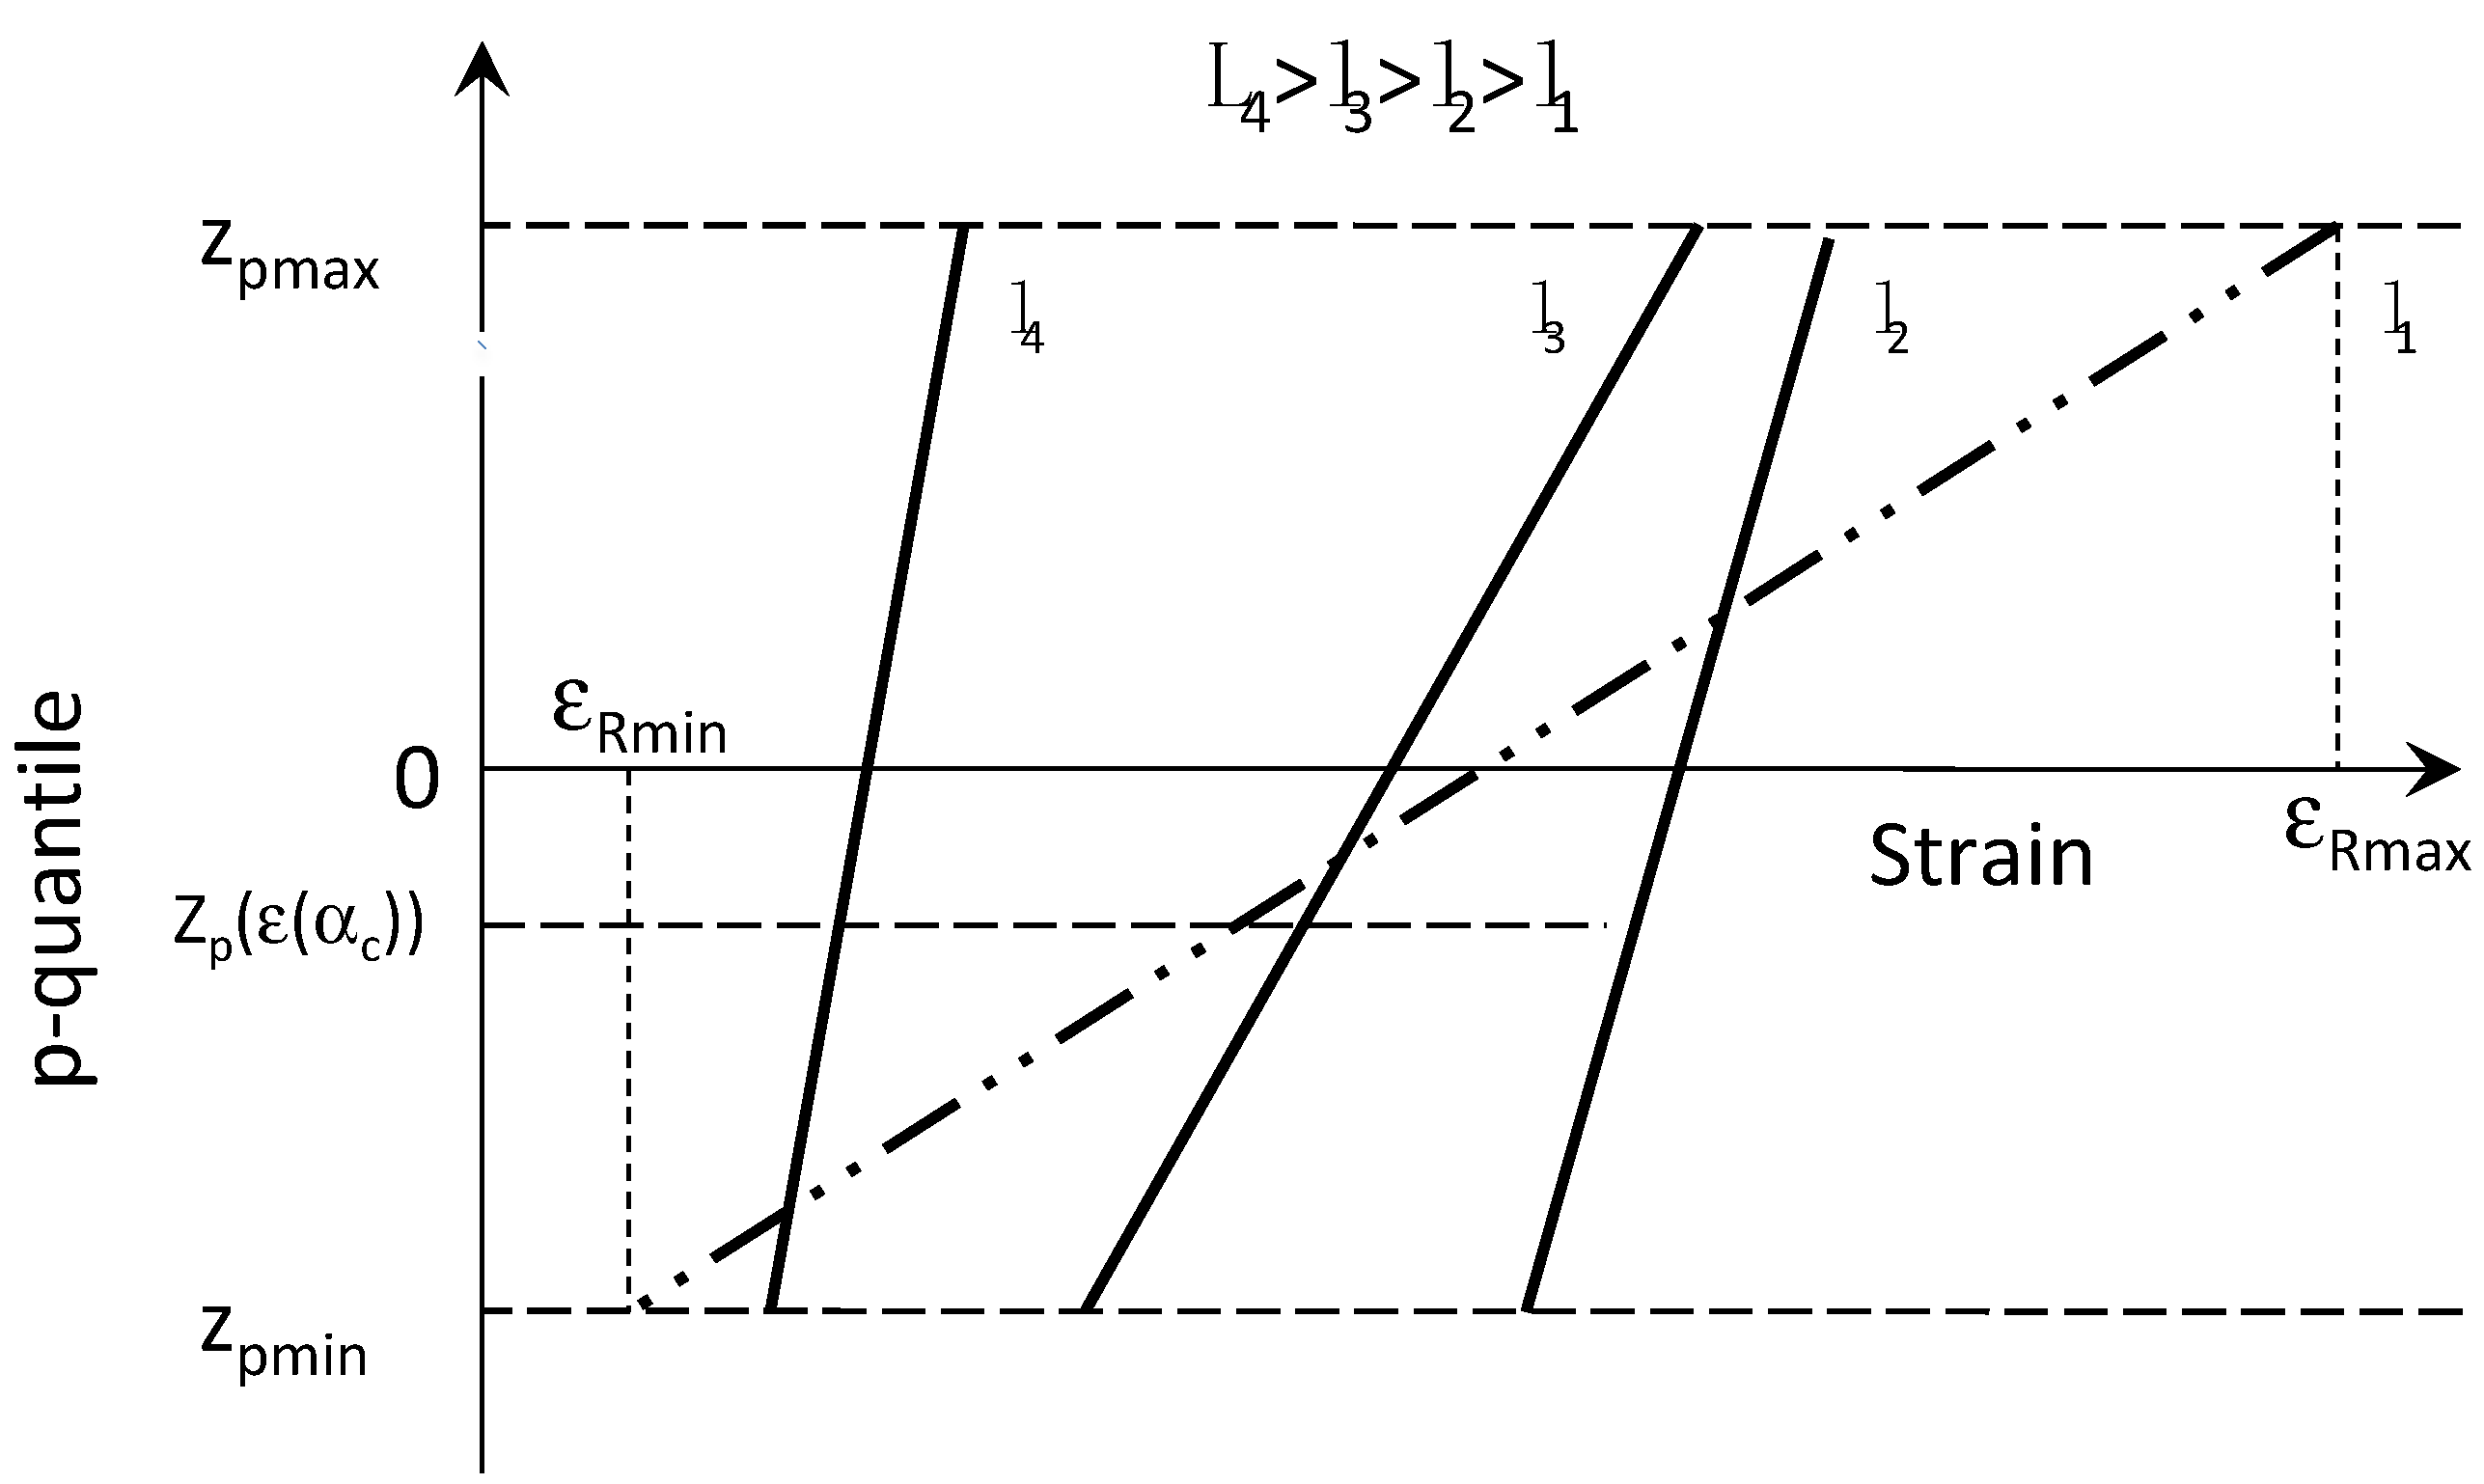
2.1. P-Quantile zp(ε) Diagram

The p-quantile diagram zp(ε) was used in a previous paper to demonstrate that filament flaw strength is a Gaussian variable [5]. It is a graphical method of comparing a Gaussian distribution to a set of data. When X is a Gaussian variable, with μ = mean and s = standard deviation, and N is a variable of the standard normal distribution, it becomes:
P ( X < x ) = P ( X μ s < x μ s ) = P ( N < z ) = Φ ( z )
where P(.) is the cumulative probability that X < x, and
z = x μ s
where Φ is the cumulative standard normal distribution of variable z:
Φ ( z ) = 1 2 π z exp ( t 2 2 ) d t
When the linearity of relation zp(x) (Equation (2)) is observed on a set of xi data, one may assume that the xi data are occurrences of the same Gaussian variable. Then, the plot of p-quantile zp vs. xp indicates whether X is a Gaussian variable. Below, p is the value of cumulative probability:
P ( X < x i ) = p i
The diagram is constructed as follows:
The p-quantile zp is derived from the cumulative standard normal distribution function Φ.
z p = Φ 1 ( p )
The equation of the p-quantile zp diagram is:
z p = Φ 1 ( p ) = x p μ s
Note that xp = xi, according to relation (5). Zp can be extracted easily from Φ using a computer or tables that are available in textbooks.

2.2. Generation of Flaw Strength Data: Tensile Behavior of Fiber Tows

Ideally, a fiber tow is regarded as a population of parallel, independent and identical single filaments (radius Rf, length l). As a consequence, under tension parallel to the tow axis, stress or strain on a filament at failure gives strength to the critical flaw in the filament. Thus, a set of filament strengths provides a significant population of critical flaw strengths.
Filaments exhibit brittle fracture and a statistical distribution of strength. Under monotonous loading at a constant strain rate, the filaments break one after another according to ascending order of strength when the stress increment is such that the stress on a filament reaches the strength of this filament (σ = σf). When a filament breaks, the surviving filaments carry the applied load equally. The force on the tow increases to a maximum and then decreases gradually to 0 [5]. This failure mode is observed when filaments share the load equally, when the filaments are independent and when the strain rate is sufficiently slow that the stress increase does not make several filaments break.
The force–strain relation that characterizes the tensile behavior of a tow [5] is:
F(ε) = Ef ε Sf (NtNi)
where F is the force on the tow at strain εi (ε = σ/Ef, where σ is the stress on surviving filaments). Ef is filament Young’s modulus, Sf is filament cross-sectional area, Nt is the initial number of filaments carrying the load, and Ni is the number of broken filaments.
The ratio Ni/Nt is the fraction of filaments that failed at strain εi. It gives the cumulative probability of failure at strain εi (denoted P(εi)).
Equation (7) reduces to:
F(ε) = k0ε [1 − P(ε)]
where k0 is the initial tow stiffness, given by the slope of the initial elastic domain of the force–strain curve.
When the filaments have an identical section Sf:
k 0 = N t S f E f
When they have different sections:
k 0 = i = 1 i = N t S f i E f = N t S ¯ f E f
where S ¯ f is the average filament diameter.
In the elastic domain, when filaments do not fail, P(ε) = 0, and F(ε) = k0 ε. Values of failure probability P(ε) are estimated from F and ε independently of the number of data according to Equation (11), derived from Equation (8) [5,56]:
P ( ε ) = 1 F ( ε ) k 0 ε

2.3. Construction of P-Quantile Diagrams

Flaw strength is characterized by both filament tensile failure stress and strain. In this paper, flaw strength is essentially characterized by the filament failure strain (ε).
The p-quantile diagram is constructed using ε and P(ε) data extracted from the experimental force–strain curve. P(ε) is given by Equation (11). zp (ε) is determined using Equation (5) rewritten as:
z p ( ε ) = Φ 1 ( P ( ε ) )
P-quantile diagrams for different volume sizes were derived from the probability dependence on volume size, thus assuming the increased probability of a larger specimen containing a flaw large enough to lead to failure. According to the weakest link concept, non-failure of volume V + V’ at strain ε requires the non-failure of both volumes V and V’. Both events being independent, the probability of survival of volume V + V’ is the product of the survival probabilities of volumes V and V’:
P S ( ε ,   V + V ) = P S ( ε , V ) · P S ( ε , V )
where PS denotes the survival probability: P = 1PS.
Note that the Weibull equation of failure probability derives directly from Equation (13), being a solution to this equation [2]. According to (13), the failure probability (denoted P2) for volume V2 = 2V1 is given by the equation:
1 − P2(ε, V2) = (1 − P1(ε, V1))2
Similarly, Pn denotes the failure probability of volume Vn = nV1:
1 − Pn(ε, Vn) = (1P1(ε, V1))n
From (15), it is inferred that:
1 − P1(ε, V1) = (1 − Pn(ε, Vn))1/n
Therefore, the probability of failure for volume V1/n = 1/n V1 can be calculated from the following equation derived from Equation (16):
1 − P1/n(ε, V1/n) = (1 − P1(ε, V1))1/n
The p-quantile diagrams for volume Vk = kV1, with k = n or k = 1/n, are derived from the initial diagram obtained for volume V1. The initial diagram is a straight line defined as:
z p 1 ( ε 1 ) = Φ 1 ( P 1 ( ε 1 ) ) = ε 1 μ 1 s 1
where μ1 is the mean and s1 is the standard deviation of the Gaussian distribution for volume V1.
The p-quantile diagram for volume Vk is predicted for various values of strain ε1 and the corresponding values of probability Pk:
1 − Pk(ε, Vk) = (1 − P1(ε, V1))k
z p k ( ε 1 ) = Φ 1 ( P k ( ε 1 ) ) = ε 1 μ k s k  
z p k ( ε 1 i ) = Φ 1 ( P k ( ε 1 i ) ) = ε 1 i μ k s k  
where μk is the mean of the Gaussian distribution for volume Vk, and sk is the standard deviation for volume Vk.
Because tows are made of a finite number of filaments, the p-quantile diagram is bounded by the following extreme values:
z p m i n = Φ 1 ( p = 1 N t )
z p m a x = Φ 1 ( p = N t 1 N t )
The mean and the standard deviation for any volume Vk may be derived from the slope 1/sk and the intercept μk/sk of the p-quantile vs. failure strain zp(ε) straight line. This allows the cumulative normal distribution functions to be calculated for various volume sizes using the following equations for positive strain values:
f ( ε ) = 1 S 2 π exp [ ( ε μ ) 2 2 S 2 ]   for   ε   >   0  
P N ( ε ε ) = 0 ε f ( ε ) d ε
where f(ε) is the density of probability. f(ε) = 0 and PN = 0 when ε ≤ 0, as the flaws cannot grow under compression.
When applicable, the Weibull distribution function defined for ε > 0 is an alternative expression of cumulative probability P:
P w ( ε < ε ) = 1 exp [ ( ε ε l ) m ]
where m is the shape parameter (or Weibull modulus), and εl is the scale factor.
The Weibull parameters can be estimated from s and μ using the first moment of the Weibull distribution:
s μ = [ Γ ( 1 + 2 m ) Γ 2 ( 1 + 1 m ) 1 ] 1.2 m
ε l = μ Γ ( 1 + 1 m )
where Γ (.) is the Gamma function.

3. Experimental Procedures

Strength data were determined from the tensile behavior of SiC Nicalon fiber tows. The test specimens contained around 1000 filaments with diameters averaging 14 μm. Tests on specimens with 500 filaments were also carried out. Batches of test specimens with gauges lengths of 40, 80 and 115 mm were prepared according to the protocol described in previous papers [50,51] and in the CEN and ISO standards [56], which recommend extreme care during specimen preparation to ensure that the procedure is repeatable. Much care was taken during specimen preparation and handling in order to avoid filament breaking or winding that induces specific drawbacks, such as fiber slack [57] and friction [58]. The quality of the test results was assessed by the features of the tensile curves and comparison with theory.
The tensile tests were carried out at room temperature under monotonous loading (displacement rate = 2 μm/s) on a servo-pneumatic testing machine. Test specimen elongation was measured using a contact extensometer (with a ± 2.5 mm elongation displacement transducer) that was clamped to the specimen using two 4 mm long thermoretractable rings (Figure 1). Thus, strain measurement was direct and unpolluted by load train deformations. The rings were located close to the grips in order to avoid possible bending introduced by the extensometer. The inner distance between the rings defined the gauge length.
The samples were first loaded up to 5% of the ultimate load, and then the extensometer was placed and adjusted. Lubricant oil was sprayed on filaments to avoid friction.
Acoustic emission was monitored during the tests on SiC fiber tows with 115 mm gauge length in order to locate fiber fracture origins [43,51]. Two resonant PZT transducers (Acoustic Emission type μ 80) were placed at specimen ends. Only those events with amplitude >60 dB (corresponding to fiber failure) were kept. The transducers were acoustically connected to the samples by vacuum grease. A two-channel Mistras 2001 data acquisition system of Physical Acoustics Corporation (PAC) was used for the recording of AE data. A fixed threshold of 32 dB was selected to minimize interference noise from outside.

4. Results

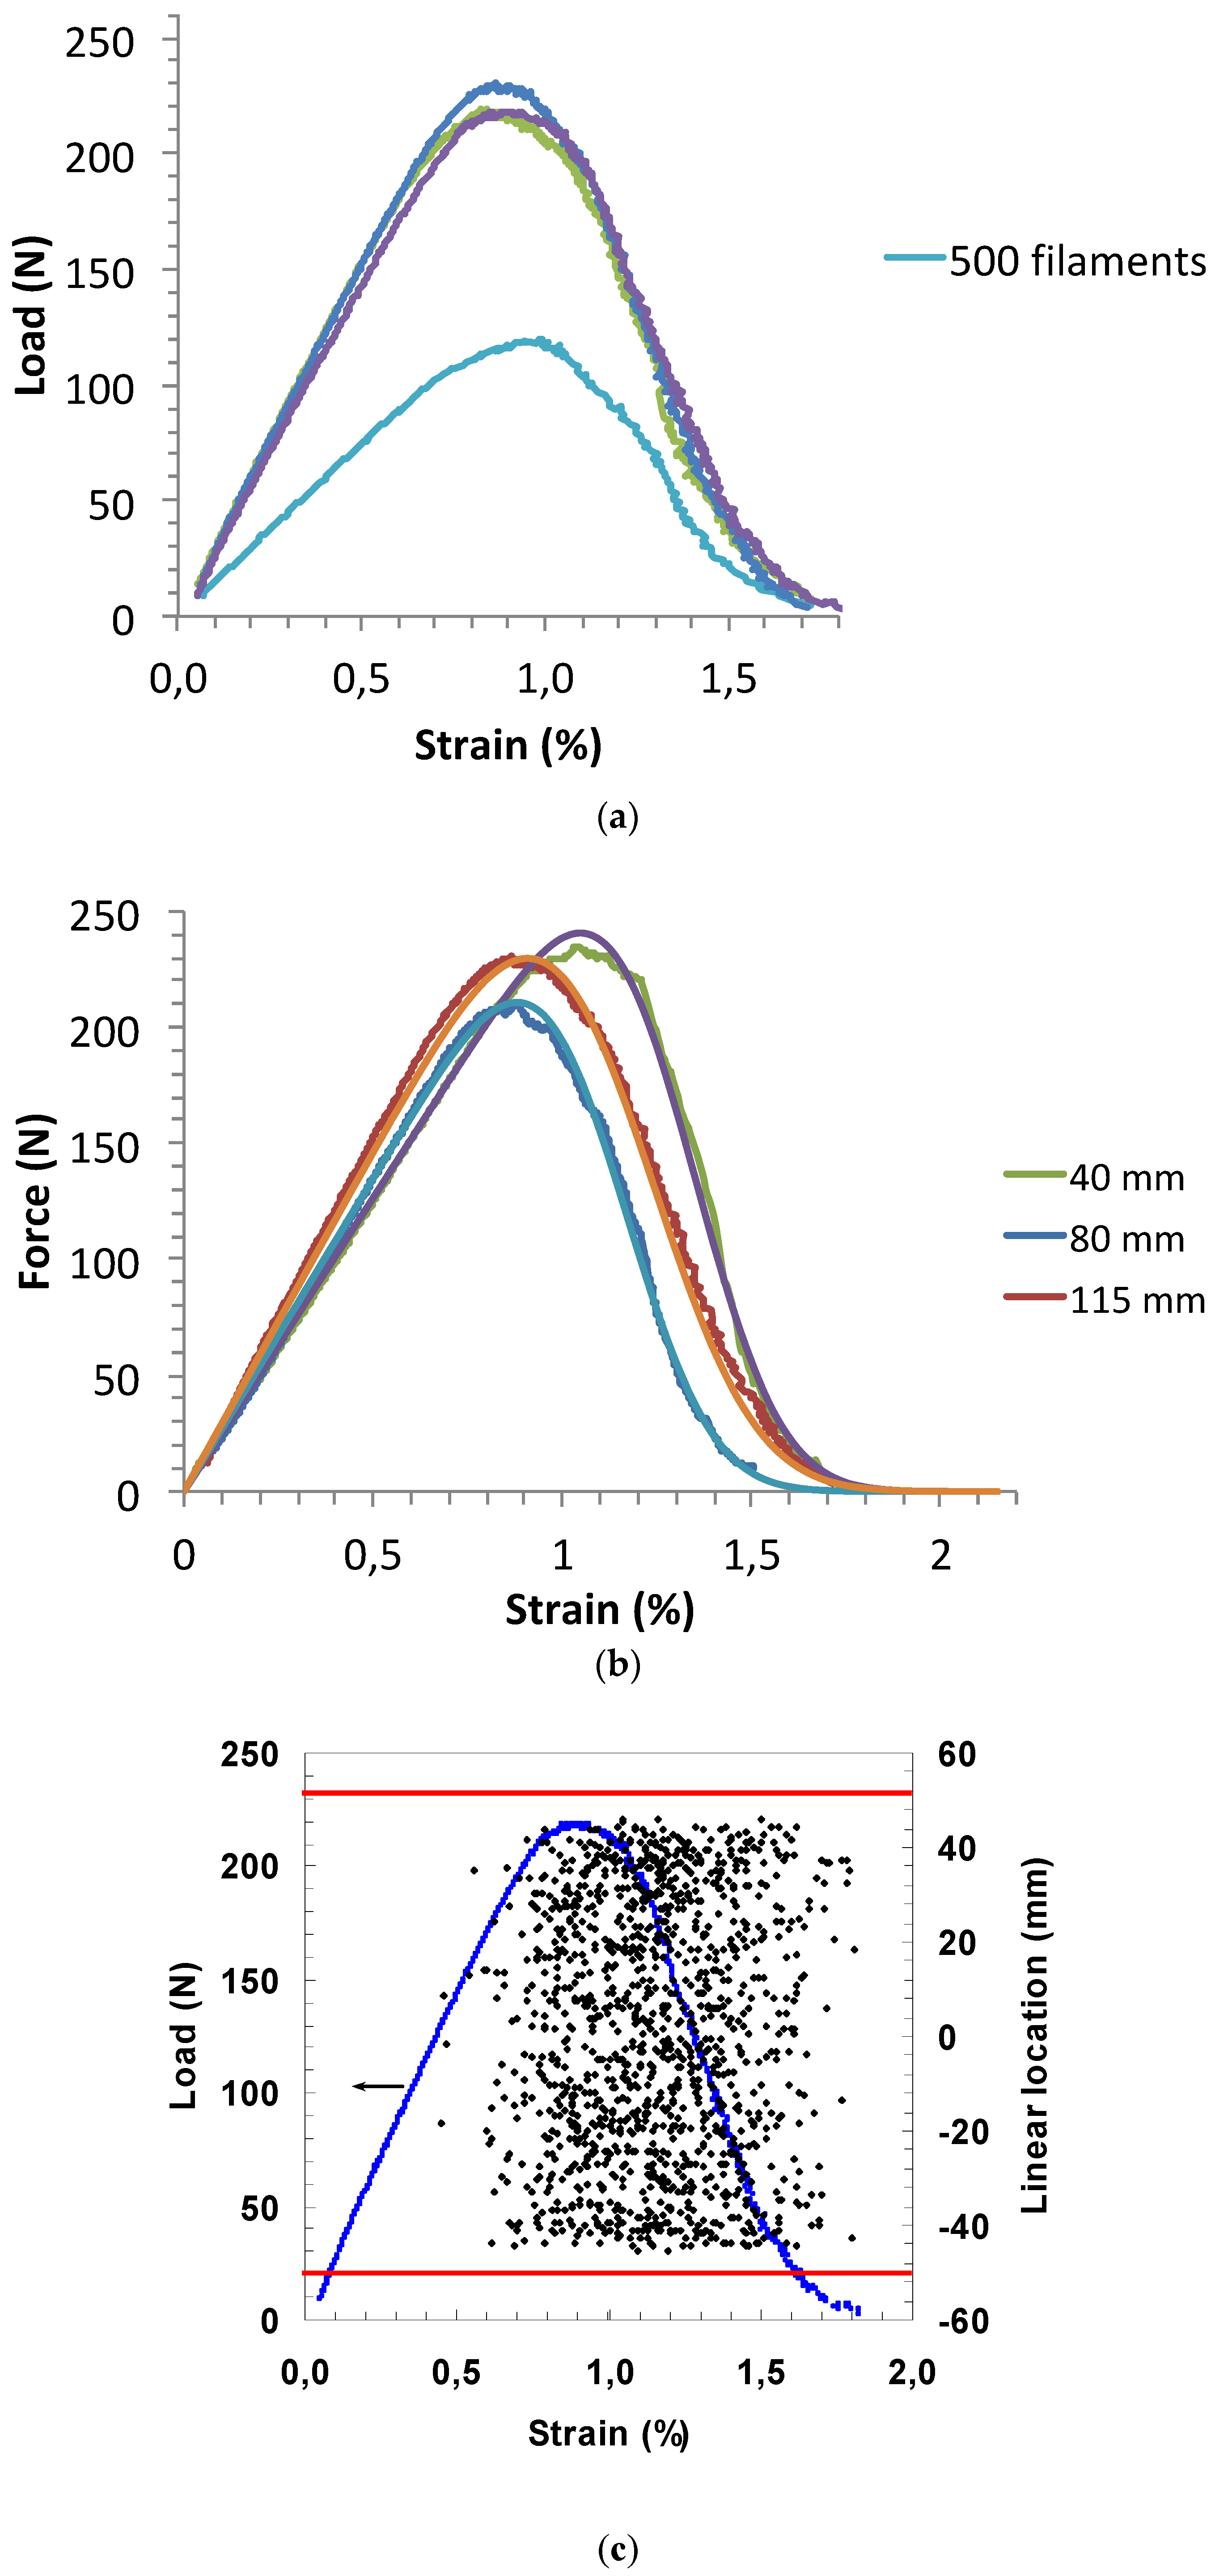
4.1. Force–Strain Curves

Typical tensile force–strain curves are shown in Figure 2. For a gauge length of 115 mm, very close curves were obtained, as shown in Figure 2a. More significant variation and load drops were displayed by curves obtained on shorter-gauge-length tows. Therefore, only those curves with the smallest load drops were considered for the analysis (Figure 2b). These curves were also those that fitted more closely to the theoretical expression (8) (Figure 2b). Note that the experimental force–strain curves of the 115 mm gauge tows did not exhibit a step-wise decrease in force at constant strain (Figure 2) [48,59], and they were well fitted by the theoretical expression.
The curves display the conventional features of the bundle tensile behavior reported in a previous paper [5]: i.e., initial elastic deformations (at strains < 0.7%) and then nonlinear deformations as a result of individual fiber breaks. Beyond the maximum, the force on the tow decreases progressively to 0. Beyond the limit of linearity, the AE event sources looked homogeneously distributed for the 115 mm gauge length, which suggests that clusters of multiple failures were not present [43] (Figure 2c).
It can be noted in Figure 2b that the initial elastic domains of curves have different slopes (k0), which reflects the difference in the initial number of filaments carrying the load (Nt). Approximate values of Nt were derived from k0 using Equation (9) for an average filament diameter set to 14 μm and Ef = 180 GPa. The results in Table 1 reflect the difference in the number of filaments initially carrying the load.
The respective position of the curve in Figure 2 indicates a variation with gauge length, the carried forces at the shortest and largest gauge lengths being comparable and above those observed at the intermediate gauge length of 80 mm. Plots of the quantity F/k0 allow one to focus on the gauge length influence independently of the number and diameter of filaments (Figure 3). It can be noted now that the curve of the 80 mm gauge length tow is pretty close to those of 115 mm gauge tows (including the tow of half-volume with 500 filaments) in the area of maximum load, and then it is located below, indicating weaker load-carrying capacity. By contrast, the 40 mm gauge tow exhibited higher load-carrying capacity.

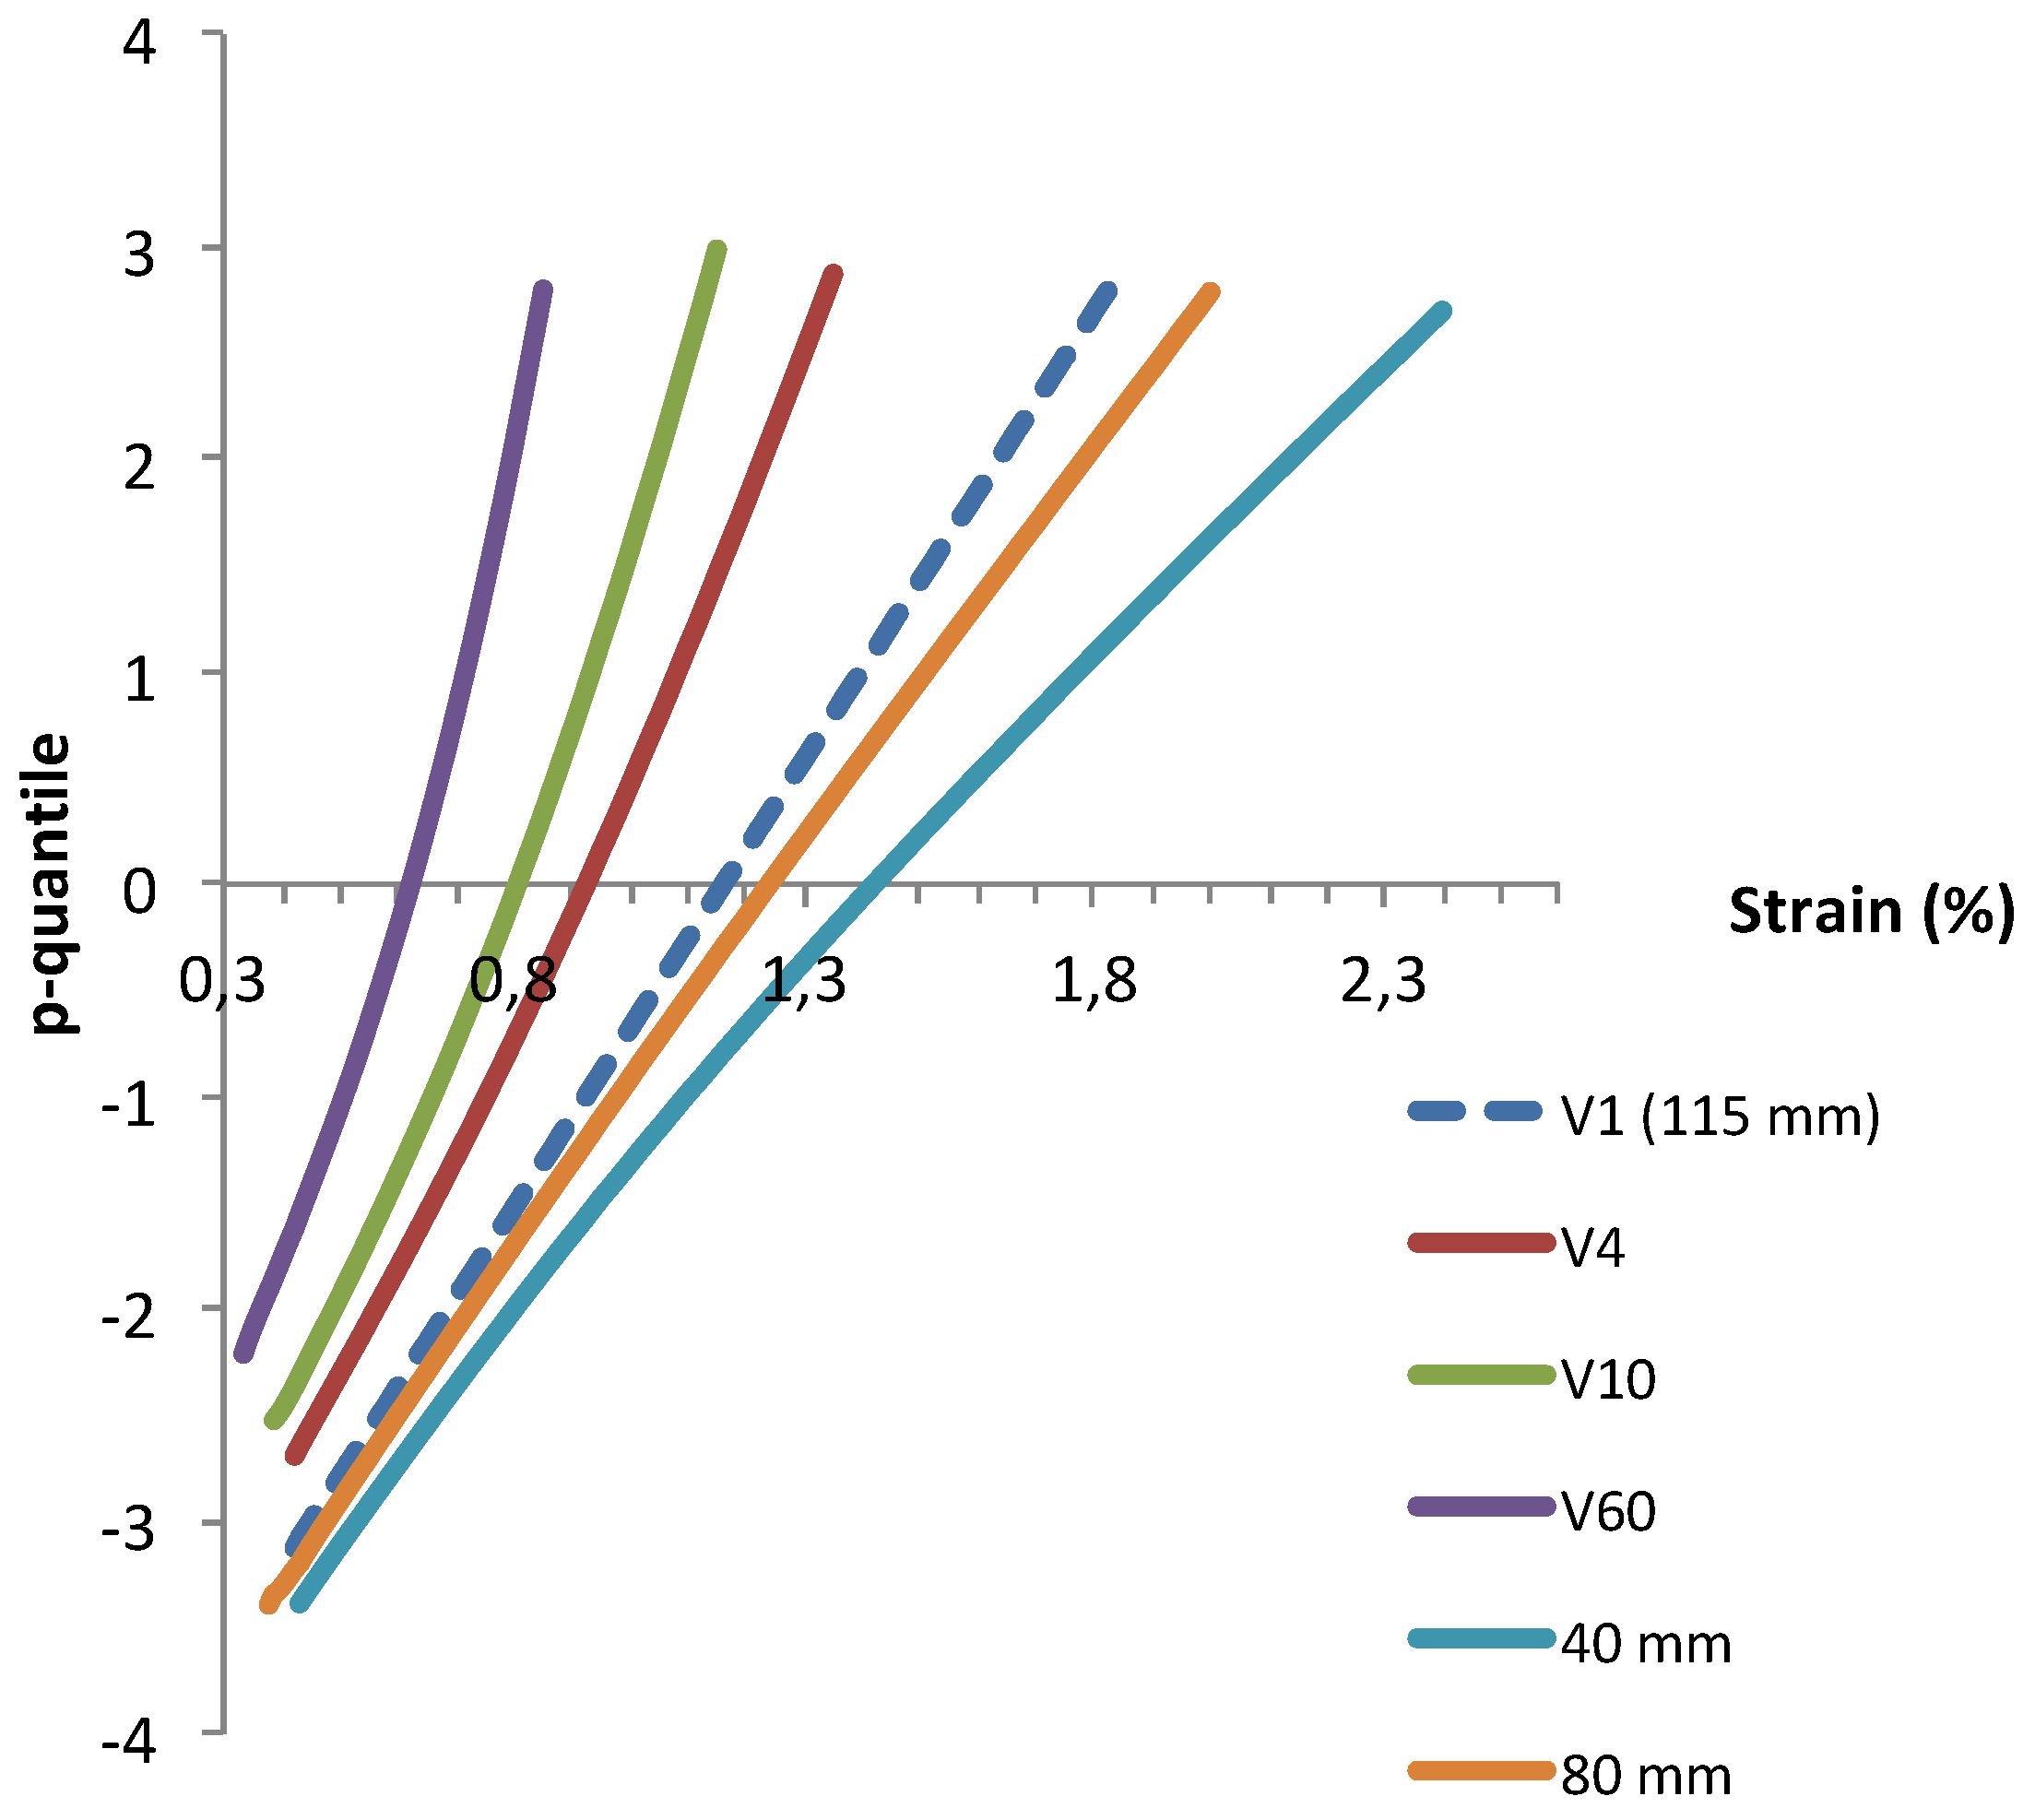
4.2. P-Quantile zp(ε) Plots

The plots of p-quantile zp versus εp diagrams obtained for different gauge lengths fit straight lines (Figure 4), with high coefficients of linear regression (R2 = 0.998 (Table 2)). This result indicates that the data follow a normal distribution. The diagrams of tows with 115 mm long gauges are superimposed, including the diagram of the tow with half-volume (500 filaments against 1000 filaments). This important result indicates that the diagrams of 115 mm gauge tows display very little variation, and it suggests that there is no size effect on flaw strength when the tow volume is half the size, i.e., as small as the volume of 62 mm/1000 filaments tows.
Table 2 summarizes the statistical parameters derived from the values of the slope (1/s) and intercept (μ/s) of the empirical p-quantile curves. It can be noted that the higher estimates of mean flaw strength were obtained on the 40 mm gauge tows, whereas the smaller values of standard deviation were estimated on the 40 and 80 mm gauge tows. Then, the Weibull modulus was found to decrease, whereas the variation in the scale factor looks erratic when the gauge length increases. As pointed out earlier for the normal distribution and for the parameters of zp(εp) diagrams, the size effect on flaw strength does not seem to follow a clear law.
The respective positions of the diagrams agree with those of the F/k0(ε) curves. The diagrams of 115 mm gauge tows overlap at lower strains with that of the 80 mm gauge tow and at higher strains with that of the 40 mm gauge tow.
The values of extremes in the zp(εp) diagrams are −3.09 and 3.09, as given by Equations (22) and (23) for 1000 filaments. The corresponding values of strain were derived using the zp(εp) relation (Equation (6)) (Table 3). The corresponding sizes of crack-like critical flaws were calculated using the following classical fracture mechanics equation for cracks (Table 3):
a c = ( K I C Y E f ε ) 2
where the critical stress intensity factor KIC = 1.2 MPa√m [60], and Y = 1.128.
Note that the values of extreme strain agree with those indicated by the acoustic emission signals in Figure 2c for a 115 mm gauge length tow. Both Table 3 and Figure 4 show that the 115 mm tow contained the largest spectrum of critical flaw sizes and both the weakest and the strongest critical flaws. The highest values of strain were smaller, and the strongest flaws would be bigger for the 40 and 80 mm gauge tows. This result suggests that the shorter tows contained more weaker flaws when compared to the longer tows. This may be the result of the presence of distributions of flaws that would be either spatially inhomogeneous or truncated by the failure of groups of filaments at constant strain. This issue is discussed in a subsequent section.

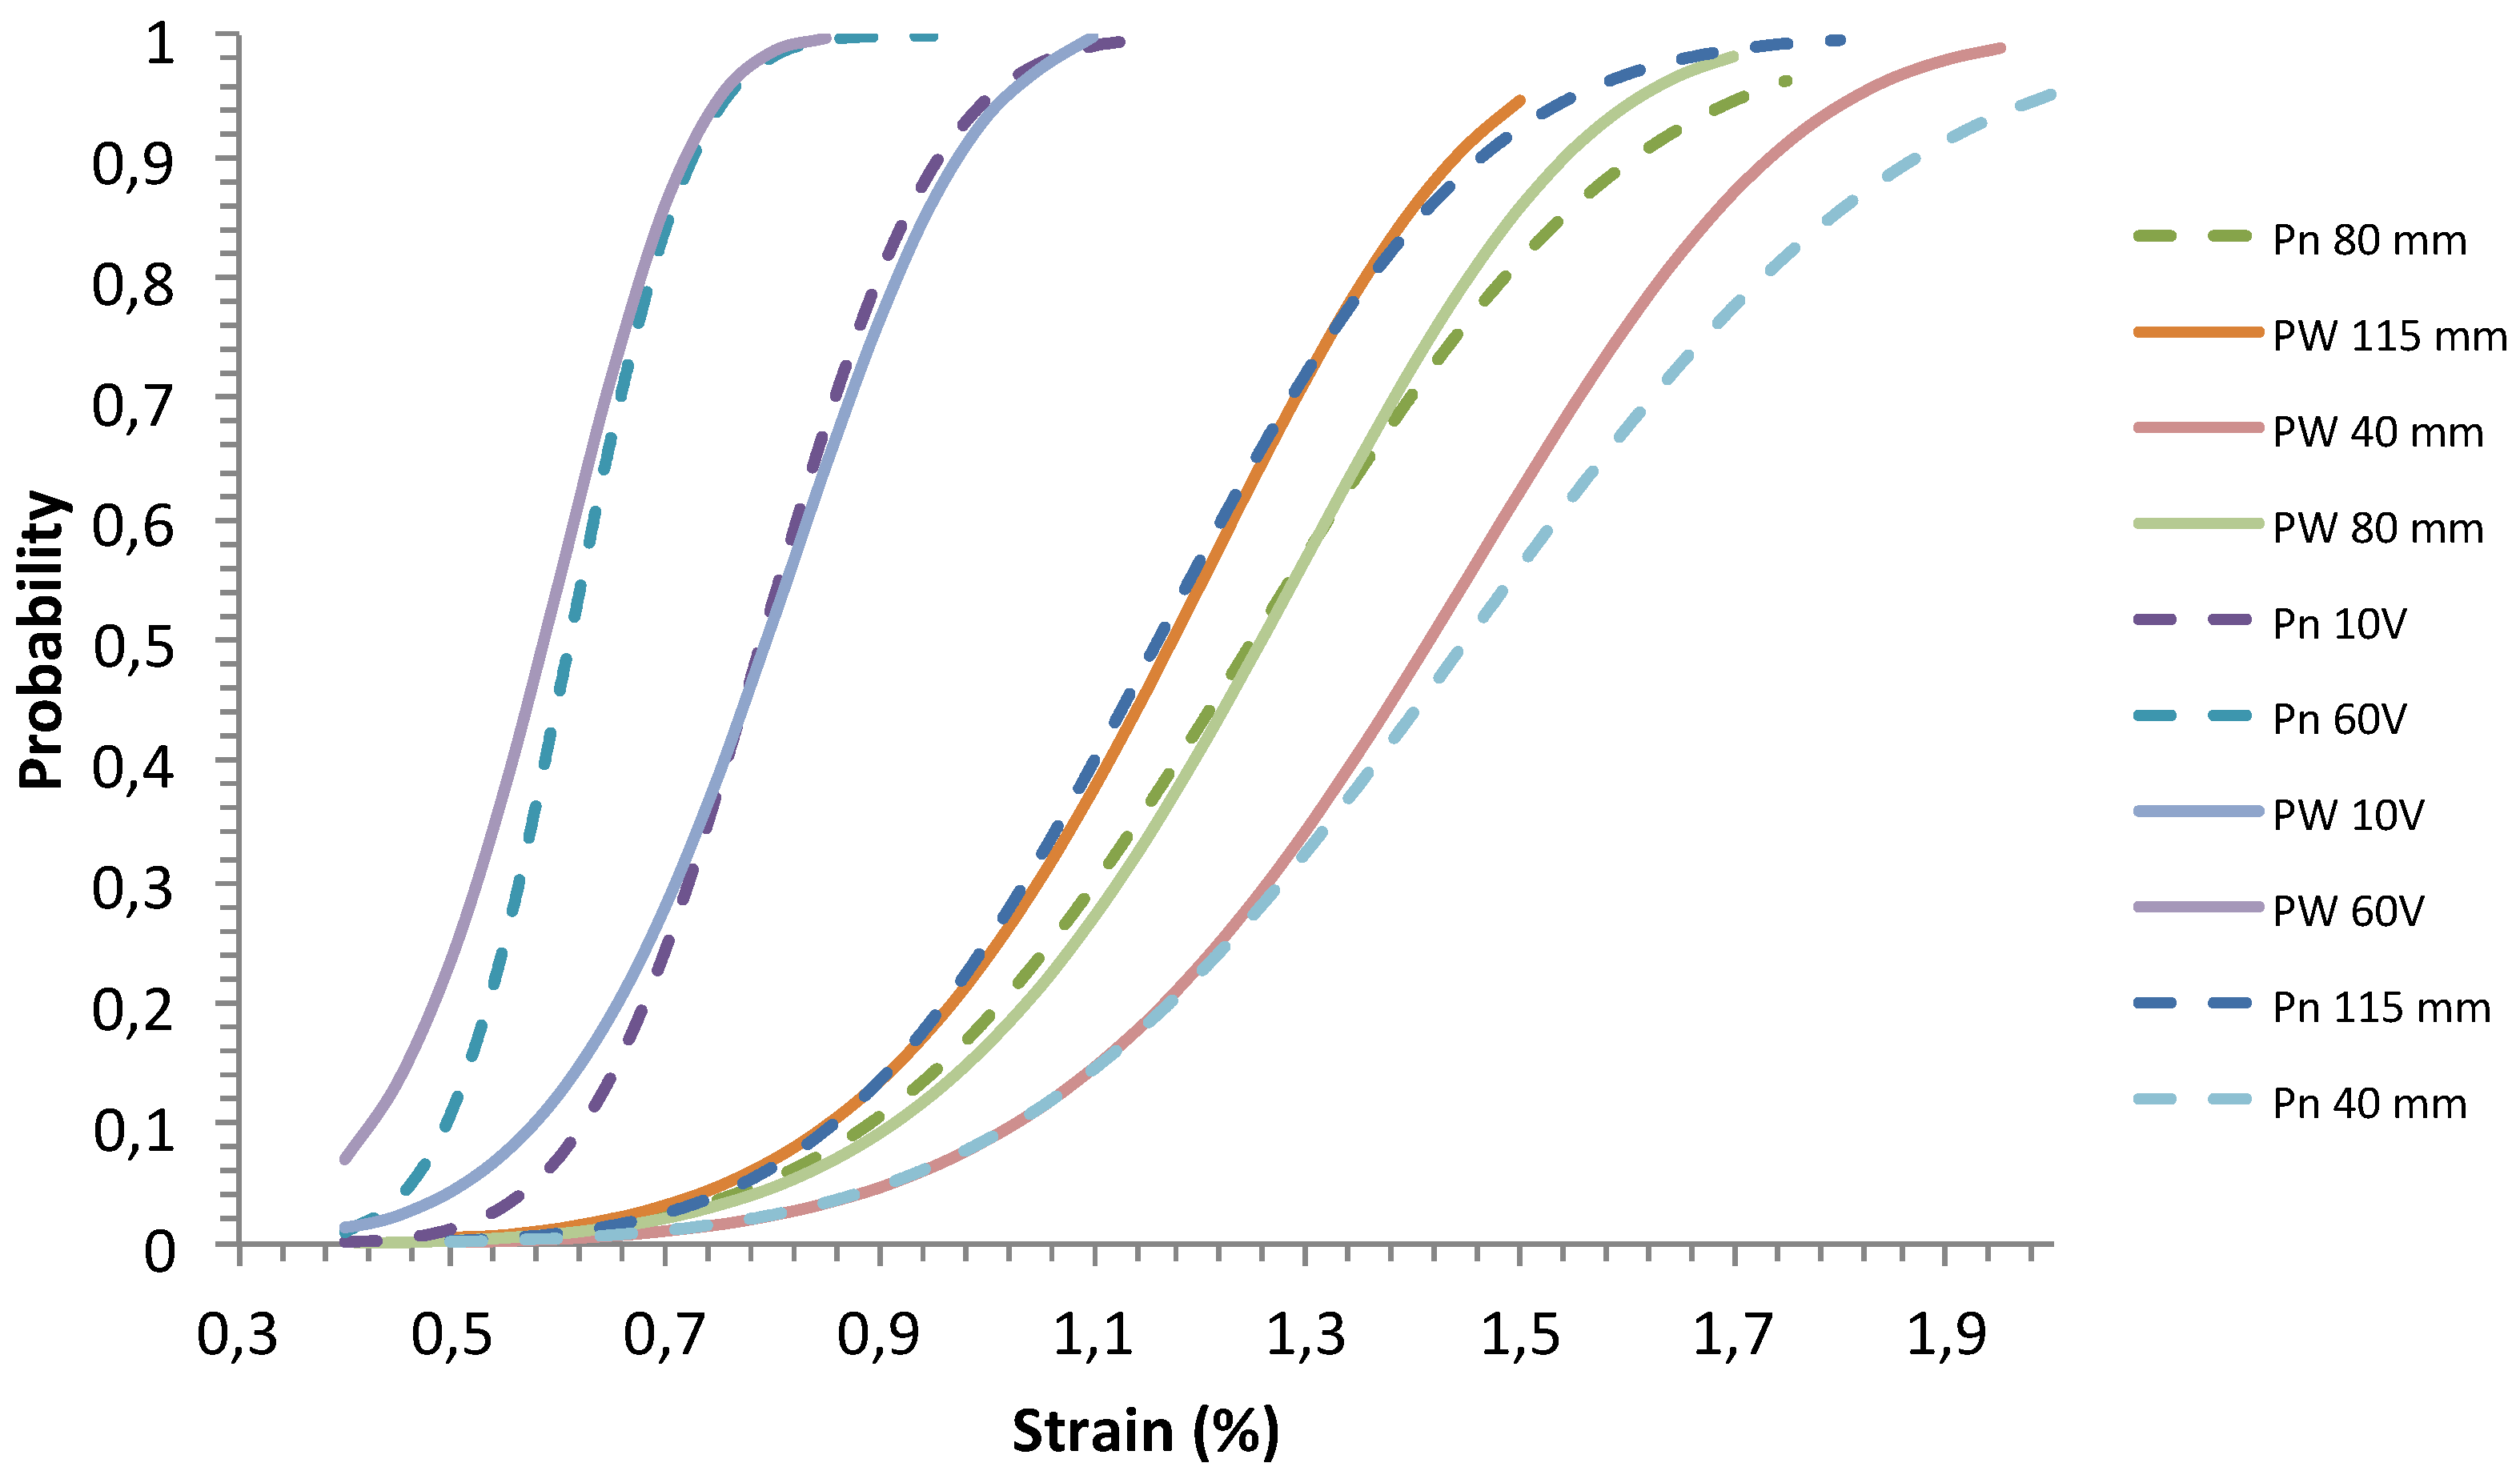
4.3. Cumulative Distribution Functions (CDFs)

Figure 5 shows that the cumulative normal and Weibull distribution functions calculated for the statistical parameters given in Table 2 fit the experimental plots derived from the force–strain curves using Equation (11). Furthermore, the excellent agreement of normal and Weibull distribution functions is measured by high values of the coefficient R2 (Pn-PW) (Table 2). This substantiates that CDFs follow both normal and Weibull distributions.
Figure 5 also shows that equations of unimodal distribution functions fit the experimental data, which agrees with the results of several papers that showed that the fracture of Nicalon fibers is caused by a single population of flaws [43].

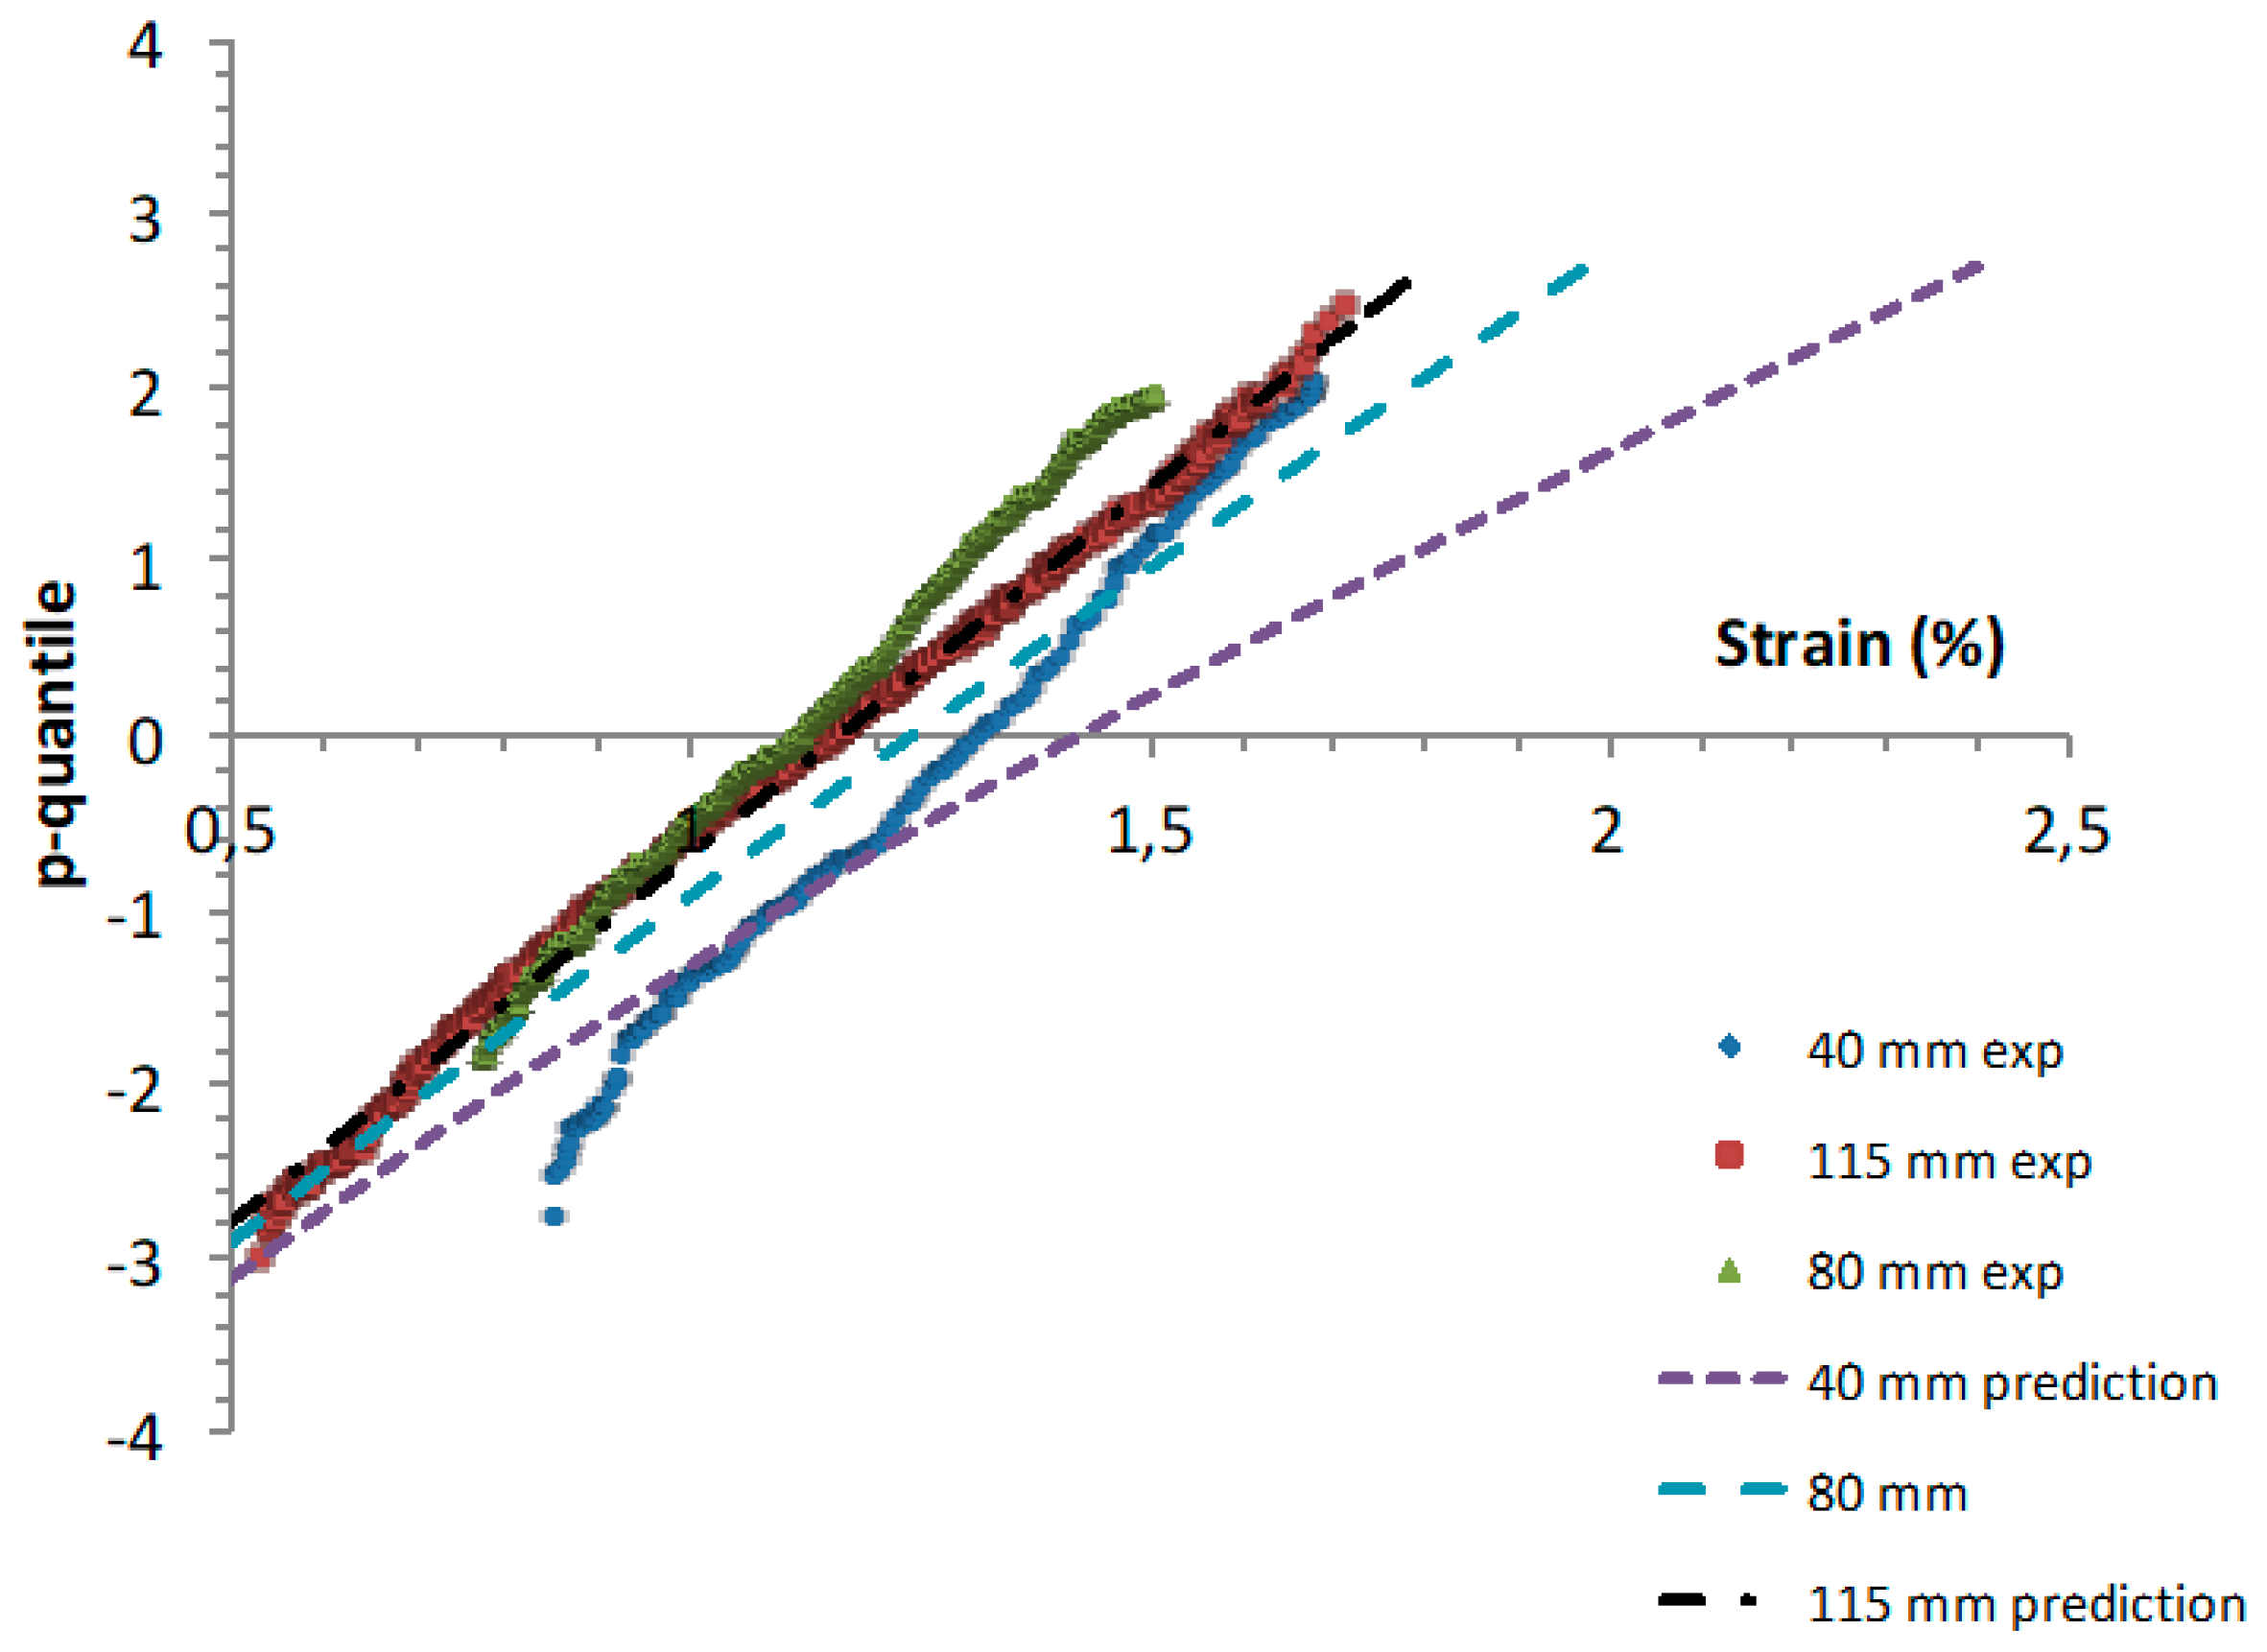
4.4. Predicted P-Quantile Plots from 115 mm Gauge Data Basis

The p-quantile diagrams at various gauge lengths were predicted using Equations (20) and (21), established on the basis of the weakest link assumption that the failure probability increases with specimen size and of the resulting Equation (13). The values of probability Pk(ε) for volume Vk were derived from probability P1(ε) for reference volume V1 using Equation (19). The reference volume was that of tows with 115 mm gauge length and about 1000 filaments.
Linear zp(ε) diagrams were predicted as shown in Figure 6. Table 4 reports values of R2 > 0.99, where R2 is the coefficient of determination that measures the global fit of Equation (6) to predictions. This indicates that the normal distribution can be predicted at various sizes using the proposed approach when the conditions underlying the weakest link assumption are realized.
Figure 7 shows the discrepancy between the predicted and experimental zp(ε) diagrams.
Figure 8 shows that the trend in experimental mean strength diverges from predicted values that decrease with increasing gauge length. Then, the standard deviation s increases with increasing gauge length in the zp(ε) experimental diagrams, whereas it decreases in the zp(ε) predicted diagrams.
Figure 9 shows that the Weibull moduli derived from experimental p-quantile diagrams decrease with increasing tow size, whereas values derived from the predicted p-quantile diagrams increase.
Calculations for much longer gauges confirm that the values of mean flaw strength and standard deviation will decrease with increasing gauge length, whereas the Weibull modulus will increase if the assumption of the weakest link concept is fulfilled (Table 4).
Making some approximations, Peirce [9] obtained the following equations giving the mean strength μnl and standard deviation snl for specimens of length nl:
μ n l = μ l 3 2   ( 1 n 1 5 ) s l
s n l = s l n 1 5
where μl and sl are the mean and standard deviation at gauge length l, and μνl and snl are the mean and standard deviation at gauge length nl.
Figure 8 shows that predictions using Equations (29) and (30) compare fairly well with those made using the approach proposed in the paper. Peirce’s equations confirm the predicted trend in mean flaw strength and standard deviation, which will decrease with increasing gauge length.
Figure 10 compares the Weibull and normal flaw strength distributions predicted from parameters estimated on 115 mm gauge length tows. The predicted Weibull distribution diverges from the normal distribution depending on gauge length, which reflects the variation in the Weibull parameter with gauge length (Table 4 and Figure 10).
Figure 11 compares experimental F/k0 curves with predictions using Equation (8) and the normal distribution function. The parameters of the normal distribution function were predicted from the p-quantile diagram established on the 115 mm gauge length tow. A significant discrepancy can be observed between experimental and predicted curves. Note that these curves represent a trend independent of the number and diameter of filaments.

5. Discussion

The size effect on the flaw strength distribution was not clear, and a discrepancy was observed between experimental results and predictions based on the weakest link concept, which assumes that weaker flaws are present in longer specimens. Understanding may be sought along two lines:
There is either a weakening effect due to adverse events or variability in the density of populations of inherent critical flaws.
The tows with 115 mm gauge length exhibited several significant features:
Good reproducibility of force–strain curves and p-quantile diagrams;
No visible load drops on the force–strain curve;
Good fit of experimental force–strain curves with theory;
Good agreement of the p-quantile diagram with those constructed from experimental strengths measured on single filaments tested individually or from fracture mirror sizes (Figure 12).
Therefore, on the basis of these features, it seems reasonable to consider that reliable intrinsic fracture results were obtained for the gauge length of 115 mm, and that these results could be regarded as a reference for investigations and predictions at various gauge lengths.
Bimodal populations were not revealed by the tests at 115 mm gauge lengths, nor in previous papers at smaller gauge lengths [43,61].
The tows with 80 mm gauge length exhibited the following features:
a—The p-quantile diagram was close to that at 115 mm gauge length;
b—Slight load drops were observed, suggesting the failure of groups of filaments at constant strain;
c—There is satisfactory agreement between the force–strain curve and theory;
d—There is satisfactory linearity in the p-quantile diagram;
e—Feature (a) implies that the p-quintile diagram is also in good agreement with those constructed from experimental strengths measured on single filaments tested individually or from fracture mirror sizes (Figure 12);
f—There is no agreement between the p-quintile diagram and the prediction based on the assumption that bigger flaws are present in larger specimens.
From these features, two possibilities can be envisaged: (i) either there is no size effect at this gauge length, but the population of critical flaws was slightly truncated by failures of groups of fibers, or (ii) there was a significant structural effect, so no conclusion may be drawn about size effect.
On the basis of features (a, c, d, e), the first possibility is the most plausible. Furthermore, it is worth pointing out that feature (d) indicates that a single mode of filament failure operated, so the strength distribution characterizes a population of critical flaw strengths.
The tows with 40 mm gauge length exhibited the following features:
a—A significant number of strengths were significantly larger than previously obtained at 80 and 115 mm;
b—There are significant load drops;
c—There is less satisfactory agreement between the force–strain curve and theory than above;
d—There is less satisfactory linearity in the p-quantile diagram (Figure 4 and Figure 7);
e—There is no agreement between the p-quintile diagram and the prediction based on the assumption that bigger flaws are present in larger specimens.
On the basis of these features, it seems logical to conclude that significant weakening occurred on the tows with 40 mm gauge length due to the contribution of unwanted failures, according to previous findings in [51] on glass fiber tows with short gauge lengths. In [51], many breaks from fiber ends were detected in tows with 30 mm gauge. It can also be concluded that in the absence of artifacts, better agreement would be obtained with predictions based on the assumption that bigger flaws are present in larger specimens. However, at this stage, one cannot anticipate the quality of the agreement.
Finally, the following conclusion is reached: There was no size effect on flaw strength distributions above 75 mm gauge length (75 mm was the gauge length of filaments in Figure 12), and a size effect was possible below. This conclusion is corroborated by the results obtained on tows with 500 filaments and 115 mm gauge length, which coincided with the p-quantile diagrams obtained on tows with twice as large volume (1000 filaments and 115 mm). Tows with 1000 filaments and 57.5 mm gauge length had the same volume as tows with 500 filaments and 115 mm.
The proposed predictive approach allowed important trends to be anticipated on the dependence of flaw strength distributions on volume, under the hypotheses of the weakest link and that failure probability increases with volume and when normal and Weibull distributions are equivalent. It was shown that the Weibull modulus would increase whereas the scale factor would decrease with increasing volume. This questions the pertinence of the Weibull distribution for failure predictions. One can infer that the weakest link hypotheses apply only to the particular case where the geometrical distribution of flaws exhibits a favorable pattern that still needs to be determined.

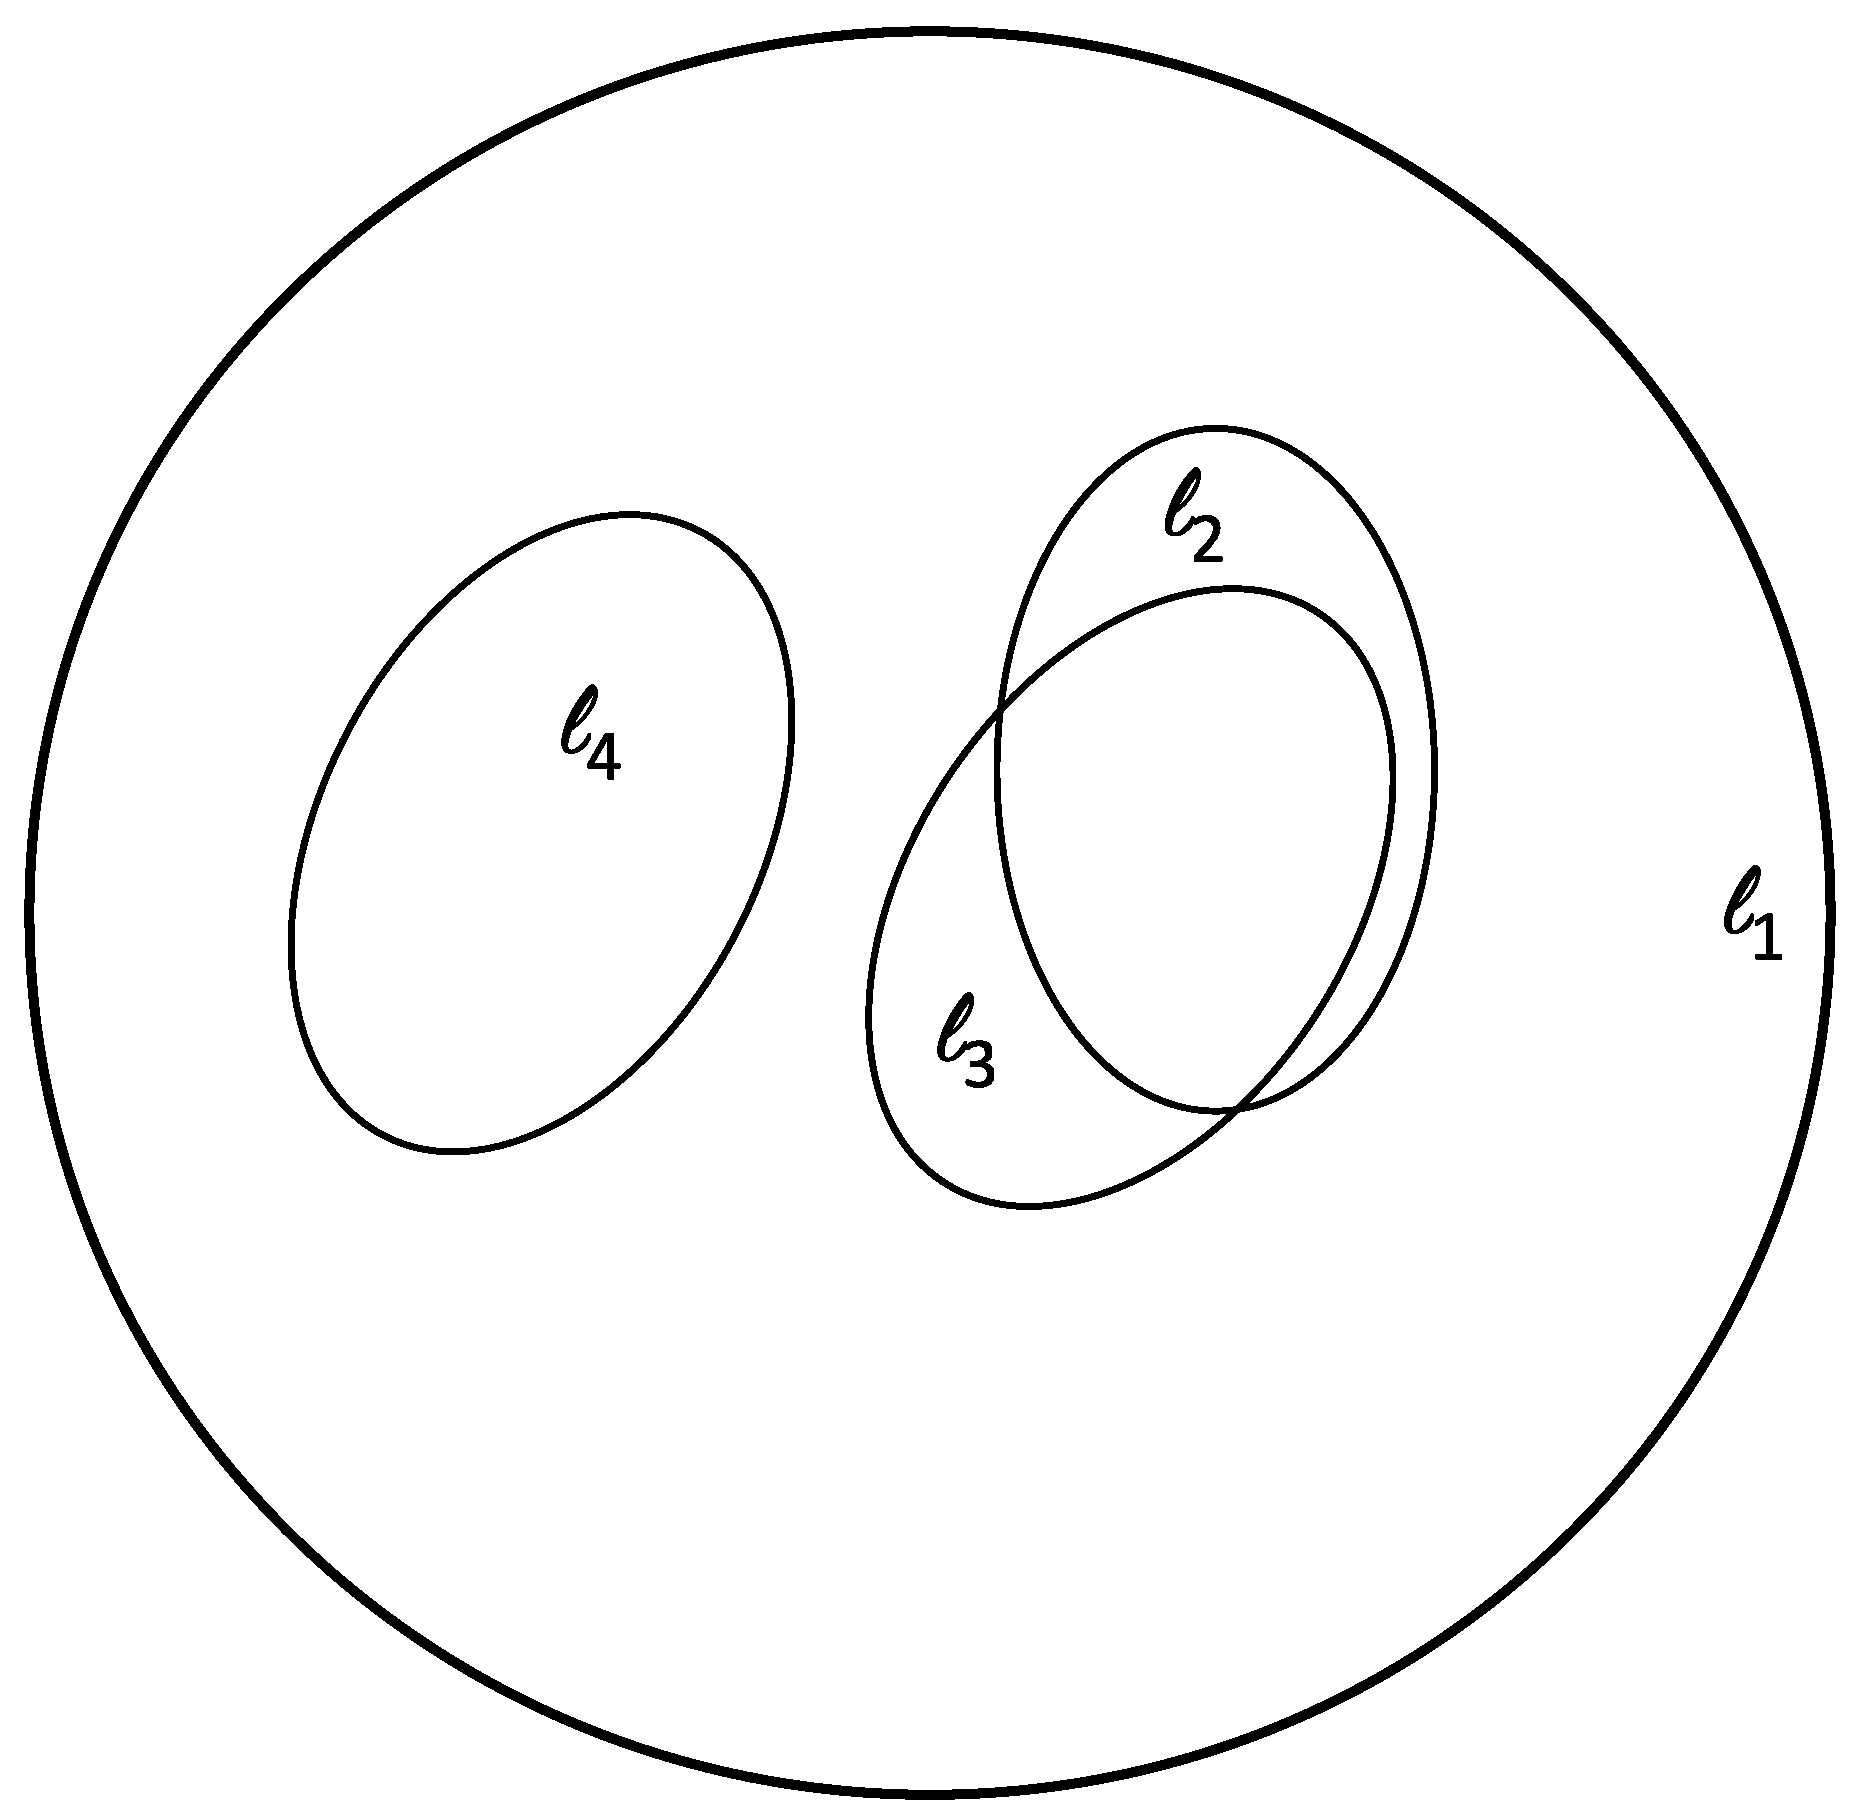
5.1. Influence of Underlying Flaw Population

From the above results, one may infer the following situations for the populations of critical flaws pre-existing in tows, as depicted by the schematic diagram of Figure 13:
(i)
Either a tow contains the whole population of critical flaws typical of the considered fiber type (this tow is indicated by gauge length l1 in Figure 13);
(ii)
Or a tow contains a subset of the whole population. One may consider two cases:
Either there are intersecting subsets with a common range of flaw strengths (examples in Figure 13 are indicated by gauge lengths l2 and l3);
Or there are exclusive subsets (indicated by gauge lengths l2 and l4, or l3 and l4).
The corresponding schematic p-quantile diagrams are shown in Figure 14.
These situations are the consequence of the selection process of flaw strength populations that is induced by taking samples from a roving. Thus, this suggests that below a critical gauge length, the sets of strain data do not characterize the whole population of critical flaw strengths. Their evolution with fiber size may be erratic or not. It depends on the spatial distribution of the critical flaws along the filament length within tows.
Above the critical gauge length, the sets of data are representative of the whole population of critical flaws. In this case, there would not be a size effect on the flaw strength distribution.
It seems reasonable to consider that the 115 mm tows contained the whole distribution of critical flaws, owing to the excellent reproducibility of p-quantile diagrams obtained on several specimens with 115 mm long gauge. Furthermore, it is worth pointing out that the number of flaws existing in these particular tows was sufficiently large: as this number was much larger than 1000 for the 40 mm tows, it can be inferred that it was much larger than 3000 in the 115 mm tows. This population size is quite significant when considering that the volume of these tows is about 18 mm3, that is, 1 critical flaw per 6 × 10⁻³ mm3.
Increasing the number of filaments at constant gauge length may be an alternative approach to the determination of the whole distribution of critical flaw strengths. This method offers the ability to generate large numbers of filament strength data points.

5.2. Simulation of Geometrical Distribution of Flaw Strengths

With a view to illustrate the significance of the geometrical distribution of critical flaw strengths, a linear distribution was generated. For this purpose, a representative cumulative distribution of critical flaw strengths (typically the distribution extracted from results at 115 mm gauge length) was transformed into a linear distribution ε(x), with x being the distance from the gauge origin. Owing to the high density of critical flaw strengths, it was described by a set of 100 data points, covering the whole interval of failure strains: 0.55 < ε < 1.7%. The ordered cumulative strength distribution was converted into an orderless set of strengths that were plotted along the x-axis, as shown in Figure 15. Note that the linear distribution of flaw strengths looks like the distribution of acoustic emission events reported in Figure 2c.
Figure 15 depicts an example of a possible flaw strength distribution along the tow axis. Subdividing the length into segments, it can be noted that the strength of the weakest flaw does not necessarily decrease with increasing segment length. This is evidenced by comparing the subset in the 20 mm segment defined by 0 < x < 20 mm with the 30 mm segment defined by 20 < x < 50 mm. Then, in order to characterize the variability and size dependence of the distribution, mean strengths were calculated in segments at various locations with or without the same length. Figure 16 shows a plot of mean strains in segments with different sizes. It displays a wide variability. It appears that the mean strain can be larger in a long segment than in a shorter one.
The variation in the mean strain does not consist of a systematic decrease with increasing segment size. Instead, the mean strain value may increase with segment size. This confirms that the size effect may be erratic and that it does not follow a formal law when the tow size is smaller than the critical length.
The discrepancy between predicted and experimental results can be attributed to the assumption that the predictions were founded upon. Experimental results and the linear distribution of flaws in shorter and longer segments clearly showed that the probability of failure does not necessarily or systematically increase with specimen size. The trend depends on the geometric distribution of flaw strengths.

5.3. Composite Fracture

The fracture of 2D woven SiC/SiC under tensile load is dictated by the failure of tows parallel to the load direction [61]. After the saturation of matrix cracking, the load is fully carried by these tows when they are free of fiber/matrix interactions. In the presence of fiber/matrix interactions, the composite is subject to premature failure.
Strain at maximum force ε(αc) is a characteristic of tow fracture under certain loading conditions: αc is the probability of the fracture of the critical fiber that triggers tow fracture at maximum force. Experimental values of ε(αc) were extracted from the experimental force–strain curves (Figure 17). Figure 17 shows experimental values of ε(αc), which compare fairly well with the higher strain-to-failure of Nicalon/SiC composite (around 1%) free of matrix/fiber interaction. The series of strain-to-failure < 0.8% show some variation, but not a decrease with increasing gauge length.
The results agree with previous results [53,54,55]. They can be examined in light of the above interpretation of the size dependence of strain-to-failure based on the critical size of the specimen and on the whole associated population of critical flaws. Thus, the absence of a size effect can be attributed to the fact that the population of tows in the Nicalon/SiC specimens contained the whole population of critical flaws. The Nicalon/SiC test specimens contained 60 tows of 500 filaments and thus more than 30,000 critical flaws. Therefore, it can be accepted that they contained the whole population of critical flaws.

5.4. Synthesis

It is worth pointing out this statement by Sutherland et al. that summarizes the point of size effects in composites: “It has been thought for some time that a strength size effect may exist for some composites. This is thought to be due to the increased probability of a larger specimen containing a flaw large enough to lead to failure. However, an accurate quantitative description of such effects, or even firm evidence of their existence, has proved elusive” [52].
The present analysis of critical flaw strength distributions of fiber tows is in line with this statement, and it sheds light on the following features of size effects on the strengths of individual fibers and composites, which were summarized in the literature review of the introduction:
The size effects seem not to follow the logic;
They seem not to be accurately predictable;
The Weibull statistical parameters display wide variability.
From the results of experiments and of the model of the size effect on the normal distribution and from the consideration of underlying populations of critical flaws, it appears that the basic assumption that the probability of the existence of a large flaw increases with specimen size is not fulfilled in the case of tows made of a very large number of small-diameter parallel filaments. This may be attributed to the specific structure of tows:
The size of flaws is limited by the small diameter of filaments (about 14 μm for the SiC Nicalon filaments), so new sufficiently large critical flaws cannot appear indefinitely.
The tows contained a very large number of critical flaws commensurate with the number of filaments, since there is a critical flaw per filament. As a consequence, the whole population inherent to a fiber type is present in a tow above a critical length that may not be so large (60 mm for the SiC Nicalon fiber).
Selecting a batch of filaments from a tow is a way to extract a reduced data set from the whole population of critical flaw strengths. The number of possible data sets is very large. Furthermore, there is no reason that they would all be similar or that they would contain bigger flaws when their size is increased. The data sets are generated by an erratic process. The statistical theories are unable to predict the data sets.
Considering the underlying flaw populations pre-existing in filaments makes it possible to better understand why the size effects could not be indisputably determined and why statistical models do not allow them to be treated accurately. The analysis focused on critical flaw strength distributions since they govern failure. However, a size effect may be observed on the load-carrying capacity of the composite when the number of filaments is increased.

6. Conclusions

Critical flaw strengths in Nicalon fiber tows with 1000 filaments and 57.5 mm gauge length follow the normal cumulative distribution function. Direct evidence was provided by the linearity of experimental p-quantile diagrams extracted from the corresponding tensile force–strain curves. The Weibull distribution function was found to be equivalent to the normal distribution function. Empirical results for the longer gauge length of 115 mm (with 500 or 1000 filaments) showed remarkable reproducibility that warrants consideration. Such reproducibility indicates that similar critical flaw strength distributions dictated filament failures. It can be inferred that these fiber tows of 115 mm gauge length contained the whole population of critical flaws inherent to this SiC Nicalon fiber type.
The approach to the prediction of the size effect on the normal distribution was based on the assumption of the weakest link that the failure probability increases with volume. Predictions agreed with the equations of mean strength and standard deviation proposed by Peirce. The Weibull distributions predicted for reference statistical parameters were not equivalent to the predicted normal distributions.
It was shown that the dependence of experimental p-quantile diagrams and flaw strength distributions on gauge length did not follow the predicted trend. Tows with shorter gauge lengths of 40 and 80 mm did not exhibit reproducible behavior, owing to structural effects that affect the stress state and cause unwanted filament failures. Despite weakening due to this artifact, the tow with the shortest gauge length of 40 mm exhibited the highest filament strengths. It can be inferred from this result that this tow did not contain the same critical flaw distribution as the tows with 115 mm gauge length, i.e., the whole population typical of the considered fiber type. When the whole population of critical flaws is present, the flaw strength distributions are not sensitive to size effects. It was established for the Nicalon fiber type in this paper that around 60 mm is probably the critical gauge length above which tows with 1000 filaments contain the whole population of inherent critical flaws.
Below the critical length, the flaw strength distribution is a subset of the whole distribution. Owing to the variability of the geometrical distribution of critical flaws, the condition that failure probability increases with specimen volume may not be fulfilled, which implies that the size dependence of the critical flaw strength distribution is not predictable using a formal equation. Furthermore, extrinsic effects due to structural phenomena may pollute the trend in intrinsic effects and enhance size effects.
The available tensile strength data for 2D SiC/SiC composite specimens are comparable to the trend in the strain at maximum force, which supports the analysis in the present paper. Thus, the tensile strength of 2D SiC/SiC composite specimens would not be size-dependent in the case where fiber/matrix interactions do not operate beyond matrix cracking saturation. Owing to the huge number of filaments in composite specimens, it can be logically inferred that composite specimens contain the whole distribution of inherent flaws typical of this fiber type.
It can be inferred that the concept of critical specimen size with respect to the sensitivity of flaw distributions to size effects is governed by the distribution pattern of critical flaw strengths in fiber tows. This pattern is dictated by the tow structure of parallel filaments that contain one critical flaw each. This kind of structural order does not exist in monolithic materials.

Author Contributions

Conceptualisation, J.L. and M.R.; methodology, J.L. and M.R.; validation, J.L. and M.R.; formal analysis, J.L.; writing—original draft preparation, J.L.; writing—review and editing, J.L. and M.R. All authors have read and agreed to the published version of the manuscript.

Funding

This research received no external funding.

Institutional Review Board Statement

Not applicable.

Informed Consent Statement

Not applicable.

Data Availability Statement

The data presented in this study are available on request from the corresponding author.

Conflicts of Interest

The authors declare no conflict of interest.

References

  1. Bunsell, A. (Ed.) Handbook of Properties of Textile and Technical Fibers, 2nd ed.; Elsevier: Amsterdam, The Netherlands, 2018; ISBN 9780081012727. [Google Scholar]
  2. Lamon, J. Brittle Fracture and Damage of Brittle Materials and Composites Statistical-Probabilistic Approaches; Lamon, J., Ed.; ISTE Press: London, UK; Elsevier: Oxford, UK, 2017; pp. 35–49. ISBN 9781785481215. [Google Scholar]
  3. Calard, V.; Lamon, J. Failure of fibres bundles. Compos. Sci. Technol. 2014, 64, 701–710. [Google Scholar] [CrossRef]
  4. Lamon, J.; R’Mili, M. Damage and failure of SiC fiber tows during environment activated slow crack growth: Residual behavior and Strength-Probability-Time diagrams. Acta Mater. 2017, 131, 197–205. [Google Scholar] [CrossRef]
  5. Lamon, J.; R’Mili, M. Investigation of flaw strength distributions from tensile force-strain curves of fiber tows. Compos. Part A 2021, 145, 106262. [Google Scholar] [CrossRef]
  6. Weibull, W. A statistical distribution function of wide applicability. J. Appl. Mech. 1951, 18, 293. [Google Scholar] [CrossRef]
  7. Freudenthal, A. Fracture; Liebowitz, H., Ed.; Chapter 6; Academic Press: New York, NY, USA, 1968; Volume II. [Google Scholar]
  8. Gumbel, E. Statistics of Extremes; Columbia University Press: New York, NY, USA, 1968. [Google Scholar]
  9. Jayatilaka, A.D.S.; Trustrum, K. Statistical approach to brittle fracture. Mater. Sci. 1977, 10, 1426–1430. [Google Scholar] [CrossRef]
  10. Argon, A.S.; McClintock, F.A. Mechanical Behavior of Materials; Addison-Wesley: Reading, MA, USA, 1966. [Google Scholar]
  11. Batdorf, S.B.; Crose, J.G. A statistical theory for the frcture of brittle structures subjected to nonuniform polyaxial stresses. J. Appl. Mech. 1974, 41, 459. [Google Scholar] [CrossRef]
  12. Lamon, J. Ceramics reliability: Statistical analysis of multiaxial failure using the Weibull approach and the Multiaxial Elemental Strengh model. J. Am. Ceram. Soc. 1990, 73, 2204. [Google Scholar] [CrossRef]
  13. Lamon, J.; Evans, A.G. Structural analysis of bending strengths for brittle solids: A multiaxial fracture problem. J. Am. Ceram. Soc. 1983, 66, 177. [Google Scholar] [CrossRef]
  14. Lamon, J. Statistical approaches to failure for ceramic reliability assessment. J. Am. Ceram. Soc. 1988, 71, 106. [Google Scholar] [CrossRef]
  15. Gong, J. A new probability index for estimating Weibull modulus for ceramics with least square method. J. Mater. Sci. Lett. 2000, 19, 827–829. [Google Scholar] [CrossRef]
  16. Barnett, V. Probability plotting methods and order statistics. J. R. Statist. Soc. 1975, 24, 95–108. [Google Scholar] [CrossRef]
  17. Watson, A.S.; Smith, R.L. An examination of statistical theories for fibrous materials in the light of experimental data. J. Mater. Sci. 1985, 20, 3260–3270. [Google Scholar] [CrossRef]
  18. Paramonov, Y.; Andersons, J. A family of weakest link models for fiber strength distribution. Compos. Part A 2007, 38, 1227–1233. [Google Scholar] [CrossRef]
  19. Phani, K.K. A new modified Weibull distribution function for the evaluation of the strength of silicon carbide and alumina fibres. J. Mater. Sci. 1988, 23, 2424–2428. [Google Scholar] [CrossRef]
  20. Amaniampong, G.; Burgoyne, C.J. Statistical variability in the strength and failure strain of aramid and polyester yarns. J. Mater. Sci. 1994, 29, 5141–5152. [Google Scholar] [CrossRef]
  21. Bergman, B. On the estimation of the Weibull modulus. J. Mater. Sci. Lett. 1984, 3, 689–692. [Google Scholar] [CrossRef]
  22. Deng, B.; Wang, X.; Jiang, D.; Gong, J. Description of the statistical variations of the measured strength for brittle ceramics: A comparison between two-parameter Weibull distribution and normal distribution. Processing Appl. Ceram. 2020, 14, 293–302. [Google Scholar] [CrossRef]
  23. Lu, C.; Danzer, R.; Fischer, F.D. Fracture statistics of brittle materials: Weibull or normal distribution. Phys. Rev. E. 2002, 65, 067102. [Google Scholar] [CrossRef] [Green Version]
  24. Basu, B.; Tiwari, D.; Kundu, D.; Prasad, R. Is Weibull distribution the most appropriate statistical strength distribution for brittle materials? Ceram. Int. 2009, 35, 237–246. [Google Scholar] [CrossRef] [Green Version]
  25. Gorjan, L.; Ambrozic, M. Bending strength of alumina ceramics: A comparison ofWeibull statistics with other statistics based on very large experimental data set. J. Eur. Ceram. Soc. 2012, 32, 1221–1227. [Google Scholar] [CrossRef]
  26. Guo, F.; Fei, Q.; Li, Y.; Zhang, P.; Wang, M.; Yu, J. “Novel statistical analysis method for determining shear strength of C/C composite pin. Ceram. Int. 2020, 46, 5262–5270. [Google Scholar] [CrossRef]
  27. Moreton, R. The effect of gauge length on the tensile strength of RAE carbon fibers. Fiber Sci. Technol. 1969, 1, 273. [Google Scholar] [CrossRef]
  28. Zweben, C. Is there a size effect in composites? Composites 1994, 25, 451. [Google Scholar] [CrossRef]
  29. Metcalf, A.G.; Schmitz, G.K. Effect of length on the strength of glass fibers. Proc. ASTM 1964, 64, 1075–1093. [Google Scholar]
  30. Bader, M.G.; Priest, A.M. Statistical aspects of fiber and bundle strength in hybrid composites. In Progress in Science and Engineeringof Composites ICCM IV; Hayash, T., Ed.; SAMPE: Diamond Bar, CA, USA, 1982; pp. 1129–1136. [Google Scholar]
  31. Eckel, A.J.; Bradt, R.C. Strength distribution of reinforcing fibers in a Nicalon Fiber/Chemically Vapor Infiltrated Silicon Carbide Matrix Composite. J. Am. Ceram. Soc. 1989, 72, 455–458. [Google Scholar] [CrossRef]
  32. Prewo, K.M. Tension and flexural strength of Silicon Carbide fiber reinforced glass ceramics. J. Mater. Sci. 1986, 21, 3590–3600. [Google Scholar] [CrossRef]
  33. Sawyer, L.C.; Chen, R.T.; Haimbach, F.I.V.; Harget, P.J.; Prack, E.R.; Jaffe, M. Thermal stability characterization of SiC fibers: II, fractography and structure. Ceram. Eng. Sci. Proc. 1986, 7, 914–930. [Google Scholar]
  34. Simon, G.; Bunsell, A.R. Mechanical and structural characterization of the Nicalon Silicon Carbide fiber. J. Mater. Sci. 1984, 19, 3649–3657. [Google Scholar] [CrossRef]
  35. Lissart, N.; Lamon, J. Statistical analysis of failure of SiC fibers in the presence of bimodal flaw populations. J. Mater. Sci. 1997, 32, 6107–6117. [Google Scholar] [CrossRef]
  36. Wu, H.F.; Lu, L.L. Strength variability and size effect of Nicalon fibre bundles. J. Mater. Sci. 1994, 29, 4232–4237. [Google Scholar] [CrossRef]
  37. Wu, H.F.; Netravali, N.J. Weibull analysis of strength-length relationships in single Nicalon SiC fibers. J. Mater. Sci. 1984, 19, 3318–3324. [Google Scholar]
  38. Sutherland, L.S.; Guedes Soares, C. Review of probabilistic models of the strength of composite materials. Reliab. Eng.-Syst. Saf. 1997, 56, 183–196. [Google Scholar] [CrossRef]
  39. Peirce, F.T. Tensile Tests for Cotton Yarns-The Weakest Link. J. Text. Inst. Trans. 1926, 17, 355–368. [Google Scholar]
  40. Epstein, B. Application of the theory of extreme values in fracture problems. J. Am. Stat. Assoc. 1948, 43, 403–412. [Google Scholar] [CrossRef]
  41. Sakai, T. Effect of Yarn Length on Tensile Strength and Its Distribution. Ph.D. Thesis, Georgia Institute of Technology, Atlanta, GA, USA, November 1970. [Google Scholar]
  42. Frenkel, J.I.; Kontorova, T.A. A statistical theory of the brittle strength of real crystals. J. Phys. USSR 1943, 7, 108. [Google Scholar]
  43. R’Mili, M.; Godin, N.; Lamon, J. Flaw strength distributions and statistical parameters for ceramic fibres: The Normal distribution. Phys. Rev. E 2012, 85, 1106–1112. [Google Scholar]
  44. Lamon, J.; R’Mili, M.; Reveron, H. Investigation of statistical distributions of fracture strengths for flax fibre using the tow-based approach. J. Mat. Sci. 2016. [Google Scholar] [CrossRef]
  45. Parthasarathy, T.A. Parthasarathy, Extraction of Weibull Parameters of Fiber Strength from Means and Standard Deviations of Failure Loads and Fiber Diameters. J. Am. Ceram. Soc. 2001, 84, 588–592. [Google Scholar] [CrossRef]
  46. Callaway, E.B.; Zok, F.W. Accurate determination of fiber strength distributions. J. Am. Ceram. Soc. 2016, 100, 1202–1211. [Google Scholar] [CrossRef]
  47. Callaway, E.B.; Zok, F.W. Weibull parameters obtained from dependence of fiber strength on fiber length and area. J. Am. Ceram. Soc. 2018, 101, 4719–4731. [Google Scholar] [CrossRef]
  48. Chi, Z.; Chou, T.W.; Shen, G. Determination of single fiber strength distribution from fiber bundle testings. J. Mater. Sci. 1984, 19, 3319–3324. [Google Scholar] [CrossRef]
  49. Lisssart, N. Probabilité de Rupture et Fiabilité des Composites à Matrice Céramique (Failure Probability and Reliability of Ceramic Matrix Composites). Ph.D. Thesis, University of Bordeaux, Bordeaux, France, 1994. [Google Scholar]
  50. R’Mili, M.; Bouchaour, T.; Merle, P. Estimation of Weibull parameters from loose bundle tests. Compos. Sci. Technol. 1996, 56, 831–834. [Google Scholar] [CrossRef]
  51. R’Mili, M.; Moevus, M.; Godin, N. Statistical fracture of E-glass fibres using a bundle tensile test and acoustic emission monitoring. Compos. Sci. Technol. 2009, 68, 1800. [Google Scholar] [CrossRef] [Green Version]
  52. Sutherland, L.S.; Shenoi, R.A.; Lewis, S.M. Size and scale effects in composites: Literature review. Compos. Sci. Technol. 1999, 59, 209–220. [Google Scholar] [CrossRef]
  53. Calard, V.; Lamon, J. A probabilistic-statistical approach to the ultimate failure of ceramic-matrixcomposites—part I: Experimental investigation of 2D woven SiC/SiC composites. Compos. Sci. Technol. 2002, 62, 385–392. [Google Scholar] [CrossRef]
  54. Calard, V.; Lamon, J. A probabilistic-statistical approach to the ultimate failure of ceramic-matrixcomposites—part II: Macroscopic model. Compos. Sci. Technol. 2002, 62, 395–399. [Google Scholar] [CrossRef]
  55. Drechsler, K.; Heine, M.; Mitschang, P.; Baur, W.; Gruber, U.; Fischer, L.; Öttinger, O.; Heidenreich, B.; Lützenburger, N.; Voggenreiter, H. Carbon Fiber Reinforced Composites. In Ullmann’s Encyclopedia of Industrial Chemistry; Ley, C., Ed.; Wiley-VCH: Weinheim, Germany, 2009. [Google Scholar] [CrossRef]
  56. nternational Standard ISO 22459; Fine Ceramics (Advanced Ceramics, Advanced Technical Ceramics)-Reinforcement of Ceramic Composites-Determination of Distribution of Tensile Strength and Tensile Strain to Failure of Filaments within a Multifilament tow at Ambient Temperature. International Organization for Standardization: Geneva, Switzerland, 2020.
  57. Phoenix, S.L. Probabilistic strength analysis of fibre bundle structures. Fibre Sci. Technol. 1974, 7, 15–31. [Google Scholar] [CrossRef]
  58. Hill, R.; Okoroafor, E.U. Weibull statistics of fibre bundle failure using mechanical and acoustic emission testing: The influence of interfibre friction. Composites 1995, 26, 699–705. [Google Scholar] [CrossRef]
  59. Wilson, D.M. Statistical tensile strength of NextelTM 610 and NextelTM 720 fibers. J. Mat. Sci. 1997, 32, 2535–2542. [Google Scholar] [CrossRef]
  60. Mazerat, S. Fibers for Reinforcement of SiC/SiC Composite: Improvement of Lifetime and Correlation with Chemical Reactivity. Ph.D. Thesis, University of Bordeaux, Bordeaux, France, 20 July 2012. [Google Scholar]
  61. Lamon, J. Approach to microstructure-behavior relationships for ceramic matrix composites reinforced by continuous fibers. Ceramic Matrix Composites: Materials, Modeling and Applications. Ceram. Matrix Compos. Mater. Modeling Technol. 2014, 520–547. [Google Scholar] [CrossRef] [Green Version]
  62. Guillaumat, L. Mécanique de la Multifissuration des CMC: Relations Avec la Microstructure et les Lois de Comportement (Multicracking of CMCs: Relationships with Microstructure and Behavior Law). Ph.D. Thesis, University of Bordeaux, Bordeaux, France, 1994. [Google Scholar]
  63. Droillard, C. Elaboration et Caractérisation de Composites à Matrice SiC et à Interphase Séquencée C/SiC. Processing and Characterization of Composites with SiC Matrix and Multilayered C/SiC Interphases). Ph.D. Thesis, University of Bordeaux, Bordeaux, France, 1993. [Google Scholar]
Figure 1. Tow test setup with extensometer clamped to the specimen and acoustic emission sensors on grips.
Jcs 06 00171 g001
Figure 2. Force–strain curves obtained on tows with different gauge lengths and 1000 filaments: (a) 115 mm gauge length (the typical behavior of a tow with 500 filaments is also shown); (b) 40, 80 and 115 mm (also shown are the theoretical curves calculated using Equation (8) for the normal distribution of flaw strengths); (c) 115 mm and location of AE events along specimen axis (the parallel red lines delineate gauge length).
Jcs 06 00171 g002
Figure 3. Typical F(ε)/k0 vs. ε curves for various gauge lengths; 115 mm/500 refers to a tow with 500 filaments.
Jcs 06 00171 g003
Figure 4. P-quantile zp(εp) plots for various gauge lengths; 115 mm/500 refers to a tow with 500 filaments.
Jcs 06 00171 g004
Figure 5. Experimental cumulative distributions derived from the force–strain curves and normal (Pn) and Weibull (PW) distribution functions derived from the p-quantile diagrams of Figure 4.
Jcs 06 00171 g005
Figure 6. P-quantile zp(ε) diagrams predicted from the diagram at 115 mm gauge length; gauge lengths: 40 mm, 80 mm, 460 mm (V4), 1150 mm (V10) and 6900 mm (V60).
Jcs 06 00171 g006
Figure 7. Comparison of experimental p-quantile diagrams with predictions from the 115 mm gauge length p-quantile diagram (as baseline).
Jcs 06 00171 g007
Figure 8. Predictions from 115 mm quantile diagram: mean (μ) and standard deviation (s) values derived from the p-quantile diagrams predicted for various gauge lengths and mean and standard deviation values calculated using Peirce’s equations.
Jcs 06 00171 g008
Figure 9. Predictions from 115 mm quantile diagram: Weibull modulus and scale factor values derived from the p-quantile diagrams predicted for various gauge lengths.
Jcs 06 00171 g009
Figure 10. Comparison of predicted cumulative normal (Pn) and Weibull (PW) distribution functions for various gauge lengths: 115 mm (basis), 40 mm, 80 mm, 1150 mm (10 V) and 6900 mm (60 V).
Jcs 06 00171 g010
Figure 11. Comparison of experimental F/k0 curves with predictions using Equation (8) and normal distribution function.
Jcs 06 00171 g011
Figure 12. Comparison of p-quantile diagrams of Nicalon fibers for critical flaw strengths derived from: (i) previous p-quantile vs. strain diagrams at 115 mm gauge length for Young’s modulus = 180 GPa, (ii) tensile tests on individual filaments with 75 mm gauge length, (iii) fracture mirror radius (rm) measured on filaments in a tow with 75 mm gauge length and using equation σ = A r m , where A= 3.5 MPa√m [49] and rm is filament radius.
Jcs 06 00171 g012
Figure 13. Schematic diagram showing the total set of critical flaw strengths (obtained at gauge length l1) and possible subsets of flaw strength data obtained at various gauge lengths smaller than the critical gauge length l1.
Jcs 06 00171 g013
Figure 14. Schematic p-quantile zp(ε) diagrams depicting the possible situations in Figure 13.
Jcs 06 00171 g014
Figure 15. Linear distribution ε(x) of flaw strengths along tow axis.
Jcs 06 00171 g015
Figure 16. Variation in mean strain value with segment length.
Jcs 06 00171 g016
Figure 17. Comparison of strains at maximum force measured on the Nicalon SiC tows and strain-to-failure measured on 2D Nicalon SiC/SiC specimens with various gauge lengths [53,54,62,63].
Jcs 06 00171 g017
Table 1. Number of filaments carrying load initially, estimated from the slope of initial linear part of force–strain curves. Note that Nt values are approximates that depend on the value of d. The important parameter is k0, which is commensurate with the number of fibers carrying load.
Gauge Length (mm)k0 (N/100)Ef (GPa)d (μm)Nt
4025018014812
8027018014877
115-130818014994
115-230518014985
115-328618014924
115-415018014485
Table 2. Values of mean (μ) and standard deviation (s) derived from the slope (1/s) and the intercept (μ/s) of the zp(εp) plots. R2 (zp) is the coefficient of determination that measures the global fit of Equation (6). Values of Weibull modulus (m) and scale factor (εl) derived from mean (μ) and standard deviation (s). R2 (Pn-PW) is the coefficient of correlation that measures the global fit of normal and Weibull distribution functions.
Tow/Number
of Filaments
Gauge Length (mm)1/sμ/sR2 (zp)s (%)μ (%)μεl (%)R2 (Pn-PW)
Tow 1115 3.704.160.9980.271.124.991.22
Tow 2115 4.124.770.9980.241.165.721.250.999
Tow 3115 4.074.840.990.241.195.811.28
500 filaments115 3.714.380.9960.271.185.261.28
40 5.195.750.9980.191.106.901.200.999
80 5.226.780.9980.191.308.141.380.95
Table 3. Values of extreme strain extracted from the empirical zp(εp) diagrams and related critical flaw sizes.
L0 (mm)4080115
εmin (%) 0.510.710.42
εmax (%) 1.691.891.90
acMAX (nm)10765571617
acMIN (nm)1239897
Table 4. Predictions from 115 mm quantile diagram: values of mean (μ) and standard deviation (s) derived from the slope (1/s) and the intercept (μ/s) of the predicted zp(εp) curves. R2 is the coefficient of determination that measures the global fit of Equation (6) to predictions. Also given are the statistical parameters of Weibull distribution function derived from μ and s.
L0 (mm)11540804 × 11510 × 11560 × 115
1/s4.223.023.736.097.5610.94
μ/s4.904.394.675.535.956.70
s0.240.330.280.160.130.09
μ1.161.451.250.910.790.61
m5.895.275.606.647.148.04
εl (%)1.251.581.350.970.840.65
R2 0.9960.9990.9970.9920.99
Publisher’s Note: MDPI stays neutral with regard to jurisdictional claims in published maps and institutional affiliations.

