Numerical Simulation of the Distribution of In Situ Cigarette Combustion-Generated Particulate Matter


1
School of Energy and Power Engineering, Dalian University of Technology, 2 Linggong Road, Ganjingzi District, Dalian 116024, China
2
School of Environmental and Materials Engineering, Shanghai Polytechnic University, 2360 Jinhai Road, Pudong District, Shanghai 201209, China
*
Author to whom correspondence should be addressed.
Colloids Interfaces 2020, 4(4), 59; https://0-doi-org.brum.beds.ac.uk/10.3390/colloids4040059
Submission received: 24 October 2020
/
Revised: 5 December 2020
/
Accepted: 7 December 2020
/
Published: 15 December 2020
(This article belongs to the Special Issue Locomotion of Colloidal Particles)
Abstract
:This paper has established a two-dimensional (2D) mathematical model for the generation, growth, and deposition of cigarette total particulate matter (TPM) in the smoldering state. The model has covered the chemical reactions and mass transfer as well as the mechanism of generation, flow, and condensation of particulate matter inside a burning cigarette. Cigarette smoke was generated by puffing under a constant pressure, and the pressure of the filter outlet was −274 Pa. The peak of the concentration of particulate matter was spatially overlapped with the peaks of pyrolysis and oxidation. Pertaining to the cross section of the cigarette at the same axial position, the peak of the diameter of particulate matter along the radial distribution first appeared in the zone near the edge of the cigarette cross section, and then gradually moved to the center of the cigarette with the cigarette smoke moving away from the combustion cone. The maximum number density of particulate matter calculated by the 2D mathematical model at the same axial position of the cigarette and the corresponding particle diameter, as well as the filtration efficiency of the filter rod, are in good accordance with the experimental data reported in previous studies.
1. Introduction
Cigarette smoke poses the risk of developing lung cancer since the carcinogenic compounds could be condensed onto particulate matter generated during the combustion process and then inhaled through the mainstream cigarette smoke side [1]. Therefore, research on the distribution of particulate matter in cigarette smoke has recently attracted great attention. In this regard, McAughey et al. presented a combined experimental set-up to determine the particle number, particle size distribution, and the concentration of each chemical component of the smoke particles generated under different conditions. In terms of the particle size distribution, the results demonstrated that particle diameter increased and particle number concentration decreased with increasing time for particle coagulation [2]. Luca et al. quantitatively assessed the excess life cancer risk (ELCR) of Italian smokers by establishing and solving a mathematical lung cancer model, and the contribution of each harmful component to lung cancer risk has been well discussed [3]. Brinkman et al. conducted the comparison of the true puff profile (TP) versus the mathematically derived smoothed puff profile (SM) [4]. The results indicated that the use of the TP and SM profiles had no obvious differences in mainstream smoke emissions. Eitzinger and Pirker established a three-dimensional model of cigarette combustion, and by modifying boundary parameter conditions, the temperature and pressure distribution in and around the cigarette under suction and static combustion conditions could be simulated [5]. Miljevic et al. investigated the use of a novel profluorescent nitroxide BPEAnit to detect reactive oxygen species (ROS) present in cigarette smoke. ROS were considered to be key factors underpinning the various adverse health effects associated with exposure to ambient particulate matter [6]. The results indicated that the amount of ROS in the case of mainstream cigarette smoke was higher than that of sidestream cigarette smoke. Robinson et al. developed a mathematical model of the tracheobronchial region to investigate the deposition of mainstream and sidestream cigarette smoke particles [7]. Random diffusion was not found to be significant for submicron particles, indicating that particles were instead transported to the airway wall by convective diffusion. The trends in both experimental and numerical results indicated that the Benzo(a)pyrene (BaP) in sidestream smoke deposits at a slightly higher efficiency than the total particulate matter, suggesting that carcinogen-specific deposition, rather than the total particulate matter, should be considered when investigating health effects. Nicula et al. utilized a scanning electron microscope to characterize the size distribution of particulate matter in both the emissions of car engines fueled by gasoline and cigarette smoke [8]. The results suggested the presence of the majority particles susceptible of being inhaled by breathing in both cigarette smoke and the emissions of car engines. The particles emitted by the car engines were significantly smaller than the particles in cigarette smoke. Chen et al. selected ten best-selling cigarettes to study the emission rates of particles generated from human smoking [9]. The results demonstrated that the emission rates of particles from Virginia-type cigarettes were higher than those from blended-type cigarettes. Moreover, the emission rates of particles from Chinese cigarettes were higher than those from Western cigarettes. Saidi et al. established a three-dimensional cigarette combustion model and considered the concentration distribution of CO, CO2, and O2. The calculated results of the model were in good agreement with the experimental data [10]. Currently, research is mainly focused on analyzing the collected cigarette smoke through experimental tools, such as analyzing the chemical composition, particle size, and pathogenic mechanism of the collected cigarette smoke, or focused on studying the influence of smokers on indoor environments and surrounding people. However, the research on the movement of these particles inside the cigarette through theoretical or numerical methods is still in a blank stage.
The distribution of particulate matter inside the cigarette is related to the flow field and temperature distribution within the cigarette. During the combustion process, the tobacco undergoes pyrolysis and oxidation reactions in the high temperature area, leading to the generation of particulate matter. The generated particulate matter inside the cigarette continues to condense and collide with each other as the mainstream smoke flows to the outlet of the filter. During the process of condensation and collision, the particulate matter continues to grow, followed by a decrease in the number of particulate matter. Furthermore, the generated particulate matter will be deposited on the tobacco and the filter rod, and the unfiltered particulate matter will enter the body of smokers through the outlet of the filter.
In this work, a two-dimensional transient combustion model was initiated, which would cover the heat and mass transfer process and the chemical reaction for the cigarette, to attain the temperature distribution at different times during the combustion process of the cigarette. Based on the temperature field, the generation, collision, and deposition processes of particulate matter would be modeled to simulate the spatial distribution of the size and number concentration of particulate matter inside a cigarette during the cigarette combustion process, and to simulate the total filtration efficiency of particulate matter by the filter rod.
2. Mathematical Model
2.1. Cigarette Combustion Model
In this study, the combustion model of Ali Rostami [11] was employed and the kinetic parameters of the cigarette combustion process came from previous studies [12]. The zones of the tobacco, cigarette paper, and filter were considered to be porous media. These zones may have different levels of permeability and porosity, as well as different physical and chemical properties. The combustion process was initiated by applying a high temperature flux at the front-end of a cigarette (i.e., the part of tobacco in contact with the air). The evaporation of water contained in the tobacco occurred at a high temperature and pyrolysis occurred in the virgin tobacco, followed by the oxidation of the carbonaceous residue, which resulted in the formation of particulate matter.
2.1.1. Water Evaporation Model
The evaporation of water contained in the tobacco followed the Arrhenius equation:
where ρw is the mass concentration of water in the tobacco and ρr0 is the initial mass concentration of water in the tobacco, which is 74 kg/m3, and Ts is solid surface temperature. Aw, Ew, and Nw are the pre-exponential factor, activation energy, and reaction order of the evaporation process, respectively.
2.1.2. Tobacco Pyrolysis Model
The pyrolysis reaction occurs first in the high temperature area. In the pyrolysis of tobacco, four pyrolysis precursors have the pyrolysis reaction, respectively. Each precursor is composed of volatile substances, such as cellulose, hemicellulose, lignin, and salts. Thus, the pyrolysis reaction could be expressed as:
where ρri is the mass concentration of the ith pyrolysis precursor, ρr is the total mass concentration of the pyrolysis precursors, and ρr0 is the initial mass concentration of the pyrolysis precursors, which is 596.8 kg/m3. Ari, Eri, and Nri are the pre-exponential factor, activation energy, and reaction order of the ith pyrolysis precursor, respectively.
2.1.3. Formation and Oxidation of Carbonaceous Residue
The mass change of carbonaceous residue is determined by two reactions: the pyrolysis of the tobacco and the oxidation of carbonaceous residue. It is assumed that two solid carbonaceous residues are produced in the pyrolysis of the tobacco:
in which ρci is the mass concentration of the ith carbonaceous residue, and ρc0 is the total mass concentration of the carbonaceous residues. Aci, Eci, and fci are the pre-exponential factor, activation energy, and mass fraction of the ith carbonaceous residue, respectively. The kinetic parameters of water evaporation, pyrolysis, and oxidation are listed in Table 1.
2.1.4. Mass Transfer Equation of the Gas Phase
Since this model includes a combustion reaction model, the concentration distribution of O2 needs to be solved. The diffusion coefficient of O2 in the gas phase is a temperature-dependent function:
where D0 is the reference value of the mass diffusivity in the porous media at 273 K and 1 atm. Its value is related to the void fraction of the media, which can be determined by:
where Dg is the unrestrained diffusion coefficient of the gas. For the O2 diffusion in nitrogen, Dg = 2 × 10⁻⁵ m2 s−1.
2.1.5. Gas Products of Oxidation
It is assumed that the carbonaceous residue is oxidized to produce CO and CO2: C + nO2 → n1CO + n2CO2. The molar ratio of CO and CO2 is as a function of temperature:
where Acc = 1.0 and Ecc = 0.2 kcal/mol.
2.1.6. Energy Equation of Porous Media
There is a significant temperature difference between the gas phase and the solid phase within porous media, and the temperature difference between these two phases could reach up to 100 K. Therefore, it is necessary to use two energy equations, one for the solid phase and one for the gas phase.
For solid:
For gas:
where Tg is the temperature of the gas, hg is the gas phase sensible enthalpy, ks,eff is the effective solid conductivity, hs–g is the gas-solid interface heat transfer coefficient, and A/V is the surface area to volume ratio of the tobacco. Ssolid and Sgas represent the source term of the energy equations for the solid phase and the gas phase, respectively. Sgas = 0, Ssolid and ks,eff could be calculated according to the following equation:
where ρ is the mass concentration of the reactant, ΔHi is the standard heat of the reaction for water evaporation, which is −2.2572 × 10³ KJ/Kg, and ΔHj is the heat of the combustion reaction, which is 1.757 × 10⁴ KJ/Kg. It is assumed that the heat of pyrolysis is small, which can be negligible.
2.1.7. Radiation Effects
The tobacco burns at temperatures above 1000 K, and the effect of radiative heat transfer cannot be neglected. The effect of radiation on the solid temperature equation can be modeled using the Rosseland approximation, whereby the solid thermal conductivity is augmented by a radiative conductivity [11]:
where dp is the pore diameter of 5.75 × 10⁻⁴ m [11], ε is the emissivity of the tobacco, which is 0.98, σ is the Stefan–Boltzmann constant, and ks is the thermal conductivity of the solid phase, which is 0.316 W/(mK).
2.1.8. Interface Heat Exchange
The surface area to volume ratio and the heat exchange coefficient of the porous media were calculated according to the model of Wakao et al. [13]. The convective heat exchange coefficient is:
The surface area to volume ratio is given by:
2.1.9. Porous Medium Flow Model
The tobacco rod is treated as a porous medium with a known permeability. In this simulation, the flow velocity was about 0.22 m/s, and the pore Reynolds number Rep ≪ 1. The resistance generated by the porous media model to the flow only needed to consider Darcy’s Law. This entails a momentum sink in the momentum equations given by:
where μ is the fluid viscosity, and K is the permeability of the porous medium. The medium is assumed to be isotropic.
2.1.10. Variation of Tobacco Permeability
The permeability of the tobacco changes as the tobacco burns. It is assumed that the permeability varies linearly with the mass concentration of the solid phase:
where Ku is the permeability of the unburned tobacco of 8.66 × 10⁻¹⁰ m2, Kb is the permeability of the burned tobacco of 1 × 10¹⁵ m2, g is an interpolation factor, ρs0 is the initial mass concentration of the unburned solid, and ρs is the mass concentration of all solids including pyrolysis precursors, water, carbonaceous residue, and ash.
2.1.11. Ash Formation Model
The formation of ash occurs during the combustion process of the carbonaceous residue, and the formation rate of ash can be directly derived from the reaction rate of the carbonaceous residue.
where nash is the coefficient for ash formation, which is 0.33.
2.2. Particle Dynamics Model
2.2.1. Particle Generation Model
Particles are generated in the process of pyrolysis and oxidation of the cigarette. In this article, it is assumed that the generated number of particulate matter increases linearly with the reaction progress, and the generated particles are spherical [14,15]:
where Spar is the generated number of particulate matter per unit time, npar is the generation coefficient of the particulate matter, and m is the mass of a single particulate matter given by:
where ρp is the density of particulate matter [14], taking 1180 kg/m3, and Dp0 is the initial diameter of particulate matter, taking 6.5 nm.
2.2.2. Particle Collision Model
The particles in the high temperature flow field condense together due to the constant collisions, and the sintering effect occurs as well. When the temperature is high, the sintering effect dominates, and the coalescence rate of the particles is significantly greater than the collision rate, and thus the spherical particles are formed. When the temperature is low or the particles are larger, the collision effect of the particles dominates and forms aggregates of the dendritic particles. The aggregation and condensation model of particles developed by Kruis [15] is used here:
where β is the collision frequency, n is the number of particles per unit volume, v is the volume of particles contained in a unit volume, a is the surface area of particles contained in a unit volume, and τ is the characteristic sintering time. Since the collected particles are all spherical particles, the sintering effect is dominant. Due to the complex composition of these particles, there is a lack of the relevant fitting formula at present. In this article, the characteristic sintering time is taken as a constant of 0.004 s. β could be obtained according to the following equation:
The particle diffusion coefficient D, particle velocity c, and conversion parameter g are calculated by the following formula, respectively:
where
where , Kb is the Boltzmann constant, λ is the distance between air molecules, and rc is the collision radius, a parameter to determine whether particles collide. For irregular particle aggregates, rc is given by:
where np is the number of primary particles in the aggregates, rp is the radius of the primary particles, and Df is the fractal dimension, which usually takes 1.8 for the dendritic particles [15].
2.2.3. Deposition Model
The particles generated by the combustion process at a high temperature will deposit on both the tobacco and the filter during the flow of cigarette smoke. The deposition of particles on the tobacco could be neglected. According to previous studies [16], the deposition on the filter rod could be described by the model:
where α is the volume fraction of solid phase, that is, α = 1 − ϕ, the filtration efficiency is the probability of each filter fiber capturing a single particle, and df is the diameter of the filter rod fiber, which is 2.51 × 10⁻⁵ m [16].
The main mechanisms of filtration are diffusion deposition, direct interception deposition, and inertial collision deposition. It is assumed that the diffusion deposition efficiency (ηD), the direct interception deposition efficiency (ηR), and the inertial collision deposition efficiency (ηI) are independent of each other. The total filtration efficiency (ηs) is a combination of these three mechanisms given by:
where Ku is the Kuwabara hydrodynamic factor: , and Pe is Peclet number: .
where G is the ratio of particle diameter to filter wire diameter: .
where ,
In the case of porous media, the particle control equation is applied and the above conditions are taken into account. For particle quantity density:
The surface area and volume of particles can also be calculated by a similar method, which is not given for the simplicity of the writing.
3. Simulation Example and Solving Process
The geometric dimension of the cigarette used in this work is 0.084 m in length and 0.008 m in diameter, with a filter tip of 0.025 m in length. According to the dimensions of the cigarette, a geometry was constructed with 0.084 and 0.004 m in the x- and y-axis directions, respectively. The boundary conditions were set accordingly: the outer surface of the cigarette paper and the front-end of the cigarette (i.e., the section of the tobacco in contact with the air) were set as the pressure inlet with a pressure of 0 Pa, and the filter outlet was set as the pressure outlet with a pressure of −274 Pa [11]. The tipping paper was set as an airtight wall, the wall shear condition was set to not slip, and the heat exchange was not considered (Figure 1).
The materials within the grid were set according to the physical and chemical properties of the tobacco, and the initial mass concentration of each substance was also set, such as the mass concentration of the initial tobacco, the mass concentration of the initial water in the tobacco, and the mass concentration of the initial pyrolysis precursor. The initial oxygen mass fraction was set to 0.23, and the initial mass fractions of CO, CO2, and water vapor in the cigarette smoke were all set to 0. The ignition process was started by adding a high temperature area to the front-end of the cigarette so that the heat generated by the cigarette could be sufficient to maintain the reaction.
UDF is a user-defined function. It is a program compiled by the user and can be customized for FLUENT software. The temperature distribution within the cigarette, the kinetic model, the spatial distribution, the particle size distribution of the generated particulate matter, the diffusion coefficient of the gas phase, and the mass diffusion would be all solved by UDF.
Under the given boundary conditions, the maximum air velocity within the cigarette was about 0.22 m/s, and all flow states were laminar. Meanwhile, the control equation was discretized by the finite volume method, the separation solver was used to solve it, and implicit format was used to linearize and solve the control equation. The first-order upwind style was used to discretize the terms in the equation. The SIMPLE algorithm was used for pressure–velocity coupling. The iteration time step was set to 0.001 s.
Equations (23)–(25) were rewritten into Eulerian form, the volume occupied by the particles was ignored, and it is assumed that there was no rate difference between the particles and the gas (since the diameter of the majority particles in the cigarette is less than 300 nm and the volume fraction is less than 10%, this assumption is acceptable). Then, the control equations for the particle number density, particle volume, and particle surface area per mass of gas were written into the following general format by user-defined scalar, which was convenient for FLUENT software to solve:
where ϕk and S are the particle parameter to be solved and the corresponding source term, respectively. Dp could be calculated by:
Dp = ρgD.
4. Results and Discussion
Figure 2 shows the temperature profiles of the tobacco area at different times (75, 150, 225, and 300 s). The temperature unit in Figure 2 is K. As shown in Figure 2, the combustion center was formed at 75 s, and the combustion center gradually travelled with a conical shape down the length of the cigarette. The combustion center had the maximum temperature and gradually decreased outwards. In each radial section, the maximum temperature point was on the central axis. The distribution of the high temperature area affected the particle formation characteristics, especially for particle size. The simulation results are in good agreement with the data in previous studies [17].
Since the cigarette combustion reaction was an approximately steady state after the initiation of the combustion process, the distribution of particulate matter inside the cigarette at all times showed a similar trend. The distribution of particulate matter inside the cigarette at 150 s is analyzed below.
Figure 3 shows the pyrolysis and oxidation rate distribution within the cigarette at 150 s. As depicted in Figure 3, oxidation was mainly concentrated at the front-end of the combustion cone, and the central zone of the combustion cone could not proceed due to lack of oxygen. Pyrolysis was concentrated in the zone where the temperature at the back-end of combustion cone was 600–750 K. Moreover, the pyrolysis rate was greater than that of oxidation because the activation energy of the pyrolysis precursor was less than that of carbonaceous, the mass concentration was significantly greater than that of carbonaceous (i.e., the generation coefficient of carbonaceous is 0.34), and the oxidation rate of carbonaceous was limited by the oxygen concentration.
Figure 4 illustrates the number density distribution of particulate matter inside the cigarette at 150 s. Since the generation of particulate matter was proportional to the rate of pyrolysis and oxidation, the concentration of particulate matter was higher in zones where pyrolysis and oxidation were more intense. After the particles were generated, they would collide with each other, bond, and merge constantly, and the number density decreased accordingly.
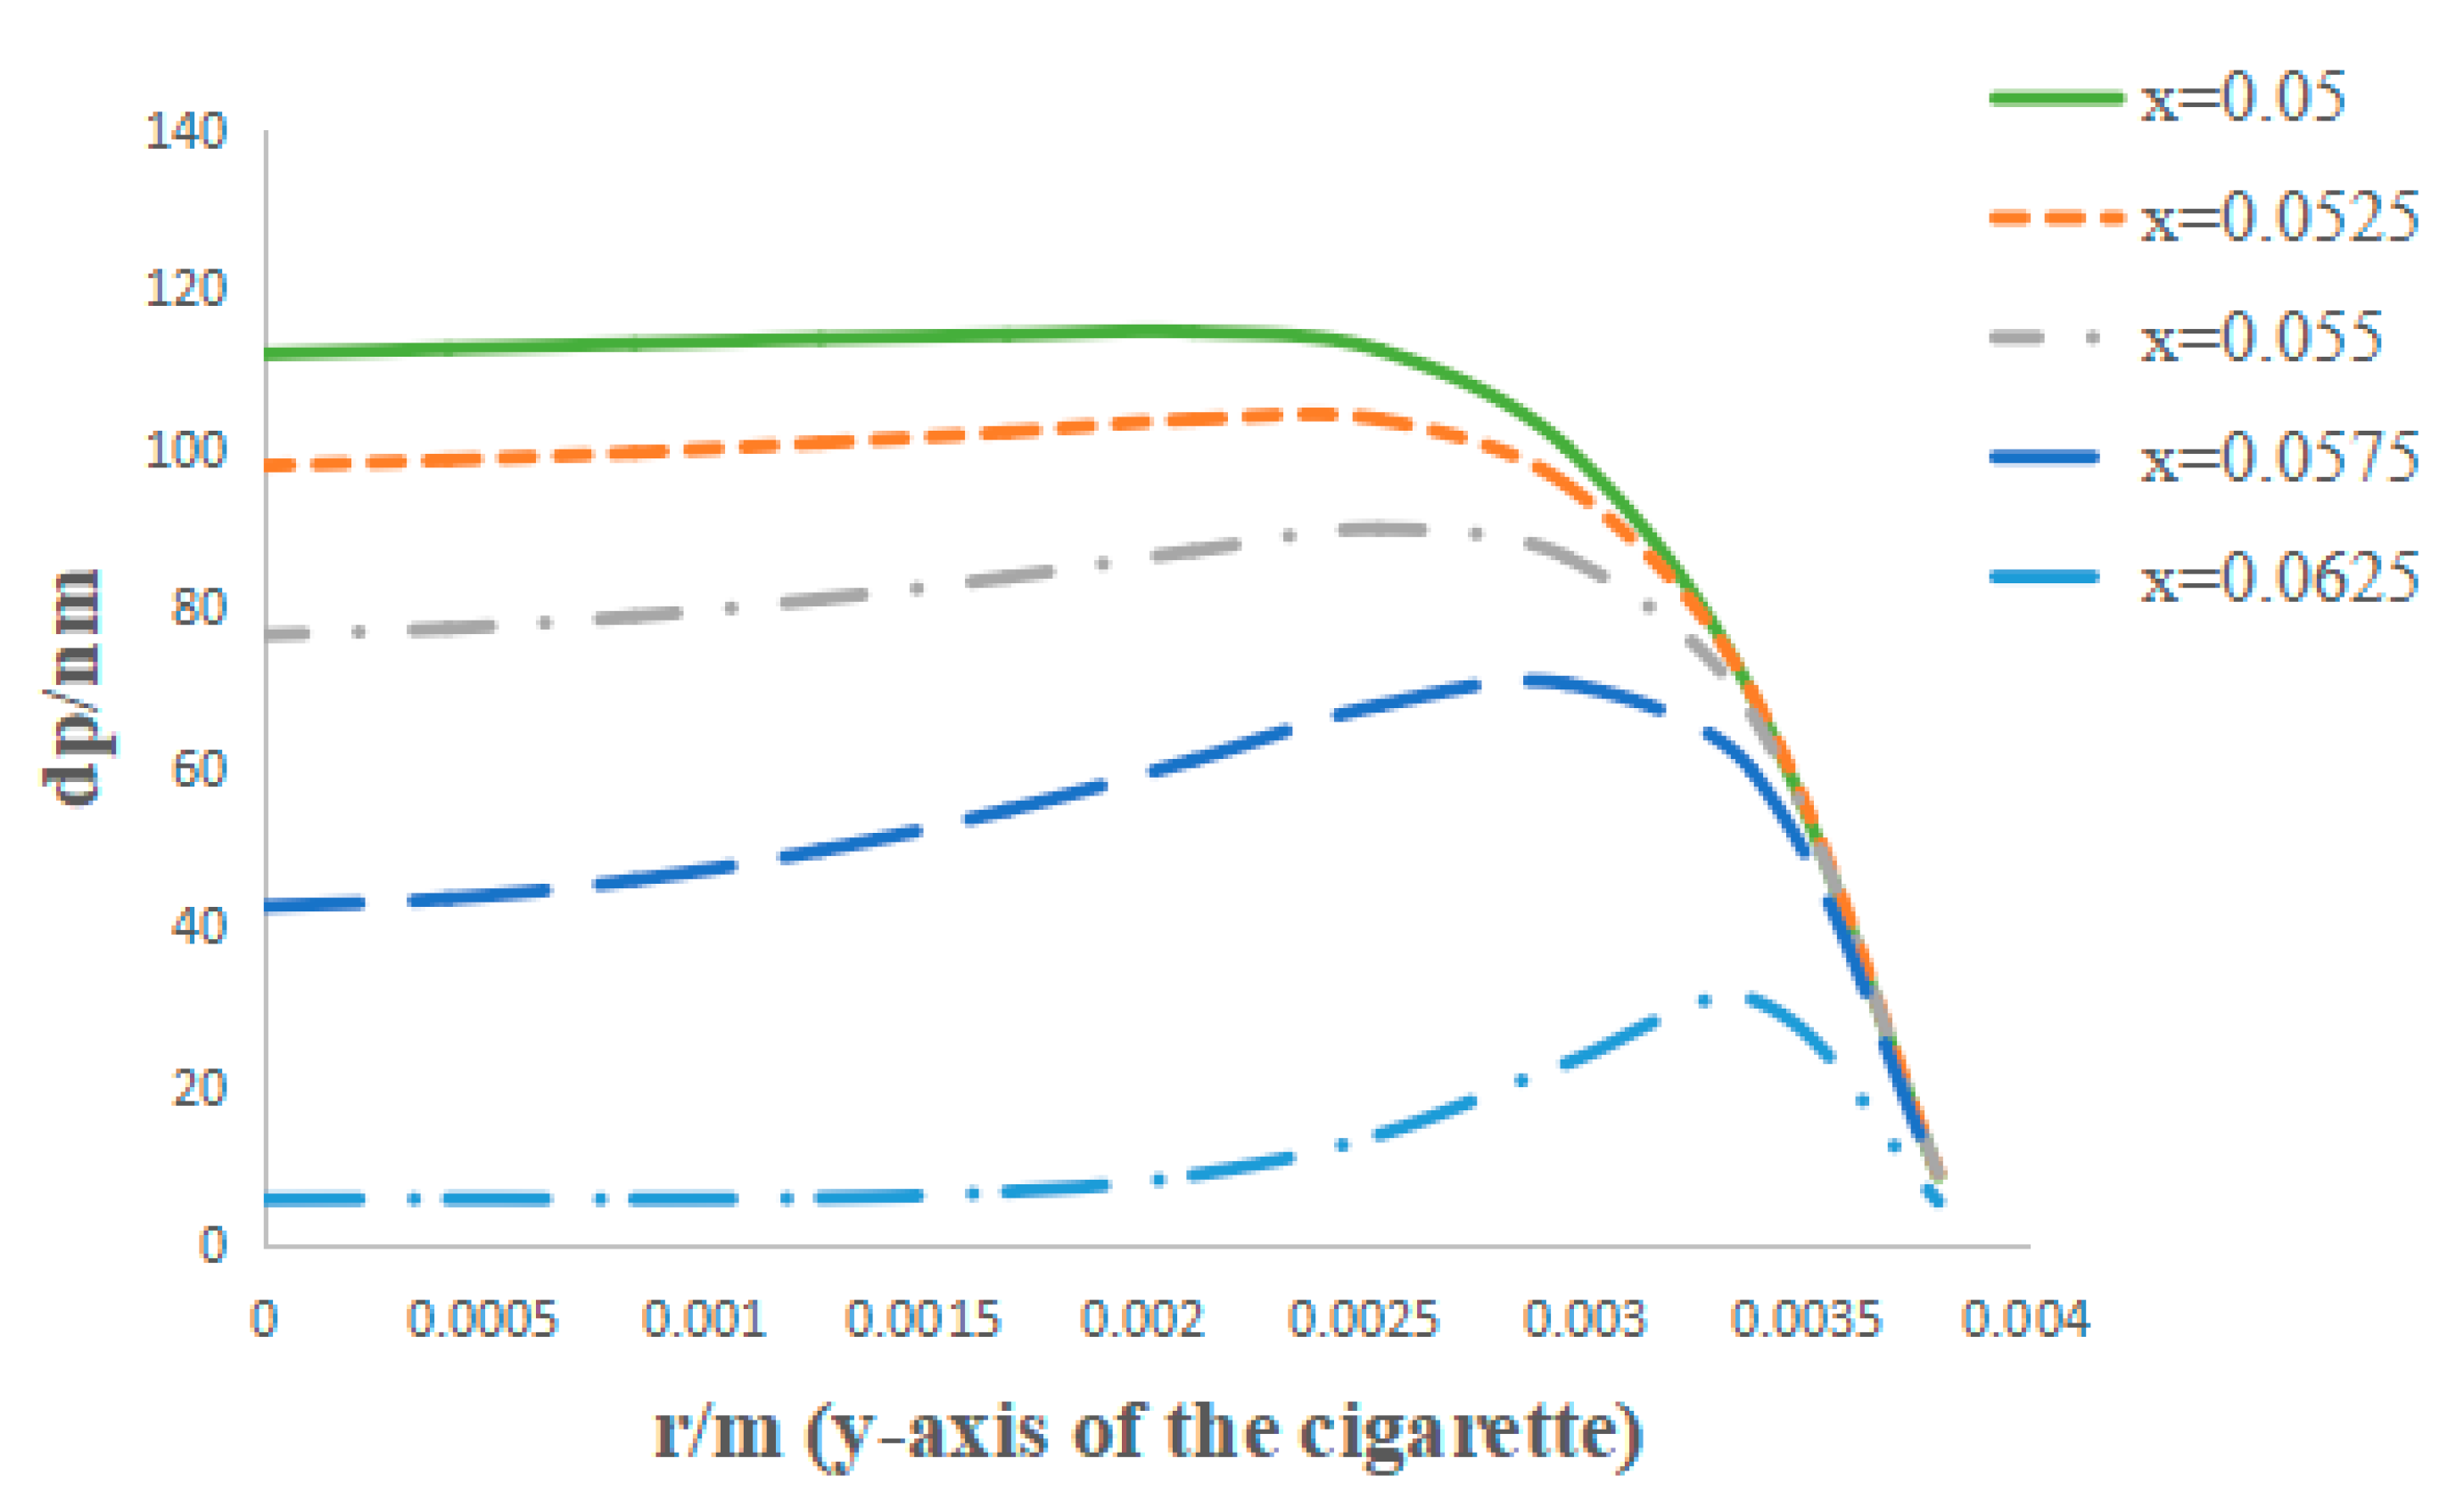
Figure 5 shows the particle size distribution of the primary particles along the radial direction at different axial positions at 150 s. As shown in Figure 4, the zone of intense pyrolysis and oxidation was close to the particle generation (i.e., the cross-section with the larger X value in Figure 5, or the downward curve), and as the radius of the cross-section increased from the central axis of the cigarette, the particle diameter first increased and then decreased. As it moved away from the combustion cone (the X value decreased), the peak of the particle size moved to the axis. This is because the generation zone near the axis of particulate matter was located relatively backward, but the number density of the particle was higher. In contrast, the generation zone in the outer zone away from the central axis of particulate matter was relatively forward, and the number density of the particle was slightly lower, but still maintained a large value (as seen in Figure 3 and Figure 4). When the analyzed cross-section was close to the generation zone of the particle, the movement time of the particle was relatively short in the zone near the central axis, the collision between these particles was less, the number density was maintained, and thus the particle size was smaller. In this process, the time that the particles dwelled in the cigarette smoke had a dominant effect on the particle size, whereas in the outer area near the edge, the movement time of the particle was relatively long, and there was more collision between these particles. The number density decreased more, and thereby the particle size was larger. In this case, the peak of the particle size distribution first appeared at the edge of the cigarette in the cross-section close to the generation zone of the particle. As the position of the cross-section moved back towards the filter, the movement time of the particle increased, the particle collision and coalescence increased, the number density decreased significantly, and the particle size further increased. Since the initial number density of the particles was the largest in the central area, there was more collision and coalescence of the particles to form larger particles. Hence, the peak of the particle size distribution gradually changed from the edge of the cigarette to the axis of the cigarette as the cross-section gradually moved away from the generation zone of the particles.
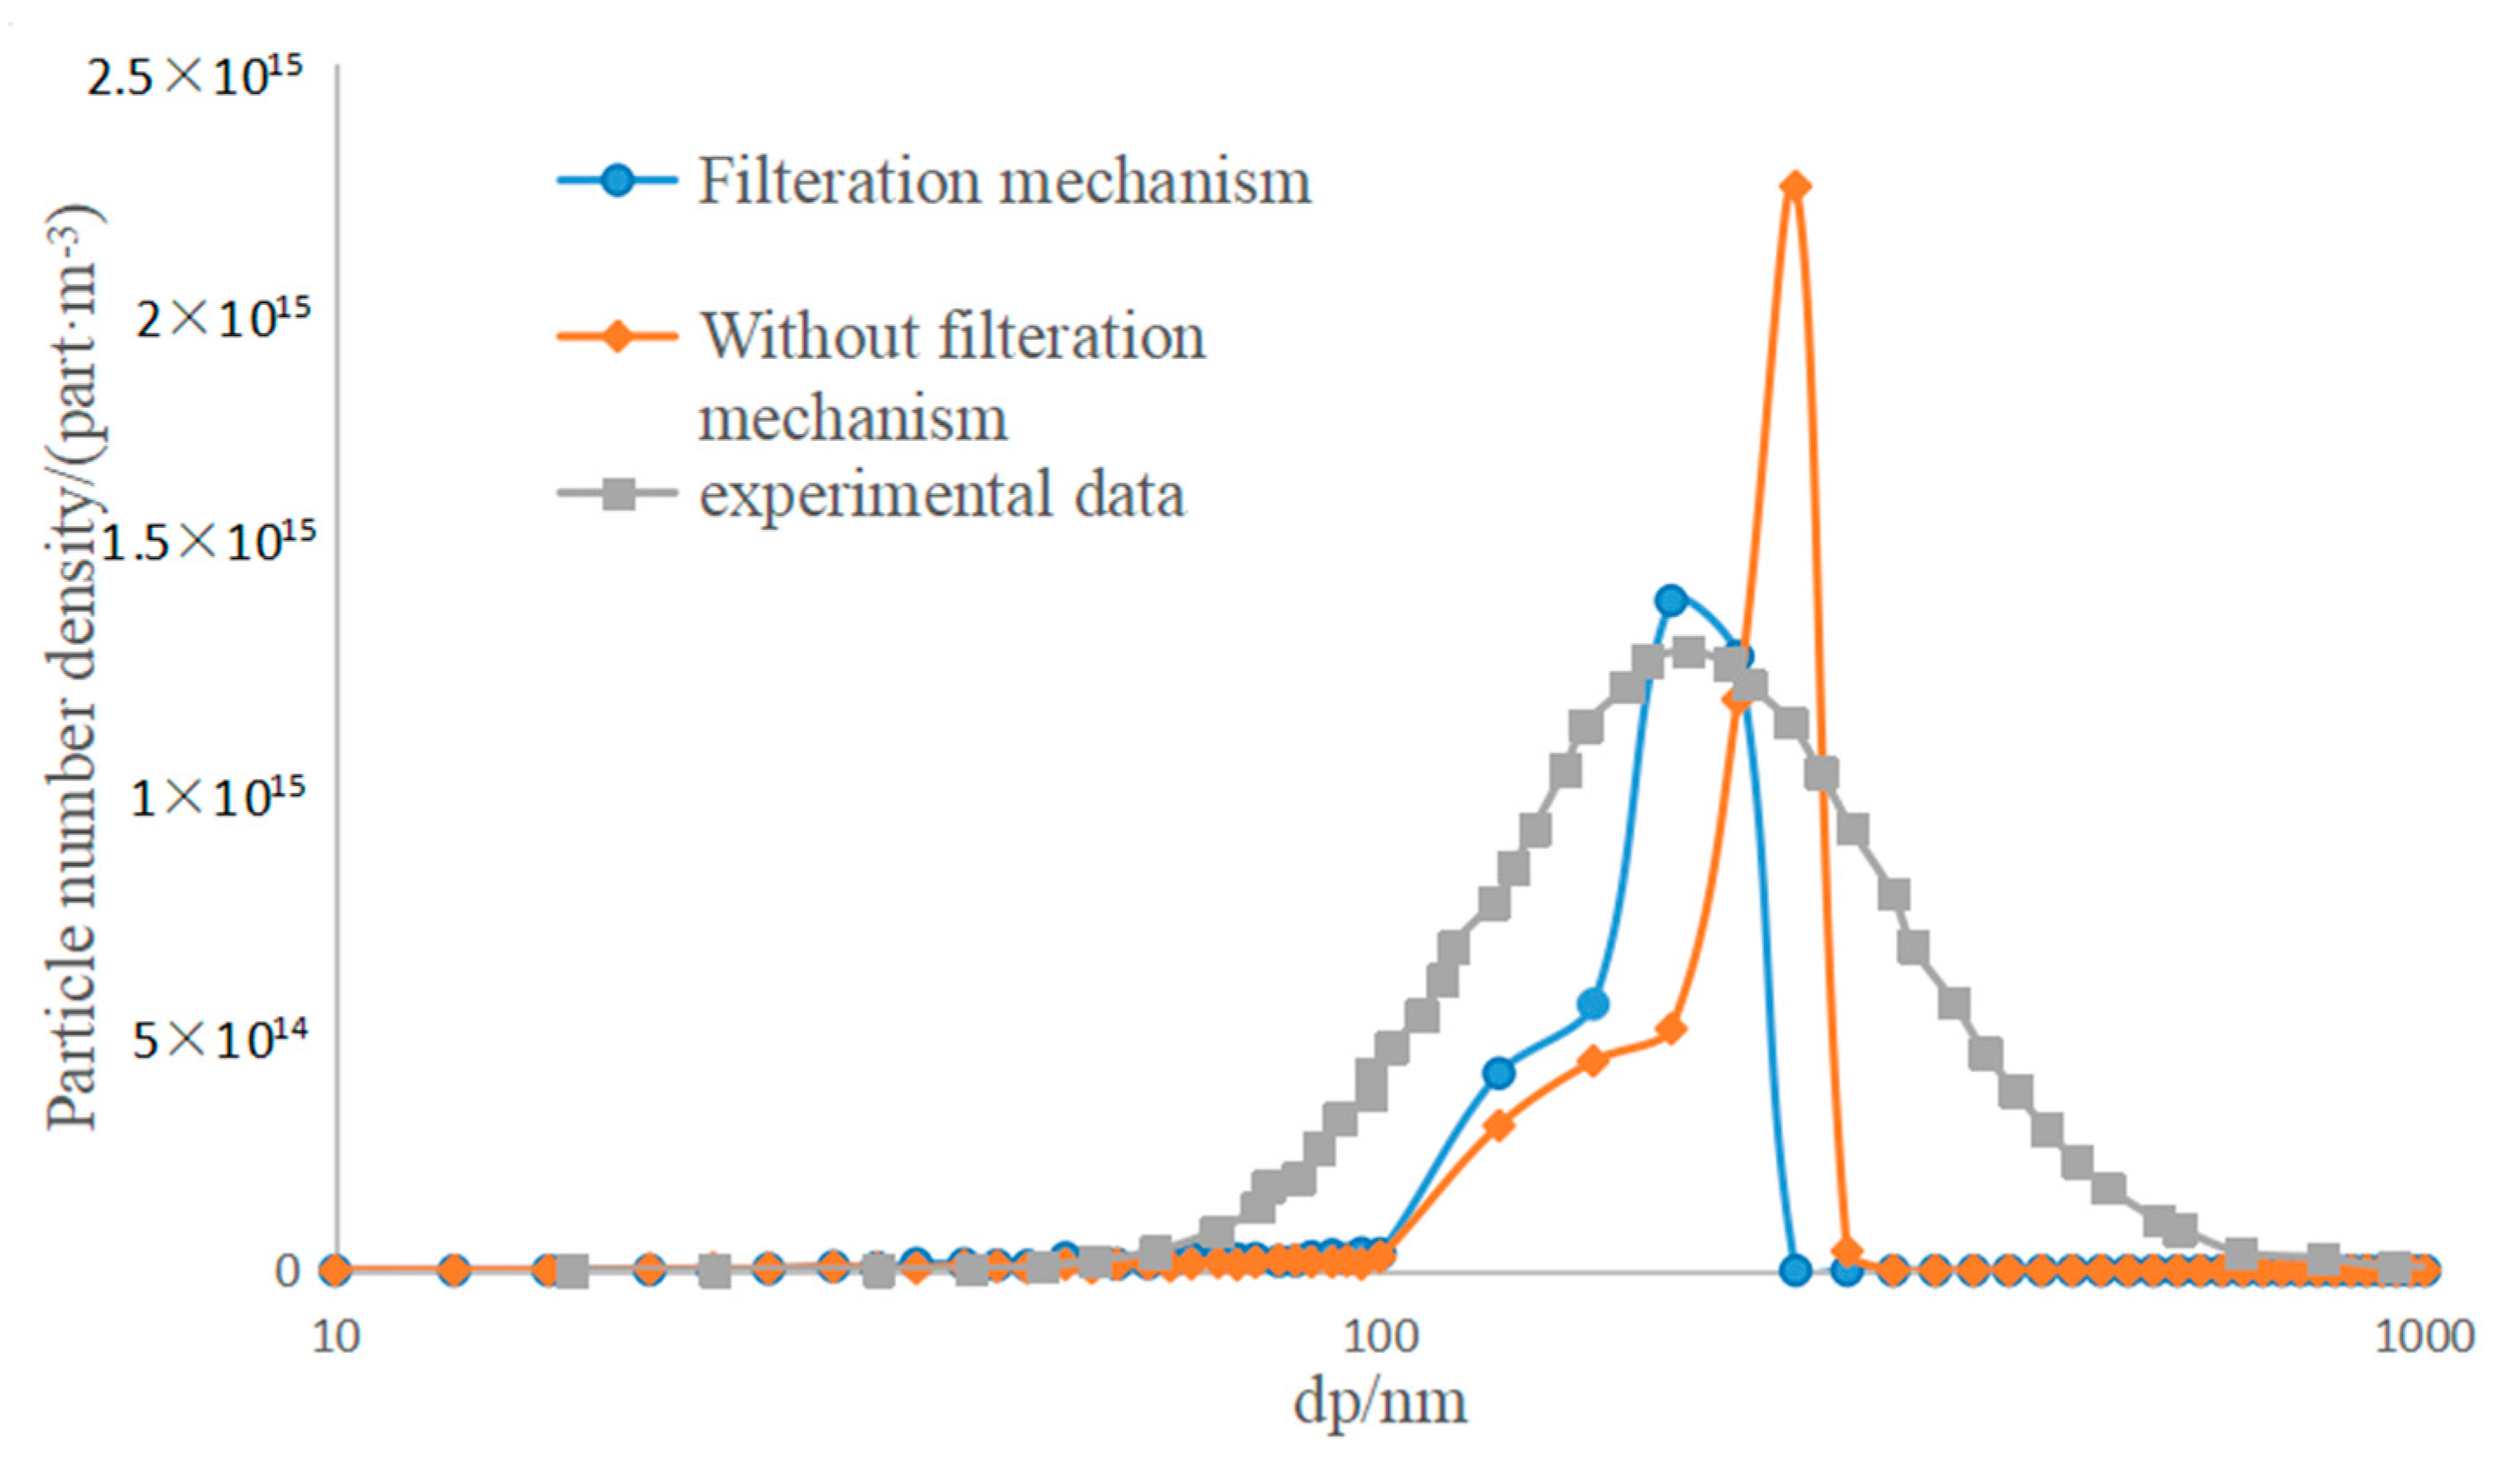
Figure 6 shows the particle size distribution during the entire cigarette combustion process. The results showed that the peak of the curve with the filtration mechanism of the filter rod was shifted to the left compared to the peak of the curve without the filtration mechanism. The number of particles was reduced by 18.43% while the total volume of particles was reduced by 54.22% (i.e., the total filtration efficiency). This is because the filters played a role. The collision between the filter fiber and the particles caused the particles to be deposited on the filter fiber. Meanwhile, the collision between the particles was weakened and the growth rate of the particles slowed down. Here, the obtained calculation result of the total filtration efficiency was in good accordance with the filtration result in previous studies [16,18]. The calculated particle size distribution was compared with the experimental results in the reference [3], as shown in Figure 6. The maximum particle number density calculated by the model and the corresponding particle diameter were consistent with the experimental results, but there was a certain deviation in the shape of the distribution. The count median diameter (CMD) of the particles was 173 nm, which was smaller than the experimental result (CMD = 228 nm) in previous studies [14]. The difference was mainly due to the puffing method by a constant pressure of the cigarette outlet used in the simulation example, which made the calculated average duration time within the cigarette less than the duration time of the ISO puffing method (i.e., a 35 mL puff of 2 s duration once every 58 s) used in the previous studies [3].
5. Conclusions
In summary, by using the Computational Fluid Dynamics (CFD) commercial software FLUENT and the related UDF of FLUENT, a detailed numerical simulation of the distribution of in-situ cigarette combustion-generated particulate matter was carried out, considering the effects of the particle dynamics model on the convection diffusion and collision. During the combustion process, the combustion cone moved backward (i.e., in the direction of the filter) at an approximately constant speed where pyrolysis was concentrated at the back-end of the combustion cone (i.e., the side direction of the filter), while oxidation was concentrated in the front-end of the combustion cone. The maximum particle size near the combustion cone appeared in the outer zone of the cross section of the cigarette. As the particles moved to the back-end of the cigarette, the maximum particle size away from the combustion cone was distributed on the axis of the cigarette, in which the particles were mainly concentrated in the area with a larger particle size. The results of the numerical simulation were in good accordance with the experimental data in previous studies.
Author Contributions
Conceptualization, S.C.; software, H.L.; methodology, H.X.; resources and data curation, S.C.; writing—Review and editing, S.C., Z.S. and H.L. All authors have read and agreed to the published version of the manuscript.
Funding
This research received no external funding.
Conflicts of Interest
The authors declare no conflict of interest.
References
- Valavanidis, A.; Vlachogianni, T.; Fiotakis, K. Pulmonary Oxidative Stress, Inflammation and Cancer: Respirable Particulate Matter, Fibrous Dusts and Ozone as Major Causes of Lung Carcinogenesis through Reactive Oxygen Species Mechanisms. Int. J. Environ. Res. Public Health 2013, 10, 3886–3907. [Google Scholar] [CrossRef]
- Mcaughey, J.; Adam, T.; Mcgrath, C. Simultaneous on-line size and chemical analysis of gas phase and particulate phase of cigarette mainstream smoke. J. Phys. Conf. Ser. 2009, 151, 012017. [Google Scholar] [CrossRef]
- Luca, S.; Giorgio, B.; Giorgio, F. Smokers’ lung cancer risk related to the cigarette-generated mainstream particles. J. Aerosol Sci. 2017, 107, 41–54. [Google Scholar]
- Marielle, C.; Brinkman, H.K.; Jane, C.C. Comparison of True and Smoothed Puff Profile Replication on Smoking Behavior and Mainstream Smoke Emissions. Chem. Res. Toxicol. 2015, 28, 182–190. [Google Scholar]
- Eitzinger, B.; Pirker, S. Numerical Simulation of a Cigarette during Smoking. Contrib. Tob. Res. 2005, 21, 403–416. [Google Scholar] [CrossRef] [Green Version]
- Miljevic, B. The application of profluorescent nitroxides to detect reactive oxygen species derived from combustion-generated particulate matter Cigarette smoke-a case study. Atmos. Environ. 2010, 44, 2224–2230. [Google Scholar] [CrossRef] [Green Version]
- Robinson, R.J.; Oldham, M.J.; Clinkenbeard, R.E. Experimental and Numerical Smoke Carcinogen Deposition in a Multi-Generation Human Replica Tracheobronchial Model. Ann. Biomed. Eng. 2006, 34, 373–383. [Google Scholar] [CrossRef] [PubMed]
- Niculaa, G.Z.; Lv, M. Aspects of particulate matter in cigarette smoke and car engines emission fueled by gasoline observed by scanning electron microscopy. J. Environ. Prot. Ecol. 2014, 15, 23–29. [Google Scholar]
- Chen, C.; Zhao, Y.; Zhao, B. Emission rates of ultrafine and fine particles generated from human smoking of Chinese cigarettes. Atmos. Environ. 2018, 194, 7–13. [Google Scholar] [CrossRef]
- Saidi, M.S.; Hajaligol, M.R.; Rasouli, F. Numerical simulation of a burning cigarette during puffing. J. Anal. Appl. Pyrolysis 2004, 72, 141–152. [Google Scholar] [CrossRef]
- Rostami, A.; Murthy, J.; Hajaligol, M.R. Modeling of a smoldering cigarette. J. Anal. Apply Pyrolysis 2003, 66, 281–301. [Google Scholar] [CrossRef]
- Yan, C.; Xie, W.; Li, Y.F. Numerical Simulation of Cigarette Smoldering. Manuf. Technol. 2014, 6, 15–20. [Google Scholar]
- Wakao, N.; Kaguei, S. Heat and Mass Transfer in Packed Beds; Gordon and Breach: New York, NY, USA, 1982. [Google Scholar]
- Tyler, J.J.; Jason, S.O.; Cabot, R.; Treacy, C.; Yurteri, C.U.; Dickens, C.; Symonds, J.P. Steady-state measurement of the effective particle density of cigarette smoke. J. Aerosol Sci. 2014, 74, 9–16. [Google Scholar]
- Kruis, F.E.; Kusters, K.A.; Pratsinis, S.E.A. Simple Model for the Evolution of the Characteristics of Aggregate Particles Undergoing Coagulation and Sintering. Aerosol Sci. Technol. 1993, 19, 514–526. [Google Scholar] [CrossRef] [Green Version]
- Du, W.; Wen, J.H.; Peng, B. An Improved Theoretical Model of Cigarette Smoke Filtration across Mono-Segment Cellulose Acetate Filters. Beitrge Zur Table 2015, 26, 232–240. [Google Scholar]
- Liu, M.C.; Li, B.; Yin, D.H. Temperature Data Pretreatment of Cigarette Static Burning by Parallel Displacement of Fermat Point. Manuf. Technol. 2012, 6, 20–23. [Google Scholar]
- Graves, B.M.; Johnson, T.J.; Nishida, R.T.; Dias, R.P.; Savareear, B.; Harynuk, J.J.; Kazemimanesh, M.; Olfert, J.S.; Boies, A.M. Comprehensive characterization of mainstream marijuana and tobacco smoke. Sci. Rep. 2020, 10, 7160. [Google Scholar] [CrossRef] [PubMed]
Figure 1.
Geometry of computational domain.

Figure 2.
Temperature field of the tobacco area at different times.

Figure 3.
Pyrolysis (a) and oxidation (b) rate distribution of the tobacco area.

Figure 4.
The number density distribution of particulate matter within the tobacco (×1018 part/m3).

Figure 5.
Radial distribution of particle diameters of different cross-sections within the cigarette at 150 s.
Figure 5.
Radial distribution of particle diameters of different cross-sections within the cigarette at 150 s.

Figure 6.
Frequency distribution of particulate matter.


Table 1.
Kinetic parameters of the water evaporation, pyrolysis, and oxidation reactions.
| Physical and Chemical Reactions | Constitutes | Reaction Order | Activation Energy (KJ·mol−1) | Pre-Exponential Factor (A/min−1) | Mass Fraction (%) |
|---|---|---|---|---|---|
| Water evaporation | Precursor 1 | 1.6 | 41.6 | 2.1 × 10⁶ | 100 |
| Pyrolysis | Precursor 2 | 1.6 | 77.2 | 4.3 × 10⁸ | 28 |
| Precursor 3 | 1.7 | 104.3 | 1.6 × 10¹⁰ | 33 | |
| Precursor 4 | 1.7 | 130.6 | 2.3 × 10¹¹ | 11 | |
| Precursor 5 | 1.4 | 50.4 | 1.5 × 10³ | 28 | |
| Oxidation | Species 1 | 1.5 | 160.0 | 1.9 × 10¹¹ | 55 |
| Species 2 | 1.5 | 350.2 | 5.2 × 1024 | 45 |
Publisher’s Note: MDPI stays neutral with regard to jurisdictional claims in published maps and institutional affiliations. |
© 2020 by the authors. Licensee MDPI, Basel, Switzerland. This article is an open access article distributed under the terms and conditions of the Creative Commons Attribution (CC BY) license (http://creativecommons.org/licenses/by/4.0/).
Share and Cite
MDPI and ACS Style
Chen, S.; Liu, H.; Sun, Z.; Xie, H. Numerical Simulation of the Distribution of In Situ Cigarette Combustion-Generated Particulate Matter. Colloids Interfaces 2020, 4, 59. https://0-doi-org.brum.beds.ac.uk/10.3390/colloids4040059
AMA Style
Chen S, Liu H, Sun Z, Xie H. Numerical Simulation of the Distribution of In Situ Cigarette Combustion-Generated Particulate Matter. Colloids and Interfaces. 2020; 4(4):59. https://0-doi-org.brum.beds.ac.uk/10.3390/colloids4040059
Chicago/Turabian StyleChen, Shi, Hanqing Liu, Zhiguo Sun, and Hongyong Xie. 2020. "Numerical Simulation of the Distribution of In Situ Cigarette Combustion-Generated Particulate Matter" Colloids and Interfaces 4, no. 4: 59. https://0-doi-org.brum.beds.ac.uk/10.3390/colloids4040059