Article

β-Lactoglobulin Adsorption Layers at the Water/Air Surface: 5. Adsorption Isotherm and Equation of State Revisited, Impact of pH

by
Georgi G. Gochev
1,2,*,
Volodymyr I. Kovalchuk
3,
Eugene V. Aksenenko
4,
Valentin B. Fainerman
5 and
Reinhard Miller
6
1
Jerzy Haber Institute of Catalysis and Surface Chemistry, Polish Academy of Sciences, 30239 Krakow, Poland
2
Institute of Physical Chemistry, Bulgarian Academy of Sciences, 1113 Sofia, Bulgaria
3
Institute of Biocolloid Chemistry, 03142 Kyiv (Kiev), Ukraine
4
Institute of Colloid Chemistry and Chemistry of Water, 03142 Kyiv (Kiev), Ukraine
5
SINTERFACE Technologies, 12489 Berlin, Germany
6
Department of Condensed Matter Physics, TU Darmstadt, 64289 Darmstadt, Germany
*
Author to whom correspondence should be addressed.
Colloids Interfaces 2021, 5(1), 14; https://0-doi-org.brum.beds.ac.uk/10.3390/colloids5010014
Submission received: 22 January 2021 / Revised: 24 February 2021 / Accepted: 1 March 2021 / Published: 5 March 2021

Abstract

:
The theoretical description of the adsorption of proteins at liquid/fluid interfaces suffers from the inapplicability of classical formalisms, which soundly calls for the development of more complicated adsorption models. A Frumkin-type thermodynamic 2-d solution model that accounts for nonidealities of interface enthalpy and entropy was proposed about two decades ago and has been continuously developed in the course of comparisons with experimental data. In a previous paper we investigated the adsorption of the globular protein β-lactoglobulin at the water/air interface and used such a model to analyze the experimental isotherms of the surface pressure, Π(c), and the frequency-, f-, dependent surface dilational viscoelasticity modulus, E(c)f, in a wide range of protein concentrations, c, and at pH 7. However, the best fit between theory and experiment proposed in that paper appeared incompatible with new data on the surface excess, Γ, obtained from direct measurements with neutron reflectometry. Therefore, in this work, the same model is simultaneously applied to a larger set of experimental dependences, e.g., Π(c), Γ(c), E(Π)f, etc., with E-values measured strictly in the linear viscoelasticity regime. Despite this ambitious complication, a best global fit was elaborated using a single set of parameter values, which well describes all experimental dependencies, thus corroborating the validity of the chosen thermodynamic model. Furthermore, we applied the model in the same manner to experimental results obtained at pH 3 and pH 5 in order to explain the well-pronounced effect of pH on the interfacial behavior of β-lactoglobulin. The results revealed that the propensity of β-lactoglobulin globules to unfold upon adsorption and stretch at the interface decreases in the order pH 3 > pH 7 > pH 5, i.e., with decreasing protein net charge. Finally, we discuss advantages and limitations in the current state of the model.

Graphical Abstract

1. Introduction

Colloid stability is a large field of physical chemistry that has been developing for centuries [1,2]. The great body of experimental data obtained with various methodologies has been continuously bringing insights into important phenomena that can explain the mechanisms of colloid stabilization. The major identification feature of colloids as dispersed systems is their large interfacial area. Hence, interfacial phenomena inevitably play a central role in the behavior of colloids, and the key step toward colloid stabilization is the decrease of the free energy of liquid interfaces by adsorption of amphiphilic species (commonly known as surfactants). The latter can be low-molecular-weight surfactants, macromolecules (polymers, proteins) as well as supramolecular assemblies (molecular aggregates, nanogels, nanoparticles, etc.).
Understanding the process of adsorption at liquid interfaces and, importantly, its theoretical description, has probably started with the introduction of the Gibbs fundamental adsorption equation, dγ ~ Γdlnc, which relates the surface tension, γ, and the surface excess, Γ, via the surfactant concentration, c, in the liquid bulk phase. Later, several approaches for obtaining the adsorption isotherm and the equation of state of interfacial layers have been developed, among which perhaps the most familiar are those of Langmuir and Frumkin. These models have also been further modified by specific theoretical considerations or/and toward taking account for physicochemical features of the adsorbing species and the solvent, for instance, the proper localization of the Gibbs dividing surface and assuming penetrable or nonpenetrable interfaces in the former case and, in the latter case, accounting for charge effects, molecular structure, solvent conditions, etc. Even for the “simpler” case of small surfactants, the accounts for the nonionic or ionic nature of the molecules, as well as for counterion co-adsorption, already required modifications of the classical models [3,4,5]. On the other hand, description of the adsorption of polymers with various molecular structures (random coil, block- or graft copolymer, etc.) requires reconsiderations of the available theoretical formalisms and even creation of new ones, e.g., based on self-consistent field theories, scaling concepts and other approaches [6,7,8].
Proteins can be regarded as a special case of macromolecules because of their complicated chemical composition (heteropolymeric chain), which gives rise to well-defined secondary (α-helix, β-sheet, etc.) and tertiary (folding) molecular structures. Hence, the process of adsorption of proteins at liquid interfaces can exhibit unique features. Early studies showed that the classical approach of Gibbs is inapplicable to protein systems [9,10,11]. The Langmuir adsorption isotherm (or the Langmuir–Szyszkowski surface tension equation) also appears inadequate to describe protein adsorption [12]; nevertheless, some modifications have been proposed [13]. While, in the latter study, Damodaran and Razumovsky [13] concluded that the relative affinities of globular proteins to the water/air interface increases with increasing the molecular weight, Mw, (in a Mw−2/3 manner), Ter-Minassian-Saraga [14] proposed the concept that the surface pressure, Π, of a protein monolayer is a function of the water activity at the surface. Joos [15] investigated spread layers of the globular protein β-lactoglobulin by treating the Π(θ) equation of state (θ is the fractional surface coverage) via the surface dilational modulus, E; he assumed a linear relation, E = uΠ, and claimed that the proportionality factor u is close to 8 for many proteins. In the same work, the author concluded that, at “low” Π, the protein globules are completely unfolded at the interface and the increase of Π leads to a decrease of the degree of unfolding. The concept of a Π-dependent degree of unfolding of globular proteins upon adsorption has been utilized also by Uraizee and Narsimhan [16], who proposed a lattice model for the treatment of the Π(Γ) equation of state. The model assumes a segmental molecular structure, as adsorbed segments are present only in the form of trains at the interface; it also accounts for segment–segment, segment–solvent and electrostatic interactions. In another statistical approach, Douillard et al. [17] described the equation of state for adsorption layers of the random coil protein β-casein by a simple relation: Π ≅ Γy, where the exponential factor y is characteristic of the regime of the interface and of the fractal dimension of the polypeptide chain. To our best knowledge, the applicability of this approach to globular proteins has not been affirmed so far.
The above considerations underline, on one hand, the conceptual difference between the interfacial behavior of low-molecular-weight surfactants and proteins and, on the other hand, the complexity of the problem of protein adsorption. However, in both cases, the heat of mixing at the interface, i.e., nonideality of enthalpy, is accounted for only in the classical Frumkin formalism [18] via an intermolecular interaction coefficient. Furthermore, it is obvious that the conformations of adsorbed proteins can be rather different from those in the bulk. Moreover, states of different molar areas can coexist, i.e., nonideality of entropy, that was considered by Joos and Serrien [19] and by Lucassen-Reynders [12].
In this paper, we focus on a thermodynamic model accounting for nonidealities of both enthalpy and entropy [20,21]. The basis of the model is the treatment of an interfacial protein layer as a 2-D solution, where the interfacial chemical composition is considered to be a mixture of the same components (solvent and solutes) as in the solution bulk and that the protein molecules can occupy a discreet spectrum of molar areas. We should stress here that previous theoretical treatments concern mostly the case of regimes at relatively low Π, which actually does not cover the whole range of experimentally measured surface pressures for protein adsorption layers. In the model considered here, such a “low” Π regime is defined as the precritical region in the surface pressure isotherm, Π(c), which is followed by a postcritical region, where θ and Π increase only slightly due to 2-D condensation (aggregation) of protein molecules adsorbed in a monolayer. At the same time, the surface excess, Γ, can significantly increase due to formation of additional layer(s) adjacent to the primary monolayer, a phenomenon experimentally observed, e.g., by ellipsometry and neutron reflectometry [22,23,24]. The two regions are divided by a critical surface pressure value, Π* (and a corresponding adsorption Γ*), achieved at a critical protein concentration, c* [20,21]. Aggregation in the postcritical region is accounted for by a dimensionless coefficient (ε = 0–0.1) that reflects the decrease of the area per protein molecule due to condensation [20]. Comparisons to experimental data for several proteins (β-casein, β-lactoglobulin, lysozyme, bovine and human serum albumins) showed quite satisfactory results [21,22,25,26] that credit adequacy to this approach. A refinement of the model for the postcritical region was introduced in [27], considering monomers and aggregates as independent kinetic units, and a semi-empirical linear relation between Π and Γ was proposed with a proportionality factor equal to the inverse aggregation number (see Equation (9), below). In this refined form, the model was compared to experimental data in several works [28,29,30,31,32,33]. We should mention here that, for the case of water/oil interfaces, the model was extended by the concept of a competitive adsorption of protein and oil molecules [34]. The general model was also extended to protein/surfactant mixtures [30,35]. In combination with surface dilational rheology theories [25,36], the model was successfully used to describe various dependencies of the surface dilational modulus E for proteins [25,27,28,29,30,31,32,36,37,38] and protein/surfactant mixtures [25,30,35].
The considered model is complicated, due to the number of model parameters. The state-of-the-art version (without accounting for co-adsorption in water/oil systems) used in the present work operates with eight free adjustable parameters for the description of a protein monolayer. To account for the formation of a secondary layer, an adsorption constant was additionally introduced; and finally, the protein diffusion coefficient is required for comparison with the available surface rheology data. Hence, to minimize speculations, fitting the model to experimental data should be done very carefully. One possibility is to constrain some parameters by a single value or to allow variation of the values only within a physically meaningful narrow range. A farther option is to apply the model simultaneously to as much experimental data as possible, ideally to the concentration dependencies of the key adsorption and rheologal parameters, i.e., Π(c), Γ(c) and E(c), which give access to the equation of state in terms of Π(Γ) and E(Π), and to other important dependencies. So far, the model was exclusively applied to experimental surface pressure isotherms, Π(c), and, only in some cases, experimental data on the surface dilational modulus, E [27,28,29,30,31,32,38] were considered. Only rarely, experimental data on both Π(c) and Γ(c) isotherms were simultaneously compared with the theory [22,26,39].
In the paper of Lucassen-Reynders, Fainerman and Miller [36], the model was applied for a detailed analysis of the dilational rheology behavior of protein layers, and an important advancement was achieved: it was demonstrated that the Gibbs (high-frequency limiting) elasticity of protein layers, where the protein molecules can exists in different conformational states, i.e., different partial molar areas, ωi, is lower than the elasticity of a layer with uniform molar area, ω, by a factor of (1 + dlnω/dlnΓ). Actually, the latter study appears to be the only one where the model was compared to experimental data (for β-casein and bovine serum albumin) on the surface equation of state for both dependencies of Π(Γ) and E(Π). In the present work, we have the same aim, in order to theoretically describe the interfacial behavior of β-lactoglobulin (BLG) adsorption layers. Furthermore, we shall apply this approach, firstly, to reconsider our previous results on BLG adsorption layers at pH 7 [28] and, secondly, to analyze in this manner new experimental data obtained for BLG solutions at pH 3 and pH 5. The results are expected to well complement previous findings on the unique effect of pH on the properties of BLG adsorption layers at the water/air interface and on corresponding foam films and foams [24,40,41,42,43,44,45].

2. Materials and Methods

2.1. Chemicals and Solutions

Native β-lactoglobulin (molecular weight Mw ≈ 18.3 kg/mol) has been isolated and purified from whey protein isolate and supplied by the group of U. Kulozik at TU Munich, Germany [46]. The used sample contained total protein of ≈98.9% (of which BLG content >99%, BLG-A/BLG-B ≈ 1.22), salts of ≈0.7% and traces of lactose (<0.05%). Measurements were performed with solutions at pH 3, 5 and 7. While pH 5 is very close to the isoelectric point of BLG (pI ≈ 5.1 [40]), and the BLG net charge is negligible, the net charge at pH 7 is negative, and, at pH 3, it is positive. Aqueous stock solutions were prepared in 10 mM Na2HPO4/citric acid/Milli-Q buffers at pH 3 or pH 7 and at a BLG concentration of c = 2 × 10⁻⁴ M (≈3.65 mg/mL or ≈0.365 wt. %). To eliminate low-molecular-weight surface active contaminations, the initial stock solutions were further purified with activated charcoal (BLG/charcoal mass ratio 1/3, stirred for 20 min) [47] and then filtered through a 0.45 µm pore size protein nonbinding filter. The stock solutions at pH 3 or pH 7 were stored in a fridge for maximum 5 days, and the desired dilutions were freshly prepared before measurements. In the case of pH 5, all studied solutions were freshly prepared from a stock solution with pH 7 by dilution with 10 mM buffer of an appropriate pH to ensure a final value of pH 5. Solutions at pH 5 with concentration c > 10−5 M were not investigated, since they heavily precipitate during the measurements. All experiments were performed at room temperature of 22–23 °C.

2.2. Experimental Methods: Tensiometry and Surface Dilational Rheometry

Adsorption dynamics and dilational rheology experiments were performed using the drop/bubble Profile Analysis Tensiometer PAT-1 (SINTERFACE, Germany) [48] in the mode of a buoyant bubble in protein solution. The dynamic surface pressure, Π(t) = γ0γ(t) (γ0 = 72.3 ± 0.2 mN/m for the pure buffer/air interface, and γ(t) is the measured surface tension at the time moment t), was measured up to t = 80,000 s (≈22.2 h). The Π-values were then used to plot the surface pressure isotherms, Π(c). The surface dilational complex viscoelasticity modulus, E, and the phase angle, φ, were evaluated by the software integrated in the instrument through a Fourier transform of the surface tension response to harmonic area oscillations [48]. From these data, the corresponding real E’ and imaginary E” parts of the complex modulus were obtained. The dilational rheology data presented in this paper were measured at an oscillation frequency of f = 0.1 Hz and an amplitude of oscillations of gΔA/A0 × 100 = 2.7 ± 0.3%, where ΔA [mm2] is the amplitude of change of the undisturbed bubble area A0 = 20 or 25 mm2. In the following, we do not present the results for E’ and E”, since the values for E’ are very close to those for E, and the values for E” are much lower (with an order of magnitude) than those for E, which is typical for globular proteins [28,44,49,50,51]. The reported values for the experimental data for Π and E were averaged from 2–3 measurements, and the corresponding standard deviation is presented as error bars in the following figures (where applicable).
The used oscillating amplitude g ≈ 2.7% belongs to the linear viscoelasticity regime for BLG adsorption layers at the water/air interface at bulk pH 7 as found from measurements of the E(g)f dependency [32]. In the present work we performed such measurements for all studied pH values and at different surface pressures. The obtained data in terms of E,φ,E”(g)f dependencies (f = 0.1 Hz) are presented in Figure S1 in the Supporting Information.
Experimental data for the surface excess, Γ, and the molar area, ω, used in the present study were reported in a previous paper as evaluated from neutron reflectometry experiments with equivalent solution formulations [24], and the experimental data were gathered from single measurements for each sample.

2.3. Theoretical Model

The model assumes a discrete spectrum of n adsorbed states (1 ≤ jn) for a protein molecule, where the average molar area ω is distributed in the range between the boundary values: ω1, which corresponds to state “1” with a minimum area, and ωn, which corresponds to the nth state with a maximum area. At an intermediate state j, the partial molar area is ωj = ω1 + (j − 1)ω0, where ω0 is an area increment taken to be in the order of the area per adsorbed water molecule. The average molar area, ω, is determined via the total coverage, θ, the partial adsorption in jth state, Γj, and the total adsorption, Γ:
θ = ω Γ = j = 1 n ω j Γ j ,   Γ = i = 1 n Γ j .
The adsorption isotherm equation for each jth adsorbed state reads:
b j c = ω Γ j ( 1 θ ) ω j / ω e x p [ 2 a   ω j ω θ ]   ,
where bj is the adsorption equilibrium constant for the protein molecules in the jth state, and a is a Frumkin-type interaction parameter (a > 0 means intermolecular attraction), which accounts for the enthalpic nonideality. It was proposed earlier that the surface activity of adsorbed proteins increases with increasing the partial molar area, ωj, according to a power law with a constant exponent, α, [20,21].
b j = ( ω j / ω 1 ) α b 1 .
Setting α > 0 means that the adsorption of molecules in states with larger molar areas is favored [27,28]. Then, combining Equations (2) and (3), one obtains:
b 1 c = ω Γ j ( ω j /   ω 1 ) α ( 1 θ ) ω j / ω e x p [ 2 a   ω j ω θ ]   .
Note b1 in the left-hand side is the adsorption equilibrium constant for the protein molecules in the state “1.” Then, equating the right-hand sides of Equation (2) with j = 1 and Equation (3), it is straightforward to express the adsorption in any jth state via the adsorption in the state “1” and to eliminate all bj except b1, which, in what follows, is denoted by b:
Γ j = Γ 1 ( ω j ω 1 ) α e x p { ω j ω 1 ω [ ln ( 1 θ ) + 2 a θ ] } .
Combining Equations (1) and (5) allows for eliminating the total adsorption, Γ, and the partial adsorptions, Γj, and obtaining an expression, which interrelates the model variables θ and ω via the model parameters ωj:
ω = j = 1 n ω j ( ω j ω 1 ) α e x p { ω j ω 1 ω [ ln ( 1 θ ) + 2 a θ ] } j = 1 n ( ω j ω 1 ) α e x p { ω j ω 1 ω [ ln ( 1 θ ) + 2 a θ ] } .
In a similar way, using Equations (1) and (5), one transforms the adsorption isotherm Equation (2) to an expression that relates the model variables θ and ω with the protein concentration c:
ω = j = 1 n ω j ( ω j ω 1 ) α e x p { ω j ω 1 ω [ ln ( 1 θ ) + 2 a θ ] } j = 1 n ( ω j ω 1 ) α e x p { ω j ω 1 ω [ ln ( 1 θ ) + 2 a θ ] } .
For relatively low protein concentrations (precritical region), the equation of state reads:
Π ω 0 R T = ln ( 1 θ ) + θ ( 1 ω 0 ω ) + a θ 2 ,
where the first term on the right-hand side is relevant to the contribution of the ideal entropy, while the second and the third terms account for the nonideal entropy and enthalpy, respectively [20,21].
With Equations (1)–(8), a protein monolayer can be described by adjusting values for the six model parameters: a, α, bj, ω0, ω1 and ωn. A kink point, Π*, in the Π(c) isotherm is observed, corresponding to the critical bulk (c*) and surface (Γ*) protein concentrations, which divide the isotherms into a precritical region (Π < Π*, Γ < Γ*) and a postcritical region (Π > Π*, Γ > Γ*); the superscript “*” denotes the critical values of the different quantities. The precritical region, defined by Equation (8), is characterized by a steep increase of Π with increasing c, while, in the postcritical region, Π usually increases only slightly. Such behavior of the layer in the postcritical region is attributed to a 2-D condensation (surface aggregation), a compression of the layer [20,21,52] and the formation of a multilayer structure [20,21,53,54]. The protein molecules and aggregates are considered as independent kinetic units, and it is approximated that the increase of Π is proportional to the increase in Γ with a factor equal to the inverse value of the aggregation number, na, [27]:
Π = Π * ( 1 + 1 n a Γ Γ * Γ * ) ,
where Γ(c) is computed via Equations (1), (5)–(7). Hence, two more parameters, Π* and na, should be included in the model calculations for the description of the primary protein monolayer in the postcritical region.
So far, Equations (1)–(9) describe the adsorption and the surface pressure isotherms as well as the surface equation of state for a protein monolayer within a 2-d solution model. Further accumulation of material onto the saturated monolayer gives rise to the formation of an adjacent protein layer; hence, the global interfacial structure tends to become heterogeneous. The secondary layer can be considered as adsorbed onto the primary monolayer and can be described by a Langmuir-type isotherm with the adsorption equilibrium constant, b2. A previously derived approximation for the total adsorption, ΓΣ, reads [20,55]:
Γ Σ ( c ) = Γ ( c ) ( 1 + b 2 c 1 + b 2 c ) ,
and hence, for a bilayer, ΓΣ instead of Γ should be used in Equation (9).
The surface dilational modulus E reads:
E = d Π d ( ln A ) ,
where A is the surface area. Assuming harmonic surface area oscillations, the frequency-dependent dilational modulus can be expressed as a complex number [56]:
E ( ϖ ) = | E | e i ϕ = E + i E ,
where ϖ = 2 π f is the angular frequency (f is the frequency in [Hz]); E | E | cos ϕ is the real part accounting for the elastic contribution (conservation of energy) and E | E | sin ϕ is the imaginary part accounting for the viscous contribution (dissipation of energy). For a diffusion-controlled exchange of matter mechanism, the modulus E of surfactant and protein adsorption layers has been derived by Lucassen and van der Tempel [57,58] for a planar surface in oscillating barrier experiments. Joos [59] derived expressions for the case of a finite curvature of a drop or a bubble surface. For the particular case of diffusion from a reservoir onto the surface of a bubble, the modulus E reads [59,60]:
E ( ϖ ) = E 0 1 + d c d Γ D i ϖ r ( 1 + r i ϖ D ) ,
where E0 is the Gibbs elasticity, i.e., the high-frequency limiting elasticity under ideal elastic conditions; D is the diffusion coefficient of protein molecules in the bulk and r is the radius of the bubble. The limiting elasticity can be computed from the equation of state, Equation (8), taking into account the respective dependence ω(Γ) and assuming ω0 << ω (which holds for proteins) [36]:
E 0 = [ d Π d ( ln Γ ) ] eq = R T ω 0 ( θ 1 θ θ 2 a θ 2 ) [ 1 + d ( ln ω ) d ( ln Γ ) ] .
Note that such expression is valid for a protein adsorption layer in the precritical region, while, for the postcritical region, the protein layer should be considered as a composite surface [61] with a limiting elasticity [21,27]:
E 0 = E 0 * ( Γ Σ / Γ ) .
In some cases, it is convenient to introduce the reduced modulus, E/E0 (0 < E/E0 ≤ 1), which can be used as a measure for deviations from an ideal elastic behavior (E/E0 = 1).

3. Results and Discussion

As mentioned in the introduction, one of the purposes of the present work is to reconsider our previous theoretical results obtained from comparison with experimental data for BLG adsorption layers at pH 7 [28] by taking into account new Γ(c) experimental data [24] and updated values of the dilational modulus, E, as measured in the linear viscoelasticity regime. In [28], the reported experimental E-data were measured at oscillation amplitudes (strains) of g ≈ 7%, which now appear to belong to the nonlinear viscoelasticity regime. Below a certain transition amplitude gtr (yield strain), E is independent of g < gtr, but beyond this threshold, E monotonically decreases with the increase of g > gtr. For BLG, gtr ≈ 4% was reported for solutions at pH 7 [32], as measured at relatively high surface pressures (Π > 20 mN/m). However, our data revealed that, in all studied cases at different pH, gtr depends on the surface pressure, and it decreases with increasing Π (Figure S1 in the Supporting Information). Actually, Benjamins [62] reported earlier that the modulus E of interfacial layers of some globular proteins (bovine serum albumin and ovalbumin) do not depend on g (up to 15%) when E < 50 mN/m. We observed the same behavior for the studied BLG layers. For moduli E > 70 mN/m (that correspond to different surface pressures at different pH values, see the results below), gtr was found to be of about 3–4% (independent of pH), which is in excellent agreement with literature [32]. Hence, in the present work, the theoretical analysis is performed on experimental E-data obtained at strains below gtr, i.e., in the linear viscoelasticity regime.
The major purpose of this work is to examine the theoretical model as compared to several experimental dependencies of the surface pressure, Π, the surface excess, Γ, and the molar area, ω, as well as of the surface dilational modulus, E, and to compare the results for three different pH. We note, once again, that the Π- and E-data were measured by a single method (bubble shape analysis), while the Γ- and ω-data were obtained from independent neutron reflectometry experiments [24]. Hence, some of the dependencies presented further below were constructed with data from separate measurements. The model was simultaneously fitted to the following types of experimental data:
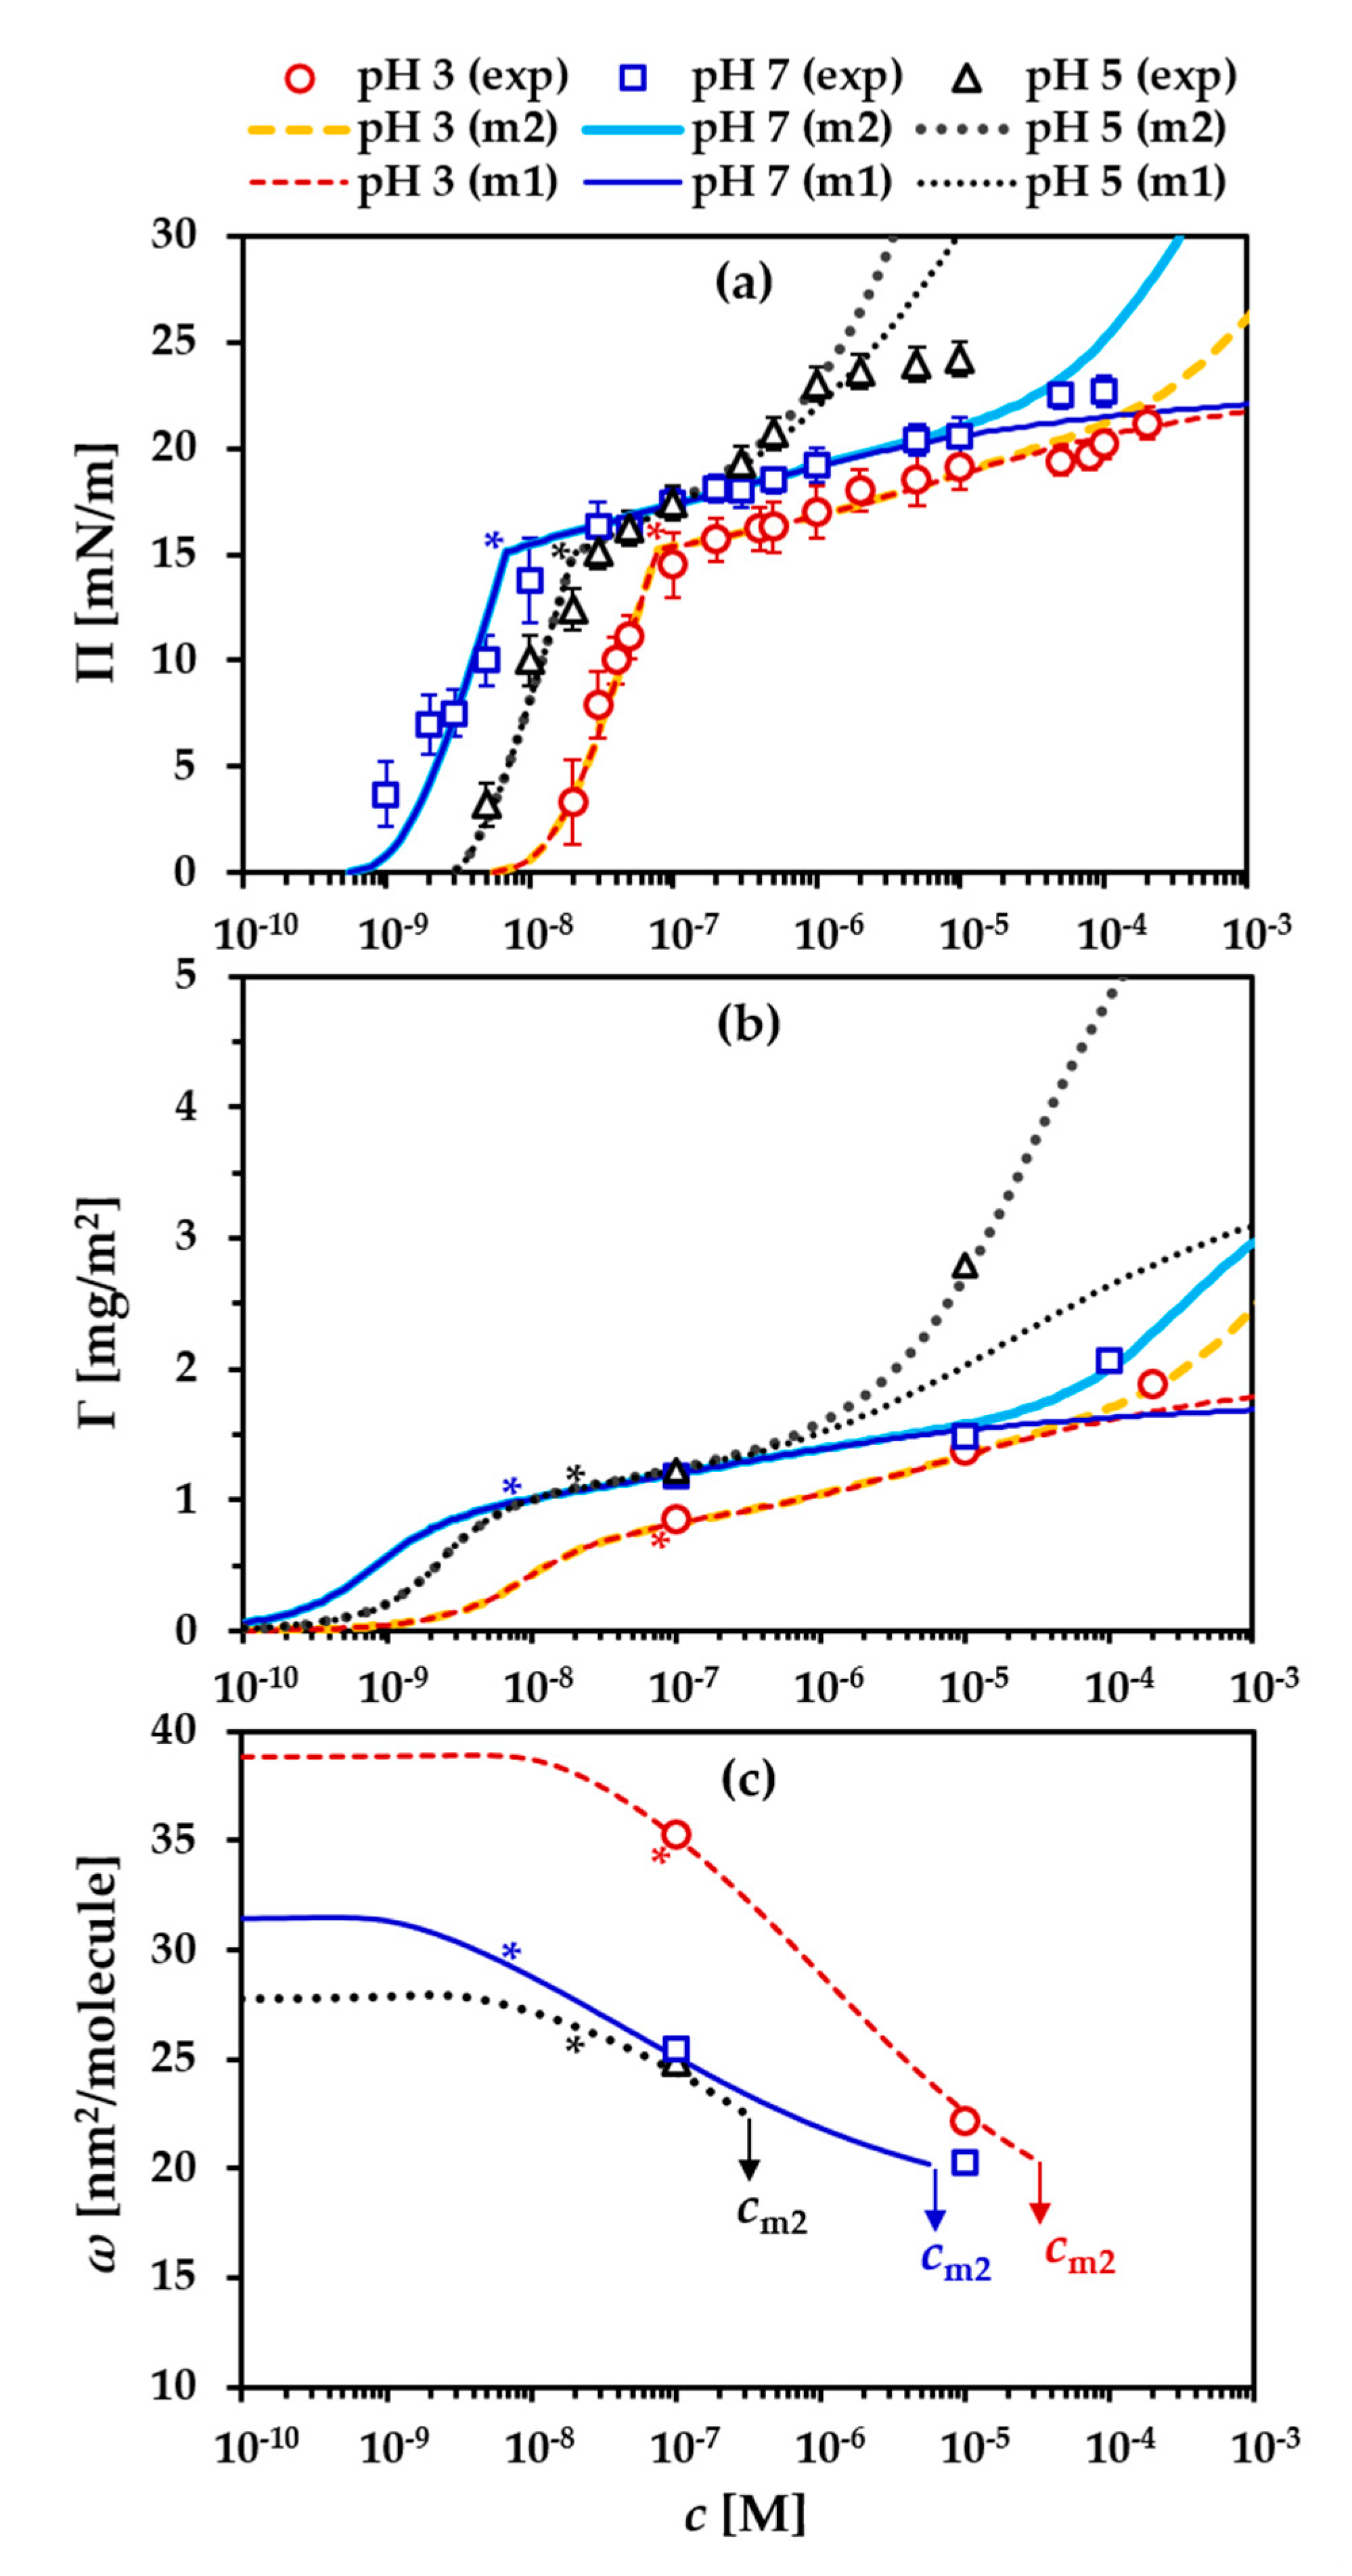
  • the surface pressure isotherm, Π(c);
  • the adsorption isotherm, Γ(c) [24]; and
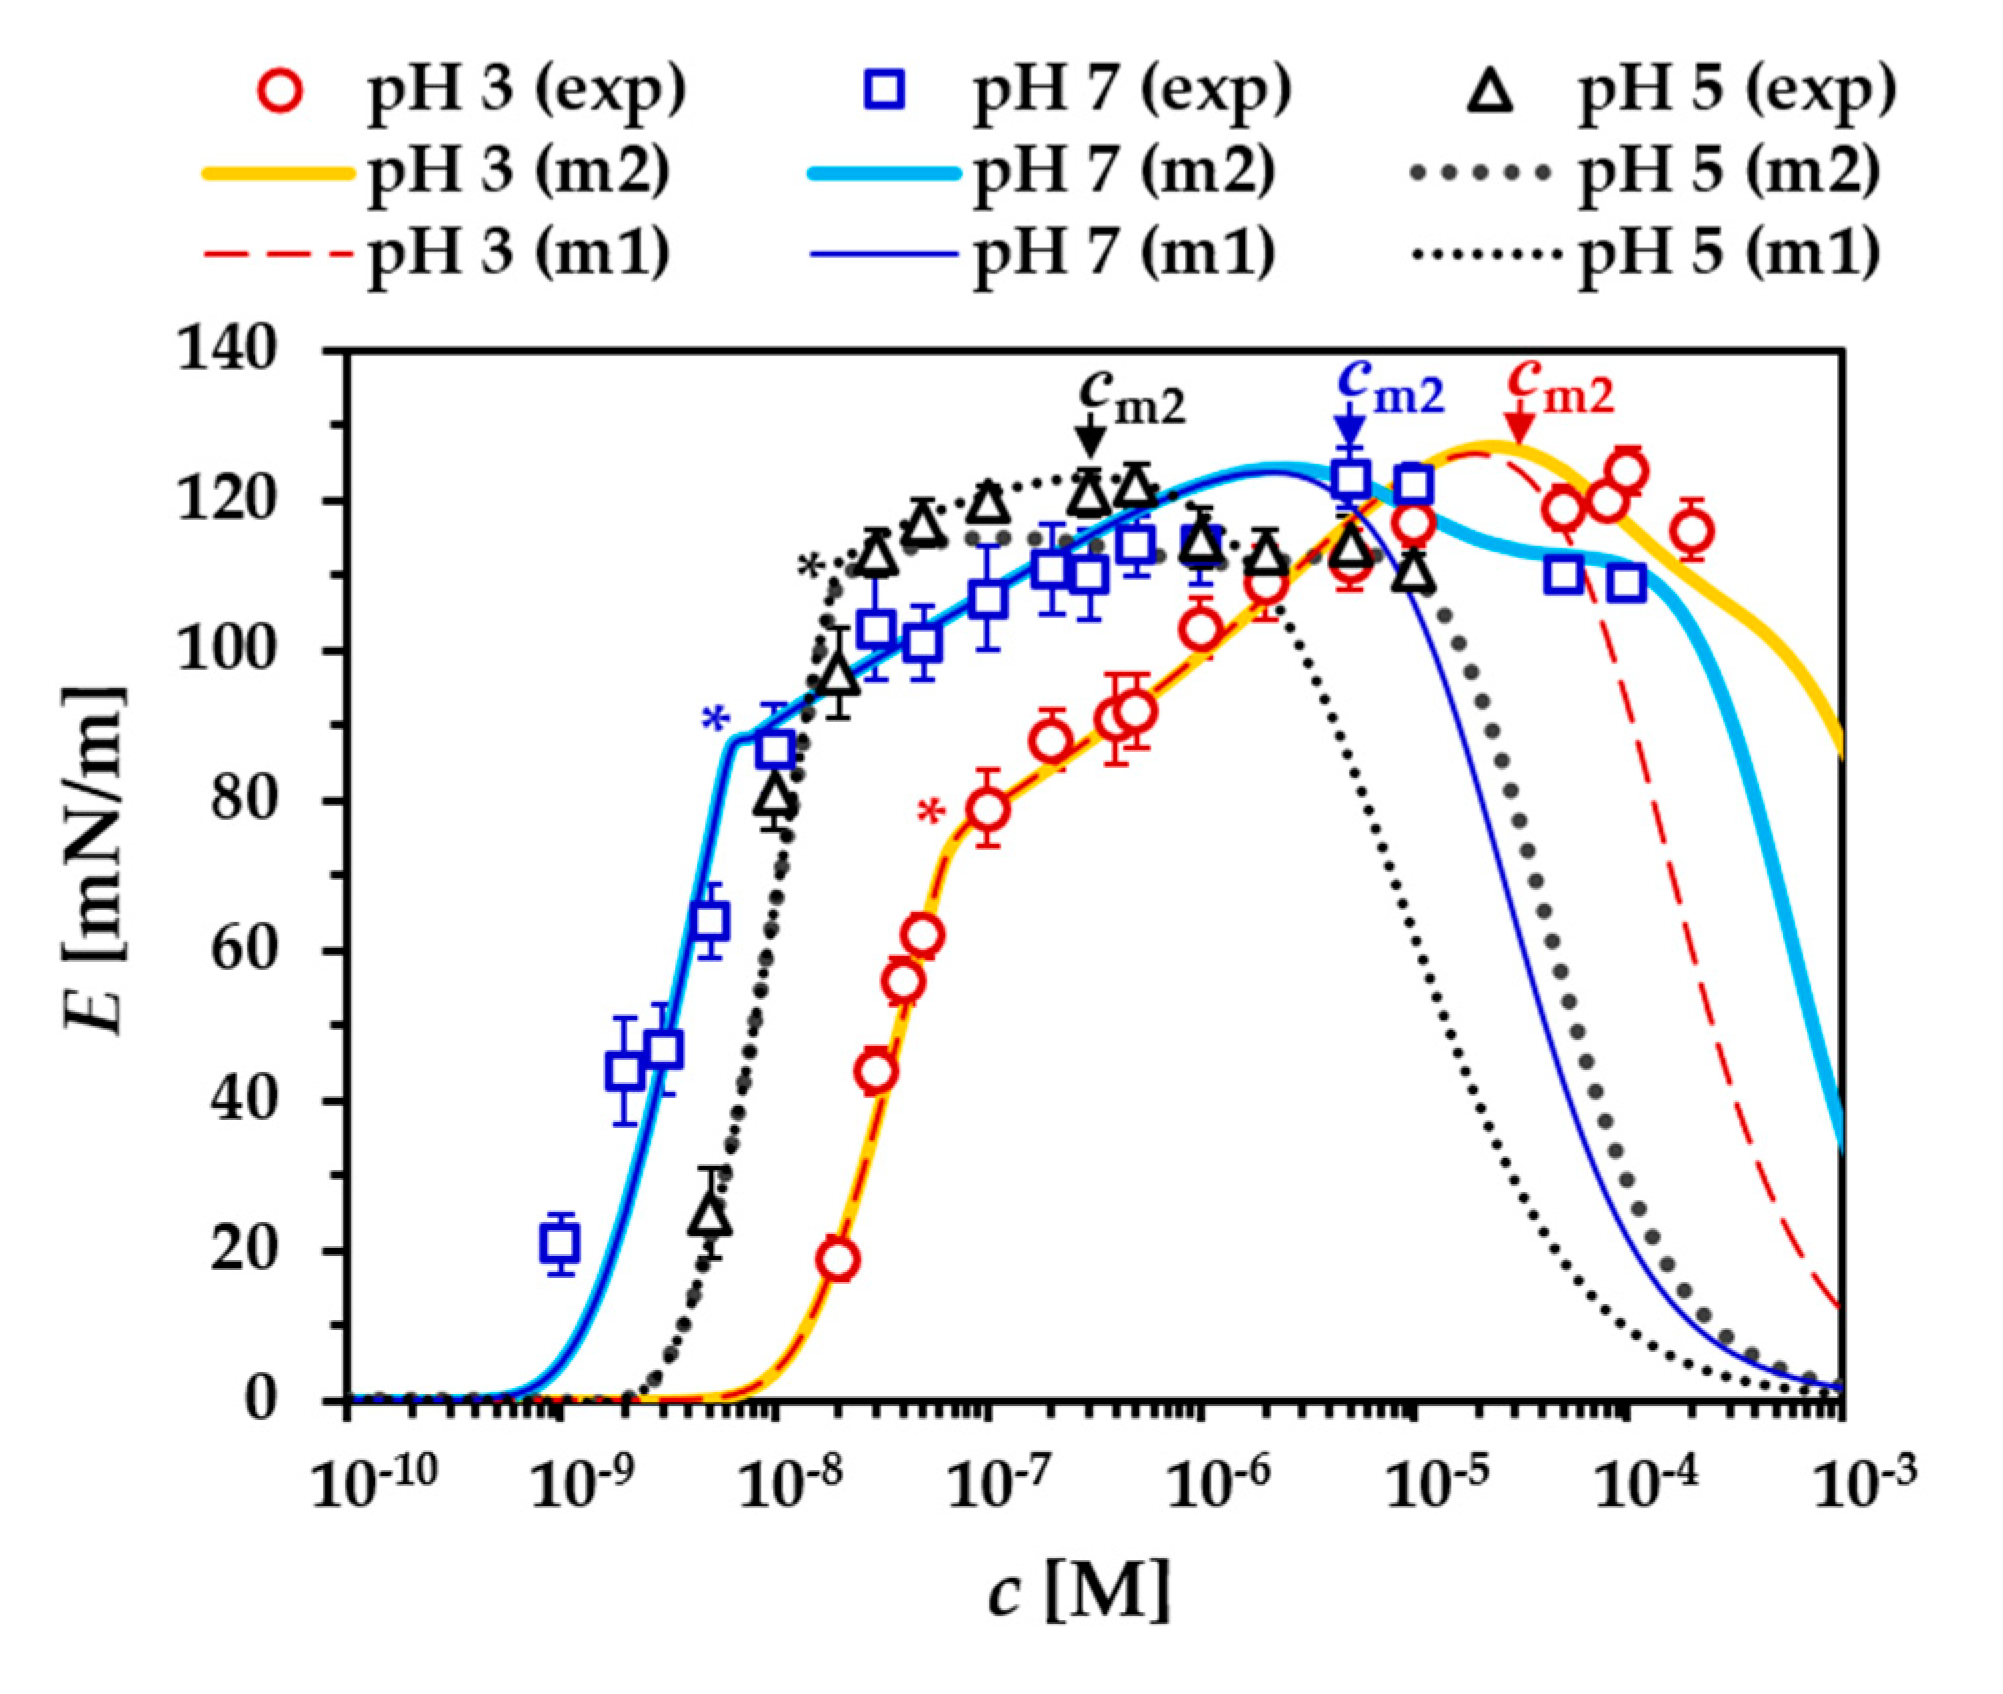
  • the dependency of the dilational modulus on the protein concentration, E(c)f,g.
From these, one obtains:
4.
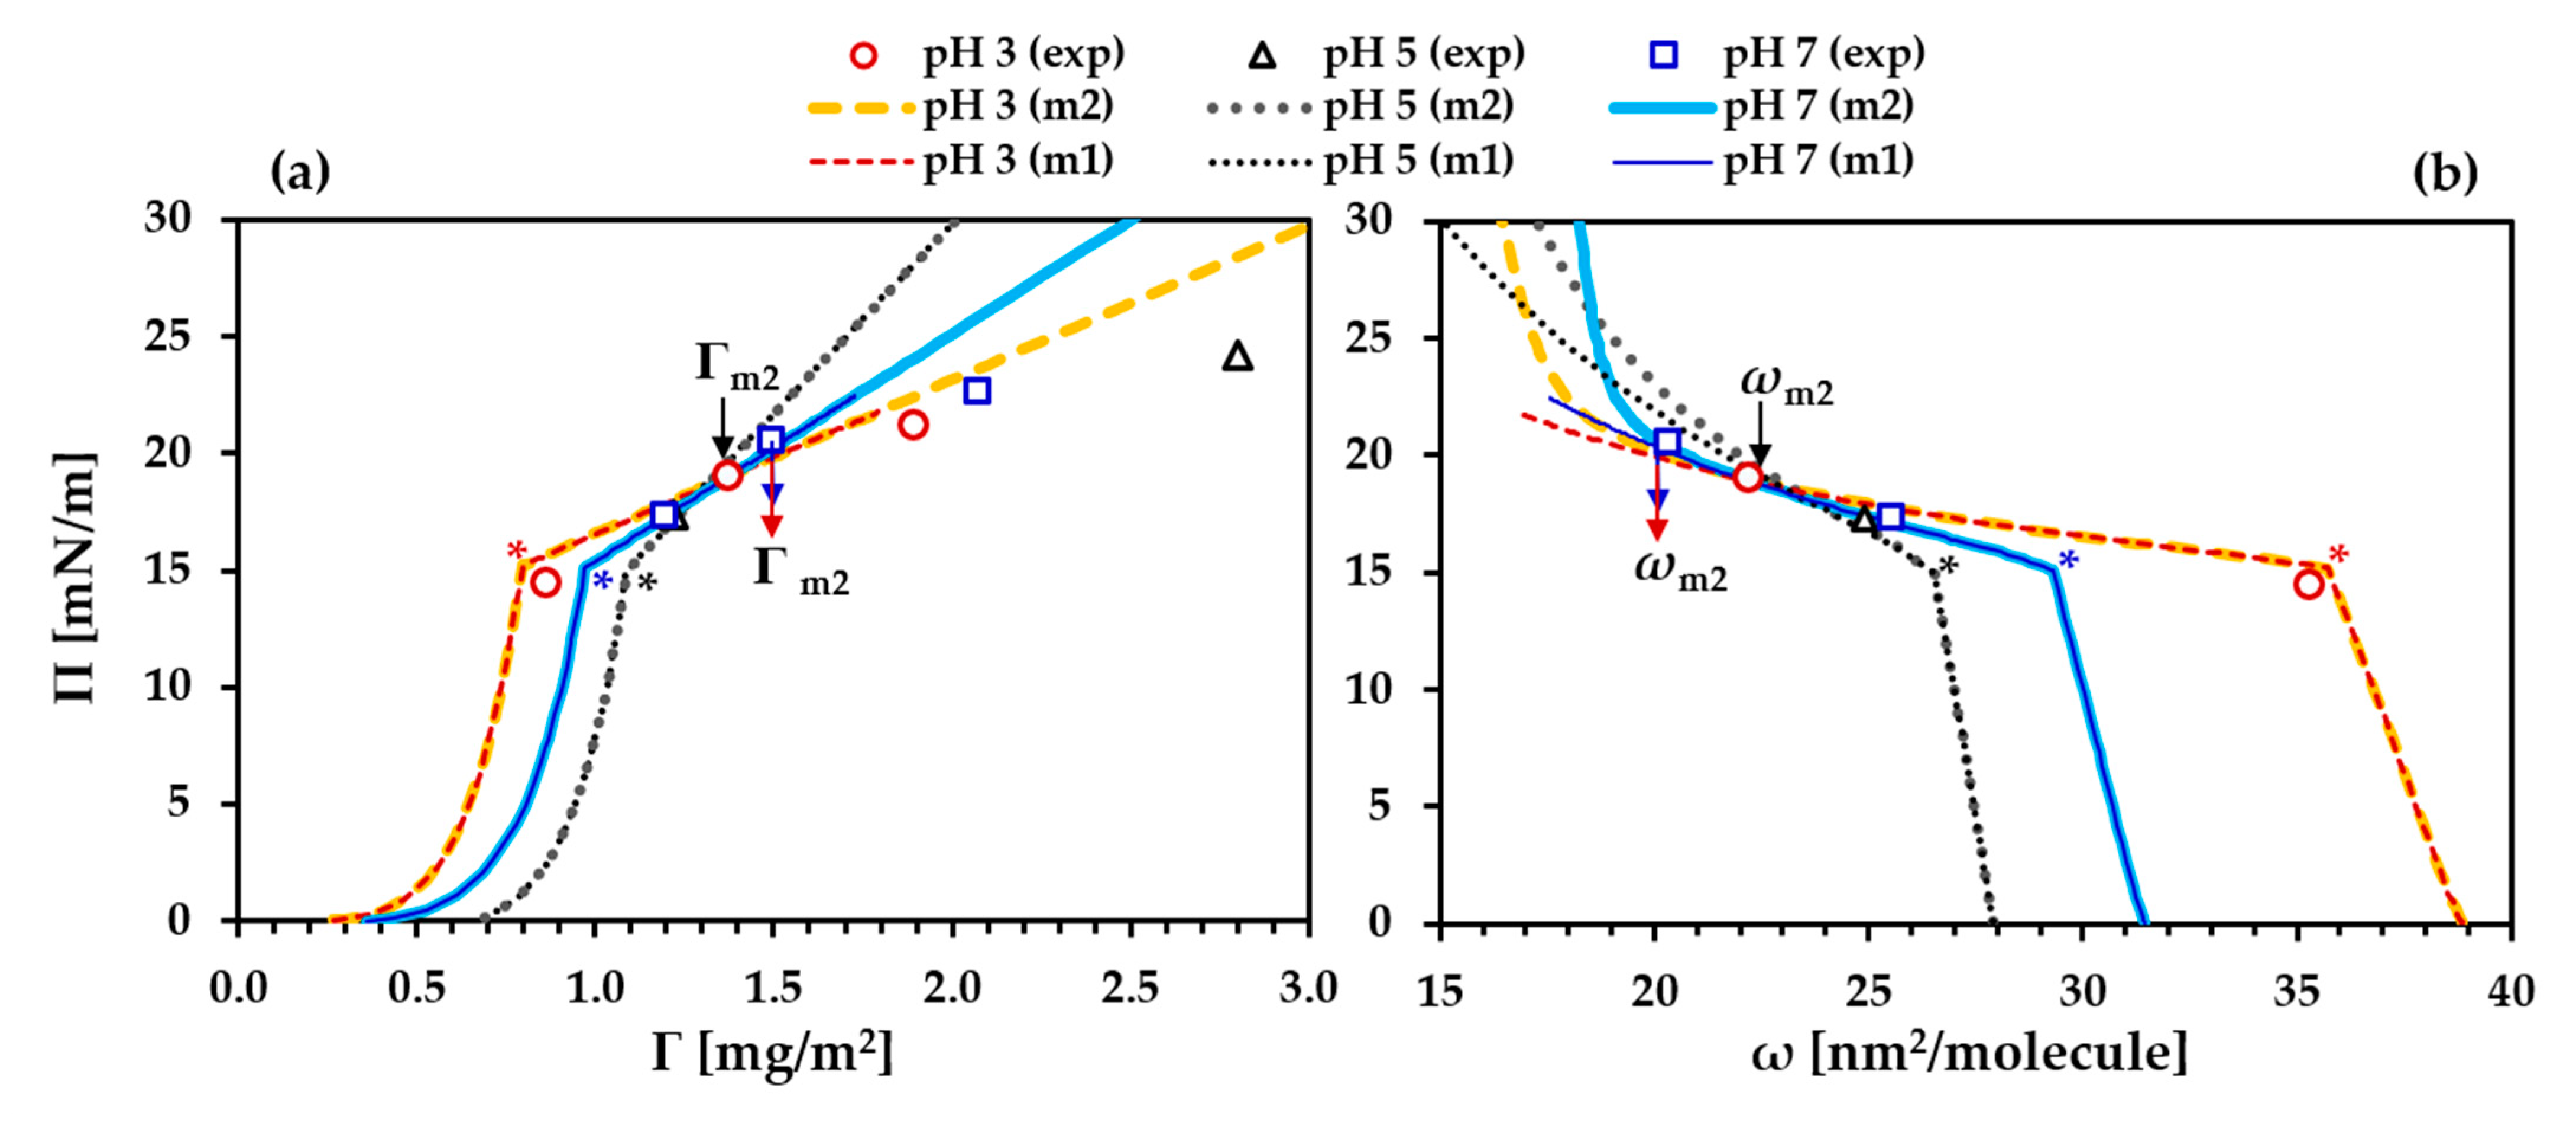
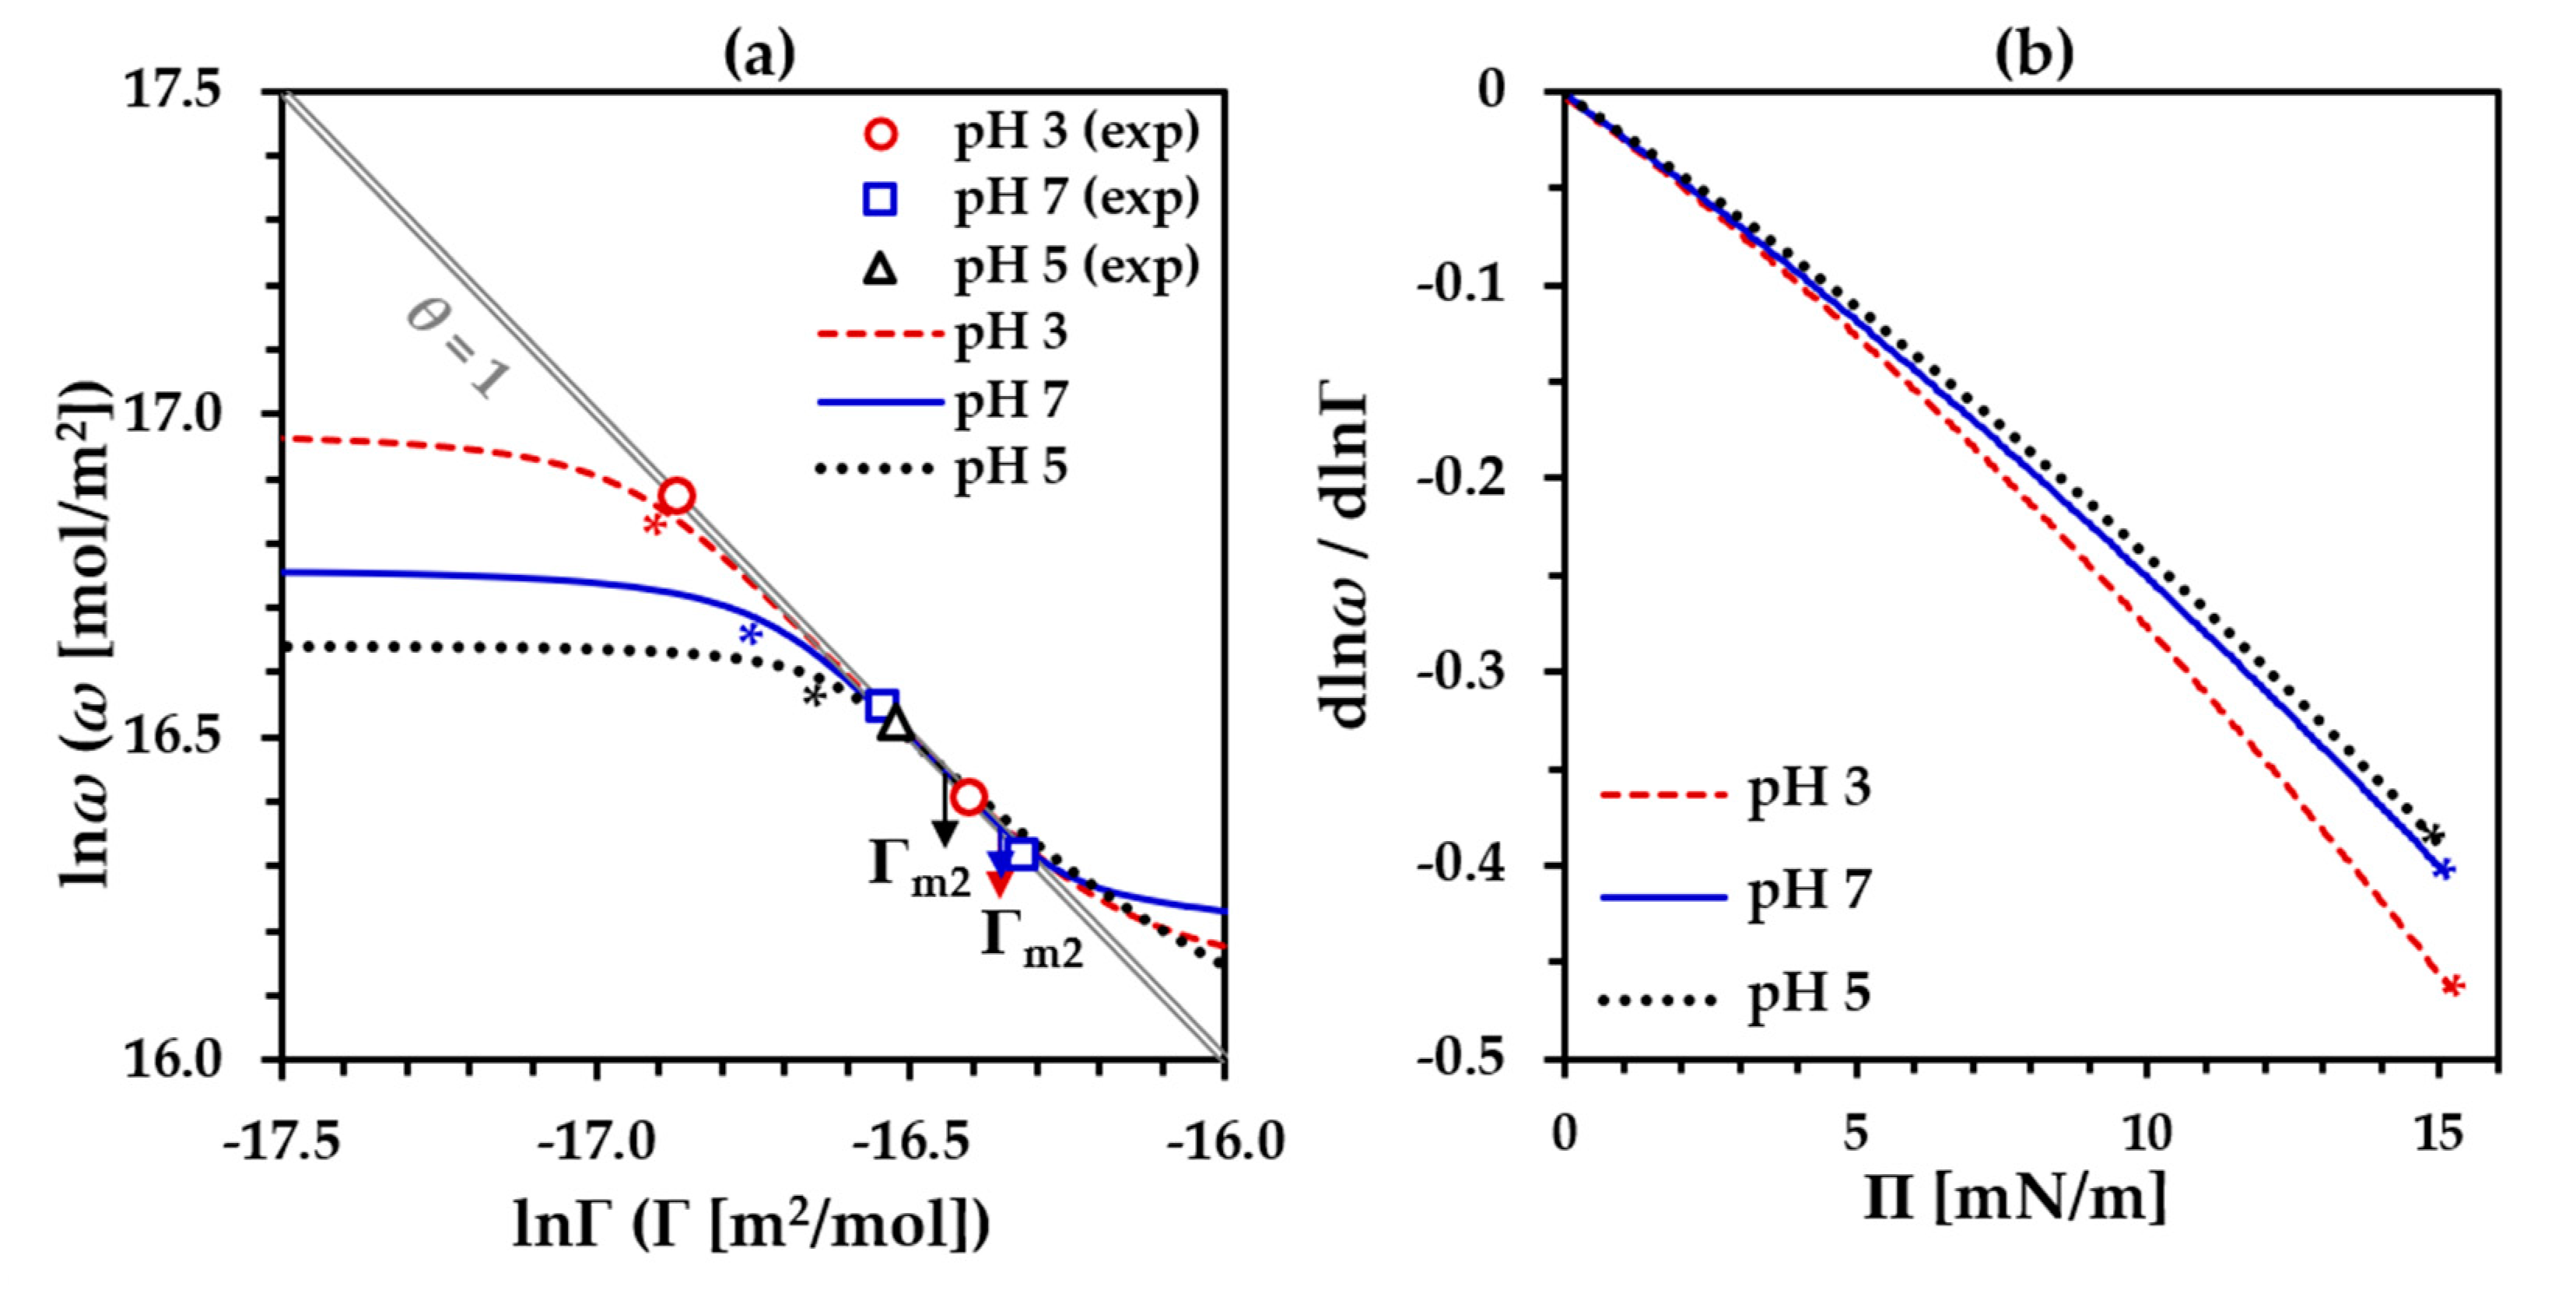
the equation of state, Π(Γ);
5.
the distribution of the average molar area over the protein concentration, ω(c) [24], the surface pressure, ω(Π) and the surface excess, ω(Γ); and
6.
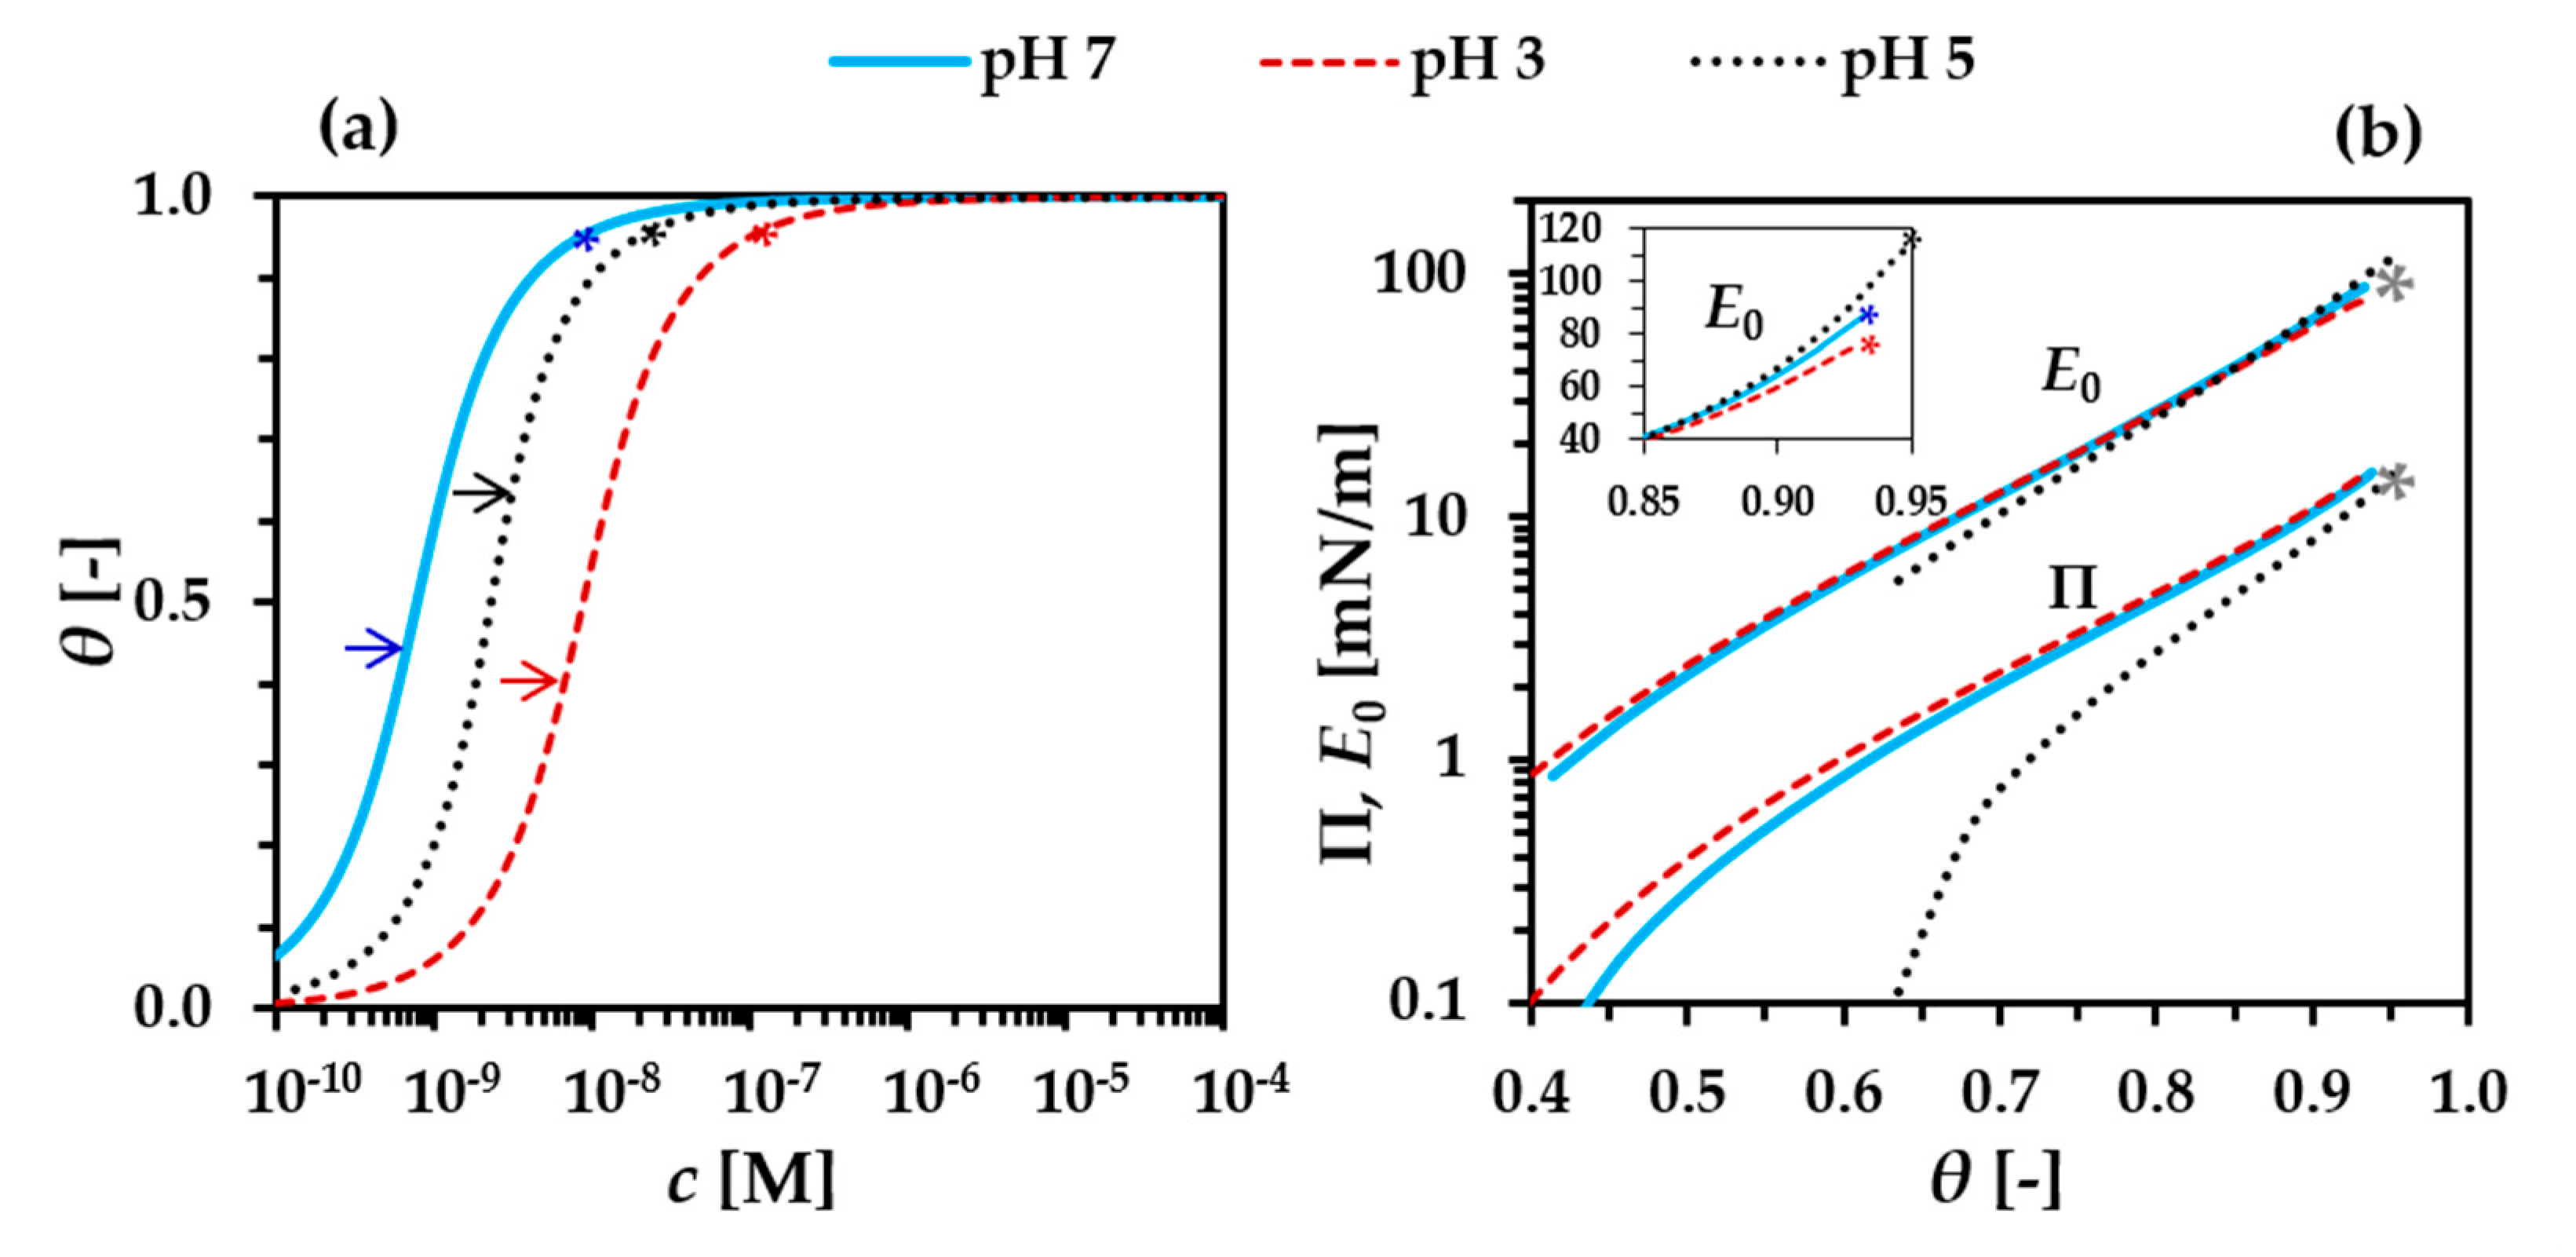
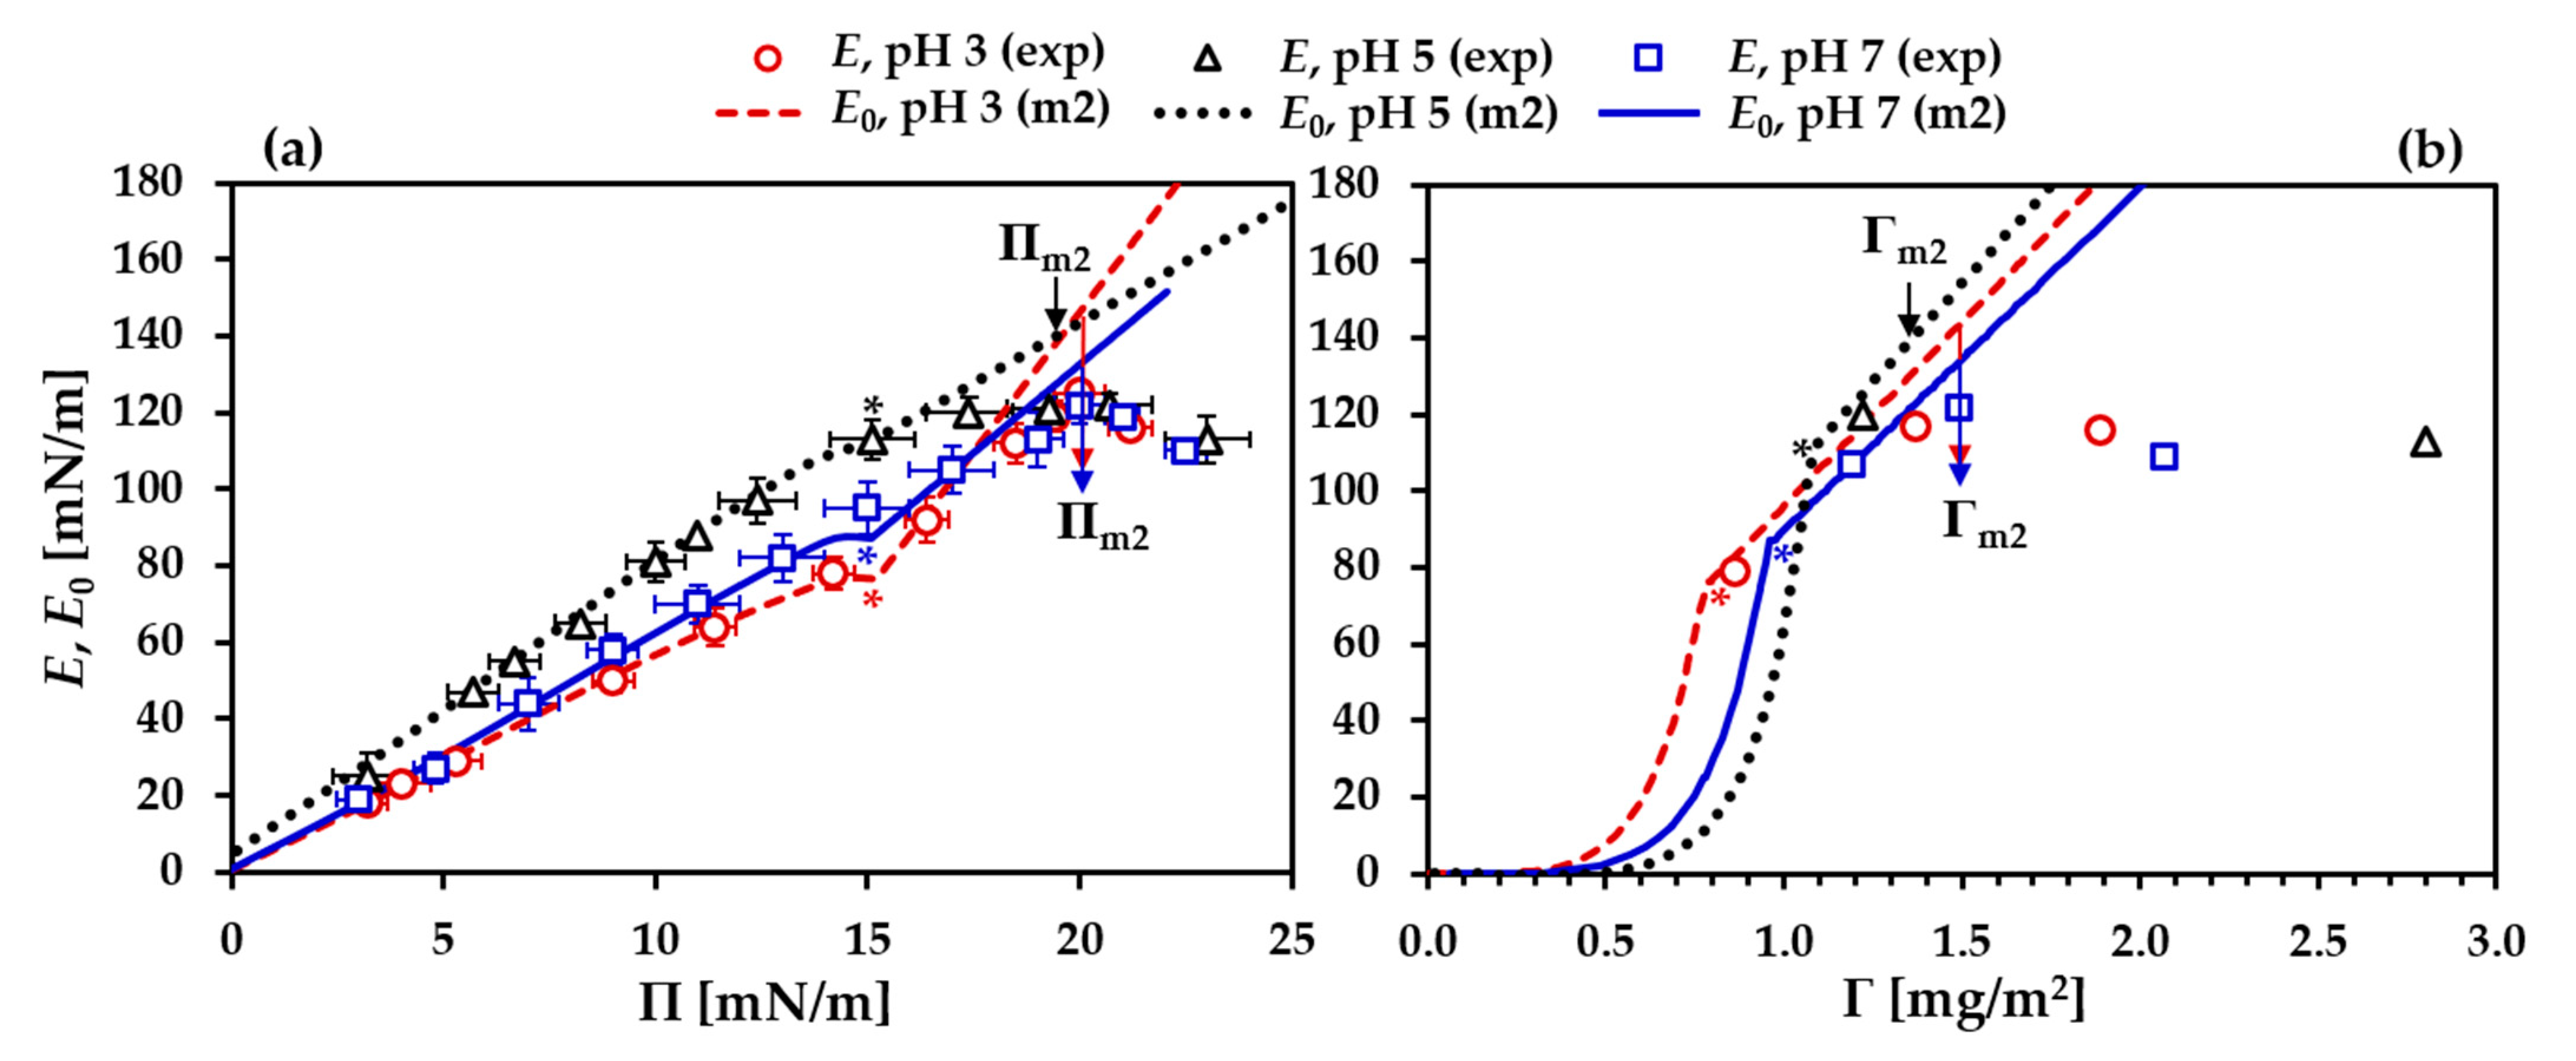
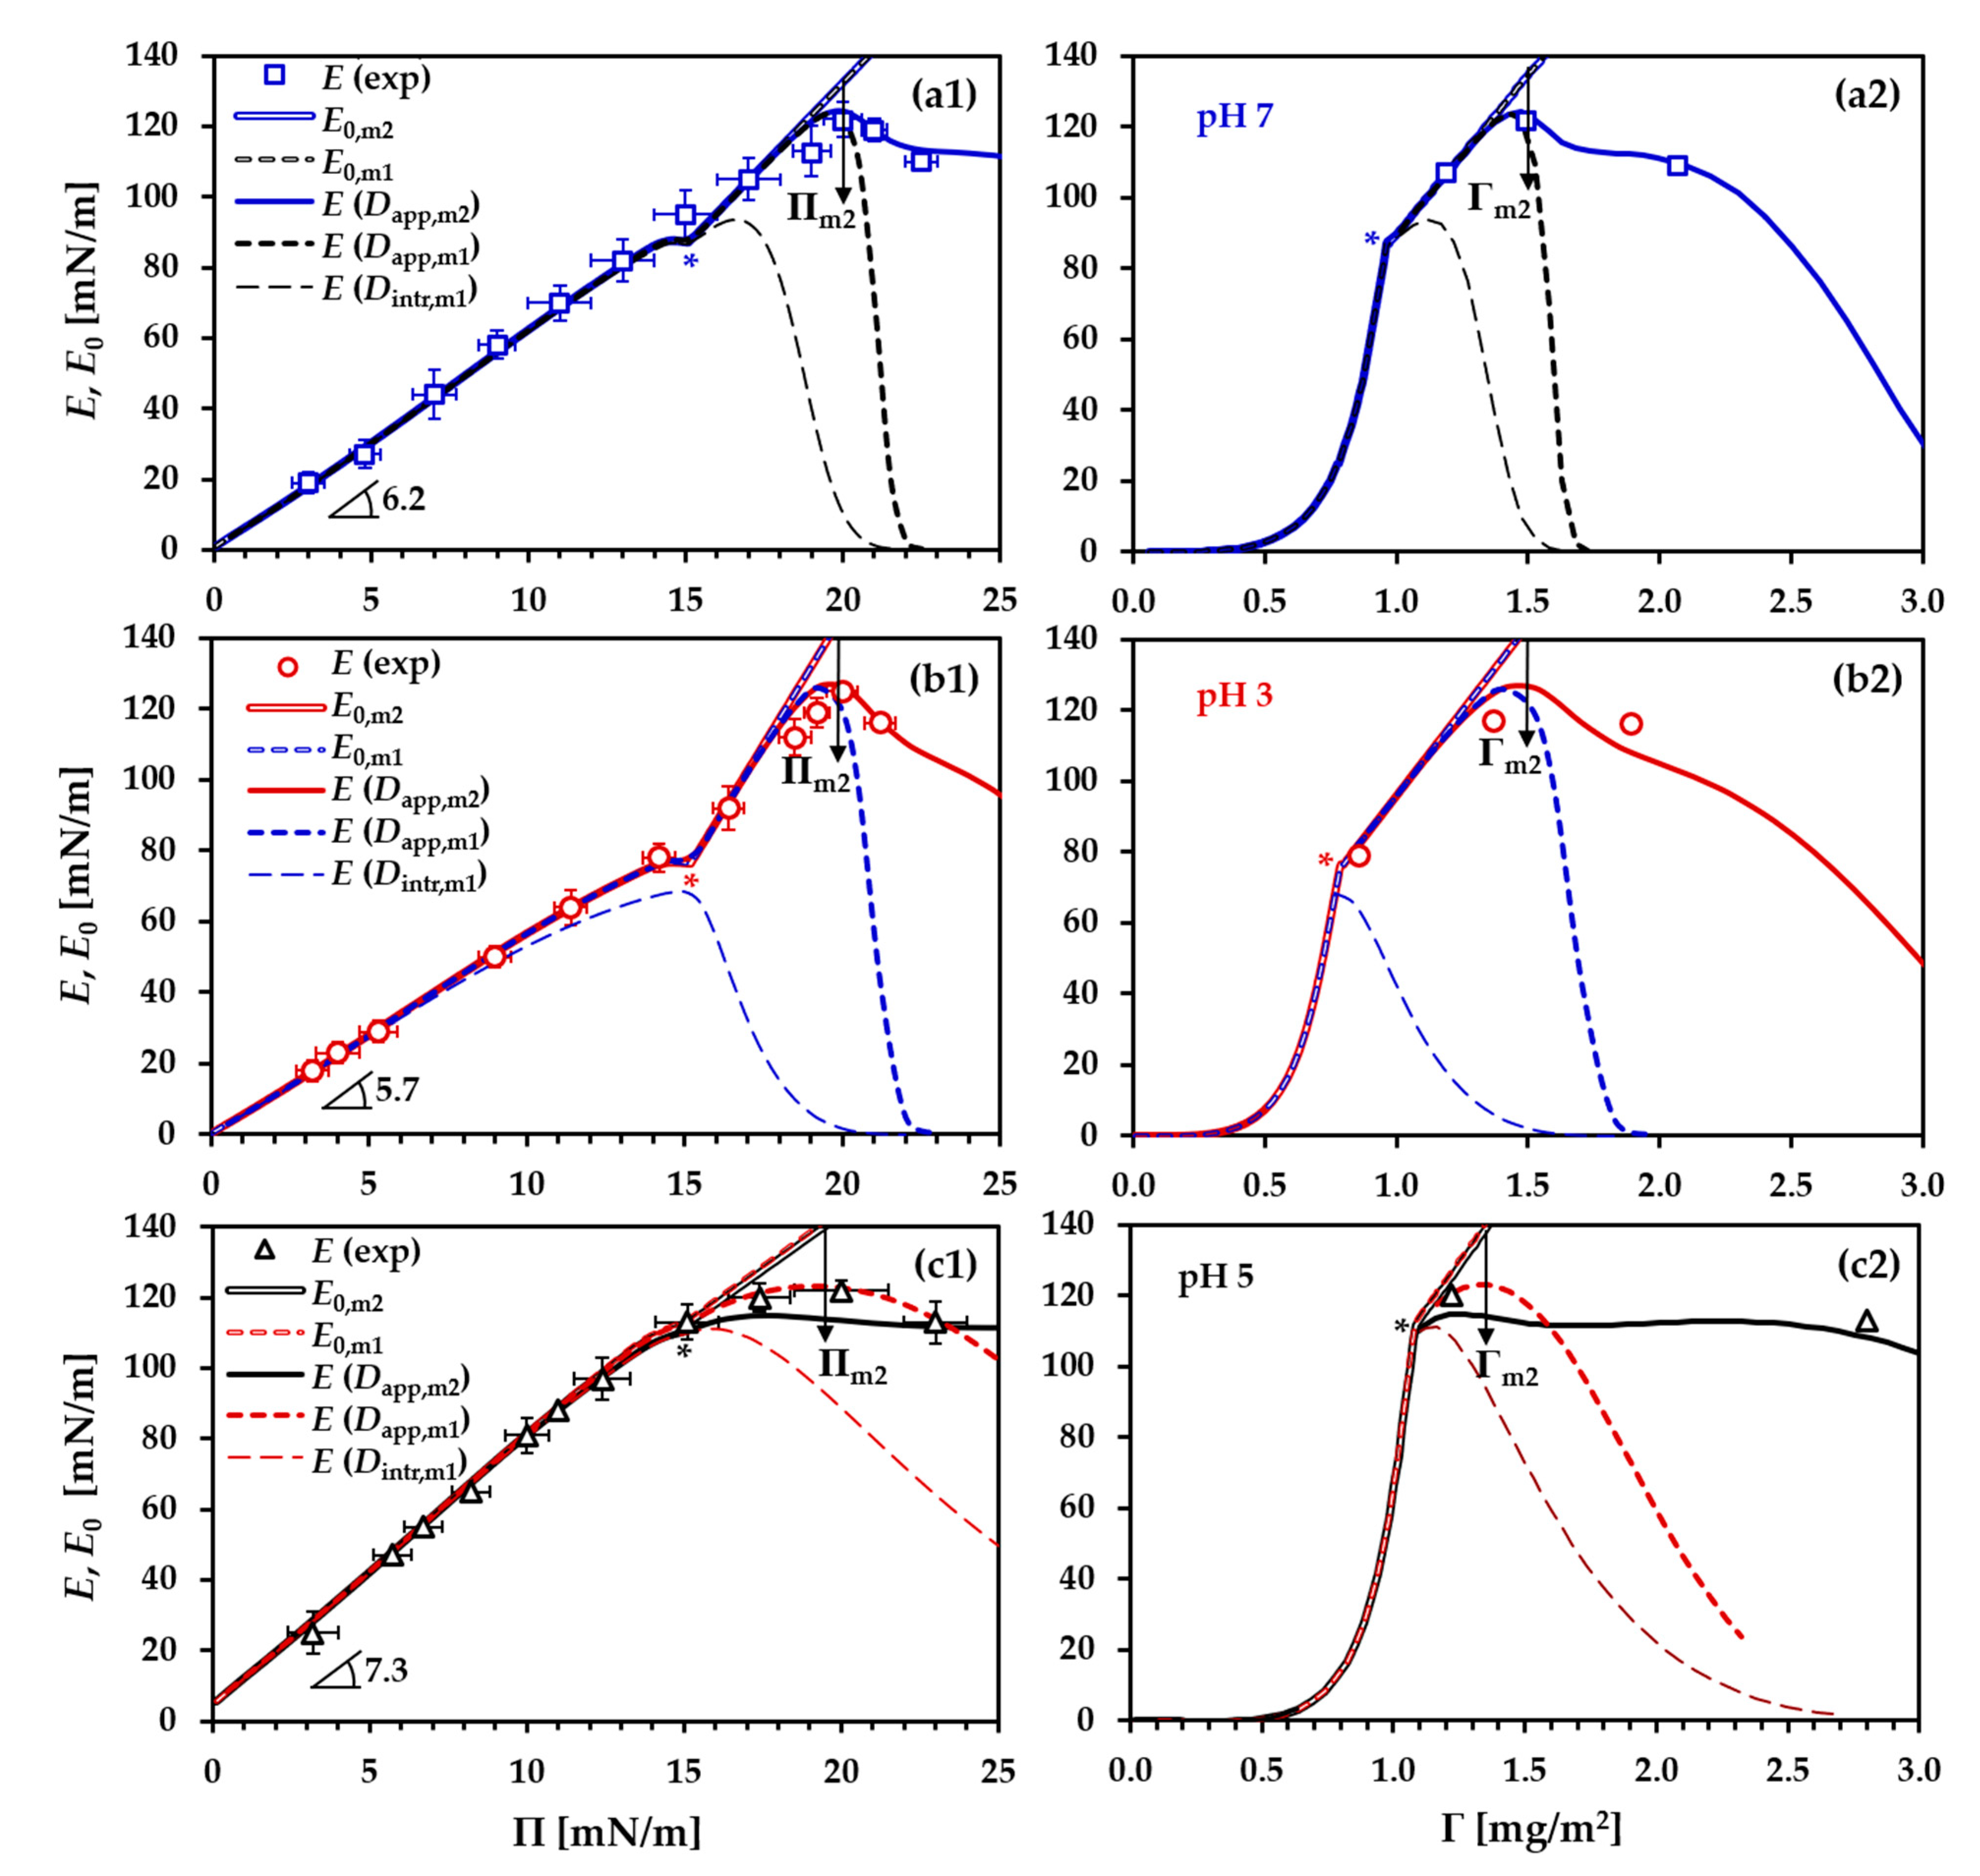
the dependencies of the dilational modulus on the surface pressure, E(Π)f,g, and on the surface excess, E(Γ)f,g.
The simultaneous fit of the model to all experimental dependencies was facilitated by a calculation procedure integrated in a dedicated software application [http://www.thomascat.info/Scientific/adso/adso.htm (accessed on 1 March 2021)]. An extended description of the model and the calculation procedure implemented in the software is given in the Supporting Information. In this application, the plotted experimental data are compared with the model by means of an interactive tool, which displays the theoretical predictions for each dependency as computed on the basis of a set of values for the input parameters. Exemplary screenshots, illustrating the effects of different input parameters on the model predictions, are given in Figure S2 in the Supporting Information. The input parameter values used in the present work are listed in Table 1.
Note that, in the model calculations, values for the surface excess, Γ, and the molar area, ω, are used in units [mol/m2] and [m2/mol], respectively, while for convenience, in most figures below, Γ is plotted in units of [mg/m2] as Γ [ mg / m 2 ] = M w [ mg / mol ] Γ [ mol / m 2 ] , and the area per molecule [nm2/molecule] is presented instead of the molar area as ω [ nm 2 / molecule ] = 10 18 ω [ m 2 / mol ] / N A , where N A is the Avogadro number.
As mentioned in the introduction, the model is complicated, due to the number of model parameters (there are nine input parameters for the description of the adsorption and rheological properties of a protein monolayer and, additionally, an adsorption constant, b2, for the secondary layer); we used all of them as free adjustable parameters. Thereby, we attempted to facilitate the fitting procedure by following several steps and performing a number of subsequent iterations in order to achieve the final best global fit to all available experimental dependencies in each set for a given pH. In each fitting step in a given iteration, one or more fitting parameter(s) was/were optimized on the basis of the results from the previous iteration. In the following, we briefly explain the effects of each parameter on the model simulations. To visually support our explanations, we show original screenshots of the software tool in Figure S2 in the Supporting Information.
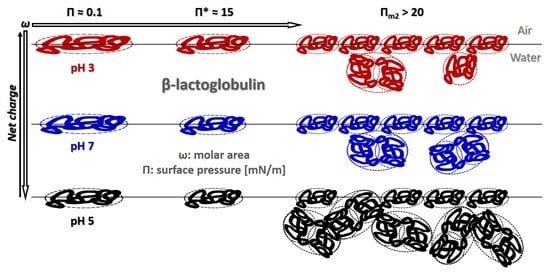
  • At the very beginning, an approximate value for Π* should be set in order to divide the precritical and postcritical regions in the simulation curves. In the present case, the appropriate values for Π* are around 15 mN/m, where the three experimental Π(c) isotherms (for pH 3, pH 5 and pH 7) exhibit a kink;
  • In accordance with Equations (1)–(7), the parameters ω1, ωn and bj are essential for optimizing the model simulations in a way to fit the experimental Γ(c) isotherm and the corresponding dependency ω(c) and, at the same time, the experimental Π(c) isotherm. In the initial iteration, this step aimed at locating the precritical region of the Π(c) isotherm along the c-axis while maintaining a good fit to the Γ(c) isotherm. At other fixed parameters, increase of the local adsorption constant, bj, shifts the precritical region of the Π(c) isotherm toward lower c; the individual effects of ω1 or ωn on the model simulations are illustrated in Figure S2b,c in the Supporting Information. In the final iterations, the values of these parameters were optimized to serve the best global fit to all processed dependencies. It must be stressed here that the input values of ω1 and ωn are boundary values. In the calculation procedure, the average molar area ω is allowed to vary between these minimal and maximal values, but the actual molar areas, computed as dependent on other parameters according to Equations (1)–(7), appear as output data (see Figure S3 in the Supporting Information). Those boundary values only guide the resulting best fit, and, therefore, a proper analysis should be based on the output data. Some characteristic values (ωΠ=0.1, ω* and ωm2 (for definitions, see the legend in Table 1)) outputted from the best fits will be discussed further below;
  • The molar area increment ω0 was allowed to vary between 2.0 × 10⁵ and 4.5 × 10⁵ m2/mol [21,28,30,32,33], which corresponds to areas per increment between ≈0.33 nm2 and ≈0.75 nm2, respectively. We could mention here that Joos [15] used a limiting value of the solvent area per molecule of 0.10 nm2 (≈6 × 10⁴ m2/mol); however, in our analysis we refrain from using such low values for ω0. Assuming a weak effect of pH on this parameter, we aimed at setting a constant value in the processing of the data packs at the three different pH. The effect of ω0 variation on the adsorption isotherm Γ(c) is less pronounced compared to that on the Π(c), Π(Γ) and E0(Π) dependencies (Figure S2d in the Supporting Information). For the latter one, optimizing ω0 was essential for description of the experimental E(Π) data. The best results were found using the lower values for ω0 so that this parameter was fixed at 2.0 × 10⁵ m2/mol. It can be mentioned here that this value is very close to the molar area of a layer of adsorbed water molecules on mica surfaces (≈1.8 × 10⁵ m2/mol or ≈0.30 nm2/molecule) [64];
  • For the exponential coefficient α, it was possible to use relatively close values in the cases of pH 3 (α = 2.7) and pH 7 (α = 2.2), but for pH 5, a substantially higher value (α = 3.8) was required. The effects of α on the model simulations are illustrated in Figure S2e in the Supporting Information;
  • The effects of variation of the interaction parameter a on the model simulations are illustrated in Figure S2f in the Supporting Information. It should be noted that the simulations of the modulus E and those of the precritical region of the Π(Γ) equation of state are very sensitive to this parameter;
  • The aggregation number na was optimized in respect to the postcritical region of the surface pressure isotherm Π(c) and to pin the local maximum of the E(Π) dependency observed at Π = 19–20 mN/m;
  • Finally, the adsorption constant for the secondary layer b2 was set to follow the experimental adsorption isotherm Γ(c), and then Π* and na were tuned in order to obtain best fits with the surface pressure isotherm Π(c) and the rheology data.
For each of the data packs at the three different pH, the same set of common input parameter values (listed in Table 1) were used to obtain fits by one-layer and two-layer models (in the following, denoted simply as “m1” and “m2,” respectively), with the only difference being the use of b2 > 0 in the m2-fits. We should mention here that better m1- and m2-fits were obtained when using separate sets of parameter values, but these modified sets differ from each other only slightly, so that all the observed trends and their interpretation remain conceptually the same as those for the original results.
The aim of this approach is to determine the onset of the formation of a secondary layer by superimposing the results obtained by the m2-fit (describing a bilayer) and those obtained by the m1-fit (solely describing a monolayer). For this purpose, we analyzed in detail the theoretical ω(Γ) dependencies (Figure S3 in the Supporting Information). The onset of secondary layer formation was defined at a molar area of the saturated monolayer, denoted ωm2, where the value of the surface excess obtained from the m2-fit (Γm2-fit) exceeds the one from the m1-fit (Γm1-fit) by about 1.5%; this corresponds to the situation where the difference between the ω-values at the average adsorption Γm2 = (Γm1-fit + Γm2-fit)/2 exceeds the area increment ω0 ≈ 0.33 nm2, and the error in ωm2 was set as ±0.2 nm2.
Despite the imposed restrictions, the obtained best global fits with the parameter values in Table 1 are quite satisfactory for the three cases of different pH values (Figure 1 and Figure 2) and our discussion and conclusions are based on these results. However, there is one conceptual discrepancy between theory and experiment: in the Π(c) isotherms computed by the m2-model, the model strongly overestimates Π at c > cm2, i.e., beyond the onset of a secondary layer formation, while the experimental Π-values tend to level off.
Based on the obtained result, we can partition the run of the Π(c) and Γ(c) isotherms into three portions: (1) a precritical range, cΠ=0.1c*, characterized by weak monolayer compression; (2) an initial part of the postcritical range, c*–cm2, characterized by strong monolayer compression and surface aggregation; and (3) a range of growth of the secondary layer onto the saturated primary monolayer, c > cm2. Definitions of the subscripts “Π=0.1" and “m2” are given in the legend of Table 1.

3.1. Precritical Region of the BLG Adsorption Layer

The monolayers formed in the precritical region are described by Equations (1)–(8), and, hence, the results from m1- and m2-fits based on the common parameter values listed in Table 1 are equivalent. Figure 1a,b show noticeable shifts along the c-axis of the Π(c) and Γ(c) isotherms as the values for both characteristic concentrations cΠ=0.1 and c* decrease in the order pH 3 < pH 5 < pH 7. Concerning the cases of pH 7 and pH 3, the lower surface activity at pH 3 is attributed to the higher protein net charge [40,43,65,66] within the concept of an electrostatic barrier of adsorption [65,66,67]. Effects of other pH-dependent factors, like exposed hydrophobicity, protein rigidity and degree of unfolding upon adsorption have also been considered in the literature [68,69,70]. Furthermore, the analysis by Sengupta et al. [71,72] of the potential energy profiles for a protein near the water/air interface, performed for sixteen proteins (which carry either positive or negative net charge under the experimental solvent conditions at pH 7), revealed the existence of an energy barrier to adsorption for the proteins with positive net charge. Such barrier appears as a local maximum in the profiles of net Van der Waals interactions (consisting of attractive Debye-Keesom interactions and London dispersion interactions) and is mainly attributable to the repulsive dispersion interactions between a protein and the water/air interface. It is worth to note that the dispersion interactions between a protein and a water/nonpolar oil interface have been found attractive; hence, such “Van der Waals force barrier” to adsorption has not been detected for this interface for any of the investigated proteins [71,72].
The lower surface activity of BLG at pH 3 than at pH 7 is well reflected by the model via the smaller adsorption constant, bj, while the parameters α and a are kept comparatively close. In this line, the intermediate values of cΠ=0.1 and c* for pH 5 (negligible net charge) are surprising. Such “anomalous” behavior of BLG at pH 5 and at relatively low protein concentrations (c ≤ 10−7 M) was observed in previous adsorption kinetics studies [43]. Note that an analogous behavior was reported also for β-casein [27]. However, this intriguing behavior still remains unexplained.
Comparison of the Π(c) and Γ(c) isotherms shows that, for any of the studied pH values, the onset of Γ precedes the onset of Π, a typical situation for proteins [10,63]. This means that a certain minimum amount of adsorbed protein molecules is required to generate measurable Π-values. This phenomenon is the background of the so-called induction time in the dynamic surface pressure of protein solutions [43,55,73,74]. The origin of such behaviors is a first-order 2-D “gaseous” to “liquid expanded” phase transition, which occurs at extremely low Π [73,74]. The respective values of ΓΠ=0.1 for the studied BLG systems are listed in Table 1 and are well visible in the Π(Γ) data in Figure 2a.
The quantity ΓΠ=0.1 is most sensitive to the interaction parameter a and the maximum molar area ωn (see Figure S2c,f in the Supporting Information) [20], and it increases in the order Γ Π = 0.1 pH 3 < Γ Π = 0.1 pH 7 < Γ Π = 0.1 pH 5 ; correspondingly, the molar area decreases in the same order, ω Π = 0.1 pH 3 > ω Π = 0.1 pH 7 > ω Π = 0.1 pH 5 (Figure 1 and Figure 2). Such behavior of adsorbed proteins has been related to effects of the molecular net charge [16,66,75]. Indeed, vibrational sum-frequency-generation spectroscopy revealed that the strength of the electric field (independent of its sign) at water/air interfaces with adsorbed BLG decreases in the same pH-order [40]. This is in agreement with the absolute values, |Z|, of the BLG net charge, ±Z, in solution, that is, ca. +30 (pH 3), +2 (pH 5) and −11 (pH 7) electronic charges, e, as estimated from hydrogen ion titration experiments [76]. Interestingly, we found an excellent linear relation (R2 > 0.99): ωΠ=0.1 = B|Z|+ 27.0, with B ≈ 0.4 [nm2/molecule.e]. For pH 5, ωΠ=0.1 = 27.9 nm2/molecule is very close to the area at zero net charge (27.0 nm2/molecule), which reveals very weak effect of the small |Z| at pH 5 on the molecular packing at the “gaseous” to “liquid expanded” phase transition.
At the very low c near the onset of Π, the induction times in the adsorption kinetics of BLG are very long (hours) [43], and, under these conditions, we consider the adsorbed protein molecules have approached the limit of unfolding upon adsorption [15,16], which apparently is pH-dependent. Note that the area “per” molecule ω is, in fact, slightly larger than the real area “of” a molecule at the interface, due to packing effects. Nevertheless, ω can be used to calculate arbitrary radii of adsorbed BLG molecules represented by oblate ellipsoids laterally packed in side-on configuration [24].
To illustrate the tendency of BLG to unfolding upon adsorption, one could also use the idea of de Feijter and Benjamins [77] about representing the adsorbed molecules as intrinsically “soft” particles that occupy an area per molecule with an “equivalent hard-core” radius, R ehc   [ nm ] = ω / π , (ω [nm2/molecule]). Later, a similar approach was used by Wierenga et al. [66], utilizing the same simple geometrical expression for estimating the “effective” radius of adsorbing globular proteins represented by hard-sphere particles. Thus, at the onset of the development of the “liquid expanded” phase, from ωΠ=0.1 we get R ehc , Π = 0.1 pH 3 ≈ 3.5 nm, R ehc , Π = 0.1 pH 7 ≈ 3.2 nm and R ehc , Π = 0.1 pH 5 ≈ 3.0 nm. The pH dependency of such “equivalent hard-core” radius can be explained by the pH-dependent molecular characteristics of the BLG globules and their net charge. The so-called acidic Q form (pH 2.5–4) of BLG has a less compact structure than the native N form (pH 4.5–6) and the so-called R form (pH 6.5–8) in the Tanford transition [78,79], which suggests the highest propensity to unfolding upon adsorption at pH 3. On the other hand, the largest net charge at pH 3 (compared to pH 5 nd pH 7) generates the strongest intermolecular electrostatic repulsion that counteracts protein–protein cohesive interactions [65] and also favors the protein–solvent interactions (wetting) at the interface. Having in mind constancy of the Debye length at the fixed ionic strength used, those prerequisites can be regarded as determining the highest values for ωΠ=0.1 and Rehc at pH 3, as the latter is merely twice the radius (≈1.75 ±0.04 nm [80,81]) of the spherical native BLG monomeric unit in bulk. With this in line, the decrease of |Z| entails the decreasing values for ωΠ=0.1 and Rehc at pH 7 and pH 5. Neglecting small pH-dependent variations in the molecular volume of BLG (ca. 1% [79]), the degree of unfolding in the primary monolayer can be monitored, for example, by the layer thickness, but we are not aware of data on the thickness of BLG layers at very low Π. Using the molecular volume of BLG (≈22.7 nm3 [24]) and the above estimated Rehc,Π=0.1 values, for oblate ellipsoids adsorbed side-on at the interface, one estimates thicknesses (ellipsoids’ polar diameters) for the near-zero compressed monolayers of ≈0.9 nm (pH 3), ≈1.1 nm (pH 7) and ≈1.2 nm (pH 5), which are quite reasonable values [24,82,83,84].
In the concentration range cΠ=0.1c*, Π and θ steeply increase, while the average molar area ω decreases only slightly (Figure 1a, Figure 2 and Figure 3a). For Γ* and ω*, Figure 2 reveals Γ pH 3 * < Γ pH 7 * < Γ pH 5 * and ω pH 3 * > ω pH 7 * > ω pH 5 * , which variations are equivalent to those of ΓΠ=0.1 and ωΠ=0.1. This behavior in the “liquid expanded” regime is consistent with the accumulation of adsorbed protein at the interface, accompanied by only a weak lateral compression of the monolayer. For a given surface pressure Πx, the monolayer compression, Kx, relative to the origin ωΠ=0.1 (representing near-zero compression) can be estimated by a simple relation between ωx and ωΠ=0.1: K x   [ % ] = ( 1 ω x ω Π = 0.1 ) × 100 . At ω* we get K pH 3 * > K pH 7 * > K pH 5 * (for exact values, see Table 1). Simultaneous measurements of Π and Γ in adsorption kinetics experiments with solutions of succinylated variants of ovalbumin [1,66] or BLG [65] with varying |Z| have shown the same shift of the “dynamic” Π(Γ) curves toward smaller Γ with increasing |Z|. Song and Damodaran [65] concluded that electrostatic forces at the interface induce a partial increase of the surface pressure at constant Γ.
The current model used in our calculations does not provide a rigorous description of electrostatic effects in the adsorption isotherm and in the equation of state, but those are reflected by the enthalpic parameter a, which increases in the order apH3 < apH7 < apH5, meaning increasing intermolecular cohesive forces against decreasing electrostatic repulsion. From θ = ωΓ, the opposite trends in the Π(Γ) and Π(ω) data, respectively (Figure 2), cancel out to a great extent in the general equation of state Π(θ), as shown in Figure 3b. Indeed, the Π(θ) curves for BLG at pH 3 and pH 7 almost overlap, while the one for pH 5 appears below them, which illustrates the positive effect of significant electrostatic forces on the surface pressure [65]. However, the almost identical values at any pH for the characteristic quantities θ* (94–95%) and Π* (15.0–15.2 mN/m) reveal a pH-independent common behavior of the interfacial layers at the critical point (Π*,θ*), regardless of the pH-dependent adsorbed amount Γ* and degree of surface-induced unfolding (represented by ω*) of the adsorbed BLG globules. Again, we found an excellent linear relation (R2 > 0.99): ω*= B|Z|+ 25.7, with B ≈ 0.33 [nm2/molecule.e]. Coincidently or not, this value of the prefactor B is virtually equal to the area increment ω0, which means that the model settings allow detection of |Z|-induced variations in ω with the resolution of a single electronic charge.
The onset of surface pressure gives rise of the modulus E, which for the precritical region is computed via Equation (13). Figure 4a shows the dependencies lnω(lnΓ) at each pH required for determining the limiting elasticity E0 via Equation (14). The prolongations of the curves above monolayer saturation correspond to increased values of Γ, due to development of the secondary layer, but the parallel decrease of the molar area is physically meaningless for θ > 1, and, therefore, the ω(c) data for c > cm2 (that is, however, mathematically estimated by the model) are omitted in Figure 1c. Although the compression of the monolayer in the precritical region is weak, it gives a noticeable change of the derivative dlnω/dlnΓ (which is negative [36]) with increasing Π, as shown in Figure 4b. The steepest slope of this dependency at pH 3 agrees with the highest relative compressibility K pH 3 * ≈ 8%, as compared to the cases of pH 7 (≈7%) and pH 5 (≈5%).
The model computations of the dependencies E0(Π) and E0(Γ) are shown in full length in Figure 5; note that for Π > Π*, Equation (15) applies instead of Equation (14). The initial parts of the precritical regions of the E0(Π) dependencies are linear [15,62] (R2 > 0.99) almost up to Π* for pH 5 and pH 7 but only up to Π ≈ 10 mN/m for pH 3. Obviously, the model predictions for E0 follow quite well the experimental data for the modulus E up to Π ≈ 18–19 mN/m. This means that the BLG monolayers exhibit a highly elastic behavior at the applied frequency of 0.1 Hz. The precritical regions of the E0(Γ) dependencies for the different pH values are shifted in the same order as in the equation of state Π(Γ), as follows from the theory. The data in Figure 2a and Figure 5 show a strong effect of pH on E0*, the values of which for each pH correspond to different Γ* and ω*, but to similar surface coverages of θ* = 0.94–0.95. Therefore, it follows from Equation (14) that this effect is accounted for by the interaction parameter a and the derivative dlnω/dlnΓ (Figure 4b). The observed pH-induced variations of the latter quantity reflect the intermolecular interactions and the resulting molecular packing as affected by the protein net charge [85,86].
Experimental and computed dependencies of the modulus E(c)f,g are presented in Figure 6. The precritical regions of the data sets at different pH are localized along the c-axis in the same way as in the isotherms of the surface pressure Π(c) and the surface excess Γ(c) (Figure 1) that follows from the theory.
Experimental and computed dependencies E(Π)f,g and E(Γ)f,g are shown individually for each pH in Figure 7, where the theoretical E0(Π) and E0(Γ) results from Figure 5 are included, also, for comparison purposes. For the precritical region, the calculations for E by Equation (13) were performed using a diffusion coefficient of Dintr = 1 × 10⁻¹⁰ m2/s (denoted intrinsic), which is a typical value for the diffusivity of BLG in aqueous bulk media and is seemingly only weakly dependent on pH [87,88,89]. For pH 5 and pH 7, the data for E overlap quite well with the corresponding data for E0 up to E0*, while, for pH 3, a small but noticeable deviation appears beyond surface pressure of about 10 mN/m.
As mentioned above, quantification of the deviation from a purely elastic behavior of a surface layer is conveniently given by the reduced modulus E/E0 (ideal elasticity at E/E0 = 1). Calculations for f = 0.1 Hz and Π* (for each pH) yielded values for E*/E0* of 0.99 (pH 7), 0.97 (pH 5) and 0.89 (pH 3); see also Figure S4a in the Supporting Information. The good agreement between theory and experiment with Dintr suggests that, apparently, protein diffusion dominates the surface pressure (stress) response of the weakly compressed monolayer to harmonic area oscillations (strain). The larger deviation from this behavior at pH 3 can be related to a high energy barrier to adsorption of positively charged proteins at the water/air interface, generated not solely by electrostatic interactions but also by repulsive dispersion interactions [71,72], as discussed in Section 3.1. Such high adsorption barrier seemingly interferes with the diffusion-controlled mechanism of the stress response, and the reduced modulus E*/E0* for BLG layers at pH 3 increases only when lower diffusion coefficients are assumed. Just for demonstration, we computed that the reduced modulus at pH 3 at the critical point increases to a value E*/E0* = 0.97 (as for pH 5) by using an “apparent” diffusion coefficient of Dapp = 6 × 10⁻¹² m2/s.

3.2. Postcritical Region of Monolayer

Let us now discuss the behavior of BLG layers in the intermediate range of protein concentrations (c*–cm2) up to the point of monolayer saturation (Πm2m2,ωm2). This region spans over a larger c-range as compared to the precritical region but includes only a small range of surface coverages from θ* ≈ 0.95 to θ→1. Hence, it is characterized by strong compression of the monolayer accompanied by a comparatively weak increase of Π (≈5 mN/m) (see, for instance, Figure 2). The relative compression at monolayer saturation, Km2, is much larger than K* (at θ*), also because of concomitant surface aggregation. Based on the values for ωm2, we obtained K m 2 pH 3 > K m 2 pH 7 > K m 2 pH 5 (for exact values, see Table 1). Since the values of ωm2 at monolayer saturation are virtually the same for pH 3 and pH 7 and only slightly higher for pH 5, the variations of the relative compression Km2 are determined by the origin ωΠ=0.1, i.e., by the pH-dependent degree of unfolding at near-zero compression.
As mentioned above, at pH 3, BLG attains its most flexible Q form, characterized by the lowest compressibility [78,79], whereas, at pH 5, the most compact molecular structure of BLG is attained (N form), characterized by the highest compressibility [78,79]. The latter is supposed to determine the lowest degree of unfolding at the interface, which subsequently results in the lowest values for ωΠ=0.1, ω*, K* and Km2. At pH 7, BLG approaches the Tanford transition (centered at pH 7.5), which is characterized by a loosening of the interior packing of BLG [78,79]. Such molecular structure should render the protein globules moderate propensity to unfolding upon adsorption, which, in turn, results in intermediate values for ωΠ=0.1, ω*, K* and Km2.
While, at pH 3, the highest net charge of BLG determines its lowest surface activity, the Π(c) and Γ(c) isotherms for pH 5 and pH 7 run through a crossover in the postcritical region. In the Γ(c) isotherms, this crossover occurs through a local overlap within the c-range between c pH 7 * (≈7 × 10⁻⁹ M) and ca. 1 × 10⁻⁷ M (including c pH 5 * ), whereas a sharp crossover of the Π(c) isotherms is observed. According to Equation (9), the observed steeper increase of Π > Π* for pH 5 at similar adsorptions is a result of the lower value for na (the effect of na on Π > Π* is illustrated in Figure S2g in the Supporting Information). Such behavior does not seem trivial, and, at the moment, we cannot provide a satisfactory explanation. A lower aggregation number for pH 5 is counterintuitive, because of the fact that proteins become more prone to aggregation when approaching pI. The most plausible reason behind this, at a first glance, paradox adsorption behavior, should be the entirely dimeric form of BLG in the bulk at pH 5 [90,91], while, for pH 7, the dimer fraction at 1 × 10⁻⁷ M can be estimated, as in the order of 10% [92] (at c m 2 pH 3 , the dimer fraction is < 5% [93]). Protein monomer/oligomer forms are not recognizable by the theory, and we stress here that the presented model computations are based on the molecular weight of a BLG monomeric unit. Further analysis is required to discover approaches for accounting bulk monomer/oligomer effects on the model’s performance, and such tests are currently running.
The increased monolayer compression in the considered region leads to a significant strengthening of the cohesive intermolecular interactions and to the formation of a strong protein network at the interface. This, in turn, enhances the elastic behavior of the monolayer, and the limiting elasticity E0 increases linearly with Π and Γ (Figure 5) in accordance with Equations (9) and (15). The good quality of the fits for the E(Π)f,g and E(Γ)f,g dependencies at Π > Π* (see Figure 7) was achieved only by using much lower diffusion coefficients (see Table 2) than the intrinsic bulk diffusivity of BLG. These “apparent” diffusion coefficients, Dapp, reveal that the compressed BLG monolayers behave essentially as insoluble surface layers, where desorption is negligible [94,95]. However, the degree of reversibility of protein adsorption is dependent on Π [94,95], as also evidenced by the results and discussions in Section 3.1, where the diffusion-controlled mechanism seems to dominate the stress response of weakly compressed BLG monolayers (Π < Π*). At higher monolayer compressions, the strong protein network generates a high Gibbs free energy barrier to desorption [95]. However, it is evident in Figure 7 that the reduced modulus E/E0 start to noticeably decrease before monolayer saturation at Πm2 and Γm2, which suggests higher extent of energy dissipation for the strongly compressed monolayers, apparently due to in-plane (nondiffusional) relaxation processes that become detectable at the used frequency of 0.1 Hz. At this frequency, increase of the strain (oscillation) amplitude above gtr (3–4%) leads to significant decrease of the modulus E (with about 40% at g = 20%), accompanied by increase of the viscous contribution E” (Figure S1 in the Supporting Information). Theoretical description of the effect of the dilational strain on the viscoelasticity of protein layers was attempted in [33].

3.3. Formation of a Secondary Layer

Once a BLG monolayer reaches the maximum compression Km2 (θ→1), the observed further increase of the adsorption goes on through accumulation of protein material (presumably by hydrophobic interactions) as a discrete secondary sublayer adjacent to the primary monolayer [24]. The onset of this process is detected by the model as a splitting point between the m1- and m2-fits for the relevant dependencies. The coordinates of such splitting points in those dependencies are dictated by the characteristic molar area ωm2 at monolayer saturation, as defined in the beginning of Section 3. For the different pH values studied here, we obtained ω m 2 pH 3 ω m 2 pH 7 < ω m 2 pH 5 (see Table 1), which give the following “equivalent hard-core” radii: R ehc , Π = 0.1 pH 3 R ehc , Π = 0.1 pH 7 ≈ 2.6 nm and R ehc , Π = 0.1 pH 5 ≈ 2.7 nm. From these values, one gets the thicknesses of the monolayers saturated by oblate ellipsoids as ≈1.6 nm and ≈1.5 nm, respectively, the values of which are in very good agreement with previous neutron reflectometry results [24,82,83,84].
The slightly higher value for ω m 2 pH 5 is somehow surprising. However, the monolayers thicknesses suggest that adsorbing dimers either align in side-on stretched configurations at the interface or disintegrate into monomers (which also stretch) upon adsorption. The latter scenario seems probable, having in mind that the affinity of the BLG monomer to the water/air interface was found higher than that of the dimer [49,96]. Moreover, the pH-dependent dissociation constants of BLG dimers were found to decrease when approaching the isoelectric point [97], i.e., the dimer becomes more stable and eventually less prone to dissociate upon adsorption at an interface. It is possible that, under saturation conditions at c m 2 pH 5 ≈ 3 × 10⁻⁷ M, the monolayer has gained some degree of heterogeneity near the onset of a secondary layer formation. The reasons for such disruption in the homogeneous 2-d monolayer’s architecture could be either nonperfect alignment of the adsorbed BLG entities (monomers, dimers or mixtures of them) or effects by newly arriving dimers (prolate ellipsoids [81]), which might be not able to get incorporated into the compressed monolayer but may only partially penetrate it, leading this way to a “pseudo saturation.” On the other hand, the monolayers at pH 3 and pH 7 exhibit similar adsorption behaviors, although the dimer fraction at c m 2 pH 7 (ca. 65% [92]) is much higher than that at c m 2 pH 3 (<5% [93]). There seems to be some small mismatch between theory and experiment, since neutron reflectometry measurements at c = 1 × 10⁻⁵ M (pH 7) revealed a monolayer surface structure [24], whereas the present computations revealed c m 2 pH 7 ≈ 5 × 10⁻⁶ M, a concentration which, is after all, only twice lower. For pH 3, the model predictions revealed c m 2 pH 3 ≈ 3 × 10⁻⁵ M, which agrees with the experimental results [24].
The propensity of BLG to build up a (heterogeneous) bilayer structure at the water/air interface is quantified by the adsorption constant b2 of the secondary layer, which increases in the order pH 3 > pH 7 > pH 5 as it becomes extremely high at pH 5 (see Table 1). The physics behind this behavior can be explained in analogy to conventional adsorption to interfaces, but, in this case, the protein molecules adsorb on a proteinaceous surface instead of a liquid interface. At pH 3 and pH 7, the plane of the primary BLG monolayer is charged [40], which gives rise to an electrostatic barrier for further adsorption of molecules of the same type. Such adsorption barrier should be highest at pH 3, where the electric field at the interface is the strongest [40], and, accordingly, it is negligible at pH 5.
The experimental and the theoretical dependencies E(c)f,g, E(Π)f,g and E(Γ)f,g for pH 3 and pH 7 in Figure 5, Figure 6 and Figure 7 show a relatively shallow but noticeable local maximum, which appears merely at cm2, Πm2 ≈ 20 mN/m and Γm2 ≈ 1.5 mg/m2, respectively, and corresponds to the splitting point of the m1- and m2-fits. We should mention here that, for both pH values, slightly higher apparent diffusion coefficients Dapp were used in the m2-fits than in the m1-fits (see Table 2). The experimental data beyond the maximum of E are well described only by m2-fits (Figure 5, Figure 6 and Figure 7). The slight decrease of E after the maximum suggests that the secondary layer somehow disrupts the elastic behavior of the primary monolayer, most probably because of loosening of the protein network due to disturbed lateral cohesion and/or of the appearance of relaxation processes originating from the looser structure of the secondary layer.
The situation at pH 5 is different, mostly due to the observed early splitting point of the m1- and m2-fits in Figure 5, Figure 6 and Figure 7, which occurs merely around c*, Π* and Γ*, respectively, i.e., well before the onset of secondary layer formation (cm2m2m2). For the m2-fit at pH 5, a broad plateau region is observed beyond the splitting point, as the model curves fall below the observed maximum of the experimental data (assigned to a saturated monolayer and well reflected by the m1-fit). For the following discussion, we recall previous data on the dynamic dilational modulus E(Π(t))f,g [44]. Those data were measured in the nonlinear viscoelasticity regime (g ≈ 7% > gtr) and, in Figure S5 in the Supporting Information, are shown new data measured in the linear viscoelasticity regime (g ≈ 2.7%). However, the results do not differ significantly, showing a local drop in the E(Π(t))f,g curves at higher BLG concentrations (ca. c > 5 × 10⁻⁷ M) that deviates from the master curve observed at lower concentrations. This behavior can be attributed to the appearance of a transient step in the formation of the BLG bilayer due to the fast adsorption of dimers [24]. On the other hand, the Π(Γ) equations of state obtained from both m1- and m2-fits (Figure 2) are practically equal. This shows that BLG monolayers possess similar adsorption behaviors but can differ in their rheological characteristics in the postcritical region, depending on the formation conditions: monolayers formed at lower BLG concentrations c (slower adsorption kinetics) are more elastic than monolayers formed at higher c (faster adsorption kinetics). To explain this finding, at the moment, we could only speculate that, in the first case, the adsorbing dimers have enough time to eventually disintegrate into monomers and well arrange at the interface, whereas, in the latter case, dimers do not disintegrate into monomers but only arrange in side-on configuration at the interface. In both cases, it seems the monolayers’ thicknesses are comparable within the achievable neutron reflectometry measurement resolution of a few Å [24].

4. Conclusions

In this work, we applied an approach to compare a thermodynamic model simultaneously to the experimental isotherms of the surface pressure, Π(c), the surface excess, Γ(c), and the surface dilation viscoelasticity modulus, E(c)f,g, and, in turn, to the equation of state in terms of various dependencies of Π, E0 or Ef,g on Γ, ω or Π. Based on the obtained results we propose a scenario of the pH-dependent behavior of BLG adsorption layers at the water/air interface. Due to the fitting protocol of the model to all kinds of available experimental data sets, the resulting parameter values are most accurate.
The provided complex analysis provides a rich set of information, which is inaccessible by investigating only a limited number of protein bulk concentrations, as done in many studies. However, the lowest surface activity at pH 3 (compared to pH 5 and pH 7) is not a new finding [42,70]. We give here just a demonstrative example, by comparing the results for BLG at two arbitrary protein concentrations: c = 7 × 10⁻⁹ and 5 × 10⁻⁶ M. The first one is just the characteristic concentration cΠ = 0.1 at pH 3, but, at the same time, it is already the critical concentration c* at pH 7 ( Π pH 7 * = 15.1 mN/m). For pH 5 and pH 7, the adsorption Γ (at c = 7 × 10⁻⁹ M) is comparable, but Π and E are much lower for pH 5, and the yield strain gtr at the transition to a nonlinear viscoelasticity regime is apparently larger (see Figure S1 in the Supporting Information). The second concentration is assigned to the onset of double layer formation c m 2 pH 7 at pH 7, which is almost one order of magnitude lower than the one c m 2 pH 3 at pH 3; at the same time, a significant secondary layer is already accumulated at pH 5.
The theoretical results for the precritical region (c < c*) of a monolayer are in very good agreement with the experimental data. This made us confident to make adequate conclusions regarding the effect of pH on the behavior of weakly compressed BLG monolayers. The capacity of the model to account for the nonidealities of enthalpy and entropy via the interaction parameter a and a discrete spectrum of different protein adsorption states ωj, respectively, allowed for obtaining precise computations of the variation of the molar area ω with the compression of the monolayer. This, in turn, yielded the characteristic values ωΠ=0.1 and ω* at the onset of measurable surface pressure values (near-zero compression at the “gaseous” to “liquid expanded” phase transition) and at the critical surface pressure Π* (weak compression), respectively. We interpret these values in terms of unfolding of BLG globules upon adsorption and their flattening at the water/air interface [15,16,24,84]. The results revealed a decrease of ωΠ=0.1 and ω*, i.e., reduced propensity to interfacial unfolding in the order pH 3 > pH 7 > pH 5, which excellently correlates with the decrease of the molecular net charge in a linear fashion [66]. Such sequence can be related to pH-dependent (charge-dependent) features of the tertiary structure of BLG globules in solution—the globular structure is most flexible at pH 3, most rigid at pH 5 and moderately flexible at pH 7 (near the Tanford transition) [78,79]. The results also revealed that a lower degree of interfacial unfolding of BLG globules leads to a higher limiting elasticity E0 and, respectively, to a higher dilational viscoelasticity modulus E (see, for instance, Figure 5). At the same time, the reduced modulus E/E0 is relatively high, as estimated at the oscillation frequency of f = 0.1 Hz and by using a diffusion coefficient equal to the intrinsic bulk diffusivity of BLG in aqueous solutions. This suggests that, at the given frequency, apparently, protein diffusion dominates the highly elastic stress response of the weakly compressed monolayer to dilational strains in the linear viscoelasticity regime.
The following regions of strong compression (accompanied by surface aggregation) of the monolayer (c* < c < cm2), and of the development of a secondary layer (c > c m2) are described by a different theory for the equation of state, which is based on a semi-empirical relation (Equation (9)) [27]. In addition, to describe the adsorption behavior of the heterogeneous surface layer (buildup by a 2-D monolayer and a discrete secondary sublayer), the adsorption of the secondary layer is expressed by a fairly crude (Langmuir-type) approximation (Equation (10)) [20,55]. The application of the latter equation results in a quite good overlap of the model predictions and the experimental adsorption isotherm Γ(c). However, our approach to detect the onset of the secondary layer formation is based on the detection of the characteristic value Γm2 at the splitting point of the m1- and m2-fits; hence, a more realistic performance of the model in respect to the m2-fits requires a rigorous derivation of the total adsorption ΓΣ. Nevertheless, the obtained Γm2-values can be considered as relative, and they clearly reveal that the propensity of BLG to build up a heterogeneous (bilayer) surface layer structure increases with decrease of both the net charge and the surface unfolding ability of BLG. The need of further refinements of the model in respect to Equations (9) and (10) emerges from the observed significant discrepancy between theory and experiment in the bilayer region (c > cm2) of the surface pressure isotherm and the equation of state (e.g., Figure 1a, Figure 2, Figure 5, and Figure 6).

Supplementary Materials

The following are available online at https://0-www-mdpi-com.brum.beds.ac.uk/2504-5377/5/1/14/s1, Figure S1: Dilational rheology parameters: E (complex viscoelasticity modulus) and φ (phase angle), and the corresponding E” (imaginary part of E) as a function of the amplitude g of oscillating area deformation at various surface pressures Π and at constant oscillation frequency of f = 0.1 Hz; Figure S2: Exemplary screenshots of the interactive software for fitting the theoretical model to experimental data (pH 7). The symbols (○) are experimental data and the lines are best m2-fits; where the model predictions are presented by green and red lines, the colors indicate the pre-critical (green) and the post-critical (red) ranges divided by the critical parameters Π*, ω*, Γ* and E_0^*.; Figure S3. Model simulations of ω(Γ) dependencies by one-layer (m1) and two-layer (m2) fits. (top) The horizontal solid lines are the input (boundary) values for ω1 and ωn in the calculation procedure. The horizontal and vertical dotted lines indicate the critical points at coordinates (ω*,Γ*), and the splitting points at coordinates (ωm2,Γm2) at full saturation of the primary monolayer (θ→1). (bottom) a zoom-in portion of the ω(Γ) dependencies illustrating the determination of Γm2; ω0 ≈ 0.33 nm2 is the area increment used in the calculation procedures for all pH values; Figure S4. Computed values for the (a) (E/E0)(f), and (b) E“(f) dependencies for three surface pressures in the pre-critical region including Π*. Symbols in (b) are experimental data at few surface pressures Π ¬< Π*. Asterisks denote values at Π*; Figure S5. Experimental (symbols) and computed (lines) dependencies of the dilational complex viscoelasticity modulus E(Π)f,g, f = 0.1 Hz, g ≈ 2.7 %; the computed dependency of the limiting elasticity E0(Π) is also given for comparison.

Author Contributions

Conceptualization, G.G.G. and R.M.; methodology, G.G.G., E.V.A., V.B.F. and R.M.; software, G.G.G., E.V.A. and V.B.F.; investigation, G.G.G.; writing—original draft preparation, G.G.G.; writing—review and editing, G.G.G., V.I.K., E.V.A., V.B.F. and R.M.; visualization, G.G.G.; funding acquisition, R.M. All authors have read and agreed to the published version of the manuscript.

Funding

This work was financially supported by a DFG-AiF cluster project on “Protein Foams” Mi418/20-1 (DFG-199448917).

Data Availability Statement

Not applicable.

Acknowledgments

We sincerely thank Inga Retzlaff for the acquisition of some parts of the experimental data.

Conflicts of Interest

The authors declare no conflict of interests.

References

  1. Vincent, B. Early (pre-DLVO) studies of particle aggregation. Adv. Colloid Interface Sci. 2012, 170, 56–67. [Google Scholar] [CrossRef]
  2. Gochev, G.; Platikanov, D.; Miller, R. Chronicles of foam films. Adv. Colloid Interface Sci. 2016, 233, 115–125. [Google Scholar] [CrossRef]
  3. Fainerman, V.B.; Lucassen-Reynders, E.H. Adsorption of single and mixed ionic surfactants at fluid interfaces. Adv. Colloid Interface Sci. 2002, 96, 295–323. [Google Scholar] [CrossRef]
  4. Ivanov, I.B.; Ananthapadmanabhan, K.P.; Lips, A. Adsorption and structure of the adsorbed layer of ionic surfactants. Adv. Colloid Interface Sci. 2006, 123–126, 189–212. [Google Scholar] [CrossRef]
  5. Liggieri, L.; Mileva, E.; Miller, R. The surface layer as the basis for foam formation and stability. In Foam Films and Foams: Fundamentals and Applications; Exerowa, D., Gochev, G., Platikanov, D., Liggieri, L., Miller, R., Eds.; CRC Press: Boca Raton, FL, USA, 2018; Chapter 1. [Google Scholar]
  6. de Gennes, P.G. Polymers at an interface; a simplified view. Adv. Colloid Interface Sci. 1987, 27, 189–209. [Google Scholar] [CrossRef]
  7. Fleer, G.J.; Cohen Stuart, M.A.; Scheutjens, J.M.H.M.; Cosgrove, T.; Vincent, B. Polymers Interfaces; Chapman and Hall: London, UK, 1993. [Google Scholar]
  8. Lyklema, J. Adsorption of polymers and polyelectrolytes. In Fundamentals of Colloid and Interface Science; Lyklema, J., Ed.; Academic Press: London, UK, 1995; Volume 2, Chapter 5. [Google Scholar]
  9. Benjamins, J.; de Feijter, J.A.; Evans, M.T.A.; Graham, D.E.; Phillips, M.C. Dynamic and static properties of proteins adsorbed at the air/water interface. Faraday Discuss. Chem. Soc. 1975, 59, 218–229. [Google Scholar] [CrossRef] [PubMed]
  10. Graham, D.E.; Phillips, M.C. Proteins at Liquid Interfaces II. Adsorption Isotherms. J. Colloid Interface Sci. 1979, 70, 415–426. [Google Scholar] [CrossRef]
  11. Douillard, R.; Lefebvre, J.; Tran, V. Applicability of Gibbs’ law to protein adsorption isotherms. Colloids Surfaces A 1993, 78, 109–113. [Google Scholar] [CrossRef]
  12. Lucassen-Reynders, E.H. Competitive adsorption of emulsifiers 1. Theory for adsorption of small and large molecules. Colloids Surf. A 1994, 91, 79–88. [Google Scholar] [CrossRef]
  13. Damodaran, D.; Razumovsky, L. Role of surface area-to-volume ratio in protein adsorption at the air–water interface. Surf. Sci. 2008, 602, 307–315. [Google Scholar] [CrossRef]
  14. Ter-Minassian-Saraga, L. Protein denaturation on adsorption and water activity at interfaces: An analysis and suggestion. J. Colloid Interface Sci. 1981, 80, 393–401. [Google Scholar] [CrossRef]
  15. Joos, P. Approach for an equation of state for adsorbed protein surfaces. Biochim. Biophys. Acta Biomembr. 1975, 375, 1–9. [Google Scholar] [CrossRef]
  16. Uraizee, F.; Narsimhan, N. A Surface Equation of State for Globular Proteins at the Air-Water Interface. J. Colloid Interface Sci. 1991, 146, 169–178. [Google Scholar] [CrossRef]
  17. Douillard, R.; Daoud, M.; Aguié-Béghin, V. Polymer thermodynamics of adsorbed protein layers. Curr. Opin. Colloid Interface Sci. 2003, 8, 380–386. [Google Scholar] [CrossRef]
  18. Frumkin, A. Die Kapillarkurve der höheren Fettsäuren und die Zustandsgleichung der Oberflächenschicht (translated by authors: The capillary curve of long-chain fatty acids and the equation of state of the surface layer). Z. Physik. Chem. (Leipzig) 1925, 116, 466–484. [Google Scholar]
  19. Joos, P.; Serrien, G. The principle of Braun-Le Châtelier at surfaces. J. Colloid Interface Sci. 1991, 145, 291–294. [Google Scholar] [CrossRef]
  20. Fainerman, V.B.; Lucassen-Reynders, E.H.; Miller, R. Description of the adsorption behaviour of proteins at water/fluid interfaces in the framework of a two-dimensional solution model. Adv. Colloid Interface Sci. 2003, 106, 237–259. [Google Scholar] [CrossRef]
  21. Fainerman, V.B.; Miller, R. Equilibrium and Dynamic Characteristics of Protein Adsorption Layers at Gas–Liquid Interfaces: Theoretical and Experimental Data. Colloid J. 2005, 67, 393–404. [Google Scholar] [CrossRef]
  22. Grigoriev, D.O.; Fainerman, V.B.; Makievski, A.V.; Krägel, J.; Wüstneck, R.; Miller, R. β-Casein bilayer adsorption at the solution/air interface: Experimental evidences and theoretical description. J. Colloid Interface Sci. 2002, 253, 257–264. [Google Scholar] [CrossRef]
  23. Holt, S.A.; McGillivray, D.J.; Poon, S.; White, J.W. Protein deformation and surfactancy at an interface. J. Phys. Chem. B 2000, 104, 7431–7438. [Google Scholar] [CrossRef]
  24. Gochev, G.; Scoppola, E.; Campbell, R.; Noskov, B.A.; Miller, R.; Schneck, E. β-Lactoglobulin Adsorption Layers at the Water/Air Surface: 3. Neutron Reflectivity Study on the Effect of pH. J. Phys. Chem. B 2019, 123, 10877–10889. [Google Scholar] [CrossRef]
  25. Miller, R.; Fainerman, V.B.; Makievski, A.V.; Krägel, J.; Grigoriev, D.O.; Kazakov, V.N.; Sinyachenko, O.V. Dynamics of protein and mixed protein/surfactant adsorption layers at the water/fluid interface. Adv. Colloid Interface Sci. 2000, 86, 39–82. [Google Scholar] [CrossRef]
  26. Miller, R.; Fainerman, V.B.; Makievski, A.V.; Leser, M.; Michel, M.; Aksenenko, E.V. Determination of protein adsorption by comparative drop and bubble profile analysis tensiometry. Colloids Surf. B 2004, 36, 123–126. [Google Scholar] [CrossRef] [PubMed]
  27. Wüstneck, R.; Fainerman, V.B.; Aksenenko, E.; Kotsmar, C.; Pradines, V.; Krägel, J.; Miller, R. Surface dilatational behavior of β-casein at the solution/air interface at different pH values. Colloids Surf. A 2012, 404, 17–24. [Google Scholar] [CrossRef]
  28. Gochev, G.; Retzlaff, I.; Aksenenko, E.V.; Fainerman, V.B.; Miller, R. Adsorption isotherm and equation of state for β-Lactoglobulin layers at the air/water surface. Colloids Surf. A 2013, 422, 33–38. [Google Scholar] [CrossRef]
  29. Dan, A.; Wüstneck, R.; Krägel, J.; Aksenenko, E.V.; Fainerman, V.B.; Miller, R. Interfacial adsorption and rheological behavior of β-casein at the water/hexane interface at different pH. Food Hydrocoll. 2014, 34, 193–201. [Google Scholar] [CrossRef]
  30. Fainerman, V.B.; Aksenenko, E.V.; Krägel, J.; Miller, R. Thermodynamics, interfacial pressure isotherms and dilational rheology of mixed protein-surfactant adsorption layers. Adv. Colloid Interface Sci. 2016, 233, 200–222. [Google Scholar] [CrossRef]
  31. Won, J.Y.; Gochev, G.G.; Ulaganathan, V.; Krägel, J.; Aksenenko, E.V.; Fainerman, V.B.; Miller, R. Dilational visco-elasticity of BLG adsorption layers at the solution/tetradecane interface–Effect of pH and ionic strength. Colloids Surf. A 2017, 521, 204–210. [Google Scholar] [CrossRef]
  32. Fainerman, V.B.; Kovalchuk, V.I.; Aksenenko, E.V.; Zinkovych, I.I.; Makievski, A.V.; Nikolenko, M.V.; Miller, R. Dilational Viscoelasticity of Proteins Solutions in Dynamic Conditions. Langmuir 2018, 34, 6678–6686. [Google Scholar] [CrossRef]
  33. Kovalchuk, V.I.; Aksenenko, E.V.; Trukhin, D.V.; Makievski, A.V.; Fainerman, V.B.; Miller, R. Effect of amplitude on the surface dilational visco-elasticity of protein solutions. Colloids Interfaces 2018, 2, 57. [Google Scholar] [CrossRef] [Green Version]
  34. Miller, R.; Aksenenko, E.V.; Zinkovych, I.I.; Fainerman, V.B. Adsorption of proteins at the aqueous solution/alkane interface: Co-adsorption of protein and alkane. Adv. Colloid Interface Sci. 2015, 222, 509–516. [Google Scholar] [CrossRef] [PubMed]
  35. Dan, A.; Gochev, G.; Krägel, J.; Aksenenko, E.V.; Fainerman, V.B.; Miller, R. Interfacial rheology of mixed layers of food proteins and surfactants. Curr. Opin. Colloid Interface Sci. 2013, 18, 302–310. [Google Scholar] [CrossRef]
  36. Lucassen-Reynders, E.H.; Fainerman, V.B.; Miller, R. Surface Dilational Modulus or Gibbs’ Elasticity of Protein Adsorption Layers. J. Phys. Chem. B 2004, 108, 9173–9176. [Google Scholar] [CrossRef]
  37. Lucassen-Reynders, E.H.; Benjamins, J.; Fainerman, V.B. Dilational rheology of protein films adsorbed at fluid interfaces. Curr. Opin. Colloid Interface Sci. 2010, 15, 264–270. [Google Scholar] [CrossRef]
  38. Maldonado-Valderrama, J.; Miller, R.; Fainerman, V.B.; Wilde, P.J.; Morris, V.J. Effect of gastric conditions on β-lactoglobulin interfacial networks: Influence of the oil phase on protein structure. Langmuir 2010, 26, 15901–15908. [Google Scholar] [CrossRef] [PubMed]
  39. Alahverdjieva, V.S.; Grigoriev, D.O.; Ferri, J.K.; Fainerman, V.B.; Aksenenko, E.V.; Leser, M.; Michel, M.; Miller, R. Adsorption behaviour of hen egg-white lysozyme at the air/water interface. Colloids Surfaces A 2008, 323, 167–174. [Google Scholar] [CrossRef]
  40. Engelhardt, K.; Lexis, M.; Gochev, G.; Konnerth, C.; Miller, R.; Willenbacher, N.; Peukert, W.; Braunschweig, B. pH Effects on the Molecular Structure of β-Lactoglobulin Modified Air–Water Interfaces and Its Impact on Foam Rheology. Langmuir 2013, 29, 11646–11655. [Google Scholar] [CrossRef]
  41. Gochev, G.; Retzlaff, I.; Exerowa, D.; Miller, R. Electrostatic stabilization of foam films from β-lactoglobulin solutions. Colloids Surfaces A 2014, 460, 272–279. [Google Scholar] [CrossRef]
  42. Lech, F.J.; Delahaije, R.J.B.M.; Meinders, M.B.J.; Gruppen, H.; Wierenga, P.A. Identification of critical concentrations determining foam ability and stability of β-lactoglobulin. Food Hydrocoll. 2016, 57, 46–54. [Google Scholar] [CrossRef]
  43. Ulaganathan, V.; Retzlaff, I.; Won, J.; Gochev, G.; Gehin-Delval, C.; Leser, M.; Noskov, B.A.; Miller, R. β-Lactoglobulin adsorption layers at the water/air surface: 1. Adsorption kinetics and surface pressure isotherm: Effect of pH and ionic strength. Colloids Surf. A 2017, 519, 153–160. [Google Scholar] [CrossRef]
  44. Ulaganathan, V.; Retzlaff, I.; Won, J.; Gochev, G.; Gunes, D.; Gehin-Delval, C.; Leser, M.; Noskov, B.A.; Miller, R. β-Lactoglobulin adsorption layers at the water/air surface: 2. Dilational rheology: Effect of pH and ionic strength. Colloids Surf. A 2017, 521, 167–176. [Google Scholar] [CrossRef]
  45. Gochev, G.; Ulaganathan, V.; Retzlaff, I.; Gehin-Delval, C.; Gunez, D.Z.; Leser, M.E.; Kulozik, U.; Miller, R.; Braunschweig, B. β-Lactoglobulin adsorption layers at the water/air surface: 4. Impact on Stability of Foam Films and Foams. Minerals 2020, 10, 636. [Google Scholar] [CrossRef]
  46. Toro-Sierra, J.; Tolkach, A.; Kulozik, U. Fractionation of α-lactalbumin and β-lactoglobulin from whey protein isolate using selective thermal aggregation, an optimized membrane separation procedure and resolubilization techniques at pilot plant scale. Food Bioprocess Technol. 2013, 6, 1032–1043. [Google Scholar] [CrossRef]
  47. Clark, D.C.; Husband, F.; Wilde, P.; Cornec, M.; Miller, R.; Krägel, J.; Wüstneck, R.J. Evidence of extraneous surfactant adsorption altering adsorbed layer properties of β-lactoglobulin. Chem. Soc. Faraday Trans. 1995, 91, 1991–1996. [Google Scholar] [CrossRef]
  48. Javadi, A.; Mucic, N.; Karbaschi, M.; Won, J.Y.; Lotfi, M.; Dan, A.; Ulaganathan, V.; Gochev, G.; Makievski, A.V.; Kovalchuk, V.I.; et al. Characterization methods for liquid interfacial layers. Eur. Phys. J. Spec. Top. 2013, 222, 7–29. [Google Scholar] [CrossRef]
  49. Mackie, A.R.; Husband, F.A.; Holt, C.; Wilde, P.J. Adsorption of β-Lactoglobulin variants A and B to the air-water interface. Int. J. Food Sci. Technol. 1999, 34, 509–516. [Google Scholar] [CrossRef]
  50. Ridout, M.J.; Mackie, A.R.; Wilde, P.J. Rheology of Mixed β-Casein/β-Lactoglobulin Films at the Air-Water Interface. J. Agric. Food Chem. 2004, 52, 3930–3937. [Google Scholar] [CrossRef] [PubMed]
  51. Noskov, B.A. Protein conformational transitions at the liquid-Gas interface as studied by dilational surface rheology. Adv. Colloids Interface Sci. 2014, 206, 222–241. [Google Scholar] [CrossRef]
  52. Fainerman, V.B.; Miller, R. Equation of State for Concentrated Protein Surface Layers at the Water/Air Interface. Langmuir 1999, 15, 1812–1816. [Google Scholar] [CrossRef]
  53. Douillard, R.; Lefebvre, J. Adsorption of proteins at the gas-liquid interface: Models for concentration and pressure isotherms. J. Colloid Interface Sci. 1990, 139, 488–499. [Google Scholar] [CrossRef]
  54. Douillard, R.; Daoud, M.; Lefebvre, J.; Minier, C.; Lecannu, G.; Coutret, J. State equation of β-casein at the air/water interface. J. Colloid Interface Sci. 1994, 163, 277–288. [Google Scholar] [CrossRef]
  55. Miller, R.; Aksenenko, E.V.; Fainerman, V.B.; Pison, U. Kinetics of adsorption of globular proteins at liquid/fluid interfaces. Colloids Surf. A 2001, 183–185, 381–390. [Google Scholar] [CrossRef]
  56. Lucassen, J.; Hansen, R.S. Damping of Waves on Monolayer-Covered Surfaces. II. Influence of Bulk-to-Surface Diffusional Interchange on Ripple Characteristics. J. Colloid Interface Sci. 1967, 23, 319–328. [Google Scholar] [CrossRef]
  57. Lucassen, J.; van den Tempel, M. Dynamic measurements of dilational properties of a liquid interface. Chem. Eng. Sci. 1972, 27, 1283–1291. [Google Scholar] [CrossRef]
  58. Lucassen, J.; van den Tempel, M. Longitudinal waves on visco-elastic surfaces. J. Colloid Interface Sci. 1972, 41, 491–500. [Google Scholar] [CrossRef]
  59. Joos, P. Dynamic Surface Phenomena; VSP: Utrecht, The Netherlands, 1999. [Google Scholar]
  60. Fainerman, V.B.; Lylyk, S.V.; Aksenenko, E.V.; Makievski, A.V.; Ravera, F.; Petkov, J.T.; Yorke, J.; Miller, R. Adsorption layer characteristics of Tritons surfactants. 3. Dilational visco-elasticity. Colloids Surf. A 2009, 334, 16–21. [Google Scholar] [CrossRef]
  61. Lucassen, J. Dynamic dilational properties of composite surfaces. Colloids Surf. 1992, 65, 139–149. [Google Scholar] [CrossRef]
  62. Benjamins, J. Static and Dynamic Properties of Proteins Adsorbed at Liquid Interfaces. Ph.D. Thesis, Wageningen University, Wageningen, The Netherlands, 2000. [Google Scholar]
  63. MacRitchie, F.; Alexander, A.E. Kinetics of adsorption of proteins at interfaces, Part I, the role of bulk diffusion in adsorption. J. Colloid Interface Sci. 1963, 18, 453–457. [Google Scholar] [CrossRef]
  64. Narayanaswamy, N.; Ward, C.A. Area Occupied by a Water Molecule Adsorbed on Silica at 298 K: Zeta Adsorption Isotherm Approach. J. Phys. Chem. C 2020, 124, 9269–9280. [Google Scholar] [CrossRef]
  65. Song, K.B.; Damodaran, S. Influence of electrostatic forces on the adsorption of succinylated β-lactoglobulin at the air-water interface. Langmuir 1991, 72, 2737–2742. [Google Scholar] [CrossRef]
  66. Wierenga, P.A.; Meinders, M.B.J.; Egmond, M.R.; Voragen, A.G.J.; de Jongh, H.H.J. Quantitative description of the relation between protein net charge and protein adsorption to air-water interfaces. J. Phys. Chem. B 2005, 109, 16946–16952. [Google Scholar] [CrossRef]
  67. MacRitchie, F.; Alexander, A.E. Kinetics of adsorption of proteins at interfaces, Part III, the role of electrical barriers in adsorption. J. Colloid Interface Sci. 1963, 18, 464–469. [Google Scholar] [CrossRef]
  68. Shimuzu, M.; Saito, M.; Yamauchi, K. Emulsifying and structural properties of β-lactoglobulin at different pHs. Agric. Biol. Chem. 1985, 49, 189–194. [Google Scholar]
  69. Wierenga, P.A.; Meinders, M.B.J.; Egmond, M.R.; Voragen, F.A.G.J.; De Jongh, H.H.J. Protein exposed hydrophobicity reduces the kinetic barrier for adsorption of ovalbumin to the air-water interface. Langmuir 2003, 19, 8964–8970. [Google Scholar] [CrossRef]
  70. Jara, F.L.; Sánchez, C.C.; Patino, J.M.R.; Pilosof, A.M.R. Competitive adsorption behavior of α-lactoglobulin β -lactalbumin, bovin serum albumin in presence of hydroxypropylmethylcellulose. Influence of pH. Food Hydrocoll. 2014, 35, 189–197. [Google Scholar] [CrossRef]
  71. Sengupta, T.; Damodaran, S. Role of dispersion interactions in the adsorption of proteins at oil-water and air-water interfaces. Langmuir 1998, 14, 6457–6469. [Google Scholar] [CrossRef]
  72. Sengupta, T.; Razumovsky, L.; Damodaran, S. Energetics of protein-interface interactions and its effect on protein adsorption. Langmuir 1999, 15, 6991–7001. [Google Scholar] [CrossRef]
  73. Sundaram, S.; Ferry, J.K.; Vollhardt, D.; Stebe, K.J. Surface phase behavior and surface tension evolution for lysozyme adsorption onto clean interfaces and into DPPC monolayers: Theory and Experiment. Langmuir 1998, 14, 1208. [Google Scholar] [CrossRef]
  74. Erickson, J.; Sundaram, S.; Stebe, K.J. Surface pressure evolution of lysozyme solutions. Langmuir 2000, 16, 5072–5078. [Google Scholar] [CrossRef]
  75. Wierenga, P.A.; Gruppen, H. New views on foams from protein solutions. Curr. Opin. Colloid Interface Sci. 2010, 15, 365–373. [Google Scholar] [CrossRef]
  76. Ghosh, S.K.; Chaudhuri, S.; Roy, J.; Sinha, N.K.; Sen, A. Physicochemical investigations on buffalo β-lactoglobulin. Studies on sedimentation, diffusion, and hydrogen ion titration. Arch. Biochem. Biophys. 1971, 144, 6–15. [Google Scholar] [CrossRef]
  77. de Feijter, J.A.; Benjamins, J. Soft-particle model of compact macromolecules at interfaces. J. Colloid Interface Sci. 1982, 90, 289–293. [Google Scholar] [CrossRef]
  78. Timasheff, S.N.; Mescanti, L.; Basch, J.J.; Townend, R. Conformational transitions of bovine b-lactoglobulins A, B, and C. J. Biol. Chem. 1966, 241, 2496–2501. [Google Scholar] [CrossRef]
  79. Taulier, N.; Chalikian, T.V. Characterization of pH-induced transitions of β-lactoglobulin: Ultrasonic, densimetric, and spectroscopic studies. J. Mol. Biol. 2001, 314, 873–889. [Google Scholar] [CrossRef] [Green Version]
  80. Timasheff, S.N.; Townend, R. Structure of the β-Lactoglobulin tetramer. Nature 1964, 203, 517–519. [Google Scholar] [CrossRef]
  81. Vogtt, K.; Javid, N.; Alvarez, E.; Sefcik, J.; Bellissent-Funel, M.-C. Tracing nucleation pathways in protein aggregation by using small angle scattering methods. Soft Matter 2011, 7, 3906–3914. [Google Scholar] [CrossRef]
  82. Scheuble, N.; Lussi, M.; Geue, T.; Carrière, F.; Fischer, P. Blocking gastric lipase adsorption and displacement processes with viscoelastic biopolymer adsorption layers. Biomacromolecules 2016, 17, 3328–3337. [Google Scholar] [CrossRef]
  83. Bertsch, P.; Thoma, A.; Bergfreund, J.; Geue, T.; Fischer, P. Transient measurement and structure analysis of protein–polysaccharide multilayers at fluid interfaces. Soft Matter 2019, 15, 6362–6368. [Google Scholar] [CrossRef] [Green Version]
  84. Bergfreund, J.; Diener, M.; Geue, T.; Nussbaum, N.; Kummer, N.; Bertsch, P.; Nyström, G.; Fischer, P. Globular protein assembly and network formation at fluid interfaces: Effect of oil. Soft Matter 2021, 17, 1692–1700. [Google Scholar] [CrossRef] [PubMed]
  85. Schestkowa, H.; Wollborn, T.; Westphal, A.; Wagemans, A.M.; Fritsching, U.; Drusch, S. Conformational state and charge determine the interfacial stabilization process of beta-lactoglobulin at preoccupied interfaces. J. Colloid Interface Sci. 2019, 536, 300–309. [Google Scholar] [CrossRef]
  86. Kieserling, H.; Pankow, A.; Keppler, J.K.; Wagemans, A.M.; Drusch, S. Conformational state and charge determine the interfacial film formation and film stability of β-lactoglobulin. Food Hydrocoll. 2021, 114, 106561. [Google Scholar] [CrossRef]
  87. de la Torre, J.G.; Huertas, M.L.; Carrasco, B. Calculation of hydrodynamic properties of globular proteins from their atomic-level structure. Biophys. J. 2000, 78, 719–730. [Google Scholar] [CrossRef] [Green Version]
  88. Beretta, S.; Chirico, G.; Baldini, G. Short-range interactions of globular proteins at high ionic strengths. Macromolecules 2000, 33, 8663–8670. [Google Scholar] [CrossRef]
  89. Jung, D.M.; Ebeler, S.E. Investigation of Binding Behavior of α- and β-lonones to β-Lactoglobulin at different pH values using a diffusion-based NOE pumping technique. J. Agric. Food Chem. 2003, 51, 1988–1993. [Google Scholar] [CrossRef] [PubMed]
  90. Verheul, M.; Pedersen, J.S.; Roefs, S.P.F.M.; de Kruif, K.G. Association behavior of native β-lactoglobulin. Biopolymers 1999, 49, 11–20. [Google Scholar] [CrossRef]
  91. Gottschalk, M.; Nilsson, H.; Roos, H.; Halle, B. Protein self-association in solution: The bovine β-lactoglobulin dimer and octamer. Protein Sci. 2003, 12, 2404–2411. [Google Scholar] [CrossRef]
  92. Aymard, P.; Durand, D.; Nicolai, T. The effect of temperature and ionic strength on the dimerisation of β-lactoglobulin. Int. J. Biol. Macromol. 1996, 19, 213–221. [Google Scholar] [CrossRef]
  93. Sakai, K.; Sakurai, K.; Sakai, M.; Hoshino, M.; Goto, Y. Conformation and stability of thiol-modified bovine β-lactoglobulin. Prot. Sci. 2000, 9, 1719–1729. [Google Scholar]
  94. MacRitchie, F. Reversibility of protein adsorption. In Proteins at Liquid Interfaces, Volume 7 in: Studies in Interface Science; Möbius, D., Miller, R., Eds.; Elsevier: Amsterdam, The Netherlands, 1998; Chapter 4. [Google Scholar]
  95. Fainerman, V.B.; Miller, R.; Ferri, J.K.; Watzke, H.; Leser, M.E.; Michel, M. Reversibility and irreversibility of adsorption of surfactants and proteins at liquid interfaces. Adv. Colloid Interface Sci. 2006, 123–126, 163–171. [Google Scholar] [CrossRef]
  96. Perriman, A.W.; Henderson, M.J.; Holt, S.A.; White, J.W. Effect of the air-water interface on the stability of β-lactoglobulin. J. Phys. Chem. B 2007, 111, 13527–13537. [Google Scholar] [CrossRef]
  97. Mercadante, D.; Melton, L.D.; Norris, G.E.; Loo, T.S.; Williams, M.A.K.; Dobson, R.C.J.; Jameson, G.B. Bovine β-lactoglobulin is dimeric under imitative physiological conditions: Dissociation equilibrium and rate constants over the pH range of 2.5–7.5. Biophys. J. 2012, 103, 303–312. [Google Scholar] [CrossRef] [PubMed] [Green Version]
Figure 1. β-lactoglobulin (BLG) adsorption layers at the water/air interface at different bulk pH. (a) Surface pressure isotherms Π(c). (b) Adsorption isotherms Γ(c) (experimental data from [24]). (c) Protein concentration dependencies of the area per molecule ω(c) (experimental data from [24]); note that an ω(c) dependency describes only the primary monolayer, and it is independent of the formation of further sublayers (see details in the text). Symbols are experimental data (exp), and lines are best fits for one-layer (m1) and two-layer (m2) models; asterisks indicate Π*, Γ* and ω* at c*, and arrows in (c) indicate the onset of double layer formation at cm2.
Colloids 05 00014 g001
Figure 2. BLG adsorption layers at the water/air interface at different bulk pH. (a) Equations of state Π(Γ). (b) Π(ω) dependencies in analogy with the compression isotherms for spread layers. Asterisks indicate Π*, Γ* and ω*, and arrows indicate the onset of the secondary layer formation.
Colloids 05 00014 g002
Figure 3. BLG adsorption layers at the water/air interface at different bulk pH. Computed dependencies from m2-fits: (a) adsorption isotherm θ(c), according to Equations (1)–(7); (b) equation of state in terms of Π(θ) and E0(θ) for the precritical region, according to Equations (1)–(9); note the log-scale of the ordinate. Asterisks indicate c*, Π*, θ* and E0*; arrows in (a) indicate θΠ=0.1; inset in (b) is a zoomed-in segment of the E0(θ) graph; note the linear-scale of the ordinate.
Colloids 05 00014 g003
Figure 4. BLG adsorption layers at the water/air interface at different bulk pH. (a) lnω(lnΓ) dependencies; (symbols) experimental data [24], (lines) computations via Equations (1)–(10); asterisks indicate the critical points at coordinates (ω*,Γ*), arrows indicate Γm2, the double-line diagonal corresponds to θ = ωΓ = 1, i.e., full saturation of the primary monolayer. (b) Distribution of the derivative dlnω/dlnΓ over surface pressure; asterisks indicate Π*.
Colloids 05 00014 g004
Figure 5. BLG adsorption layers at the water/air interface at different bulk pH. Dependencies of the measured dilational complex viscoelasticity modulus E and the computed high-frequency limiting elasticity E0 on (a) surface pressure, E0(Π), E(Π)f,g, and (b) surface excess, E0(Γ), E(Γ)f,g; f = 0.1 Hz, g ≈ 2.7%. Symbols are experimental data for E (exp), lines are best fits for the two-layer (m2) model, asterisks indicate Π* and Γ*, arrows indicate the onset of secondary layer formation at Πm2 and Γm2.
Colloids 05 00014 g005
Figure 6. BLG adsorption layers at the water/air interface at different bulk pH. Protein concentration dependencies of the dilational complex viscoelasticity modulus, E(c)f,g; f = 0.1 Hz, g ≈ 2.7%. Symbols are experimental data (exp), lines are best fits for one-layer (m1) and two-layer (m2) models, asterisks indicate E* at c*, arrows indicate the onset of a secondary layer formation at cm2.
Colloids 05 00014 g006
Figure 7. BLG adsorption layers at the water/air interface at (a1,a2) pH 3, (b1,b2) pH 7 and (c1,c2) pH 5. Dependencies of the dilational complex viscoelasticity modulus E and the high-frequency limiting elasticity E0 on (a1,b1,c1) surface pressure, E0(Π) and E(Π)f,g and (a2,b2,c2) surface excess, E0(Γ) and E(Γ)f,g; f = 0.1 Hz, g ≈ 2.7%. Symbols are experimental data for E (exp), lines are best fits for one-layer (m1) and two-layer (m2) models (note the common legend for each row), asterisks indicate Π* and Γ*, arrows indicate the onset of secondary layer formation at Πm2 and Γm2, Dintr = 1×10⁻¹⁰ m2/s, Dapp is the apparent diffusion coefficient with values listed in Table 2.
Colloids 05 00014 g007
Table 1. Values for input model parameters used for obtaining the best fits to the experimental data at different pH. Values for some output parameters obtained from the best fits are also listed.
Model Parameters[unit]pH 7pH 3pH 5
Input parameters
Π* (Critical surface pressure)[mN/m]15.115.215.0
ω1 (Minimum molar area)
or (Area per molecule)
[m2/mol]
[nm2/molecule]
9.7 × 10⁶
16.1
8.4 × 10⁶
14.0
4.5 × 10⁶
7.5
ωn (Maximum molar area)
or (Area per molecule)
[m2/mol]
[nm2/molecule]
2.40 × 10⁷
39.8
2.95 × 10⁷
49.0
2.02 × 10⁷
33.5
ω0 (Area increment)
or (Area per increment)
[m2/mol]
[nm2/increment]
2 × 10⁵
0.33
2 × 10⁵
0.33
2 × 10⁵
0.33
bj (Local adsorption constant, monolayer)[m3/mol]24005027
α (Exponential coefficient)[-]
[-]
[-]
2.22.73.8
a (Frumkin interaction parameter)0.700.660.92
na (Aggregation number)11167
m (Number of layers)[-]121212
b2 (Adsorption constant, 2nd layer)[m3/mol]0300.6050
Output parameters a
n (Number of adsorbed states)[-]7210679
cΠ=0.1
c *
cm2
[M]
[M]
[M]
7 × 10⁻¹⁰
7 × 10⁻⁹
5 × 10⁻⁶
7 × 10⁻⁹
8 × 10⁻⁸
3 × 10⁻⁵
3 × 10⁻⁹
2 × 10⁻⁸
3 × 10⁻⁷
ΓΠ=0.1
Γ*
Γm2
[mg/m2]
[mg/m2]
[mg/m2]
0.42
0.97
0.31
0.80
0.69
1.09
1.50 b1.50 b1.35 b
ωΠ=0.1
ω*
ωm2
[nm2/molecule]
[nm2/molecule]
[nm2/molecule]
31.4
29.3
38.9
35.7
27.9
26.5
20.4 ± 0.2 b20.4 ± 0.2 b22.4 ± 0.2 b
θΠ=0.1
θ*
[-]
[-]
0.440.400.63
0.940.940.95
E0*[mN/m]
[mN/m]
[mN/m]
8776113
Πm2
E0,m2
202019.5
135144140
K* (Relative compression at ω*) c
Km2 (Relative compression at ωm2) c
[%]
[%]
7
35 d
8
48 d
5
20 d
a Subscripts: “Π=0.1” refers to values at the onset of measurable surface pressure, arbitrarily defined at Π = 0.1 mN/m [63]; “m2” refers to values at the onset of secondary layer formation (defined in the text). b Values and error by definition; see above in the text. c Kx (defined in the text) is the monolayer compression at a given molar area ωx relative to the origin ωΠ=0.1 at near-zero compression; ωxω* for K* and ωxωm2 for Km2. d Note that, in the postcritical region, compression is accompanied by surface aggregation.
Table 2. Values for the apparent diffusion coefficient, Dapp, used in the model calculations.
pH 7pH 3pH 5
m1m2m1m2m1m2
Dapp [m2/s]8.0 × 10−151.2 × 10−141.3 × 10−151.8 × 10−151.0 × 10−113.8 × 10⁻¹¹
Publisher’s Note: MDPI stays neutral with regard to jurisdictional claims in published maps and institutional affiliations.

