
Luminescence Sensitivity of Rhine Valley Loess: Indicators of Source Variability?

 , , , ,
Abstract
:1. Introduction
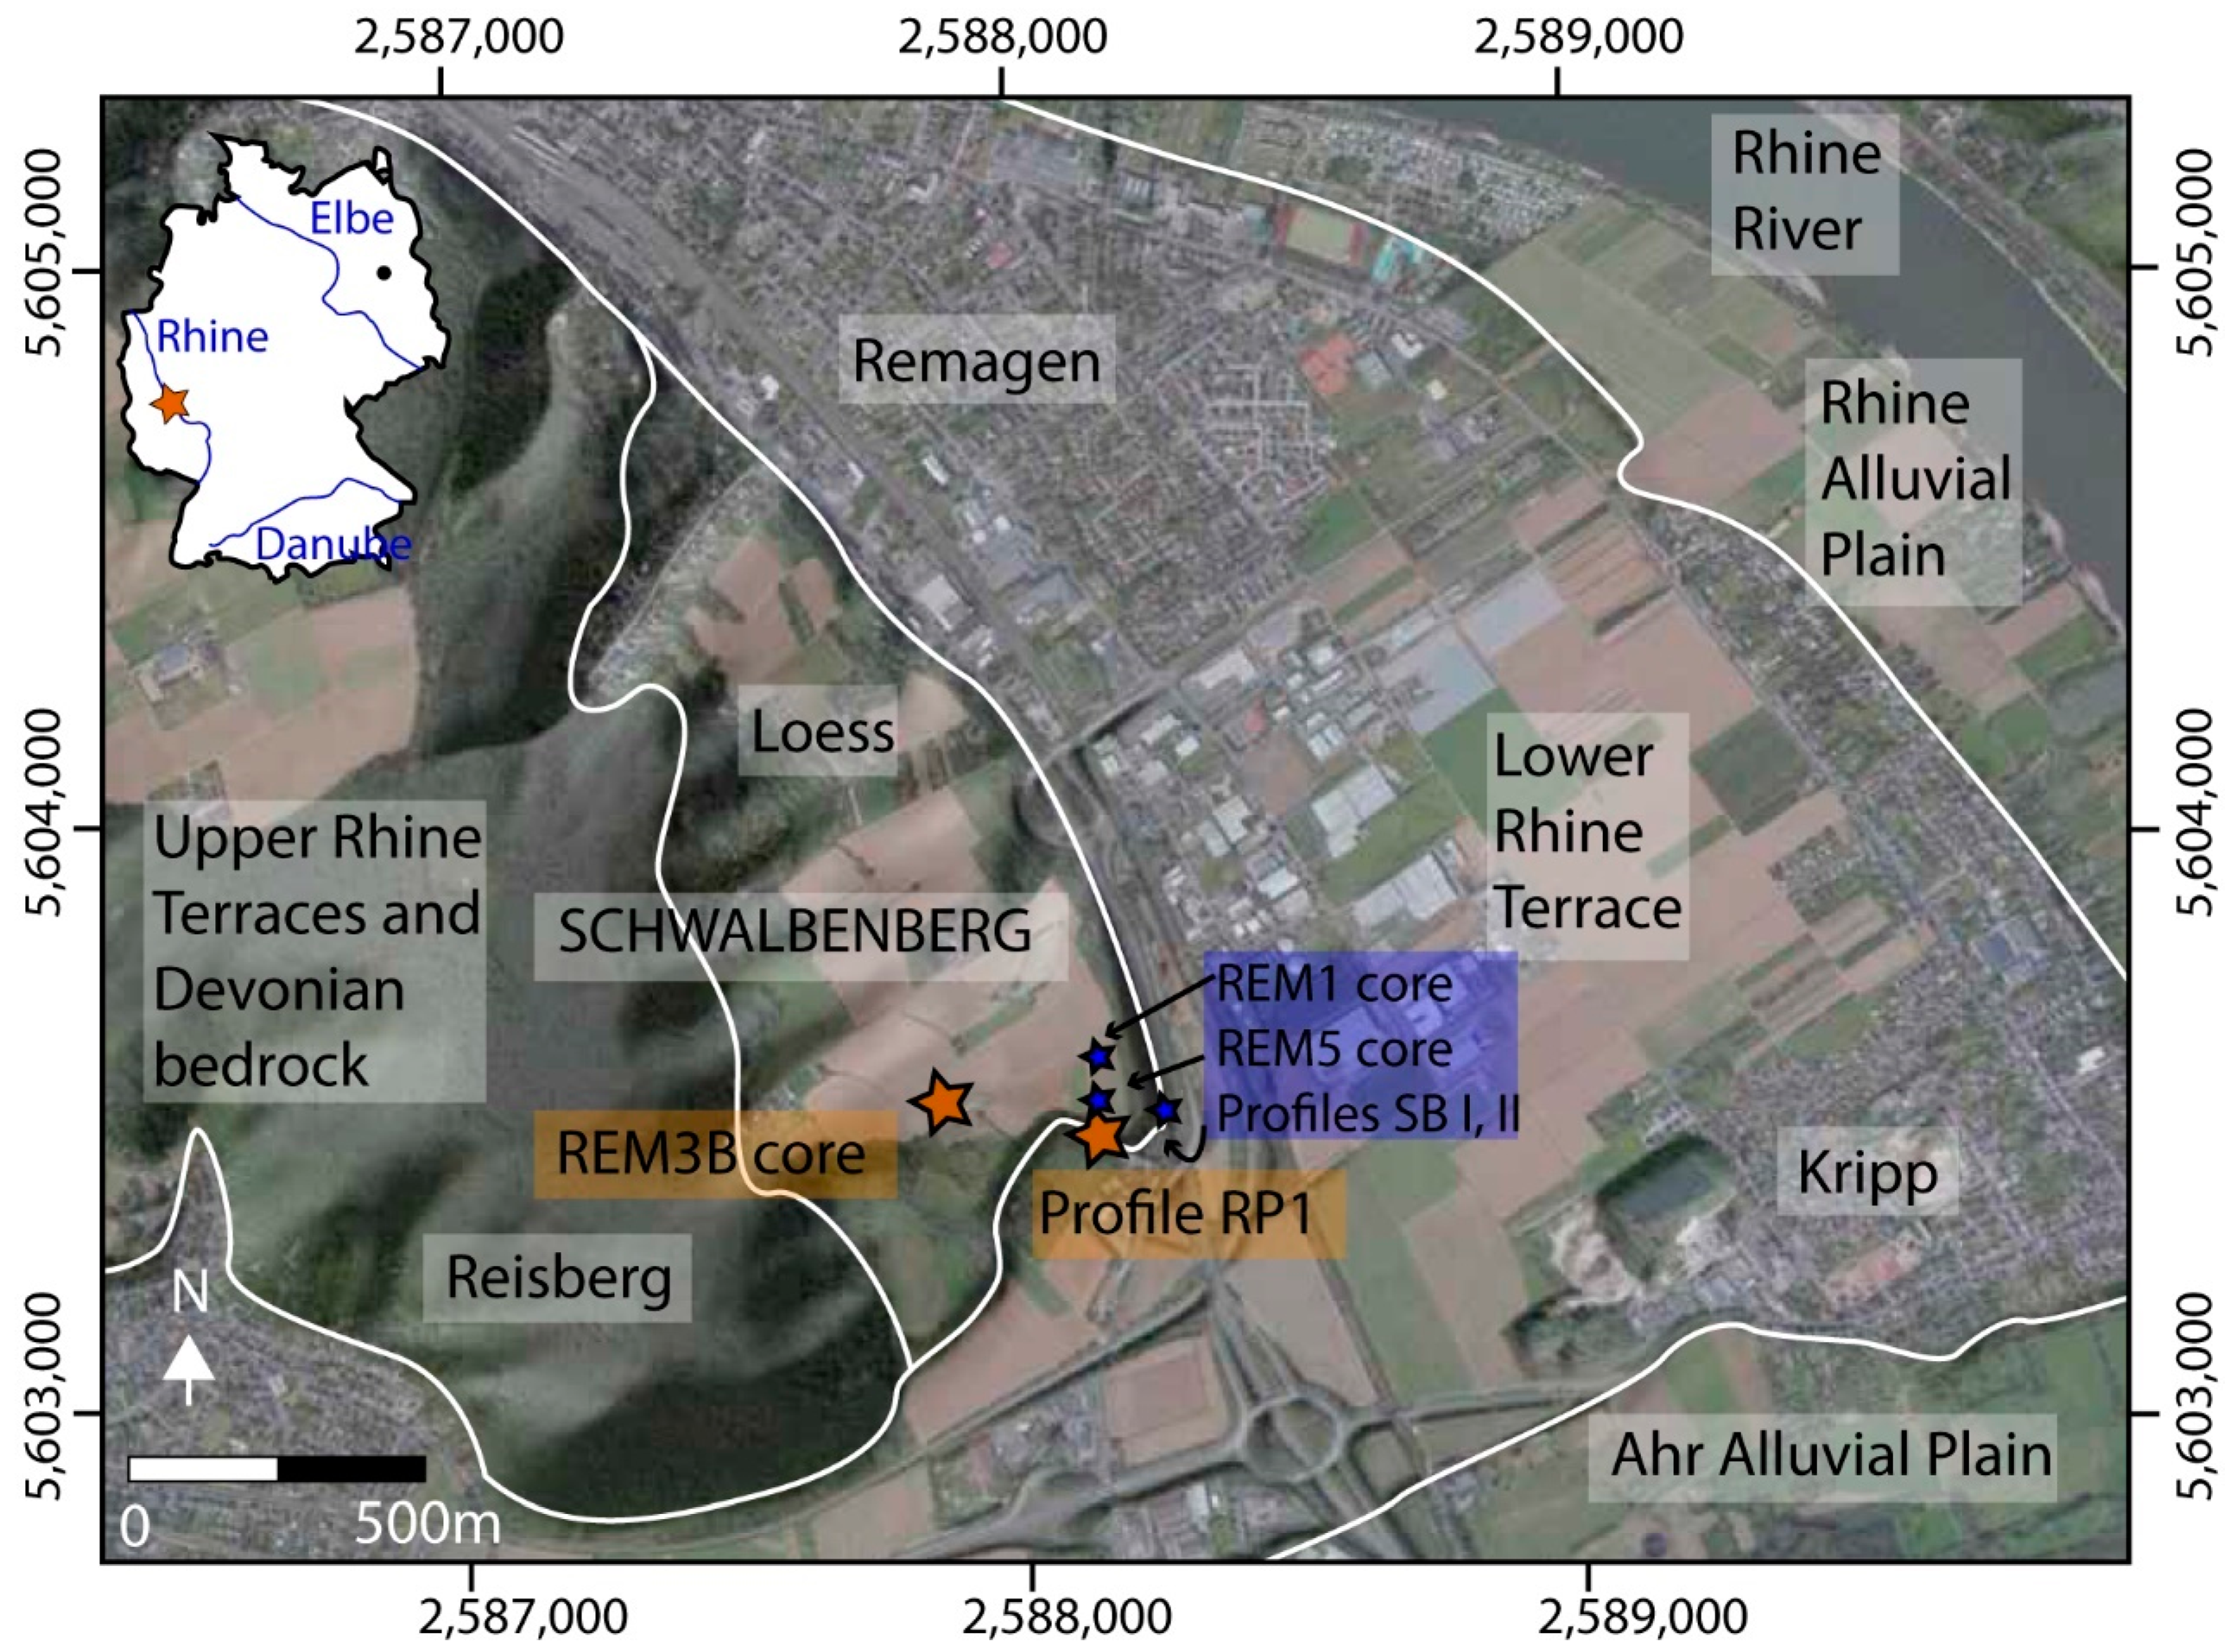
2. Regional Setting
3. Materials and Methods
3.1. Luminescence Measurements on the RP1 Profile
3.2. Luminescence Measurements on the REM3B Core
3.3. Statistical Analyses to Test Correlations between Luminescence Sensitivity and Other Proxy Data
4. Results
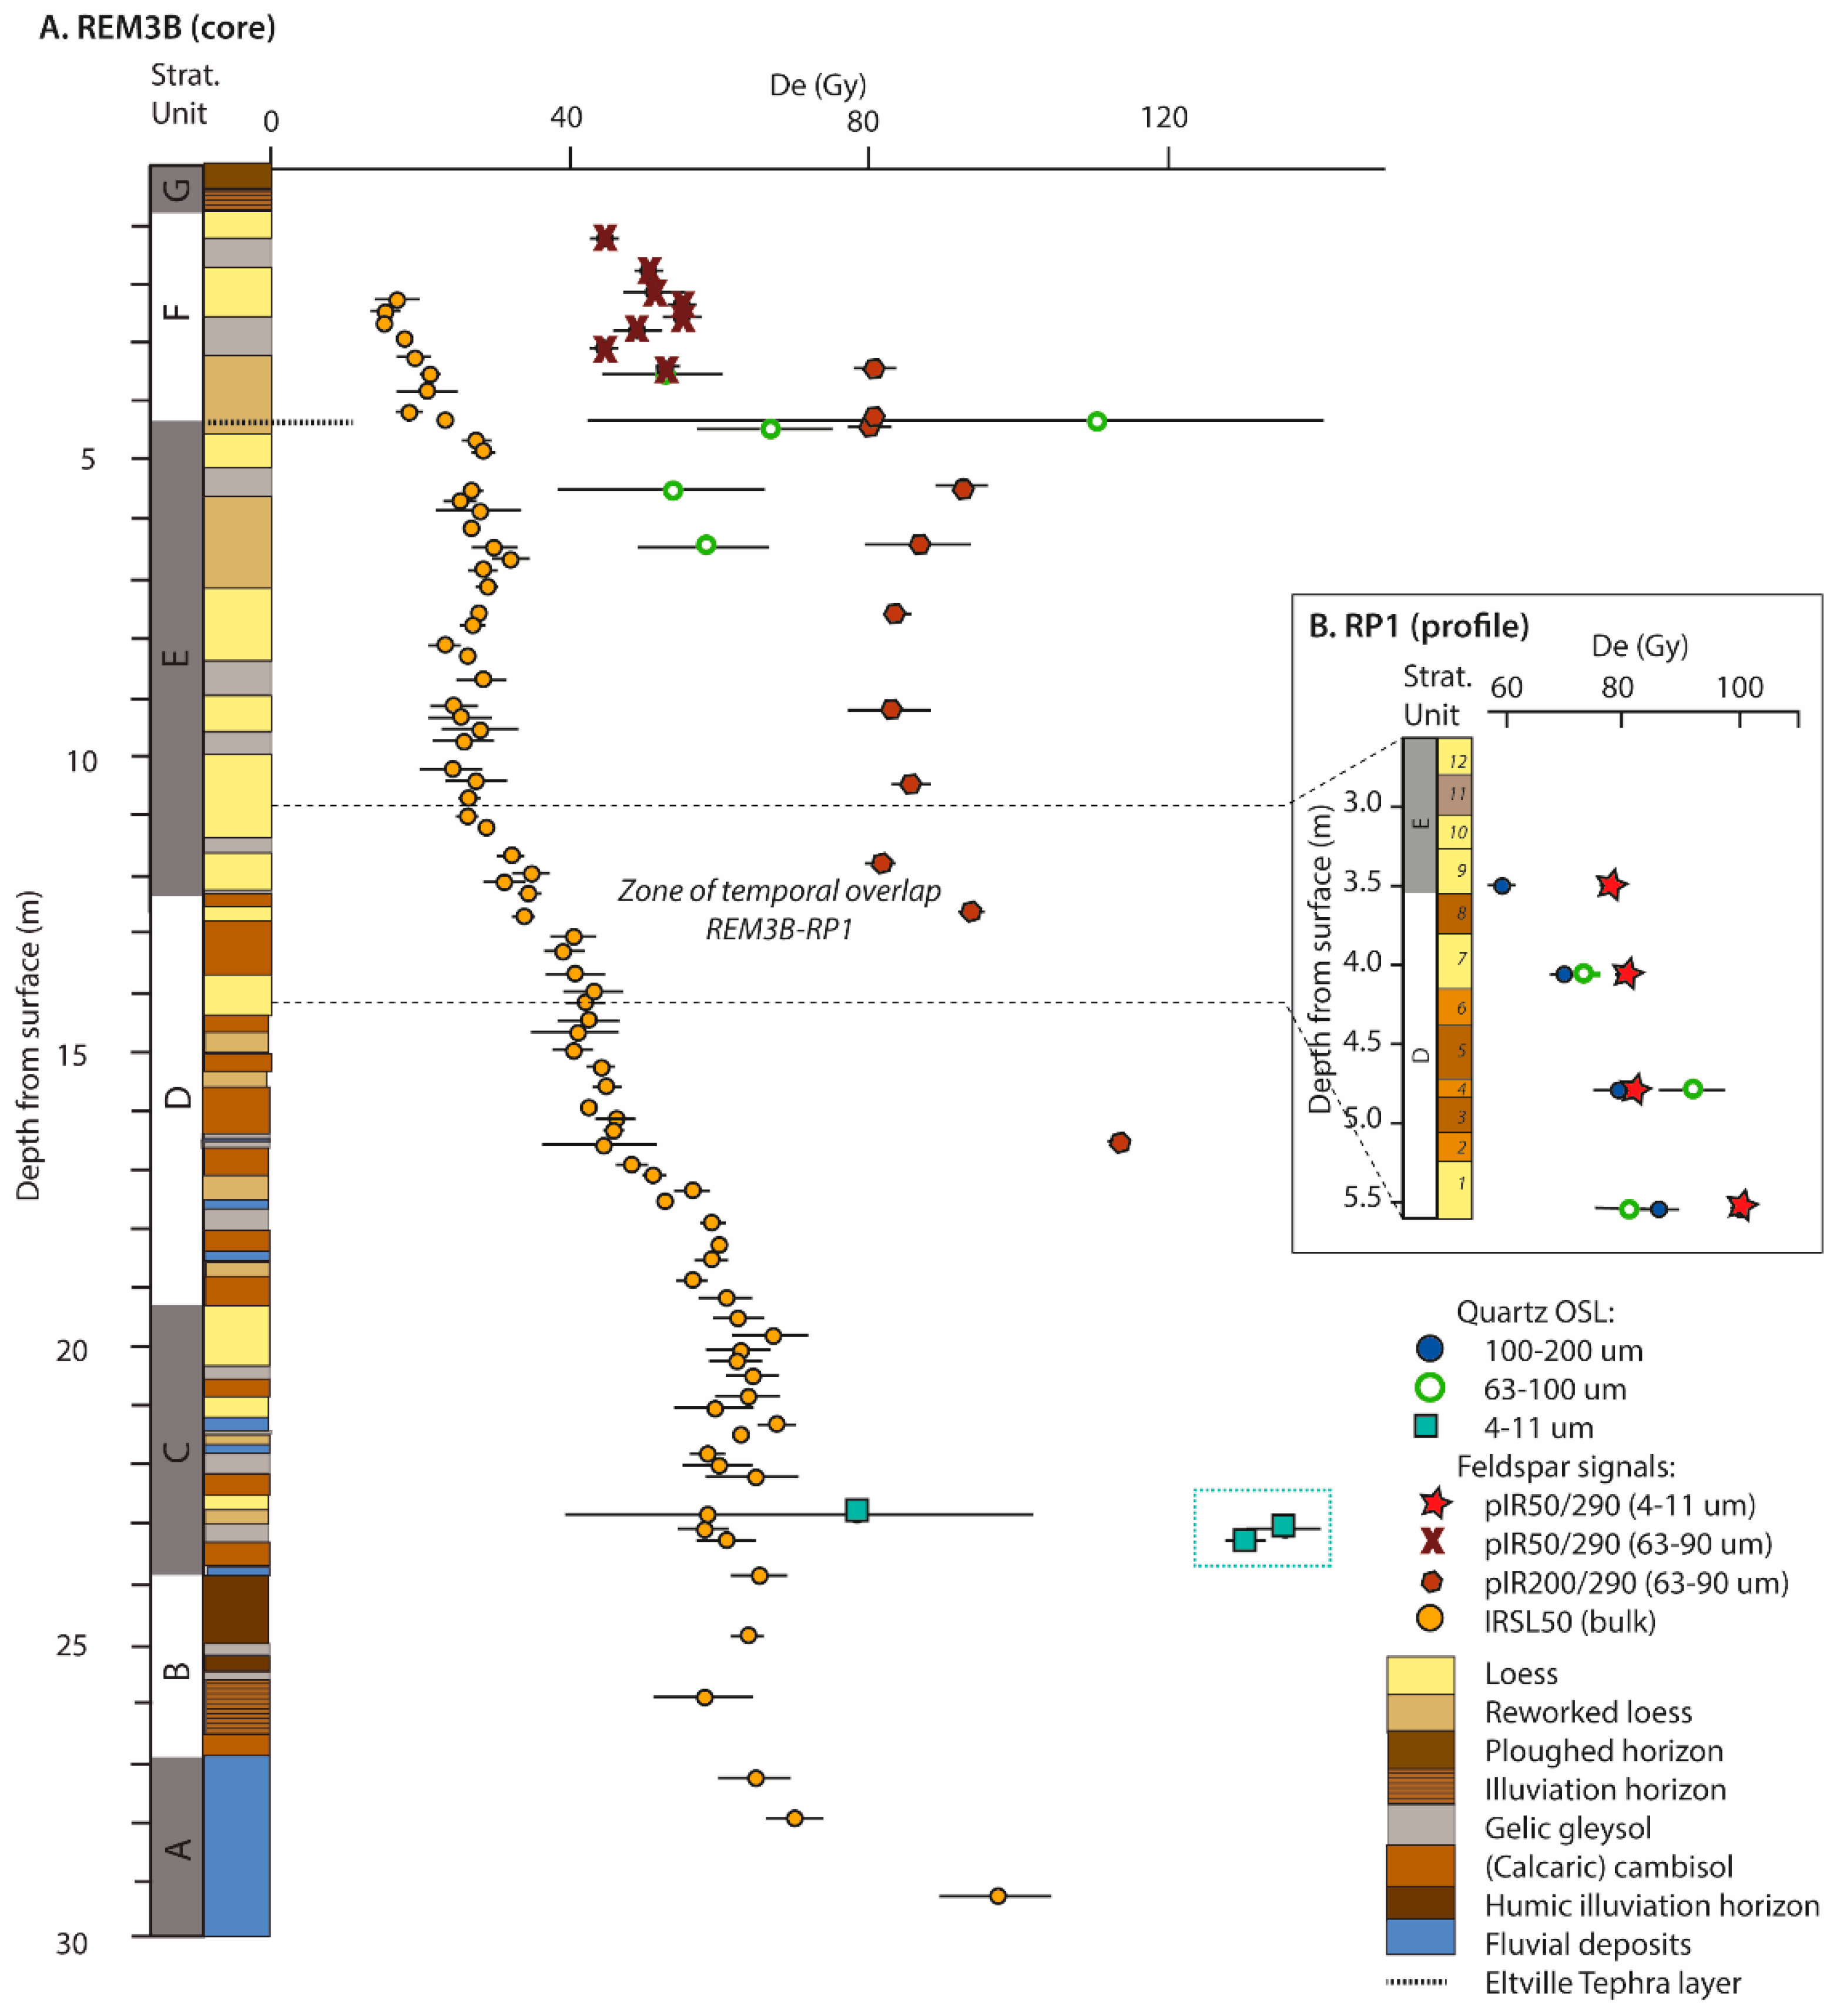
4.1. Equivalent Dose Measurements
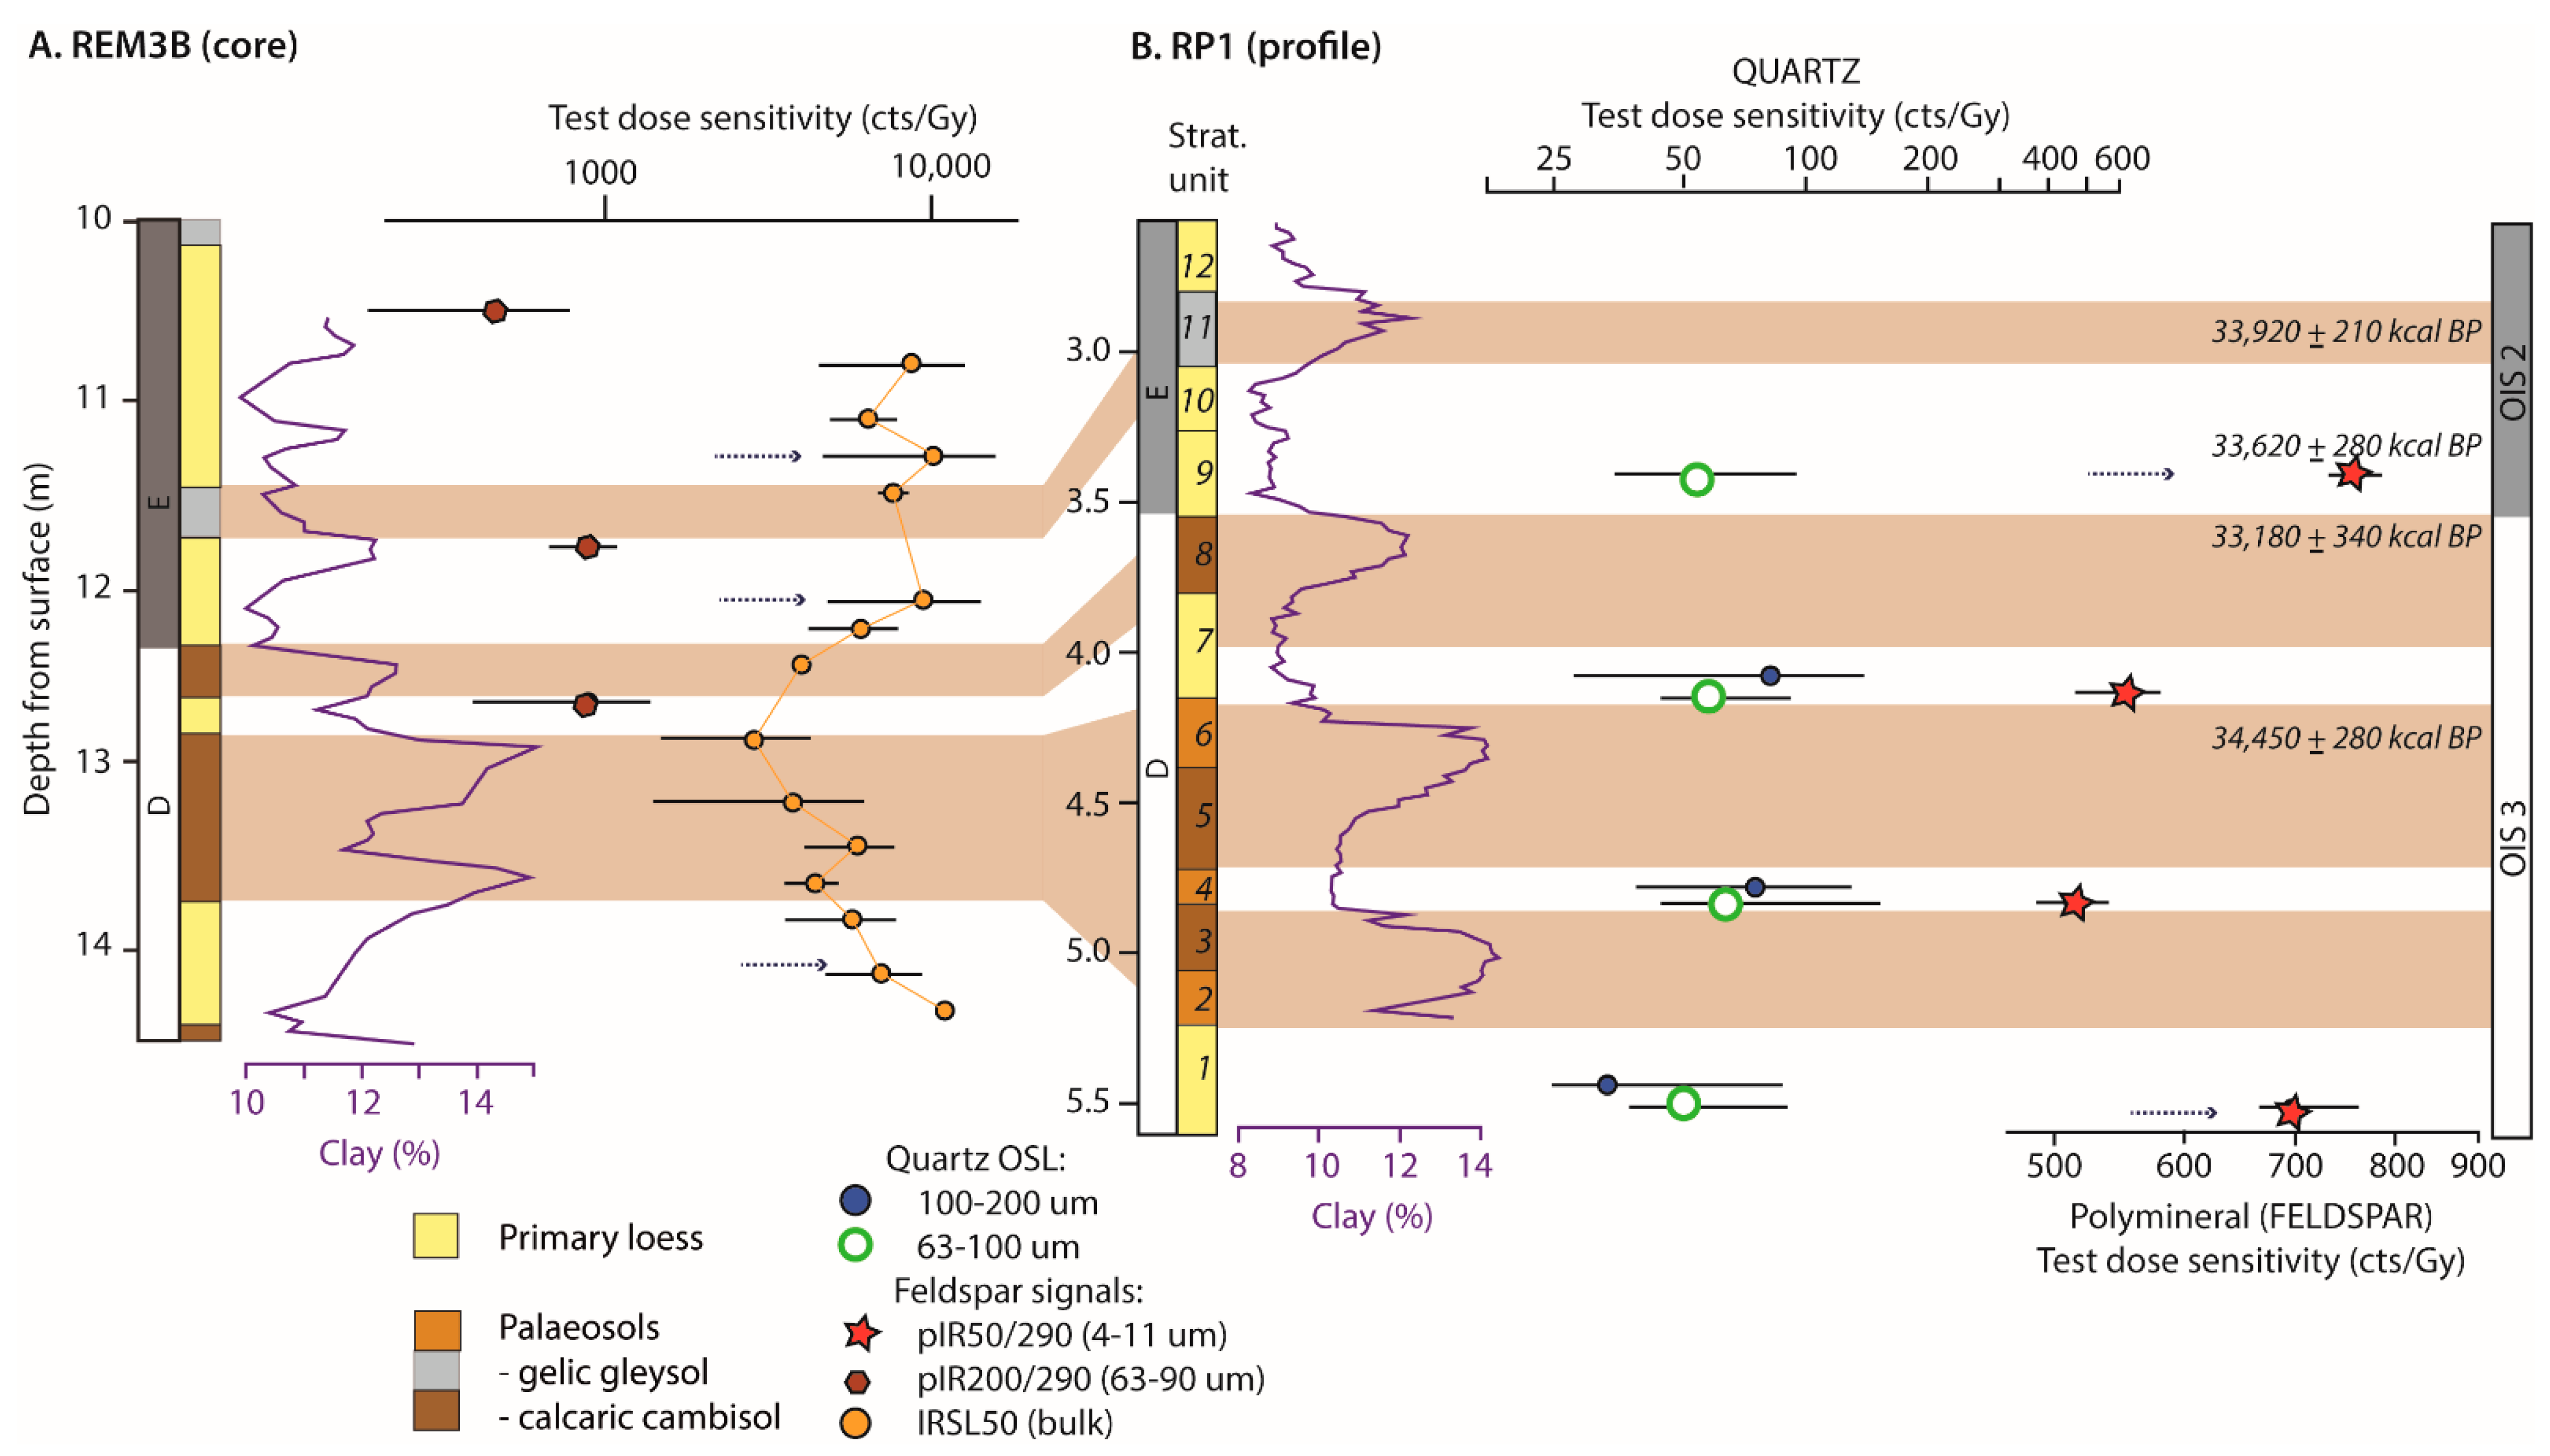
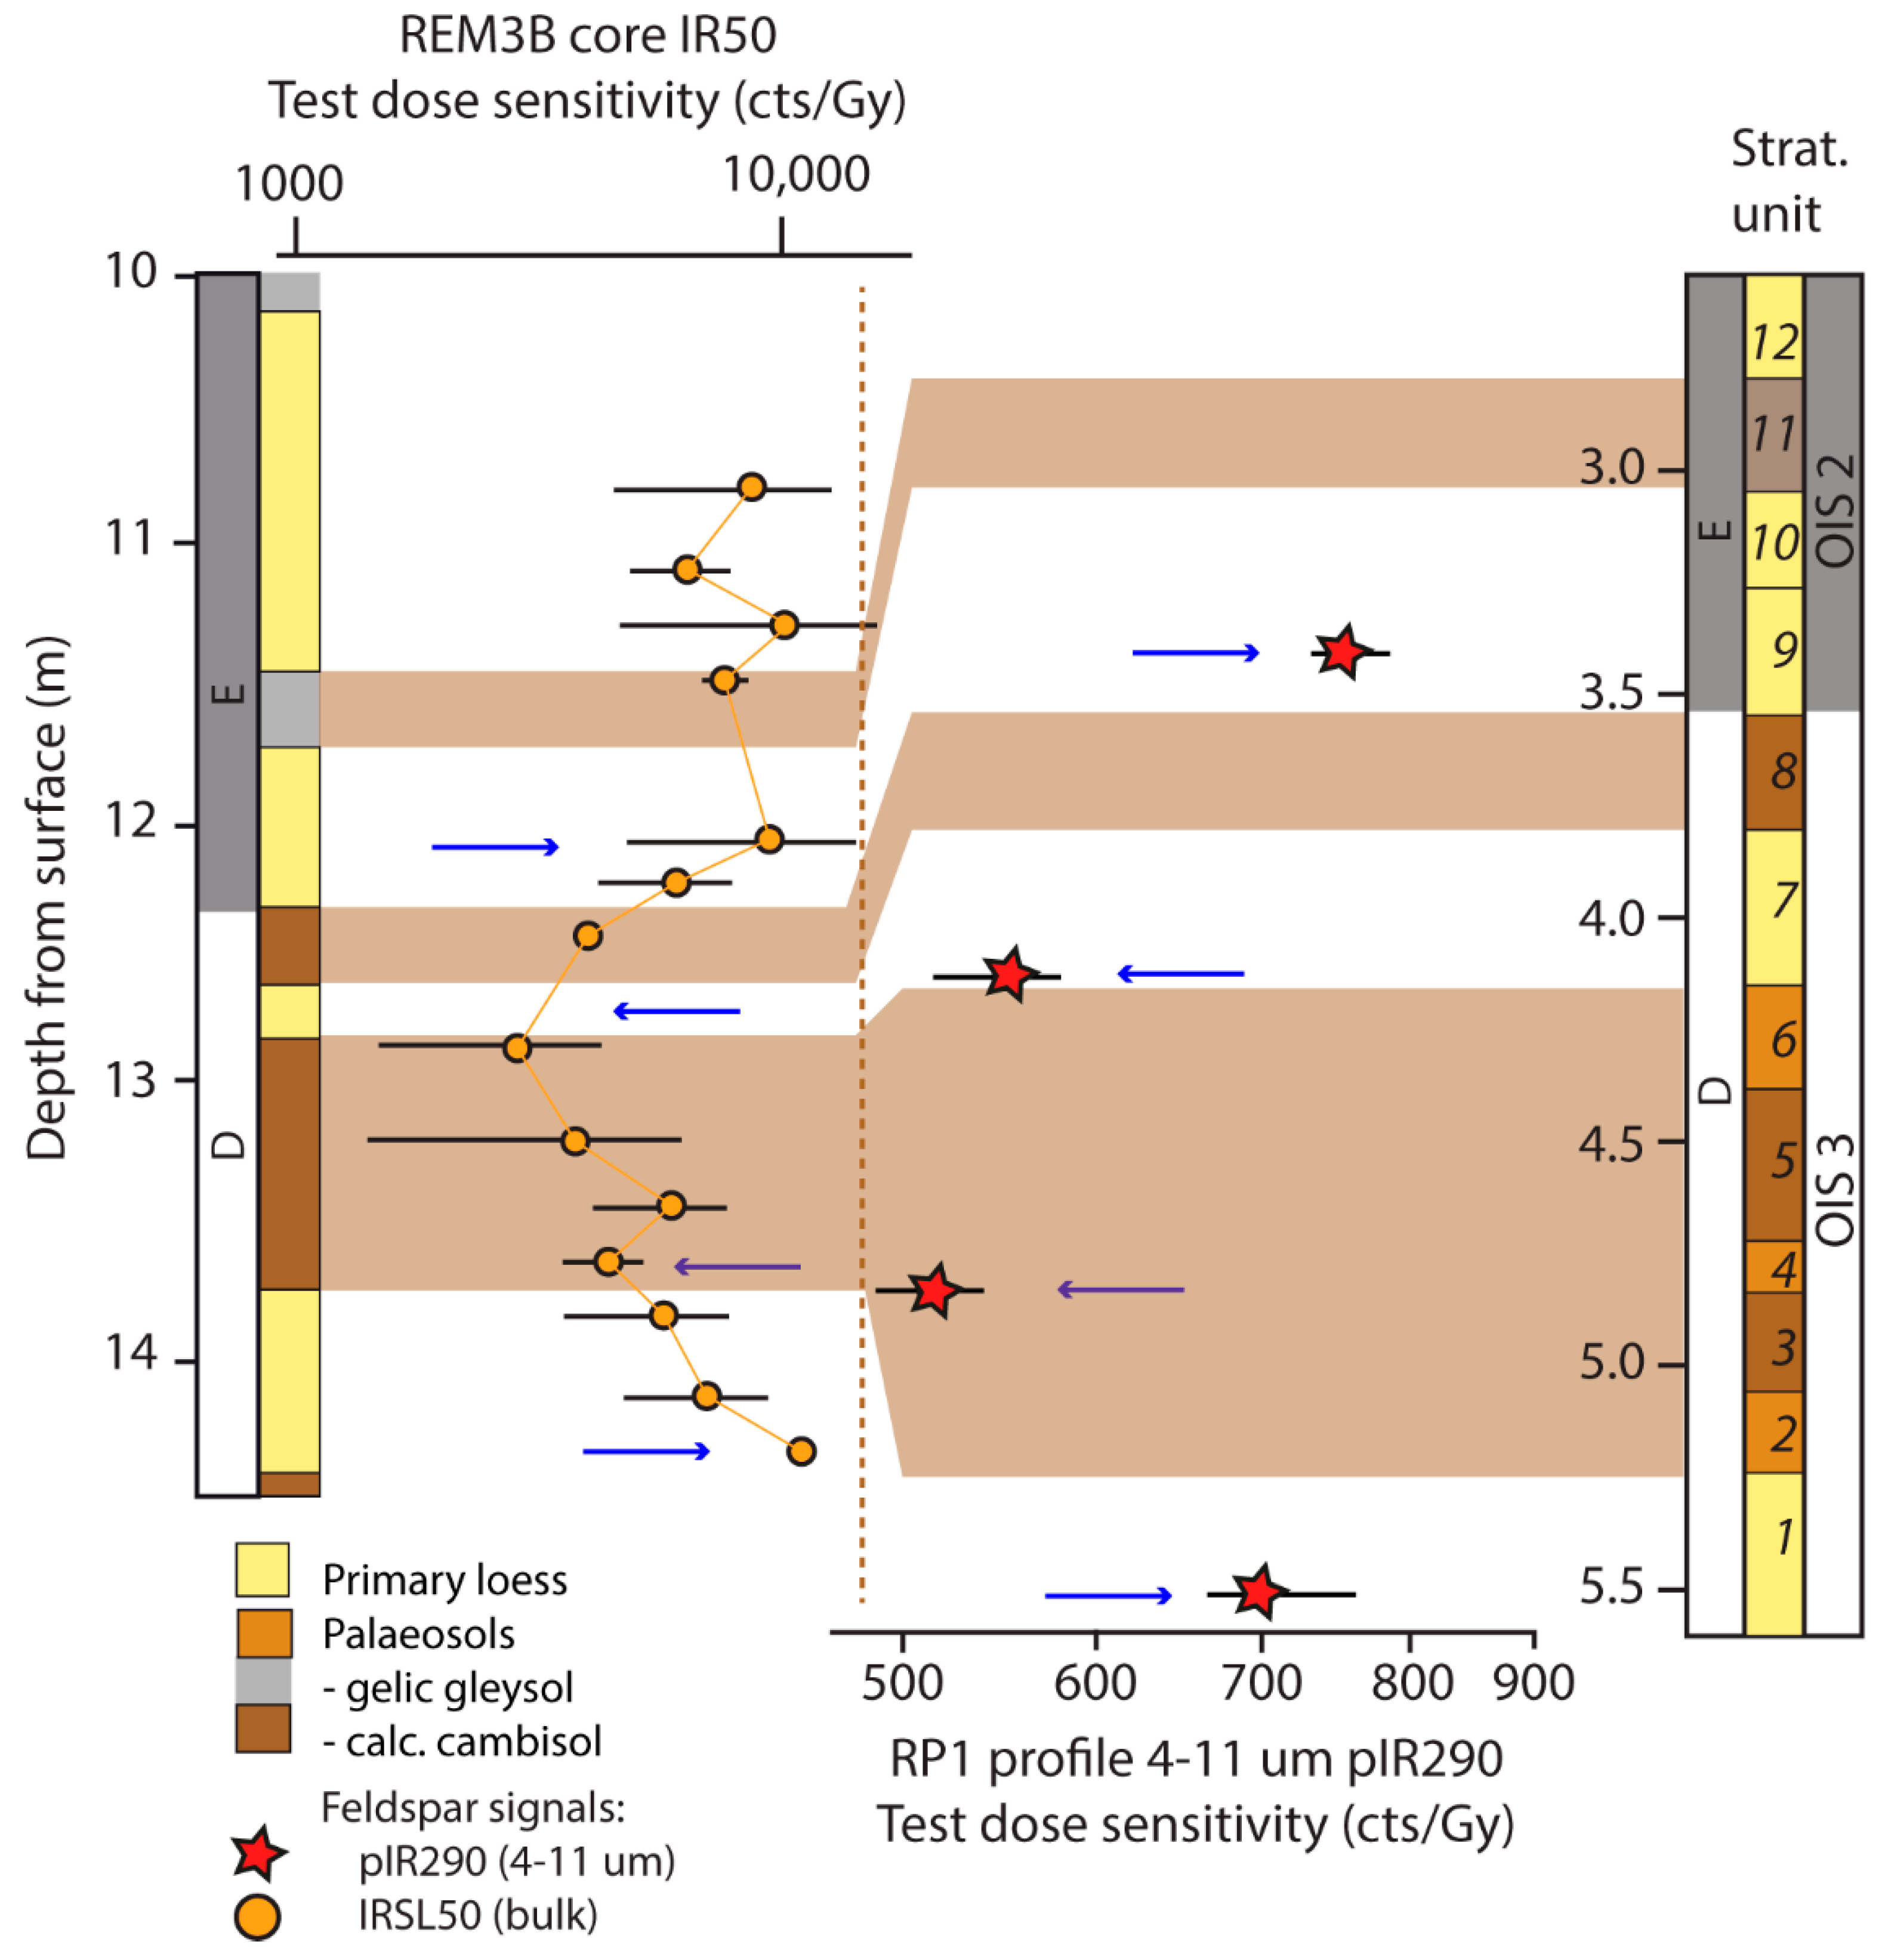
4.2. Luminescence Sensitivity within Profile RP1 and in the Zone of Temporal Overlap between REM3B and RP1
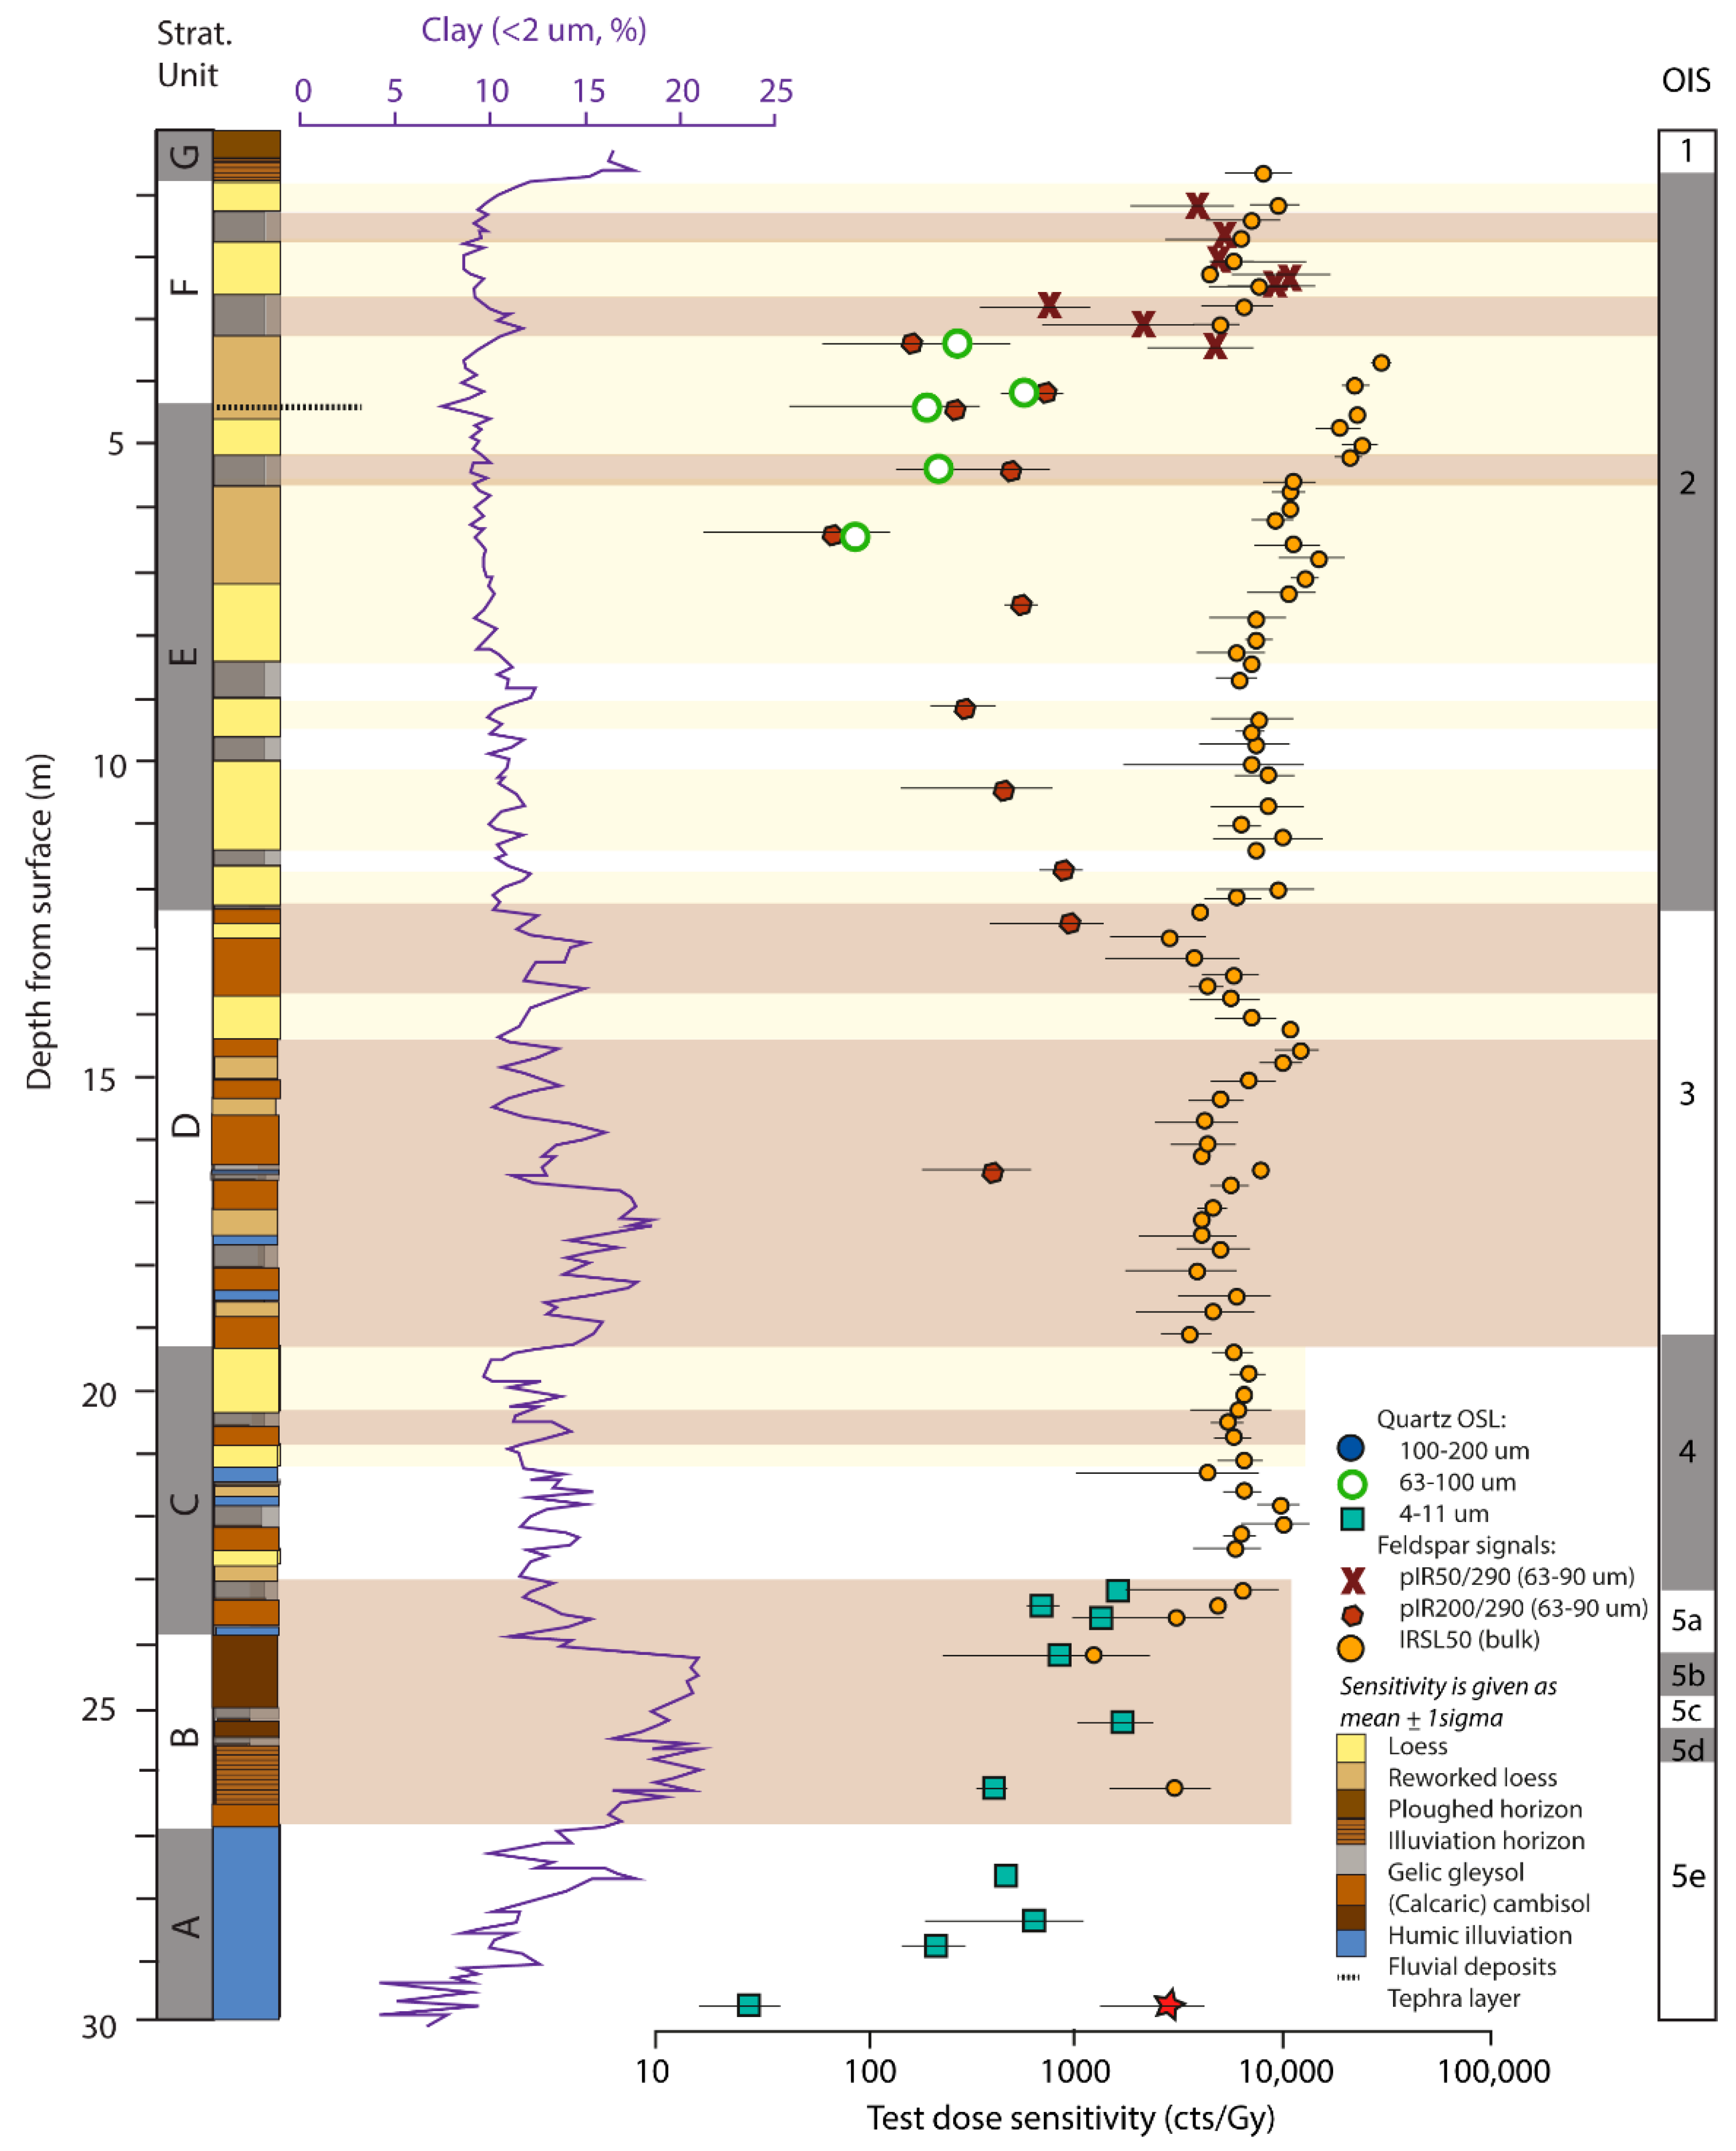
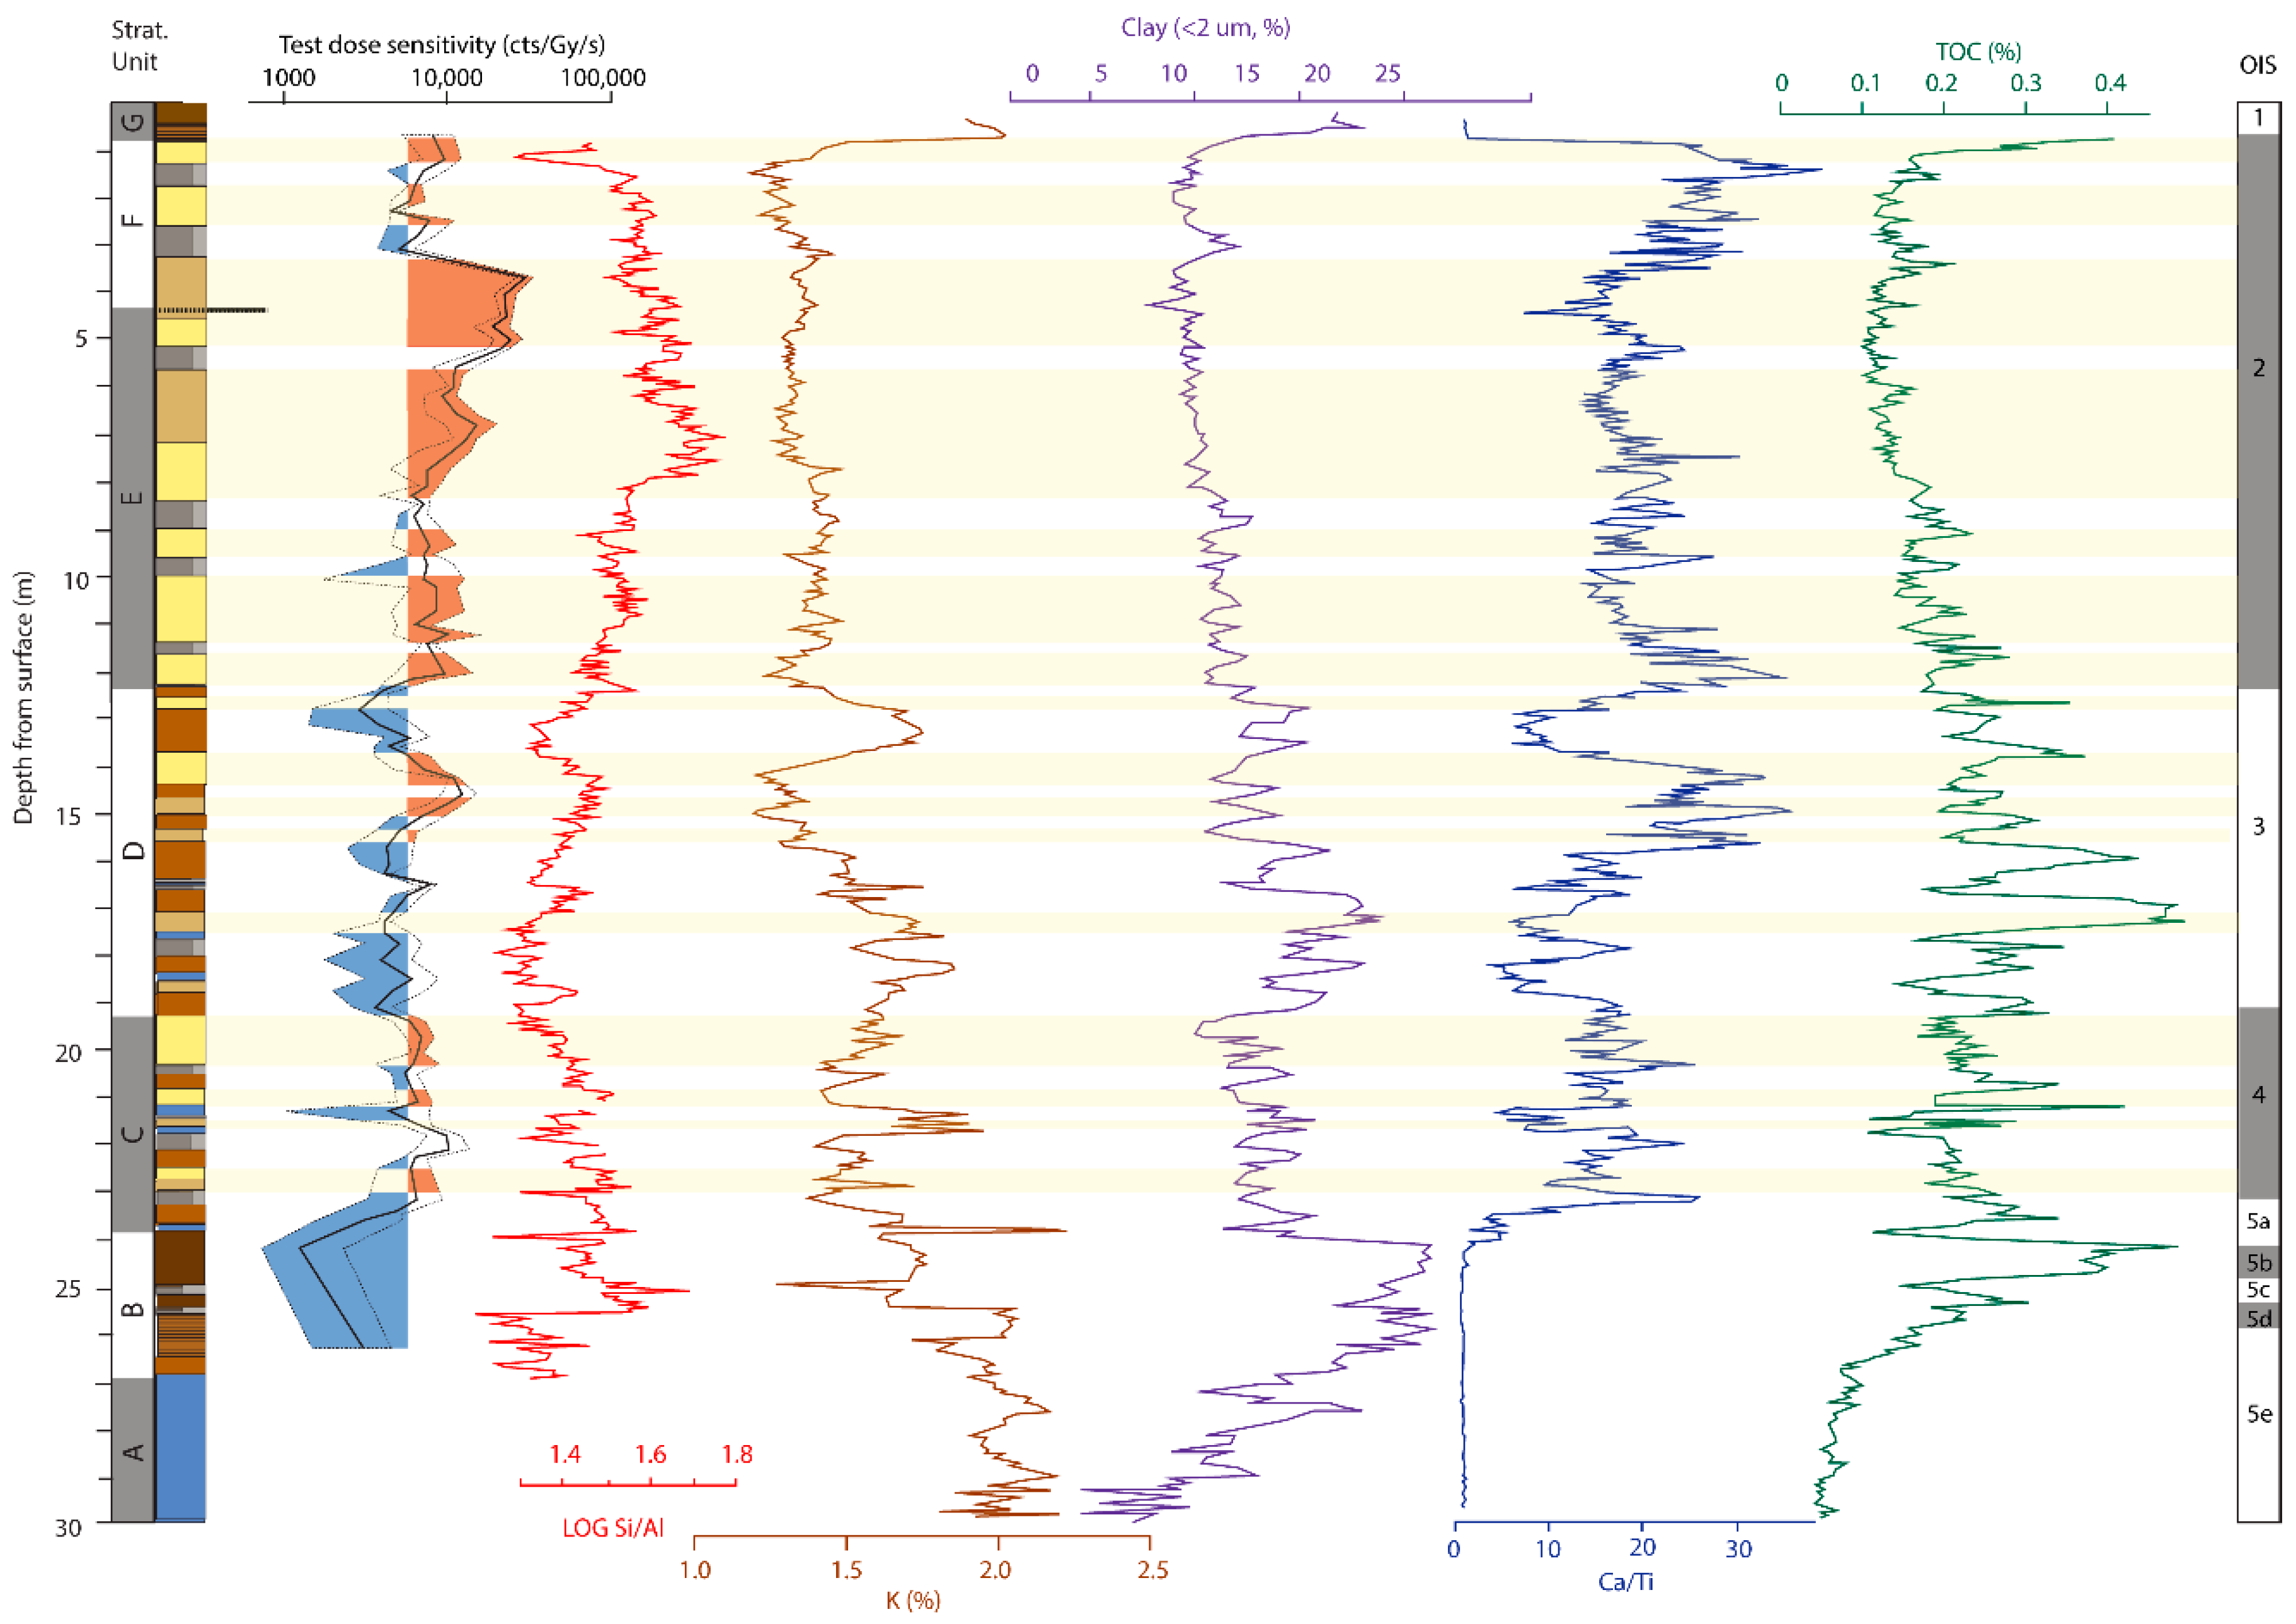
4.3. Luminescence Sensitivity down Core REM3B
5. Discussion
5.1. Variability in Quartz and Feldspar Test Dose Sensitivity during OIS 3
5.2. Variability in Rapidly Meaasured IR50 Sensitivity down Core REM3B: Implications for Source Variability?
6. Conclusions
Supplementary Materials
Author Contributions
Funding
Institutional Review Board Statement
Informed Consent Statement
Data Availability Statement
Acknowledgments
Conflicts of Interest
References
- Pécsi, M. Loess is not just the accumulation of dust. Quat. Int. 1990, 7–8, 1–21. [Google Scholar] [CrossRef]
- Pye, K. The nature, origin and accumulation of loess. Quat. Sci. Rev. 1995, 14, 653–677. [Google Scholar] [CrossRef]
- Fitzsimmons, K.E.; Markovic, S.; Hambach, U. Pleistocene environmental dynamics recorded in the loess of the middle and lower Danube basin. Quat. Sci. Rev. 2012, 41, 104–118. [Google Scholar] [CrossRef]
- Liu, T.; Chang, T. The “Huangtu” (loess) of China. In Proceedings of the 6th INQUA Congress, Warsaw, Poland, 1961; 1964; Volume 4, pp. 503–534. Available online: https://www.researchgate.net/publication/285484646_The_’Huangtu’_loess_of_China (accessed on 11 November 2021).
- Marković, S.B.; Stevens, T.; Kukla, G.J.; Hambach, U.; Fitzsimmons, K.E.; Gibbard, P.; Buggle, B.; Zech, M.; Guo, Z.; Hao, Q.; et al. Danube loess stratigraphy—Towards a pan-European loess stratigraphic model. Earth Sci. Rev. 2015, 148, 228–258. [Google Scholar] [CrossRef] [Green Version]
- Fitzsimmons, K.E. Reconstructing palaeoenvironments on desert margins: New perspectives from Eurasian loess and Australian dry lake shorelines. Quat. Sci. Rev. 2017, 171, 1–19. [Google Scholar] [CrossRef]
- Buggle, B.; Hambach, U.; Kehl, M.; Markovic, S.B.; Zöller, L.; Glaser, B. The progressive evolution of a continental climate in southeast-central European lowlands during the Middle Pleistocene recorded in loess paleosol sequences. Geology 2013, 41, 771–774. [Google Scholar] [CrossRef]
- Guo, Z.T.; Ruddiman, W.F.; Hao, Q.Z.; Wu, H.B.; Qiao, Y.S.; Zhu, R.X.; Peng, S.Z.; Wei, J.J.; Yuan, B.Y.; Liu, T.S. Onset of Asian desertification by 22 Myr ago inferred from loess deposits in China. Nature 2002, 416, 159–163. [Google Scholar] [CrossRef]
- Markovic, S.B.; Hambach, U.; Stevens, T.; Kukla, G.J.; Heller, F.; McCoy, W.D.; Oches, E.A.; Buggle, B.; Zöller, L. The last million years recorded at the Stari Slankamen (Northern Serbia) loess-palaeosol sequence: Revised chronostratigraphy and long-term environmental trends. Quat. Sci. Rev. 2011, 30, 1142–1154. [Google Scholar] [CrossRef]
- Fink, J.; Kukla, G.J. Pleistocene climates in Central Europe: At least 17 interglacials after the Olduvai event. Quat. Res. 1977, 7, 363–371. [Google Scholar] [CrossRef]
- Licht, A.; Pullen, A.; Kapp, P.; Abell, J.; Giesler, N. Eolian cannibalism: Reworked loess and fluvial sediment as the main sources of the Chinese Loess Plateau. GSA Bull. 2016, 128, 944–956. [Google Scholar] [CrossRef] [Green Version]
- Smalley, I.; O’Hara-Dhand, K.; Wint, J.; Machalett, B.; Jary, Z.; Jefferson, I. Rivers and loess: The significance of long river transportation in the complex event-sequence approach to loess deposit formation. Quat. Int. 2009, 198, 7–18. [Google Scholar] [CrossRef]
- Smalley, I.; Marković, S.B. Controls on the nature of loess particles and the formation of loess 567 deposits. Quat. Int. 2019, 502, 160–164. [Google Scholar] [CrossRef]
- Újvári, G.; Stevens, T.; Svensson, A.; Klötzli, U.S.; Manning, C.; Németh, T.; Kovács, J.; Sweeney, M.R.; Gocke, M.; Wiesenberg, G.L.; et al. Two possible source regions for central Greenland last glacial dust. Geophys. Res. Lett. 2015, 42, 10399–10408. [Google Scholar] [CrossRef] [Green Version]
- Zaarur, S.; Stein, M.; Adam, O.; Mingram, J.; Liu, J.; Wu, J.; Raveh-Rubin, S.; Erel, Y. Synoptic stability and anomalies in NE China inferred from dust provenance of Sihailongwan maar sediments during the past ∼80 kyr. Quat. Sci. Rev. 2020, 239, 106279. [Google Scholar] [CrossRef]
- Buggle, B.; Glaser, B.; Zöller, L.; Hambach, U.; Marković, S.; Glaser, I.; Gerasimenko, N. Geochemical characterization and origin of Southeastern and Eastern European loesses (Serbia, Romania, Ukraine). Quat. Sci. Rev. 2008, 27, 1058–1075. [Google Scholar] [CrossRef]
- Obreht, I.; Hambach, U.; Veres, D.; Zeeden, C.; Bösken, J.; Stevens, T.; Marković, S.B.; Klasen, N.; Brill, D.; Burow, C.; et al. Shift of large-scale atmospheric systems over Europe during late MIS 3 and implications for Modern Human dispersal. Sci. Rep. 2017, 7, 5848. [Google Scholar] [CrossRef]
- Fitzsimmons, K.E.; Nowatzki, M.; Dave, A.K.; Harder, H. Intersections between wind regimes, topography and sediment supply: Perspectives from aeolian landforms in Central Asia. Palaeogeog. Palaeoclim. Palaeoecol. 2020, 540, 109531. [Google Scholar] [CrossRef]
- Li, Y.; Song, Y.; Kaskaoutis, D.G.; Chen, X.; Mamadjanov, Y.; Tan, L. Atmospheric dust dynamics in southern Central Asia: Implications for buildup of Tajikistan loess sediments. Atmos. Res. 2019, 229, 74–85. [Google Scholar] [CrossRef]
- Stuut, J.-B.; Smalley, I.J.; O’Hara-Dhand, K. Aeolian dust in Europe: African sources and European deposits. Quat. Int. 2009, 198, 234–245. [Google Scholar] [CrossRef]
- Gallet, S.; Jahn, B.M.; Lanoë, B.V.; Dia, A.; Rossello, E. Loess geochemistry and its implications for particle origin and composition of the upper continental crust. Earth Plan. Sci. Lett. 1998, 156, 157–172. [Google Scholar] [CrossRef]
- Li, Y.; Song, Y.; Fitzsimmons, K.E.; Chen, X.; Wang, Q.; Sun, H.; Zhang, Z. New evidence for the provenance and formation of loess deposits in the Ili River Basin, Arid Central Asia. Aeol. Res. 2018, 35, 1–8. [Google Scholar] [CrossRef]
- Újvári, G.; Varga, A.; Balogh-Brunstad, Z. Origin, weathering, and geochemical composition of loess in southwestern Hungary. Quat. Res. 2008, 69, 421–437. [Google Scholar] [CrossRef]
- Bird, A.; Stevens, T.; Rittner, M.; Vermeesch, P.; Carter, A.; Andò, S.; Garzanti, E.; Lu, H.; Nie, J.; Zeng, L.; et al. Quaternary dust source variation across the Chinese Loess Plateau. Palaeogeog. Palaeoclim. Palaeoecol. 2015, 435, 254–264. [Google Scholar] [CrossRef]
- Fenn, K.; Stevens, T.; Bird, A.; Limonta, M.; Rittner, M.; Vermeesch, P.; Andò, S.; Garzanti, E.; Lu, H.; Zhang, H.; et al. Insights into the provenance of the Chinese Loess Plateau from jointzircon U-Pb and garnet geochemical analysis of last glacial loess. Quat. Res. 2018, 89, 645–659. [Google Scholar] [CrossRef] [Green Version]
- Stevens, T.; Carter, A.; Watson, T.P.; Vermeesch, P.; Andò, S.; Bird, A.F.; Lu, H.; Garzanti, E.; Cottam, M.A.; Sevastjanova, I. Genetic linkage between the Yellow River, the Mu Us desert and the Chinese Loess Plateau. Quat. Sci. Rev. 2013, 78, 355–368. [Google Scholar] [CrossRef]
- Újvári, G.; Varga, A.; Ramos, F.C.; Kovács, J.; Németh, T.; Stevens, T. Evaluating the use of clay mineralogy, Sr–Nd isotopes and zircon U–Pb ages in tracking dust provenance: An example from loess of the Carpathian Basin. Chem. Geol. 2012, 304, 83–96. [Google Scholar] [CrossRef]
- Újvári, G.; Wegner, W.; Klötzli, U.; Horschinegg, M.; Hippler, D. Sr-Nd-Hf Isotopic Analysis of <10 mg Dust Samples: Implications for Ice Core Dust Source Fingerprinting. Geochem. Geophys. Geosyst. 2018, 19, 60–72. [Google Scholar] [CrossRef] [Green Version]
- Obreht, I.; Zeeden, C.; Hambach, U.; Veres, D.; Marković, S.B.; Bösken, J.; Svirčev, Z.; Bačević, N.; 612 Gavrilov, M.B.; Lehmkuhl, F. Tracing the influence of Mediterranean climate on Southeastern Europe during the past 350,000 years. Sci. Rep. 2016, 6, 36334. [Google Scholar] [CrossRef] [Green Version]
- do Nascimento, D.R.; Sawakuchi, A.O.; Guedes, C.C.; Giannini, P.C.; Grohmann, C.H.; Ferreira, M.P. Provenance of sands from the confluence of the Amazon and Madeira rivers based on detrital heavy minerals and luminescence of quartz and feldspar. Sed. Geol. 2015, 316, 1–12. [Google Scholar] [CrossRef]
- Gray, H.J.; Jain, M.; Sawakuchi, A.O.; Mahan, S.A.; Tucker, G.E. Luminescence as a Sediment Tracer and Provenance Tool. Rev. Geophys. 2019, 57, 987–1017. [Google Scholar] [CrossRef] [Green Version]
- Sawakuchi, A.O.; Rodrigues, F.C.; Mineli, T.D.; Mendes, V.R.; Melo, D.B.; Chiessi, C.M.; Giannini, P.C. Optically Stimulated Luminescence Sensitivity of Quartz for Provenance Analysis. Methods Protoc. 2020, 3, 6. [Google Scholar] [CrossRef] [Green Version]
- Nagashima, K.; Nishido, H.; Kayama, M.; Kurosaki, Y.; Ohgo, S.; Hasegawa, H. Composition of Asian dust from cathodoluminescence spectral analysis of single quartz grains. Geology 2017, 45, 879–882. [Google Scholar] [CrossRef]
- Sun, Y.; Tada, R.; Chen, J.; Chen, H.; Toyoda, S.; Tani, A.; Isozaki, Y.; Nagashima, K.; Hasegawa, H.; Ji, J. Distinguishing the sources of Asian dust based on electron spin resonance signal intensity and crystallinity of quartz. Atmos. Environ. 2007, 41, 8537–8548. [Google Scholar] [CrossRef]
- Toyoda, S.; Hattori, W. Formation and decay of the E1′ center and of its precursor. Appl. Radiat. Isot. 2000, 52, 1351–1356. [Google Scholar] [CrossRef]
- Gong, Z.; Sun, J.; Lü, T. Investigating the components of the optically stimulated luminescence signals of quartz grains from sand dunes in China. Quat. Geochron. 2015, 29, 48–57. [Google Scholar] [CrossRef]
- Tsukamoto, S.; Nagashima, K.; Murray, A.S.; Tada, R. Variations in OSL components from quartz from Japan sea sediments and the possibility of reconstructing provenance. Quat. Int. 2011, 234, 182–189. [Google Scholar] [CrossRef]
- Fitzsimmons, K.E. An assessment of the luminescence sensitivity of Australian quartz with respect to sediment history. Geochronometria 2011, 38, 199–208. [Google Scholar] [CrossRef] [Green Version]
- Lü, T.; Sun, J. Luminescence sensitivities of quartz grains from eolian deposits in northern China and their implications for provenance. Quat. Res. 2011, 76, 181–189. [Google Scholar] [CrossRef]
- Sawakuchi, A.O.; Blair, M.W.; Dewitt, R.; Faleiros, F.M.; Hyppolito, T.; Guedes, C.C. Thermal history versus sedimentary history: OSL sensitivity of quartz grains extracted from rocks and sediments. Quat. Geochron. 2011, 6, 261–272. [Google Scholar] [CrossRef]
- Zheng, C.X.; Zhou, L.P.; Qin, J.T. Difference in luminescence sensitivity of coarse-grained quartz from deserts of northern China. Radiat. Meas. 2009, 44, 534–537. [Google Scholar] [CrossRef]
- Li, Y.; Zhou, L. Variations of thermally and optically stimulated luminescence sensitivity of loess and pedocomplex samples from southern Tajikistan, Central Asia. Geochronometria 2020, 47. [Google Scholar] [CrossRef]
- Lü, T.; Sun, J.; Li, S.H.; Gong, Z.; Xue, L. Vertical variations of luminescence sensitivity of quartz grains from loess/paleosol of Luochuan section in the central Chinese Loess Plateau since the last interglacial. Quat. Geochron. 2014, 22, 107–115. [Google Scholar] [CrossRef]
- Stevens, T.; Adamiec, G.; Bird, A.F.; Lu, H. An abrupt shift in dust source on the Chinese Loess Plateau revealed through high sampling resolution OSL dating. Quat. Sci. Rev. 2013, 82, 121–132. [Google Scholar] [CrossRef]
- Aitken, M.J. Thermoluminescence Dating; Academic Press: London, UK, 1985. [Google Scholar]
- Haase, D.; Fink, J.; Haase, G.; Ruske, R.; Pécsi, M.; Richter, H.; Altermann, M.; Jäger, K.D. Loess in Europe--its spatial distribution based on a European Loess Map, scale 1:2,500,000. Quat. Sci. Rev. 2007, 26, 1301–1312. [Google Scholar] [CrossRef]
- Rousseau, D.-D.; Boers, N.; Sima, A.; Svensson, A.; Bigler, M.; Lagroix, F.; Taylor, S.; Antoine, P. (MIS3 & 2) millennial oscillations in Greenland dust and Eurasian aeolian records—A paleosol perspective. Quat. Sci. Rev. 2017, 169, 99–113. [Google Scholar]
- Lehmkuhl, F.; Nett, J.J.; Pötter, S.; Schulte, P.; Sprafke, T.; Jary, Z.; Antoine, P.; Wacha, L.; Wolf, D.; Zerboni, A.; et al. Loess landscapes of Europe–Mapping, geomorphology, and zonal differentiation. Earth Sci. Rev. 2021, 215, 103496. [Google Scholar] [CrossRef]
- Jain, M.; Ankjærgaard, C. Towards a non-fading signal in feldspar: Insight into charge transport and tunnelling from time-resolved optically stimulated luminescence. Radiat. Meas. 2011, 46, 292–309. [Google Scholar] [CrossRef]
- Pagonis, V.; Jain, M.; Murray, A.S.; Ankjærgaard, C.; Chen, R. Modeling of the shape of infrared stimulated luminescence signals in feldspars. Radiat. Meas. 2012, 47, 870–876. [Google Scholar] [CrossRef]
- Guralnik, B.; Li, B.; Jain, M.; Chen, R.; Paris, R.B.; Murray, A.S.; Li, S.H.; Pagonis, V.; Valla, P.G.; Herman, F. Radiation-induced growth and isothermal decay of infrared-stimulated luminescence from feldspar. Radiat. Meas. 2015, 81, 224–231. [Google Scholar] [CrossRef] [Green Version]
- Riedesel, S.; Bell, A.M.; Duller, G.A.; Finch, A.A.; Jain, M.; King, G.E.; Pearce, N.J.; Roberts, H.M. Exploring sources of variation in thermoluminescence emissions and anomalous fading in alkali feldspars. Radiat. Meas. 2021, 141, 106541. [Google Scholar] [CrossRef]
- Fischer, P.; Jöris, O.; Fitzsimmons, K.E.; Vinnepand, M.; Prud’Homme, C.; Schulte, P.; Hatté, C.; Hambach, U.; Lindauer, S.; Zeeden, C.; et al. Millennial-scale terrestrial ecosystem responses to Upper Pleistocene climatic changes: 4D-reconstruction of the Schwalbenberg Loess-Paleosol-Sequence (Middle Rhine valley, Germany). Catena 2021, 196, 104913. [Google Scholar] [CrossRef]
- Vinnepand, M.; Fischer, P.; Fitzsimmons, K.E.; Thornton, B.; Fiedler, S.; Vött, A. Combining Inorganic and Organic Carbon Stable Isotope Signatures in the Schwalbenberg Loess-Palaeosol-Sequence Near Remagen (Middle Rhine Valley, Germany). Front. Earth Sci. 2020, 8, 276. [Google Scholar] [CrossRef]
- Klasen, N.; Fischer, P.; Lehmkuhl, F.; Hilgers, A. Luminescence dating of loess deposits from the Remagen-Schwalbenberg site, western Germany. Geochronometria 2015, 42, 67–77. [Google Scholar] [CrossRef] [Green Version]
- Schirmer, W.; Ikinger, A.; Nehring, F. Die terrestrischen Böden im Profil Schwalbenberg/Mittelrhein. (Terrestrial soils of the Schwalbenberg profile/Middle Rhine). Mainz. Geowiss. Mitt. 2012, 40, 53–78. [Google Scholar]
- Schirmer, W. Late Pleistocene loess of the lower Rhine. Quat. Int. 2016, 411, 44–61. [Google Scholar] [CrossRef]
- Bibus, E. Zur Relief-, Boden-und Sedimententwicklung am unteren Mittelrhein; Goethe-Universität Institut für Physische Geographie: Frankfurt am Main, Germany, 1980; Volume 1. [Google Scholar]
- Profe, J.; Zolitschka, B.; Schirmer, W.; Frechen, M.; Ohlendorf, C. Geochemistry unravels MIS 3/2 paleoenvironmental dynamics at the loess–paleosol sequence Schwalbenberg II, Germany. Palaeogeog. Palaeoclim. Palaeoecol. 2016, 459, 537–551. [Google Scholar] [CrossRef]
- Schirmer, W. Würmzeitliche Böden am Mittelrhein. In Proceedings of the Program. und Exkursionsführer, 10. Tagung des AK Paläoböden der DBG, Bayreuth, Germany, 1991. [Google Scholar]
- Schirmer, W. Eine Klimakurve des Oberpleistozäns aus dem rheinischen Löss. Eiszeit. Und Ggw. 2000, 50, 25–49. [Google Scholar] [CrossRef]
- Boenigk, W.; Frechen, M. The Pliocene and Quaternary fluvial archives of the Rhine system. Quat. Sci. Rev. 2006, 25, 550–574. [Google Scholar] [CrossRef]
- Frechen, M.; Schirmer, W. Luminescence chronology of the Schwalbenberg II loess in the Middle Rhine valley. EG Quat. Sci. J. 2011, 60, 78–89. [Google Scholar] [CrossRef]
- App, V. Die altsteinzeitliche Fundstelle auf dem Schwalbenberg bei Remagen. Ber. Zur Archäologie Mittelrh. Und Mosel 1995, 4, 11–136. [Google Scholar]
- Schiermeyer, J. Würmzeitliche Lößmollusken aus der Eifel; Universität Düsseldorf: Düsseldorf, Germany, 2002. [Google Scholar]
- Lang, A.; Lindauer, S.; Kuhn, R.; Wagner, G.A. Procedures used for optically and infrared stimulated luminescence dating of sediments in Heidelberg. Ancient TL 1996, 14, 7–11. [Google Scholar]
- Bøtter-Jensen, L. Luminescence techniques: Instrumentation and methods. Radiat. Meas. 1997, 27, 749–768. [Google Scholar] [CrossRef]
- Murray, A.S.; Wintle, A.G. Luminescence dating of quartz using an improved single-aliquot regenerative-dose protocol. Radiat. Meas. 2000, 32, 57–73. [Google Scholar] [CrossRef]
- Murray, A.S.; Wintle, A.G. The single aliquot regenerative dose protocol: Potential for improvements in reliability. Radiat. Meas. 2003, 37, 377–381. [Google Scholar] [CrossRef]
- Buylaert, J.-P.; Jain, M.; Murray, A.S.; Thomsen, K.J.; Thiel, C.; Sohbati, R. A robust feldspar luminescence dating method for Middle and Late Pleistocene sediments. Boreas 2012, 41, 435–451. [Google Scholar] [CrossRef]
- Perić, Z.; Adolphi, E.L.; Stevens, T.; Újvári, G.; Zeeden, C.; Buylaert, J.P.; Marković, S.B.; Hambach, U.; Fischer, P.; Schmidt, C.; et al. Quartz OSL dating of late quaternary Chinese and Serbian loess: A cross Eurasian comparison of dust mass accumulation rates. Quat. Int. 2019, 502, 30–44. [Google Scholar] [CrossRef]
- Timar, A.; Vandenberghe, D.; Panaiotu, E.C.; Panaiotu, C.G.; Necula, C.; Cosma, C. Optical dating of Romanian loess using fine-grained quartz. Quat. Geochron. 2010, 5, 143–148. [Google Scholar] [CrossRef]
- Vinnepand, M.; Fischer, P.; Zeeden, C.; Schulte, P.; Fiedler, S.; Jöris, O.; Hambach, U.; Fitzsimmons, K.E.; Prud’homme, C.; Peric, Z.; et al. Decoding geochemical signals of the Schwalbenberg Loess-Palaeosol-Sequences-A key to Upper Pleistocene terrestrial ecosystem responses in western Central Europe. In Proceedings of the EGU General Assembly Conference Abstracts, EGU21-10532, Online, 19–30 April 2021. [Google Scholar] [CrossRef]
- Galbraith, R.F.; Roberts, R.G.; Laslett, G.M.; Yoshida, H.; Olley, J.M. Optical dating of single and multiple grains of quartz from Jinmium rock shelter, northern Australia. Part 1, Experimental design and statistical models. Archaeometry 1999, 41, 339–364. [Google Scholar] [CrossRef]
- Preusser, F. Bulk sediment IRSL screening applied for high-resolution and fast age assessment of fluvial deposits in the Upper Rhine Plain. In Proceedings of the German Luminescence and Electron Spin Resonance Dating (DLED) Conference, Bingen, Germany, 8–10 November 2019. [Google Scholar]
- Anechitei-Deacu, V.; Timar-Gabor, A.; Thomsen, K.J.; Buylaert, J.P.; Jain, M.; Bailey, M.; Murray, A.S. Single and multi-grain OSL investigations in the high dose range using coarse quartz. Radiat. Meas. 2018, 120, 124–130. [Google Scholar] [CrossRef]
- Timar Gabor, A.; Vandenberghe, D.A.; Vasiliniuc, S.; Panaoitu, C.E.; Panaiotu, C.G.; Dimofte, D.; Cosma, C. Optical dating of Romanian loess: A comparison between silt-sized and sand-sized quartz. Quat. Int. 2011, 240, 62–70. [Google Scholar] [CrossRef]
- Fuhrmann, F.; Diensberg, B.; Gong, X.; Lohmann, G.; Sirocko, F. Aridity synthesis for eight selected key regions of the global climate system during the last 60 000 years. Clim. Past 2020, 16, 2221–2238. [Google Scholar] [CrossRef]
- Fuhrmann, F.; Seelos, K.; Sirocko, F. Eolian sedimentation in Central European Auel dry maar from 60 to 13 ka. Quat. Res. 2021, 101, 4–12. [Google Scholar] [CrossRef]
- Sirocko, F.; Knapp, H.; Dreher, F.; Förster, M.W.; Albert, J.; Brunck, H.; Veres, D.; Dietrich, S.; Zech, M.; Hambach, U.; et al. The ELSA-Vegetation-Stack: Reconstruction of Landscape Evolution Zones (LEZ) from laminated Eifel maar sediments of the last 60,000 years. Glob. Planet. Chang. 2016, 142, 108–135. [Google Scholar] [CrossRef]
- Zeeden, C.; Hambach, U.; Veres, D.; Fitzsimmons, K.; Obreht, I.; Bösken, J.; Lehmkuhl, F. Millennial scale climate oscillations recorded in the Lower Danube loess over the last glacial period. Palaeogeog. Palaeoclim. Palaeoecol. 2018, 509, 164–181. [Google Scholar] [CrossRef]
- Rasmussen, S.O.; Bigler, M.; Blockley, S.P.; Blunier, T.; Buchardt, S.L.; Clausen, H.B.; Cvijanovic, I.; Dahl-Jensen, D.; Johnsen, S.J.; Fischer, H.; et al. A stratigraphic framework for abrupt climatic changes during the Last Glacial period based on three synchronized Greenland ice-core records: Refining and extending the INTIMATE event stratigraphy. Quat. Sci. Rev. 2014, 106, 14–28. [Google Scholar] [CrossRef] [Green Version]
- Schaffernicht, E.J.; Ludwig, P.; Shao, Y. Linkage between dust cycle and loess of the Last Glacial Maximum in Europe. Atmos. Chem. Phys. 2020, 20, 4969–4986. [Google Scholar] [CrossRef]
- Huntley, D.J.; Lian, O.B. Some observations on tunnelling of trapped electrons in feldspars and their implications for optical dating. Quat. Sci. Rev. 2006, 25, 2503–2512. [Google Scholar] [CrossRef]
- Valla, P.G.; Lowick, S.E.; Herman, F.; Champagnac, J.D.; Steer, P.; Guralnik, B. Exploring IRSL50 fading variability in bedrock feldspars and implications for OSL thermochronometry. Quat. Geochronol. 2016, 36, 55–66. [Google Scholar] [CrossRef] [Green Version]
- Trauerstein, M.; Lowick, S.; Preusser, F.; Rufer, D.; Schlunegger, F. Exploring fading in single grain feldspar IRSL measurements. Quat. Geochron. 2012, 10, 327–333. [Google Scholar] [CrossRef]
- Visocekas, R.; Zink, A. Tunneling afterglow and point defects in feldspars. Radiat. Eff. Defects Solids 1995, 134, 265–272. [Google Scholar] [CrossRef]
- Vinnepand, M.; Fischer, P.; Zeeden, C.; Schulte, P.; Fiedler, S.; Jöris, O.; Hambach, U.; Fitzsimmons, K.E.; Prud’homme, C.; Peric, Z.; et al. Decoding multivariate geochemical signatures of the Upper Pleistocene Schwalbenberg loess-palaeosol sequence—Implications on changes of source areas and weathering intensities. Catena. in revision.


Publisher’s Note: MDPI stays neutral with regard to jurisdictional claims in published maps and institutional affiliations. |
© 2021 by the authors. Licensee MDPI, Basel, Switzerland. This article is an open access article distributed under the terms and conditions of the Creative Commons Attribution (CC BY) license (https://creativecommons.org/licenses/by/4.0/).
Share and Cite
Fitzsimmons, K.E.; Perić, Z.; Nowatzki, M.; Lindauer, S.; Vinnepand, M.; Prud’homme, C.; Dave, A.K.; Vött, A.; Fischer, P. Luminescence Sensitivity of Rhine Valley Loess: Indicators of Source Variability? Quaternary 2022, 5, 1. https://0-doi-org.brum.beds.ac.uk/10.3390/quat5010001
Fitzsimmons KE, Perić Z, Nowatzki M, Lindauer S, Vinnepand M, Prud’homme C, Dave AK, Vött A, Fischer P. Luminescence Sensitivity of Rhine Valley Loess: Indicators of Source Variability? Quaternary. 2022; 5(1):1. https://0-doi-org.brum.beds.ac.uk/10.3390/quat5010001
Chicago/Turabian StyleFitzsimmons, Kathryn E., Zoran Perić, Maike Nowatzki, Susanne Lindauer, Mathias Vinnepand, Charlotte Prud’homme, Aditi K. Dave, Andreas Vött, and Peter Fischer. 2022. "Luminescence Sensitivity of Rhine Valley Loess: Indicators of Source Variability?" Quaternary 5, no. 1: 1. https://0-doi-org.brum.beds.ac.uk/10.3390/quat5010001