1. Introduction
Coastal karst aquifers, in Croatia and the wider Mediterranean area, have an irreplaceable function of providing sufficient water for the needs of public water supply of the coastal zone [
1]. Since these are highly tourist areas, these needs are expressed especially during the dry summer months due to the large number of tourists. The required quantities increase several times in the summer compared to the winter months when drinking water is supplied only to the local population [
2].
Coastal karst aquifers are usually in direct contact with seawater that penetrates the coastal zone of aquifers creating a mixing zone of salt and fresh water. Due to the dynamics of discharge, as well as the dynamics of tides, this is not a sharp boundary between the two media, but a mixing zone is formed in which the salinity is increased compared to freshwater aquifers and the salinity rises towards the sea. This zone can be several tens of meters thick and knowing its dynamics is very important for the management of any coastal aquifer. Namely, any disturbance of this labile balance can cause the mixing zone to move towards the coastal aquifer, creating salinization of individual aquifer zones and potential problems in the functioning of public water supply systems. Decreased aquifer inflows during the summer dry periods, prolonged dry periods and reduced infiltration, and rising sea levels as natural causes contribute to this imbalance [
3]. On the other hand, the imbalance may be the result of the high groundwater gradients after high intensity precipitation causing a mixing zone expansion due to uplifting of the salinized water from very deep zone of the karst aquifer. The main causes of these changes are climate changes that causes prolongation of dry, summer periods, increased precipitation intensities, increased mean air temperature, and increased evapotranspiration [
4]. Anthropogenic reasons such as excessive abstraction for public water supply, industry, or agriculture, or drainage of floodplains by building drainage canals or tunnels can also contribute to this imbalance [
2,
5].
The problem of salinization of coastal springs and the impact of salinization on coastal aquifer zones has been studied in numerous aquifers and coastal springs throughout Croatia [
2,
6,
7,
8,
9] and the Mediterranean area [
10,
11,
12,
13,
14,
15].
In numerical representations, the mixing zone is approximated as a sharp boundary and with the basic law of Ghyben–Herzberg [
16,
17]. This law is based on the ratio of the difference in the density of fresh and saline seawater and applies only to stationary flow conditions with equal horizontal velocities in the freshwater zone. According to this approximation, for every 1 m of freshwater layer above sea level, about 40 m of freshwater lens below sea level to the boundary of the fresh and saltwater mixing zone can be expected. The situation is much more complex; therefore, this law can be used only as a rough approximation [
18].
The coastal karst aquifer Bokanjac-Poličnik is one of the catchments in the Dinaric karst region and is in the Adriatic Sea catchment area. The Dinaric karst aquifers are very complex structures and according to the categorization of karst terrains [
19], they belong to the category of extreme karst. As such, they are extremely anisotropic and inhomogeneous structures, and it is very difficult to determine hydraulic parameters in such aquifers [
20], which is necessary for the development of mathematical models. With numerous limitations and approximations, it is possible to set up a mathematical model, but with a large amount of data on fracture systems in modeled catchments [
21], which is not the case in the investigated catchment where only a few piezometric boreholes were drilled.
When studying the relationship between the mixing of salt and fresh water in coastal aquifers, only the upper boundary of the mixing zone, i.e., the zone where the increase in salinity occurs, was most often investigated. In order to obtain a quality presentation of the dynamics of the mixing zone in different hydrological conditions, it is necessary to monitor the change of chemical and physical indicators of salinization along the aquifer depth by drilling and equipping deep piezometric wells.
Chemical and physical indicators that are measurable in water and can be related to some of the processes are considered natural tracers. The most significant examples of natural tracers for the detection of salinity and monitoring of the mixing zone of salt and fresh water in the aquifer are chloride ions (Cl
−), sulfate ions (SO
42−), and the value of electrical conductivity (EC). Natural tracers can indicate a change in the position and dynamics of the salt and freshwater mixing zone even at low concentrations [
1]. It is necessary to observe changes in these parameters along the depth of the aquifer to determine the dynamics of freshwater lenses, but also zones of mixing salt and fresh water in different hydrological and climatological conditions and in terms of pumping different amounts of water from coastal aquifers.
The coastal karst aquifer Bokanjac-Poličnik is an unconfined, anisotropic, and inhomogeneous aquifer in which the karstification is very deep which allows very deep underground flows, as well as the existence of saltwater in very deep aquifer zones. Given the relatively small distance of the Boljkovac water pumping station from the sea, it can be assumed that in the deep part of the aquifer under the freshwater there is a saltwater zone which probably affects the salinization processes of the Boljkovac water pumping station. This is currently impossible to prove because the wells drilled in the catchment area allow monitoring of deeper parts of the aquifer, but not the deepest parts of the aquifer due to their insufficient depth.
The pumping station Boljkovac near Zadar was chosen for the analysis of salinization because there are many similar cases in Croatia and in the wider Mediterranean area [
22]. All these pumping stations need to set up a quality management system in conditions of threatening salinization, and such an analysis can serve as a basis. Similar research and analysis are needed at each of the coastal karst springs and pumping stations that occasionally have salinization problems due to the impact of seawater intrusion into the freshwater system. Due to the diversity of geological structures in karst coastal aquifers, each analysis must be adapted to local geological conditions.
2. Hydrogeological Description of the Bokanjac-Poličnik Catchment Area and Boljkovac Water Supply Pumping Station
The Boljkovac water supply pumping station is located in the discharge zone of the Bokanjac-Poličnik catchment area as one of the five water pumping stations in the basin. All of them are included in the water supply system of the city of Zadar in a way that they are managed centrally from the control room located at the Bokanjac pumping station. The Boljkovac water supply site is one of the pumping stations where there is no permanent crew, but the operation of the pumps is controlled remotely.
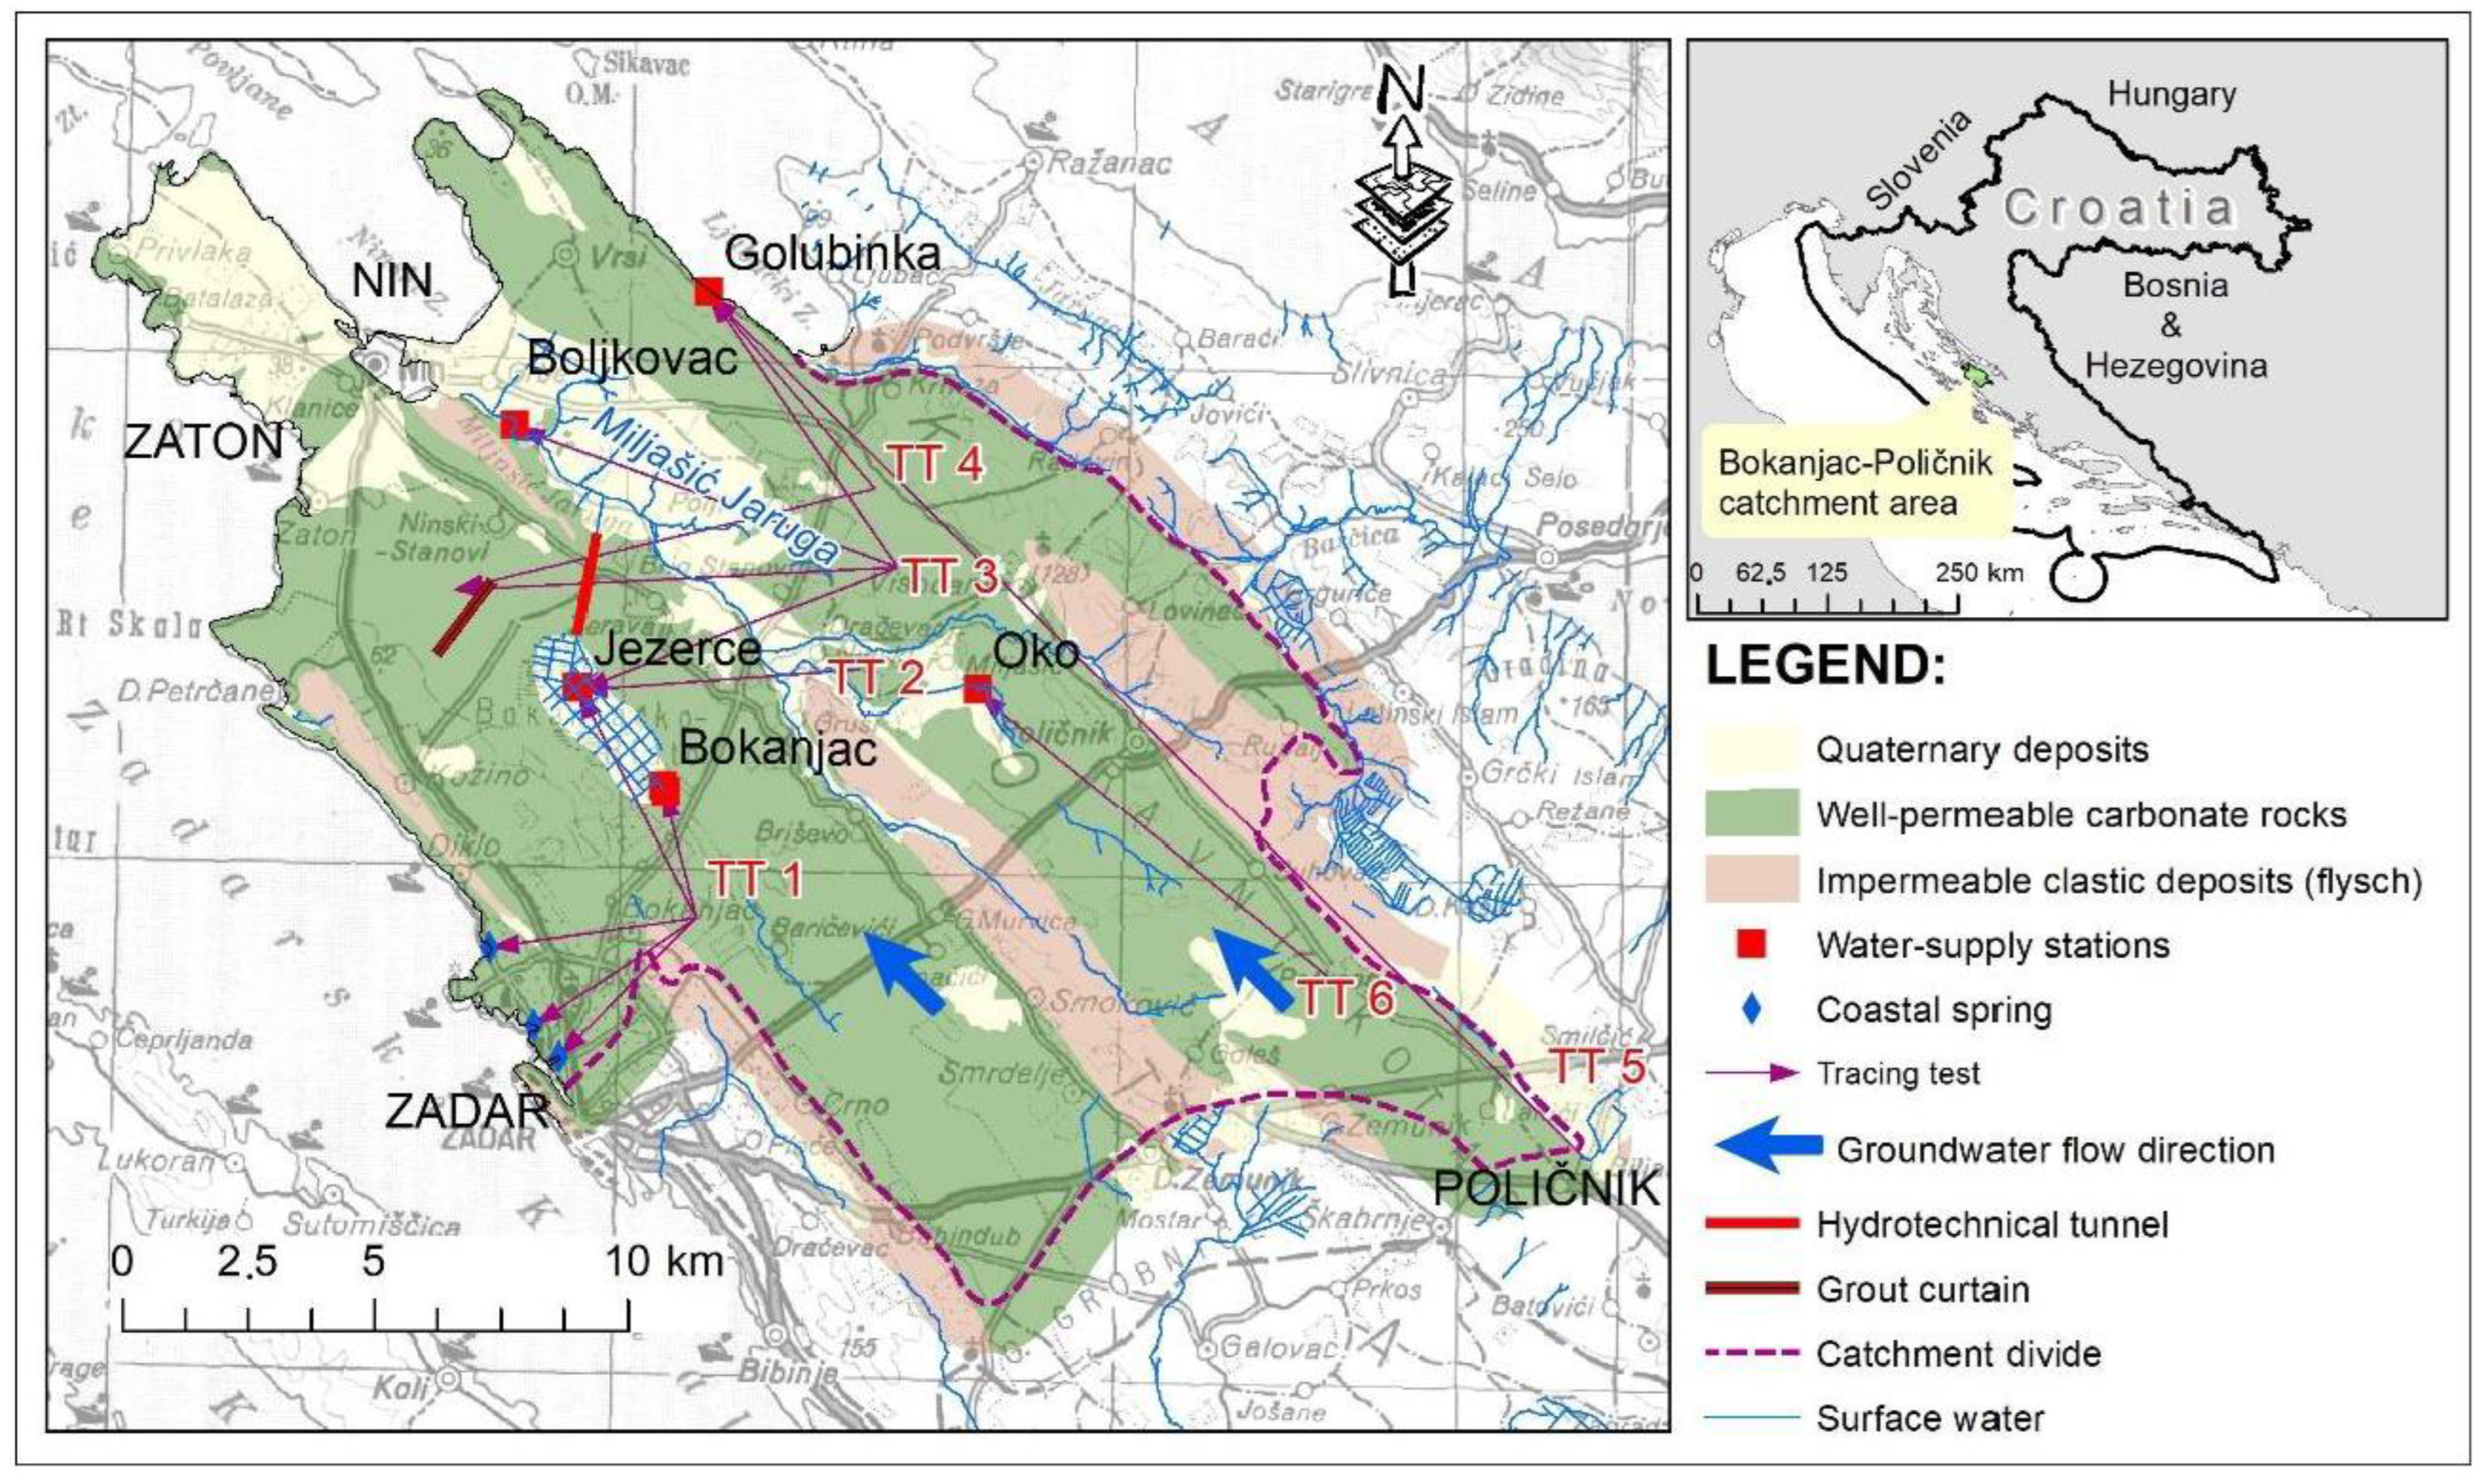
The Bokanjac-Poličnik catchment area is characterized by a geological structure in which water-permeable carbonate rocks and water-impermeable clastic deposits alternate in lateral direction (
Figure 1). The cores of the anticline parts are built of limestones of Upper Cretaceous age, while the syncline parts are built of impermeable flysch deposits of the Paleogene age. Limestones of Paleogene age were transgressively sedimented on limestones of Cretaceous age, and on top of them were continuously sedimented flysch deposits. The thickness of the flysch complex is estimated to be several hundred meters, but due to the erosion process on a large part of the catchment area, flysch deposits have been eroded. Therefore, in the upstream part of the catchment area, flysch deposits represent a hydrogeological barrier and separate the catchment area into two main flow directions, while in the downstream part of the catchment area, the thickness of flysch is significantly reduced or is completely eroded. Groundwater flows occur in water-permeable carbonate rocks that are karstified much deeper than the current sea level. Such karstification is the result of changes in sea level during the Quaternary. Since the last ice age, the sea level has risen by about a hundred meters [
23], which has caused the processes of karstification and the creation of a system of fractures that are much deeper than today’s sea level. The cover deposits in the zone between the Boljkovac pumping station and the seacoast are sedimented on a large area, but due to their limited depth, they do not have a significant impact on the hydrogeological conditions of the Boljkovac water supply capture.
For determining the catchment area and groundwater flow directions, six tracing tests were performed in the last 55 years. The first tracing test in the catchment area (TT1) was performed in 1966 with proving the groundwater connection to the Bokanjac pumping station (apparent groundwater velocity 1 cm/s) and to the Jezerce pumping station (3.2 cm/s). Moreover, the connection to coastal springs and water supply sites in the wider area of Zadar has been proven but without information about apparent groundwater velocities. The next tracing test (TT2) was performed in 1967 from the area downstream from the Oko pumping station, which proved the groundwater connection to the Jezerce pumping station (2.9 cm/s). Tracing test TT3 was performed in 1968 and it proved the groundwater connection to the Jezerce pumping station (1.1 cm/s), to the piezometric well in the area of the grout curtain (2.3 cm/s), to the Boljkovac pumping station (1.1 cm/s), and to the Golubinka spring (0.5 cm/s). Tracing test TT4 was performed in 1968 and it proved the groundwater connection to the piezometric well in the area of the grout curtain (1.4 cm/s) and to the Golubinka spring (1.4 cm/s). The only real regional tracing test in the area of the Bokanjac-Poličnik catchment area (TT5) was performed in 1975 from the southeastern part of the catchment area. The tracer was injected in the wider area of Poličnik and the groundwater connection with the Golubinka spring (8.1 cm/s) was proven. For the purpose of researching the location of the future Waste Management Center of Zadar County, the tracing test (TT6) was performed in 2007. Tracer appeared at the Oko water pumping station (2.5 cm/s) [
24].
Groundwater flow directions in the Bokanjac-Poličnik catchment area are parallel or subparallel to the geological structures in the southeast-northwest direction in two separate parts or flow lines, as proved by the tracing tests. The first flow line is on the northeast side of the flysch barrier from Poličnik to the northwest side of the catchment area following the geological structures. The majority of groundwater of this flow line flows towards the coastal spring Golubinka and the pumping station Boljkovac. Only after the zone where the flysch barrier ends, the groundwater flows perpendicular to the spread of the structures, towards the Jezerce pumping station. The second flow line is towards Bokanjačko Blato and further towards Boljkovac and to the northwestern part of the catchment area where groundwater diffusely discharges to the sea near Zaton and Nin.
The natural conditions of surface water and groundwater dynamics have been partially changed by the construction of a hydrotechnical tunnel through which the flood waters of Bokanjačko Blato have been drained to the Miljušić Jaruga since 1963. This prevents the formation of a temporary lake in the area of Bokanjačko Blato. Prior to the construction of this facility, the area of Bokanjačko Blato was occasionally flooded and slowly emptied by sinking in the northwestern part of the field. With the construction of the tunnel, the area of Bokanjačko Blato is no longer flooded, thus enabling permanent agricultural activity in this area. Irrigation and drainage canal systems have been built for this purpose. However, on the other hand, this intervention also changed the conditions of groundwater recharge, i.e., reduced the positive impact of infiltration of that surface waters on the hydrogeological conditions in the aquifer.
Almost all water supply facilities in the catchment area (Golubinka, Boljkovac, Jezerce, Bokanjac) have temporary problems with saltwater intrusion. Because of that, the grout curtain was constructed in the mid-seventies of the last century downstream of the Jezerce and Bokanjac pumping station to prevent saltwater intrusion [
24]. The grout curtain did not have results because the groundwater flow is much deeper than the depth of the grout curtain and after the grout curtain construction, there were occasional salinity increases at the Bokanjac and Jezerce pumping stations.
The climate in the Bokanjac-Poličnik catchment area is determined by latitude, the Adriatic Sea, the mountainous area north and northeast of the catchment area, and to a lesser extent by the hinterland of the flatted area southeast of the catchment area and the islands of the Zadar archipelago. Latitude determines the annual amount of sun and radiation and determines the circulation of the atmosphere that affects weather and climate. In the summer months, the influence of the subtropical zone becomes significant. Local climatic conditions are determined based on data for the period from 1961 to 1990. Air temperature mainly depends on the length and intensity of solar radiation, and only partly depends on the composition of the land surface (e.g., soil type, vegetation) and topography. The annual cycle of monthly average air temperatures has marine characteristics where autumns are 2.5 °C warmer than springs. The average air temperature is 7.4 °C in winter and 22.5 °C in summer [
25].
Precipitation mainly depends on air circulation and moisture content. The Bokanjac-Poličnik catchment area has a maritime type of annual cycle with the least amount of precipitation that occurs during the warm period of the year, i.e., in the period from April to September. The minimum amount of precipitation occurs in July (35 mm) [
26]. For the period 2017–2019 maximum annual mean precipitation value is 1433.9 mm, minimum annual mean precipitation value is 508.8 mm, and average annual mean precipitation value is 911.2 mm.
The Boljkovac water supply pumping station is a dug well 5.75 m deep. It was built in 1972 on the spring of the same name in the lower course of the Miljašić Jaruga watercourse. Although the well is located at an altitude of 3.25 m above sea level and about 2 km away from the sea, it has had elevated concentrations of chloride since the beginning of use due to the influence of the sea, i.e., saline water from the karst underground. Therefore, the built-in capacity of pumps of 100 L/s is not used and only a few tens of L/s are occasionally pumped, mainly during the summer periods when the needs for drinking water in this tourist region are greatest. The Boljkovac pumping station does not have an overflow, and the capacity of the water supply capture is not possible to measure except by the pumping tests.
The main watercourse in the Bokanjac-Poličnik catchment area is the Miljašić Jaruga watercourse, and apart from its natural immediate surface catchment area, surface waters also characterize its most important tributary, the hydrotechnical tunnel that transfers waters from the Bokanjačko Blato area to the Miljašić Jaruga. Miljašić Jaruga begins its course at an elevation of about 88 m asl near the Oko water supply capture and after 25 km of flow flows into the sea near the town of Nin. Miljašić Jaruga watercourse passes right next to the Boljkovac water supply pumping station where a water gauge station has been set up. In the period from 1996 to 2018, the maximum measured flow at the water gauge station was 8.83 m
3/s, while during the dry periods dries up (
Table 1), which gives it a distinctly torrential character [
24].
3. Monitoring Data and Input Data for the Analysis
For the analysis of the salinization mechanism and dynamics of the mixing zone in the coastal karst aquifer, the Boljkovac water supply site near Zadar was selected, which is salinized several times a year, even in completely natural conditions. In addition to the pumping station, a piezometric well up to 60 m below sea level was drilled and equipped, which includes an automatic monitoring system for measuring electrical conductivity, temperature, and groundwater level at depth every 10 m. The piezometric borehole is located about 30 m upstream of the water supply station Boljkovac. Furthermore, by measuring the same parameters, the pumping station was equipped. The dynamics of measurements on the automatic monitoring system are set to every ten minutes and were measured during the period from 2017 to 2019. Data from laboratory analyses of chlorides and sulphates were additionally used in the analysis.
The reference period for salinity analysis at the Boljkovac water supply pumping station is from 2017 to 2019 when the operational monitoring was carried out, because due to salinization of that part of the coastal aquifer, the groundwater body (GWB) Bokanjac-Poličnik, in which it is located, was assessed as bad status and at risk during the preparation of the River Basin Management Plan of the Republic of Croatia for the period from 2016 to 2021 (RBMP 2016–2021) [
26].
For the reference period, available data on chloride and sulphate concentrations in groundwater were processed, as well as data obtained from operational monitoring, namely values of electrical conductivity, temperature, and groundwater level in the water supply facility Boljkovac and the piezometric well near the water supply facility by aquifer depth.
Chloride concentrations were analyzed for a longer period than the reference period, i.e., for the period from 1995 to 2019. During this period, data on chloride concentrations in the water supply facility were analyzed, as a rule, once a week.
Figure 2 shows the average, minimum, and maximum annual concentrations of chloride in relation to the maximum allowed concentrations (MAC) for drinking water in Croatia, which is 250 mg/L. This indicates that the Boljkovac water supply facility can only be used occasionally when chloride concentrations are below that MAC value. In average annual values, chloride concentrations are 565 mg/L, the minimum is 150 mg/L, and the maximum is 1775 mg/L, which indicates that the Boljkovac water supply facility is under the constant influence of salinization.
In the reference period, sulphates exceeded the MAC value (250 mg/L) in only one sample (31 March 2017) and the measured concentration was 678.86 mg/L (
Figure 3). In all other analyses, sulfate concentrations were below the MAC values.
Chlorides and sulphates are indicators of salinization, but for their analysis it is necessary to take a sample and analyze it in the laboratory, which makes it impossible to continuously monitor the dynamics of the mixing zone. Therefore, operational monitoring includes the measurement of electrical conductivity, which enables continuous measurement of aquifer behavior in very small-time increments. In the case of the Boljkovac water supply facility, the entire depth of the aquifer was measured every 10 min.
Based on the measured data in the laboratory (chlorides and sulfates) and the data measured by automatic electrical conductivity meters, a correlation analysis was carried out showing the relationship between these parameters (
Figure 4). The data used in the analysis are from 2017 to 2019.
Correlation values are very high, especially in the case of the relationship between electrical conductivity and chloride concentrations (
Figure 4b), suggesting that instead of measuring chloride or sulfate concentrations, electrical conductivity measurements can be established with control analyses in the laboratory.
In order to establish the operational monitoring to identify the mechanism and dynamics of salinization, in the immediate vicinity of the Boljkovac water pumping station (
Figure 5), a new piezometric well BOLJ-1 with a depth of 65.6 m was drilled. Divers have been installed in the well to measure the groundwater level, electrical conductivity, and temperature every 10 m of depth. The divers were set to measure every 10 min and are placed at depths of 20 m, 30 m, 40 m, 50 m, and 60 m below mean sea level [
24].
After the piezometric well was finished, for the identification of the salt and fresh water mixing zone, on 20 February 2018, electrical conductivity (EC) and groundwater temperature (T) were measured in the BOLJ-1 well every 5 m. The electrical conductivity up to a depth of 35 m was about 0.875 mS/cm, while at a greater depth it was about 2.4 mS/cm. This difference in the values of electrical conductivity indicates the existence of a zone of mixing fresh and salt water [
24].
The data used for the analysis of salinization at the Boljkovac water supply facility are temperature (°C), electrical conductivity (mS/cm), and groundwater level (m) while at the water pumping station and in the BOLJ-1 piezometer, pumping rates from the water supply facility, precipitation quantities (mm) measured at the hydrological station Zadar, the flow rates at the water gauge station Miljašić Jaruga, and the concentration of chlorides and sulfates (mg/L) at the pumping station. Data on precipitation and flow rates were obtained from the State Hydrometeorological Service, while data on pumping quantities and concentrations of chlorides and sulfates in water supply facility were obtained by the Zadar Waterworks. As part of the operational monitoring, data were collected on water temperature and electrical conductivity by the depth of the aquifer and in the pumping station itself, as well as on the groundwater level and the water level in the pumping station.
The water pumping station was not active during the entire period of operational monitoring, but was active in two periods, from 6 June 2018 to 4 November 2018 and from 28 June 2019 until 31 August 2019. In 2018, about 5 L/s were pumped in June, and in July this amount increased to about 20 L/s.
4. Results of Analysis and Discussion
In the observed period, the Boljkovac pumping station was salinized a few times, from the end of 2017 to the mid of June 2018, in February 2019 (5.27 mS/cm), in April 2019 (4.89 mS/cm), and in May 2019 (3.73 mS/cm). All those events were during the rainy periods. During the dry periods, the value of electrical conductivity was slightly increased but within the allowable values (about 1 mS/cm). In the nearby piezometric well, in the shallow zone, the electrical conductivity values were very similar to those in the water supply facility, while in the deeper parts of the aquifer the electrical conductivity measurement indicated a certain dynamic of the salt and fresh water mixing zone, especially during the salinization period (
Figure 6).
During dry periods, the aquifer was complete with freshwater up to the depth of 50 m, while during rainy periods the mixing zone was widened and raised, which caused the rising of the upper limit of the mixing zone to a depth of about 30 m. During these periods, a significantly higher value of electrical conductivity was recorded in the deeper parts of the aquifer, and at a depth of about 50 m, the mixing zone passed into a completely saline zone (
Figure 6).
Table 2 shows the average, minimum, and maximum measured values of the observed parameters in the period from December 2017 to the end of October 2019 obtained by operational monitoring.
The MAC values of electrical conductivity are defined by the rulebook on the quality of drinking water [
26] and RBMP 2016–2021 [
27]. For the drinking water, the MAC value of electrical conductivity is 2.5 mS/cm, while according to RBMP 2016–2021, the threshold value for EC for coastal aquifers where salinization and other intrusions are possible was reduced to 1.25 mS/cm. The limit value of the rulebook on drinking water determines the possibility of using water for public water supply, while the RBMP 2016–2021 singles out those coastal aquifers that are under the influence of the sea and determines the implementation of classification tests to determine groundwater status in accordance with the Water Framework Directive [
28].
In the period from the end of 2017 to the end of 2019, the MAC value of electrical conductivity for drinking water at the Boljkovac water pumping station was exceeded on several occasions, exclusively during rain periods (
Figure 7). In those periods, there was no pumping for the public water supply, so the causes of salinization must be sought in the dynamics of the aquifer in natural conditions. During the summer dry periods, up to a maximum of 47 L/s was pumped for the public water supply, but this pumping did not have a negative impact on the behavior of the mixing zone of salt and fresh water, or on the occurrence of salinization of this coastal aquifer.
Precipitation during rainy periods contributes to the recharge of aquifers and causes an increase in groundwater levels, higher groundwater flow velocities, and higher hydraulic gradients. In the Dinaric karst area, the base of the karstification reaches more than 100 m below today’s sea level, which is the result of changes in sea level during the Quaternary. Deep fracture systems allow direct contact of salt seawater and freshwater of coastal aquifers and the establishment of a labile balance of salt and fresh water in the deep karst underground. Due to the very small distance of the Boljkovac pumping station from the sea, it can be assumed that below the freshwater zone, there is a saltwater zone which could affect the salinization processes of the Boljkovac pumping station. Precipitation during rainy periods significantly changes the flow dynamics in the coastal karst aquifer and disturbs the labile balance of salt and fresh water in the deep karst underground and can cause uplifting of the salinized water from the deep parts of the aquifer.
Salinization at the Boljkovac water supply station occurs only during rainy periods. Given that the water supply station is exploited exclusively during summer dry periods and there are no other pumping stations nearby for the needs of public water supply, agriculture, or industry that could affect these events, it can be concluded that salinization occurs in completely natural conditions by disrupting the labile balance of salty and fresh water in the karst underground. Salinization lasts only a few days and after that, the salinity returns to the level before the salinization event. This indicates that the salinization comes from the deeper part of the karst aquifer by pushing the saltwater towards the surface due to increased gradients in the aquifer itself.
Figure 8 shows the conceptual model of the aquifer and the level of electrical conductivity values per aquifer depth during summer dry periods in the area of the Boljkovac pumping station.
The connection between the amount of precipitation at the rain gauge station in the catchment area and the value of electrical conductivity at the Boljkovac water pumping station was analyzed.
Figure 9 shows that due to increased rainfall, there is an increase in groundwater levels, and consequently the value of electrical conductivity. In dry conditions, during the summer periods, the lowest groundwater levels were recorded, as well as the lowest values of electrical conductivity.
Figure 10 shows the relationship between the water level in the Miljašić Jaruga watercourse, groundwater level (GWL) in the piezometric well BOLJ-1, sea level, and the value of electrical conductivity in the deepest part of the piezometric well BOLJ-1.
Figure 9 shows that significant increases in the value of electrical conductivity in the deepest part of the BOLJ-1 well are accompanied by high groundwater levels, high water levels of the Miljašić Jaruga watercourse, and elevated sea levels. Already at a depth of 50 m, increases in the value of electrical conductivity were not so pronounced, except in extreme cases (7 February 2019) when salinization was recorded along almost the entire depth of the well. Then, the elevated groundwater levels and also water levels of the Miljašić Jaruga watercourse coincided after a long stable period with a significant increase in sea level of almost 60 cm in just a few days. The result is an uplifting of the mixing zone of salt and fresh water in the aquifer and an increase in salinity along almost the entire depth of the aquifer. These phenomena of elevated values of electrical conductivity last only a few days when they return to their normal values.
Boljkovac water supply facility is located in the zone of influence of sea tides, although that influence is not great. The analysis shows (
Figure 11) that the daily amplitudes of the sea tides are about 50 cm, while the daily fluctuation of the groundwater level in Boljkovac is only a few centimeters (2–2.5 cm). A dry period was selected during which there was no pumping at the Boljkovac water pumping station and during which there was no precipitation to exclude the influence of precipitation and changes of surface water level in the Miljašić Jaruga watercourse. There was a delay in the fluctuation of groundwater levels in relation to changes in sea level of about 12 h (
Figure 11).
From the presented relationships of different parameters (groundwater level, sea level, electrical conductivity, chlorides, sulfates, precipitation), it can be concluded that the Boljkovac water supply facility is under the influence of the sea even though it is about two kilometers away.
In the Bokanjac-Poličnik catchment area, where the Boljkovac water pumping station is located, the analysis of trends in annual precipitation, average annual air temperature, average annual flow of Miljašić Jaruga watercourse, and average annual sea level for the period 1961 to 2009 indicates reduced average annual precipitation in analyzed period of almost 200 mm, increase of average annual air temperature by 1.5 °C, increase of average annual sea level by about 5 cm and decrease of flow on Miljašić Jaruga by about 0.4 m
3/s [
6]. Climate models with forecasts indicate a further reduction in precipitation by 2100 [
29]. Moreover, extremes are already happening today, with precipitation of higher intensity in a shorter period.
Boljkovac water pumping station is located in the aquifer zone with a very unstable balance of salt and fresh water. During the summer dry periods on the Boljkovac pumping station, saltwater intrusion has not occurred, but during the rainy periods, Boljkovac water pumping station were salinized several times.
Climate changes will affect the reduction of total annual precipitation, increase in air temperature, increase of evapotranspiration, sea level rise, which will certainly negatively affect the already labile balance of salt and fresh water during the summer at the Boljkovac water pumping station. For now, there is no salinization during the summer periods, but as a result of climate changes, an increased risk of salinization can be expected.
5. Conclusions
Two threatening salinization phenomena were recorded at the pumping station Boljkovac. One is the rise of saltwater from the deep karst underground as a result of heavy rains after drought periods, and the other is the continuously slightly increased salinity at the pumping station compared to the upstream part of the basin due to the proximity of the seacoast and the influence of the mixing of salty water under the influence of the sea and fresh water of the coastal karst aquifer.
The first phenomena can be interpreted in the way that under completely natural conditions, as a result of the increase of the gradient in the aquifer, the saltwater from the deep karst underground is uplifted through the karst fractures systems, the mixing zone is becoming thicker, and that process is causing the salinization problems on the water supply pumping station Boljkovac.
The second phenomena can be interpreted in the way that the constantly slightly elevated values of electrical conductivity are the consequence of the proximity of the mixing zone of salt and fresh water and the constant slight influence of the sea on this part of the karstic coastal aquifer.
The parameters that directly indicate the appearance of salinity are electrical conductivity, chlorides, and sulfates. Analysis of concentrations of chlorides and sulfates are cheap and simple but are carried out in laboratories on samples taken in the field. This is usually limited to one sample per day. On the other hand, electrical conductivity values correlate well with chloride and sulphate concentrations and can be measured continuously by obtaining significantly more data for analyses of salt and fresh water mixing zone dynamics in coastal aquifers.
The values of these parameters increase after long periods of drought, followed by extremes that are manifested in sudden precipitation in large quantities. Such precipitation washes away saline karst siphons, pushes saltwater towards the pumping station, which is a place of low hydraulic resistance, and raises the mixing zone of salt and fresh water. According to the values of electrical conductivity measured in the piezometric well BOLJ-1, it can be concluded that the mixing zone of salt and fresh water is located at a depth of more than 40 m. Moreover, according to the values of electrical conductivity (greater than 1 mS/cm) and chlorides and sulfates (greater than 150 mg/L), it can be concluded that the aquifer is under the constant influence of salinization.
Climate changes are manifested in rising air temperatures, which in turn lead to rising sea levels and reduced annual quantities of precipitation. The expected significant reduction in precipitation by 2100 will reduce infiltration in the recharge zones of the catchment areas, which will influence the position of the mixing zone of salt and fresh water and disturb the labile balance of salt and fresh water in the aquifer and increase the possibility of enlarged intrusion of seawater and salinization with greater consequences.
According to the presented analysis of pumping quantities and concentrations of chlorides and sulphates and the values of electrical conductivity at the Boljkovac water pumping station, it can be concluded that salinization is caused mostly by natural processes. Furthermore, the analysis of data obtained from operational monitoring for the Boljkovac water pumping station showed that the values of electrical conductivity and chloride concentrations during summer dry periods are higher than in the upstream parts of the aquifer but below the allowable values, and after the first sudden and heavy rains, the values increase and exceed MAC values, which makes it impossible to use such water for the public water supply.
To mitigate the consequences of the above, it is necessary to reduce the risk of potential salinization. The most important step in the protection of groundwater is the establishment of appropriate monitoring that can detect changes in the qualitative and quantitative status of water in a timely manner. A good example of establishing proper monitoring is the Bokanjac-Poličnik catchment area, but the installation of measuring devices with telemetry and early warning system would enable a timely response to elevated values of measured parameters. As groundwater from karst aquifers is used for water supply, it is important to pump in appropriate quantities that cannot adversely affect the quantitative status, and therefore qualitative, i.e., to raise the mixing zone of salt and fresh water and cause the salinization of the aquifer.
The existing monitoring system is sufficient for the management of the pumping station, but to monitor the dynamics of the deepest part of the aquifer, it is necessary to have much deeper piezometric boreholes that would enter the saltwater zone under the freshwater lens.


