Article

Spectroscopic Measurements of Dissolved O3, H2O2 and OH Radicals in Double Cylindrical Dielectric Barrier Discharge Technology: Treatment of Methylene Blue Dye Simulated Wastewater

by
Emile Salomon Massima Mouele
1,*,
Jimoh. O. Tijani
2,
Milua Masikini
3,
Ojo. O. Fatoba
1,
Chuks P. Eze
1,
Chionydua T. Onwordi
1,4,
Myo Tay Zar Myint
5,
Htet Htet Kyaw
6,
Jamal Al-Sabahi
6,7,
Mohammed Al-Abri
6,7,
Sergey Dobretsov
8,9,
Katri Laatikainen
10 and
Leslie. F. Petrik
1,*
1
Environmental and Nano Sciences (ENS) Research Group, Department of Chemistry, University of the Western Cape, Bellville 7535, South Africa
2
Department of Chemistry, Federal University of Technology, PMB 65, PO. Box 920 Minna, Niger State 920001, Nigeria
3
Sensor Lab, Department of Chemistry, University of the Western Cape, Robert Sobukwe Road, Bellville 7535, South Africa
4
Department of Chemistry, Faculty of Science, Lagos State University, LASU P.O. Box 0001, Ojo, Lagos 102001, Nigeria
5
Department of Physics, College of Science, Sultan Qaboos University, P.O. Box 36, 123 Al-Khoud, Muscat 123, Oman
6
Nanotechnology Research Center, Sultan Qaboos University, P.O. Box 33, Al-Khoud, Muscat 123, Oman
7
Petroleum and Chemical Engineering Department, Sultan Qaboos University, P.O. Box 33, Al-Khoud, Muscat 123, Oman
8
Department of Marine Science and Fisheries, Sultan Qaboos University, P.O. Box 34, Al-Khoud, Muscat 123, Oman
9
Center of Excellence in Marine Biotechnology, Sultan Qaboos University, P.O. Box 50, Al-Khoud, Muscat 123, Oman
10
Laboratory of Separation Technology, Lappeenranta University of Technology, P.O. Box 20, FI-53851 Lappeenranta, Finland
*
Authors to whom correspondence should be addressed.
Submission received: 3 March 2020 / Revised: 4 April 2020 / Accepted: 16 April 2020 / Published: 18 May 2020

Abstract

:
Advanced oxidation technologies (AOTs) focusing on nonthermal plasma induced by dielectric barrier discharge are adequate sources of diverse reactive oxygen species (ROS) beneficial for water and wastewater treatment. In this study, indigo, peroxytitanyl sulphate and terephthalic acid methods were used to approximate the concentrations of O3, H2O2 and OH produced in a double cylindrical dielectric barrier discharge (DCDBD) plasma configuration. The effect of pH and scavengers as well as the amount of chemical probes on the generation of oxidants was investigated. The efficiency of the DCDBD reactor was further evaluated using methylene blue (MB) as model pollutant. The results demonstrated that the formation of oxidants O3, H2O2 and OH in the DCDBD reactor was pH-dependent. Furthermore, the presence of scavengers such as phosphates, bicarbonates and carbonates in the solution diminished the amount of OH in the system and hence could impact upon the degree of detoxification of targeted pollutants during water and wastewater treatment. The MB simulated dye was totally decomposed into H2O, dissolved CO2 and simpler aqueous entities. Herein the DCDBD design is an adequate AOT that can be used worldwide for effective decontamination of water and wastewater.

Graphical Abstract

1. Introduction

Textile, pharmaceutical, and other industries utilize a high amount of water and chemicals during their operation and, as a consequence, release large volumes of untreated water and wastewater containing complex and highly recalcitrant persistent organic pollutants (POPs) and microbes into water bodies [1,2]. Specifically, azo dyes present in textile wastewater, pharmaceuticals and personal care products in water and wastewater treatment plants (WWTPs) have been identified as the most persistent pollutants due to their intense colouration and occurrence in water sources which disrupt human health, ecological system, and aquatic lives [3]. This untreated/partially treated wastewater from various industries discharged into rivers, lakes, land etc. has detrimental effects on the flora and fauna in the environment and causes related human health hazards. Several treatment methods including physical, chemical and biological processes such as activated carbon, ozonation, reverse osmosis, ion exchange on synthetic adsorbent resins, flocculation, decantation [4] have been explored [5,6,7,8,9,10]. However, these techniques are often associated with limitations such as sludge formation in the case of precipitation, regular adsorbent regeneration, which sometimes becomes costly and time-consuming, and the complexity of aromatic compounds during the adsorption process, which hinders their practicability [11]. Recently, advanced oxidation processes (AOPs) have emerged as alternative methods for total degradation of POPs in aquatic media [12,13,14,15]. AOPs involve the generation of the most powerful and nonselective oxidant OH that can attack and mineralize any type of water pollutant into CO2, H2O, and inoffensive byproducts. The efficiency of a particular AOP generally depends on the amount of OH radicals produced. AOPs induced by dielectric barrier discharges (DBDs) produce UV light and various reactive oxygen and nitrogen species, such as O3, H2O2, O, OH, NO and NO2, to mention but a few, without any environmental impacts. These species can act alone or in combination and create an effective chemical cocktail that directly or indirectly decomposes and mineralizes organic pollutants into H2O, dissolved CO2, and other entities [16,17]. The common DBD electrode geometries encountered in the literature include single and double planar DBD, single and double co-axial DBD conformations [18,19]. Their principle, properties, and operation mode have been reviewed by Mouele et al. [16]. The advantage of DBDs relies on the fact that OH radical is produced via multiple chain reactions of UV light with O3 and related reactive oxygen species (ROS) previously mentioned. However, in most single dielectric barrier configurations, the high voltage (HV) is covered by one dielectric material and directly submerged in the solution, which results in the erosion of the anode after long experimental runs. Therefore, the efficiency of nonthermal plasma technologies may depend on the reactor configuration and thus on the concentration of reactive species produced [20,21,22]. Researchers have utilized different DBD reactors to decompose toxic organic dyes in aqueous solutions and achieved different results [23,24,25]. Methylene blue (MB) with the molecular formula (C16H18N3SCl) and a molar mass of 319,85 g/mol is a two-membered ring heterocyclic aromatic compound that has been widely used in the dyeing operation by textile industries [26].. The removal of MB by single dielectric barrier discharges (DBD) in combination with either catalysts or chemicals/gas such as H2O2/O3 that act as efficiency boosting agents has been reported extensively in the literature [27,28,29]. However, the post separation of these chemical additives is costly, time-consuming and tedious. In contrast, the double cylindrical (DCDBD) system does not require the addition of any chemical or catalyst to degrade recalcitrant organic dyes in wastewater. Not only that, but the high voltage electrode in DCDBD is also surrounded by two dielectric layers that protect it against corrosion and improve the density of highly energized electrons that massively contribute to the generation of ROS in the plasma zone and the effluent being remediated. Besides, there is little literature that reports on the complete optimization of the DCDBD configuration for the decontamination of POPs, dye MB or other compounds. In this study, we evaluated the efficiency of the DCDBD reactor by measuring the concentrations of O3, H2O2 and OH using spectroscopic techniques. Therefore, we demonstrated that the DCDBD design generates sufficient active species that could be used as a chemical mixture to induce the decontamination of water pollutants; however, its optimization is mandatory before any application. Consequently, the DCDBD’s performance was further tested on the decontamination of simulated textile wastewater using MB as the model contaminant. The MB degradation intermediates’ byproducts in the treated solution were identified using liquid chromatography–mass spectrometry (LC-MS) and the degradation mechanism pathways were also proposed.

2. Materials and Methods

The silver 1.5 mm high voltage electrode and quartz tube reactors purchased from C.J.LABS South Africa and Glass tech/Johannesburg, RSA, correspondingly, were used to design the DBD reactor that was used in this study. The GW INSTEK programmable power supply PSP-405 (set voltage, 10 kV; set trip current, 40 A; set power, 200 W; set frequency, 2000 Hz; set modes: LF-P(Low-P) and HF-P(Med-P)) was purchased from the Electrical and Engineering Department, Stellenbosch University, Cape Town, South Africa (SA) while the electromagnetic air compressor model Acq-009 (set voltage, 220–240 V; frequency, 50 Hz; power, 185 W; output, 60 L/min) was obtained from Boyu Industrie company. Ltd., Cape Town, South Africa and an airflow meter acquired fromRotameter Manufacturing Company Ltd. in England, UK /tube number R868119/H.D, free liter/minute nitrogen 25 °C 20 p.s.i.g. (maximum flow rate of 160 L/min) purchased from Kimix Laboratory equipment supplier in Cape Town, South Africa was used in the DBD experimental set up shown in Figure 1. The A GBC UV/VIS 920 spectrophotometer and a Varian Cary Eclipse spectrophotometer were used to determine the absorbance and fluorescence intensity of water samples, respectively.
Indigo disulfonate, phosphoric acid (H3PO4), sodium hydrogen phosphate (Na2HPO4), and titanyl sulphate purchased from Sigma-Aldrich South Africa and Kimix SA were used for the quantification of O3 and H2O2 in the DBD reactor. On the other hand, terephthalic acid (TA), sodium hydroxide (NaOH), potassium hydrogen carbonate (KH2PO4), sodium hydrogen phosphate (Na2HPO4), 2-hydroxy terephthalic acid (HTA), sulphuric acid (H2SO4), sodium carbonate (Na2CO3) and sodium chloride (NaCl) purchased from Kimix and Sigma Aldrich SA were utilized for the preparation of solutions used for probing OH radicals in the DBD reactor.

2.1. Experimental Protocols

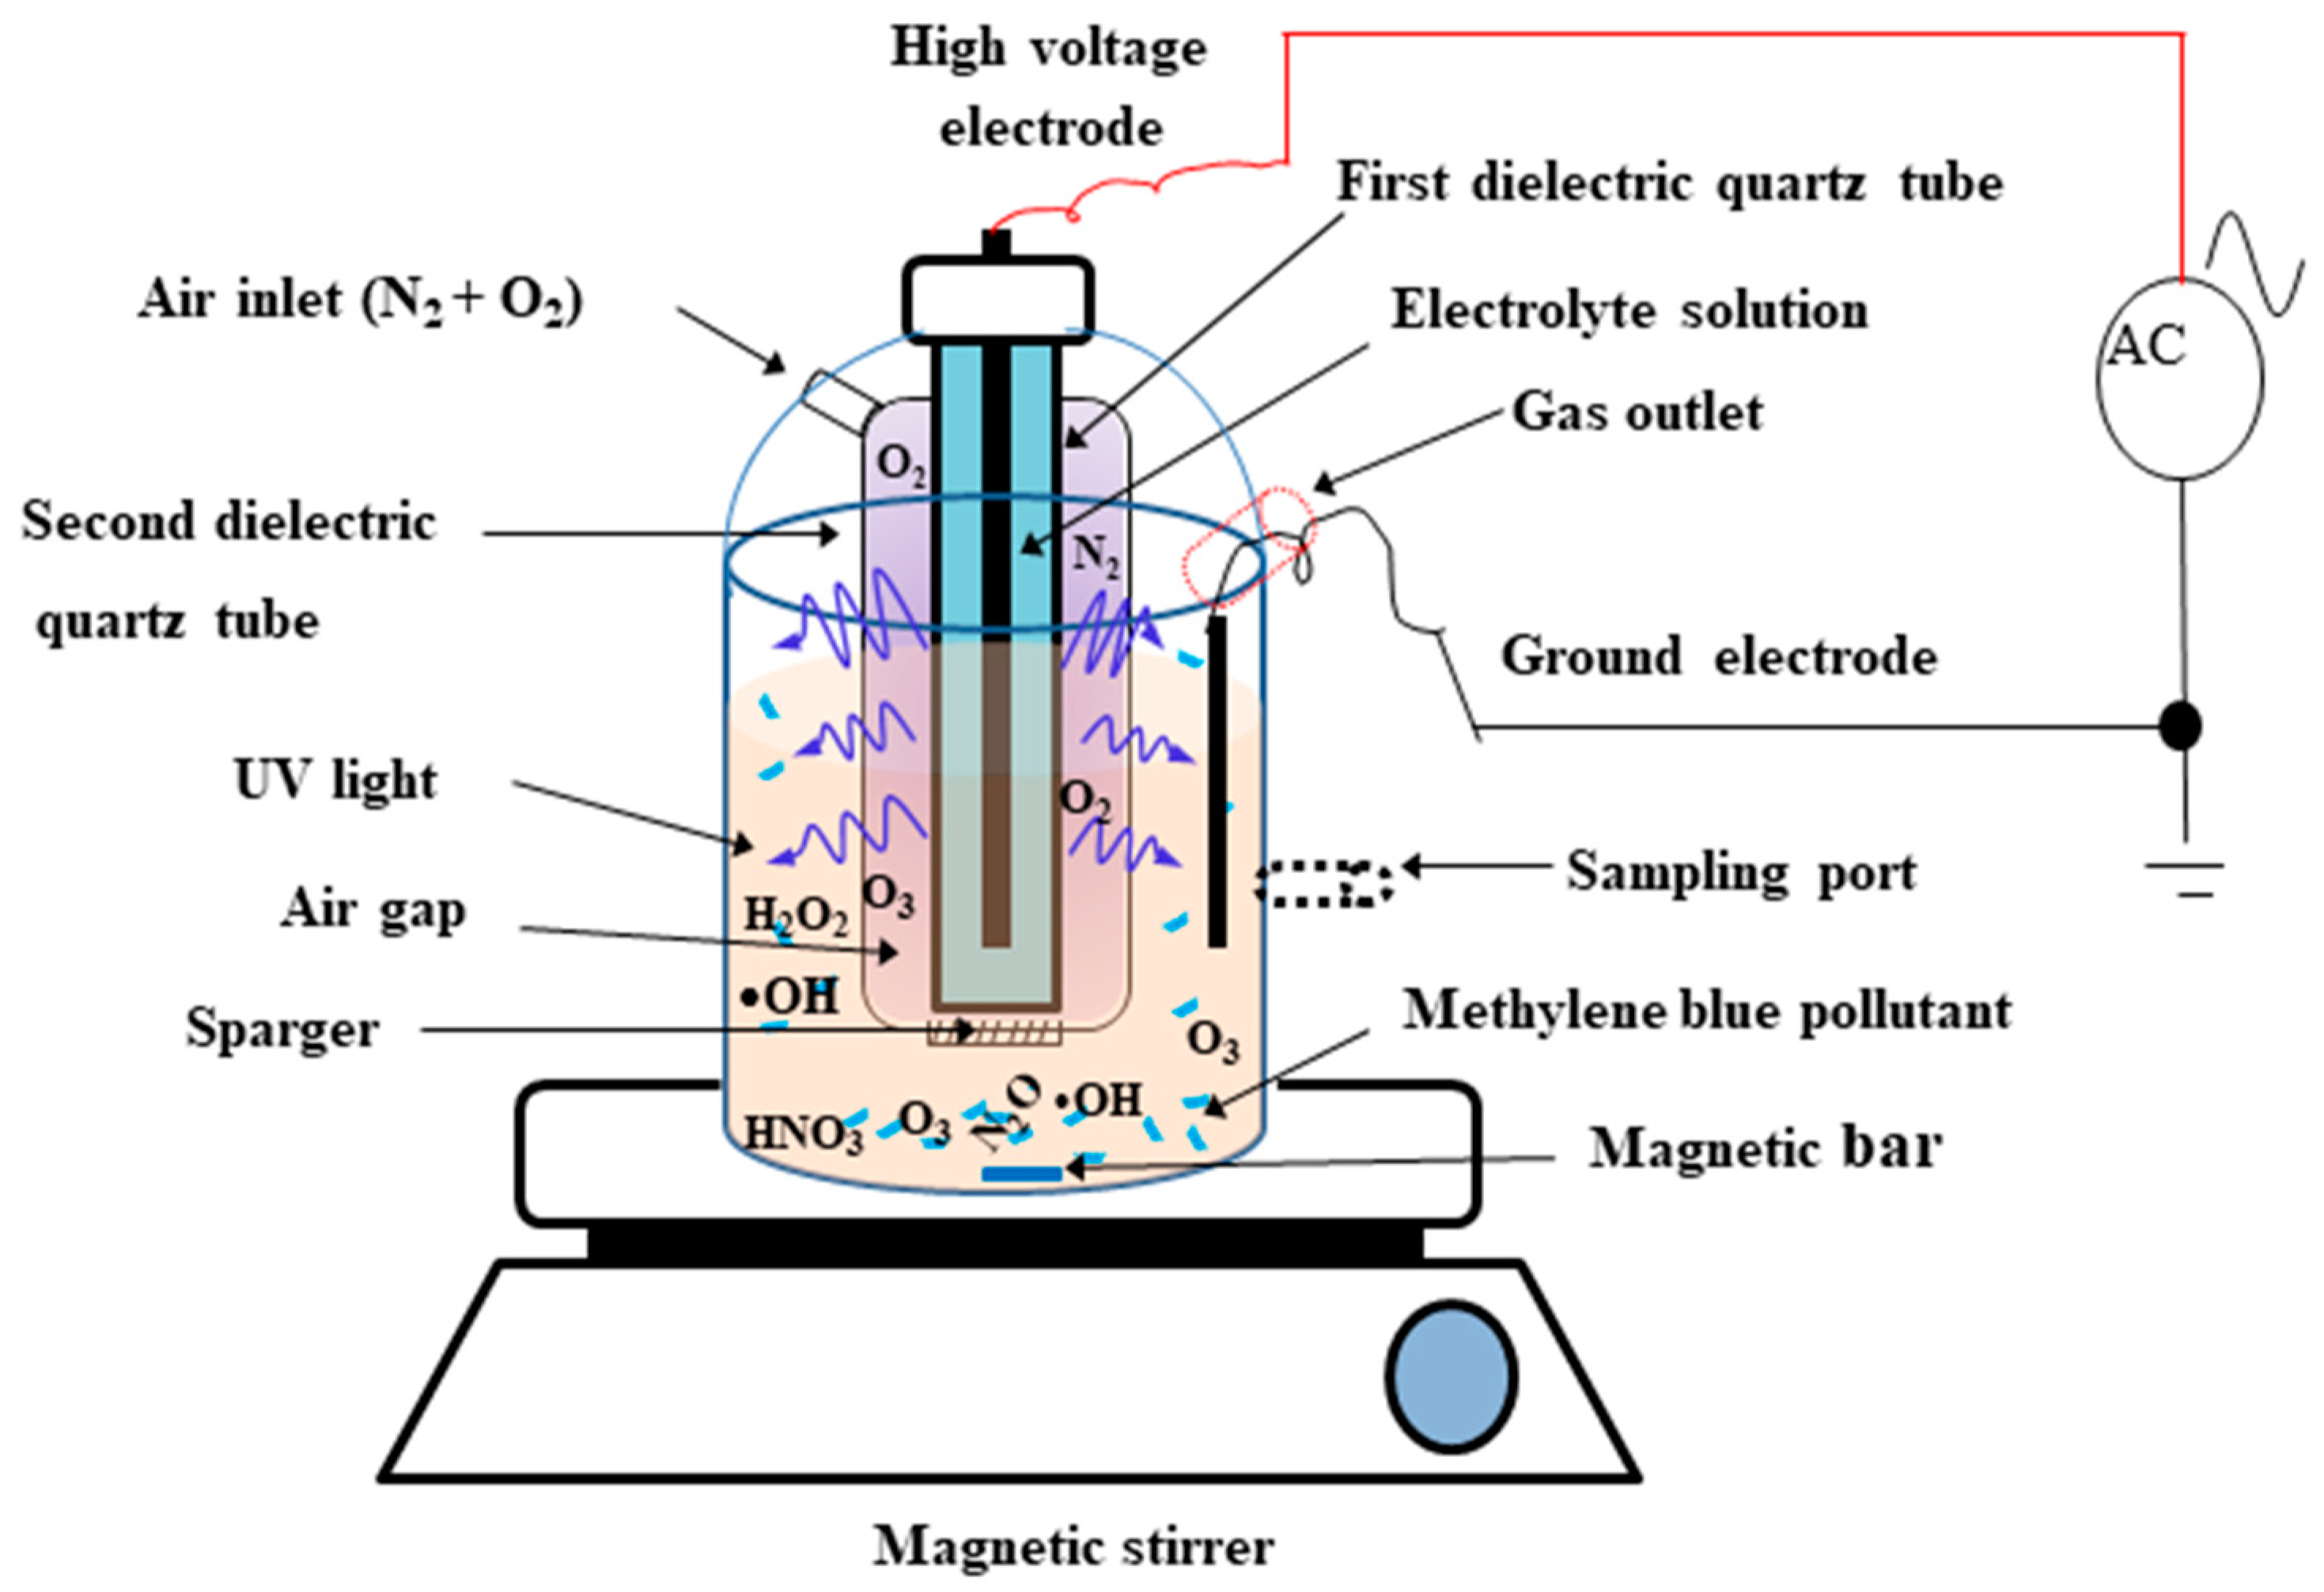
2.1.1. Dielectric Barrier Discharge Experimental Procedure

A high-voltage cable/electrode from a 200 W AC power supply was connected to a 1.5 mm silver electrode that was directly immersed in a 50 g/L sodium chloride electrolyte in the inner tube of the DBD reactor. The 23 cm long DBD reactor had a total volume capacity of 2000 mL. However, 1500 mL of solution (distilled water) was selected as the optimum volume to avoid overflow of the solution and short circuits during DBD experiments. An air compressor with an output of 60 L/min was connected to an airflow meter that was attached to the DBD reactor as a source of air/oxygen. Distilled water was used as the run in the DBD system for 60 min and sampled every 5 min for detection and quantification of reactive oxygen species O3, H2O2, and OH.

2.1.2. Quantification of Dissolved Ozone and Hydrogen Peroxide in DCDBD Reactor

The dissolved ozone in the DBD reactor was entrapped using the indigo method where after the measurement of blank and sample absorbance was done by UV-vis spectroscopy at 600 nm (ε = 20,000 L.mol−1.cm−1) using two solutions 1 and 2 prepared as follows:
  • Solution 1: About 0.5 mL of phosphoric acid was mixed with 310 mg of indigo trisulfonate in a volumetric flask and filled up to 500 mL with Millipore water.
  • Solution 2: Measured 14 g of sodium hydrogen phosphate was mixed with 17.5 g of H3PO4 in a volumetric flask and filled up with Millipore water.
About 2 mL each of solution 1 and 2 were mixed in a 25 mL volumetric flask and filled up to 25 mL with distilled water. The absorbance of the mixture was measured and recorded as a reference (blank). To determine the concentration of dissolved ozone in the water, again 2 mL volumes of solution 1 and 2 were mixed in a 25 mL volumetric flask and the rest of the volume was filled up with water withdrawn from the DBD reactor at each sampling time. Then the absorbance of the solution was measured and recorded as the sample absorbance. This procedure was performed for each solution pH, which varied from 2.5, 6.5, 8.5 and 10.5 at the applied conditions: peak voltage, 6.8 kV; air flow rate, 3 L/min; solution volume 1500 mL; 1.5 mm silver electrode; 50 g/L NaCl electrolyte; treatment time, 60 min; sampling every 5 min.
On the other hand, the concentration of H2O2 during the DBD experimental run was measured by the addition of 3 mL of water sampled from the reactor every 5 min and mixed with 0.3 mL of the prepared titanylsulphate solution in a cuvette. From the absorbance measured with a UV-vis spectrophotometer at 410 nm (ε = 750 M−1cm−1), the H2O2 concentration generated by the DBD system was derived. This protocol was repeated for each solution pH that was altered from 2.5, 6.5, and 8.5 to 10.5 at the same conditions. The concentration of both O3 and H2O2 was approximated using de Beer’s law.

2.1.3. Effect of pH on the Production of OH Radicals in the DBD Reactor

Approximately 0.75 g of terephthalic acid (TA) was dissolved in 50 mL of 5 mM NaOH solution. The prepared 2 mM TA solution was added to 1250 mL of distilled water blank solution in a 2 L beaker. Thereafter, the buffer solution (KH2PO4 + Na2HPO4, pH = 7.39) was added to the mixture until the conductivity of the mixed solution reached 380 µS/cm. The obtained solution was then subjected to the DBD experiment for 60 min and sampled every 5 min. The 2-hydroxy terephthalic acid (HTA) fluorescence yields from samples drawn from each run were detected with a Varian Cary Eclipse spectrophotometer using an excitation slit of 5 μm and an emission slit of 2.5 μm (excitation wavelength λex = 315 nm; emission wavelength λem = 425 nm). The unknown concentrations of OH radicals at each sampling time were determined using a linear trend of fluorescent intensity versus standard concentrations of hydroxyl terephthalic acid (HTA).
To verify the effect of pH on the production of OH radicals in the DBD configuration, the initial pH of the 2 mM TA solution was set at 2.5, 6.5, 8.5 or 10.5 using NaOH or H2SO4 solutions. Thereafter, the TA solution at each pH value was subjected to the DBD experiment at the applied conditions: water initial pH, 5.49; peak voltage, 6.8 kV; power, 60 W; trip current, 10 A; set current, 60 mA; frequency, 1000 Hz; air flow rate, 3 L/min; solution volume, 1500 mL; 1.5 mm silver electrode; 50 g/L NaCl electrolyte; treatment time, 60 min; sampling every 5 min.

2.1.4. Effect of Scavengers and Terephthalic Acid Probe Concentration on the Quenching of OH Radicals in DBD Reactor

To investigate the impact of sodium carbonate (Na2CO3) and sodium chloride (NaCl) on the production of OH radicals in the DBD system, these two scavengers’ concentration was varied between 0.01 M, 0.02 M and 0.04 M, and added to the 2 mM TA solution probe, which was in turn exposed to the DBD experiment at the applied conditions. The amount of OH radicals formed in DBD reactor after addition of scavengers was determined using the Varian Cary Eclipse spectrophotometer at the applied conditions.
To investigate the impact of probe concentration on the production of OH in the DBD reactor, the TA solution concentration was varied between 0.01, 0.02 and 0.04 M, then subjected to the DBD experiment at the applied conditions and the amount of OH produced was measured as described above.

2.1.5. Dielectric Barrier Discharge Experimental Degradation Protocol of MB Simulated Wastewater

A stock solution of 200 mg/L MB dye was prepared by dissolution of 0.2 g of MB powder in 1000 mL volumetric flask and further made up to the mark with distilled water. Various concentrations of MB (20, 60 and 100 mg/L) were prepared by serial dilution. The linear trend (y = 0.1154X, R2 = 0.998) obtained was used to determine the unknown concentrations of MB and hence its degradation efficiency. The simulated MB solution (1500 mL of 20 mg/L) placed in the 2000 mL DBD reactor was earthed to complete the circuit according to the DBD protocol previously described. The MB degradation was monitored for 60 min while sampling every 10 min and analysed using UV-vis spectroscopy in the range of 200–800 nm. The decolouration percentage (D%) of MB was calculated using Equation (1).
Decolouration percentage (D%) = [(CoCt)/Co] × 100
where Co and Ct are the initial and the final concentrations of MB solution respectively. This procedure was repeated and the effects of parameters such as MB initial concentration (20, 60 to 100 mg/L), solution pH (2.5, 6.5 to 10.5) and peak voltage (6.4, 6.8 to 7.8 kV) on MB % degradation were investigated while other factors were kept constant. The solution pH was adjusted to the desired value using a few drops of either 50% NaOH or 90% HNO3.

3. Results

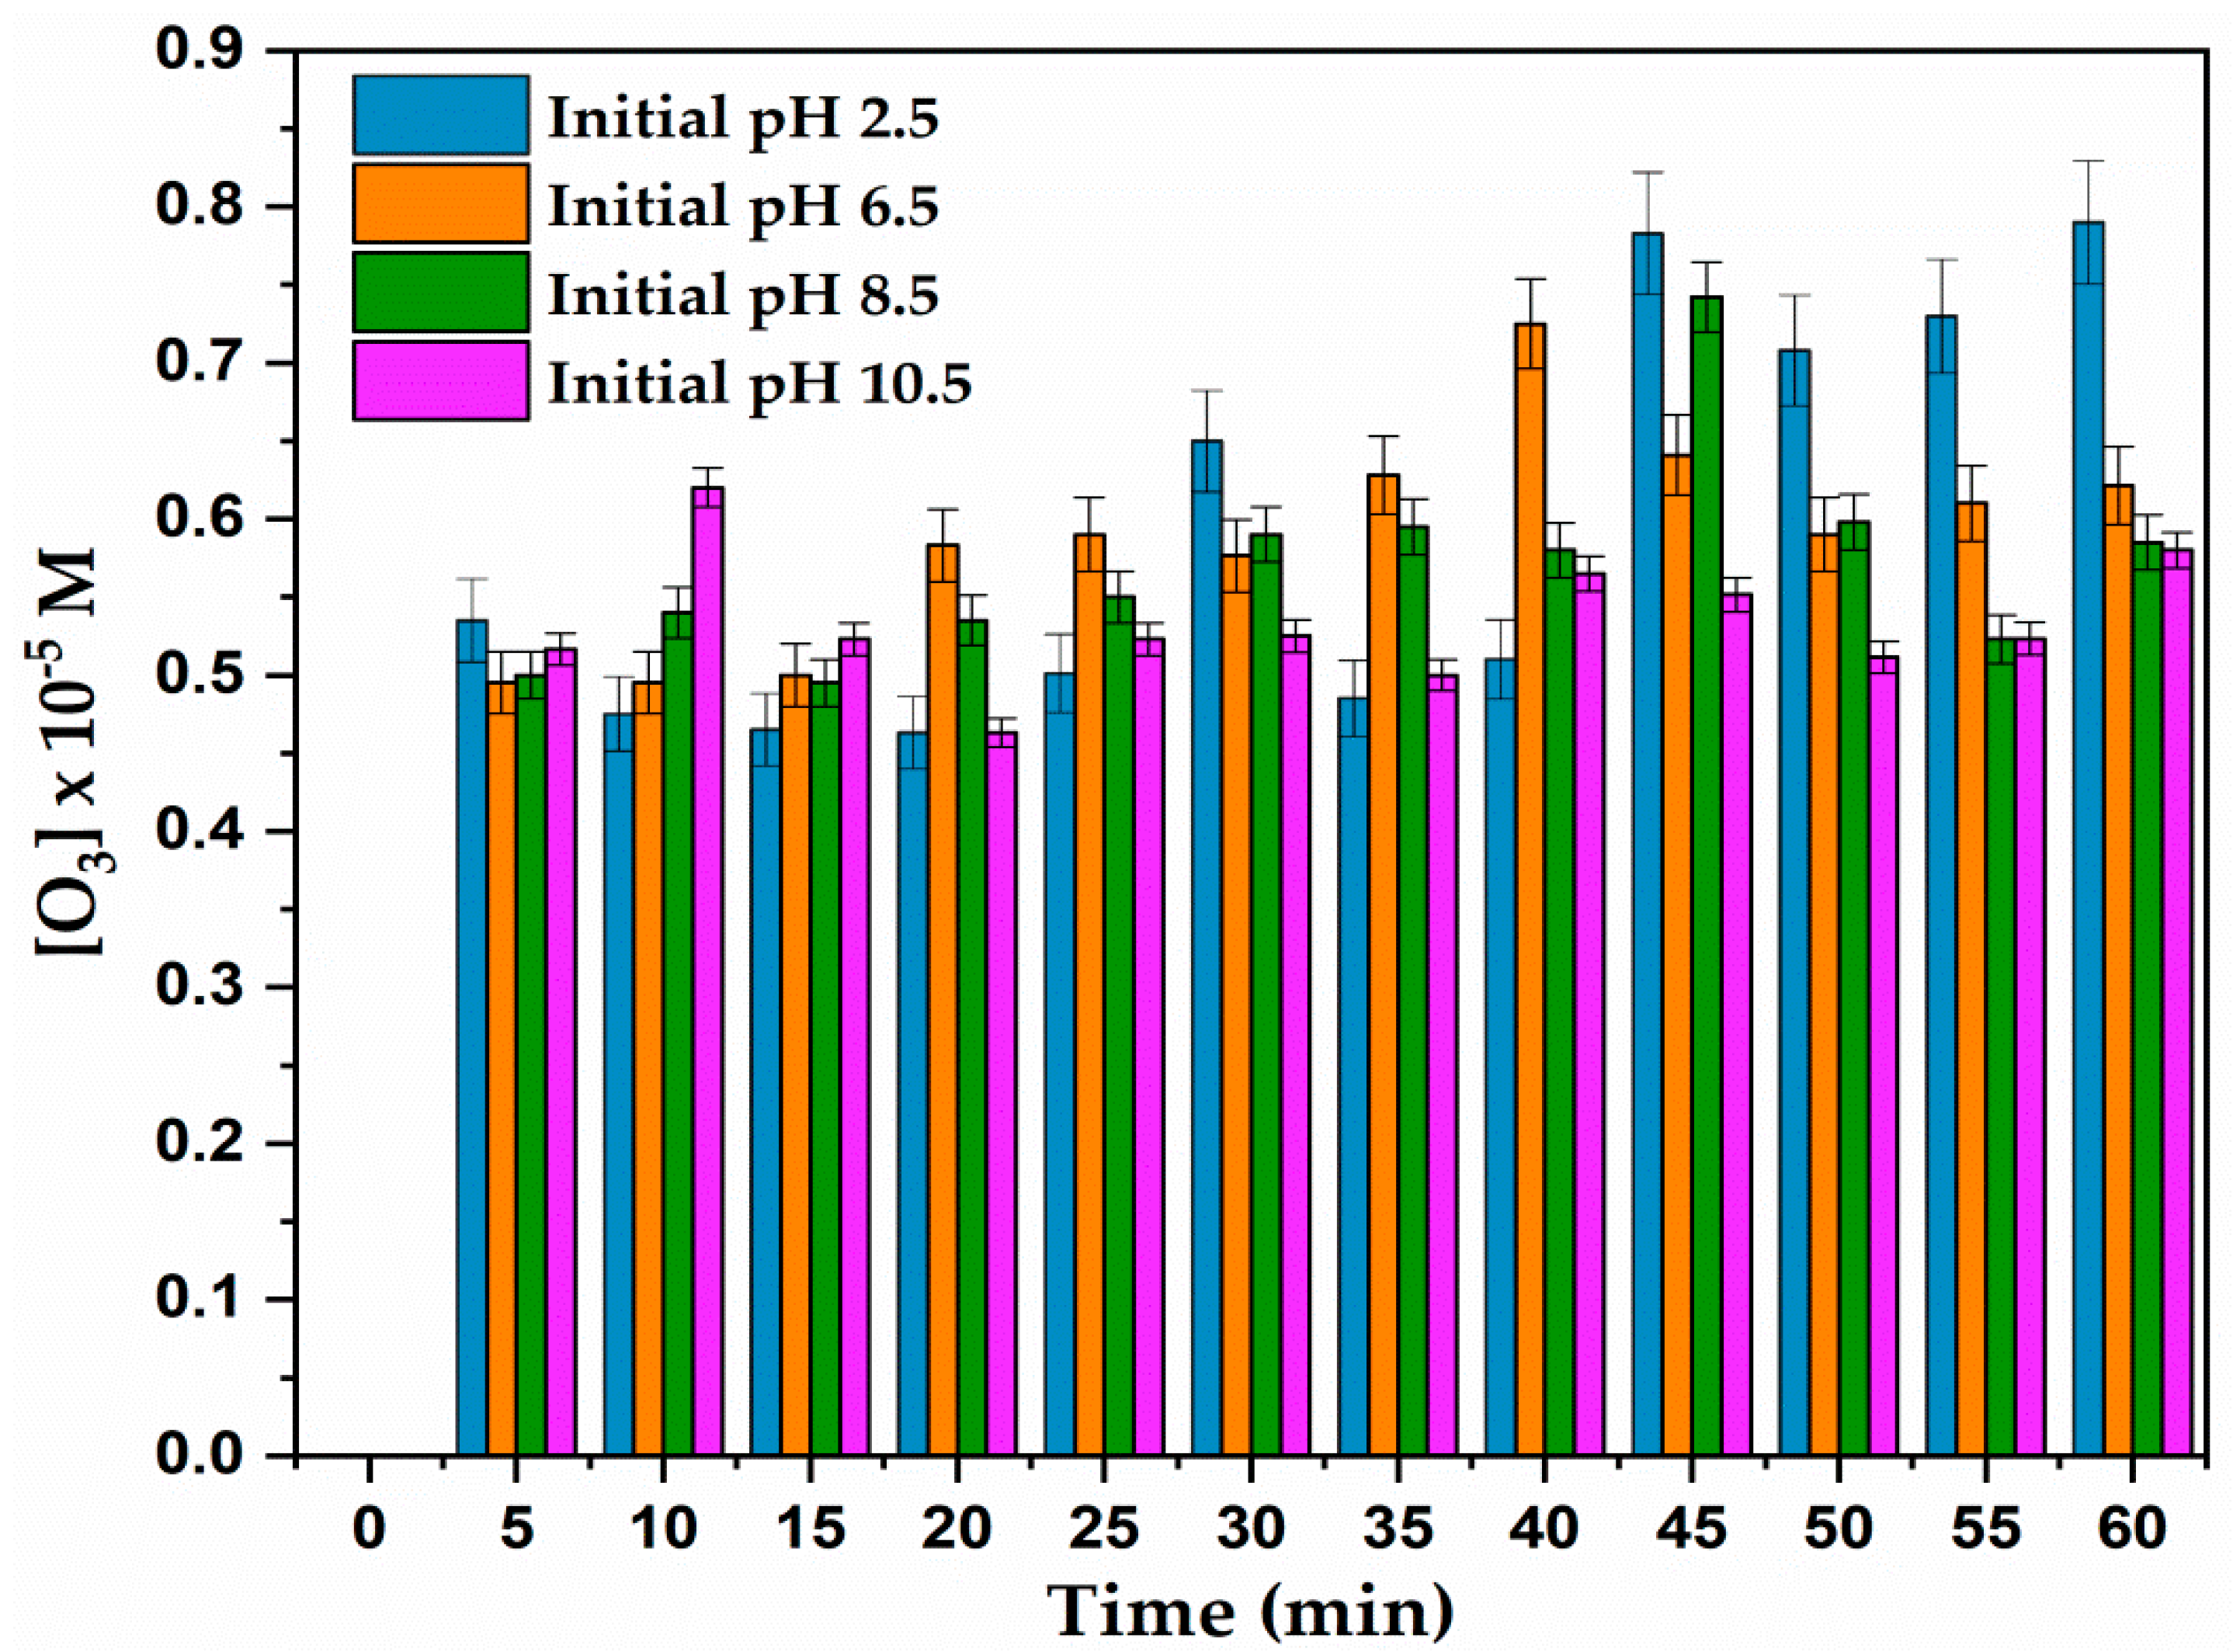
3.1. Effect of pH on Dissolved Ozone Concentration in DCDBD Reactor

The indigo method was employed to quantify the amount of O3 produced in the DCDBD reactor over time using distilled water as a model/baseline solution. The concentration of O3 was followed with respect to the change in pH values in duplicate (n = 2) at the applied conditions (Figure 2).
A significant molar concentration of O3 was present for 60 min operation time but the amount of ozone produced at all pH values fluctuated with time and did not follow a constant trend. The highest amount of ozone was generated in acidic pH 2.5 followed by pH 10.5, 8.5 and 6.5, correspondingly. At pH 2.5, the fluctuating ozone concentration quantified after 5 min increased from 0.535 mol/L to 0.783 and 0, 79 mol/L after 45 and 60 min of DBD run, respectively.
In contrast, the 0.516 M of O3 detected after 5 min at pH 10.5 increased to 0.62 M after 10 min and progressively fluctuated down to 0.58 M after 60 min. A similar trend was also observed at pH 8.5 and 6.5 during the 60 min of DBD run. This inferred that O3 was being produced and scavenged/consumed in the DCDBD reactor following different reactions pathways [30].
The slight decrease of O3 concentration within the 60 min of the DBD experiment was probably due to its decomposition by UV light generated in the DBD reactor that resulted in various side chain reactions, which further induced its reduction over time. This corroborates the findings of [31] who showed that when exposed to UV light at λ ≤ 310 nm, ozone decomposes to singlet oxygen molecules and a highly reactive singlet oxygen atom according to Equation (1), even though the measurement of the wavelength of UV light generated in the current DBD reactor remains challenging.
According to [32], the singlet oxygen atom, whose lifetime is estimated to be 4.4 µS in aqueous media, reacts with water to produce hydroxyl radicals, as in Equation (2). The generated OH radicals likely recombined to form H2O2, as indicated in Equation (3). Besides, the aqueous O3 in the DCDBD reactor could have also been converted into oxygen by hydroxyl radicals according to Equations (4) and (5).
O3 + hv → O (1D) + O2 (1Δg) λ ≤ 310 nm
O (1D) + H2O (g) → 2OH
O (1D) + H2O (l) → H2O2
O3 + OH → O2 + HO2
HO2 + O3 → OH + 2O2
The O3 disintegrations highlighted in the equations above substantiate the fluctuation of its concentration and decline observed in the DCDBD system, which could further be ascribed to side reactions reported in the literature [33,34,35,36,37], as disclosed in Equations (6)–(13)
2O3 + H2O2 → 2OH + 3O2
O3 + hv + H2O → H2O2 + O2
H2O2 + hv → 2OH
O3 + OH → O2 + HO2
O3 + HO2 → HO + O2 + O2
O3 + O2 → O3 + O2
O3 + HO → HO4
The presence of H2O2 may accelerate the decomposition of ozone and increase the OH radical concentration (Equation (13)). This process occurs very slowly at low pH and is greatly accelerated at pH values above 5. This, therefore, validates the prominent amount of ozone quantified at pH 2.5 in the DCDBD reactor compared to its lower concentrations detected at higher pH values.
O3 + H2O2 + OH → OH + HO2 + O2 + OH
The slight increase of O3 concentration at 60 min was attributed to the recombination of secondary active species generated in the DCDBD reactor and induced its accumulation in the solution. The two processes, namely the decomposition of O3 to active species and the recombination of the unstable oxygen-based metabolites, induced the behaviour of O3 perceived during the 60 min of the DBD experimental run. Since DBD technologies appear as robust AOPs, these observations also implied that it is difficult to predict the exact routes via which O3 and its derivatives can be produced or consumed in the DCDBD system. Nevertheless, the most probable chemical reaction chains in DBD configurations have already been proposed by Gupta [38] and reviewed by Mouele et al. [16].
The DCDBD system used in this study certainly functioned well compared to other systems. That is, the highest amount of O3, 0.79 M measured in the current DBD reactor after 60 min is higher than 0.09 M of O3 quantified after 30 min by Tichonovas et al. [39] and much higher than 0.0001 M of O3 achieved after 66 min by [40] using different DBD reactor configurations.

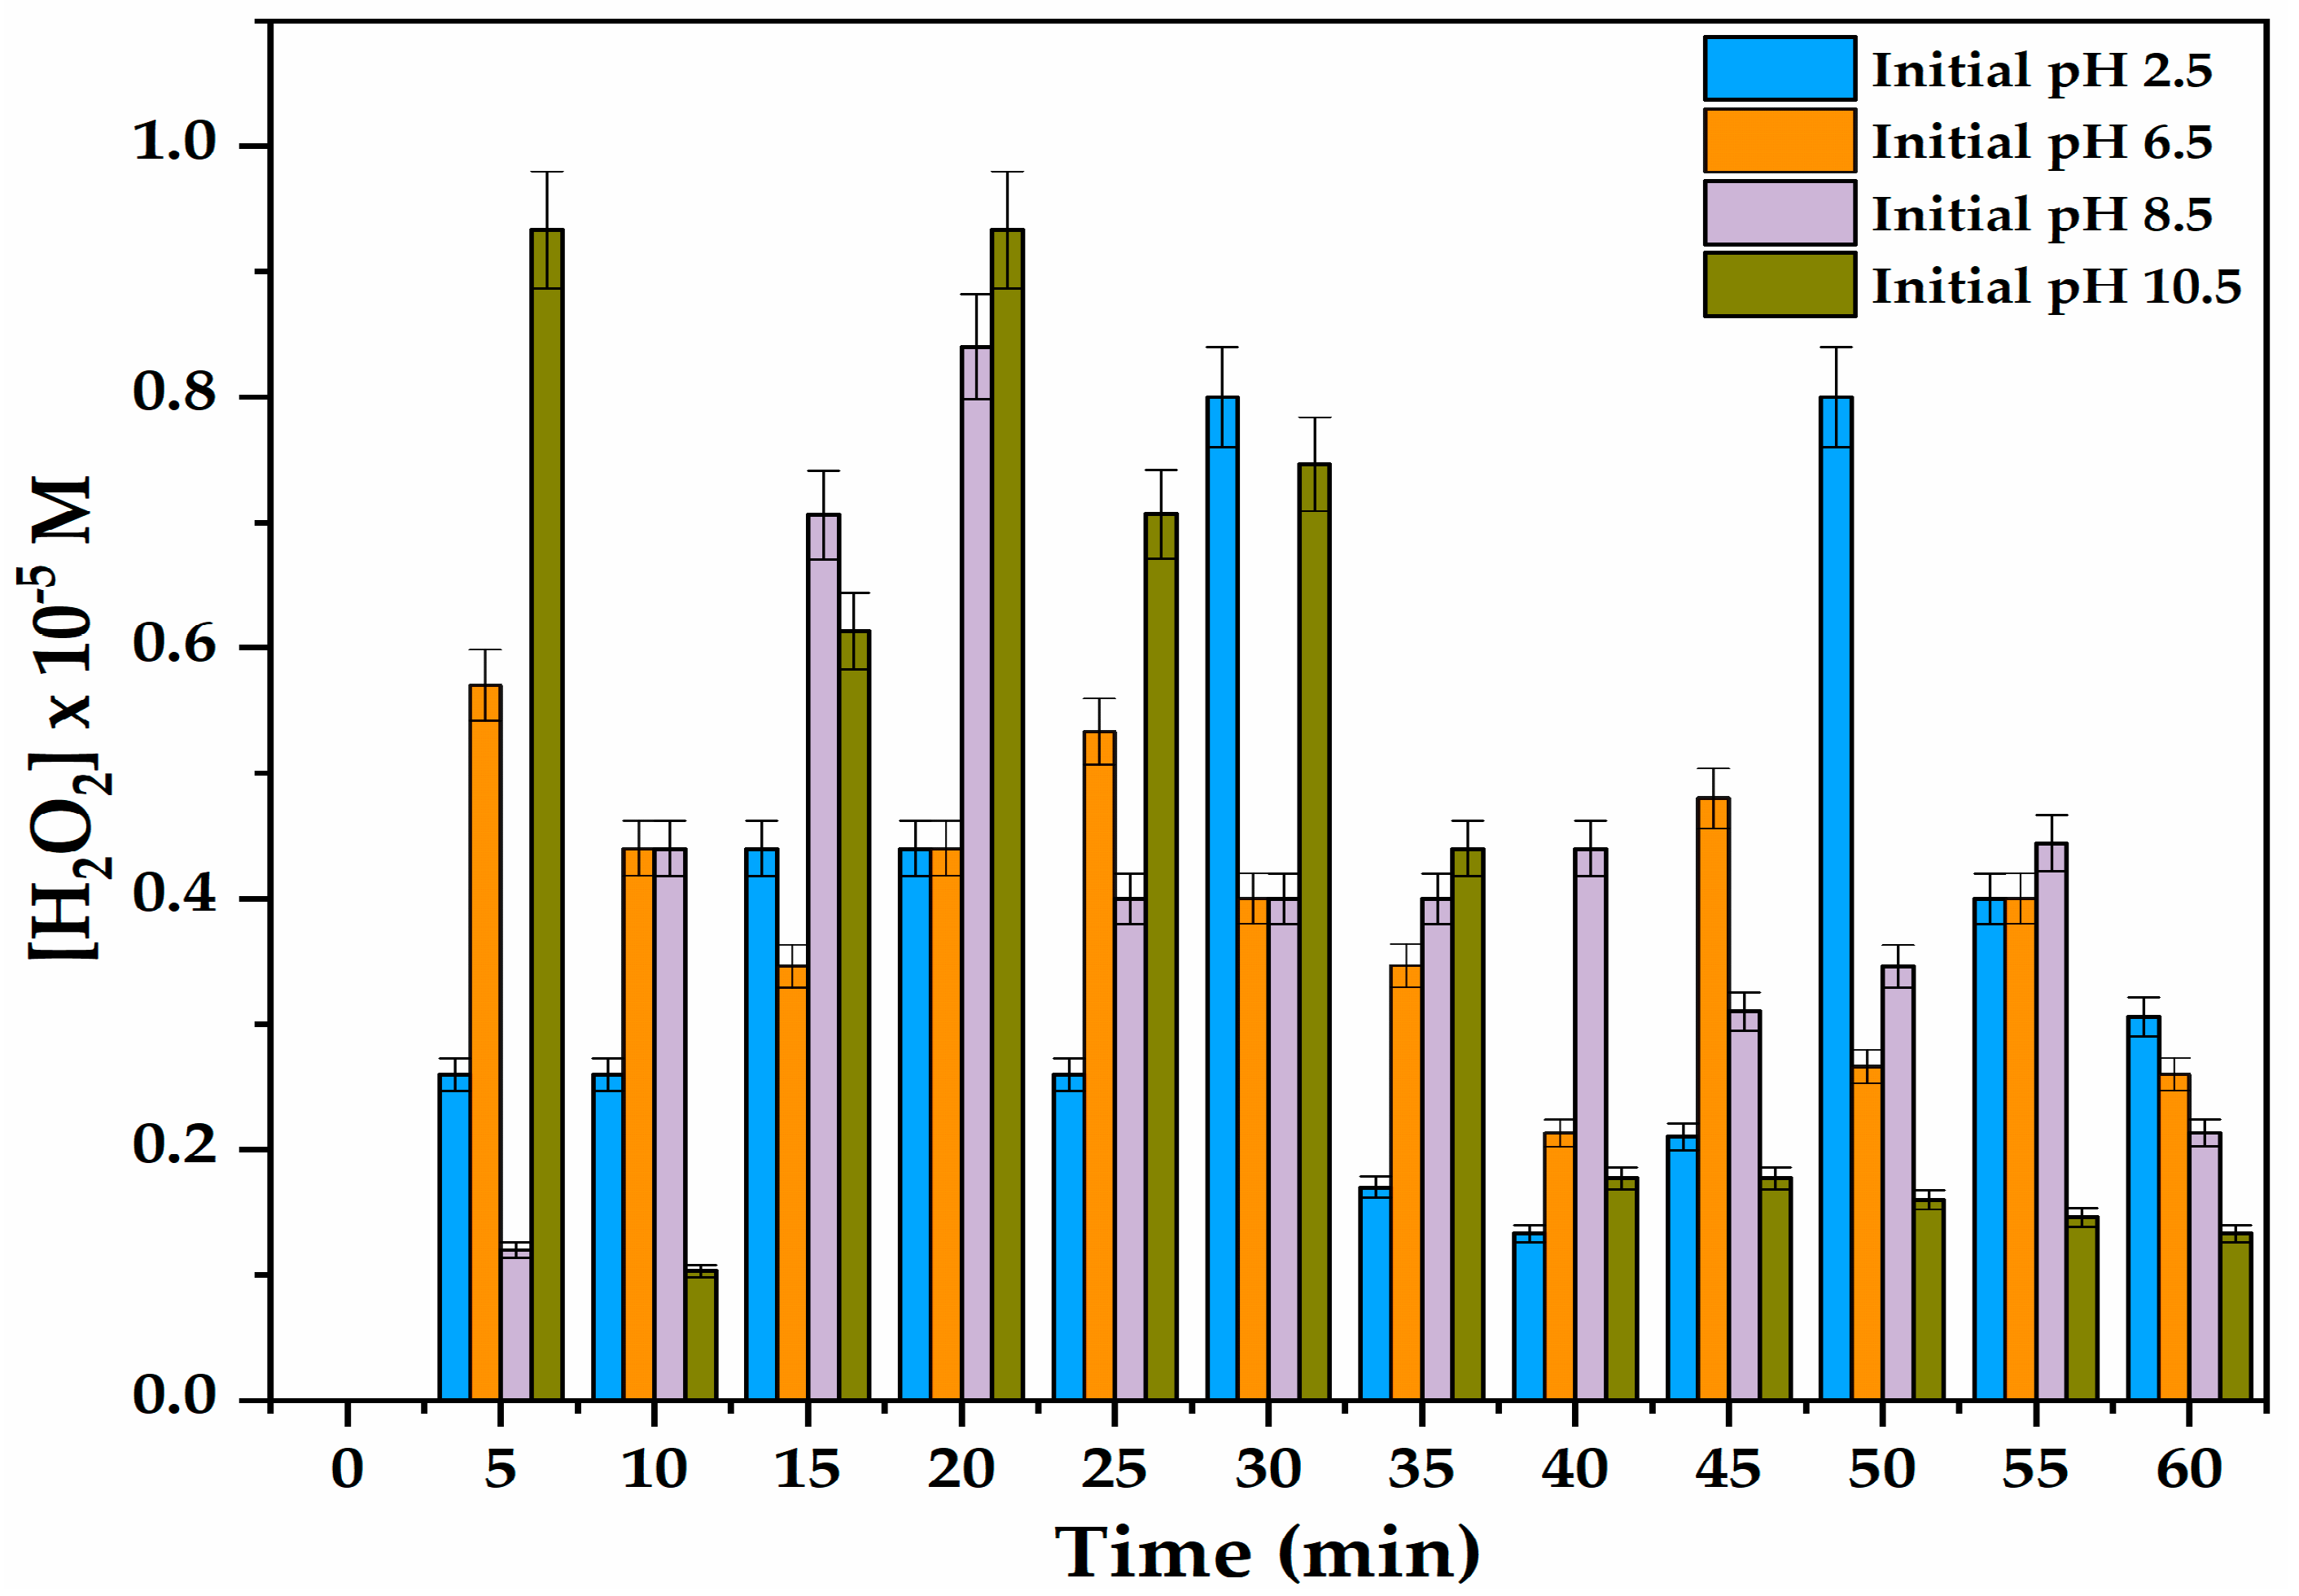
3.2. Effect of pH on Hydrogen Peroxide Production in DBD Reactor

The effect of initial solution pH of the distilled water on the generation of H2O2 was evaluated in duplicate (n = 2) using the Eisenberg technique as shown in Figure 3.
The amount of H2O2 at different pH values in the DCDBD reactor fluctuated with time. Nevertheless, the highest concentration of H2O2 in the reactor was noticed at a basic pH of 10.5 and 8.5 compared to the acidic pHs of 2.5 and 6.5. Consequently, at pH 10.5, the 0.933 M of H2O2 detected after 5 min decreased to 0.613 M after 15 min and increased back to the initial value, which progressively followed a sinusoidal decline to 0.133 M after 60 min. These results were similar to those achieved at pH 8.5.
Alternatively, at pH 6.5, the 0.57 M of H2O2 decreasingly fluctuated down to 0.26 M after 60 min. The last variation of H2O2 concentration observed at pH 2.5 shows that 0.26 M H2O2 measured after 5 min increased to 0.8 M after 30 min and fluctuated down to 0.306 M after 60 min. The fluctuating decrease of H2O2 concentration in both acidic and basic pH indicated that either H2O2 was being self-decomposed, photo-decomposed to H+, H2O, and OH, or it was being used up to yield other oxygen-based active/reactive species such as O2, O, O2, etc. as shown in Equations (15)–(17).
H2O2 → H+ + H2O
H2O2 + hv → 2OH
O3 + H2O2 + OH → OH + HO2 + O2 + OH
The H2O2 produced in the solution may also react with various aqueous species, such as OH, H, O2, O, etc., forming diverse secondary species such as perhydoxyl radicals (HO2), H2, O2, H+, H2O, etc., as described in the chain of disintegration processes in Equations (18)–(24), which consequently contributed to the decline of its concentration in the DCDBD reactor.
H2O2 + OH → H2O + HO2
H2O2 + H → H2O + OH
H2O2 + H+ → HO2 + H2
H2O2 + O2 → 2HO2
H2O2 + O → HO2 → OH
H2O2 + O → H2O + O2
H2O2 + OH→ H2O + H+ + O2
Alternatively, the increase of H2O2 concentration in the DCDBD reactor could be attributed to various chemical reactions including the interaction of O3 with H2O and water molecules collisions, as suggested by Mededovic [41] and shown in Equations (25)–(32).
O3 + hv + H2O → H2O2 + O2
H2O → H + OH
OH + OH → H2O2
HO2 + HO2 → H2O2 + O2
HO2 + H2 → H2O2 + H+
2H2O → H2 + H2O2
6H2O → 4H2 + 2H2O2 +O2
O (1D) + H2O (l) → H2O2
These chemical reactions might have contributed to the fluctuating increase of H2O2 concentration in the reactor at low or elevated pH. In total, the fluctuating increase and decrease of H2O2 in the DCDBD configuration presented in Figure 3 demonstrated the numerous chains of chemical reactions that occur during the DBD experimental run as summarized by Gupta [39]. This was earlier sustained by Ullmann 1991 [35] and [36]. Even though H2O2 does not directly attack organic pollutants on its own, it represents a potential source of secondary reactive oxygen species, mainly OH radicals that directly or indirectly degrade the target contaminants in water and wastewater.

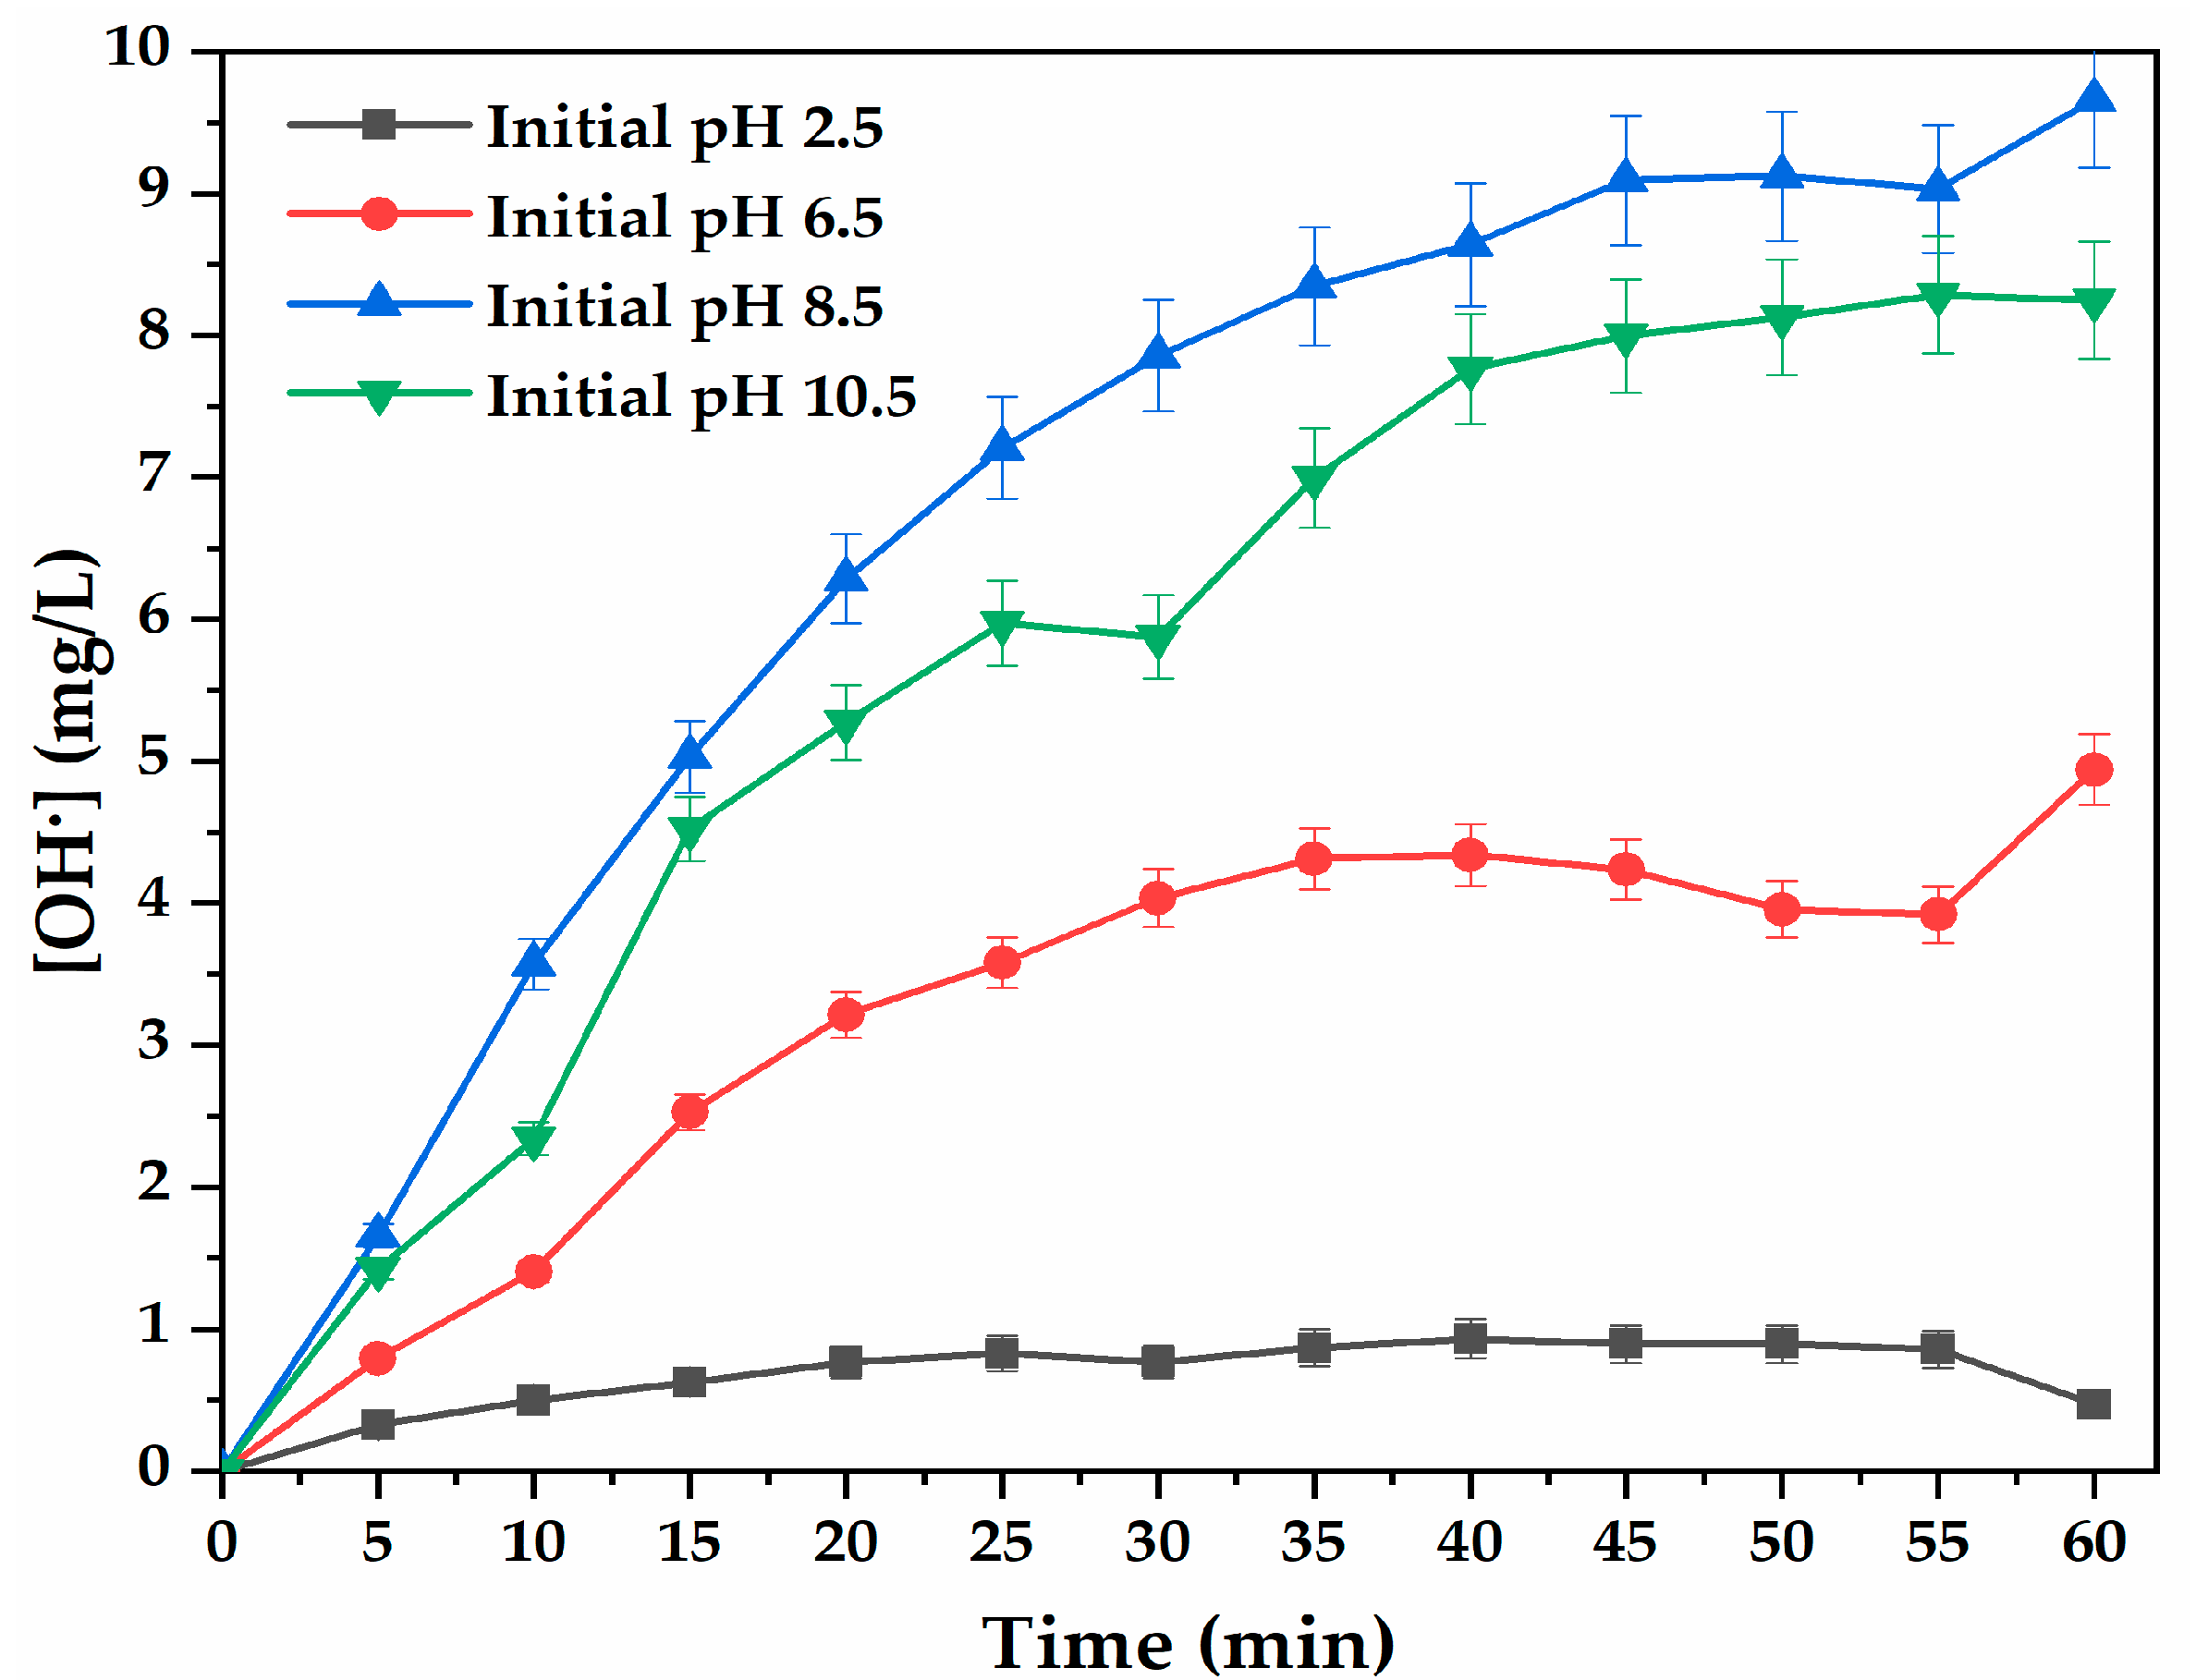
3.3. Effect of Solution pH on OH Production in the Absence of Buffer

A terephthalic acid (TA) chemical probe was used to approximately trap the amount of OH radicals generated in the DCDBD system in the absence of buffer solution at the applied conditions. This was achieved by assessing the impact of initial solution pH on OH concentration in distilled water within 60 min of the DBD run, as described in Figure 4. The results show that, at pH 6.5, 8.5 and 10.5, the amount of OH continuously increased with an increase of DBD run time. At pH 2.5, the OH concentration was almost constant during the 60 min of the experimental run. Yet, the highest amount of OH radicals were trapped at pH 10.5, followed by pH 8.5, 6.5 and 2.5.
After 60 min of DBD run time, 9.661 mg/L of OH radical was achieved at pH 10.5 compared to 8.24, 4.941 and 0.473 mg/L OH reached at pH 8.5, 6.5 and 2.5, respectively. This trend was observed at each sampling time during the DBD experiment. This implied that in the absence of buffer, high amounts of OH radicals were generated from distilled water at basic pH. OH radicals remain the targeted nontoxic and nonselective species in most AOPs, particularly in DBD technologies. In the ozone section, the equation showing the disintegration of O3 mainly resulted in the formation of OH Besides, the homolytic cleavage of H2O2 and its decomposition also yielded OH as shown in Figure 4.
Therefore, it was evident that OH concentration increased with an increase in treatment time and high concentrations of OH (9.661 or 8.246 mg/L) were achieved at basic pH (10.5 or 8.5). These observations complement the results obtained by [42] who also observed an increase in time-integrated OH concentration trapped with TA during the pulsed discharge plasma process. These claims are also confirmed by Badmus et al. [43] who successfully showed that TA is an effective probe for the trapping of OH radicals in aqueous systems.
In acidic pH (6.5 and 2.5), the concentration of OH radicals increased with treatment time, the amount of OH at these pH values were less than those obtained in basic conditions as reported by Sahni and Locke [44]. This means that DBD experiments conducted in an acidic environment in the absence of buffer favour the production of O3 and other active species [18,34,35]. In other words, at pH below 7, O3 and related oxygen intermediates other than H2O2 and OH were majorly produced in the DCDBD configuration [20,21]. These results suggest that at acidic pH values, OH radical scavengers, such as nitrates, nitrites, sulphates, etc., might have been present in the solution and consequently consumed the generated OH, hence reducing its amount in the solution [22].

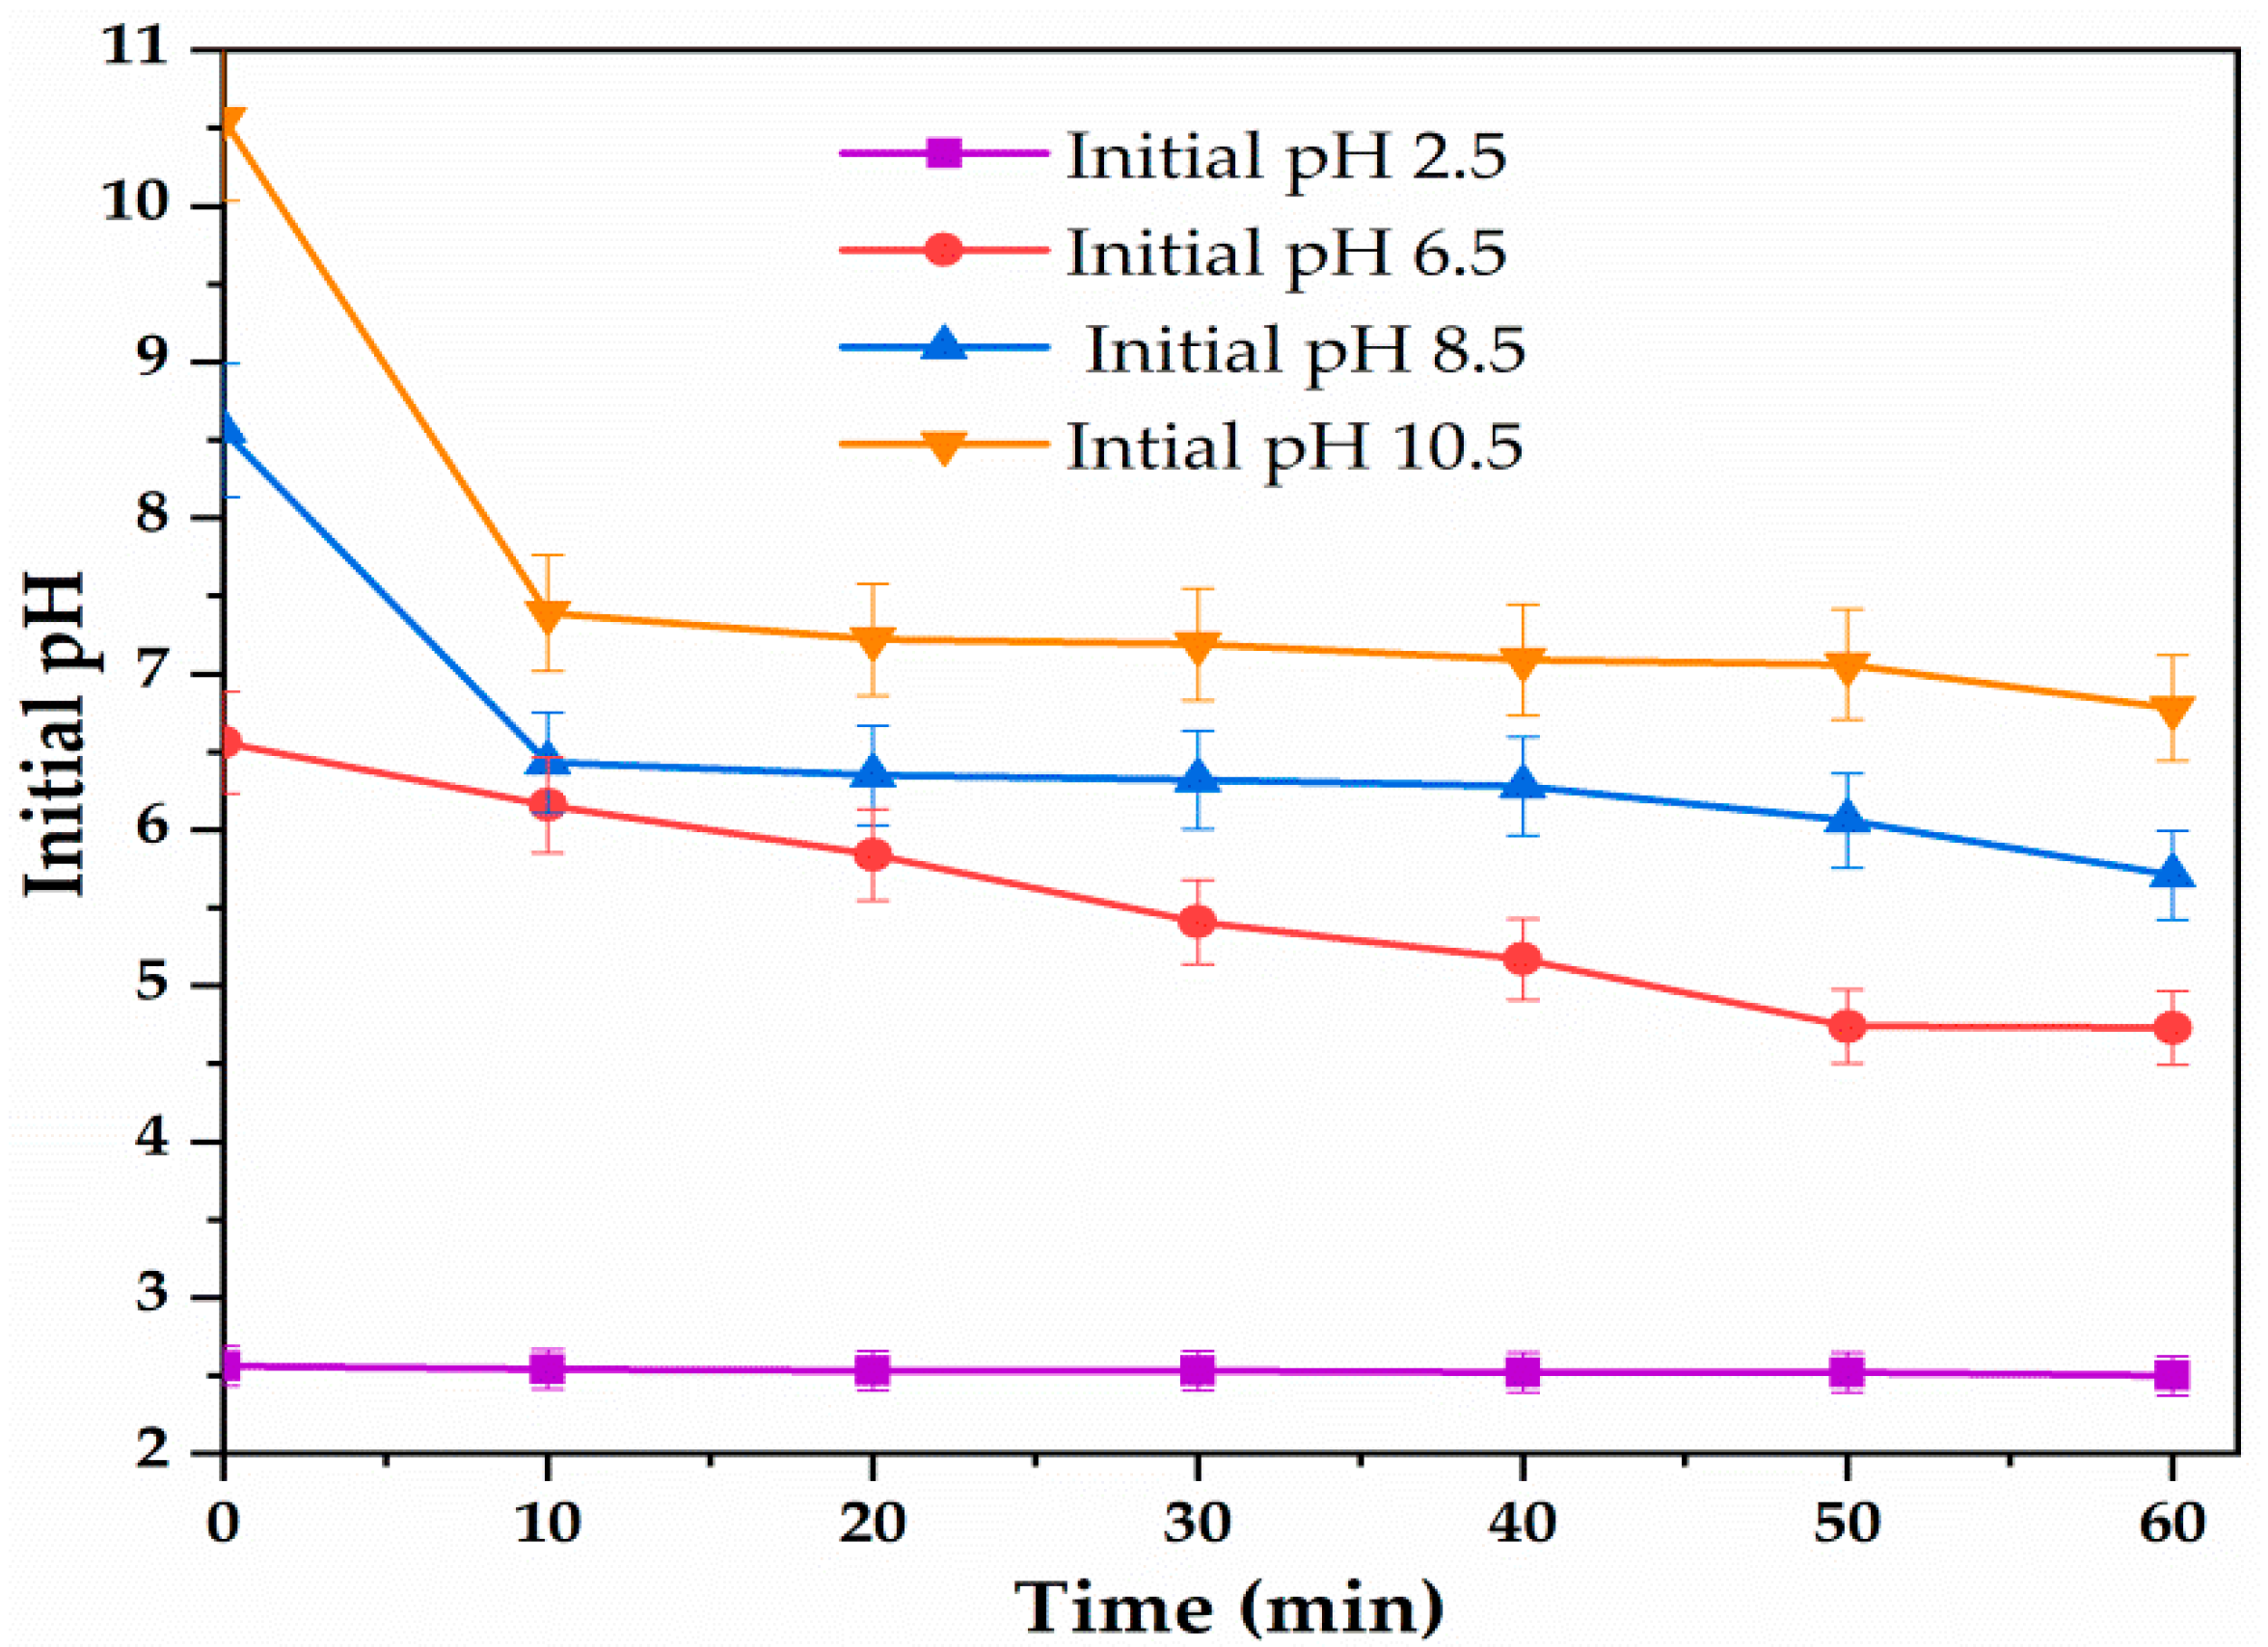
3.4. Trends of Solution pH during Quantification of OH Radicals in the DBD Reactor

The duplicated pH trends during the quantification of OH radical in DCDBD reactor in the absence of buffer was evaluated (n = 2). The initial pH value was regulated using H2SO4 or NaOH and its tendency over the 60 min of DBD experiment was followed at the applied conditions as shown in Figure 5.
The outcomes in Figure 5 indicate that the basic pH values significantly decreased in the first 10 min, and thereafter slightly declined with time. The initial pH 10.5 significantly declined to 7.9 after 10 min of the DBD run and thereafter slightly decreased further to 6.78 after 60 min. A similar decay was observed at pH 8.5. Likewise, the initial pH 6.5 slightly and progressively decreased to 4.73 over the 60 min of DBD run while the experiment conducted at pH 2.5 did not experience any change, the initial pH 2.5 remained constant during the 60 min of DBD experiment. The decline of pH 10.5, 8.5, 6.5 to their lower values in the first 10 min of the DBD run was certainly due to the formation of acidic species in the solution.
Indeed, the dry air circulated in the air gap of the DCDBD reactor contains N2 and O2 whose interaction with energized electrons lead to excited N2* and O2* metastable species which generate not only UV light when falling back to their energy ground states, but largely contribute to the production of oxygen- and nitrogen-based species such as O2, O, O3, N, N2, NO, N2O, etc., either via ionization, dissociation, recombination or other chemical reactions according to Equations (33)–(48).
O2 + e → 2O + e dissociation
O2 + e → O2+ + 2e ionization
O2 + e → O2 attachment
O2 + e → O + O dissociative attachment
O2 + O → O3 association
N2 + e → 2N + e dissociation
N2 + e → N2+ + 2e ionization
N + O → NO association
NO + O → NO2 association
N2+ + O2 → 2NO recombination
N2 + O → N2O association
N2 + O → NO + N
N + O2 → NO + O
NO + O3 → NO2 + O2
NO2 + O3 → NO3 + O2
NO3 + NO2 → N2O5
These active and unstable species formed in the plasma zone diffused into the solution through continuous airflow and become solvated. Their coexistence in DBD aqueous media led to the formation of various acids including nitric and nitrous acid (HNO2 and HNO3) which consequently induced the decrease of the acidity in the DCDBD reactor, as shown in Equations (49)–(53).
2NO2 + H2O → HNO2 + HNO3
HNO → H+ + NO
HNO → H+ + NO
OH + OH → H2O2
2H2O + UV → H3O+ + OH
Similar interactions of O2 and N2 derivatives in nonthermal plasma technologies have already been summarized by Lopez [45]. The decrease of pH in the first 10 min and its constant tendency from 10 to 60 min of the DBD experiment suggest that the amount of the generated acidic species was getting close to their threshold boundaries. After 10 min, some of the acidic species might have behaved as scavengers and consumed the OH radicals produced in the system and hence promoted the abundance of nitrogen and oxygen like species that reinforced the acidity in the solution. These observations were also reported by Magureanu et al. [46], who claimed that, during plasma discharge process, the decrease in pH is often due to the formation of nitric and nitrous acids in such a way that the transferred gaseous nitrogen oxides (NO, NO2) from the air gap into the bulk solution, are converted into nitrite (NO2) and nitrate ions (NO3) and further to nitric acid (HNO3), nitrous acid (HNO2) and peroxynitrous acid (ONOOH). In addition to these, the H2O2 produced in acidic conditions and often considered as a weak acid, even at a lower amount might have slightly contributed to the decline of pH observed in Figure 5.
Besides, the hydronium cations (H3O+) resulting from water splitting by UV light generated in the DCDBD reactor might have participated in the pH decay to acidic values [47,48,49,50,51]. These arguments were recently supported by Tijani et al. [52]. For the DBD experiment performed at pH 2.5, the undisturbed behaviour of pH 2.5 suggested that 2.5 was the operational pH value at which acidic species that were produced did not change the pH and hence the duplicated pH trend in the DCDBD reactor (n = 2) shows that adjusting initial pH is not an effective strategy as the default low pH over time confounds any pH adjustment.

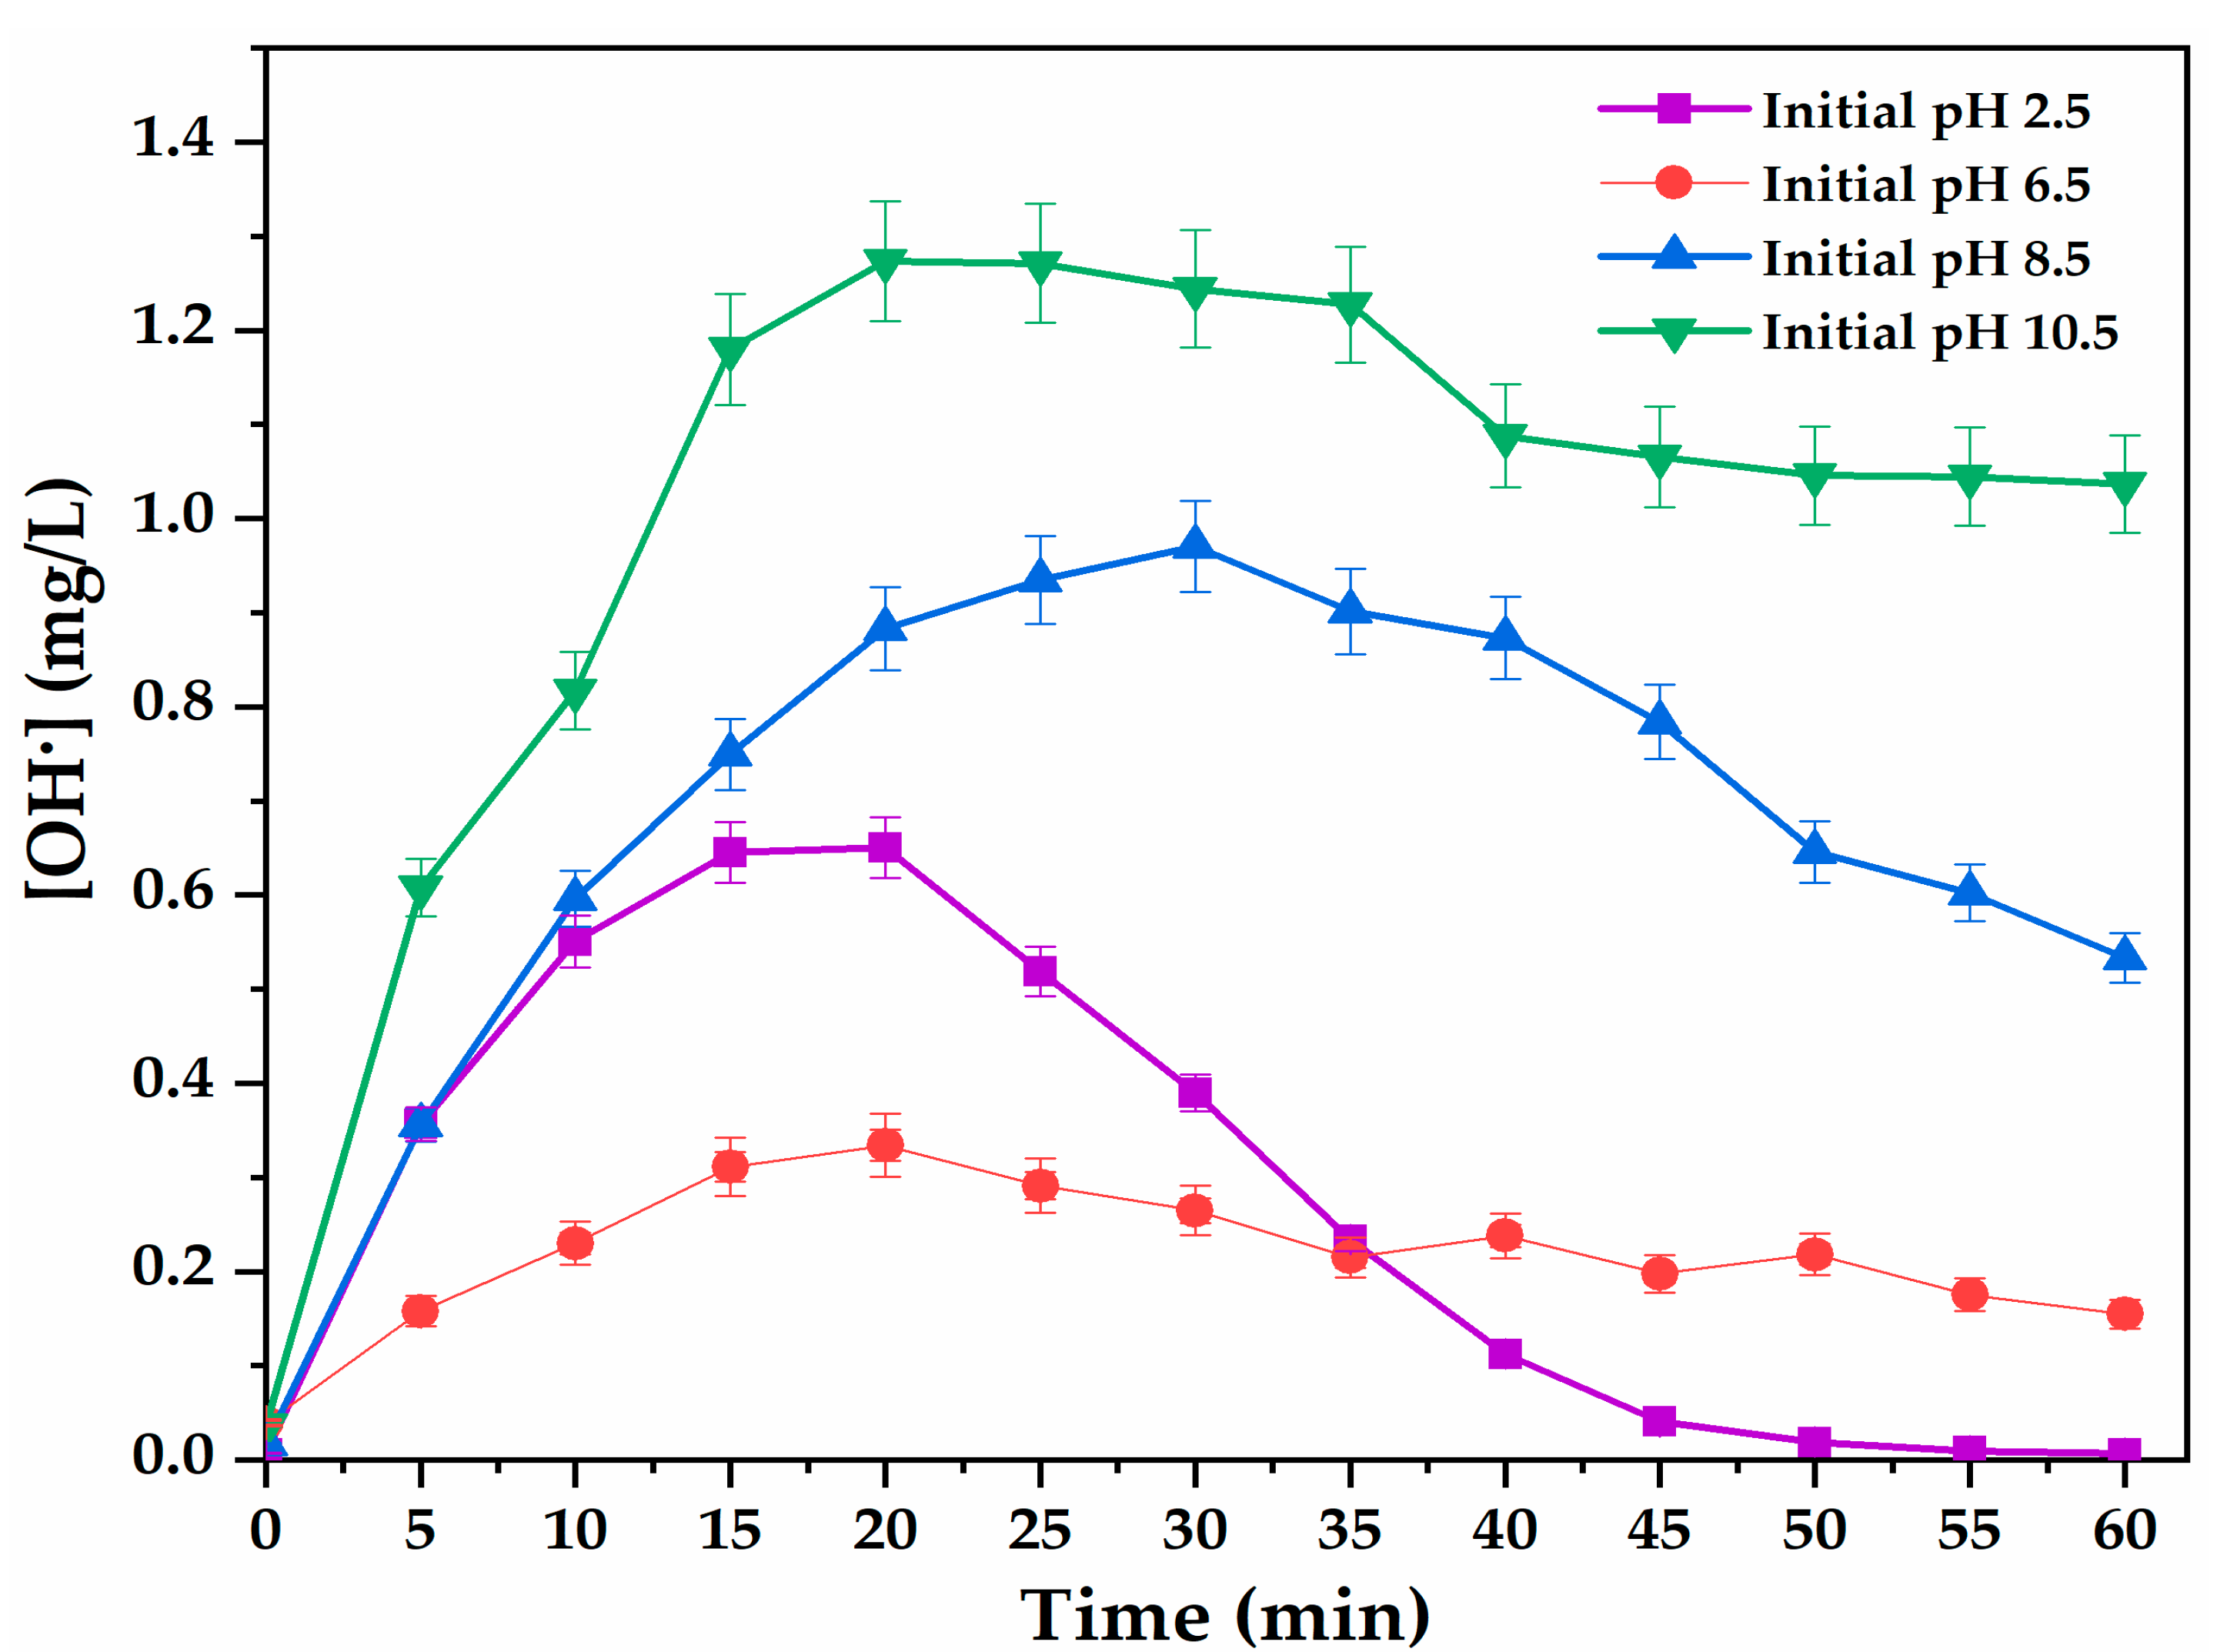
3.5. Effect of Initial Solution pH on OH Production in the Presence of Buffer

The impact of pH on OH concentration in the DCDBD reactor was also investigated twice (n = 2) in the presence of KH2PO4 buffer at the conditions as shown in Figure 6.
After a small amount of buffer (Na2HPO4 and KH2O4) was introduced in the reactor, only 1.27 mg/L of OH, was generated at pH 10.5 after 20 min of DBD while 0.97 mg/L was attained at pH 8.5 after 30 min of DBD run. These results suggest that phosphate anion scavengers, mainly H2PO4, HPO4 and PO4, from the buffer reacted slowly with OH radicals, as demonstrated in Equations (54)–(62) [53].
OH + H2PO4 → HPO4 + H2O
OH + H2PO4 → H2PO4 + HO
OH + HPO42− → HPO4 + OH
OH + PO43− → PO42− + HO
H2PO4 + H2O2 → H2PO4 + HO2 + H+
HPO4 + H2O2 → HPO42− + 2H+ + O2
H2PO4 + OH ⇄ HPO4 + H2O
H2PO4 + H2PO4 → H2P2O84− + 2H+
PO42− + PO42− → P2O84−
Hence scavenging by the buffer led to the progressive decline of OH in basic conditions. This trend was also observed in acidic pH after the introduction of phosphate buffer in the solution at pH 6.5 and 2.5. The number of phosphate scavengers produced at pH 6. 5 was probably higher than that obtained at pH 2.5 in the first 35 min.
This consequently resulted in low concentrations (0.33 mg/L) of OH at pH 6.5 after 20 min of DBD with phosphate buffer, compared to 0.65 mg/L OH achieved at pH 2.5 at the same sampling time. Beyond 35 min of the DBD experiment, the abundance of phosphate scavengers at pH 2.5 was higher than that at pH 6.5. This, therefore, resulted in a higher concentration of OH radicals (0.22 mg/L) at pH 6.5 after 50 min of DBD sampling, compared to 0.02 mg/L of OH achieved at pH 2.5 at the same sampling time in the presence of the phosphate buffer. These side reactions show that, during the formation of OH radicals in the DCDBD system, scavengers originating from the feeding gas (dry air) buffer such as phosphates (nitrate) reduce the amount of OH radicals formed in the reactor.
Moreover, the trends observed in Figure 5 still show that during the 60 min of the DBD experimental run, the highest concentrations of OH radicals were achieved at basic starting pH 10.5 and 8.5. Specifically, after 25 min of the DBD experiment, 1.271 and 0.934 mg/L OH were respectively reached when initial pH was 10.5 and 8.5, compared to 0.518 and 0.291 mg/L obtained at initial pH of 2.5 and 6.5.
Despite the presence of the phosphate buffer solution in the DCDBD reactor, high amounts of OH radicals were produced at basic pH as a result of the abundance of side-chain interactions of O3 and H2O2 with other species generated in the DCDBD reactor [30]. Apart from this, extended side-chain reactions such as the disintegration of H2O2 by UV light might have also contributed to improving the concentration of OH in the reactor at higher pH.
The main precursor of OH radicals in the DCDBD might have been used up by interaction with various species to generate various oxygen-based ionic and radical or molecular unstable intermediates as earlier shown in Equations (23)–(31). On the other hand, [42] held that the decay of OH in nonthermal plasma is mainly caused by OH diffusion from the discharge network and the termination reactions or recombination reaction, during which the reactions in Equations (63)–(68) take place [41,54,55].
OH + OH + (M) → H2O2 + (M)
OH + OH → H2O + O
OH + O → O2 + H
OH + H → O + H2
OH + H + (M) → H2O + (M)
OH + H → H2O
These reactions sequentially reduced the amount of OH radicals either with or without buffer in the solution. Comparable observations on OH radicals’ behaviour in an open DBD system were reported by Tijani et al. [52], who quantified the concentration of OH radicals and secondary intermediates in DBD during degradation of 2-nitro phenol. These results consequently show that during treatment of specific water effluent by DBD nonthermal plasma technologies, one should pay attention to chemical additives or anions, which, instead of boosting the detoxification process, may impede the removal of the targeted pollutants due to competitive reactions of OH radicals with scavengers, leading to the formation of various reactive aqueous species.

3.6. Effect of Sodium Carbonate on the Production of OH Radicals in DBD System

The effect of scavengers on OH radical concentration was investigated two times (n = 2) by assessing the impact of sodium carbonate (Na2CO3) on OH concentration in the DBD system in the absence of (Na2HPO4 and KH2O4) buffer at the applied conditions, as shown in Figure 7.
The outcomes of results shown in Figure 7 point out that, in the absence of phosphate buffer and Na2CO3 scavenger, the amount of OH radicals in the DCDBD reactor progressively increased with an increase of reaction time. This trend is in accordance with the results previously obtained in Figure 4 in the absence of phosphate buffer in the solution. In contrast, the concentration of OH radicals significantly decreased with the addition of Na2CO3 in the DBD system as shown in Figure 7.
After 35 min of the DBD experiment, the amount of OH radicals generated in the absence of scavenger was found to be about 0.389 mg/L, which considerably decreased to 0.034, 0.032 and 0.001 mg/L upon addition of 1.59, 3.18 g and 6.36 g of Na2CO3 in 1.5 L of 2 mM TA solution, respectively, in the DCDBD reactor, hence corresponding to 0.01, 0.02 and 0.04 M of Na2CO3. This trend was visible at all sampling times and for all three molarities of the scavenger during the DBD experiments. This observation shows that NaCO3 significantly affected the amount of OH radicals generated in the DBD reactor over time. This was certainly due to the scavenging interaction of carbonate/bicarbonate (CO32−/HCO3) with OH radicals, as shown in the series of Equations (69)–(80) earlier described by Wang et al. [56].
CO32− + H2O → HCO3 + OH
CO3 + H2O2 → HCO3 + HO2
HCO3 + OH→ CO32− + H2O
HCO3 + OH→ CO3 + H2O
HCO3 + O2 → CO3 + HO2
OH + HCO3 → CO3 + H2O
CO32− + OH → CO32− + OH
CO3 + O3 → CO3 + O3
CO32− + O + H2O → CO3 + 2OH
CO3 + O2 → CO32− + O2
CO3 + HO2 → CO32− + HO2
OH + CO32 → CO3 + OH
A similar impact of carbonate and bicarbonate anions on OH in solution was already claimed by Buxton et al. [57]. For decades, the oxidizing CO32−/HCO3 couple has been claimed to be effective scavengers of OH radicals in aqueous media [58,59,60]. This negative effect of HCO3 and CO32− anions deactivating the OH radicals, as shown in Equations (74)–(85), has been investigated by Staehelin and Hoigné [61,62,63].
Recently, the scavenging effects of carbonate and bicarbonate anionic species on OH radicals, were reported by Ann Liebert [64,65,66,67]. This further implies that, during the degradation of organic pollutants in the DCDBD reactor, the presence of species such as CO32−, HCO2, SO42− or NO2 may reduce the amount of OH produced and hence slow down the mineralization process of the targeted compounds.
Though high degradation percentages of pollutants such as dyes might be achieved, the amount of scavenger in the solution may thus significantly impact the degree of mineralization/decomposition of the targeted pollutant; hence, these species should be controlled or removed to ensure an adequate amount of OH radical is generated that majorly contributes to the destruction of targeted pollutants in the DCDBD reactor.

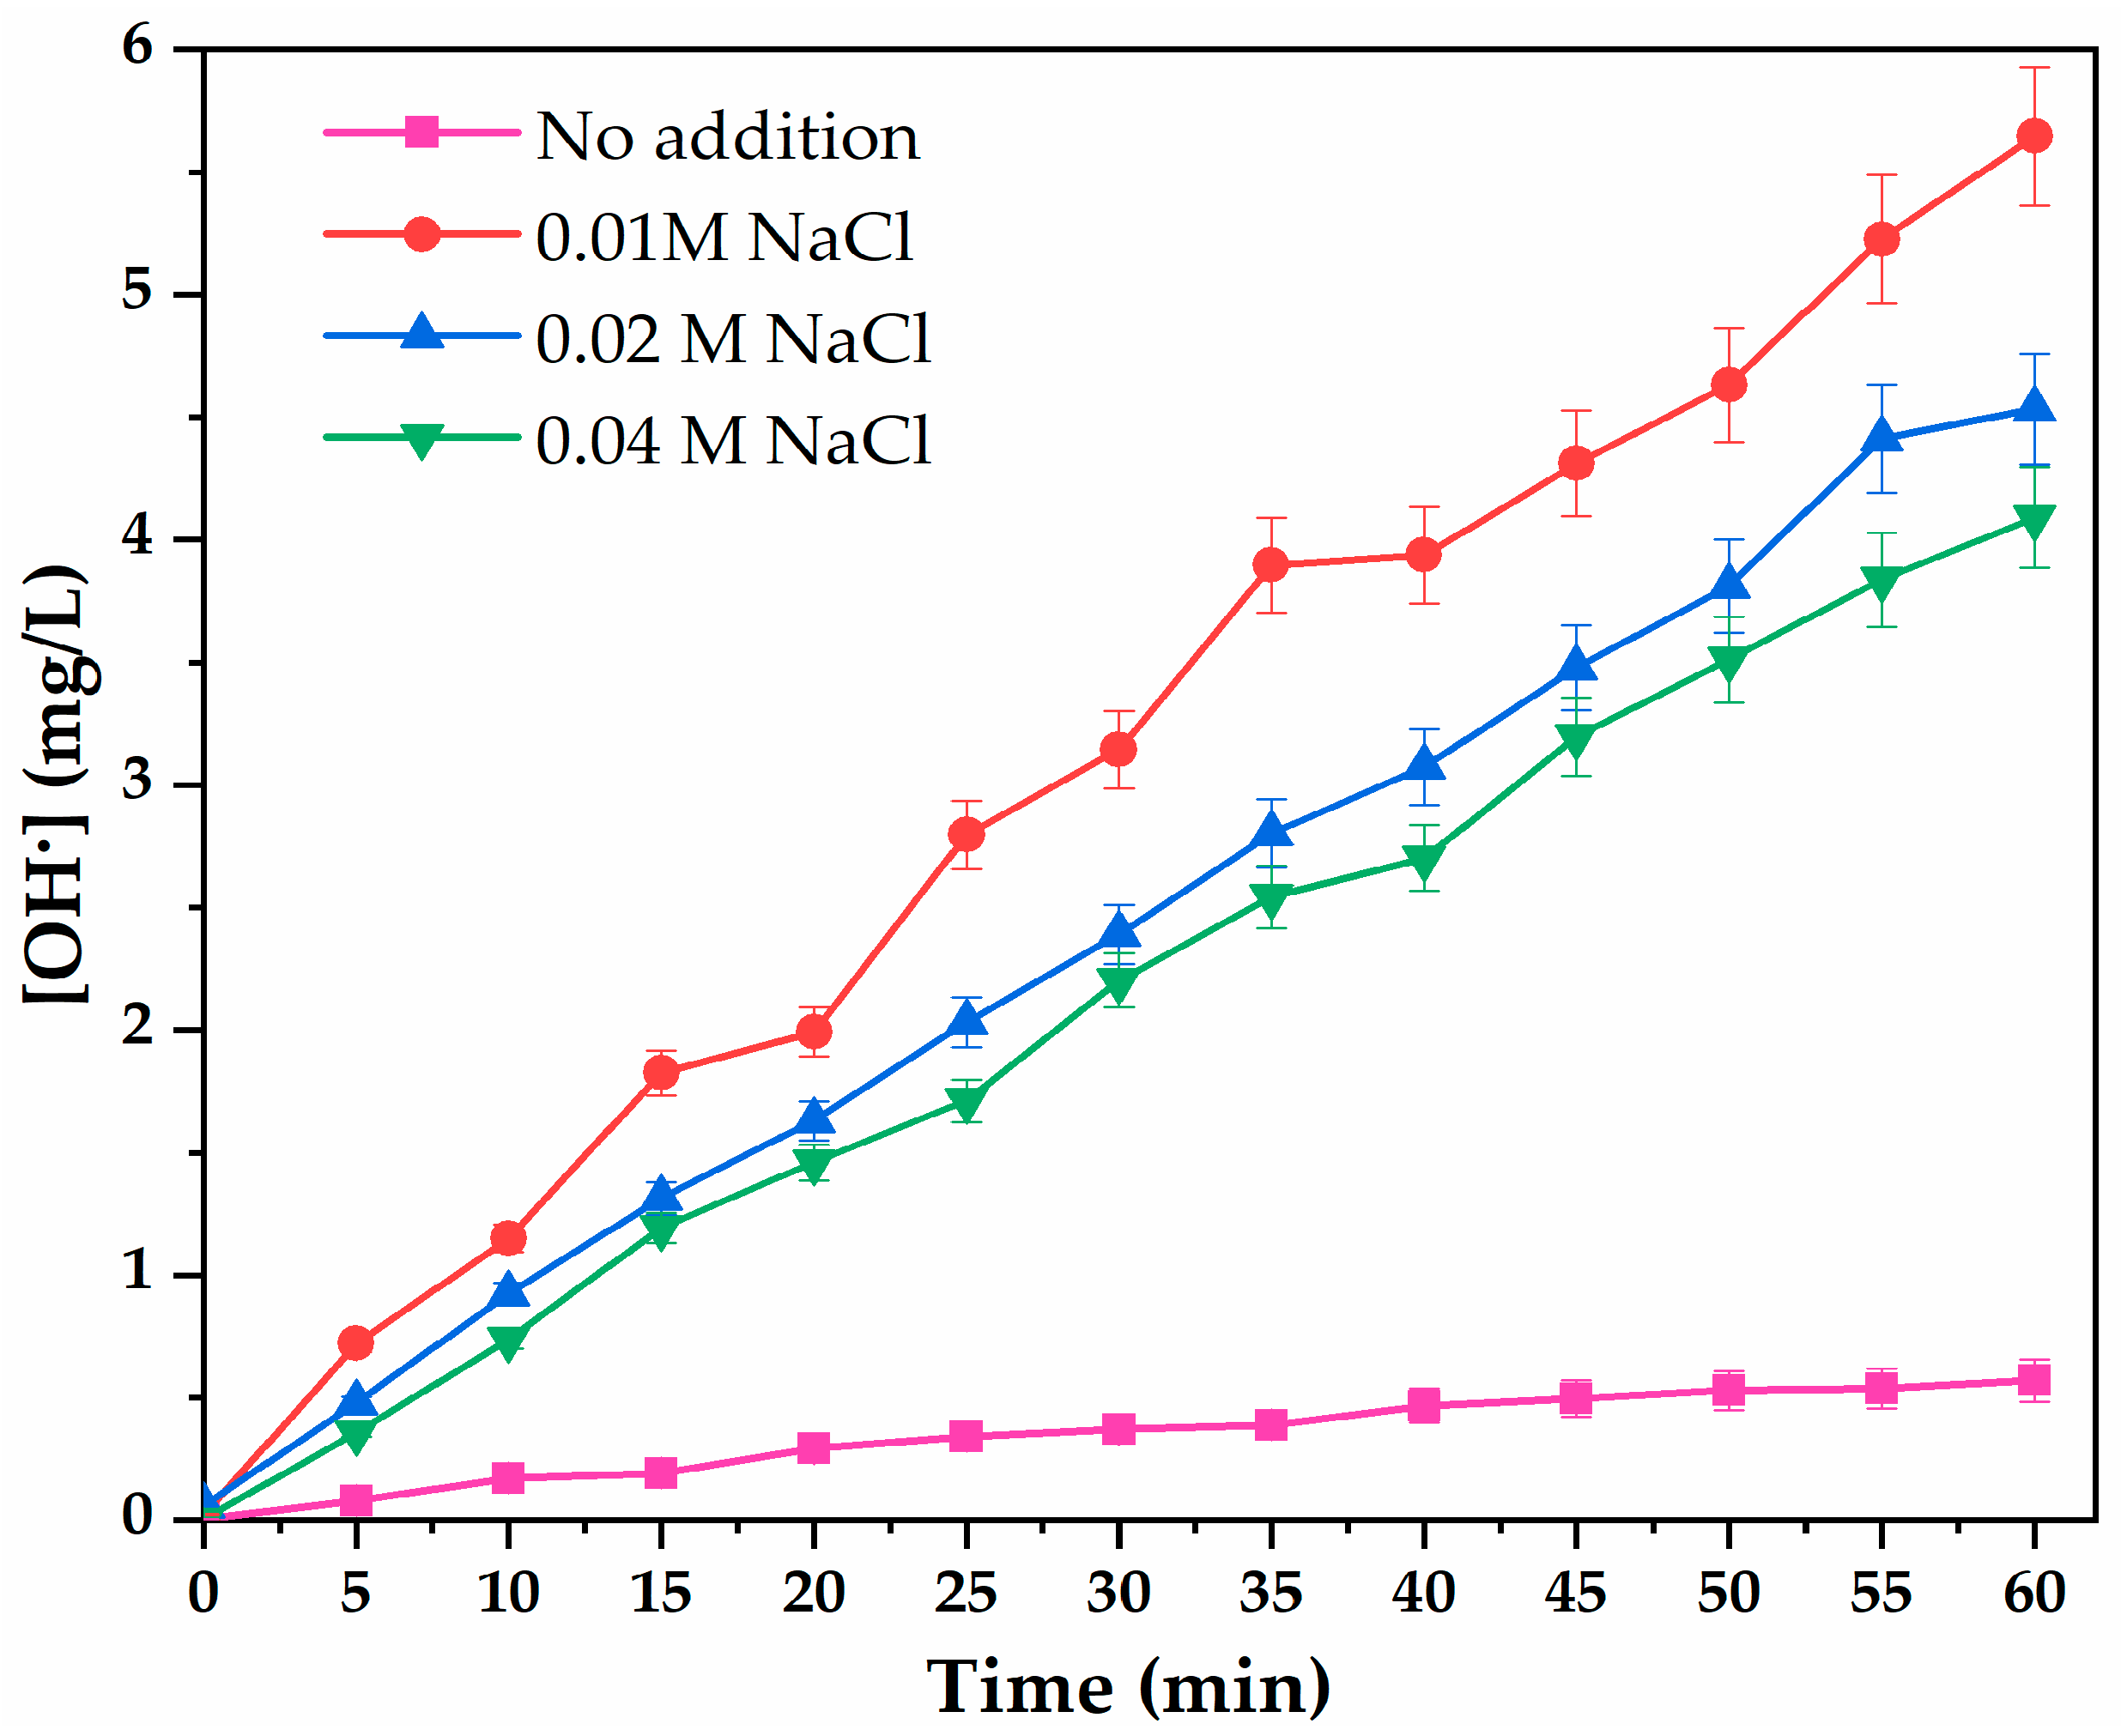
3.7. Effect of Sodium Chloride Scavenger on the Generation of OH Radicals

Besides Na2CO3, the repeated influence of scavenger on OH radicals (n = 2) was also investigated by evaluating the impact of NaCl (often considered chloride anion (Cl) on OH concentration in the DCDBD reactor at the corresponding conditions and the results of these investigations are shown in Figure 8.
The results in Figure 8 show that, after the addition of NaCl in the DBD system, the concentration of OH radical continuously increased with the DBD run time and was well above 0.57 mg/L OH earlier obtained in distilled water only in the absence of the phosphate buffer, as shown in Figure 4 and without the addition of Na2CO3. In fact, it was expected that OH concentration would be below 0.57 mg/L upon the addition of NaCl.
Unlike in the case of Na2CO3, the addition of NaCl in the DCDBD system boosted the production of OH radicals to a considerable extent even though the concentration of OH increased with a decrease in the amount of NaCl. Consequently, high concentrations of OH radicals were achieved with the addition of 1.59 g NaCl followed by 4.98 g and 9.64 g in 1.5 L of 2 mM TA in the DCDBD reactor, and hence corresponding to 0.01, 0.02 and 0.04 M NaCl molarities, respectively.
After 25 min of the DBD experiment, 2.796 mg/L OH was obtained with 0.01 M NaCl, which was higher than 2.030 or 1.710 mg/L OH obtained with 0.02, 0.04 M of NaCl in the absence of phosphate buffer, respectively. These results demonstrate that NaCl in the actual DCDBD configuration is not a scavenger but an OH promoter in a certain concentration range. The abundance of OH after the addition of NaCl in the DCDBD reactor in the absence of phosphate buffer in Figure 8 was probably due to the reaction of hydroxide anion (OH) with various aqueous species formed during the dissolution of NaCl, as shown in Equations (81)–(88).
NaCl (s) → Na+ (aq) + Cl (aq)
H2O (l) + UV → H+ + OH
Na+ (aq) + OH (aq) → NaOH (aq)
O3 + OH → O2 + HO2
O3 + HO2 → 2O2 + OH
HO3 → O2 + OH
OH + H2O2 → HO2 + H2O
HO2 + H2O → H2O2 + OH
Alternatively, the scavenging behaviour of NaCl observed in Figure 8 could be a factor as the amount of OH radicals (mg/L) decreased with an increase of NaCl quantity yet OH values were still high. In fact, various studies have demonstrated that NaCl is an OH scavenger. This is in conformity with Liebert et al. [64], who reported that Cl could lessen the photocatalytic/oxidation reaction rate by trapping the oxidizing OH radicals, as shown in Equations (89) and (90).
OH + Cl → Cl
Cl + Cl → Cl
These ions consequently could reduce the concentration of aqueous OH radicals produced in the DCDBD configuration. This was also supported by Abdullah, [60] who agreed that Cl and SO42− compete with OH, as shown in the Equations (94) and (95), to yield corresponding radicals that are often transitory aqueous species during the oxidation process. Though the results obtained by Abdullah and colleagues claim that NaCl is an OH scavenger. The experimental systems used in their studies and those employed in the current DCDBD reactor are far different and hence unlikely to lead to the same results.
Furthermore, Haarstrick et al. [68] stated that the chlorine radicals formed (Equation (94)) can interact with H2O2, leading to the production of O2 and Cl in aqueous systems. This consequently may impact on the rate of oxidation during the Cl scavenging scenario, which diminished H2O2 concentration beyond a certain molar amount of NaCl when applied in the DBD reactor, and hence resulted in the reduction of OH radical concentration in the system, recalling that H2O2 is one of the principal precursors of OH radicals in aqueous media.
Despite the fact that literature has supported these claims, the experimental conditions used in their studies were far different from those employed by the DCDBD system investigated in this study. This implies that, depending on the system and NaCl concentration, NaCl could be considered as either OH scavenger or promoter.

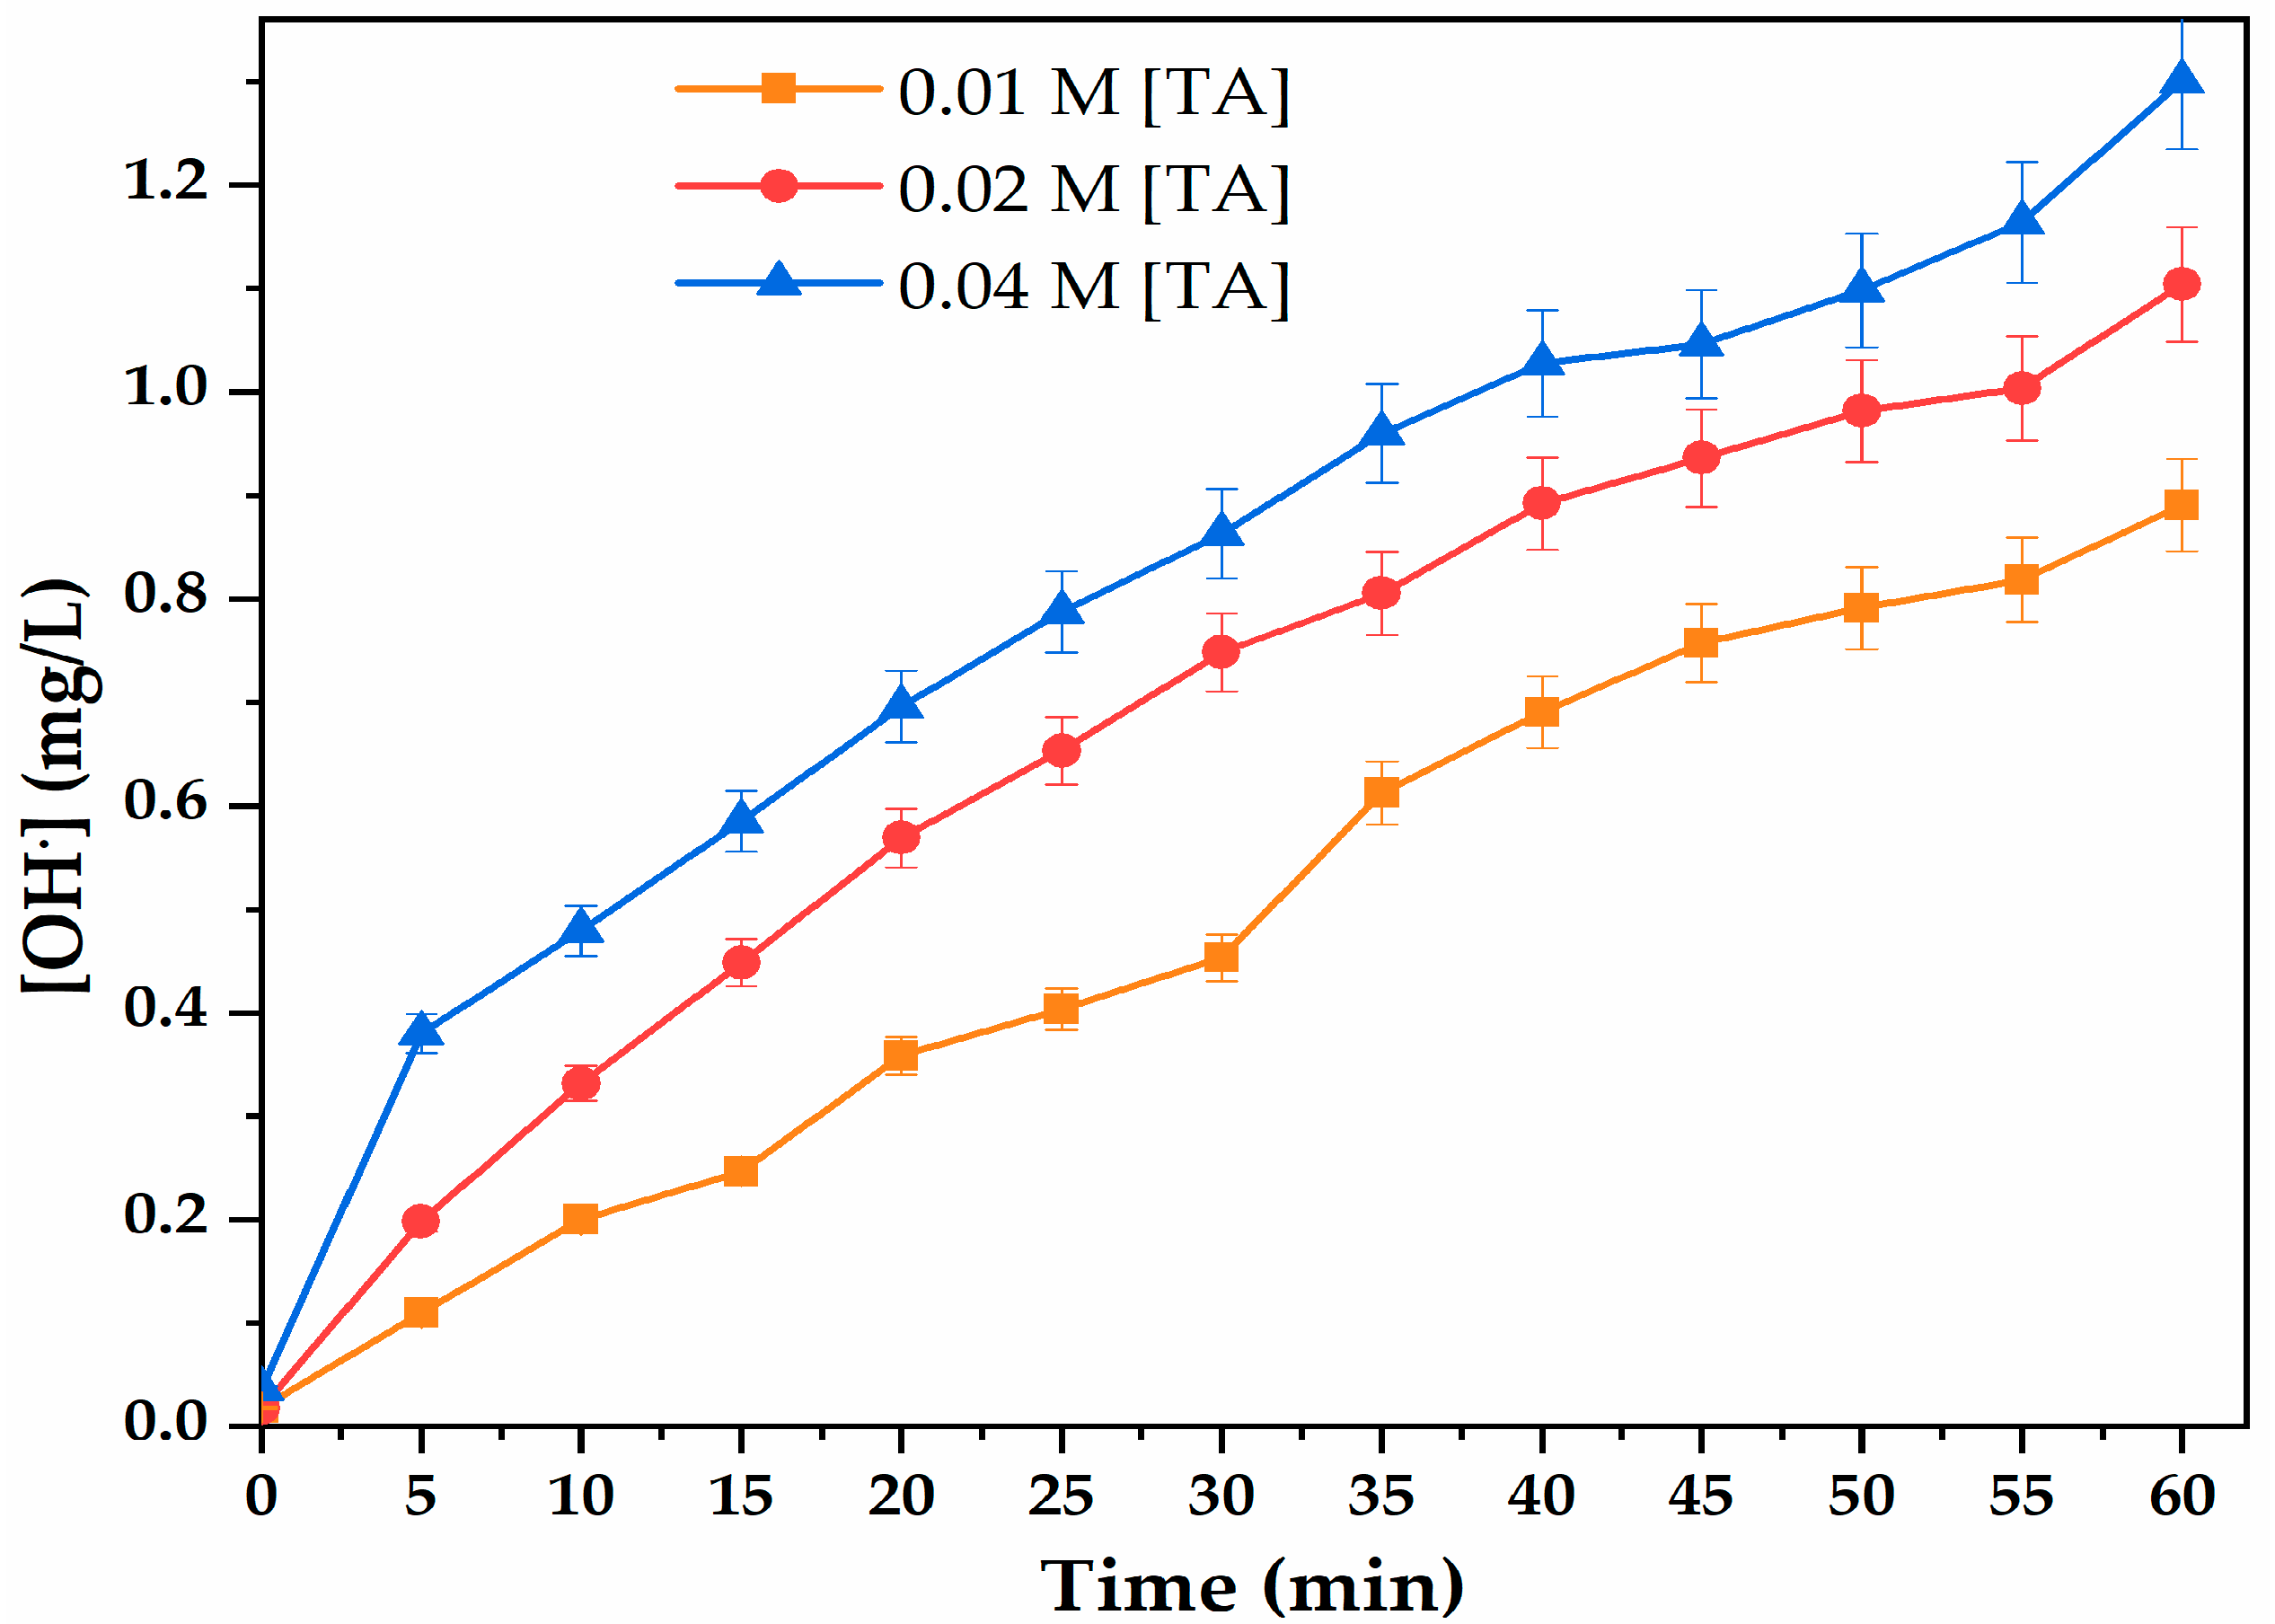
3.8. Effect of Chemical Probe Concentration on the Trapping of OH Radical

The effect of the chemical probe (TA) on the OH concentration in the DCDBD system was inspected (n = 2) at the applied conditions as detailed in Figure 9. The results show that, for each dose of TA probe, the OH concentration in the DCDBD reactor continuously increased with an increase in DBD exposure time.
These results confirm that DCDBD is a typical AOP configuration in which OH radicals are uninterruptedly produced via several chemical mechanisms, as suggested in Equations (1)–(94). Regardless of the fact that OH was proved to interact with other species and hence could be consumed inside reactions, its increasing concentration at each concentration of the TA probe suggests that the rate of formation of OH predominates over its consumption by other chemical reactions taking place in the reactor.
Likewise, the results also show that the use of too little TA below the molarity of 0.04 M in the DCDBD reactor may not capture many of the OH radicals produced [69]. Similar observations were reported by Kanazawa et al. [42], who measured OH radicals in aqueous solution produced by an atmospheric-pressure, low-frequency plasma jet using a TA probe and they are in good agreement with various authors [70,71,72,73,74].
Besides, the results in Figure 9 also show that the amount of OH radicals that were measured increased with an increase of the amount of TA used. After 5 min of DBD run time, 0.479 mg/L OH was measured with 0.04 M of TA, which was higher than 0.198 and 0.110 mg/L OH measured with 0.02 and 0.01M of TA, correspondingly. This trend was also observed at each sampling time in the 60 min of DBD run. This indicates that a higher amount of TA probe in the solution may assist to capture most of the OH generated in the DCDBD reactor and an insufficient amount of TA will limit the trapping of the OH measured.
These outcomes also demonstrated that TA is a suitable probe for the quantification of OH in the DBD aqueous system. The interaction between TA and OH yielding the yellow-coloured 2-hydroxy terephthalic acid is thus capable of trapping the maximum of the OH radicals produced in advanced oxidation technologies, as argued by [75,76,77], which investigated the quantification of OH using TA probe in aqueous systems other than DBDs. Even though different experimental systems have been utilized for the determination of OH radicals, the results obtained in this study validate that TA is a suitable chemical probe for the detection and quantification of OH in aqueous media, but its quantity could limit trapping of OH leading to underestimation of the OH radicals present in the system.
Herein, the study in distilled water proved that the DCDBD reactor is an effective AOP that generates various oxidizing species. Among the three oxidants quantified in the DCDBD reactor, O3 and OH radicals are more active with their oxidation potentials of 2.07 eV and 2.80 eV, compared to H2O2 (1.76 eV), whose effect has been evidenced in medicine [78]. However, it is mostly OH precursor [79,80]. While O3 attacks olefenic compounds mostly by epoxidation [81] (1), the nonselective OH oxidizes and mineralizes the pollutants to CO2, H2O and harmless byproducts (2) [82]. To support these claims, the efficacy of the DCDBD reactor had to be tested by direct decontamination of MB simulated textile wastewater.

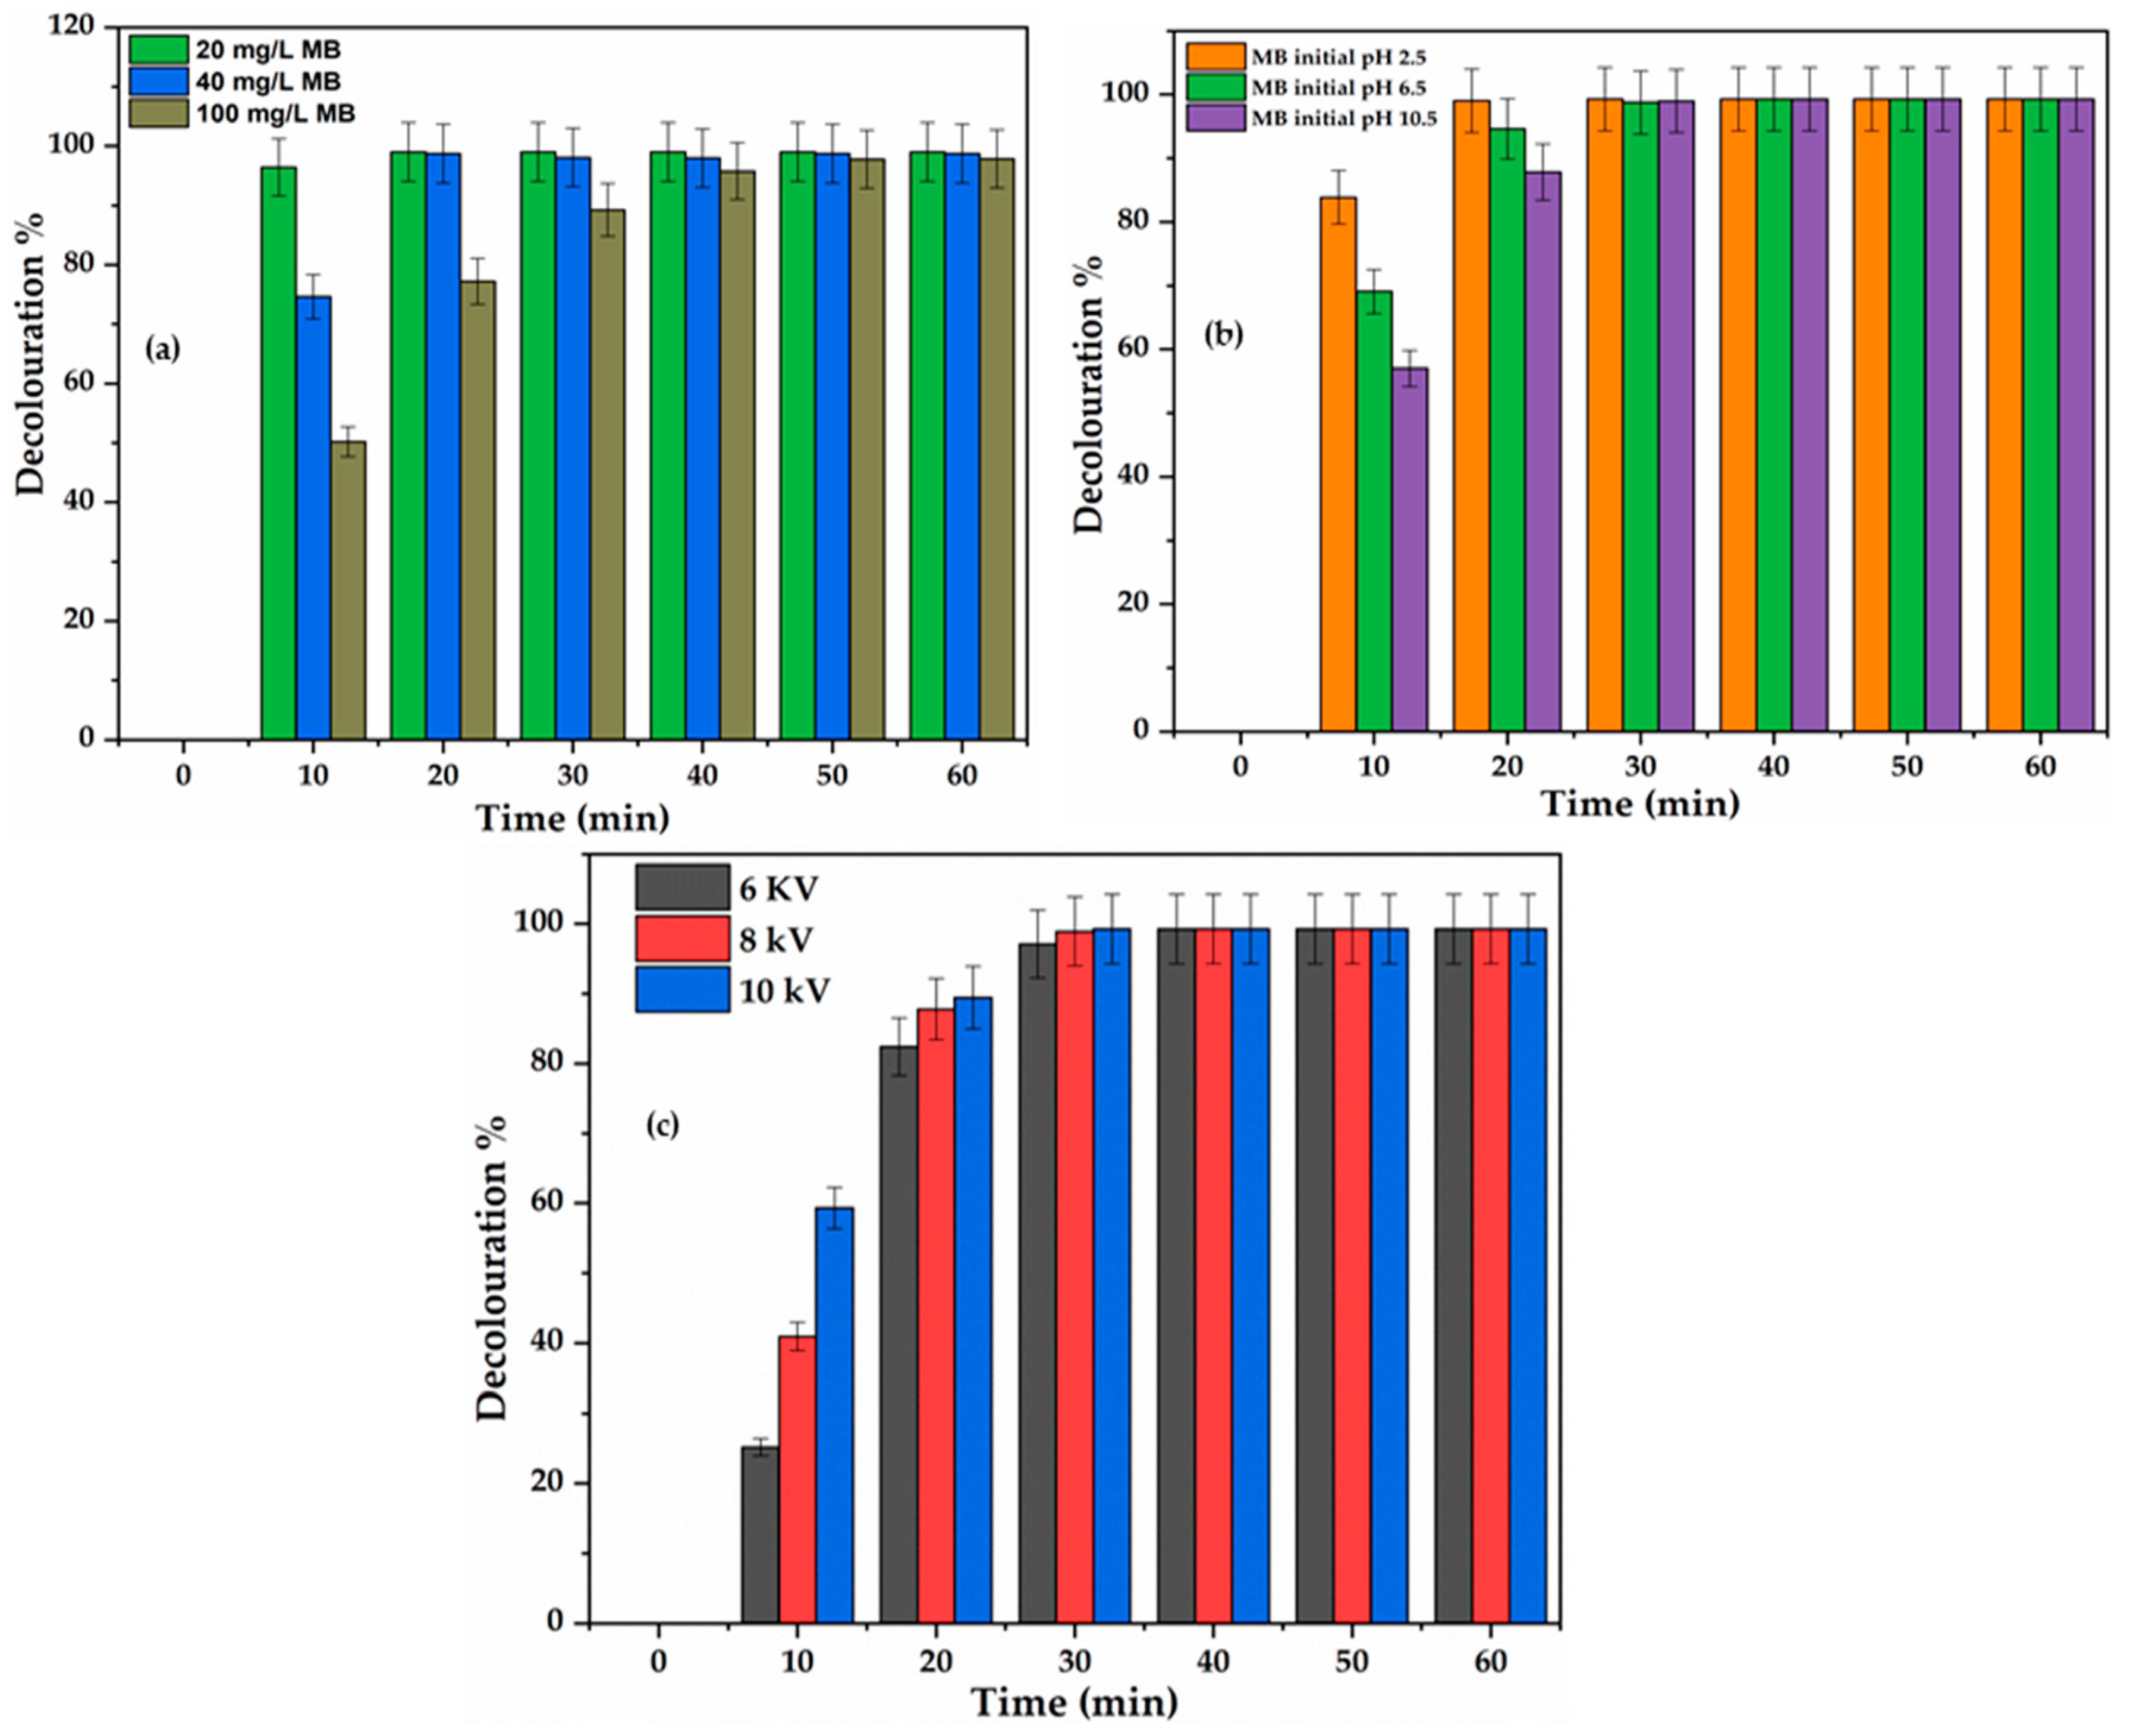
3.9. Decolouration of Simulated Methylene Blue by Optimized Double Cylindrical Dielectric Barrier Discharge: Effect of Working Parameters

After evaluation of the DCDBD efficiency by quantification of O3, H2O2 and OH, the effectiveness of the reactor was further tested for the degradation of simulated wastewater containing methylene blue (MB) as the model pollutant. In this regard, the influence of working parameters, namely, the initial concentration, solution pH, and peak voltage, on the removal efficiency of MB was investigated at the applied conditions.

3.9.1. Effect of Initial Concentration on Decolouration Rate of MB

When the MB concentration was varied from 20, 60 to 100 mg/L at the applied conditions, the results displayed in Figure 10a show that the decolouration percentage decreased with an increase of initial MB concentration [83]. For instance, in Figure 10a, after 10 min, 93.9% decolouration of MB was achieved with 20 mg/L, which decreased to 66.37% and 19.8% decolouration when initial MB concentration was increased to 60 or 100 mg/L, respectively. This trend was observed at all sampling times and complied with Inaloo et al. [84].
These authors confirmed that dye decolouration decreases with an increase of its initial concentration. This was further supported by Reddy and Subrahmanyam [85] who stated that dye decolouration is effective at low concentration as the performance of the DBD system declined at high initial dye concentration. The decrease in decolouration percentage as the concentration of MB increased was certainly due to the higher proportion of MB molecules, rather than free reactive species in the medium. Not only that, at a high concentration of MB, the intensity of UV-light produced in the DCDBD system also became weak, and, as such, could not penetrate the bulk dye solution. In fact, only the MB solution layers surrounding the second (or the outer) dielectric quartz tube were thoroughly exposed to the UV light generated and decolourized. Additionally, the MB solution of high concentration required significant stirring and a prolonged exposure time of more than 30 min to be adequately decolourized. The results in Figure 10a demonstrated that the initial concentrations and time significantly affected the degradation of MB dye from the simulated wastewater.

3.9.2. Effect of pH on Decolouration of MB

The influence of initial solution pH on MB decolouration efficiency in the DCDBD reactor was evaluated by varying initial pH between 2.5, 6.5 and 10.5 using NaOH or HNO3, and the results are shown in Figure 10b. It was observed that MB decolouration efficiency decreased with an increase in solution pH. Specifically, in Figure 10b, it was noticed that 83.11% degradation of 20 mg/L MB was achieved after 10 min at pH 2.5, compared to 66.99% and 56. 24% degradation obtained at pH 6.5 and 10.5, correspondingly. Similar trends were observed even after 20 and 30 min reaction time, which supported the findings of Madhu et al. [23] showing that the maximum decolouration of MB by TiO2 was achieved at pH 2.
The decrease in MB decolouration percentage due to an increase in pH values suggested the presence of a greater quantity of O3 and perhaps the low amount of OH radical and H2O2 in the acidic medium than in the alkaline environment. The results agreed with the outcome of Sugiarto et al. [86], who reported that the oxidation of organic dyes is pH sensitive and dyes degrade faster into organic acids, aldehydes in an acidic medium than alkaline region. The observed trend could further be ascribed to the consumption of the available OH radicals by scavengers such as carbonates and nitrogenous species that are formed during oxidation of MB [17].
These results further demonstrated that acidic dyes such as MB easily decolourize in acidic conditions [86,87,88].Since the maximum MB degradation percentage in Figure 10b was achieved at pH 2.5; this was selected as the optimum pH value in the current study and is lower than the pH 3.5 reported by Sugiarto and colleagues during decolouration of Chicago Sky Blue dye in different pulse discharge configurations.

3.9.3. Effect of Peak Voltage on Decolouration of MB

Figure 10c depicts the results of the variation of the peak voltage on MB decolouration percentage and rate. It can be seen that MB decolouration increased with increased applied voltage within the first 30 min (Figure 10c). For instance, at 10 min of DBD plasma treatment, 24.63% 5 mg/L MB decolouration was achieved with 6 kV and increased to 40.22% and 58.54% when the peak voltage was increased to 8 and 10 kV, respectively. This result is similar to the outcomes published by Reddy et al. [85] who investigated the removal of MB by single cylindrical dielectric barrier discharge. At a fixed concentration of 50 mg/L MB, Reddy and co-workers showed that, after 25 min of reaction time, MB % decolouration increased from 90, 93.5 to 94.5% when the voltage was varied from 14, 16 to 18 kV, respectively. In Figure 10c, the MB decolouration rate constant Kr1 (0.921 × 10⁻¹ min−1) at 6.4 kV within 60 min increased to (Kr2 = 1.526 × 10⁻¹ min−1 and Kr3 = 2.071 × 10⁻¹ min−1) as the peak voltage increased from 6 to 10 kV, respectively. This was due to the increase of both the number and the duration of microdischarges generated in the DBD reactor and invariably enhanced the amount of hydroxyl radicals and hydrogen peroxide in the medium [89]. In addition to that, the strong electric field around the anode electrode probably enhanced the production of other reactive species in the system and hence resulted in the higher decolouration rate of MB dye. It can be inferred that peak voltage slightly impacted dye removal in the DBD reactor. Nevertheless, 8 kV was selected as the best peak voltage for the decolouration of MB in the current DBD configuration.

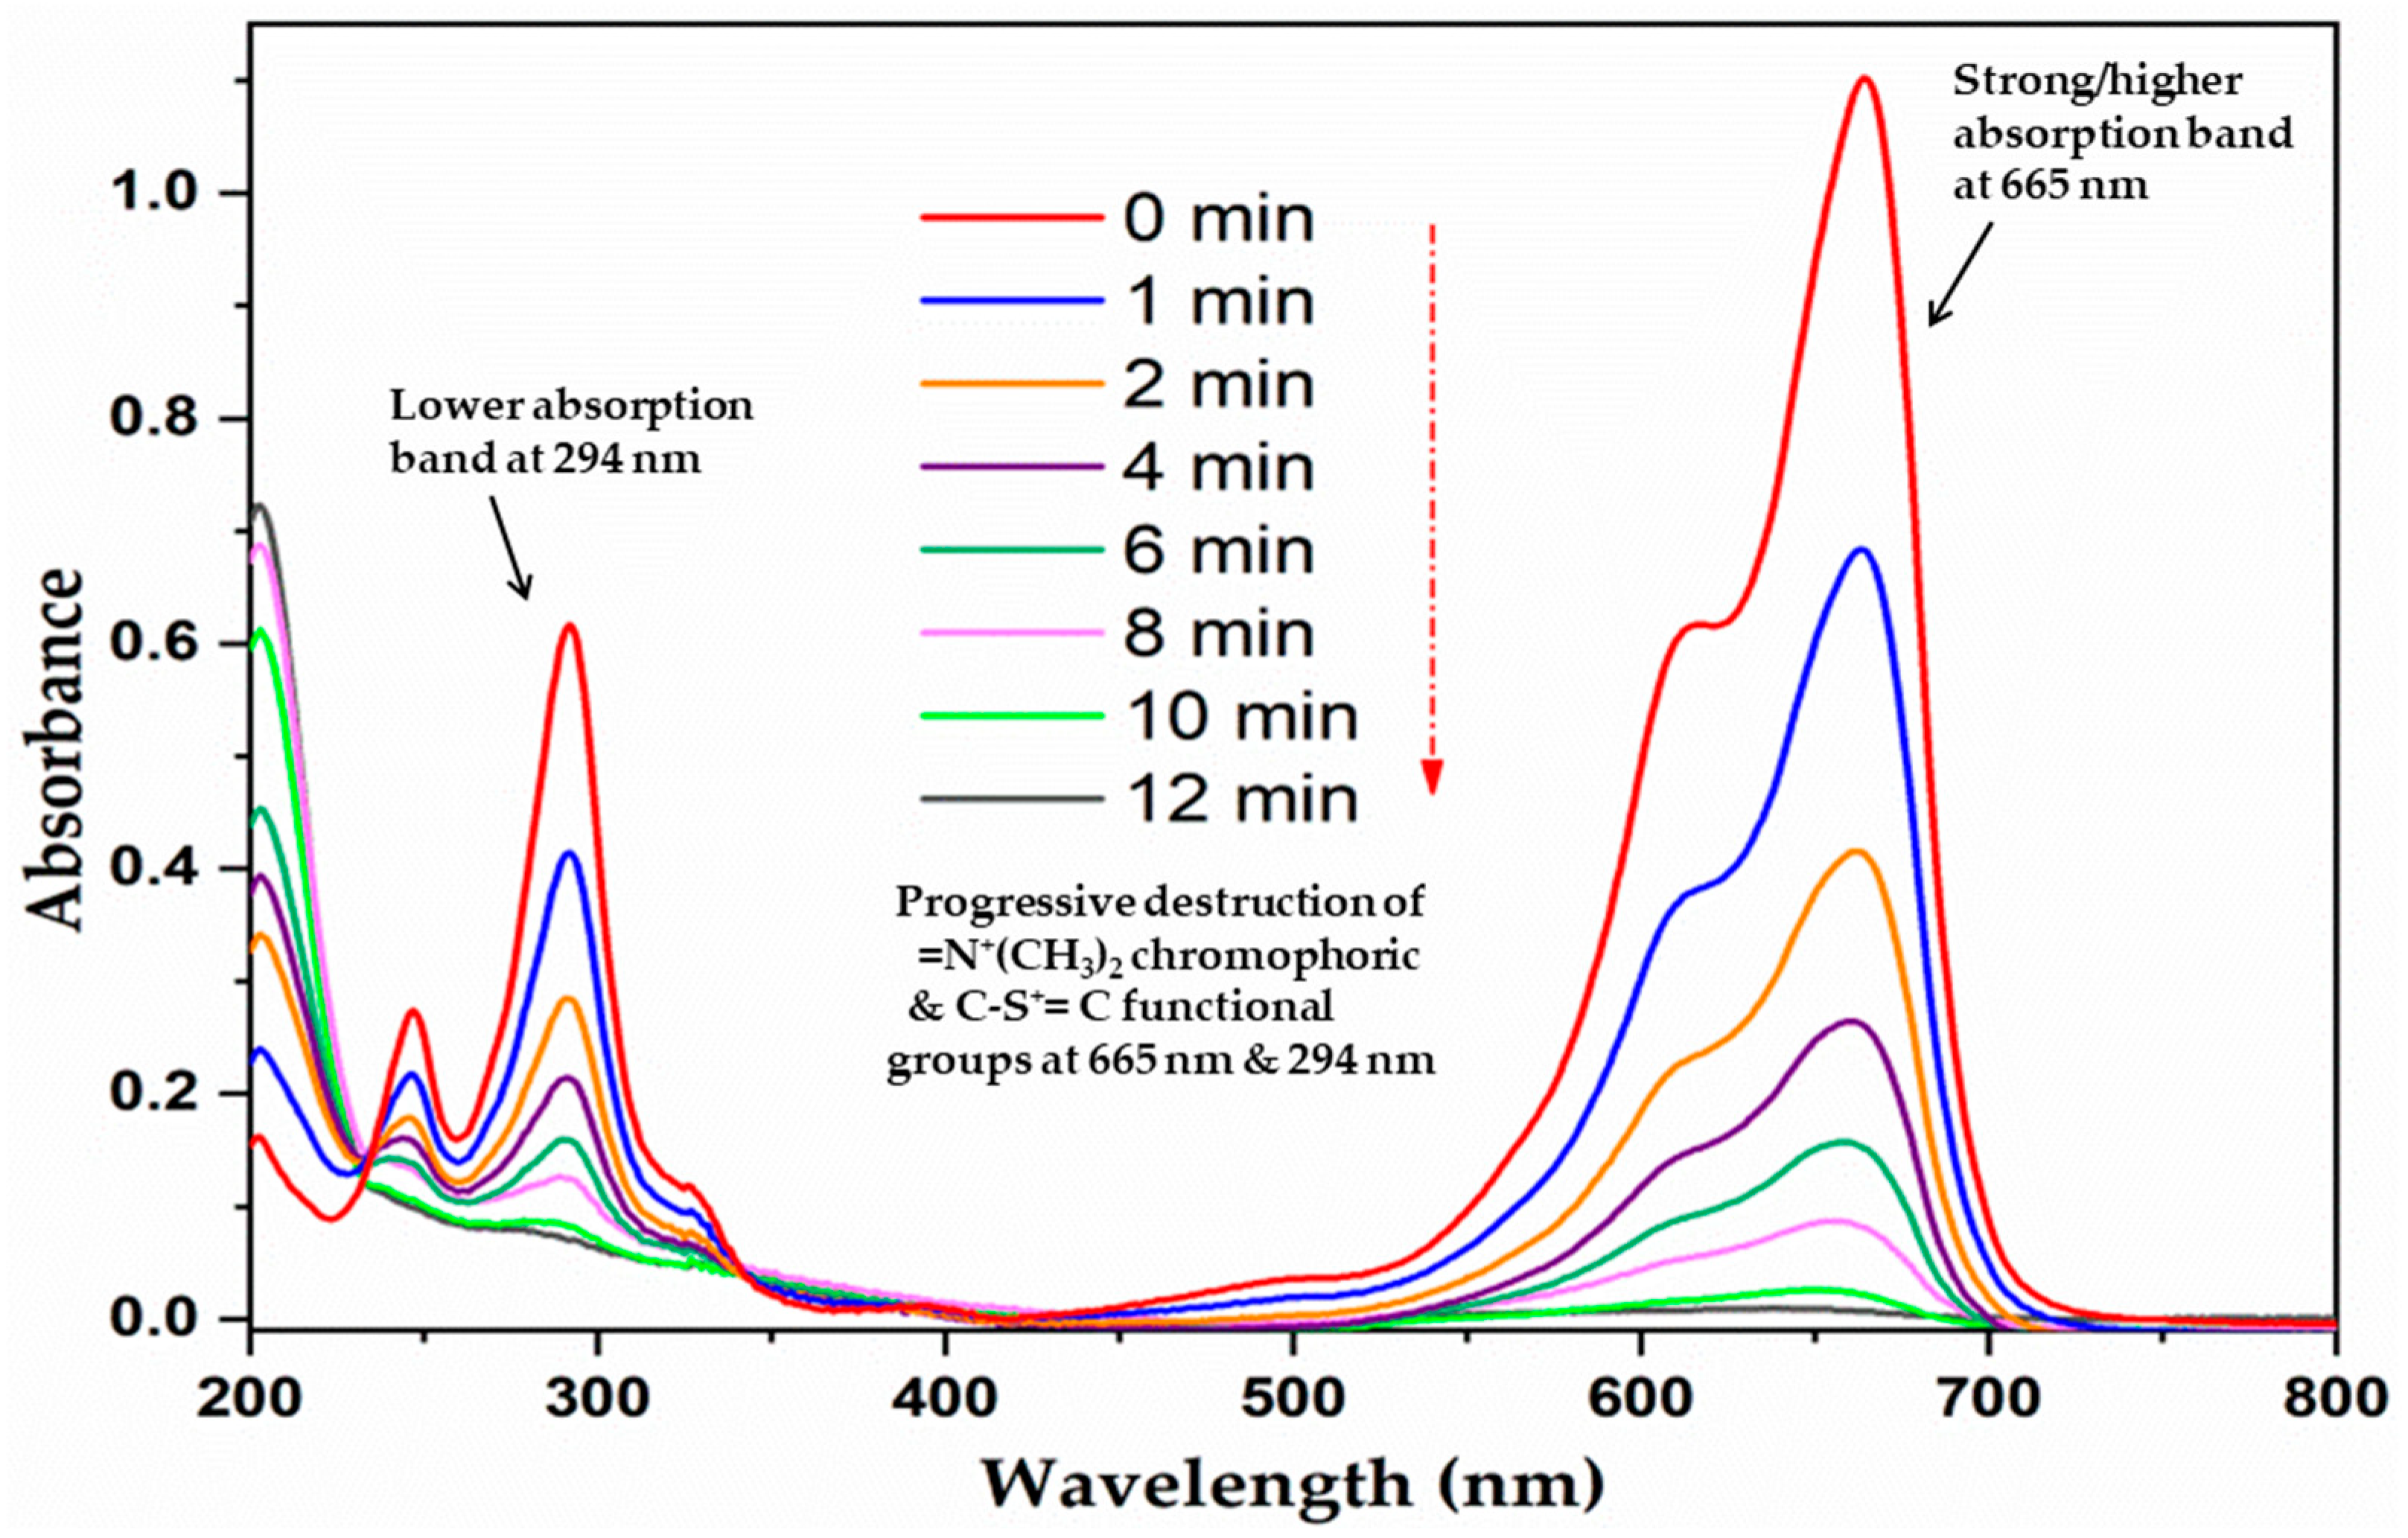
3.9.4. Ultraviolet-Visible Spectroscopy

The UV spectra of MB decolouration at optimum conditions presented in Figure 11 showed that the MB higher energy absorption bands were between 535 cm−1 and 735 cm−1. The progressive decline of MB absorption peak intensity at 665 nm and 294 nm as a function of reaction time may be attributed to the destruction of the =N+(CH3)2 chromophor group by ozone and hydroxyl radicals [46]. Moreover, the results in Figure 11 indicate that complete decolouration of MB at the optimum conditions was achieved within 12 min of plasma exposure as the absorption peaks obtained at 665 nm within 12 min showed a progressive decay of MB. This rapid decolouration of MB was enhanced by the destruction of the C-S+=C functional group in the MB structure which is also an electrophilic centre attacked by OH radicals during plasma treatment [90].
Similar UV-vis spectra for the degradation of MB by nonthermal plasma were reported by Akishev et al. [91], who investigated the decomposition of MB by corona discharge and showed that the strong maximum absorption bands of MB recorded at 665 and lower absorption bands around 294 nm progressively decreased with an increase of treatment time, and total decolouration was achieved after 30 min of plasma treatment. The authors reported that a long time was required to decolour high MB concentration varied from 50, 100 to 150 mg/L. This concurred with the outcome of Magureanu et al. [92,93,94,95,96], who separately noticed complete degradation of MB in corona discharges, an ozonation system and a single planar DBD reactor after 30, 20 and 28 and 15 min, respectively. The differences in the reaction time may be ascribed to the type of DBD system employed.
Altogether, the decline of MB concentration with time shown in Figure 8 and the literature cited above demonstrated that dye initial concentration is a critical parameter that needs particular attention during water and wastewater treatment by nonthermal induced DBD. Alternatively, these observations proved that DBD configurations are effective methods for the decolouration of MB. However, their efficiencies might depend on the initial concentration and applied time to reach complete decolouration.
The removal of POPs in drinking water and wastewater from chemical industry effluents, pharmaceutical products and personal care products has been the subject of research in recent years. In terms of colourant compounds such as dyes, the two aspects involved during their removal include decolouration and degradation. Decolouration often indicated by colour removal refers to the destruction of chromophoric groups such as (azo, N-CH3, C=C, etc.) from the chemical structure by reactive oxygen species, such as O3 or related oxidants. However, the general chemical framework could still be unbroken and might become either harmless or more carcinogenic than parent molecules depending on the treatment system.
On the other hand, degradation entails that the carbonyl component portion of the molecule is destroyed leading either to smaller entities or to bigger fragments (oligomers) that could be innocuous or more toxic than the starting compounds. Consequently, for both coloured and colourless POPs, the degradation scenario is the ideal process targeted during detoxification of polluted water. So to overcome the toxicity of byproducts for both types of compounds, further oxidation and mineralization of degradation intermediate byproducts to CO2, H2O and inoffensive end products are mandatory. Therefore, robust environmental treatment technologies should be able to meet these criteria.
During the degradation of POPs, the decomposition of the targeted compound can follow different mechanisms whose effectiveness may depend on the behaviour of degradation byproducts. Hence, the UV-vis spectroscopy used to follow the decolouration of targeted/model compounds in most studies would not be enough to define their complete mineralization, but more sophisticated techniques such as HPLC-MS or LC-MS would be required.

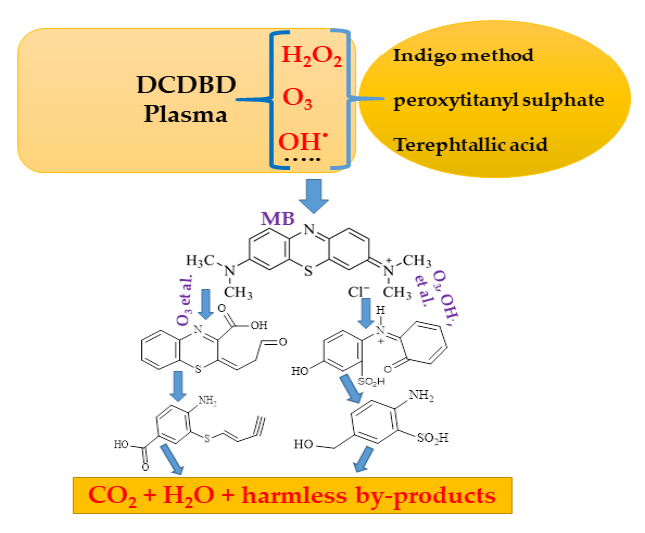
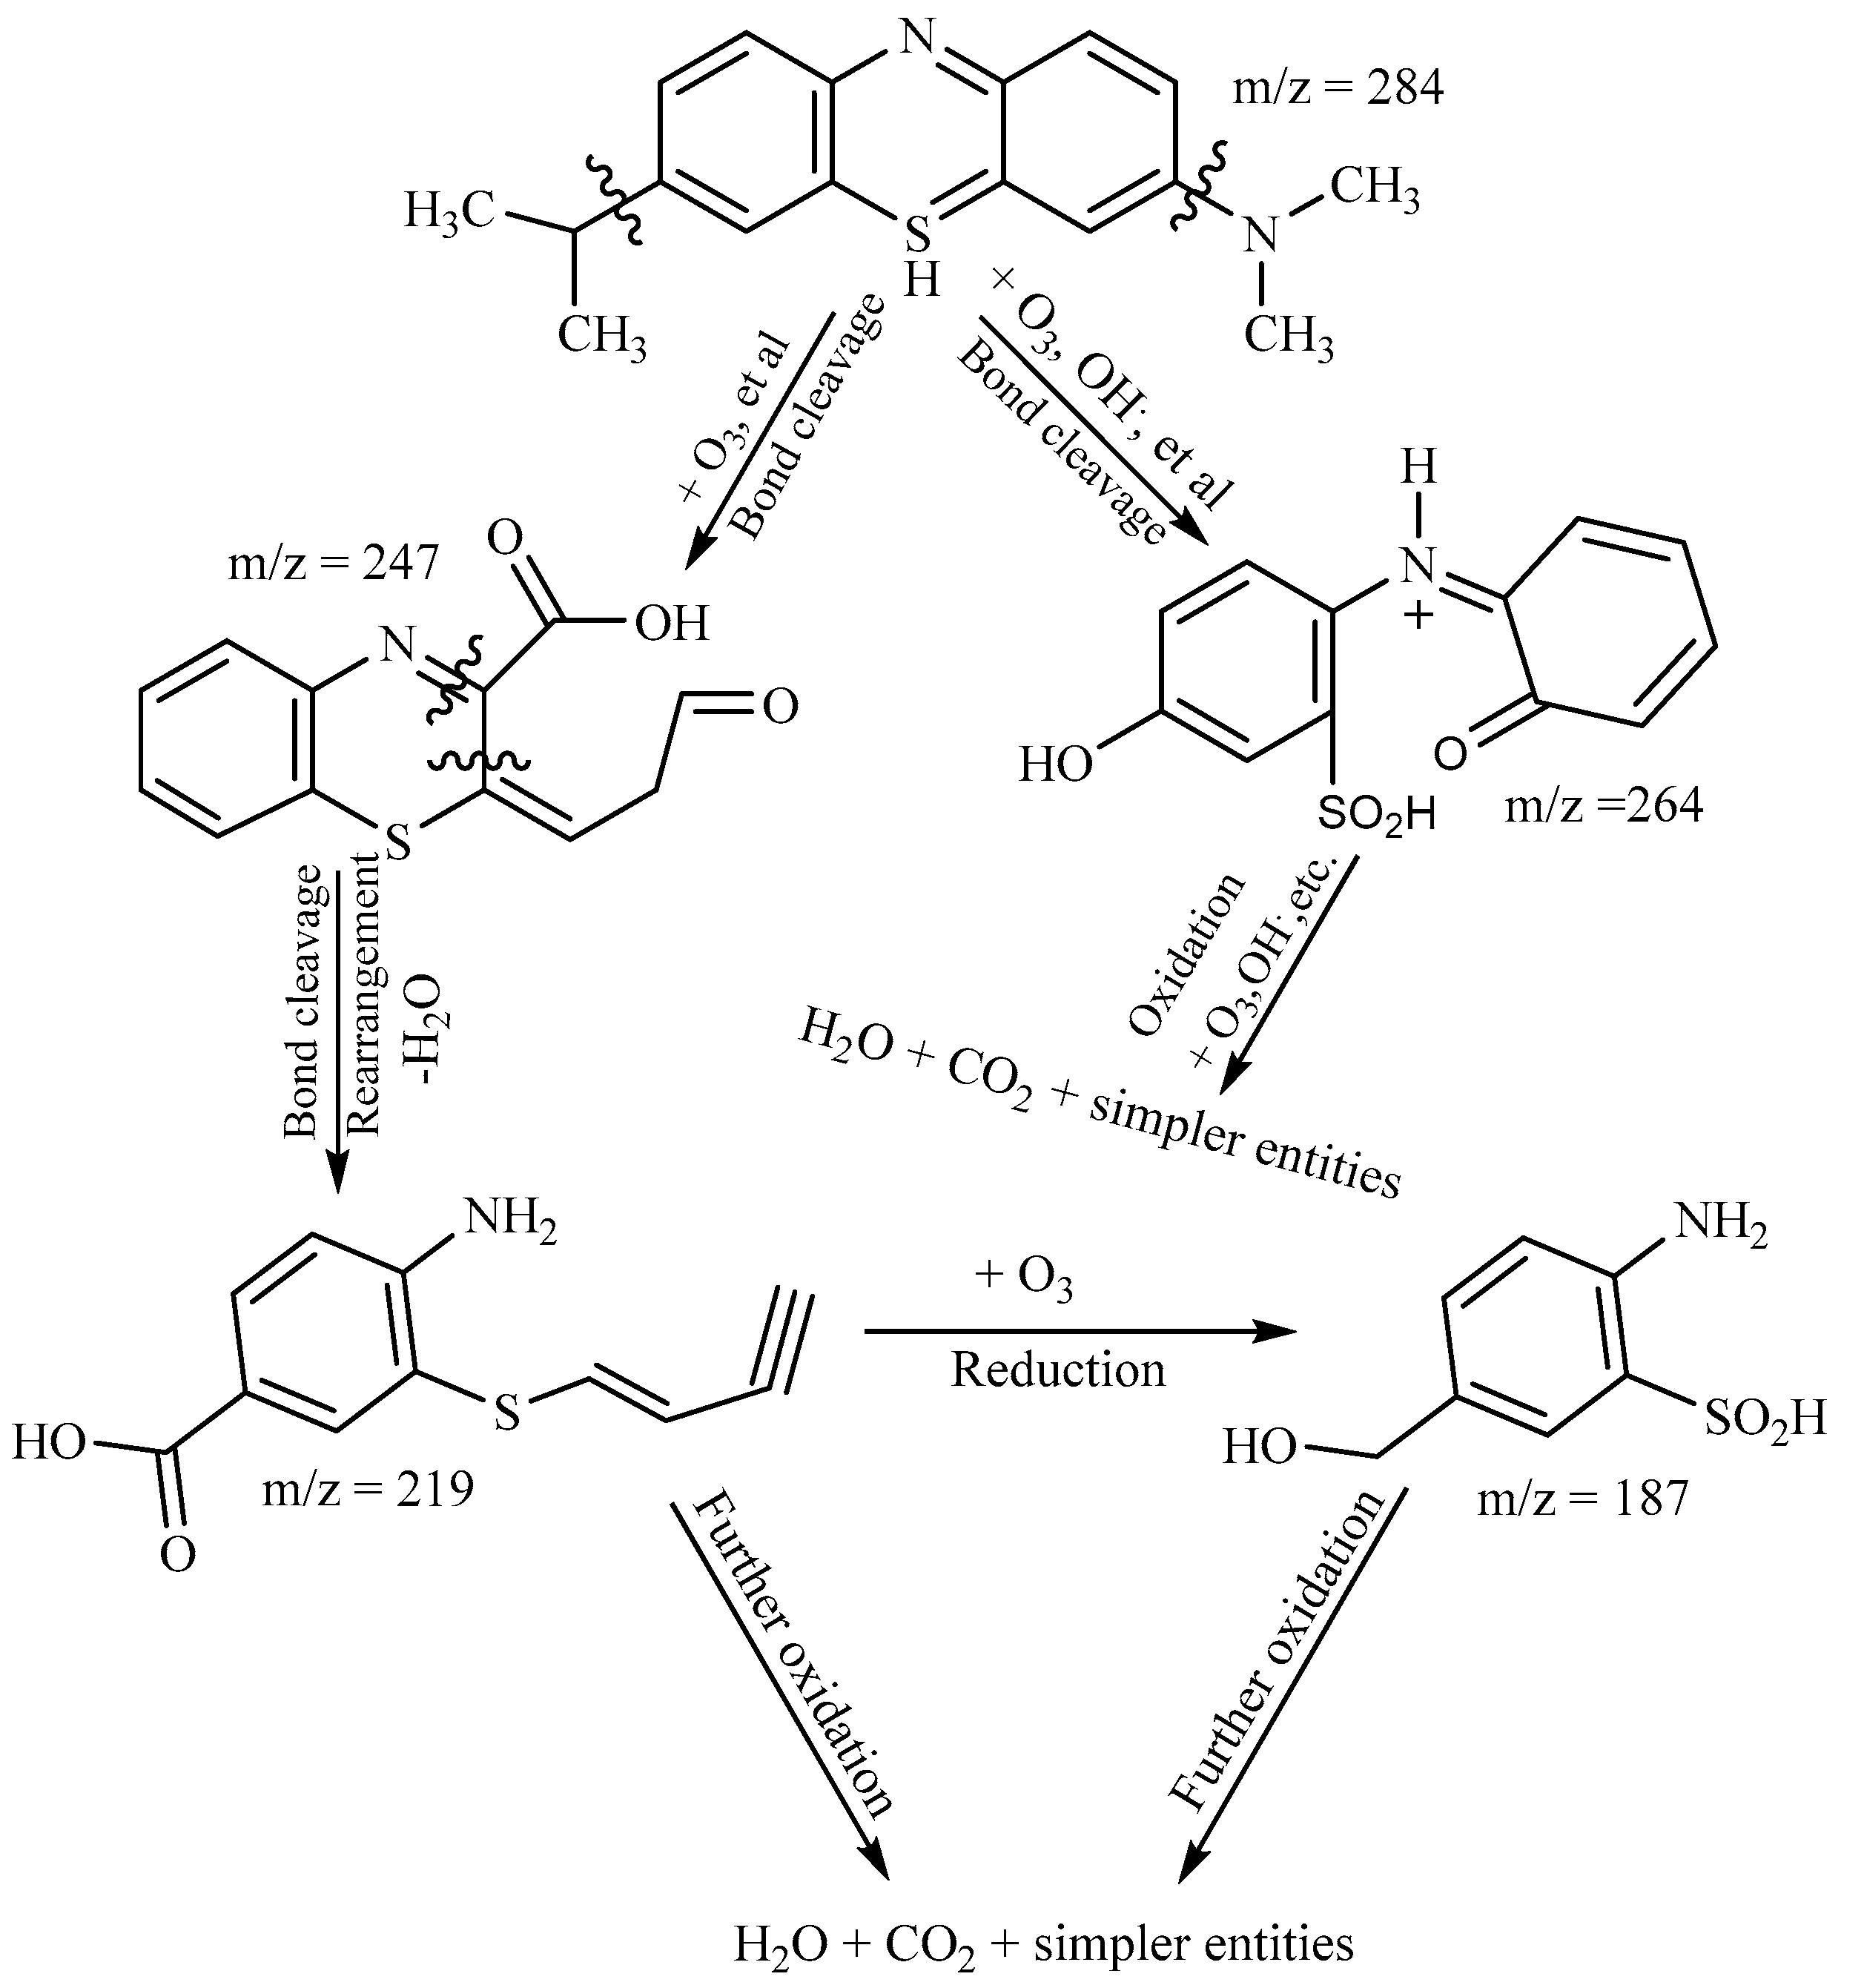
3.9.5. Liquid Chromatography/Mass Spectroscopy Analysis

The results of the liquid chromatography/mass spectroscopy (LC-MS) analysis of treated MB solution after 60 min are presented in Table 1 In total, five prominent degradation intermediates including MB were identified after 20 min of plasma treatment. The parent molecule MB designated as compound I (Cp I) with the mass m/z = 284 was observed within a retention time of 4 min. The other four degradation byproducts denoted as Cp II, Cp III, Cp IV and Cp V with the corresponding mass of m/z = 247, 264, 219 and 187 were observed at retention times of 1.9, 5.40, 5.41 and 5.79 min respectively. The molecular and chemical structures of the identified byproducts are also presented in Table 1.
The degradation pathways of MB in the DBD system were proposed and are presented in Figure 11. It was observed that the oxidation of MB was induced by both O3 and H2O2/OH produced in the DBD reactor, and thus implied two distinctive pathways, and hence satisfied our previously made claims (1) and (2). In the first pathway, under acidic conditions, MB was attacked either by O3 or OH causing the ring opening and formation of a sulfonated metabolite with fragment pattern m/z = 264 (Cp II).
On the other hand, the degradation of MB (Cp I) by O3 caused bond cleavage and breakage resulting in the formation of compound III with m/z = 247. The oxidation of Cp III by O3 and co-oxidants enhanced the bond cleavage and molecular rearrangement with a corresponding loss of water giving rise to Cp IV and Cp V with fragmentation pattern m/z = 219 and 187, respectively. In total, the analysis of MB dye in the current DCDBD system performed at improved conditions showed that decolouration of MB occurred at a higher rate and its degradation was mainly induced by O3 and H2O2. Consequently, MB dye was degraded into four intermediate byproducts, including (E)-2-(3-oxopropylidene)-2H-benzo[b][1,4] thiazine-3-carboxylic acid, (Z)-6-hydroxy-2-(3-oxoprop-1-en-1-yl)-3-sulfinoquinolin-1-ium, (E)-4-amino-3-(but-1-en-3-yn-1-ylthio) benzoic acid, and 2-amino-5-(hydroxymethyl) benzenesulfinic acid, which were detected after 20 min of DBD run, and their complete degradation was reached after 60 min of DBD experiment.
These aromatic intermediates byproducts are different from those reported by Magureanu et al. [92] when MB dye was treated by corona discharge. This implies that, for the same targeted persistent pollutant, various intermediate byproducts could be obtained when using different plasma reactor configurations.

4. Discussion

The widespread use of DBD advanced oxidation processes in water and wastewater treatment has emerged in recent decades. Their efficiencies depend not only on the electrode configuration but also on the amount of free reactive species formed. The DCDBD plasma reactor designed in this study is a potential source of various ROS. Its effectiveness was determined by spectroscopic measurement of O3, H2O2, and OH by indigo, pertitanyl sulphate, and terephthalic acid methods, respectively. The impact of solution pH, scavengers, and the amount and type of chemical probes was investigated. The results demonstrate that O3, H2O2, and OH were abundantly produced in the DCDBD reactor and their production was significantly influenced by solution pH. That is, the high fluctuating increase of O3 concentration in the acid medium was certainly due to its stability mentioned by [17]. Hence its accumulation in acidic pH increased its concentration from 0.535 mol/L after 5 min of the DBD experiment to 0.783 and 0.79 mol/L after 45 and 60 min of DBD plasma exposure, respectively. A similar trend was already observed by [97] who, in their study, informed that O3 was significantly generated in acidic pH (5.6) after 350 min of storage, while H2O2 was highly produced in basic pH (pH 8), in agreement with Wang et al. [98] but using different DBD configurations. On the other hand, the decrease of O3 concentration in the DCDBD system could also be due to competitive reactions with NOx species formed in air plasma even though NOx species were not quantified in the current reactor but remains an important task for future investigations. Nguyen et al. [99] reported that the interaction of O3 and NOx (NO) results in its disintegration and hence diminished its concentration in the double planar DBD system used in their study, in conformity with the claims of Shen et al. [100].
As for H2O2, the decrease of its amount after 15 and 60 min of DBD run indicated its involvement in side reactions. This could be ascribed to its weak acid properties. Also, the decline of initial solution pH discussed in Section 3.6 favoured the production of ozone but resulted in the decline of H2O2 concentration and is in line with [98] who showed that the decrease of solution initial pH during air plasma run resulted in the decay of H2O2 concentration. Besides, H2O2 has been considered as the major source of OH as a consequence of its disintegration. It is certain that its conjugate base H2O might have captured free aqueous protons (H+) in the solution resulting in the back-formation of H2O2, which in turn contributed to the increase of its amount up to 0.933 M at basic pH 10.5 after 5 min of plasma run. Judée et al. [78] showed that quantification of H2O2 in a single planar DBD system by titanium oxy sulphate revealed a high concentration of H2O2 formed in tap water at a maximum of 1.85 mmol/L after 30 min of plasma run. Their results also showed that H2O2 concentration increased with an increase in treatment time. This corroborates the outcomes of Shen et al. [98] though using different DBD reactor geometries. Moreover, Wang et al. [99] reported that the formation of H2O2 in a planar double DBD is also improved by the disintegration reaction of O3 with H2O and recombination of OH. Furthermore, Bruno et al. [96] reported that H2O2 is usually the final product of various ROS, while NOx species are the resultant end products in plasma technologies. The authors highlighted three ways for the formation of H2O2, among which were photolysis and electron impact of H2O molecules. The disproportionation of OOH was favoured in acidic conditions (but minor as O2 is produced in the presence of O2 molecules). Even though H2O2 finds its wide application in medicine, mostly as a novel treatment approach to preventing the proliferation of cancer cells, it is believed that in the current DCDBD reactor, H2O2 was a potential source of OH via photolysis (by UV radiation) disintegration [78,97].
The interaction of UV light with chemical species generated in DBD plasma systems such as DCDBD reactor form chemical cocktails whose total determination of reaction mechanisms up to date remain a mystery in plasma science technologies [58]. Nevertheless, the formation of ROS in DCDBD systems is initiated by the breakdown of water (H2O) molecules by UV light or by highly energized electrons surrounding the first dielectric quartz tube. In this regard, the dissociation of H2O and H2O2 molecules by UV light produced in the DCDBD reactor certainly boosted the amount of OH radicals in the system. Moreover, the recombination processes of diverse radical intermediate species in the DCDBD reactor could have also enhanced the concentration of O3, H2O2 and OH during the 60 min of plasma run. On the other hand, the collision of H2O molecules with energized electrons in DBD systems leads to the formation of H2O2, OH, O3 and various other species depending on the feed gas used. This corroborates with Shen et al. [100], who showed that the reaction of highly energized electrons with H2O and O3 generate OH radicals. Subsequently, their study found that O3 is abundantly produced in an acidic environment and its reaction in basic milieu leads to the formation of OH and related species. This, therefore, justifies the 9.661 mg/L of OH radical recorded at pH 10.5 after 60 min of DBD run in Figure 4, which is comparable to the findings of [99]. This consequently demonstrates that DCDBD is a robust AOP that can be used for water and wastewater treatment.
Even though various techniques for the determination of OH radicals in different systems have been developed [101,102,103], the use of a chemical TA probe remains one of the most effective methods for approximation of OH radicals in aqueous media. From this point of view, the decrease of OH radicals noticed in the DCDBD reactor between 45 and 55 min of plasma run (Figure 4) was due to quenching phenomena either by nitrogen species or by interactions with other species [100]. During water and wastewater treatment by plasma systems, the initial pH of the solution decreases to acidic ranges [98]. Hence, buffer solutions are often used to stabilize and maintain pH to desired values. However, there are few to no scientific reports highlighting the impact of buffer addition on the amount of OH radical quantified in DBD configurations, although Fadda et al. [104] highlighted that the presence of phosphate species in solution diminishes the concentration of OH radicals. Therefore, the results discussed in Figure 6 sufficiently inform that those pH stabilizers such as buffers should carefully be chosen or avoided, as their addition in DBD reactors or other treatment systems could lessen the amount of OH measured and hence result in a lower effectiveness of the reactor. The results exhibited in Figure 7 demonstrate that the presence of scavengers in the DCDBD configuration significantly reduced the amount of OH radicals produced due to competitive reactions of carbonates with OH radicals. This, in turn, could impact the degradation of targeted contaminants. This trend is in line with [30], which reported that the quantity of OH radicals in the DBD system decayed with an increase of sodium carbonate concentration, in agreement with previous investigations [105,106,107,108]. Conversely, NaCl was found to be an OH precursor in the DCDBD reactor, though this observation was previously made by Pieczyńska et al. [109] and Lei et al. [110] using different AOPs than DBD processes. Besides, our findings also show that the amount of TA probe influences the concentration of OH captured in the DCDBD reactor. So the results plotted in Figure 8 suggest that, during the efficiency test of DBD geometries, the amount of probe relative to OH concentration should be optimized to achieve accurate monitoring of the system. The analysis and interpretation of results achieved in this study demonstrate that the DCDBD is a unique system producing UV light and large amounts of major oxidants, such as O3, H2O2, OH and related species without chemical additives. The decomposition of O3 and H2O2 largely contributed to the genesis of OH radicals whose increasing concentration was also associated with side reactions and likely parallel recombination of related species susceptible to be produced in the solution during DBD experiments. Even though higher amounts of O3, H2O2, and OH in parallel DBD configurations might have been reported, the 0.79 mg/L of O3, 0.933 M mg/L and 9.661 mg/L of OH achieved in the DCDBD reactor demonstrate its high performance compared to previous/other configurations. This is plausibly due to the fact that there is no chemical addition during DCDBD operation and the technology is feasible and affordable compared to precedent DBD geometries in which ROS measurement methods could be costly for researchers with limited analytical equipment.
The spectroscopic techniques used to measure the amount of O3, H2O2 and OH in the current study are straightforward and cost-effective compared to optical emission spectroscopy, molecular beam mass spectrometry, etc., previously reported/employed [111,112]. Therefore, our study offers faster and detailed ways for the detection and quantification of these major oxidants in DCDBD plasma configuration. Consequently, we demonstrate that indigo, titanyl sulphate and terephthalic acid methods using UV-vis and fluorescence spectroscopies are effective techniques for quick determination of the efficiency of DCDBD reactor and corresponding treatment systems by easy measurement of major ROS produced. Moreover, the determination of the oxidative power of O3, H2O2 and OH measured in the DCDBD reactor on the detoxification of simulated textile synthetic polluted wastewater shows that, within 12 min of plasma run, MB used as the model pollutant was destroyed into four degradation intermediates, which were further oxidized into dissolved CO2, H2O and simpler entities.
In terms of colourant compounds such as dyes, the two aspects involved during their removal include decolouration and degradation. Decolouration, often indicated by colour removal, refers to the destruction of chromophoric groups, such as azo, N-CH3, C=C, etc., from the chemical structure by reactive oxygen species, such as O3 or related oxidants. However, the general chemical framework could still be unbroken and might become either harmless or more carcinogenic than parent molecules depending on the treatment system. On the other hand, degradation entails that the carbonyl central system of the chemical is destroyed leading either to smaller entities or to bigger fragments (oligomers) that could be innocuous or toxic than starting compounds. Consequently, for both colour and colourless POPs, the degradation scenario is the ideal process targeted during detoxification of polluted water. So, to overcome the toxicity of byproducts for both types of compounds, further oxidation and mineralization of degradation intermediate byproducts to CO2, H2O and inoffensive end products are necessary. In this point of view, robust environmental treatment technologies should be able to meet these criteria. During degradation of POPs, the decomposition of targeted compound can follow different mechanisms whose effectiveness may depend on the behaviour of degradation byproducts. Hence, the UV-vis spectroscopy used to follow the decolouration of targeted/model compounds in most studies would not be enough to define their complete mineralization, but more sophisticated techniques such as HPLC-MS or LC-MS would be greatly required. Following these requirements, Figure 11 and Figure 12 demonstrated that MB dye was decolourized and degraded within 12 min of DBD run. Its degradation intermediates were completely oxidized to CO2, H2O and innocuous inorganic species. This therefore confirms the efficiency of DCDBD reactor evaluated in the current study.
The degradation mechanisms proposed in Figure 12 show that O3 and OH were responsible for the degradation of MB, while H2O2 was the major precursor of OH. Various studies on the degradation of MB using DBD configurations or other systems have been conducted [99,101,102,103,104,105,106,107,108,109,110,111,112,113,114,115,116,117,118]. However, it could be noticed that various chemicals were added in their protocols, and the total deactivation or degradation of MB in some of the reported studies was achieved after 30 min reaction time. Consequently, the actual DCDBD actuator is very effective for the treatment of water and textile wastewater. Perhaps, the next tasks of this project will be to use the DCDBD reactor for the treatment of real industrial wastewater, or the mixture of various model pollutants, taking into account factors such as total organic carbon (TOC), chemical oxygen demand (COD), biological oxygen demand (BOD), etc., characteristics of water quality. This study hence proved that DCDBD is an adequate advanced technology that generates a significant amount of ROS enough to combat MB dye, but that it could eliminate other types of pollutants in water and wastewater. Hence the current DCDBD technology can be used for potable water polishing or as an integrated method for post-treatment of industrial effluents.

5. Conclusions

The major reactive oxygen species O3, H2O2 and OH radicals were successfully quantified in the DCDBD reactor. The generation of each oxidant was found to be pH-dependent. Ozone was abundantly produced in acid pH and its concentration was lower in basic conditions due to side reactions. The concentration of H2O2 was highly detected in basic pH and its reduced amount in acidic pH was a result of side chemical interactions. The disintegration of both O3 and H2O2 contributed to the production of OH radicals. The concentration of OH in the DCDBD progressively increased with DBD run time in the absence of the buffer and declined when the buffer solution was added. The presence of a scavenger such as Na2CO3 significantly reduced the amount of OH radicals in the DCDBD configuration and could further impact on the decontamination of water pollutants. On the other hand the presence of salt such as NaCl in DCDBD reactor could enhance the concentration of OH radicals. Consequently, during quantification of ROS in DBD systems, the concentration of OH radical may depend on the amount of chemical probe used. The study proved that DCDBD technology is an effective AOP that produces various oxygen reactive species and hence can be used for the removal of persistent organic toxins from water and wastewater. The DCDBD reactor was successfully optimized. The study showed that the detoxification of MB textile simulated wastewater in DCDBD reactor depended on dye initial concentration, solution pH and applied peak voltage. The detoxification of MB simulated dye was mainly initiated by O3 and OH. The UV-vis analysis showed that complete degradation of MB occurred within 20 min of plasma exposure. About four MB transformation products were identified by LC-MS and their degradation mechanism pathways were successfully suggested. The outcomes of this study proved that double cylindrical DBD is an adequate technology that produces O3 and related species and can be used for the oxidation and mineralization of water and wastewater pollutants.

6. Novelty of the Study

Despite the various research reports on the application of nonthermal plasma for water and wastewater treatment published in the literature, this study proved that an optimized DCDBD configuration is an adequate and unique advance oxidation technology that generates in situ UV light and various reactive oxygen-based species (ROS), mainly O3, H2O2 and OH, that can successfully be quantified by indigo, pertitanyl sulphate and terephthalic acid spectroscopic techniques. Incorporation of sodium chloride (NaCl) in the DCDBD system shows that NaCl is predominantly an OH promotor. The study substantiates that for an effective technology, both decolouration and degradation processes should be achieved during purification of dye-polluted wastewater. This research further demonstrates for the first time that oxidation of MB in DCDBD is prompted by O3 and OH radical via bond cleavage, rearrangement and reduction mechanisms. The four MB resultant degradation intermediate byproducts and their total oxidation pathways have not been reported elsewhere. In contrast with the literature, this study shows that MB dye can be converted to different degradation intermediate byproducts when using various plasma systems. In this regard, the efficiency of a particular plasma configuration would depend not only on the amount of free radical produced but on their ability to oxidize the intermediate degradation byproducts to CO2, H2O and co-species, ideally in short time. Furthermore, we showed that to evidence the degradation of specific colouring pollutant such as dye in a typical treatment configuration (DCDBD), UV-vis spectroscopy should be supplemented by effective analysis such as liquid chromatography coupled with mass spectroscopy (LC-MS).

Author Contributions

E.S.M.M., J.O.T., M.M., O.O.F., C.P.E., C.T.O., and L.F.P. planned the research and developed the DCDBD reactor, K.L. and E.S.M.M. performed the quantification of free reactive oxygen species in the reactor; E.S.M.M., O.O.F., M.T.Z.M., H.H.K., J.A.-S., M.A.-A., S.D. and L.F.P. conducted the LC-MS analysis for the identification of MB degradation byproducts; E.S.M.M., L.F.P. examined the data and provided positive input in data interpretation and supervised the work. J.O.T., M.M., O.O.F., C.P.E., C.T.O., L.F.P., K.L., and E.S.M.M. wrote the first draft of the manuscript; the work was reviewed and approved by all authors before submission to the journal. All authors have read and agreed to the published version of the manuscript.

Funding

The authors are grateful for the financial support of a grant of Oman/RSA Cooperation Programme, project reference no.UID: 111007.

Acknowledgments

The authors also thank all Funders, Water Research commission SA, NRF South Africa through Core Project 18N/2019. All national and international co-authors are also acknowledged for their peer their contribution and peer review of this manuscript.

Conflicts of Interest

The authors declare no conflict of interest in publishing this manuscript.

References

  1. Weber, E.J.; Adams, R.L. Electrochemical monitoring of water remediation by metallic iron. Environ. Sci. Technol 1995, 29, 113. [Google Scholar]
  2. Mathur, N.; Bhatnagar, P. Mutagenicity assessment of textile dyes from Sanganer (Rajasthan). J.Environ. Biol. 2007, 28, 123–126. [Google Scholar] [PubMed]
  3. Wu, C.H.; Chern, J.M. Kinetics of photocatalytic decomposition of methylene blue. Ind. Eng. Chem. Res. 2006, 45, 6450–6457. [Google Scholar] [CrossRef]
  4. Rajeshwar, K.; Osugi, M.E.; Chanmanee, W.; Chenthamarakshan, C.R.; Zanoni, M.V.B.; Kajitvichyanukul, P.; Krishnan-Ayer, R. Heterogeneous photocatalytic treatment of organic dyes in air and aqueous media. J. Photochem. Photobiol. C Photochem. Rev. 2008, 9, 171–192. [Google Scholar] [CrossRef]
  5. Tan, B.H.; Teng, T.T.; Omar, A.K.M. Removal of dyes and industrial dye wastes by magnesium chloride. Water Res. 2000, 34, 597–601. [Google Scholar] [CrossRef]
  6. Chu, W. Dye removal from textile dye wastewater using recycled alum sludge. Water Res. 2001, 35, 3147–3152. [Google Scholar] [CrossRef]
  7. Koyuncu, I. Reactive dye removal in dye/salt mixtures by nanofiltration membranes containing vinylsulphone dyes: Effects of feed concentration and cross flow velocity. Desalination 2002, 143, 243–253. [Google Scholar] [CrossRef]
  8. El-Daly, H.A.; Habib, A.F.M.; El-Din, M.A.B. Kinetics and mechanism of the oxidative color removal from Durazol Blue 8 G with hydrogen peroxide. Dye. Pigment. 2003, 57, 197–210. [Google Scholar] [CrossRef]
  9. Ge, J.; Qu, J. Ultrasonic irradiation enhanced degradation of azo dye on MnO2. Appl. Catal. B Environ. 2004, 87, 252. [Google Scholar] [CrossRef]
  10. Malik, P.K. Dye removal from wastewater using activated carbon developed from sawdust: Adsorption equilibrium and kinetics. J. Hazard. Mater. 2004, 113, 81–88. [Google Scholar] [CrossRef]
  11. Kurbus, T.; Slokar, Y.M.; Le Marechal, A.M. The study of the effects of the variables on H2O2/UVdecoloration of vinylsulphone dye: Part II. Dye. Pigment. 2002, 54, 67–78. [Google Scholar] [CrossRef]
  12. Mok, Y.S.; Jo, J.O.; Whitehead, J.C. Degradation of an azo dye Orange II using a gas phase dielectric barrier discharge reactor submerged in water. Chem. Eng. J. 2008, 142, 56–64. [Google Scholar] [CrossRef]
  13. Magureanu, M.; Piroi, D.; Mandache, N.B.; David, V.; Medvedovici, A.; Parvulescu, V.I. Degradation of pharmaceutical compound pentoxifylline in water by non-thermal plasma treatment. Water Res. 2010, 44, 3445–3453. [Google Scholar] [CrossRef] [PubMed]
  14. Rong, S.; Sun, Y.; Zhao, Z.; Wang, H. Dielectric barrier discharge induced degradation of diclofenac in aqueous solution. Water Sci. Technol. 2014, 69, 76–83. [Google Scholar] [CrossRef] [PubMed]
  15. Liu, Y.; Sun, Y.; Hu, J.; He, J.; Mei, S.; Xue, G.; Ognier, S. Removal of iopromide from an aqueous solution using dielectric barrier discharge. J. Chem. Technol. Biotechnol. 2013, 88, 468–473. [Google Scholar] [CrossRef]
  16. Mouele, E.S.M.; Tijani, J.O.; Fatoba, O.O.; Petrik, L.F. Degradation of organic pollutants and microorganisms from wastewater using different dielectric barrier discharge configurations—A critical review. Environ. Sci. Pollut. Res. 2015, 22, 18345–18362. [Google Scholar] [CrossRef]
  17. Mouele, E.S.M.; Fatoba, O.O.; Babajide, O.; Badmus, K.O.; Petrik, L.F. Review of the methods for determination of reactive oxygen species and suggestion for their application in advanced oxidation induced by dielectric barrier discharges. Environ. Sci. Pollut. Res. 2018, 25, 9265–9282. [Google Scholar] [CrossRef]
  18. Nehra, V.; Kumar, A.; Dwivedi, H.K. Atmospheric Non-Thermal Plasma Sources. Int. J. Eng. 2008, 2, 53–68. [Google Scholar]
  19. Calderon, P.B.; Roberfroid, M.B. Free Radicals and Oxidation Phenomena in Biological Systems; CRC Press: New York, NY, USA, 1995. [Google Scholar]
  20. Sawyer, D.T.; Valentine, J.S. How super is superoxide? Acc. Chem. Res. 1981, 14, 393–400. [Google Scholar] [CrossRef]
  21. Sies, H.; Menck, C.F.M. Singlet oxygen induced DNA damage. Mutat. Res. 1992, 275, 367–375. [Google Scholar] [CrossRef]
  22. Rehman, A.U.; Cser, K.; Sass, L.; Vass, I. Characterization of singlet oxygen production and its involvement in photodamage of Photosystem II in the cyanobacterium Synechocystis PCC 6803 by histidine-mediated chemical trapping. Biochim. Biophys. Acta—Bioenerg 2013, 1827, 689–698. [Google Scholar] [CrossRef] [PubMed] [Green Version]
  23. Madhu, G.M.; Lourdu, M.A.; Raj, A.; Vasantha, K.; Pai, K. Titamium oxide (TiO2 ) assisted photocatalytic degradation of methylene blue. J. Environ. Biol. 2009, 30, 259–264. [Google Scholar] [PubMed]
  24. Joshi, K.M.; Shrivastava, V.S. Removal of methylene blue dye aqueous solution using photocatalysis. Int. J. Nano Dimens. 2011, 2, 241–252. [Google Scholar]
  25. Lee, H.; Park, S.H.; Kim, B.H.; Kim, S.J.; Kim, S.C.; Seo, S.G.; Jung, S.C. Contribution of Dissolved Oxygen to Methylene Blue Decomposition by Hybrid Advanced Oxidation Processes System. Int. J. Photoenergy 2012, 2012, 6. [Google Scholar] [CrossRef]
  26. Hameed, B.H.; Din, A.M.; Ahmad, A.L. Adsorption of methylene blue onto bamboo-based activated Carbon: Kinetics and equilibrium studies. J. Hazard. Mater. 2007, 141, 819–825. [Google Scholar] [CrossRef]
  27. Huang, Z.Y.; Chen, F.L.; Wang, H. Analysis of the degradation mechanism of methylene blue by atmospheric pressure dielectric barrier discharge plasma. Chem. Eng. J. 2010, 162, 250–256. [Google Scholar] [CrossRef]
  28. Magureanu, M.; Bradu, C.; Piroi, D.; Mandache, N.B.; Parvulescu, V. Pulsed corona discharge for degradation of methylene Blue in Water. Plasma Chem. Plasma Process. 2013, 33, 51–64. [Google Scholar] [CrossRef]
  29. Reddy, P.M.K.; Raju, B.R.; Karuppiah, J.; Reddy, E.L.; Subrahmanyam, C. Degradation and mineralization of methylene blue by dielectric barrier discharge non-thermal plasma reactor. Chem. Eng. J. 2013, 217, 41–47. [Google Scholar] [CrossRef]
  30. Tang, S.; Yuan, D.; Rao, Y.; Li, M.; Shi, G.; Gu, J.; Zhang, T. Percarbonate promoted antibiotic decomposition in dielectric barrier discharge plasma. J. Hazard. Mater. 2019, 366, 669–676. [Google Scholar] [CrossRef]
  31. Atkinson, R. Kinetics and mechanisms of the gas-phase reactions of the hydroxyl radical with organic compounds under atmospheric conditions. Chem. Rev. 1985, 85, 69–201. [Google Scholar] [CrossRef]
  32. Haugland, R.P. Handbook of Fluorescence Probes, 6th ed.; Molecular Probes: Eugene, OR, USA, 1996. [Google Scholar]
  33. Glaze, W.H. Reaction products of ozone: A review. Environ. Health Perspect. 1986, 69, 151–157. [Google Scholar] [CrossRef] [PubMed]
  34. Gurol, M.D.; Vatistas, R. Oxidation of phenolic compounds by ozone and ozone and u.v. radiation: A comparative study. Water Res. 1987, 21, 895–900. [Google Scholar] [CrossRef]
  35. Ullmann Encyclopedia of Industrial Chemistry, 5th ed.; Ozone; Verlag Chemie: Einheim, Germany, 1991; Volume A18, pp. 349–357. ISBN 3-527-20118-1.
  36. Kirk, D.F.; Othmer, R.E. Encyclopedia of Chemical Technology, 4th ed.; Ozone; Wiley-Interscience: London, UK, 1996; pp. 953–994. ISBN 0-471-52686-X. [Google Scholar]
  37. Tarr, M. Chemical Degradation Methods for Wastes and Pollutants; Marcel Dekker Inc.: New York, NY, USA, 2003. [Google Scholar]
  38. Gupta, S.B. Investigation of a Physical Disinfection Process Based on Pulsed Underwater Corona Discharges. Ph.D. Thesis, Forschungszentrum Karlshrue, Karlshrue, Germany, 2007. ISSN 0947-8620 urn: nbn: de:0005-073362. [Google Scholar]
  39. Tichonovas, M.; Krugly, E.; Racys, V.; Hippler, R.; Kauneliene, V.; Stasiulaitiene, I.; Martuzevicius, D. Degradation of various textile dyes as wastewater pollutants under dielectric barrier discharge plasma treatment. Chem. Eng. J. 2013, 229, 9–19. [Google Scholar] [CrossRef]
  40. Marotta, E.; Schiorlin, M.; Ren, X.; Rea, M.; Paradisi, C. Advanced oxidation process for degradation of aqueous phenol in a dielectric barrier discharge reactor. Plasma Process. Polym. 2011, 8, 867–875. [Google Scholar] [CrossRef]
  41. Selma, M. Chemical Processes in Aqueous Phase Pulsed Electrical Discharges: Fundamental Mechanisms and Applications to Organic Compound Degradation. Ph.D. Thesis, Florida State University Libraries, Electronic Theses, Treatises and Dissertations, the Graduate School, Florida State University, Tallahassee, FL, USA, 2007. [Google Scholar]
  42. Kanazawa, S.; Kawano, H.; Watanabe, S.; Furuki, T.; Akamine, S.; Ichiki, R.; Ohkubo, T.; Kocik, M.; Mizeraczyk, J. Observation of OH radicals produced by pulsed discharges on the surface of a liquid. Plasma Sources Sci. Technol. 2011, 20, 034010. [Google Scholar] [CrossRef]
  43. Badmus, K.O.; Tijani, J.O.; Eze, C.P.; Fatoba, O.O.; Petrik, L.F. Quantification of Radicals Generated in a Sonicator. Analytical and Bioanalytical Chemistry Research. 2016, 3, 139–147. [Google Scholar]
  44. Sahni, M.; Locke, B.R. Quantification of hydroxyl radicals produced in aqueous phase pulsed electrical discharge reactors. Ind. Eng. Chem. Res. 2006, 45, 5819–5825. [Google Scholar] [CrossRef]
  45. Lopez, J.L. Dielectric Barrier Discharge, Ozone Generation, and their Applications. In Complex Plasmas Summer Institute; Saint Peter’s College: Jersey City, NJ, USA, 2008. [Google Scholar]
  46. Magureanu, M.; Dobrin, D.; Mandache, N.B.; Bradu, C.; Medvedovici, A.; Parvulescu, V.I. The mechanism of plasma destruction of enalapril and related metabolites in water. Plasma Process. Polym. 2013, 2013, 459 –468. [Google Scholar] [CrossRef]
  47. Massima, M.E.S. Water Treatment using Electrohydraulic Discharge System. MSc Thesis, University of the Western Cape, Western Cape, South Africa, 2014. [Google Scholar]
  48. Burlica, R.; Kirkpatrick, M.J.; Finney, W.C.; Clark, R.J.; Locke, B.R. Organic dye removal from aqueous solution by glidarc discharges. J. Electrostat. 2004, 62, 309–321. [Google Scholar] [CrossRef]
  49. Zhang, Y.; Zhou, M.; Hao, X.; Lei, L. Degradation mechanisms of 4-chlorophenol in a novel gas–liquid hybrid discharge reactor by pulsed high voltage system with oxygen or nitrogen bubbling. Chemosphere 2007, 67, 702–711. [Google Scholar] [CrossRef]
  50. Zhang, D.; Zhang, H.; Zhang, Y. Decolorisation and mineralisation of CI Reactive Black 8 by the Fenton and ultrasound/ Fenton methods. Color Technol. 2007, 123, 101. [Google Scholar] [CrossRef]
  51. Dojčinović, B.P.; Roglić, G.M.; Obradović, B.M.; Kuraica, M.M.; Kostić, M.M.; Nešić, J.; Manojlović, D.D. Decolorization of reactive textile dyes using water falling film dielectric barrier discharge. J. Hazard. Mater. 2011, 192, 763–771. [Google Scholar] [CrossRef] [PubMed]
  52. Tijani, J.O.; Mouele, M.E.S.; Tottito, T.C.; Fatoba, O.O.; Petrik, L.F. Degradation of 2-Nitrophenol by Dielectric Barrier Discharge System: The Influence of Carbon Doped TiO2 Photocatalyst Supported on Stainless Steel Mesh. Plasma Chem. Plasma Process. 2017, 37, 1343–1373. [Google Scholar] [CrossRef]
  53. Kochany, J.; Lipczynska-Kochany, E. Application of the EPR spin-trapping technique for the investigation of the reactions of carbonate, bicarbonate, and phosphate anions with hydroxyl radicals generated by the photolysis of H2O2. Chemosphere 1992, 25, 1769–1782. [Google Scholar] [CrossRef]
  54. Beltrán, F.J.; Aguinaco, A.; García-Araya, J.F.; Oropesa, A. Ozone and photocatalytic processes to remove the antibiotic sulfamethoxazole from water. Water Res. 2008, 42, 3799–3808. [Google Scholar] [CrossRef]
  55. Joshi, A.A.; Locke, B.R.; Arce, P.; Finney, W.C. Formation of hydroxyl radicals, hydrogen peroxide and aqueous electrons by pulsed streamer corona discharge in aqueous solution. J. Hazard. Mater. 1995, 41, 3–30. [Google Scholar] [CrossRef]
  56. Wang, J.; Qian, Q.; Chen, Q.; Liu, X.; Luo, Y.; Xue, H.; Li, Z. Significant role of carbonate radicals in tetracycline hydrochloride degradation based on solar light-driven TiO2-seashell composites: Removal and transformation pathways. Chin. J. Catal. 2020, 41, 1511–1521. [Google Scholar] [CrossRef]
  57. Buxton, G.V.; Greenstock, C.L.; Helman, W.P.; Ross, A.B. Critical Review of rate constants for reactions of hydrated electrons, hydrogen atoms and hydroxyl radicals (⋅OH/⋅O−in Aqueous Solution. J. Phys. Chem. Ref. Data 1988, 17, 513–886. [Google Scholar] [CrossRef] [Green Version]
  58. Wahyudiono; Mano, K.; Hayashi, Y.; Yamada, M.; Takahashi, S.; Takada, N.; Kanda, H.; Goto, M. Atmospheric-pressure pulsed discharge plasma in capillary slug flow system for dye decomposition. Chem. Eng. Process.-Process Intensif. 2019, 135, 133–140. [Google Scholar] [CrossRef]
  59. Şahin, S.; Demir, S.; Güҫer, C. Simultaneous UV-vis spectrophotometric determination of disperse dyes in textile wastewater by partial least squares and principal component regression. Dye. Pigm. 2007, 73, 368. [Google Scholar] [CrossRef]
  60. Abdullah, M.; Low, G.K.C.; Matthews, R.W. Effects of common inorganic anions on rates of photocatalytic oxidation of organic carbon over illuminated titanium dioxide. J. Phys. Chem. 1990, 94, 6820–6825. [Google Scholar] [CrossRef]
  61. Staehelin, J.; Hoigné, J. Reaktionsmechanismus und Kinetik des Ozonzerfalls in Wasser in Gegenwart organischer Stoffe. Vom Wasser 1983, 61, 337–348. [Google Scholar]
  62. Hoigne, J. The Chemistry of Ozone in Water. In Process Technologies for Water Treatment; Stucki, S., Ed.; Plenum Publishing Corporation: New York, NY, USA, 1988. [Google Scholar]
  63. Tschirch, J.; Dillert, R.; Bahnemann, D.; Proft, B.; Biedermann, A.; Goer, B. Photodegradation of methylene blue in water, a standard method to determine the activity of photocatalytic coatings? Res. Chem. Intermed. 2008, 34, 381–392. [Google Scholar] [CrossRef]
  64. Liebert, M.A.; Lee, B.; Liaw, W.; Lou, J. Photocatalytic Decolorization of Méthylène Blue in Aqueous TiO2 Suspension. Environ. Eng. Sci. 1999, 16, 165–175. [Google Scholar]
  65. Qifu, L.; Guohua, N.; Yiman, J.; Zhaojun, W.; Song, J.; Kefu, L. Special type of plasma dielectric barrier discharge reactor for direct ozonization of water and degradation of organic pollution Degradation of Alizarin Red by Hybrid Gas-Liquid Dielectric Barrier Discharge Treatment of Wastewater with High Conductivity by Pulsed Discharge Plasma. J. Phys. D Appl. Phys. 2008, 41, 85207. [Google Scholar]
  66. Xie, Y.; Chen, F.; He, J.; Zhao, J.; Wang, H. Photoassisted degradation of dyes in the presence of Fe3+ and H 2O2 under visible irradiation. J. Photochem. Photobiol. A Chem. 2000, 136, 235–240. [Google Scholar] [CrossRef]
  67. Neppolian, B.; Choi, H.C.; Sakthivel, S.; Arabindoo, B.; Murugesan, V. Solar light induced and TiO2 assisted degradation of textile dye reactive blue 4. Chemosphere 2002, 46, 1173–1181. [Google Scholar] [CrossRef]
  68. Haarstrick, E.H.A.; Kut, O.M. TiO2-Assisted Degradation of Environmentally Relevant Organic Compounds in Wastewater Using a Novel Fluidized Bed Photoreactor. Environ. Sci. Technol. 1996, 30, 817–824. [Google Scholar] [CrossRef]
  69. Lv, K.; Yu, J.; Deng, K.; Li, X.; Li, M. Effect of phase structures on the formation rate of hydroxyl radicals on the surface of TiO2. J. Phys. Chem. Solids 2010, 71, 519–522. [Google Scholar] [CrossRef]
  70. Hirakawa, T.; Yawata, K.; Nosaka, Y. Photocatalytic reactivity for O2{radical dot}-and OH{radical dot} radical formation in anatase and rutile TiO2 suspension as the effect of H2O2 addition. Appl. Catal. A Gen. 2007, 18, 3247–3254. [Google Scholar] [CrossRef]
  71. Liu, J.; Lagger, G.; Tacchini, P.; Girault, H.H. Generation of OH radicals at palladium oxide nanoparticle modified electrodes, and scavenging by fluorescent probes and antioxidants. J. Electroanal. Chem. 2008, 619, 131–136. [Google Scholar] [CrossRef] [Green Version]
  72. Li, C.; Jiang, X.; Hou, X. Dielectric barrier discharge molecular emission spectrometer as gas chromatographic detector for amines. Microchem. J. 2015, 119, 108–113. [Google Scholar] [CrossRef]
  73. Nakabayashi, Y.; Nosaka, Y. The pH dependence of OH radical formation in photo-electrochemical water oxidation with rutile TiO2 single crystals. Phys. Chem. Chem. Phys. 2015, 17, 30570–30576. [Google Scholar] [CrossRef] [PubMed]
  74. Hayashi, H.; Akamine, S.; Ichiki, R.; Kanazawa, S. Comparison of OH Radical Concentration Generated by Underwater Discharge Using Two Methods. Int. J. Plasma Environ. Sci. Technol. 2016, 10, 24–28. [Google Scholar]
  75. Bianco, A.; Passananti, M.; Perroux, H.; Voyard, G.; Mouchel-Vallon, C.; Chaumerliac, N.; Mailhot, G.; Deguillaume, L.; Brigante, M. A better understanding of hydroxyl radical photochemical sources in cloud waters collected at the puy de Dôme station—Experimental versus modelled formation rates. Atmos. Chem. Phys. 2015, 15, 9191–9202. [Google Scholar] [CrossRef] [Green Version]
  76. Gonzalez, D.H.; Kuang, X.M.; Scott, J.A.; Rocha, G.O.; Paulson, S.E. Terephthalate Probe for Hydroxyl Radicals: Yield of 2-Hydroxyterephthalic Acid and Transition Metal Interference. Anal. Lett. 2018, 51, 2488–2497. [Google Scholar] [CrossRef]
  77. Lallement, A.; Vinatier, V.; Brigante, M.; Deguillaume, L.; Delort, A.M.; Mailhot, G. First evaluation of the effect of microorganisms on steady state hydroxyl radical concentrations in atmospheric waters. Chemosphere 2018, 212, 715–722. [Google Scholar] [CrossRef]
  78. Judée, F.; Simon, S.; Bailly, C.; Dufour, T. Plasma-activation of tap water Using DBD for agronomy applications: Identification and quantification of long lifetime chemical species and production/consumption mechanisms. Water Res. 2018, 133, 47–59. [Google Scholar] [CrossRef] [Green Version]
  79. Lide, D.R. Handbook of Chemistry and Physics, 79th ed.; Chemical Rubber Co.: Cleveland, OH, USA, ISBN Solubility Sel. Gases Water; 1999; Volume 8, pp. 8–86. [Google Scholar]
  80. Hoeben, W. Pulsed Corona-Iduced Degradation of Organic Materials in Water; Technische Universiteit Eindhoven: Eindhoven, The Netherlands, 2000. [Google Scholar]
  81. Jiang, B.; Zheng, J.; Qiu, S.; Wu, M.; Zhang, Q.; Yan, Z.; Xue, Q. Review on electrical discharge plasma technology for wastewater remediation. Chem. Eng. J. 2014, 236, 348–368. [Google Scholar] [CrossRef]
  82. Munter, R. Advanced oxidation processes –current status and prospects. Proc. Est. Acad. Sci. Chem. 2001, 50, 59–80. [Google Scholar]
  83. Jo, J.-O.; Mok, Y.S. In-situ production of ozone and ultraviolet light using a barrier discharge reactor for wastewater treatment. J. Zhejiang Univ. Sci. A 2009, 10, 1359–1366. [Google Scholar] [CrossRef]
  84. Inanloo, K.; Naddafi, K.; Mesdaghinia, A.; Nasseri, S.; Nodehi, R.N.; Rahimi, A. Optimization Of Operational Parameters for Decolorization And Degradation Of C. I. Reactive Blue 29 By Ozone. J. Environ. Health Sci. Eng. 2011, 8, 227–234. [Google Scholar]
  85. Reddy, P.M.K.; Subrahmanyam, C. Green approach for wastewater treatment-degradation and mineralization of aqueous organic pollutants by discharge plasma. Ind. Eng. Chem. Res. 2012, 51, 11097–11103. [Google Scholar] [CrossRef]
  86. Sugiarto, A.T.; Ito, S.; Ohshima, T.; Sato, M.; Skalny, J.D. Oxidative decoloration of dyes by pulsed discharge plasma in water. J. Electrostat. 2003, 58, 135–145. [Google Scholar] [CrossRef]
  87. Ince, N.H.; Tezcanli, G. Treatability of textile dye-bath effluents by advanced oxidation: Preparation for reuse. Water Sci. Technol. 1999, 40, 183. [Google Scholar] [CrossRef]
  88. Thagard, S.M.; Takashima, K.; Mizuno, A. Chemistry of the positive and negative electrical discharges formed in liquid water and above a gas-liquid surface. Plasma Chem. Plasma Process. 2009, 29, 455. [Google Scholar] [CrossRef]
  89. Lu, F.K.; Emanuel, G.; Panicker, P.K.; Satyanand, U.S.; Emanuel, G.; Svihel, B.T. Development of Corona Discharge Apparatus for Supersonic Flow Millimeter-scaled boats and flotillas View project Blast wave attenuation View project Development of Corona Discharge Apparatus for Supersonic Flow. AIAA Pap. 2003, 6925, 2003. [Google Scholar]
  90. Wang, C.; Yao, J. Decolorization of methylene blue with TiO2 sol via UV irradiation photocatalytic degradation. Int. J. Photoenergy 2010, 2010, 643182. [Google Scholar]
  91. Akishev, Y.; Trushkin, N.; Grushin, M.; Petryakov, A.; Karal’nik, V.; Kobzev, E.; Kholodenko, V.; Chugunov, V.; Kireev, G.; Rakitsky, Y.; et al. Inactivation of Microorganisms in Model Biofilms by an Atmospheric Pressure Pulsed Non-thermal Plasma. In Plasma for Bio-Decontamination, Medicine and Food Security; Machala, Z., Hensel, K., Akishev, Y., Eds.; NATO Science for Peace and Security Series A: Chemistry and Biology; Springer: Dordrecht, The Netherlands, 2012; ISBN 978-94-007-2851-6. [Google Scholar] [CrossRef]
  92. Magureanu, M.; Mandache, N.B.; Parvulescu, V.I. Degradation of organic dyes in water by electrical discharges. Plasma Chem. Plasma Process. 2007, 27, 589–598. [Google Scholar] [CrossRef]
  93. Magureanu, M.; Piroi, D.; Mandache, N.B.; Parvulescu, V. Decomposition of methylene blue in water using a dielectric barrier discharge: Optimization of the operating parameters. J. Appl. Phys. 2008, 104, 103306. [Google Scholar] [CrossRef]
  94. Wang, J.; Sun, Y.; Jiang, H.; Feng, J. Removal of caffeine from water by combining dielectric barrier discharge (DBD) plasma with goethite. J. Saudi Chem. Soc. 2017, 21, 545–557. [Google Scholar] [CrossRef] [Green Version]
  95. Bruno, G.; Heusler, T.; Lackmann, J.W.; von Woedtke, T.; Weltmann, K.D.; Wende, K. Cold physical plasma-induced oxidation of cysteine yields reactive sulfur species (RSS). Clin. Plasma Med. 2019, 14, 100083. [Google Scholar] [CrossRef]
  96. Patange, A.; Boehm, D.; Giltrap, M.; Lu, P.; Cullen, P.J.; Bourke, P. Assessment of the disinfection capacity and eco-toxicological impact of atmospheric cold plasma for treatment of food industry effluents. Sci. Total Environ. 2018, 631, 298–307. [Google Scholar] [CrossRef] [PubMed]
  97. Shen, J.; Zhang, H.; Xu, Z.; Zhang, Z.; Cheng, C.; Ni, G.; Lan, Y.; Meng, Y.; Xia, W.; Chu, P.K. Preferential production of reactive species and bactericidal efficacy of gas-liquid plasma discharge. Chem. Eng. J. 2019, 362, 402–412. [Google Scholar] [CrossRef]
  98. Wang, B.; Dong, B.; Xu, M.; Chi, C.; Wang, C. Degradation of methylene blue using double-chamber dielectric barrier discharge reactor under different carrier gases. Chem. Eng. Sci. 2017, 168, 90–100. [Google Scholar] [CrossRef]
  99. Nguyen, D.B.; Trinh, Q.H.; Hossain, M.M.; Lee, W.G.; Mok, Y.S. Enhancement of plasma-assisted catalytic CO2 reforming of CH4 to syngas by avoiding outside air discharges from ground electrode. Int. J. Hydrog. Energy 2019. [Google Scholar] [CrossRef]
  100. Chen, Q.; Liu, Q.; Ozkan, A.; Chattopadhyay, B.; Wallaert, G.; Baert, K.; Terryn, H.; Delplancke-Ogletree, M.P.; Geerts, Y.; Reniers, F. Atmospheric pressure dielectric barrier discharge synthesis of morphology-controllable TiO2 films with enhanced photocatalytic activity. Thin Solid Film. 2018, 664, 90–99. [Google Scholar] [CrossRef]
  101. Ramli, N.A.H.; Zaaba, S.K.; Mustaffa, M.T.; Zakaria, A.; Shahriman, A.B. Review on the development of plasma discharge in liquid solution. In AIP Conference Proceedings; AIP Publishing LLC: Melville, NY, USA, 2017; Volume 1824. [Google Scholar]
  102. Permata, Y.E.; Cahyani, R.A.; Karamah, E.F.; Bismo, S. Characteristic of phenol and 2,4-dichlorophenol synthetic wastewater degradation in a DBD (dielectric barrier discharge) reactor. J. Phys. Conf. Ser. 2019, 1349, 012073. [Google Scholar] [CrossRef]
  103. Suzuki, K.; Endo, T.; Fukushima, T.; Sato, A.; Suzuki, T.; Nakayama, T.; Suematsu, H.; Niihara, K. Controlling Oxygen Content by Varying Oxygen Partial Pressure in Chromium Oxynitride Thin Films Prepared by Pulsed Laser Deposition. Mater. Trans. 2013, 54, 1140–1144. [Google Scholar] [CrossRef] [Green Version]
  104. Fadda, A.; Barberis, A.; Sanna, D. Influence of pH, buffers and role of quinolinic acid, a novel iron chelating agent, in the determination of hydroxyl radical scavenging activity of plant extracts by Electron Paramagnetic Resonance (EPR). Food Chem. 2018, 240, 174–182. [Google Scholar] [CrossRef]
  105. Brandt, S.; Schütz, A.; Klute, F.D.; Kratzer, J.; Franzke, J. Dielectric barrier discharges applied for optical spectrometry. Spectrochim. Acta-Part B At. Spectrosc. 2016, 123, 6–32. [Google Scholar] [CrossRef]
  106. Brandt, S.; Klute, F.D.; Schütz, A.; Franzke, J. Dielectric barrier discharges applied for soft ionization and their mechanism. Anal. Chim. Acta 2017, 951, 16–31. [Google Scholar] [CrossRef] [PubMed]
  107. Huang, W.; Bianco, A.; Brigante, M.; Mailhot, G. UVA-UVB activation of hydrogen peroxide and persulfate for advanced oxidation processes: Efficiency, mechanism and effect of various water constituents. J. Hazard. Mater. 2018, 347, 279–287. [Google Scholar] [CrossRef] [PubMed]
  108. Merouani, S.; Hamdaoui, O.; Saoudi, F.; Chiha, M.; Pétrier, C. Influence of bicarbonate and carbonate ions on sonochemical degradation of Rhodamine B in aqueous phase. J. Hazard. Mater. 2010, 175, 593–599. [Google Scholar] [CrossRef] [PubMed]
  109. Pieczyńska, A.; Ossowski, T.; Bogdanowicz, R.; Siedlecka, E. Electrochemical degradation of textile dyes in a flow reactor: Effect of operating conditions and dyes chemical structure. Int. J. Environ. Sci. Technol. 2019, 16, 929–942. [Google Scholar] [CrossRef]
  110. Lei, Y.; Lu, J.; Zhu, M.; Xie, J.; Peng, S.; Zhu, C. Radical chemistry of diethyl phthalate oxidation via UV/peroxymonosulfate process: Roles of primary and secondary radicals. Chem. Eng. J. 2020, 379, 122339. [Google Scholar] [CrossRef]
  111. Damodar, R.A.; You, S.J.; Chou, H.H. Study the self cleaning, antibacterial and photocatalytic properties of TiO2 entrapped PVDF membranes. J. Hazard. Mater. 2009, 172, 1321–1328. [Google Scholar] [CrossRef]
  112. Zhang, R.; Liao, H.; Yang, J.; Fan, X.; Yang, B. A molecular beam mass spectrometric investigation of plasma assisted oxidation and pyrolysis of methane. Proc. Combust. Inst. 2019, 37, 5577–5586. [Google Scholar] [CrossRef]
  113. Turhan, Z.T.K.; Durukan, I.; Ozturkcan, S.A. Decolorization of textile basic dye in aqueous solution by ozone. Dye. Pigment. 2012, 92, 897–901. [Google Scholar] [CrossRef]
  114. Aziz, K.H.H.; Mahyar, A.; Miessner, H.; Mueller, S.; Kalass, D.; Moeller, D.; Khorshid, I.; Rashid, M.A.M. Application of a planar falling film reactor for decomposition and mineralization of methylene blue in the aqueous media via ozonation, Fenton, photocatalysis and non-thermal plasma: A comparative study. Process Saf. Environ. Prot. 2018, 113, 319–329. [Google Scholar] [CrossRef]
  115. Benzaouak, A.; Ellouzi, I.; Ouanji, F.; Touach, N.; Kacimi, M.; Ziyad, M.; El Mahi, M.; Lotfi, E.M. Photocatalytic degradation of Methylene Blue (MB) dye in aqueous solution by ferroelectric Li1-xTa1-xWxO3 materials. Colloids Surf. A Phys. Eng. Asp. 2018, 553, 586–592. [Google Scholar] [CrossRef]
  116. Son, G.; Kim, D.H.; Lee, J.S.; Kim, H.I.; Lee, C.; Kim, S.R.; Lee, H. Synchronized methylene blue removal using Fenton-like reaction induced by phosphorous oxoanion and submerged plasma irradiation process. J. Environ. Manag. 2018, 206, 77–84. [Google Scholar] [CrossRef] [PubMed]
  117. Lu, P.; Kim, D.W.; Park, D.W. Silver nanoparticle-loaded filter paper: Innovative assembly method by nonthermal plasma and facile application for the reduction of methylene blue. Surf. Coat. Technol. 2019, 366, 7–14. [Google Scholar] [CrossRef]
  118. Iervolino, G.; Vaiano, V.; Palma, V. Enhanced removal of water pollutants by dielectric barrier discharge non-thermal plasma reactor. Sep. Purif. Technol. 2019, 215, 155–162. [Google Scholar] [CrossRef]
Figure 1. Double cylindrical dielectric barrier discharge (DBD) plasma reactor set up. Fixed parameters: water volume, 1500 mL; initial pH, 5.49; peak voltage, 6.8 kV; power, 60 W; trip current, 10 A; set current, 60 mA; frequency, 1000 Hz; air flow rate, 3 L/min; solution volume, 1500 mL; 1.5 mm silver electrode; 50 g/L NaCl electrolyte; treatment time, 60 min; sampling every 5 min.
Plasma 03 00007 g001
Figure 2. Effect of pH on ozone generation in DBD reactor (n = 2) at the following experimental conditions. Fixed parameters: peak voltage, 6 kV; air flow rate, 3 L/min; solution volume, 1500 mL; 1.5 mm silver electrode; 50 g/L NaCl electrolyte; treatment time, 60 min; sampling every 5 min. Varied parameter: pH of 2.5, 6.5, 8.5 and 10.5.
Plasma 03 00007 g002
Figure 3. Effect of initial solution pH on hydrogen peroxide concentration in the DBD reactor (n = 2). Experimental conditions: peak voltage, 6 kV; air flow rate, 3 L/min; solution volume, 1500 mL; 1.5 mm silver electrode; 50 g/L NaCl electrolyte; treatment time, 60 min; sampling every 5 min. Varied parameter: distilled water pH of 2.5, 6.5, 8.5 and 10.5).
Plasma 03 00007 g003
Figure 4. Impact of solution pH on OH production in the DCDBD reactor without buffer (n = 2) at the following experimental conditions: peak voltage, 6 kV; air flow rate, 3 L/min; solution volume, 1500 mL; 1.5 mm silver electrode; 50 g/L NaCl electrolyte; treatment time, 60 min; sampling every 5 min. Varied parameter: distilled water pH of 2.5, 6.5, 8.5 and 10.5).
Plasma 03 00007 g004
Figure 5. pH trends during the production of OH in the DCDBD reactor (n = 2) at the following experimental conditions: Fixed parameters: peak voltage, 6 kV; air flow rate, 3 L/min; solution volume, 1500 mL; 1.5 mm silver electrode; 50 g/L NaCl electrolyte; treatment time, 60 min; sampling every 5 min; Varied parameter: distilled water pH of 2.5, 6.5, 8. 5 and 10.5).
Plasma 03 00007 g005
Figure 6. Impact of initial solution pH with phosphate buffer on OH production in the DBD reactor (n = 2) at the following experimental conditions: peak voltage, 6 kV; air flow rate, 3 L/min; solution volume, 1500 mL; 1.5 mm silver electrode; 50 g/L NaCl electrolyte; treatment time, 60 min; sampling every 5 min. Varied parameter: distilled water pH of 2.5, 6.5, 8.5 and 10.5.
Plasma 03 00007 g006
Figure 7. Impact of sodium carbonate (Na2CO3) scavenger concentration on the production of OH in DBD reactor in the absence of phosphate buffer (n = 2) at the following experimental conditions: peak voltage, 6 kV; air flow rate, 3 L/min; solution volume, 1500 mL; 1.5 mm silver electrode; 50 g/L NaCl electrolyte; treatment time, 60 min; sampling every 5 min. Varied parameter: Na2CO3 mass of 1.59, 3.18 g and 6.36 g; fixed parameters were calculated according to Appendix 1 and were dissolved in 1.5 L of 2 mM terephthalic acid (TA)solution.
Plasma 03 00007 g007
Figure 8. Impact of NaCl scavenger concentration on OH production in the DBD reactor without sulphate buffer (n = 2) at the following experimental conditions: peak voltage, 6 kV; solution pH, 2.5; air flow rate, 3 L/min; solution volume, 1500 mL; 1.5 mm silver electrode; 50 g/L NaCl electrolyte; treatment time, 60 min; sampling every 5 min. Varied parameter: NaCl probe concentration of 0.01, 0.02, or 0.04 M.
Plasma 03 00007 g008
Figure 9. Impact of TA generation on OH production in distilled water in the DCDBD reactor (n = 2) at the following experimental conditions. Varied parameter: TA molarity (0.01, 0.02 and 0.04 M). Fixed parameters: peak voltage, 6 kV; air flow rate, 3 L/min; solution volume, 1500 mL; 1.5 mm silver electrode; 50 g/L NaCl electrolyte; treatment time, 60 min; sampling every 5 min).
Plasma 03 00007 g009
Figure 10. Effect of working parameters of initial concentration (20, 40 and 100 mg/L) (a), solution pH (2.5, 6.5 and 10.25) (b) and peak voltage (6, 8 and 10 kV) (c) on the decolouration of methylene blue MB at the applied conditions (air flow rate, 3 L/min; solution volume, 1500 mL; 1.5 mm silver electrode; 50 g/L NaCl electrolyte; treatment time, 60 min; sampling every 5 min).
Plasma 03 00007 g010
Figure 11. Ultraviolet-visible spectra of MB samples extracted within 12 min reaction time of DBD experiment at the following conditions: peak voltage, 8 kV, 40 mg/L MB; pH 2.5; air gap, 0.2 cm; air flow rate, 3 L/min; MB volume, 1500 mL; 50 g/L NaCl electrolyte; 1.5 mm silver electrode; and treatment time of 60 min.
Plasma 03 00007 g011
Figure 12. Degradation mechanism pathway of methylene blue dye in DBD system. Experimental conditions: peak voltage, 8 kV; concentration of MB dye, 40 mg/L; pH 2.5; 1500 mL MB; air feed gas flow, 3 L/min; 1.5 mm silver electrode; 50 g/L NaCl electrolyte; air gap, 0.2 cm; treatment time of 60 min.
Plasma 03 00007 g012
Table 1. Degradation intermediate byproducts of methylene blue in dielectric barrier discharge at the following conditions: peak voltage, 8 kV; 40 mg/L MB dye; solution pH, 2.5; 1500 mL MB; 3 L/min air flow rate; electrode diameter, 1.5 mm; 50 g/L NaCl electrolyte; air gap, 0.2 cm; treatment time of 60 min.
CompoundMolecular StructureChemical StructureRetention Time (min)M/Z
7-isopropyl-N,N-dimethyl-5l4-phenothiazin-3-amine (I)C17H20N2S Plasma 03 00007 i0014.138284.4
(E)-2-(3-oxopropylidene)-2H-benzo[b][1,4]thiazine-3-carboxylic acid (II)C12H9NO3S Plasma 03 00007 i0021.922247.3
(Z)-6-hydroxy-2-(3-oxoprop-1-en-1-yl)-3-sulfinoquinolin-1-ium (III)C12H10NO4S+ Plasma 03 00007 i0035.406264.3
(E)-4-amino-3-(but-1-en-3-yn-1-ylthio)benzoic acid (IV)C11H9NO2S Plasma 03 00007 i0045.414219.3
2-amino-5-(hydroxymethyl)benzenesulfinic acid (V)C7H9NO3S Plasma 03 00007 i0055.790187.2

