
Effects of Non-Thermal Plasma on the Transition from Nano-Crystalline to Amorphous Structure in Water and Subsequent Effects on Viscosity
 , and
, and
Abstract
:
1. Introduction
2. Materials and Methods
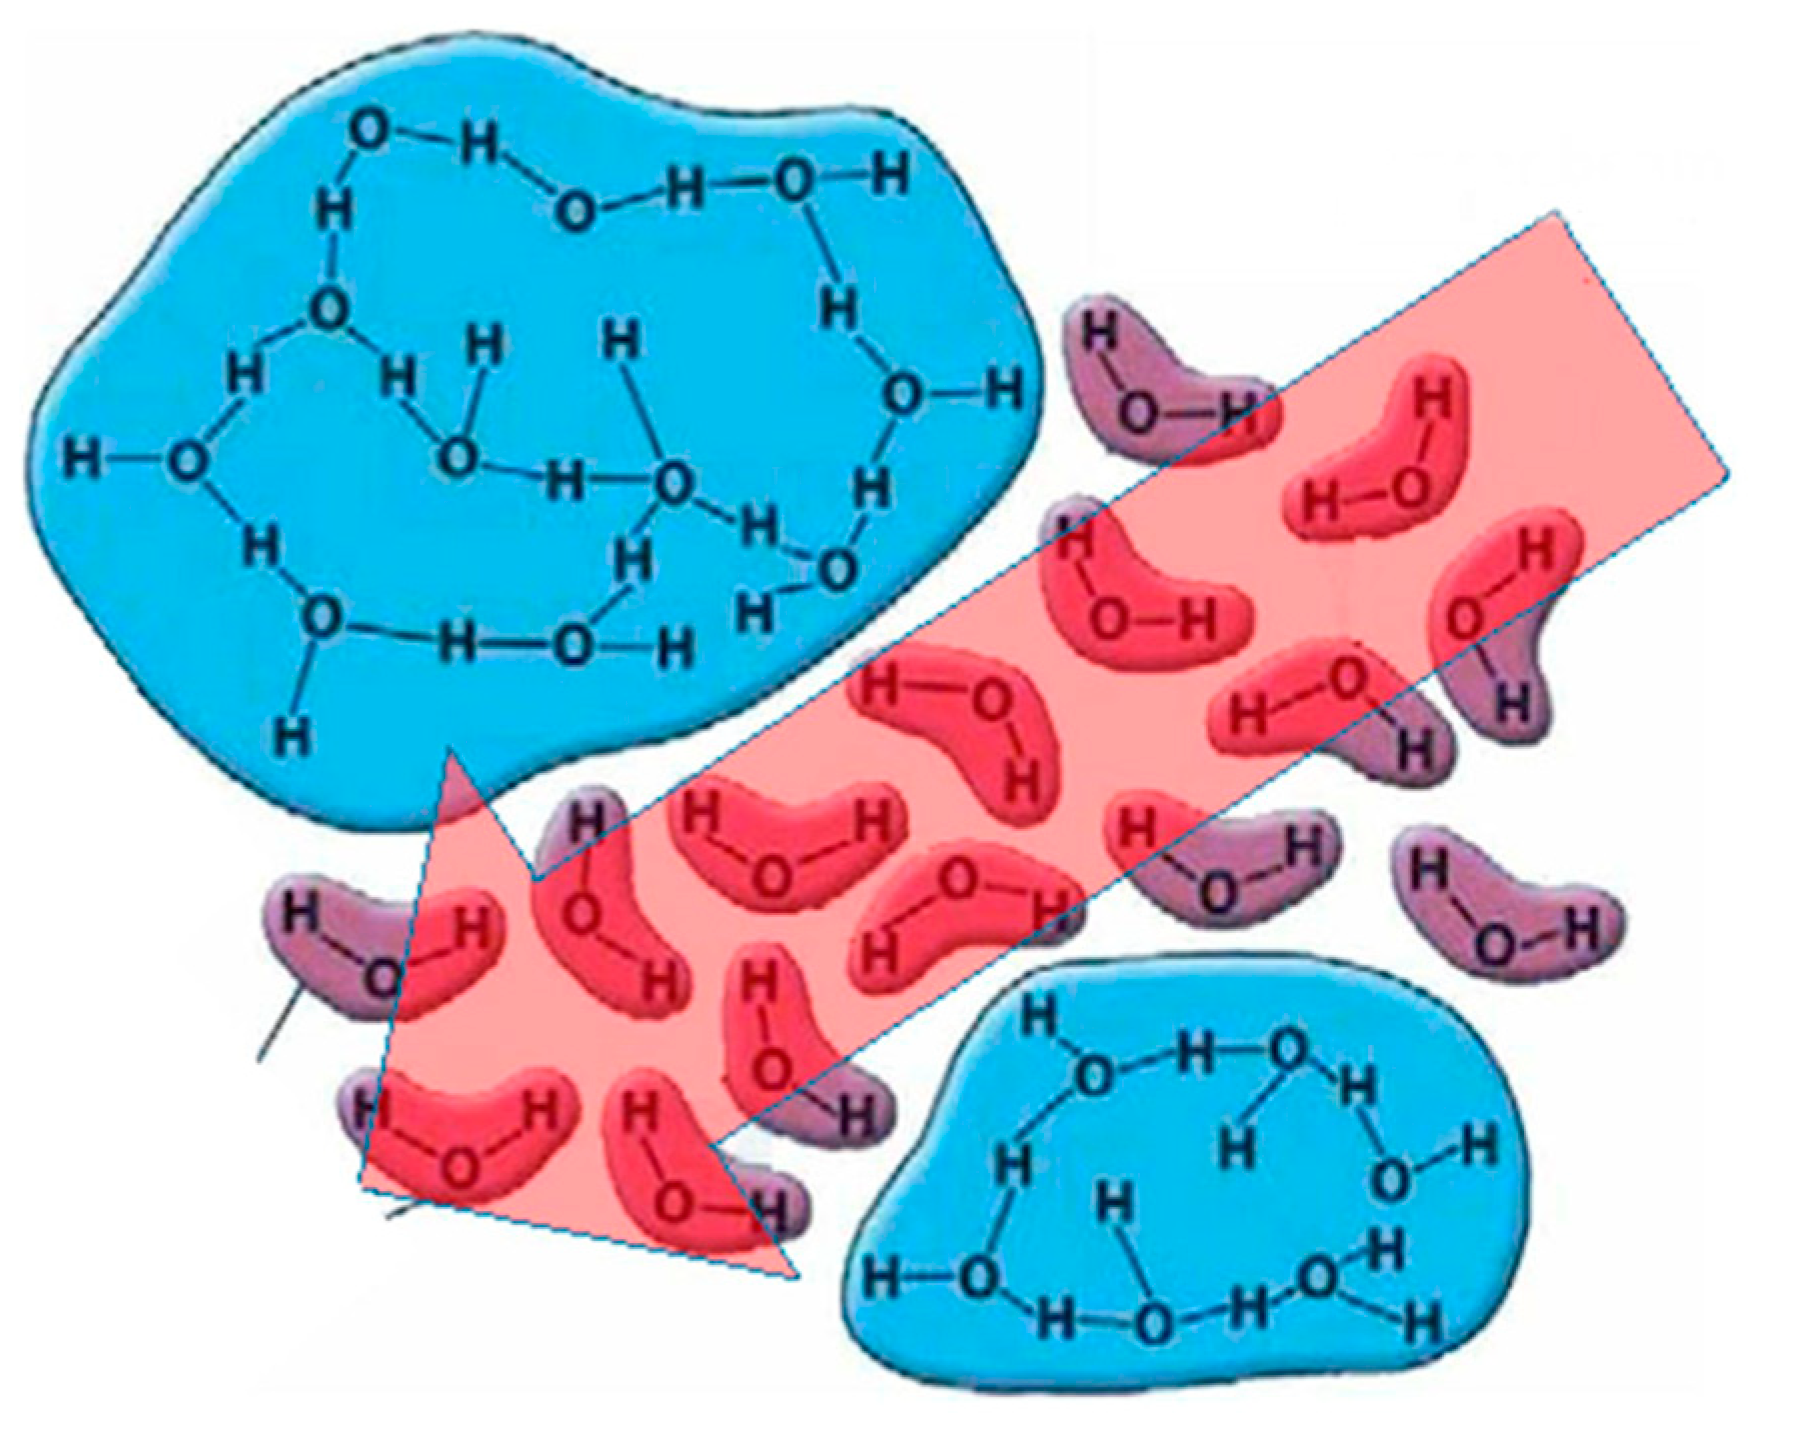
2.1. Two-State Model of Liquid Water and the Effects of Plasma Activation
2.2. Describing Pure Water with the Two-State Model
2.3. Describing PAW with the Two-State Model
3. Results and Discussion
4. Conclusions
- This study constructed a model that explains the following:
- ○
- How PAW induces the significant effects observed on physical properties, such as washing-out ability, surface tension, contact angle, and viscosity;
- ○
- Why PAW has the surprising effect of lowering the viscosity at lower temperatures;
- ○
- How the effects of PAW exceed the colligative effect for ideal solutions.
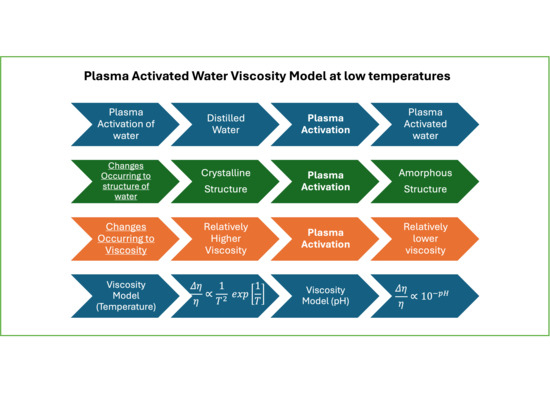
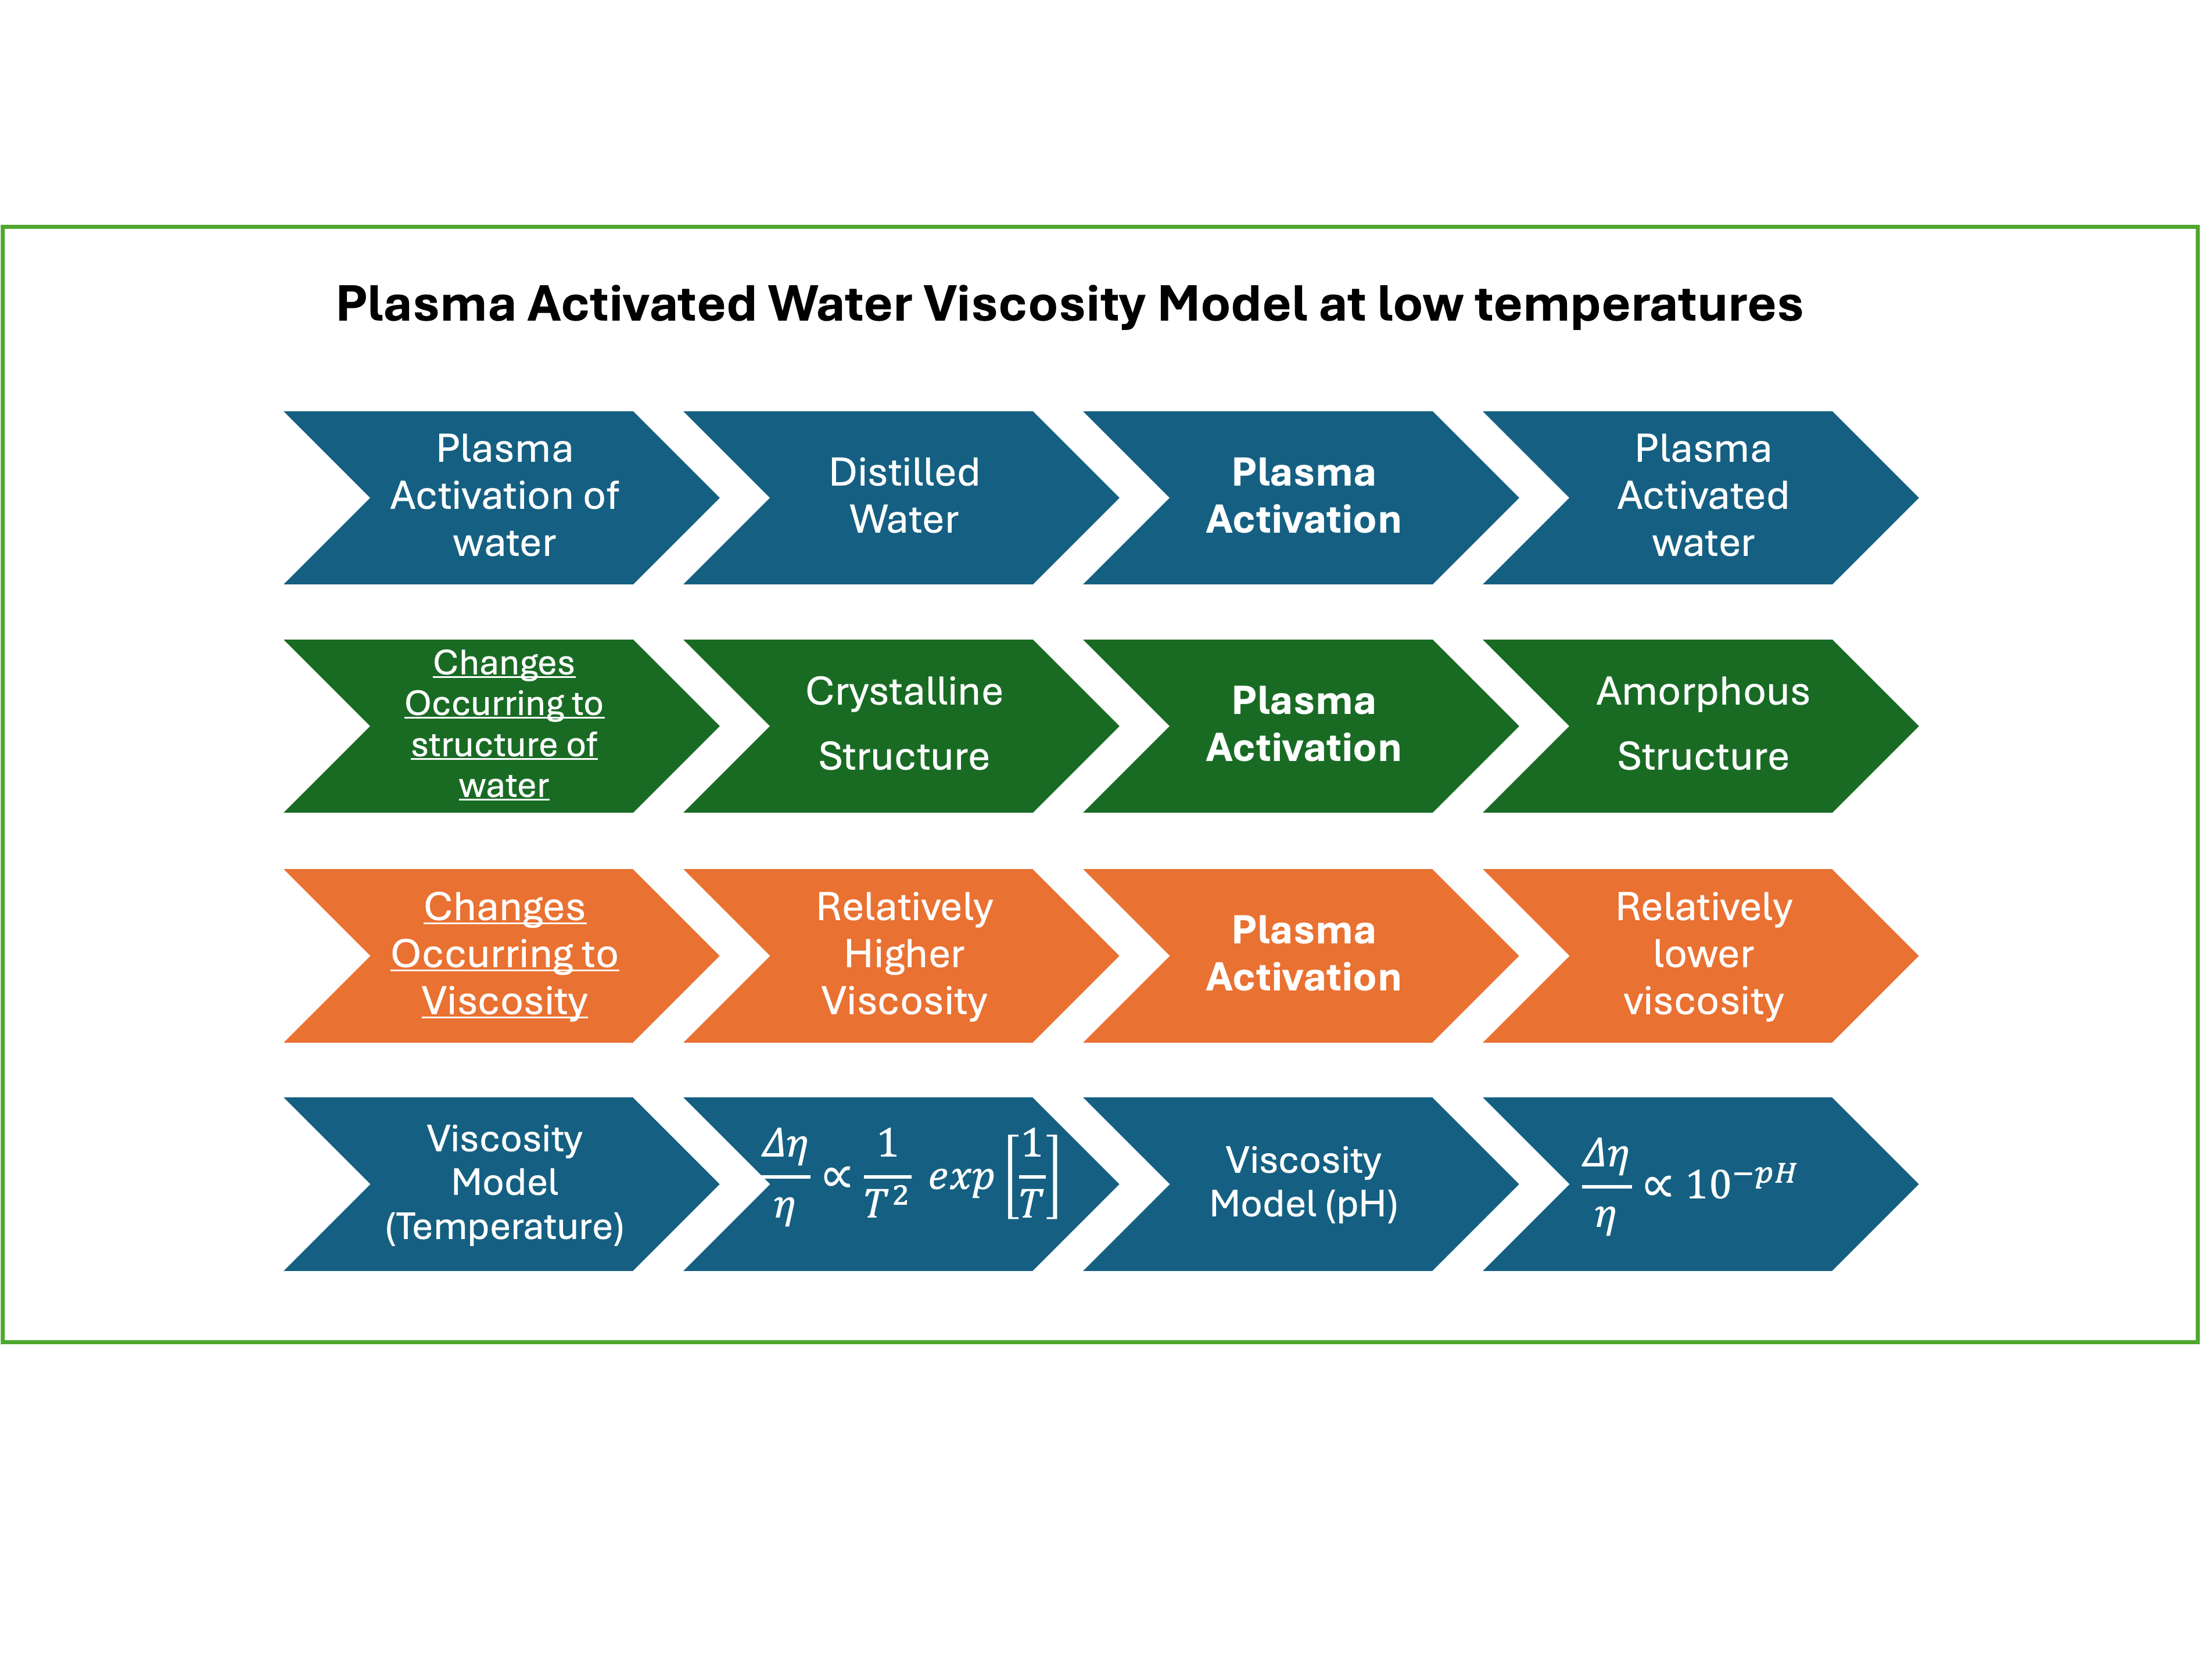
- A model for the proportion of nano-crystalline structures in PAW and a model for PAW viscosity were developed using the two-state model of water and the Debye–Huckel theory, along with the assumption that the effects of plasma-generated species are small enough to be approximated as linear.
- This viscosity model predicts the following:
- ○
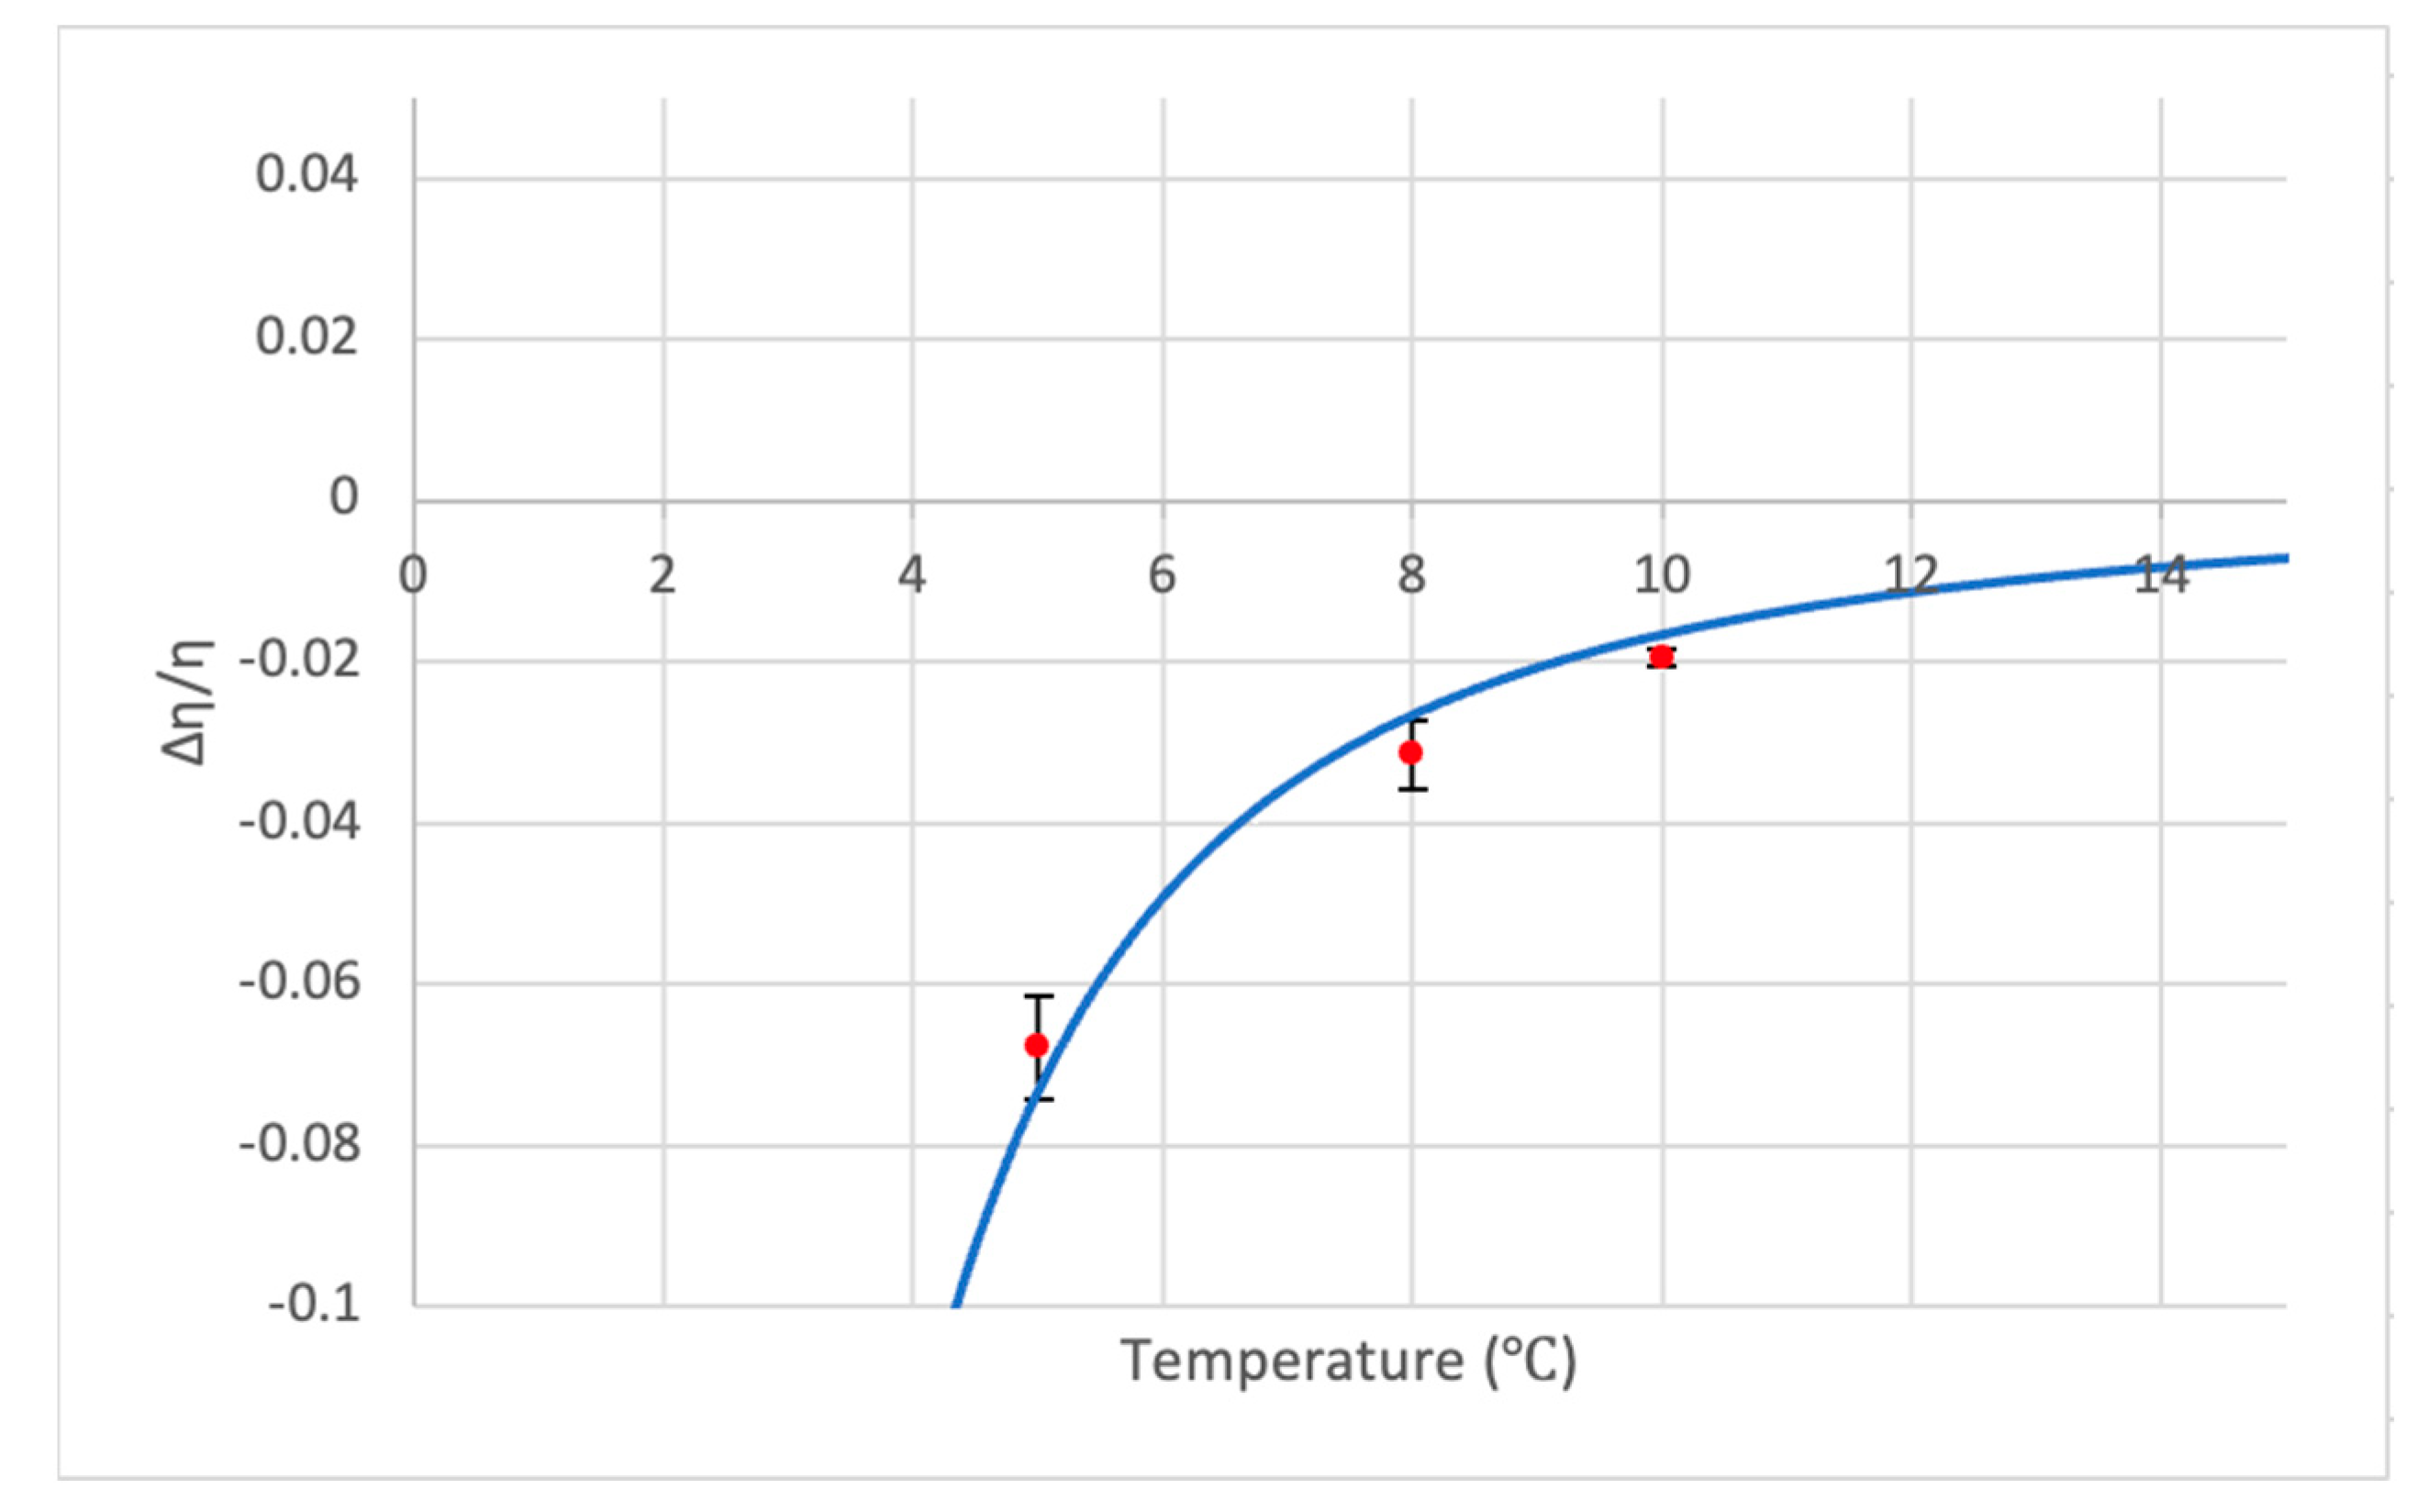
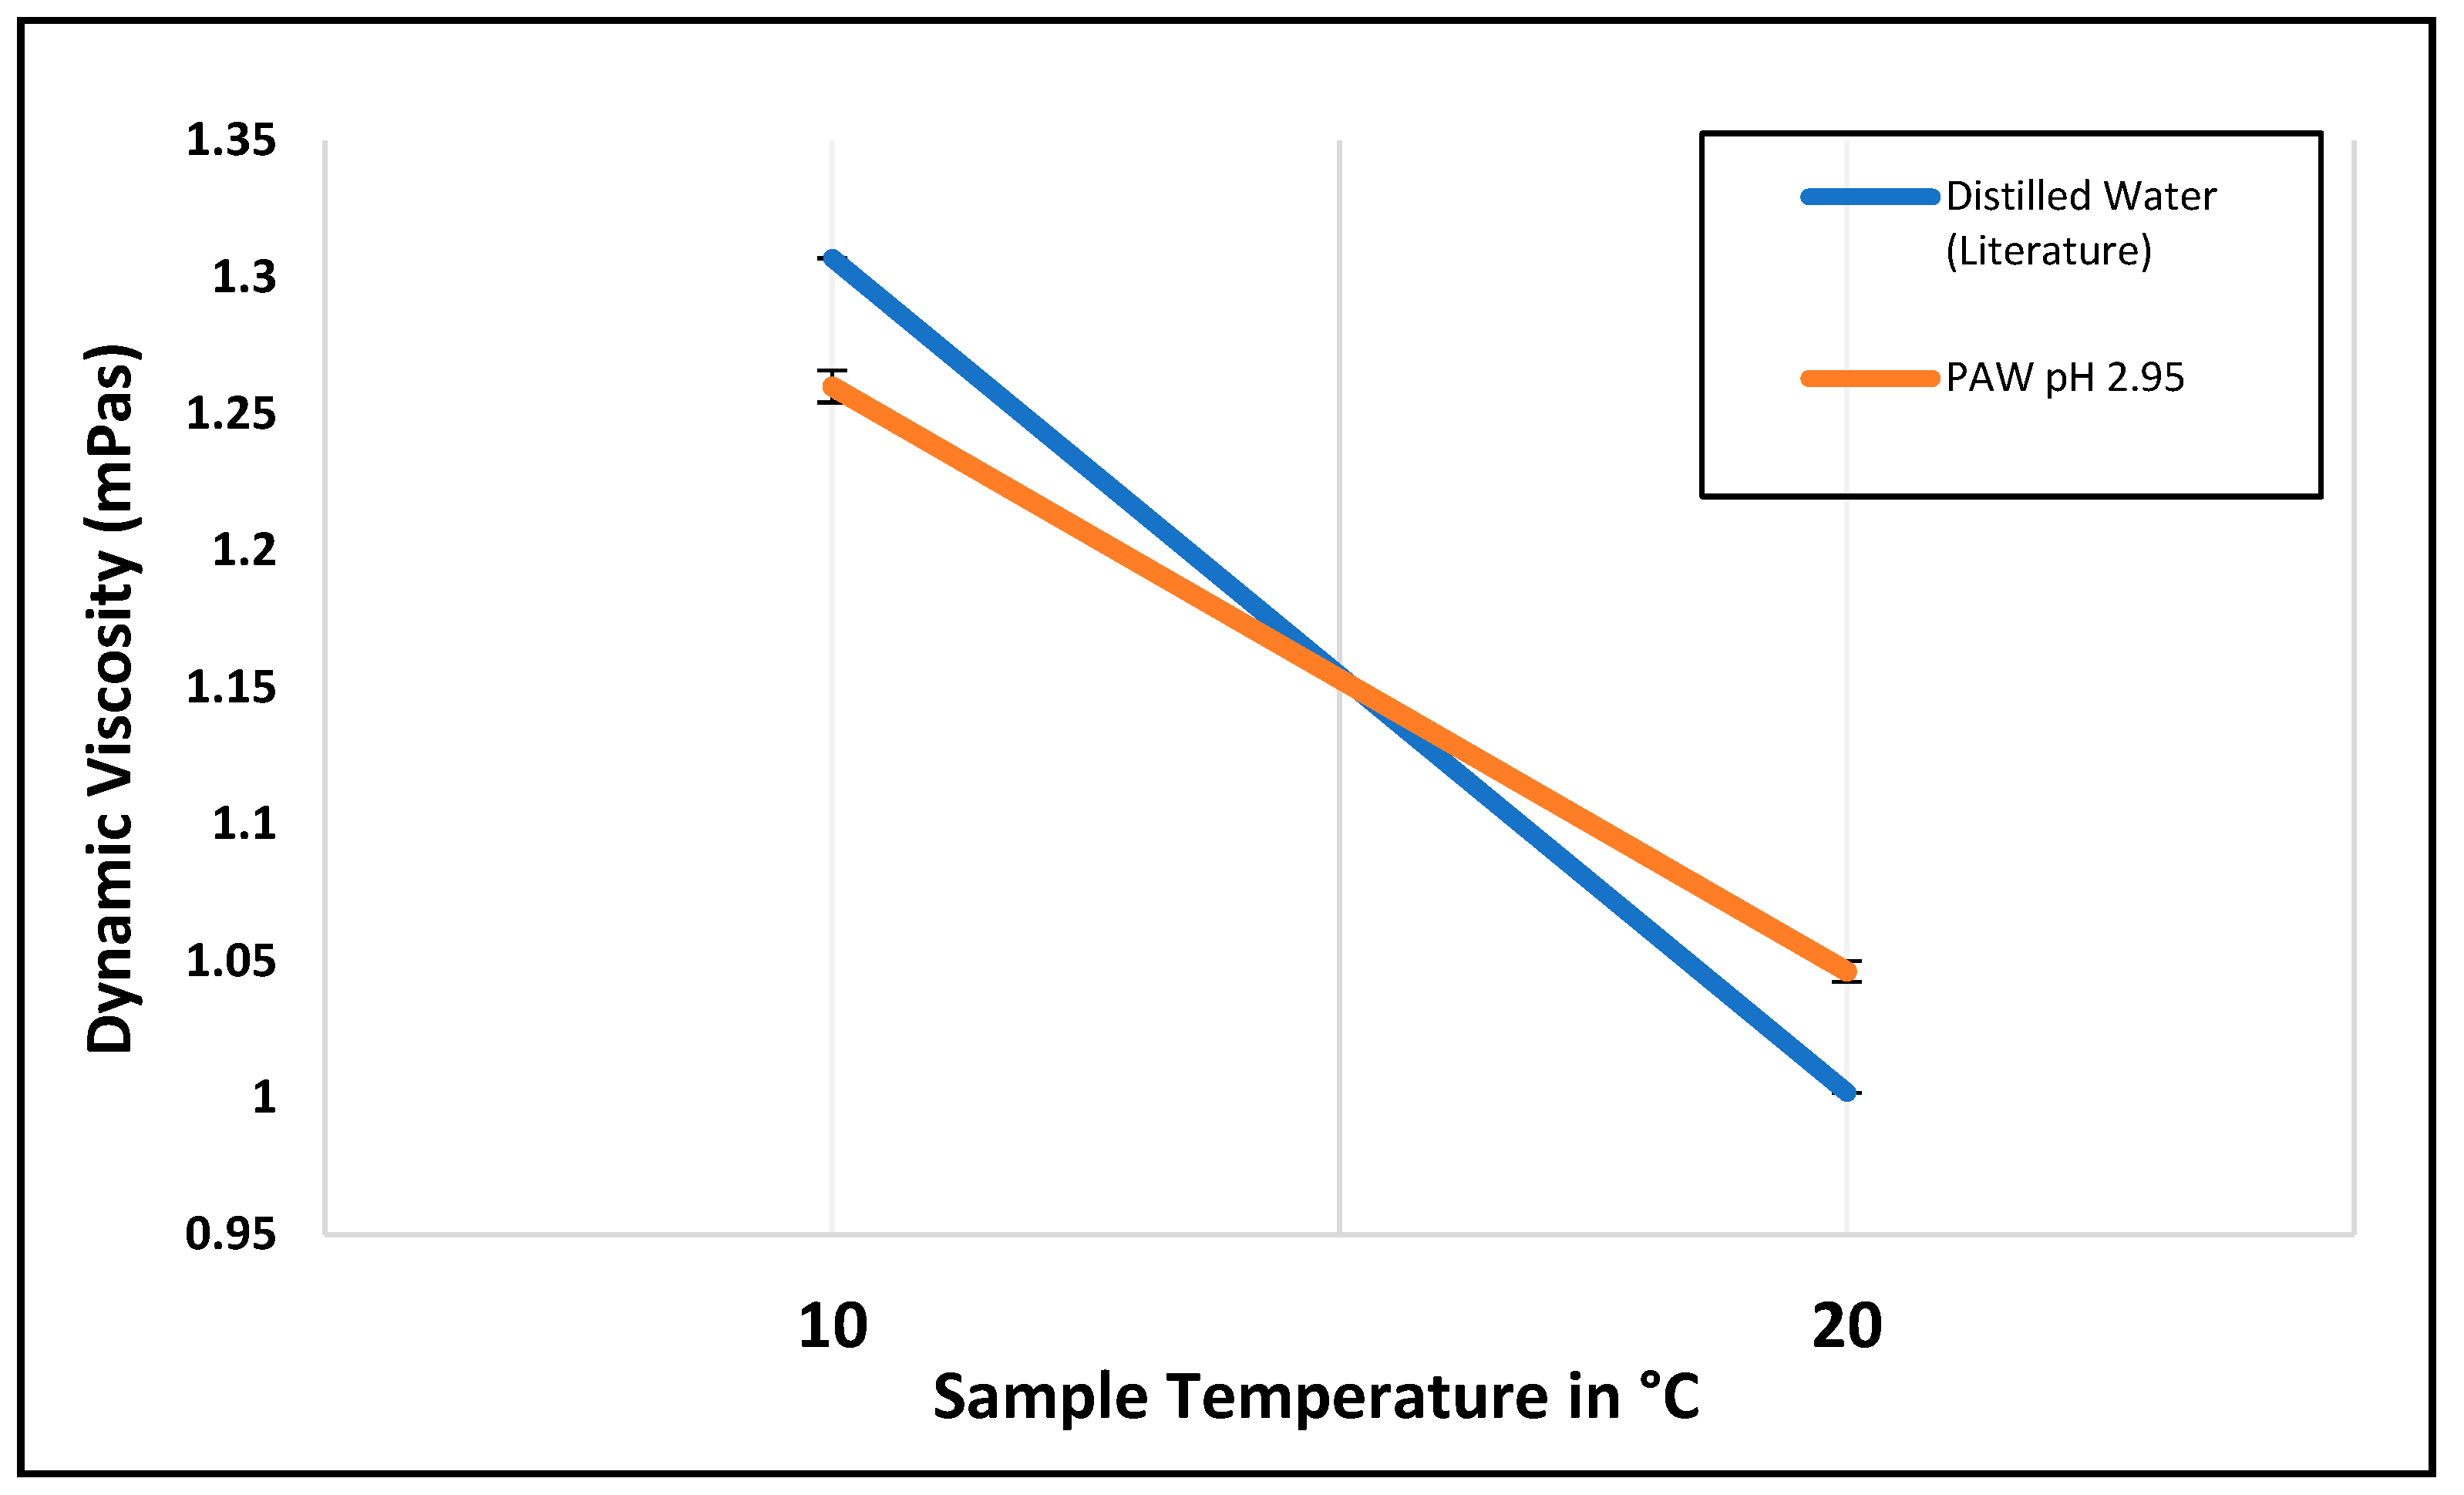
- Below 15 °C, is proportional to and .
- ○
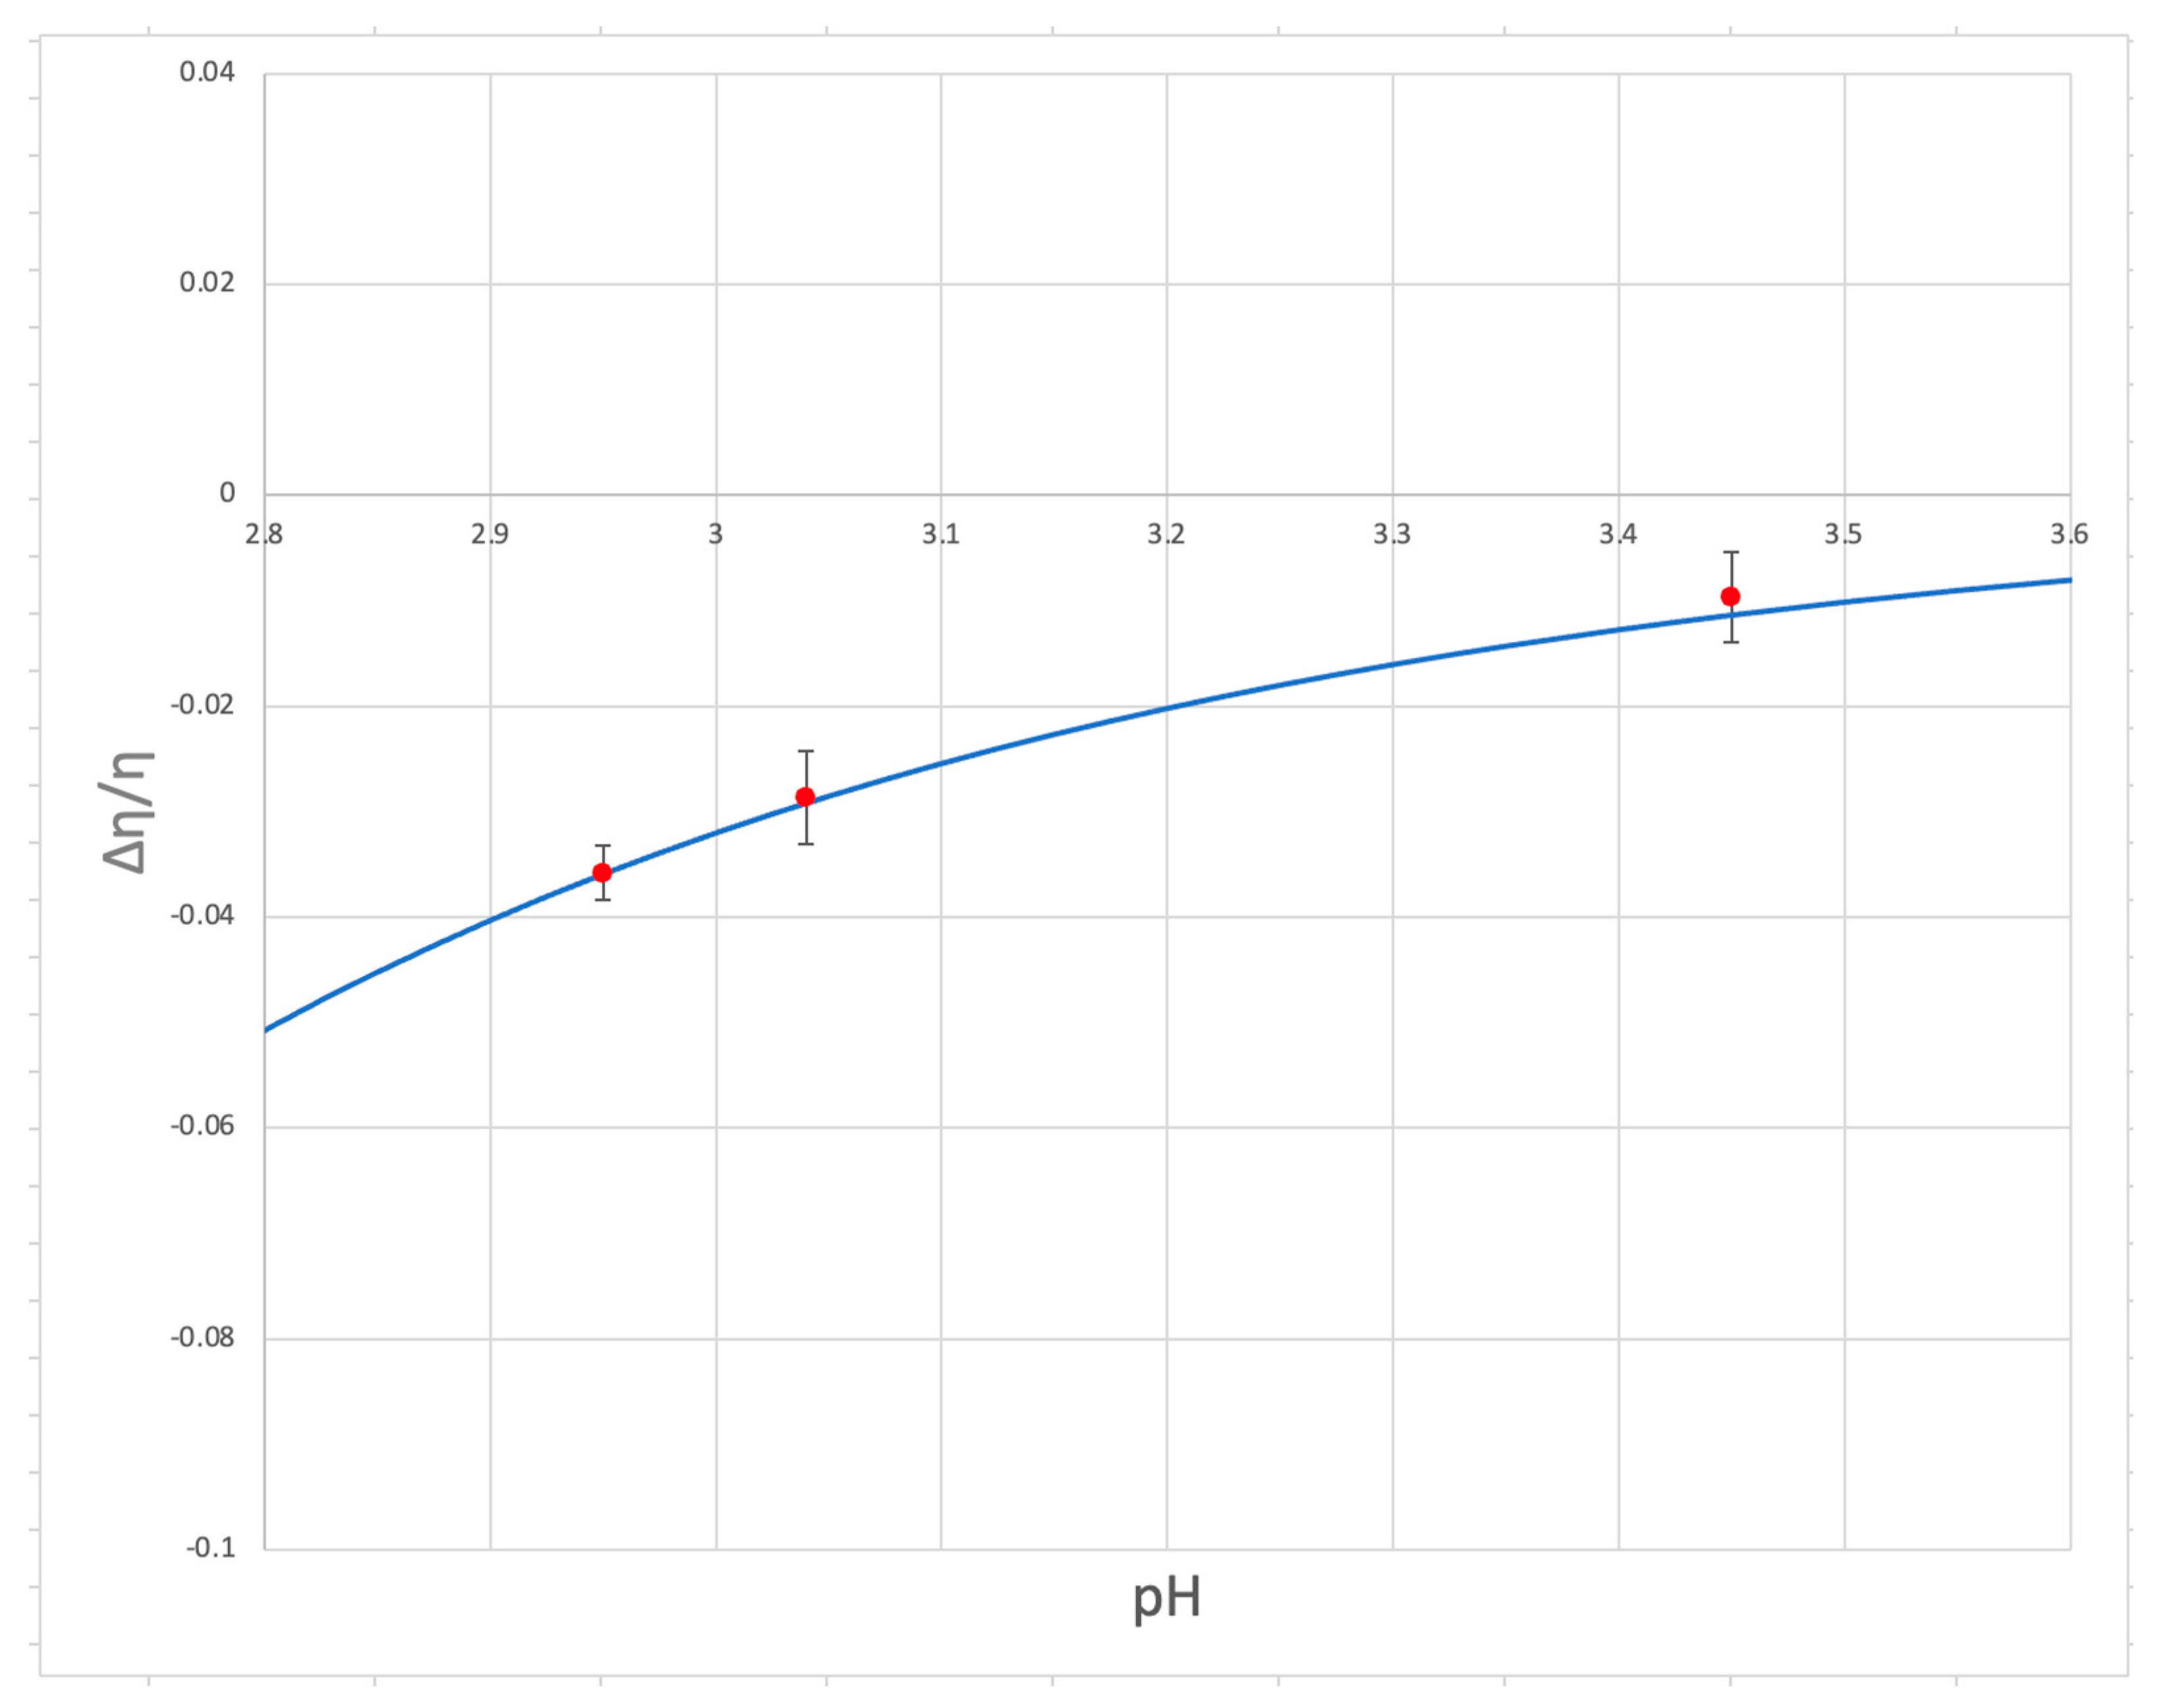
- As the temperature decreases, the viscosity of PAW becomes increasingly lower than the viscosity of distilled water, thus explaining PAW’s unusual viscosity-reducing effect; furthermore, although the contribution of the Debye–Huckel term was approximated to be linear, the full form of the model contains two exponential terms, one inside the other, which can explain why the effect of PAW is non-colligative
- Even with the approximations, the viscosity model proved to match the experimental data quite well, demonstrating a strong ability of the equation to accurately predict the PAW viscosity.
- The proportion of nano-crystalline structures in water and PAW determines many physical properties beyond the viscosity, so the model of PAW developed here could be used to understand and model any of these physical properties, potentially facilitating many applications of PAW, such as the use as an eco-friendly surfactant or disinfectant of fresh produce. While the present work has not yet modeled physical properties outside of the viscosity, the success of the viscosity model alone shows promise for the modeling of other properties.
Author Contributions
Funding
Institutional Review Board Statement
Data Availability Statement
Conflicts of Interest
References
- Fridman, A. Plasma Chemistry; Cambridge University Press: Cambridge, UK, 2008. [Google Scholar]
- Zhou, R.; Zhou, R.; Wang, P.; Xian, Y.; Mai-Prochnow, A.; Lu, X.; Cullen, P.J.; Ostrikov, K.K.; Bazaka, K. Plasma-Activated Water: Generation, Origin of Reactive Species and Biological Applications. J. Phys. Appl. Phys. 2020, 53, 303001. [Google Scholar] [CrossRef]
- Fridman, A.A. Plasma Medicine; John Wiley & Sons: Chichester, UK, 2013; ISBN 978-1-118-43765-0. [Google Scholar]
- Cooper, M.; Fridman, G.; Staack, D.; Gutsol, A.F.; Vasilets, V.N.; Anandan, S.; Cho, Y.I.; Fridman, A.; Tsapin, A. Decontamination of Surfaces from Extremophile Organisms Using Nonthermal Atmospheric-Pressure Plasmas. IEEE Trans. Plasma Sci. 2009, 37, 866–871. [Google Scholar] [CrossRef]
- Nunnally, T.; Gutsol, K.; Rabinovich, A.; Fridman, A.; Starikovsky, A.; Gutsol, A.; Potter, R.W. Dissociation of H2S in Non-Equilibrium Gliding Arc “Tornado” Discharge. Int. J. Hydrogen Energy 2009, 34, 7618–7625. [Google Scholar] [CrossRef]
- Stratton, G.R.; Bellona, C.L.; Dai, F.; Holsen, T.M.; Thagard, S.M. Plasma-Based Water Treatment: Conception and Application of a New General Principle for Reactor Design. Chem. Eng. J. 2015, 273, 543–550. [Google Scholar] [CrossRef]
- Palma, D.; Papagiannaki, D.; Lai, M.; Binetti, R.; Sleiman, M.; Minella, M.; Richard, C. PFAS Degradation in Ultrapure and Groundwater Using Non-Thermal Plasma. Molecules 2021, 26, 924. [Google Scholar] [CrossRef] [PubMed]
- Lewis, A.J.; Joyce, T.; Hadaya, M.; Ebrahimi, F.; Dragiev, I.; Giardetti, N.; Yang, J.; Fridman, G.; Rabinovich, A.; Fridman, A.A.; et al. Rapid Degradation of PFAS in Aqueous Solutions by Reverse Vortex Flow Gliding Arc Plasma. Environ. Sci. Water Res. Technol. 2020, 6, 1044–1057. [Google Scholar] [CrossRef]
- Surace, M.J.; Murillo-Gelvez, J.; Shaji, M.A.; Fridman, A.A.; Rabinovich, A.; McKenzie, E.R.; Fridman, G.; Sales, C.M. Plasma-Assisted Abatement of Per- and Polyfluoroalkyl Substances (PFAS): Thermodynamic Analysis and Validation in Gliding Arc Discharge. Plasma 2023, 6, 419–434. [Google Scholar] [CrossRef]
- Foster, J.E. Plasma-Based Water Purification: Challenges and Prospects for the Future. Phys. Plasmas 2017, 24, 055501. [Google Scholar] [CrossRef]
- Saleem, M.; Tomei, G.; Beria, M.; Marotta, E.; Paradisi, C. Highly Efficient Degradation of PFAS and Other Surfactants in Water with Atmospheric RAdial Plasma (RAP) Discharge. Chemosphere 2022, 307, 135800. [Google Scholar] [CrossRef]
- Khan, M.J.; Jovicic, V.; Zbogar-Rasic, A.; Poser, A.; Freichels, K.; Delgado, A. Effectiveness of Non-Thermal Plasma Induced Degradation of Per- and Polyfluoroalkyl Substances from Water. Water 2022, 14, 1408. [Google Scholar] [CrossRef]
- Johnson, M.J.; Maza, W.A.; Breslin, V.M.; Boris, D.R.; Petrova, T.B.; Walton, S.G. Low Power Degradation of Perfluorooctane Sulfonate (PFOS) in Water Using a Nanosecond Pulsed Atmospheric Pressure Plasma. Plasma Sources Sci. Technol. 2022, 31, 085001. [Google Scholar] [CrossRef]
- Foster, J.E.; Mujovic, S.; Groele, J.; Blankson, I.M. Towards High Throughput Plasma Based Water Purifiers: Design Considerations and the Pathway towards Practical Application. J. Phys. Appl. Phys. 2018, 51, 293001. [Google Scholar] [CrossRef]
- Moszczyńska, J.; Liu, X.; Wiśniewski, M. Non-Thermal Ammonia Decomposition for Hydrogen Production over Carbon Films under Low-Temperature Plasma—In-Situ FTIR Studies. Int. J. Mol. Sci. 2022, 23, 9638. [Google Scholar] [CrossRef] [PubMed]
- Li, W.; Cao, M.; Meng, S.; Li, Z.; Xu, H.; Liu, L.; Song, H. Non-Thermal Plasma Assisted Catalytic Water Splitting for Clean Hydrogen Production at near Ambient Conditions. J. Clean. Prod. 2023, 387, 135913. [Google Scholar] [CrossRef]
- Mumtaz, S.; Khan, R.; Rana, J.N.; Javed, R.; Iqbal, M.; Choi, E.H.; Han, I. Review on the Biomedical and Environmental Applications of Nonthermal Plasma. Catalysts 2023, 13, 685. [Google Scholar] [CrossRef]
- Gapper, C.; Dolan, L. Control of Plant Development by Reactive Oxygen Species. Plant Physiol. 2006, 141, 341–345. [Google Scholar] [CrossRef]
- Judée, F.; Simon, S.; Bailly, C.; Dufour, T. Plasma-Activation of Tap Water Using DBD for Agronomy Applications: Identification and Quantification of Long Lifetime Chemical Species and Production/Consumption Mechanisms. Water Res. 2018, 133, 47–59. [Google Scholar] [CrossRef]
- Ma, R.; Wang, G.; Tian, Y.; Wang, K.; Zhang, J.; Fang, J. Non-Thermal Plasma-Activated Water Inactivation of Food-Borne Pathogen on Fresh Produce. J. Hazard. Mater. 2015, 300, 643–651. [Google Scholar] [CrossRef]
- Guo, L.; Yao, Z.; Yang, L.; Zhang, H.; Qi, Y.; Gou, L.; Xi, W.; Liu, D.; Zhang, L.; Cheng, Y.; et al. Plasma-Activated Water: An Alternative Disinfectant for S Protein Inactivation to Prevent SARS-CoV-2 Infection. Chem. Eng. J. 2021, 421, 127742. [Google Scholar] [CrossRef]
- Li, Y.; Pan, J.; Ye, G.; Zhang, Q.; Wang, J.; Zhang, J.; Fang, J. In Vitro Studies of the Antimicrobial Effect of Non-Thermal Plasma-Activated Water as a Novel Mouthwash. Eur. J. Oral Sci. 2017, 125, 463–470. [Google Scholar] [CrossRef]
- Ten Bosch, L.; Köhler, R.; Ortmann, R.; Wieneke, S.; Viöl, W. Insecticidal Effects of Plasma Treated Water. Int. J. Environ. Res. Public. Health 2017, 14, 1460. [Google Scholar] [CrossRef] [PubMed]
- Rathore, V.; Nema, S.K. The Role of Different Plasma Forming Gases on Chemical Species Formed in Plasma Activated Water (PAW) and Their Effect on Its Properties. Phys. Scr. 2022, 97, 065003. [Google Scholar] [CrossRef]
- He, J.; Rabinovich, A.; Vainchtein, D.; Fridman, A.; Sales, C.; Shneider, M.N. Effects of Plasma on Physical Properties of Water: Nanocrystalline-to-Amorphous Phase Transition and Improving Produce Washing. Plasma 2022, 5, 462–469. [Google Scholar] [CrossRef]
- Shaji, M.; Rabinovich, A.; Surace, M.; Sales, C.; Fridman, A. Physical Properties of Plasma-Activated Water. Plasma 2023, 6, 45–57. [Google Scholar] [CrossRef]
- Brini, E.; Fennell, C.J.; Fernandez-Serra, M.; Hribar-Lee, B.; Lukšič, M.; Dill, K.A. How Water’s Properties Are Encoded in Its Molecular Structure and Energies. Chem. Rev. 2017, 117, 12385–12414. [Google Scholar] [CrossRef] [PubMed]
- Semak, V.V.; Gerakis, A.; Shneider, M.N. Measurement of Temperature Dependent Absorption Coefficient of Water at 1064 nm Wavelength. AIP Adv. 2019, 9, 085016. [Google Scholar] [CrossRef]
- Boles, M.A.; Dr, Y.A.C. Thermodynamics: An Engineering Approach; McGraw-Hill Education: New York, NY, USA, 2014; ISBN 978-0-07-339817-4. [Google Scholar]
- Tanaka, H. Simple Physical Model of Liquid Water. J. Chem. Phys. 2000, 112, 799–809. [Google Scholar] [CrossRef]
- Fisher, M.E. The Theory of Equilibrium Critical Phenomena. Rep. Prog. Phys. 1967, 30, 615. [Google Scholar] [CrossRef]
- Olmsted, P.D. Lectures on Landau Theory of Phase Transitions. Available online: https://site.physics.georgetown.edu/~pdo7/ps_files/landau.pdf (accessed on 1 July 2023).
- Redfern, S. Order-Disorder Phase Transitions. Rev. Mineral. Geochem. 2000, 39, 105–133. [Google Scholar] [CrossRef]
- Shen, Y.; Wei, X.; Wang, Y.; Shen, Y.; Li, L.; Huang, Y.; Ostrikov, K. Energy Absorbancy and Freezing-Temperature Tunability of NaCl Solutions during Ice Formation. J. Mol. Liq. 2021, 344, 117928. [Google Scholar] [CrossRef]
- Kestin, J.; Sokolov, M.; Wakeham, W.A. Viscosity of Liquid Water in the Range −8 °C to 150 °C. J. Phys. Chem. Ref. Data 1978, 7, 941–948. [Google Scholar] [CrossRef]


| Temperature °C | Measured Distilled Water Viscosity (mPas) | Measurement Error (mPas) | Distilled Water Viscosity from the Literature (mPas) [35] |
|---|---|---|---|
| 5 | 1.51 | 0.001 | 1.51 |
| 8 | 1.37 | 0.006 | 1.38 |
| 10 | 1.31 | 0.005 | 1.31 |
| 20 | 1.02 | 0.003 | 1.00 |
| Temperature °C | PAW pH 2.7 Viscosity (mPas) | Measurement Error (mPas) | Distilled Water Viscosity (mPas) [35] |
|---|---|---|---|
| 5 | 1.41 | 0.009 | 1.51 |
| 8 | 1.34 | 0.008 | 1.38 |
| 10 | 1.28 | 0.000 | 1.31 |
| Sample | Dynamic Viscosity (mPas) | Measurement Error (mPas) |
|---|---|---|
| Distilled Water | 1.31 [35] | - |
| PAW, pH 2.95 | 1.26 | 0.005 |
| PAW, pH 3.04. | 1.27 | 0.003 |
| PAW, pH 3.45 | 1.29 | 0.005 |
Disclaimer/Publisher’s Note: The statements, opinions and data contained in all publications are solely those of the individual author(s) and contributor(s) and not of MDPI and/or the editor(s). MDPI and/or the editor(s) disclaim responsibility for any injury to people or property resulting from any ideas, methods, instructions or products referred to in the content. |
© 2023 by the authors. Licensee MDPI, Basel, Switzerland. This article is an open access article distributed under the terms and conditions of the Creative Commons Attribution (CC BY) license (https://creativecommons.org/licenses/by/4.0/).
Share and Cite
Ginzburg, J.; Shaji, M.; Rabinovich, A.; Vainchtein, D.; Sales, C.; Fridman, A. Effects of Non-Thermal Plasma on the Transition from Nano-Crystalline to Amorphous Structure in Water and Subsequent Effects on Viscosity. Plasma 2024, 7, 16-28. https://0-doi-org.brum.beds.ac.uk/10.3390/plasma7010002
Ginzburg J, Shaji M, Rabinovich A, Vainchtein D, Sales C, Fridman A. Effects of Non-Thermal Plasma on the Transition from Nano-Crystalline to Amorphous Structure in Water and Subsequent Effects on Viscosity. Plasma. 2024; 7(1):16-28. https://0-doi-org.brum.beds.ac.uk/10.3390/plasma7010002
Chicago/Turabian StyleGinzburg, Joshua, Mobish Shaji, Alexander Rabinovich, Dmitri Vainchtein, Christopher Sales, and Alexander Fridman. 2024. "Effects of Non-Thermal Plasma on the Transition from Nano-Crystalline to Amorphous Structure in Water and Subsequent Effects on Viscosity" Plasma 7, no. 1: 16-28. https://0-doi-org.brum.beds.ac.uk/10.3390/plasma7010002