
Polystyrene (PS) Degradation Induced by Nanosecond Electric Discharge in Air in Contact with PS/Water


1
Groupe de Physique des Plasmas, Département de Physique, Université de Montréal, Montréal, QC H2V 0B3, Canada
2
Laboratoire des Sciences des Procédés et des Matériaux (LSPM), CNRS UPR3407, Université Sorbonne Paris Nord, 93430 Villetaneuse, France
3
Institut Clément Ader, CNRS UMR 5312, Institut National des Sciences Appliquées (INSA) de Toulouse, 31300 Toulouse, France
*
Author to whom correspondence should be addressed.
Plasma 2024, 7(1), 49-63; https://0-doi-org.brum.beds.ac.uk/10.3390/plasma7010004
Submission received: 6 December 2023
/
Revised: 22 December 2023
/
Accepted: 11 January 2024
/
Published: 16 January 2024
(This article belongs to the Special Issue Processes in Atmospheric Pressure Plasmas)
Abstract
:Water pollution with microplastics has become a significant concern. Conventional treatment methods have proven ineffective, and alternatives are being explored. Herein, we assess the degradation efficiency of polystyrene (PS) by measuring its nanosecond discharge in air in contact with water. Its discharge is characterized during processing, and a transition from streamer-like to spark-like discharge occurs due to the increased electrical conductivity of water. Experiments are conducted at different frequencies, and the highest degradation is achieved at 10 kHz; an 83% polystyrene weight loss is recorded after 5 min of processing. The optical spectra of the discharge show no evidence of C-species, and an FTIR analysis of the processed polystyrene reveals no structural modifications. An NMR analysis shows the presence of ethylbenzene in water. Finally, a mechanism of PS degradation is proposed.
1. Introduction
Plastic has emerged as an attractive material due to its affordability, versatility, light weight, and excellent resistance, among other properties [1]. Consequently, plastic materials have found their way into numerous everyday applications, making human activities increasingly dependent on plastic usage. Unfortunately, this has led to the release of millions of tons of plastic waste into the environment, particularly into the ocean [2]. Such heavy plastic pollution poses significant threats to both land-based and marine ecosystems, endangering their delicate balance [3]. Due to its high resistivity, plastic debris with sizes ranging from several millimeters (microplastics, MP) to a few nanometers (nanoplastics, NP) often evades conventional processing plants and finds its way into water bodies [4]. These small, persistent plastic particles have the potential to infiltrate ready-to-consume water [5], and recent analyses have highlighted the concerning presence of these materials in human blood [6], animal stomachs [7], and even plants [8].
Numerous technologies, including physical- [9], chemical- [10], and biological-based techniques [11], are currently being employed to address the removal of plastic materials from aquatic environments. However, when it comes to wastewater treatment plants, filtration methods exhibit limited efficacy in removing plastics smaller than 5 mm, specifically microplastics (MP), due to the size constraints of the technologies employed [12,13]. Given that most conventional MP removal processes primarily rely on physical separation from the environment, additional treatment is necessary to achieve the complete decomposition of MP [14]. To tackle this pressing environmental issue, various degradation technologies have emerged in recent years, offering promising solutions. These include biodegradation [15], oxidation processes [16], catalysis [17], and other innovative approaches [18].
Among the array of degradation technologies, advanced oxidation processes (AOPs) have garnered great research interest since their introduction in the 1980s [14]. AOPs involve the utilization of single or multiple methods, such as UV light, heat, plasma, and catalysts, to generate reactive species during the treatment process. These reactive species play a crucial role in decomposing the various contaminants present in water [19], making AOPs highly versatile and applicable in numerous fields. The wide-ranging applications of AOPs include (i) the elimination of refractory, traceable, or specific organic materials; (ii) the enhancement of biodegradation processes; and (iii) the complete conversion of hazardous organic pollutants into harmless end products [14,19]. With their ability to address diverse water pollution challenges, AOPs have emerged as a promising technology in the quest for effective and sustainable solutions for water treatment and environmental protection.
Kiendrebeogo et al. [20] conducted a thorough evaluation of the electro-oxidation process’s feasibility for degrading microplastics (MP). By optimizing the electrode’s nature, electrolyte composition, and electrical current intensity, the authors achieved an impressive degradation efficiency of approximately 90% after 6 h of processing. Interestingly, the study revealed that the MP do not break down into smaller particles; instead, they are directly transformed into gaseous products, including CO2. This transformation process represents a significant advancement in the field of MP degradation. In a more recent study, García-Muñoz et al. [21] established a comprehensive protocol for analyzing the oxidation of polystyrene (PS) beads using TiO2-based photocatalysis. By measuring the total organic carbon (TOC), they showed that 80% of the organic carbon present in the polymeric nanomaterials is successfully converted to CO2. However, the conversion process takes a long time and requires 96 h of UV radiation. The extended degradation period of PS highlights the relatively lower efficiency of the AOPs.
In the current scenario, it has become evident that a rapid and eco-friendly process for degrading microplastics (MP) is urgently needed. This process must generate reactive species that effectively break the molecular bonds within the structure of the MP, leading to their degradation [22]. Plasmas can potentially be used to develop such a process, especially considering their high efficiency in degrading various pollutants [23,24]. Indeed, plasmas offer a unique advantage, as they can simultaneously produce a plethora of reactive species, including photons, electrons, and radicals, fostering a synergistic effect. This feature allows multiple reactions to occur, thereby increasing the efficiency of plasma treatment in breaking down a wide range of organic compounds (e.g., aromatic and aliphatic rings, as well as organic dyes) present in water [25,26,27]. Notably, the reactivity of plasmas is enhanced in the presence of water due to the production of additional species such as OH, H2O2, and O [23,28,29].
In the realm of microplastic degradation, the utilization of plasma technology remains relatively limited, with only a handful of studies exploring its potential. One such study conducted by Zhou et al. [18] investigates the aging of various microplastics using a dielectric barrier discharge. The authors show that after two hours of processing, the alkyl group is disrupted and O-containing functional groups are identified in the structure. As a result of the plasma treatment, the MP samples exhibit significant changes, including the emergence of cracks, holes, and porous surfaces, along with a noticeable reduction in the C/O ratio. While this transformation signifies progress in terms of MP degradation, it is important to note that the plasma-based process also leads to the formation of degradation by-products, some of which are identified as toxic compounds.
In this study, we evaluate the degradation efficiency of polystyrene (PS), a compound typically used in packaging applications and a major ocean pollutant, by treating it with a repetitive nanosecond discharge generated in air in contact with water. The evolution of the electrical and optical properties of the discharge is meticulously documented using adapted probes and optical emission spectroscopy, respectively. Meanwhile, the properties of the PS samples are analyzed using FTIR spectroscopy before and after plasma processing to determine the plasma-induced changes in the plastics’ molecular structure. The impact of the discharge process on the water’s properties is also investigated by evaluating changes in the electrical conductivity and acidity of the water. This provides vital information regarding the interaction between the discharge and the water environment. Finally, NMR spectroscopy is used to examine the composition of the water after processing.
2. Materials and Methods
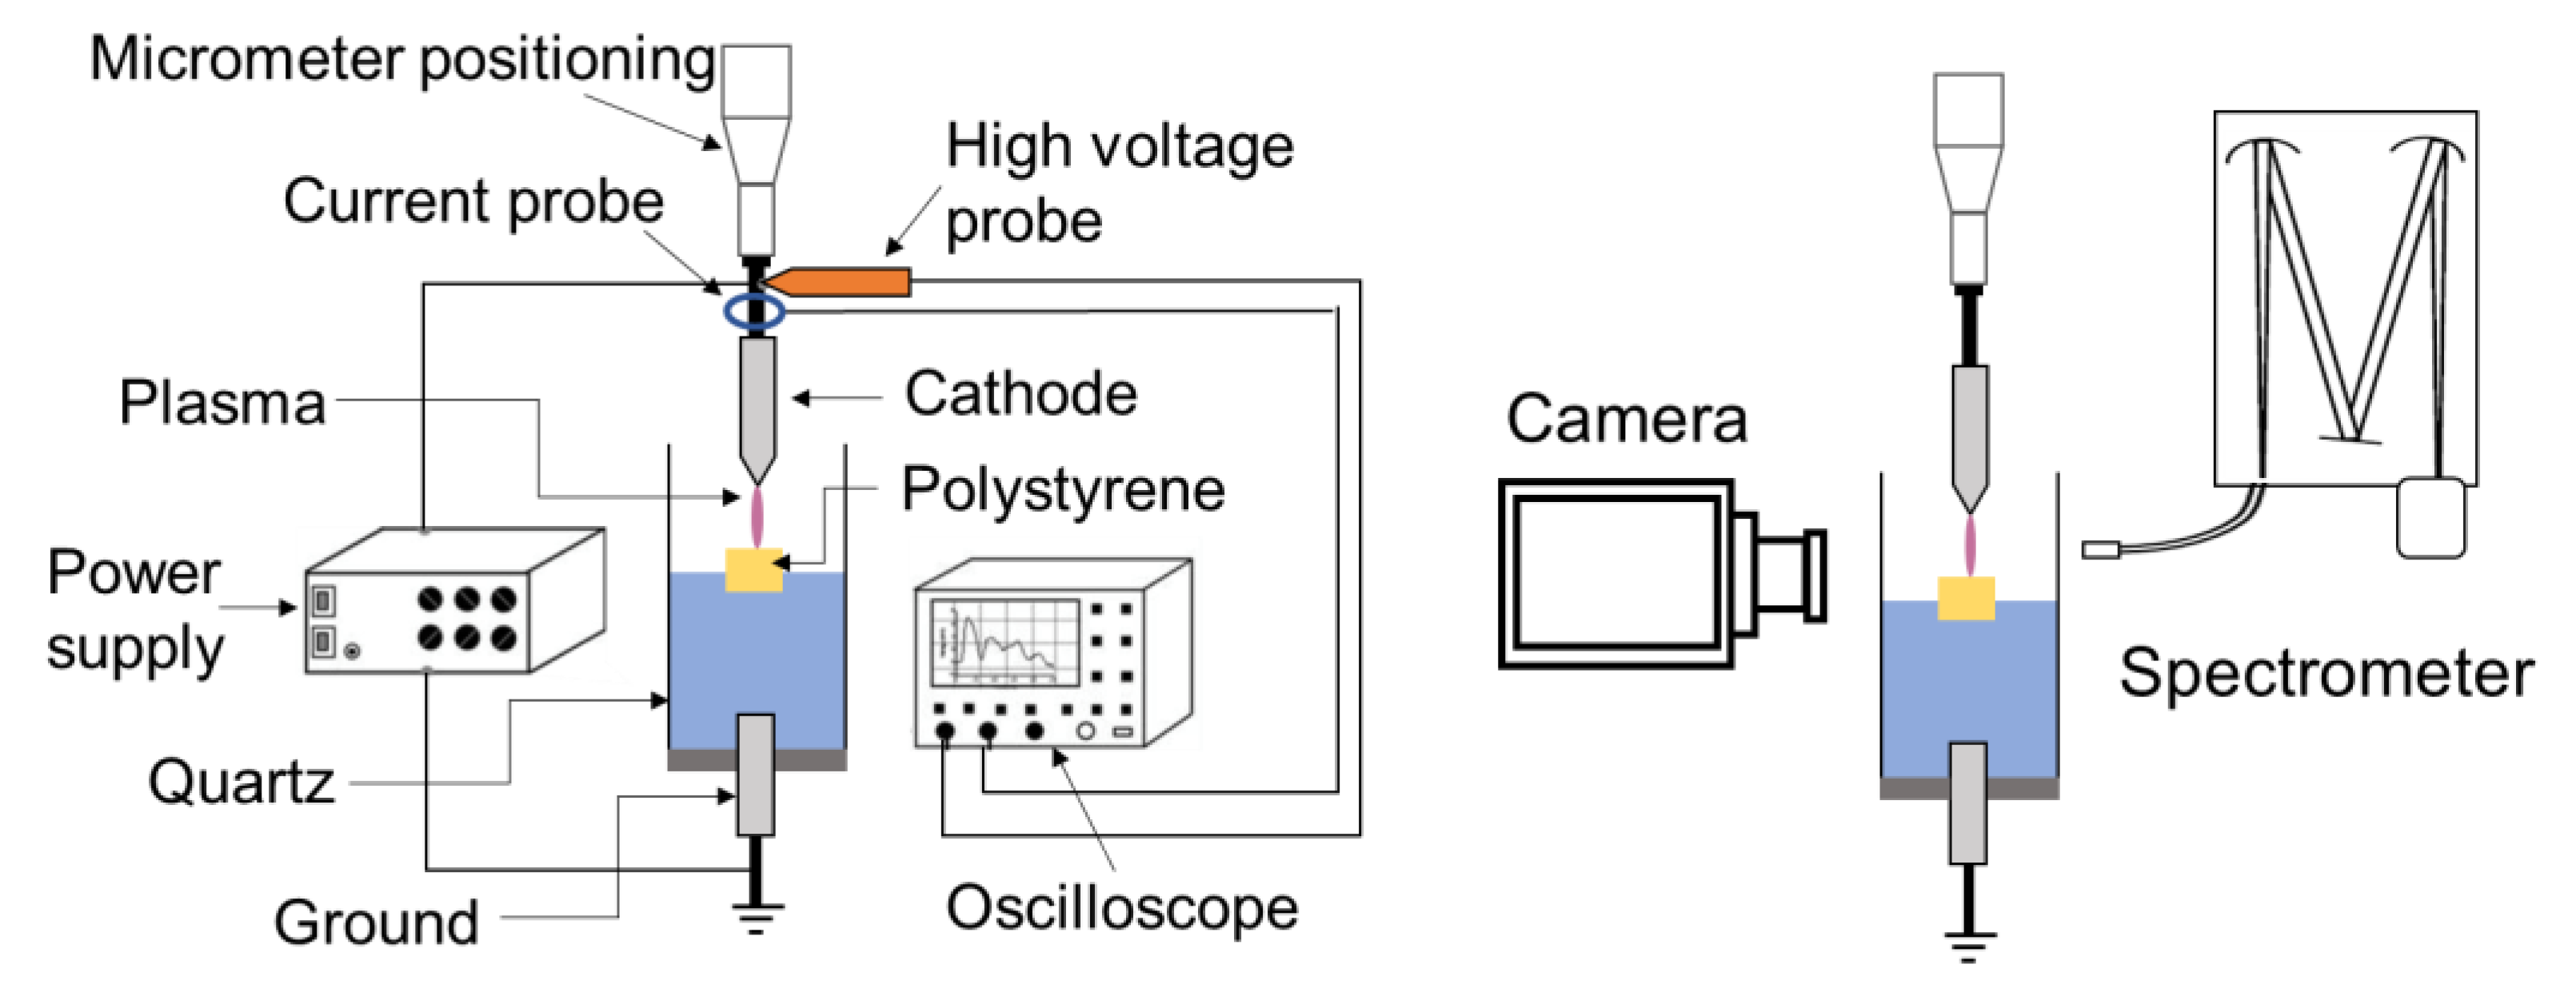
The experimental setup, illustrated in Figure 1, comprises two tungsten electrodes (with a 2 mm diameter) firmly secured on a vertical micrometric positioning system. These electrodes are carefully polished to achieve the desired configuration and geometry, be it pin or plate. The cathode’s tip is refined to an apex angle of approximately 50° (with a curvature radius of 20–30 μm) using an electrode sharpener grinder angle controller, and it is positioned 24.5 mm above the grounded electrode, which has a flat tip. The grounded electrode is immersed in 10 mL deionized water (with an initial electrical conductivity of ~2 µS/cm and pH of 5.6), and the distance between the cathode and the water surface is maintained at 4.5 mm.
For our experiment, a cubic piece of polystyrene microplastic (5 × 5 × 5 mm3, 1.8 ± 0.1 mg) is placed in the cell, then 10 mL of deionized water is added. At equilibrium, the microplastic sample floats on the water’s surface (i.e., it is semi-submerged in water), and the cathode pin is positioned 2 mm above the microplastics’ surface. Note that the processed samples originate from a PS used in packaging. Therefore, there is no information about its properties. However, the PS samples have a density between 0.96 and 1.05 g/cm3 with a molecular weight between 100 and 400 kg/mol.
Negative high-voltage pulses are applied to the cathode using a pulser (NSP 120-20-N-500-TG-H; Eagle Harbor Technologies, Seattle, WA, USA). The high-voltage amplitude and pulse width are −12 kV and 500 ns, respectively, whereas the repetition rate is adjusted to 2, 5, or 10 kHz. The voltage and current waveforms are measured using a high-voltage probe (P6015A, ×1000; Tektronix, Beaverton, OR, USA) and a current monitor (6585, 0.5 V/A; Pearson, Palo Alto, CA, USA), respectively, and they are recorded on an oscilloscope (MSO54, 2 GHz, 6.25 GS/s; Tektronix) every minute of processing.
Another probe (pH/conductivity/DO; MU 6100 H) is used to measure the conductivity and acidity of water before and after plasma processing, and nuclear magnetic resonance (NMR–Bruker AV700 spectrometer, Billerica, MA, USA) spectrometry is used to identify the chemical species present in the water after treatment. To determine the structure of the PS and the possible modifications induced by the discharge process, Fourier transform infrared (FTIR) spectrometry (Vertex 70; Bruker) analyses are performed in attenuated total reflectance (ATR) mode (with a spectral resolution of 2 cm−1). Plasma-induced losses in the weights of PS samples are established by weighing the samples before and after processing using a precision balance (XPR404S; Mettler Toledo, Columbus, OH, USA). Before weighing, the processed samples are dried over two days in a closed tray containing Drierite.
Finally, the optical properties of the plasma are recorded using an optical emission spectrophotometer (IsoPlane SCT-320; Princeton Instruments, Trenton, NJ, USA) equipped with 600 lines/mm grating and an ICCD camera detector (Princeton Instruments PI-MAX4 1024 × 256). The optical fiber is positioned perpendicular to the plasma channel outside the quartz tube, and the acquired spectra are averaged spatially (with a probed zone of ~2 × 2 mm2) and temporally (i.e., integrated during the 500 ns pulse). The plasma’s dynamics are also investigated using a video camera operated at the repetition rate of 30 Hz (Panasonic, AG HMC70, Secaucus, NJ, USA).
3. Results
3.1. Optical and Electrical Characteristics of the Discharge
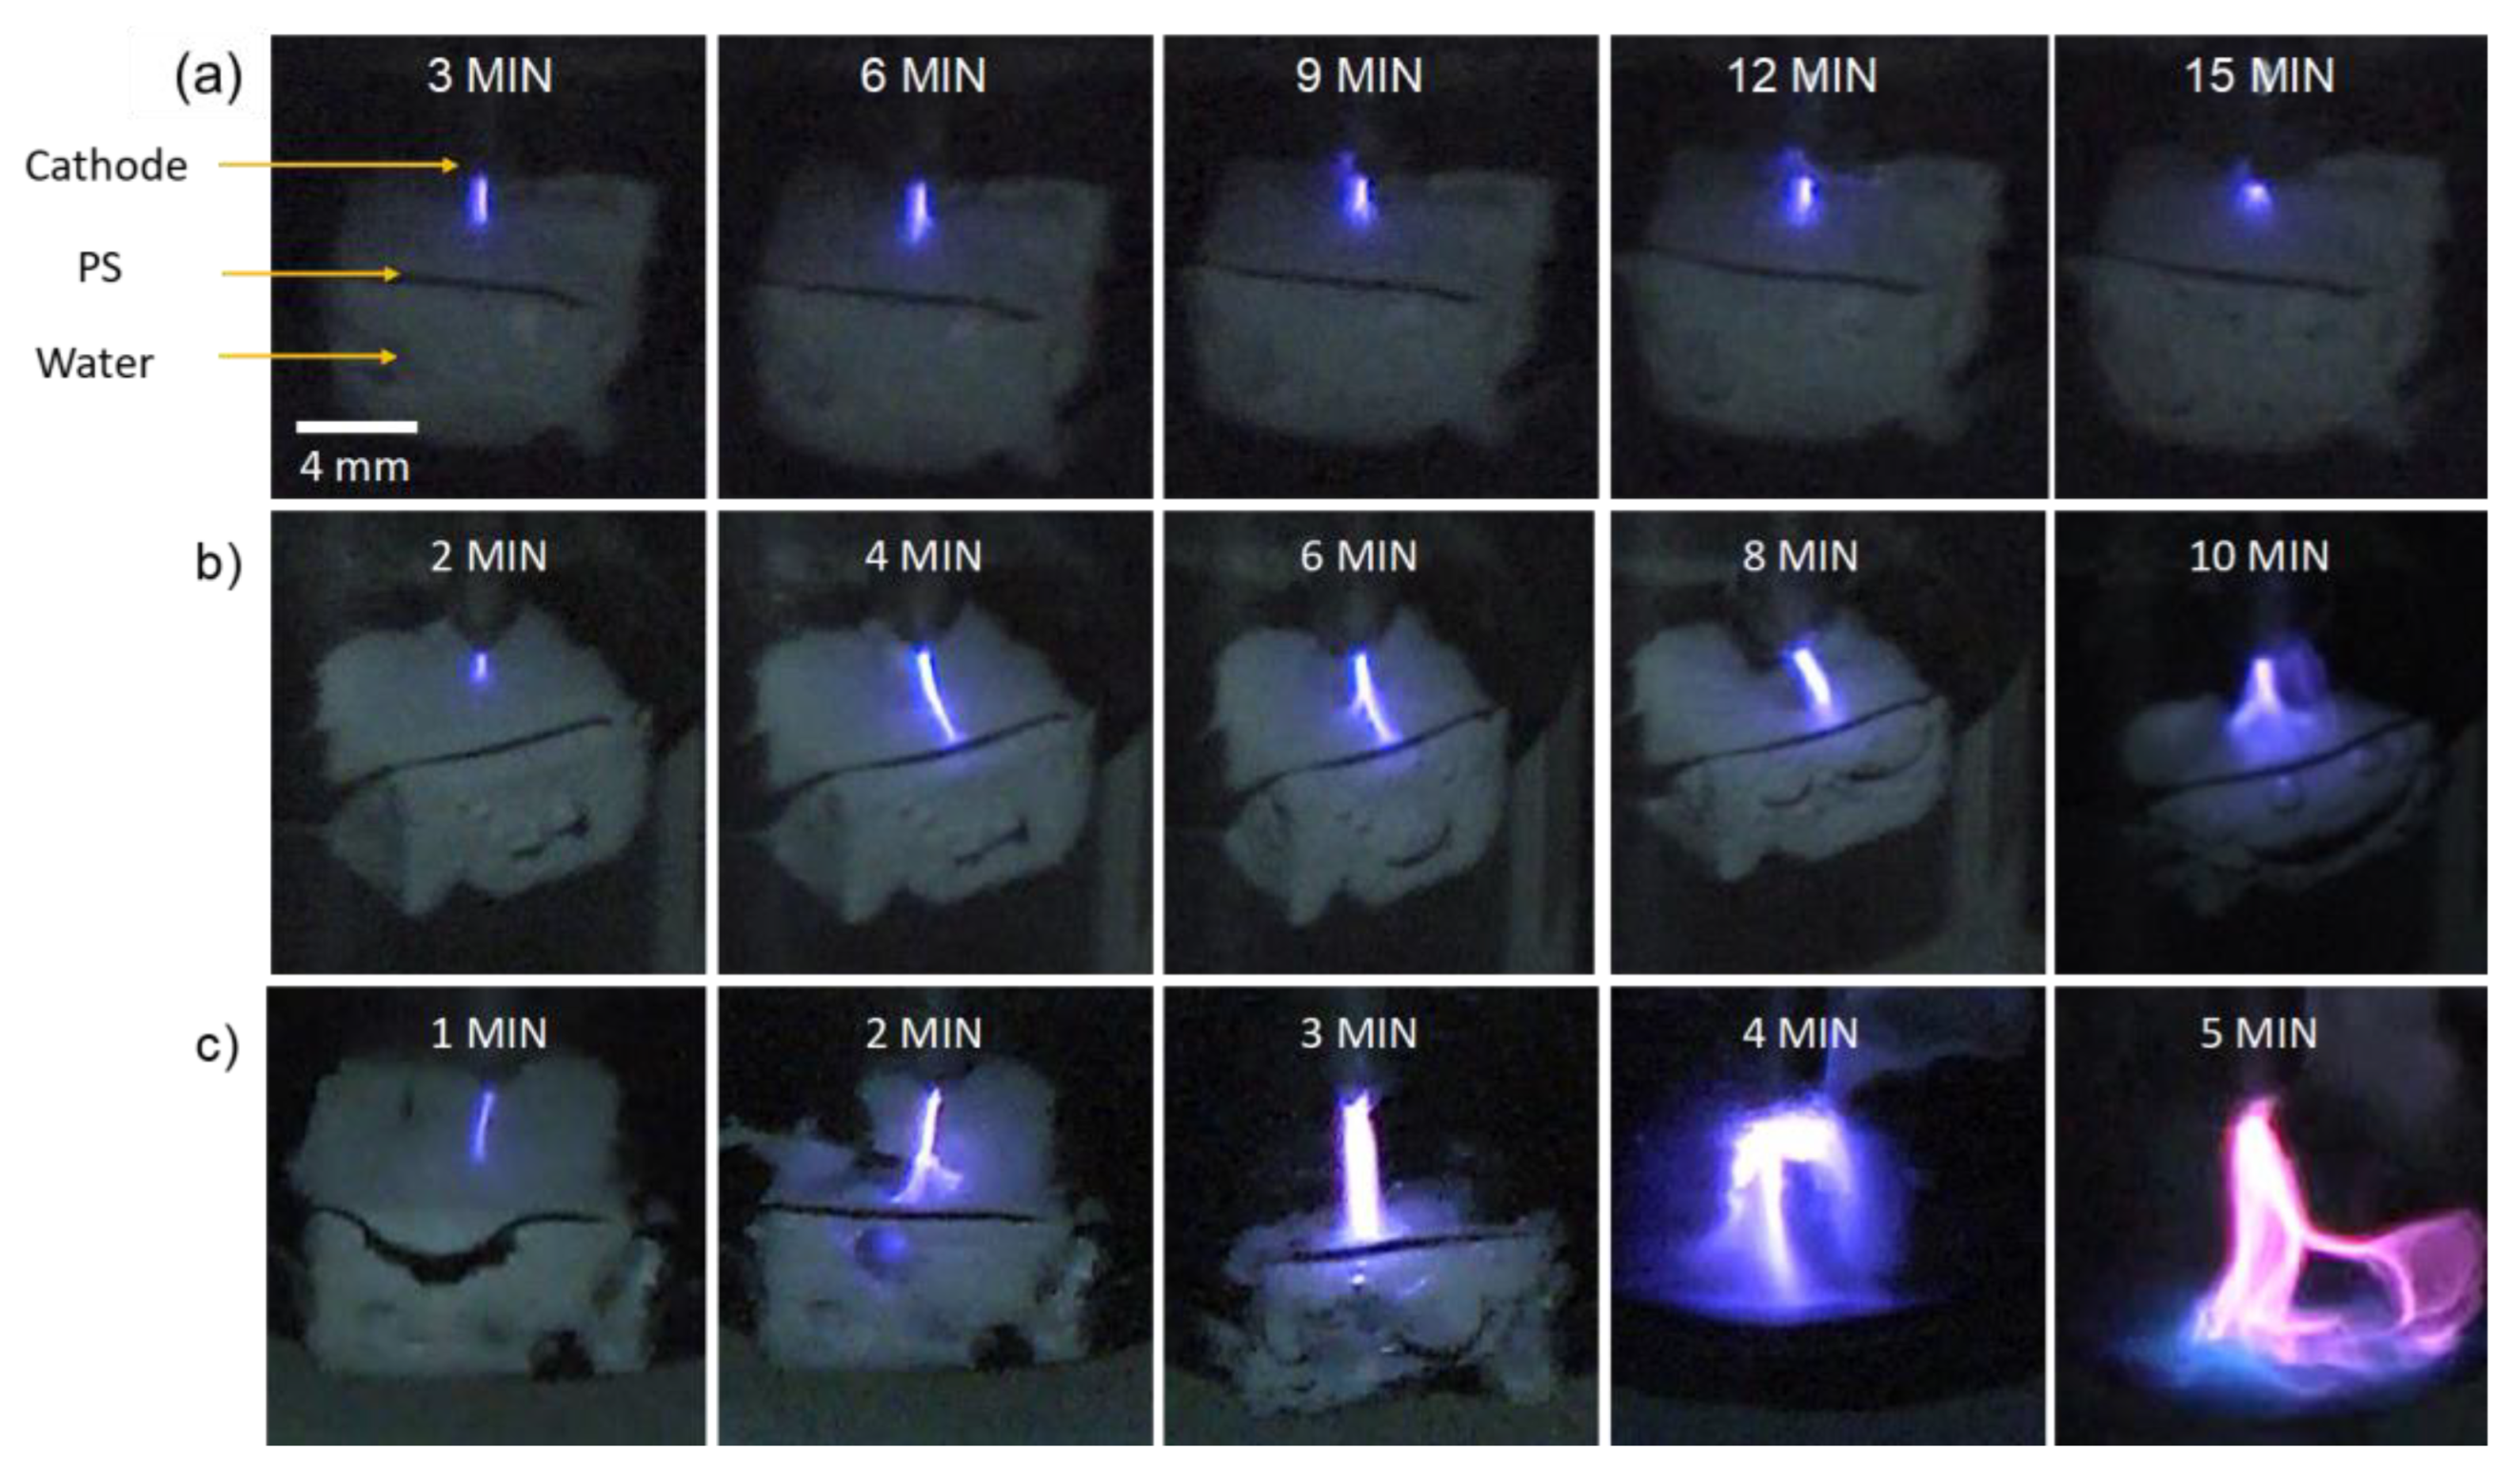
The discharge is first characterized via a video camera to show its dynamics during processing. Images of interest are extracted from the videos at different times, and they are shown in Figure 2a–c for the discharges at 2, 5, and 10 kHz, respectively.
At 2 kHz, the discharge emission consists of a purple plasma filament that is in contact with the surface of the PS. This color is derived from the emission of nitrogen species (as confirmed by OES). The discharge morphology does not change significantly with time; however, at 15 min, it becomes more diffuse and shorter in length. At 5 kHz, a short plasma filament that is in contact with the PS surface is identified at the beginning. Later (e.g., at 4 min), the length of the filament increases, but it remains in contact with the PS surface. Beyond 4 min, the filament becomes wider, with a diffused head at the PS surface. At 10 kHz, the intensity of the discharge filament increases significantly with the processing time. As in the previous case (5 kHz), the plasma filament is initially short, but its length increases rapidly. At 2 min, the filament head at the PS surface splits into two branches, and at 3 min, it turns back into a single one that becomes wider with a diffuse head at the water surface (the PS sample size is reduced at this point). Further processing (4 min) leads to filaments with highly diffused heads propagating towards the water surface, and towards the end of processing (5 min), a significant color change from violet to pink/blue is observed. This indicates that the plasma composition has changed due to a transition in the discharge mode (more details are provided below). At this stage, it is worth noting that the discharge conditions that lead to a significant degradation of the PS sample also induce a significant increase in the gap distance. For instance, at 10 kHz, the gap distance increases from ~2 to ~5 mm after 5 min of processing, which also contributes to the evolution of the discharge.
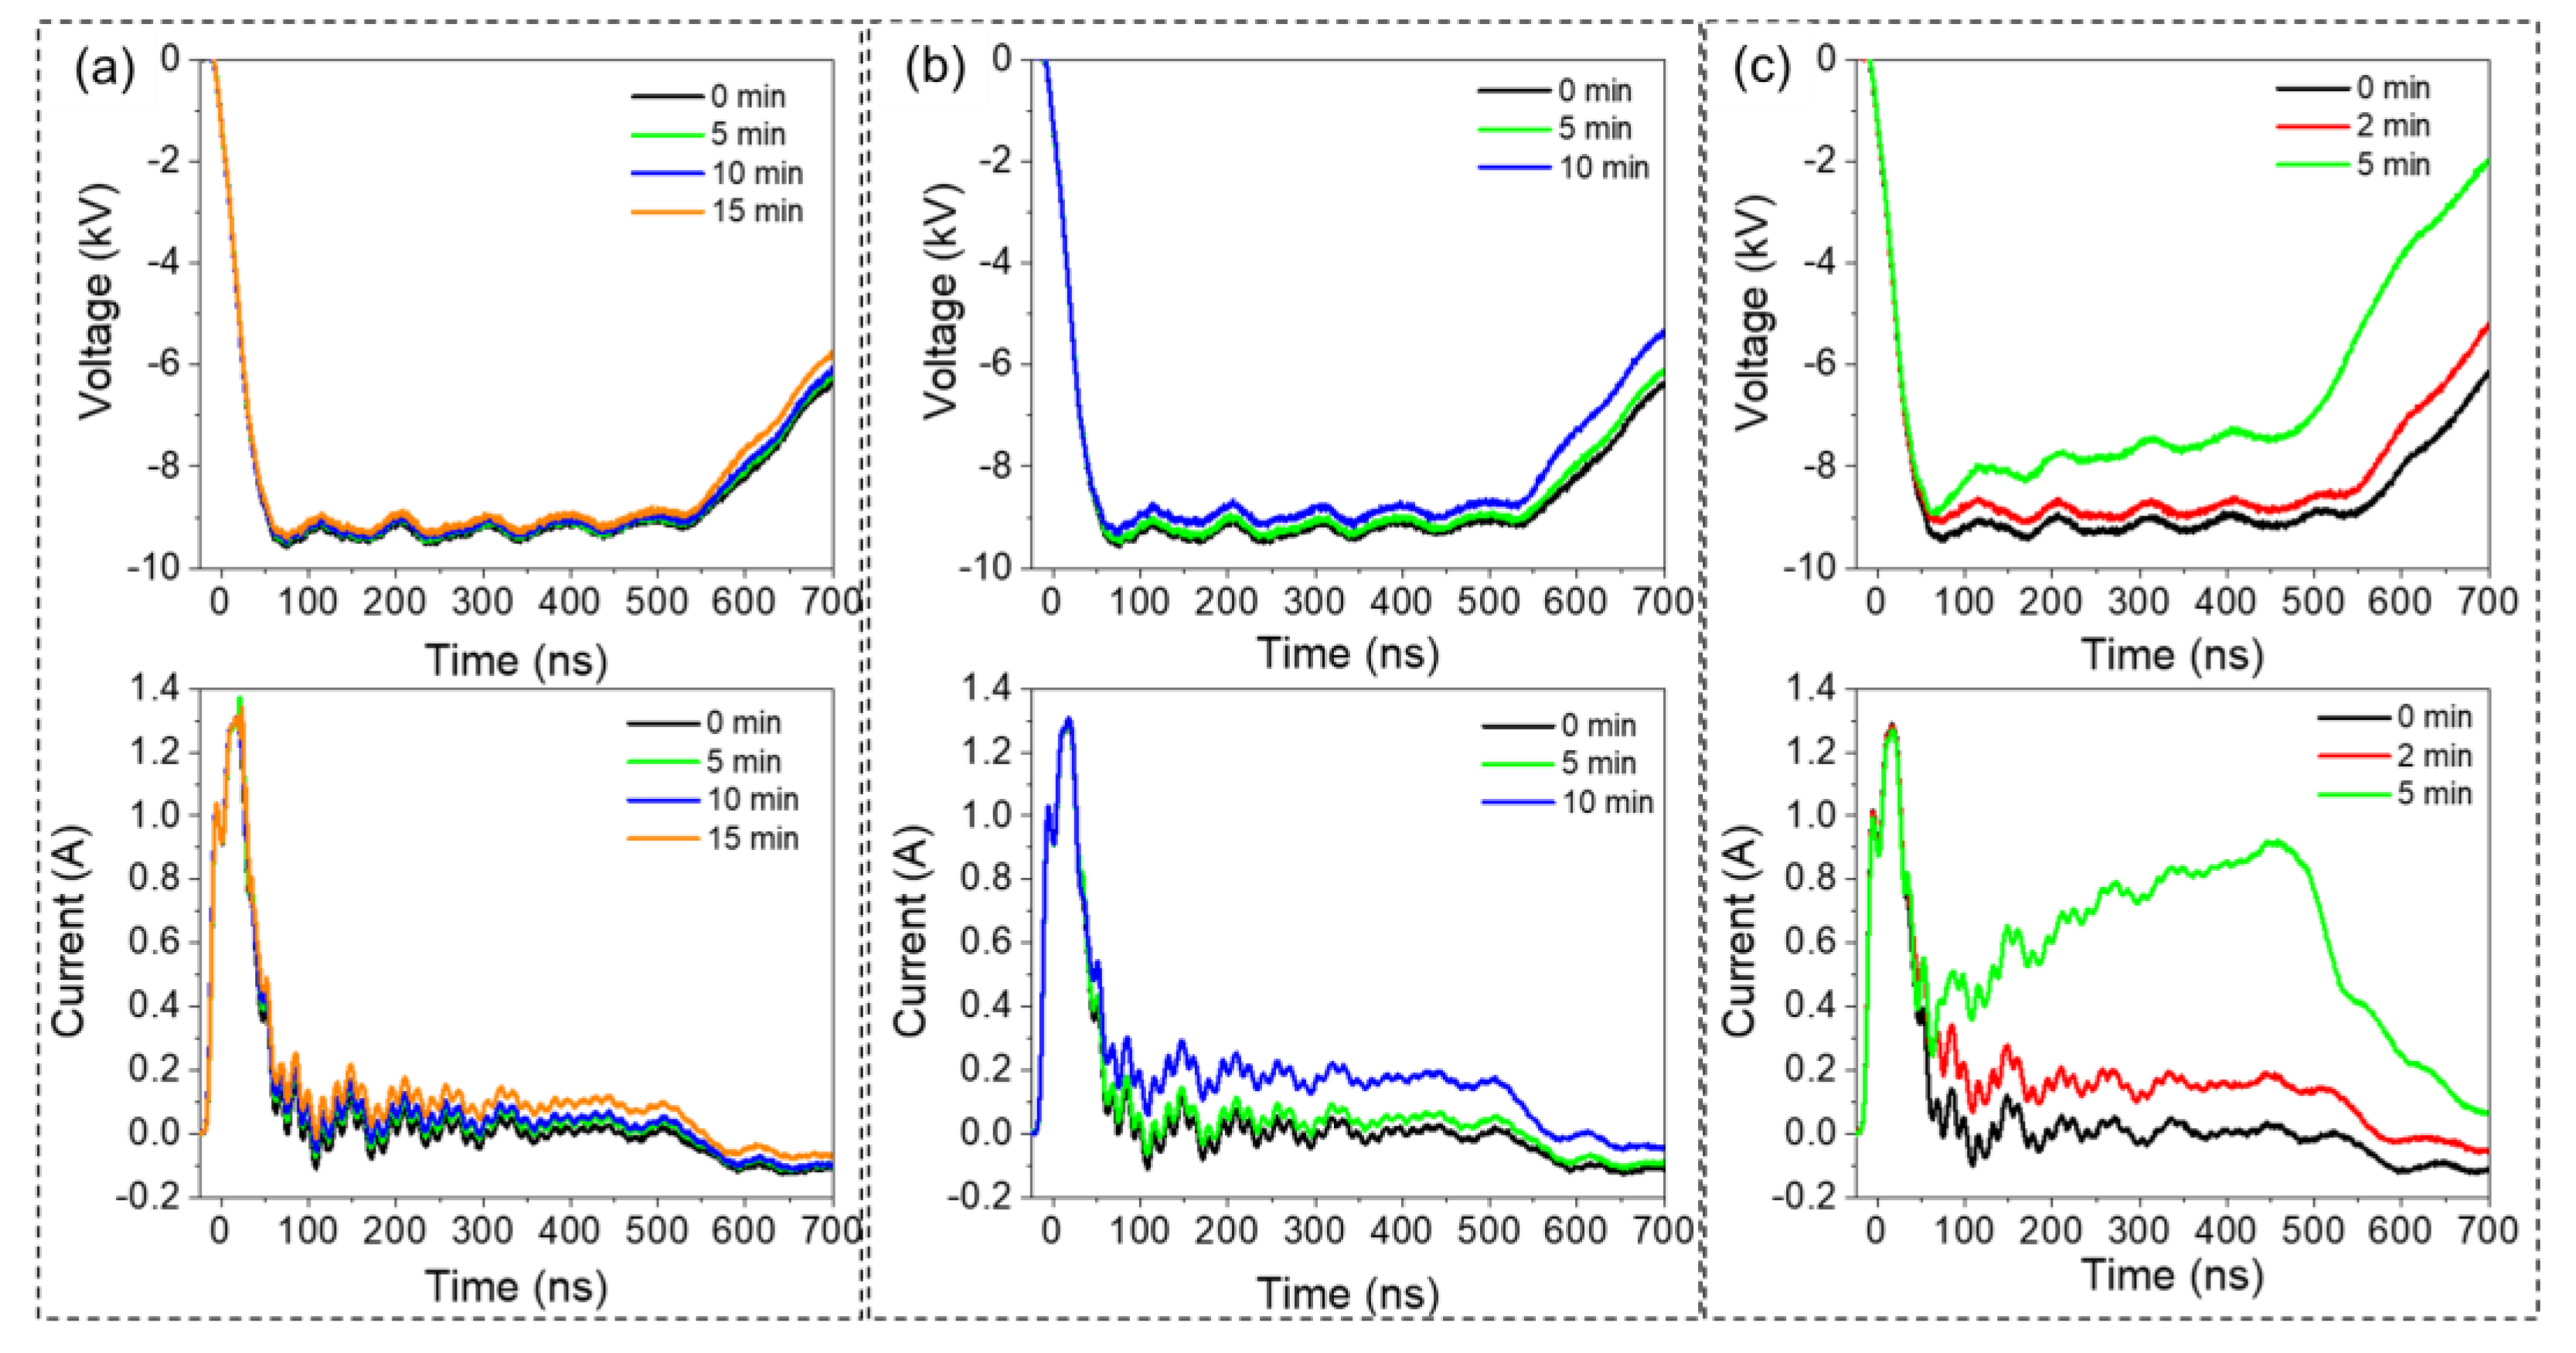
Figure 3a shows the voltage and current waveforms recorded after 0, 5, 10, and 15 min of discharge processing at 2 kHz. The figure indicates that the voltage waveforms do not present significant variation as a function of time. However, at 5 kHz (Figure 3b) and 10 kHz (Figure 3c), we notice a decrease (absolute value) in voltage amplitude (plateau zone) at longer times. For instance, at 5 kHz, the voltage drops by ~300 V after 10 min of processing, while at 10 kHz, the voltage drops by ~300 and ~1500 V after 2 and 5 min of processing, respectively. We also notice an increase in the current, which is correlated with the decrease in voltage. Note that the initial peak (at ~20 ns) corresponds to the displacement current induced by the voltage increase. At the end of processing, the current values (plateau zone) recorded at 2, 5, and 10 kHz increase by ~0.1, 0.3, and 0.9 A, respectively. Overall, greater temporal variations in the electrical waveforms are observed at higher frequencies. During the first two minutes of processing, the effect of frequency is negligible, and similar waveforms are recorded at 2, 5, and 10 kHz. Within this time period, the voltage plateau decreases by a few hundred volts, and the current increases by ~0.2 A, irrespective of the discharge pulse frequency. At longer processing times (>3 min), the current increases significantly to reach ~1 A at 5 min, and the voltage drops by ~2 kV. The transition from non-significant to significant variation in electrical discharge characteristics as a function of the processing time signifies a transition in the discharge mode from streamer-like to spark-like (in the following, only the term ‘spark’ is utilized). The plasma dynamics exhibit a similar transition at around 2–3 min (see Figure 2), as confirmed by the optical emission spectroscopy data discussed below. The change in discharge mode may be correlated with the increase in water electrical conductivity, which in turn is attributed to the enrichment of water with ionic species (e.g., nitrate, nitrites, etc.). The increase in water electrical conductivity can be also inferred from the rapidly falling time of the pulse (~500–700 ns period).
As shown in Table 1, the conductivity increases from 2 to 333 μS/cm after 5 min of processing at 10 kHz. At 5 and 2 kHz, the conductivity increases to 215 and ~40 μS/cm after 10 and 15 min, respectively. The ionic species produced by discharge processing also increase the acidity of the water. As reported in Table 1, the pH decreases from 5.6 to 4.2, 3.7, and 3.2 after processing at 2, 5, and 10 kHz, respectively.
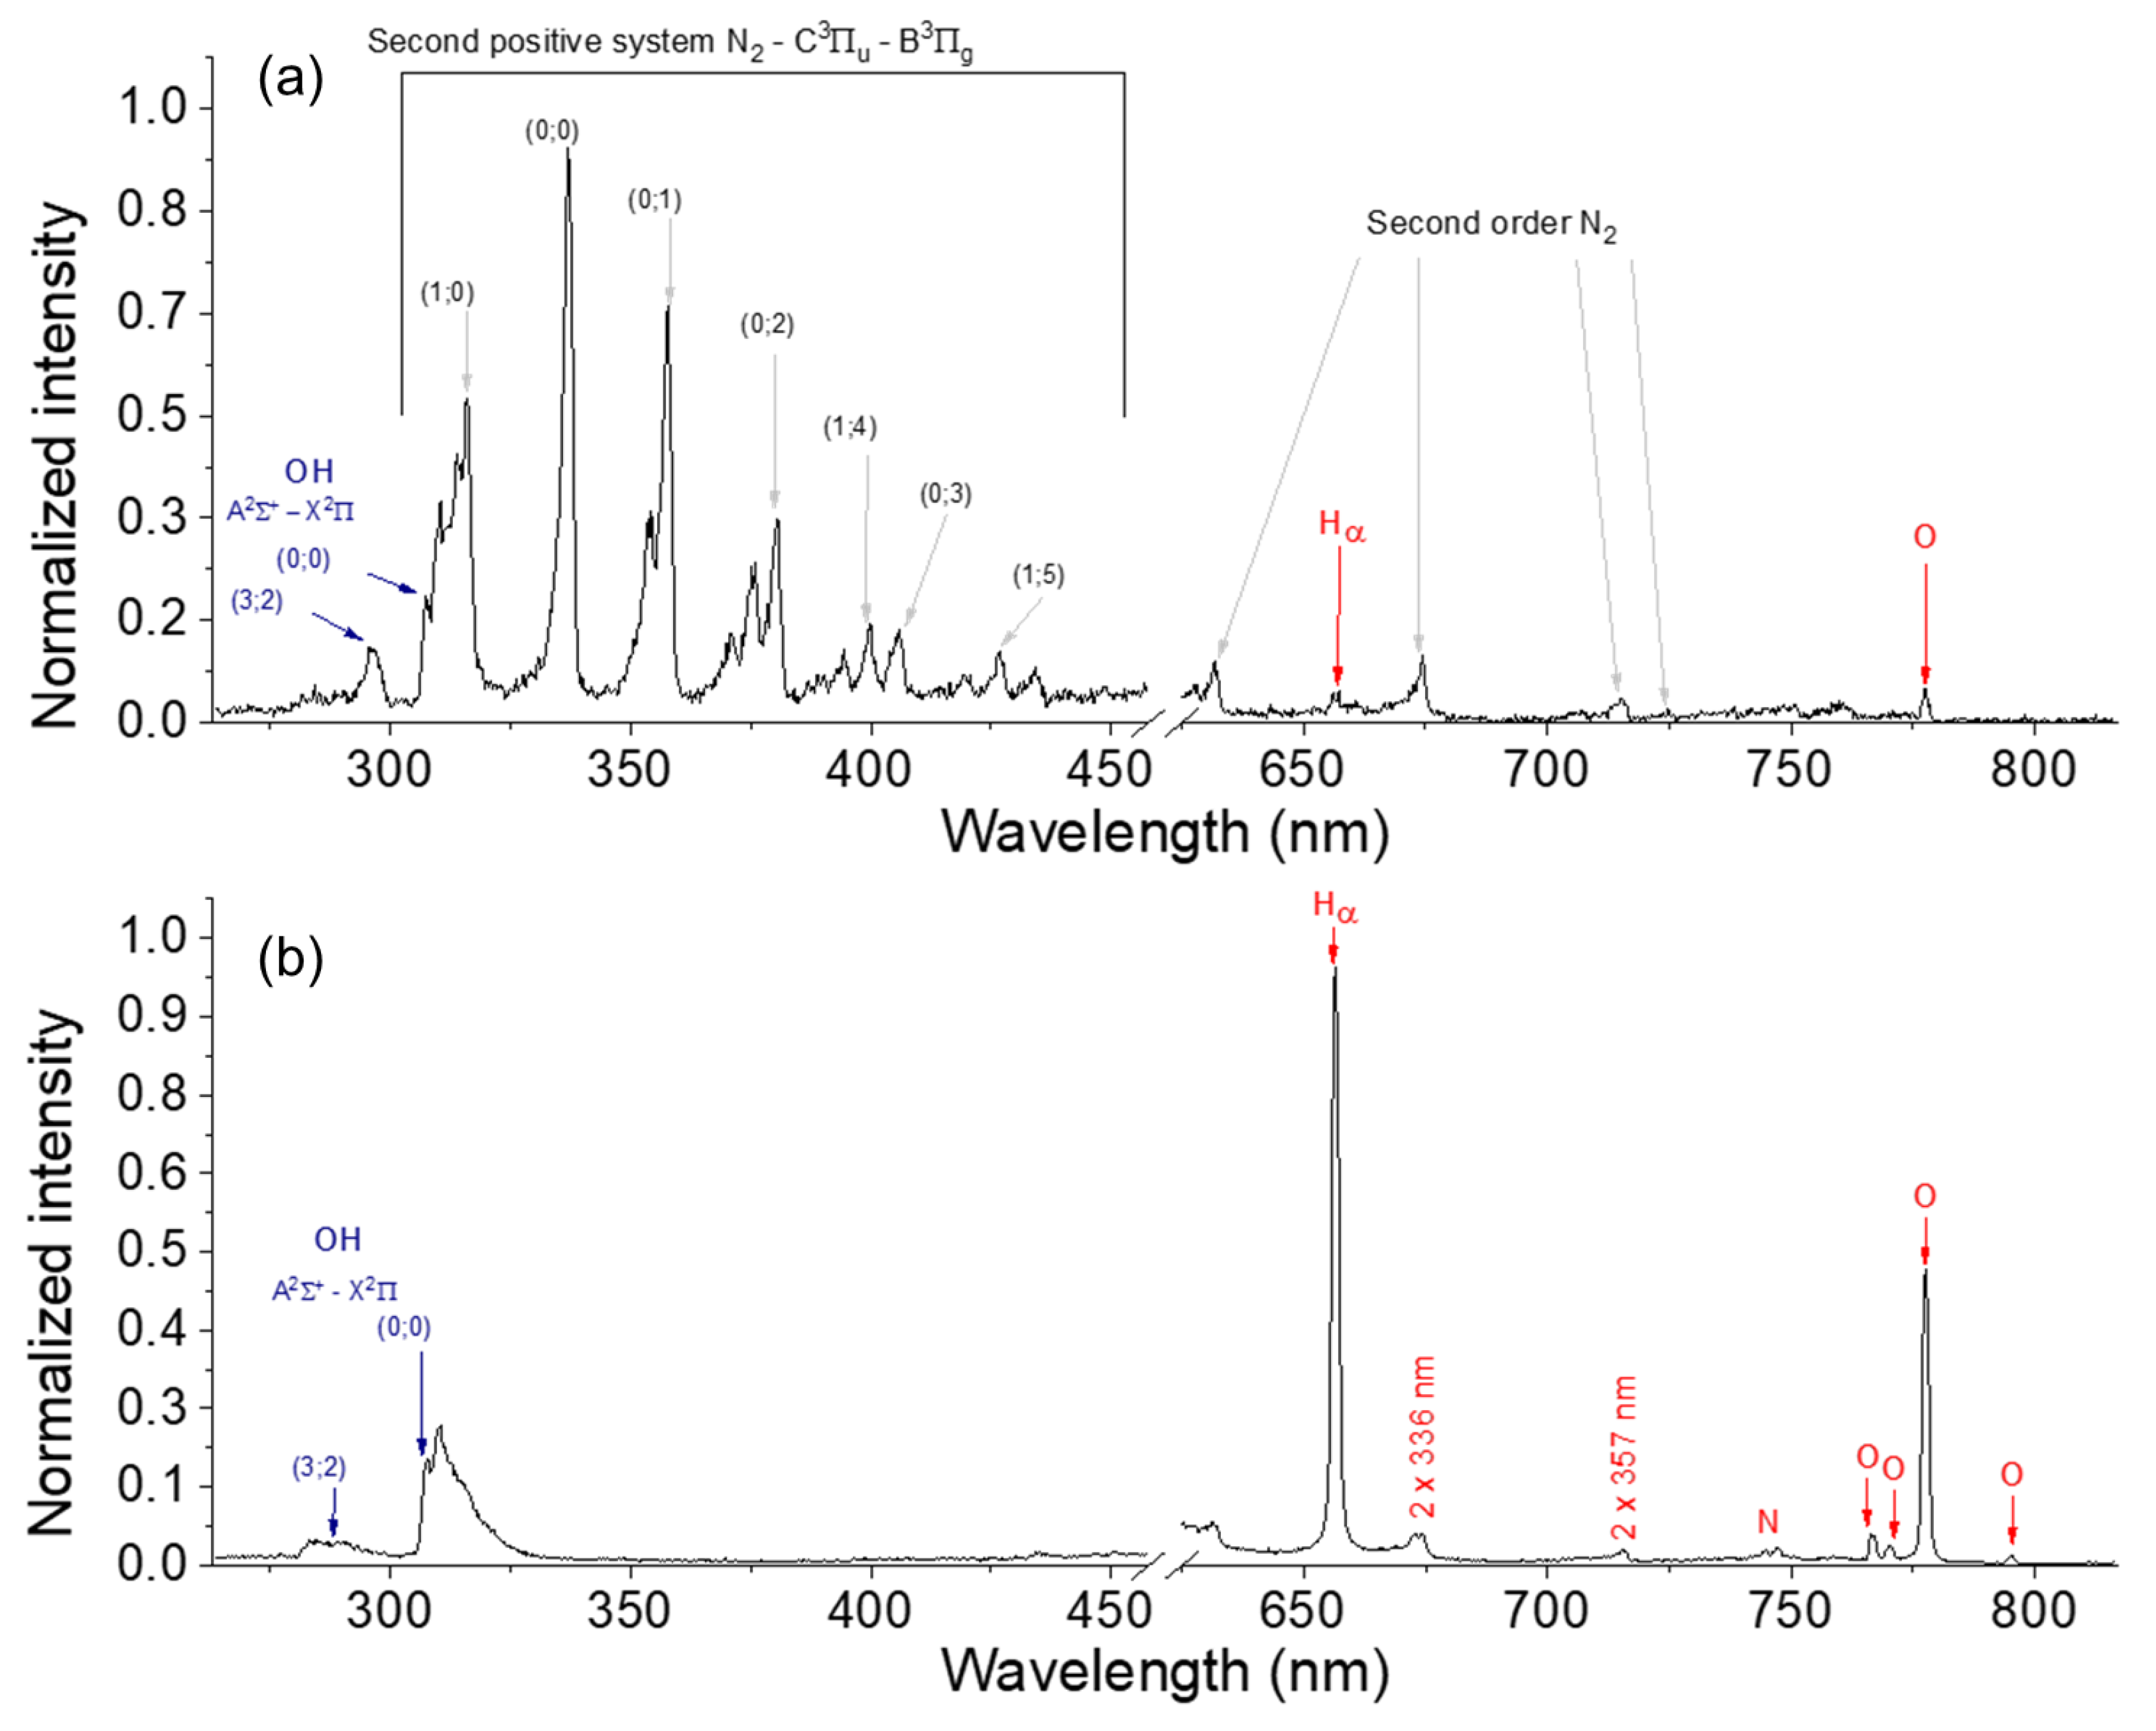
The emitting species in the discharge were identified using optical emission spectroscopy. Considering that the spectra acquired at 2 and 5 kHz are similar to those recorded at 10 kHz (t < 3 min), only the latter are discussed here. Figure 4a,b show the emission spectra measured at t < 3 min (i.e., in streamer mode) and at t > 3 min (i.e., in spark mode), respectively. In streamer mode, the spectrum is dominated by the emission signals of the plasma-excited molecular nitrogen (N2 second positive system) present in air. Low-intensity Hα, O, and OH bands are also detected. In spark mode, N2 emissions almost disappear, and Hα, O, and OH bands dominate the spectrum. These species originate from the dissociation of water vapor, and their emission signals are dominant in the spark discharge spectrum. Therefore, it may be concluded that the streamer discharge is mainly composed of air, while the spark discharge primarily consists of water vapor; a further discussion on the plasma kinetics in different modes is provided below. The change in discharge composition at 2–3 min is in agreement with the video images and discharge electrical characteristics supporting a transition from streamer to spark mode. Note that no carbonaceous species (e.g., C2, CH, C, etc.) are detected by emission spectroscopy, regardless of the discharge mode.
At this stage, it is important to compare the results with those obtained without PS. Indeed, in a recent study [30], we investigated the evolution of the plasma properties of a discharge in contact with water without PS and reported a rise in gas temperature, as well as an increase in water conductivity and acidity during plasma processing. The water volume was higher than the one here (50 vs. 10 mL) and, therefore, a complete transition to a spark was not reached; there was only a partial transition. Furthermore, with the processing time, the authors observed an increase in the discharge current, an increase in the N2 emission signals in streamer mode before the transition to spark mode (the data were not reported for the spark regime), and an increase in the rotational temperature of the N2 molecule. This similarity suggests that the PS plays a non-significant role in the discharge kinetics that is rather sensitive to the water’s characteristics. In another study that addressed the interaction of a similar discharge with a suspension of crystalline nanocellulose (CNC) [31], a similar behavior was also observed, despite the fact that after processing, the CNC was gelled. This is an interesting finding as it suggests that the streamer-to-spark transition can be controlled by adjusting the solution properties, and this feature can be further explored in a future process to maintain the ‘constant’ action of plasma exhibiting different properties (streamer or spark) on the PS sample [31,32,33].
3.2. Discharge-Induced Degradation of PS
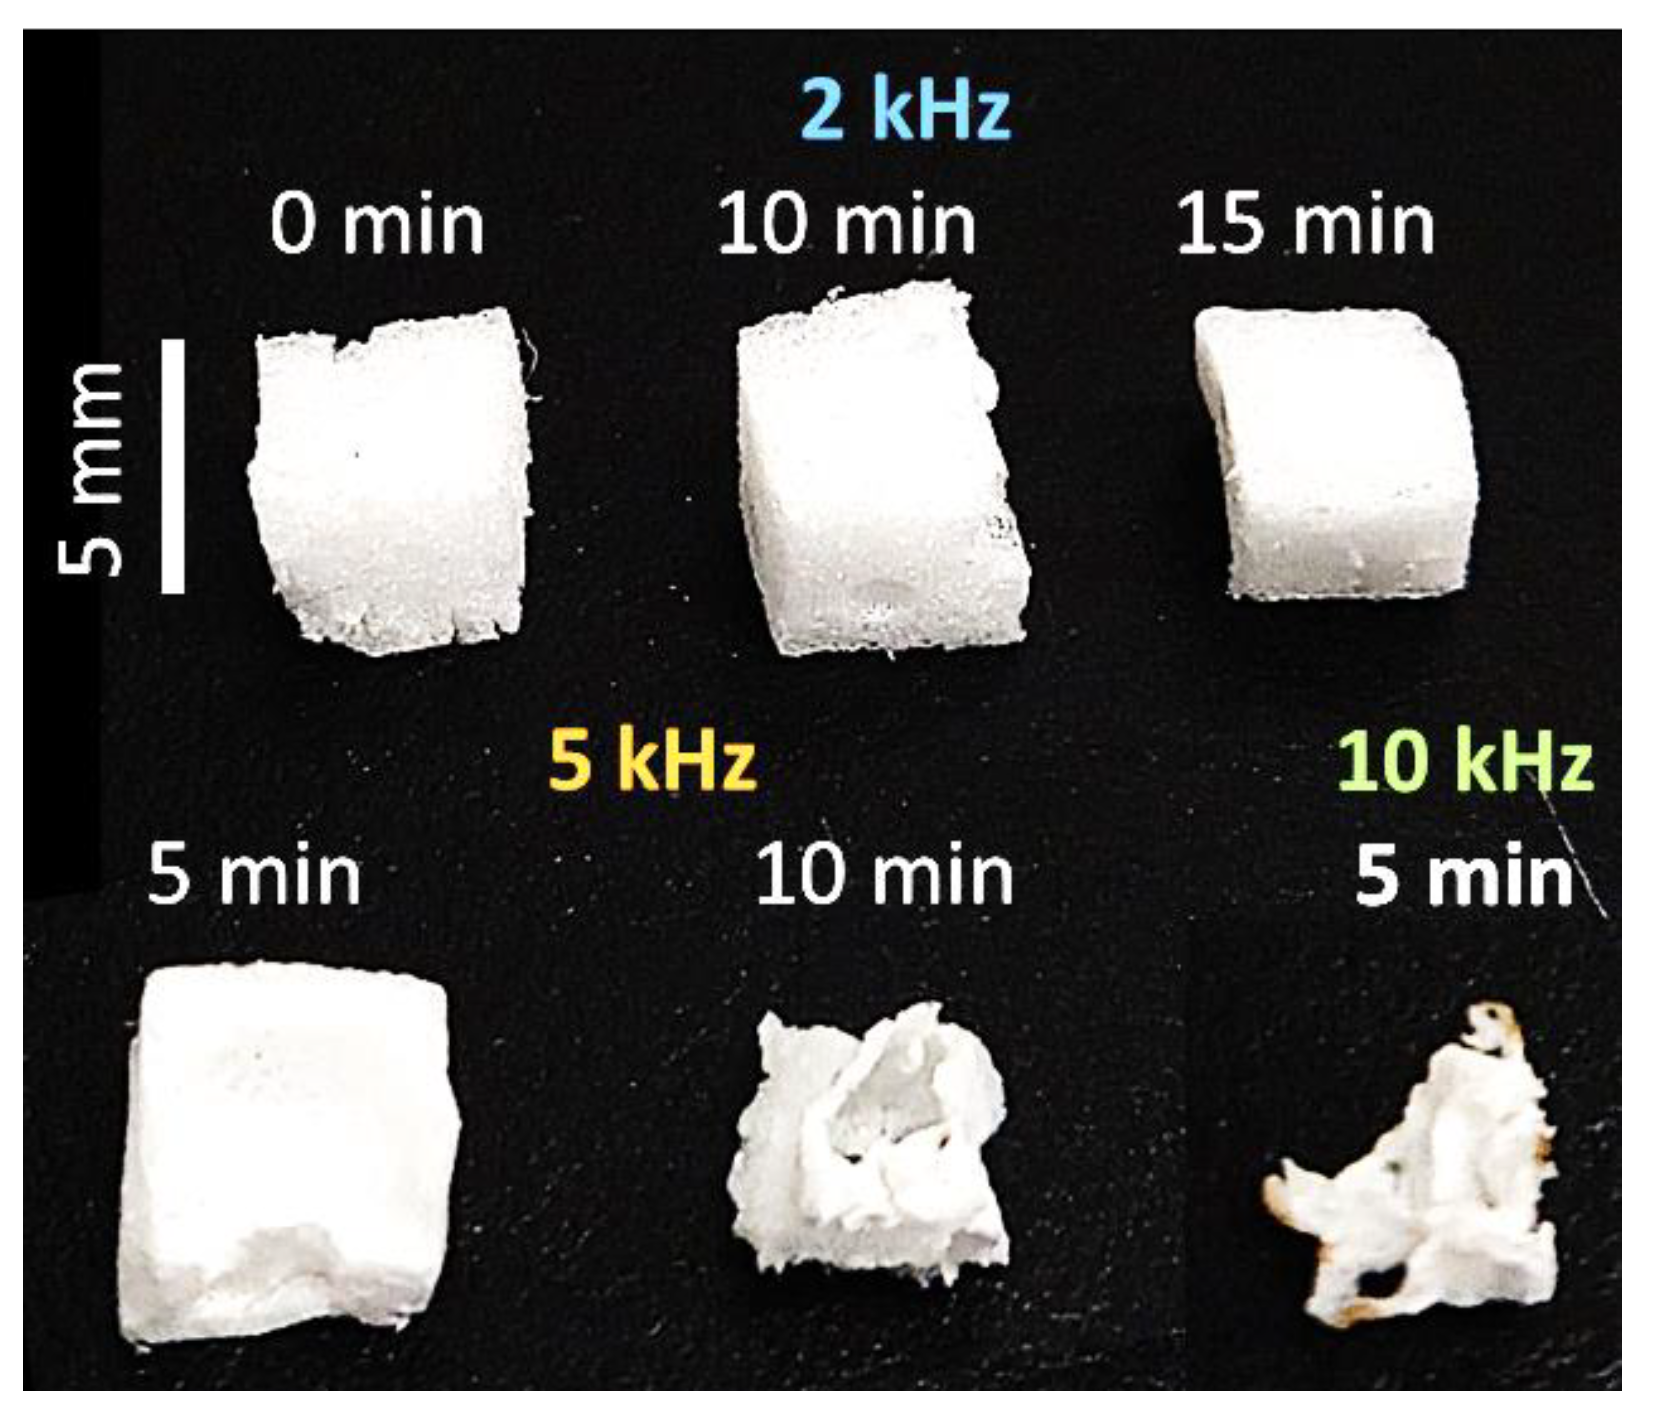
The degradation of PS was assessed visually, as well as by measuring the weights and recording the FTIR spectra of the PS samples before and after processing. Our visual assessment of the images recorded using a standard camera shows that the sample exposed to a 2 kHz discharge exhibits no significant change in structure, even after 15 min (Figure 5). Meanwhile, a part of the sample processed at 5 kHz disappears after 5 min of processing, and its shape changes completely to a crumbled film after 10 min. A similar film-like structure is also observed for the PS sample processed at 10 kHz, after only 5 min. A complete degradation of the PS is not detected, as the samples move away from the discharge area after their shape changes.
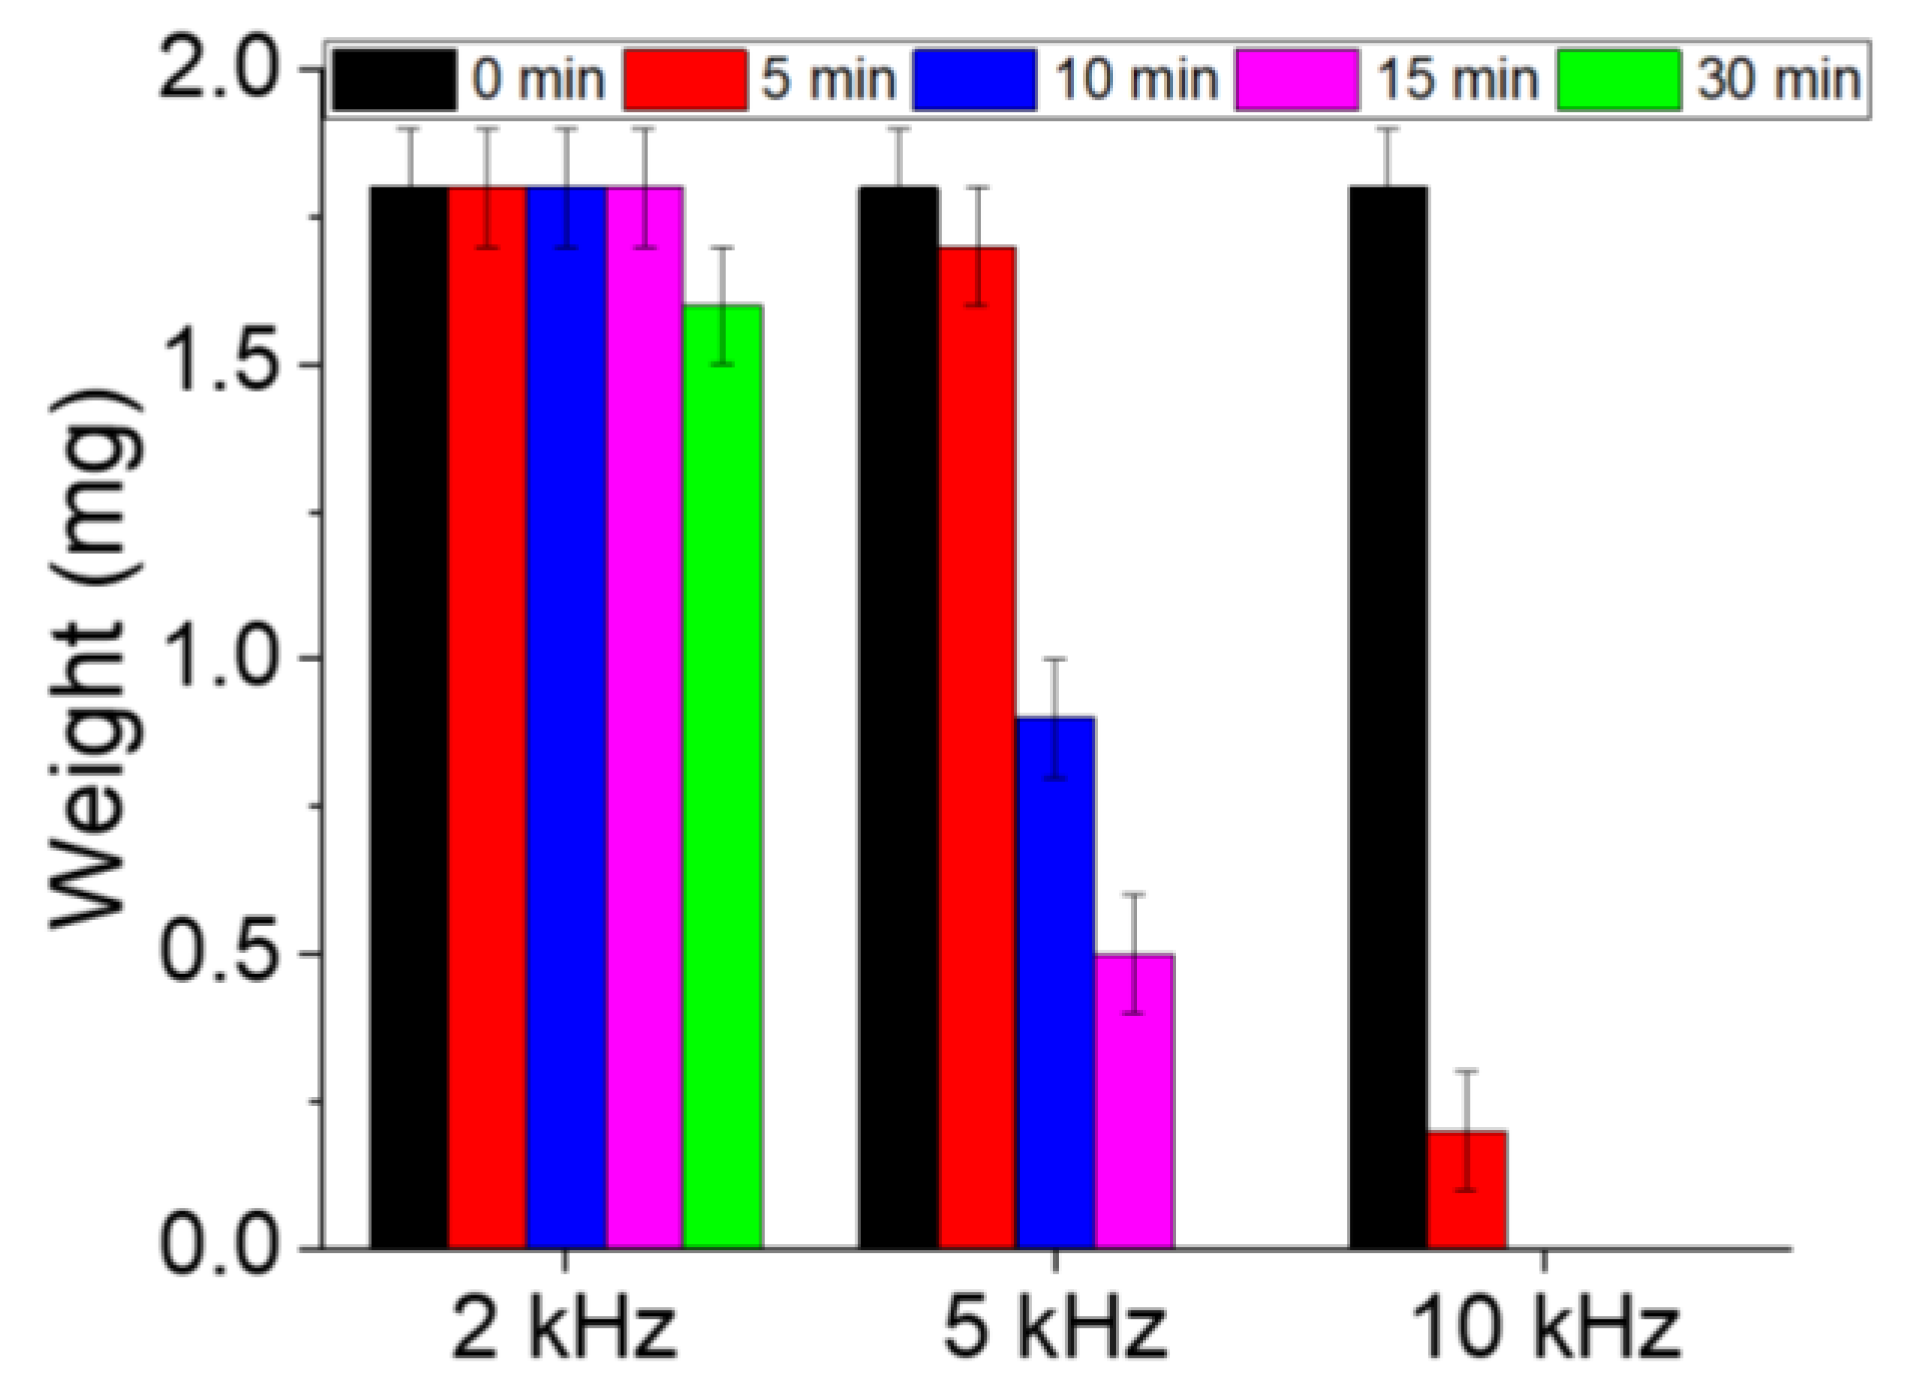
The weights of the PS samples were measured before and after processing using a precision balance. Prior to weighing, the processed samples were dried to ensure the complete removal of the water. As shown in Figure 6, the weight of the sample processed at 2 kHz does not significantly change after 15 min of processing, and weight loss is observed only after 30 min. In contrast, the weight of the 5 kHz sample decreases from 1.8 ± 0.1 mg before processing to ~1.7 ± 0.1 and ~0.9 ± 0.1 mg after 5 and 10 min of discharge exposure, respectively. At 10 kHz, the decrease in the PS sample weight becomes more significant, and an ~83% weight loss is achieved within 5 min only (i.e., the sample weight reached ~0.3 ± 0.1 mg). Based on these results, it may be concluded that the degradation efficiency of PS increases with the increasing discharge frequency in the range of 2–10 kHz. At this stage, it is important to compare the efficiency with some other techniques. For instance, García-Muñoz et al. [21] applied a TiO2-based photocatalysis technique and showed that 80% of the organic carbon present in the polymeric nanomaterials is converted to CO2 after 96 h of UV radiation. Kiendrebeogo et al. [20] applied the electro-oxidation technique and reached a degradation efficiency of 90% after 6 h of processing. The study presented here is more advantageous in terms of degradation (at least in terms of the mass reduction), but the identification of final products remains one of the essential elements to adopt a process to degrade MP.
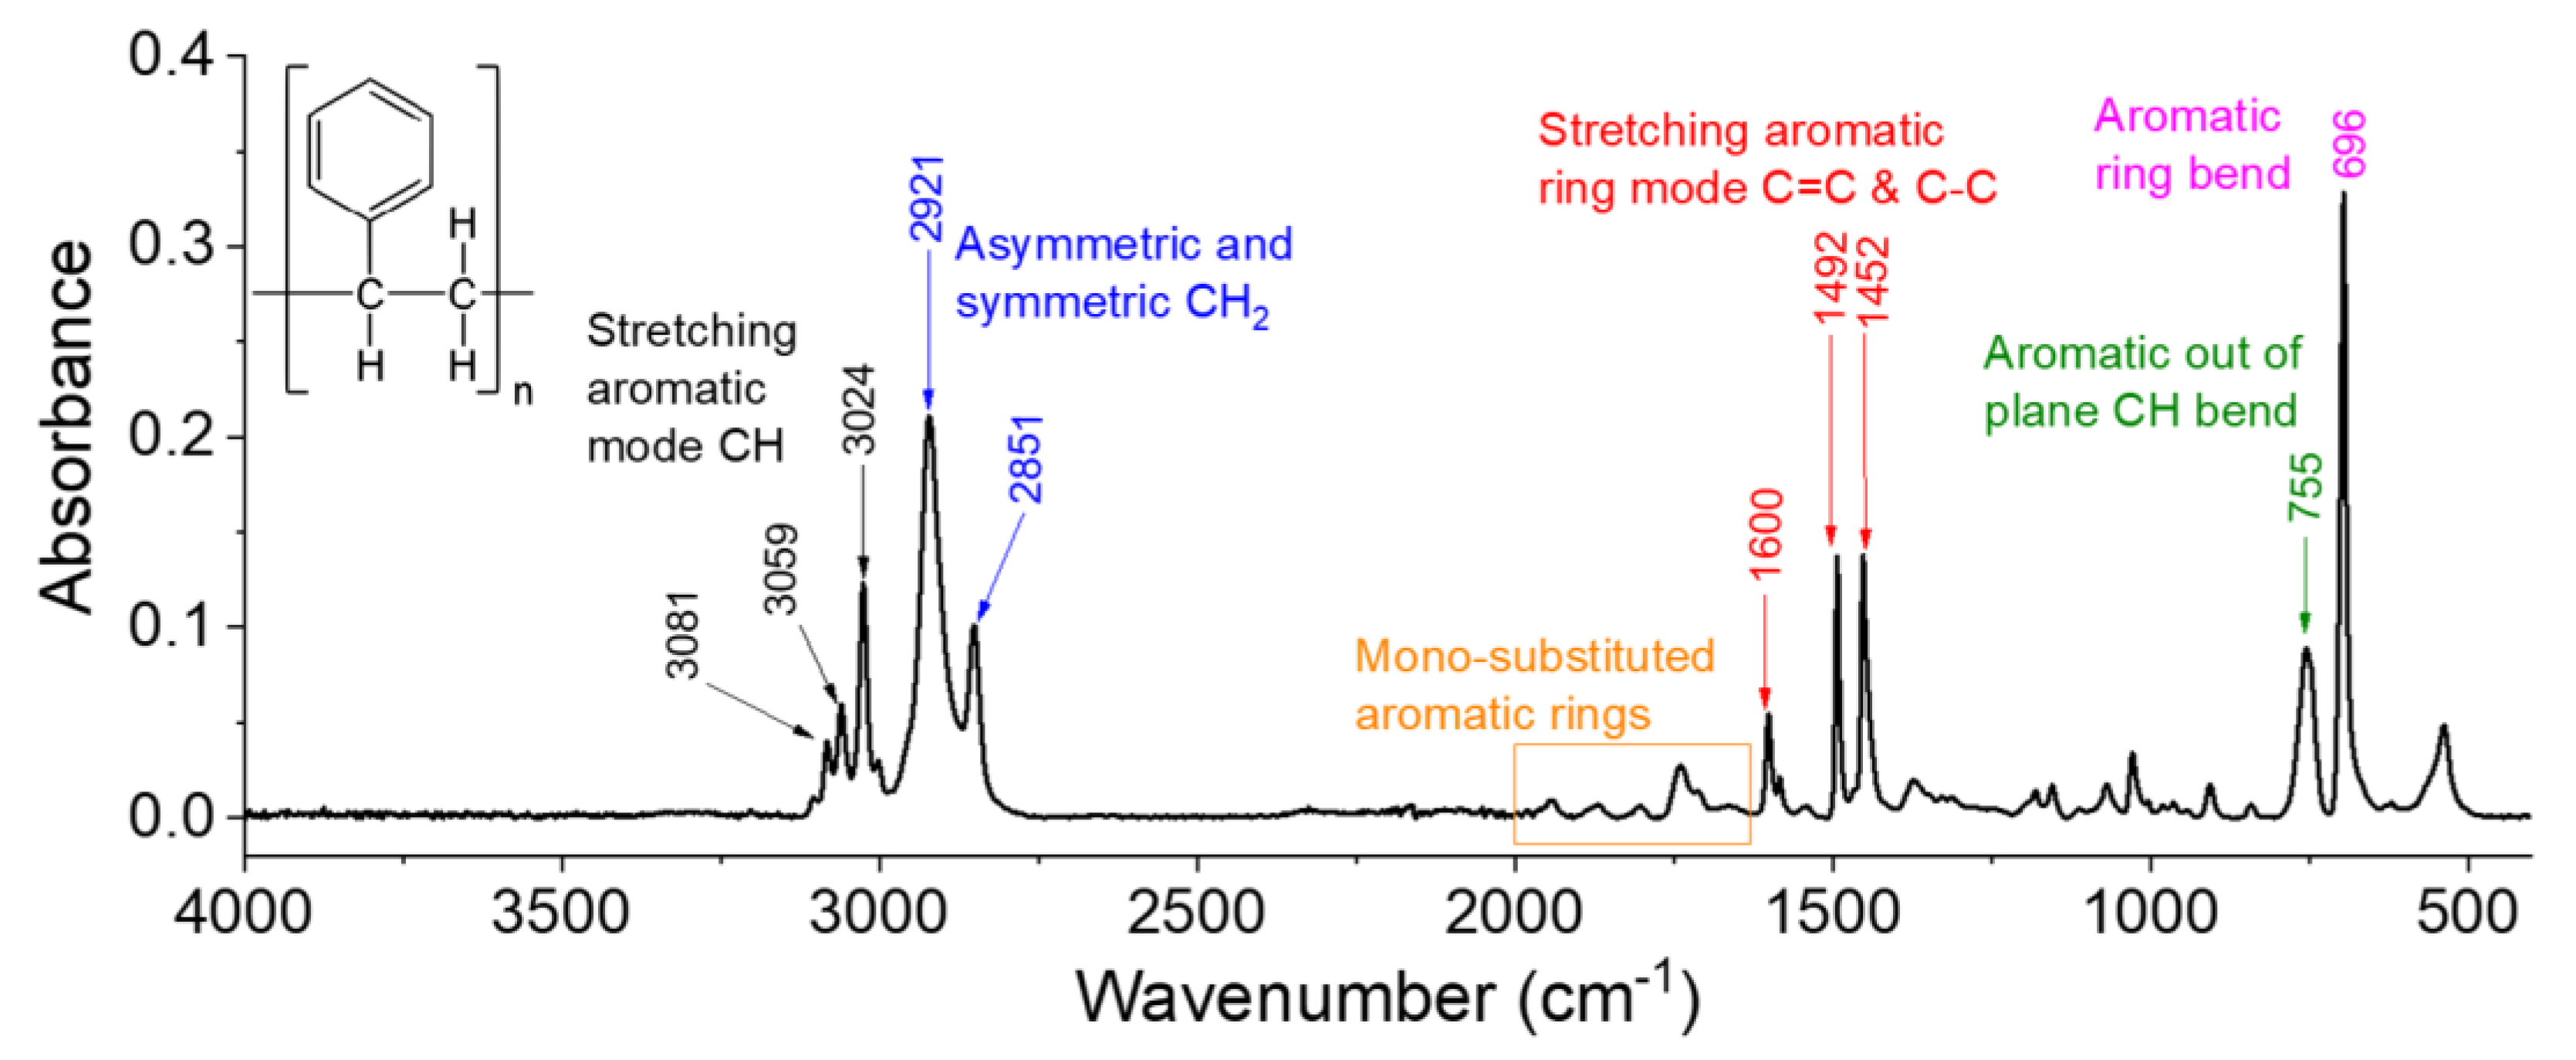
Plasma-induced changes in the composition of the PS were analyzed by recording the FTIR spectra of the samples processed at different frequencies before and after discharge exposure. Figure 7 depicts the spectrum of the unprocessed sample, which is dominated by aromatic ring signals, including the vibrations of aromatic –CH, C=C, and C–C bonds [34]. Herein, the spectrum is decomposed into three regions, and a comparison with the processed samples’ spectra is made for each region.
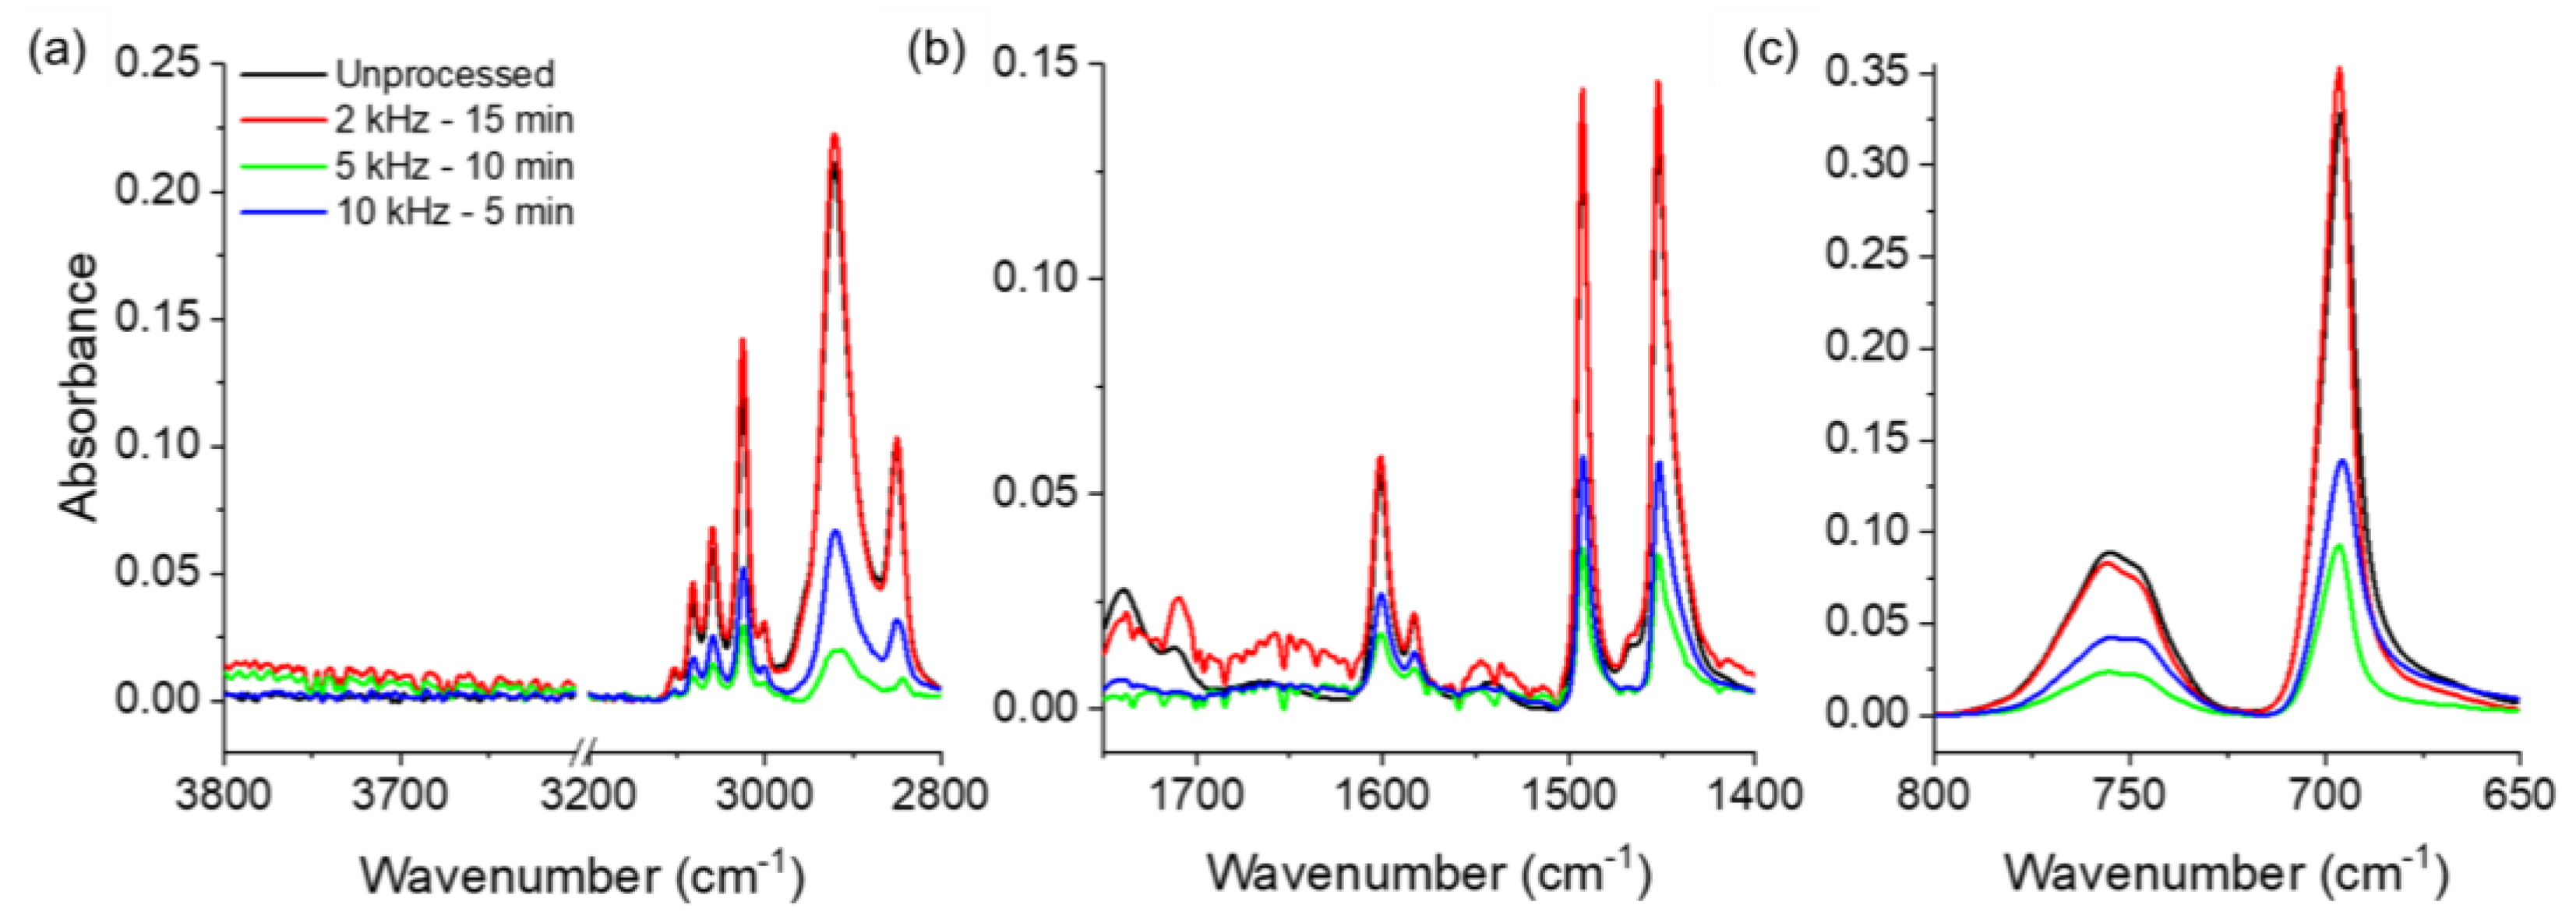
Figure 8 compares the FTIR spectra of PS samples processed under different conditions to those of an unprocessed sample. In general, the same absorption peaks are observed in all spectra; however, the intensities of these peaks decrease after processing, except in the case of processing at 2 kHz for 15 min. This indicates that the chemical structure of PS is not altered by the discharge (no bonds are broken or formed) prior to degradation. After processing at 2 kHz, the peak intensities do not change, and thus, the PS does not degrade, which is in agreement with the weight results discussed above. Meanwhile, processing at 5 or 10 kHz induces a significant decrease in the intensities of all vibrational signals. At this point, it should be noted that ATR-FTIR spectroscopy probes the surface of the PS sample, with a penetration depth of ~1 μm (more or less) [35]. In fact, despite the loss in weight and volume, the analyzed samples completely covered the FTIR window, which means that the decrease in intensity cannot be attributed to the mass variation. Instead, it is related to a change in the morphology of the sample, i.e., the porosity and irregularities on the surface, as shown in Figure 5. Finally, a comparison of the 5 and 10 kHz processed sample spectra reveals that the intensities detected in the latter are slightly higher than those observed in the former. Such variation may also be related to the morphology and roughness of the treated sample.
Overall, the results presented in this study demonstrate that PS can be effectively degraded by discharge processing at a high frequency (10 kHz). Therefore, the following discussion will focus solely on the 10 kHz processing case. The major difference between this case and the lower-frequency cases is the streamer-to-spark transition correlated with the increase in water electrical conductivity (from ~2 to 333 µS/cm) due to water enrichment with NO2− and NO3−, among other species.
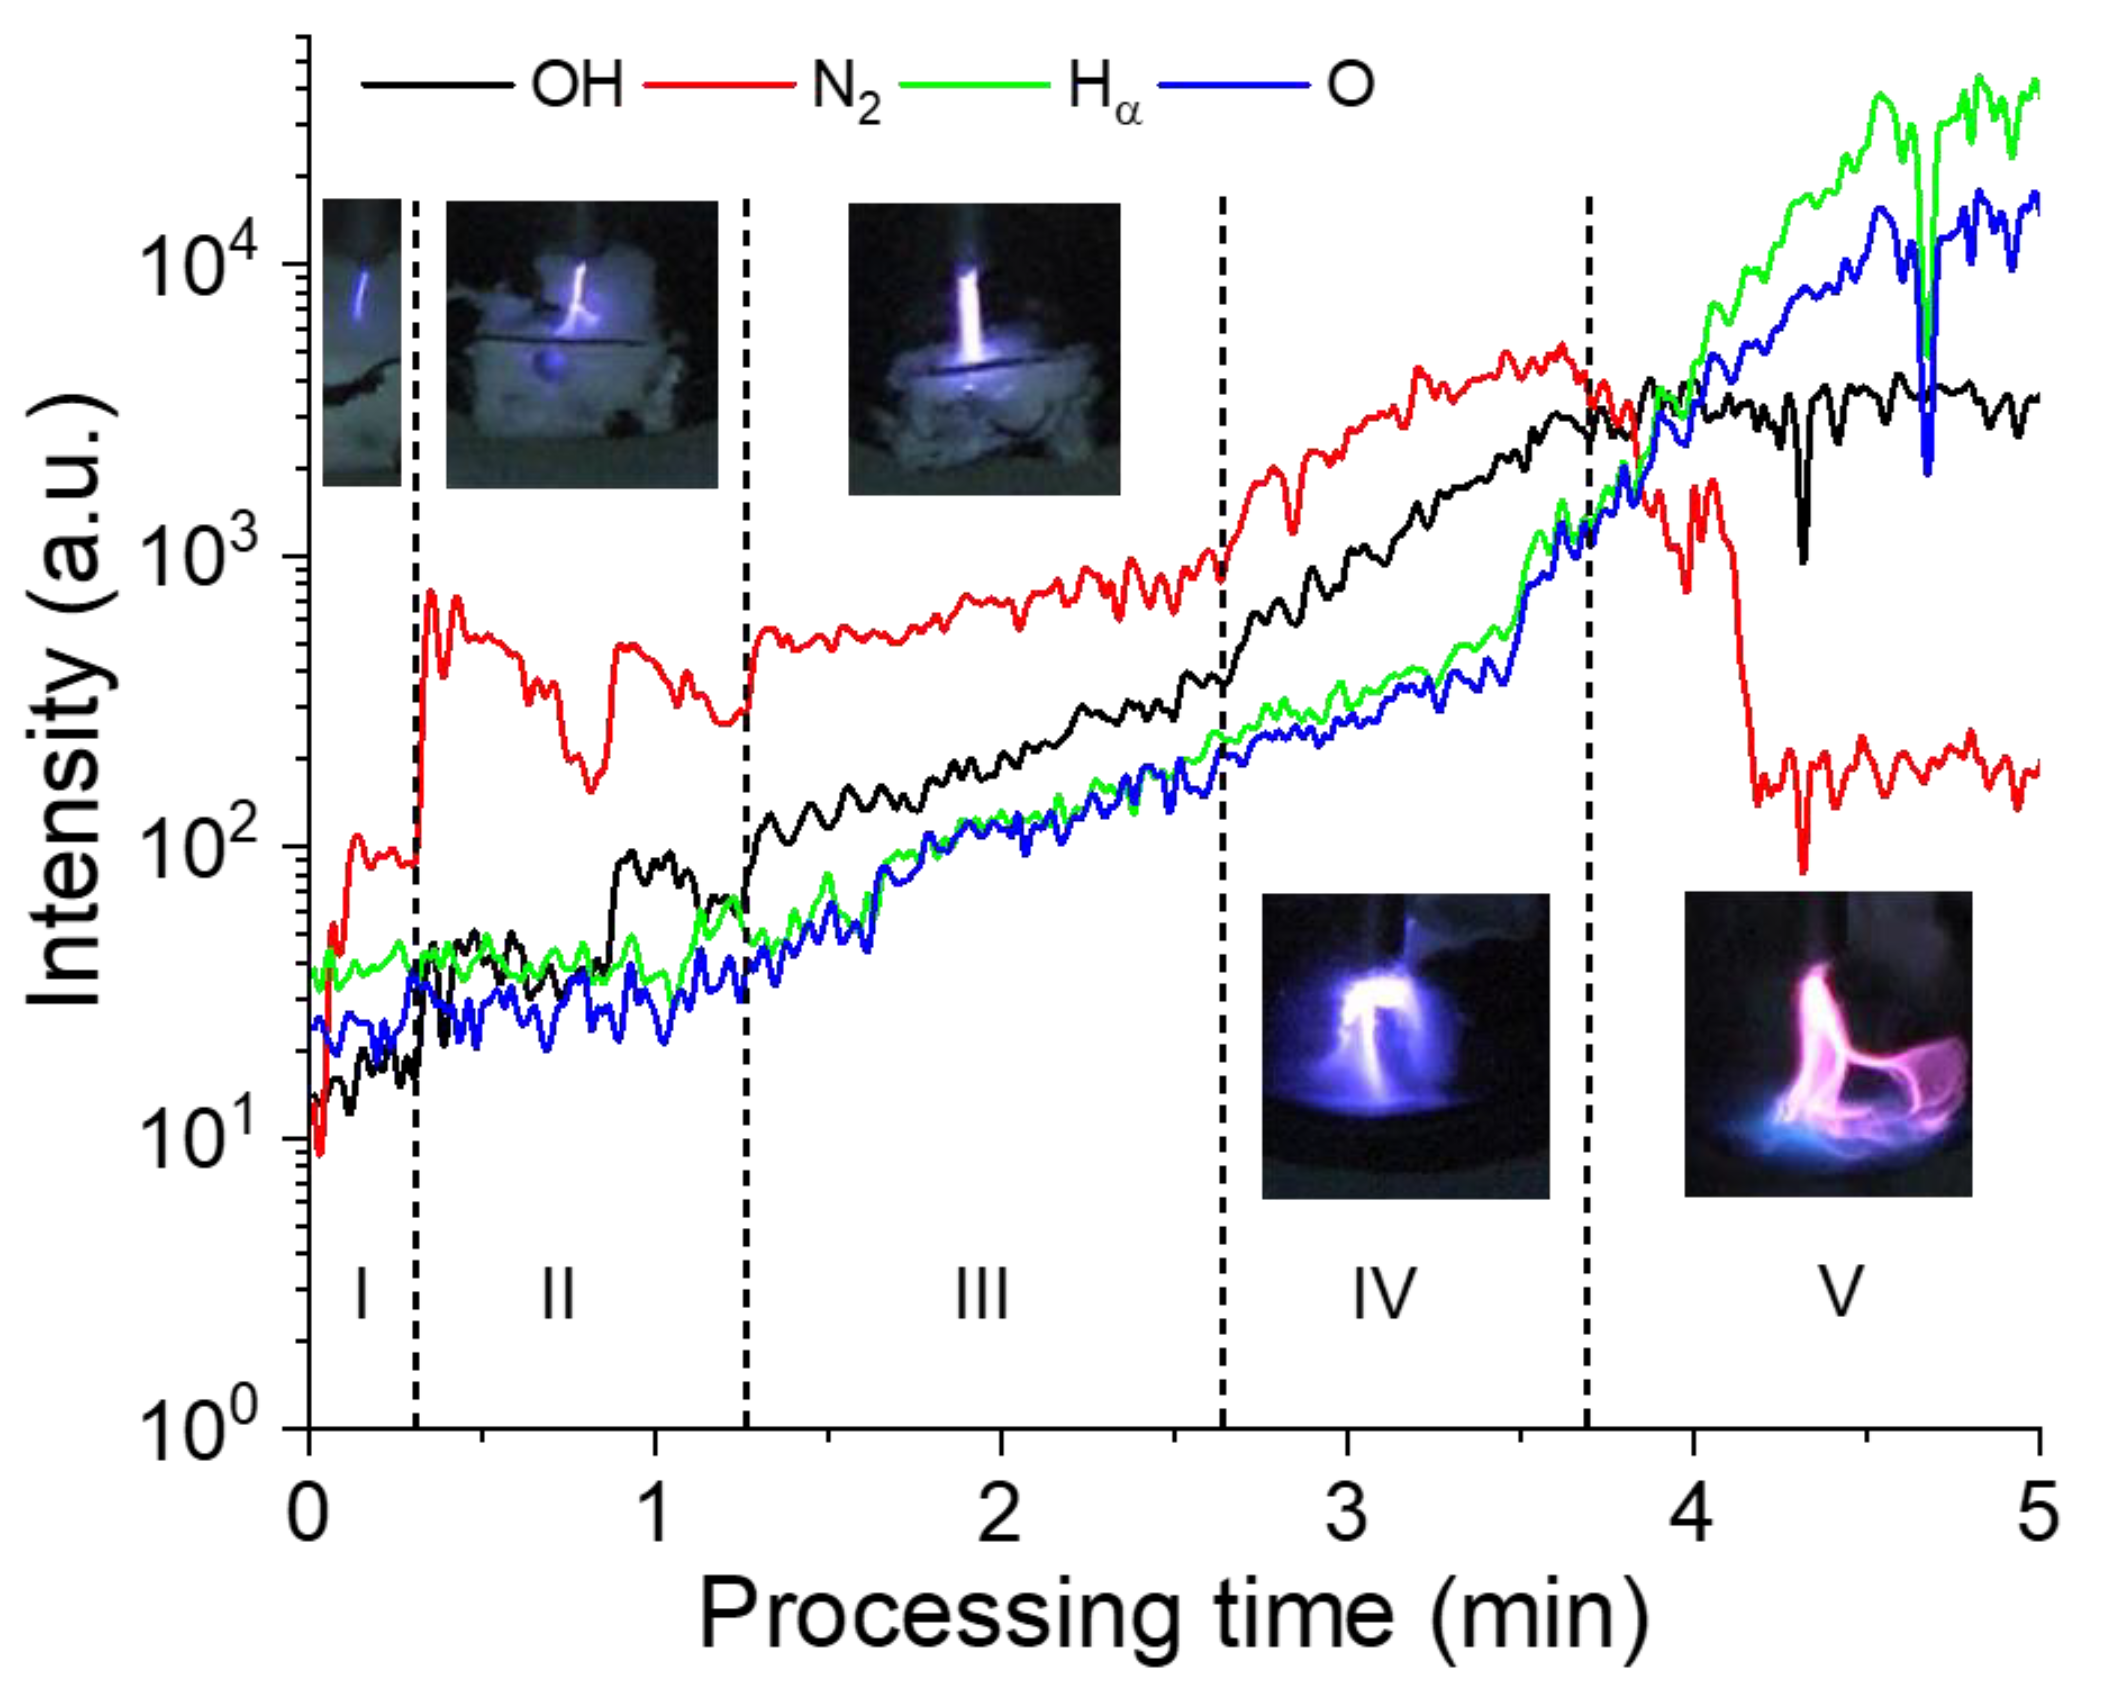
Temporal correspondence is established between the visual aspect of the discharge (based on video recordings), the PS degradation process, and the emitting species. The evolution of these species is derived from time-resolved optical emission spectra, and the evolution profiles of specific line intensities (atomic and molecular), namely OH (at 309 nm), N2 (from 315 to 350 nm), Hα (at 656.3 nm), and O (at 777 nm), are presented in Figure 9.
As mentioned earlier (Figure 2), the discharge is initially ignited in streamer mode, and the filaments propagate at the surface of the PS. During this first phase (Phase I; ~20 s), emission signals of different atomic and molecular species are detected (OH, O, H, and N2), and the N2 lines exhibit the highest intensity. The second phase (Phase II; ~20–70 s) also corresponds to the streamer mode, and it is similar to phase I, but with more filaments propagating at the PS surface. In this phase, the intensity of the N2 emission line is almost one order of magnitude higher than that of other emission signals. In phase III (~70–160 s), the discharge remains as streamer, and the first signs of PS degradation are observed (i.e., the modification of the PS surface). During this phase, the number of plasma filaments increases further and so does the water temperature (to almost boiling). Compared to Phases I and II, higher emission intensities are detected in Phase III, and N2 continues to be the dominant species. Phase IV (160–220 s) is similar to Phase III, i.e., there is a further increase in emission line intensities with a significant decrease in PS size, and in Phase V (220–300 s), the plasma touches the water surface and the discharge transitions to spark mode, resulting in a significantly increased evaporation rate and altered gas composition. This is evidenced by the dominancy of the O, H, and OH lines in the Phase V emission spectrum. During this final phase, the PS sample can move freely on the water surface due to its appreciably reduced size, and thus interaction with the plasma is minimized, leading to a lower degradation rate. In summary, the PS sample interacts with a streamer-like discharge at ~3.5–4.0 min and then at ~1.0–1.5 min with a spark-like discharge.
At this stage, it is important to explain the evolution of the plasma composition with the processing time, in particular, the difference between the streamer and spark discharges. Indeed, the major difference between the streamer and spark discharge modes is that sparks have a higher temperature. Therefore, when the discharge transits from a streamer to a spark, the temperature increases, thereby promoting the evaporation of water. As the acquired spectra showed, the emission of the discharge is closely related to the discharge mode. It is well accepted that during the establishment of a streamer, the gas temperature increases due to the quenching of electronically excited species (N2*) by other molecules, such as O2 and H2O, which induces their dissociation. Also, it is reported that in the streamer phase, an important portion of the energy is loaded into the vibrational mode of N2 molecules [36,37,38], which explains the high intensity of N2 bands in the streamer mode. The high vibrational excitation of N2 may increase the electron energy through de-excitation by collision with electrons [39]. These effects in the streamer phase initiate gas dynamic processes that decrease the gas density and enhance thermal ionization [40]. Therefore, the discharge transits to a spark, resulting in the decreased emission of N2 and increased emission of atomic species, such as H and O, which is in good agreement with the experimental observation.
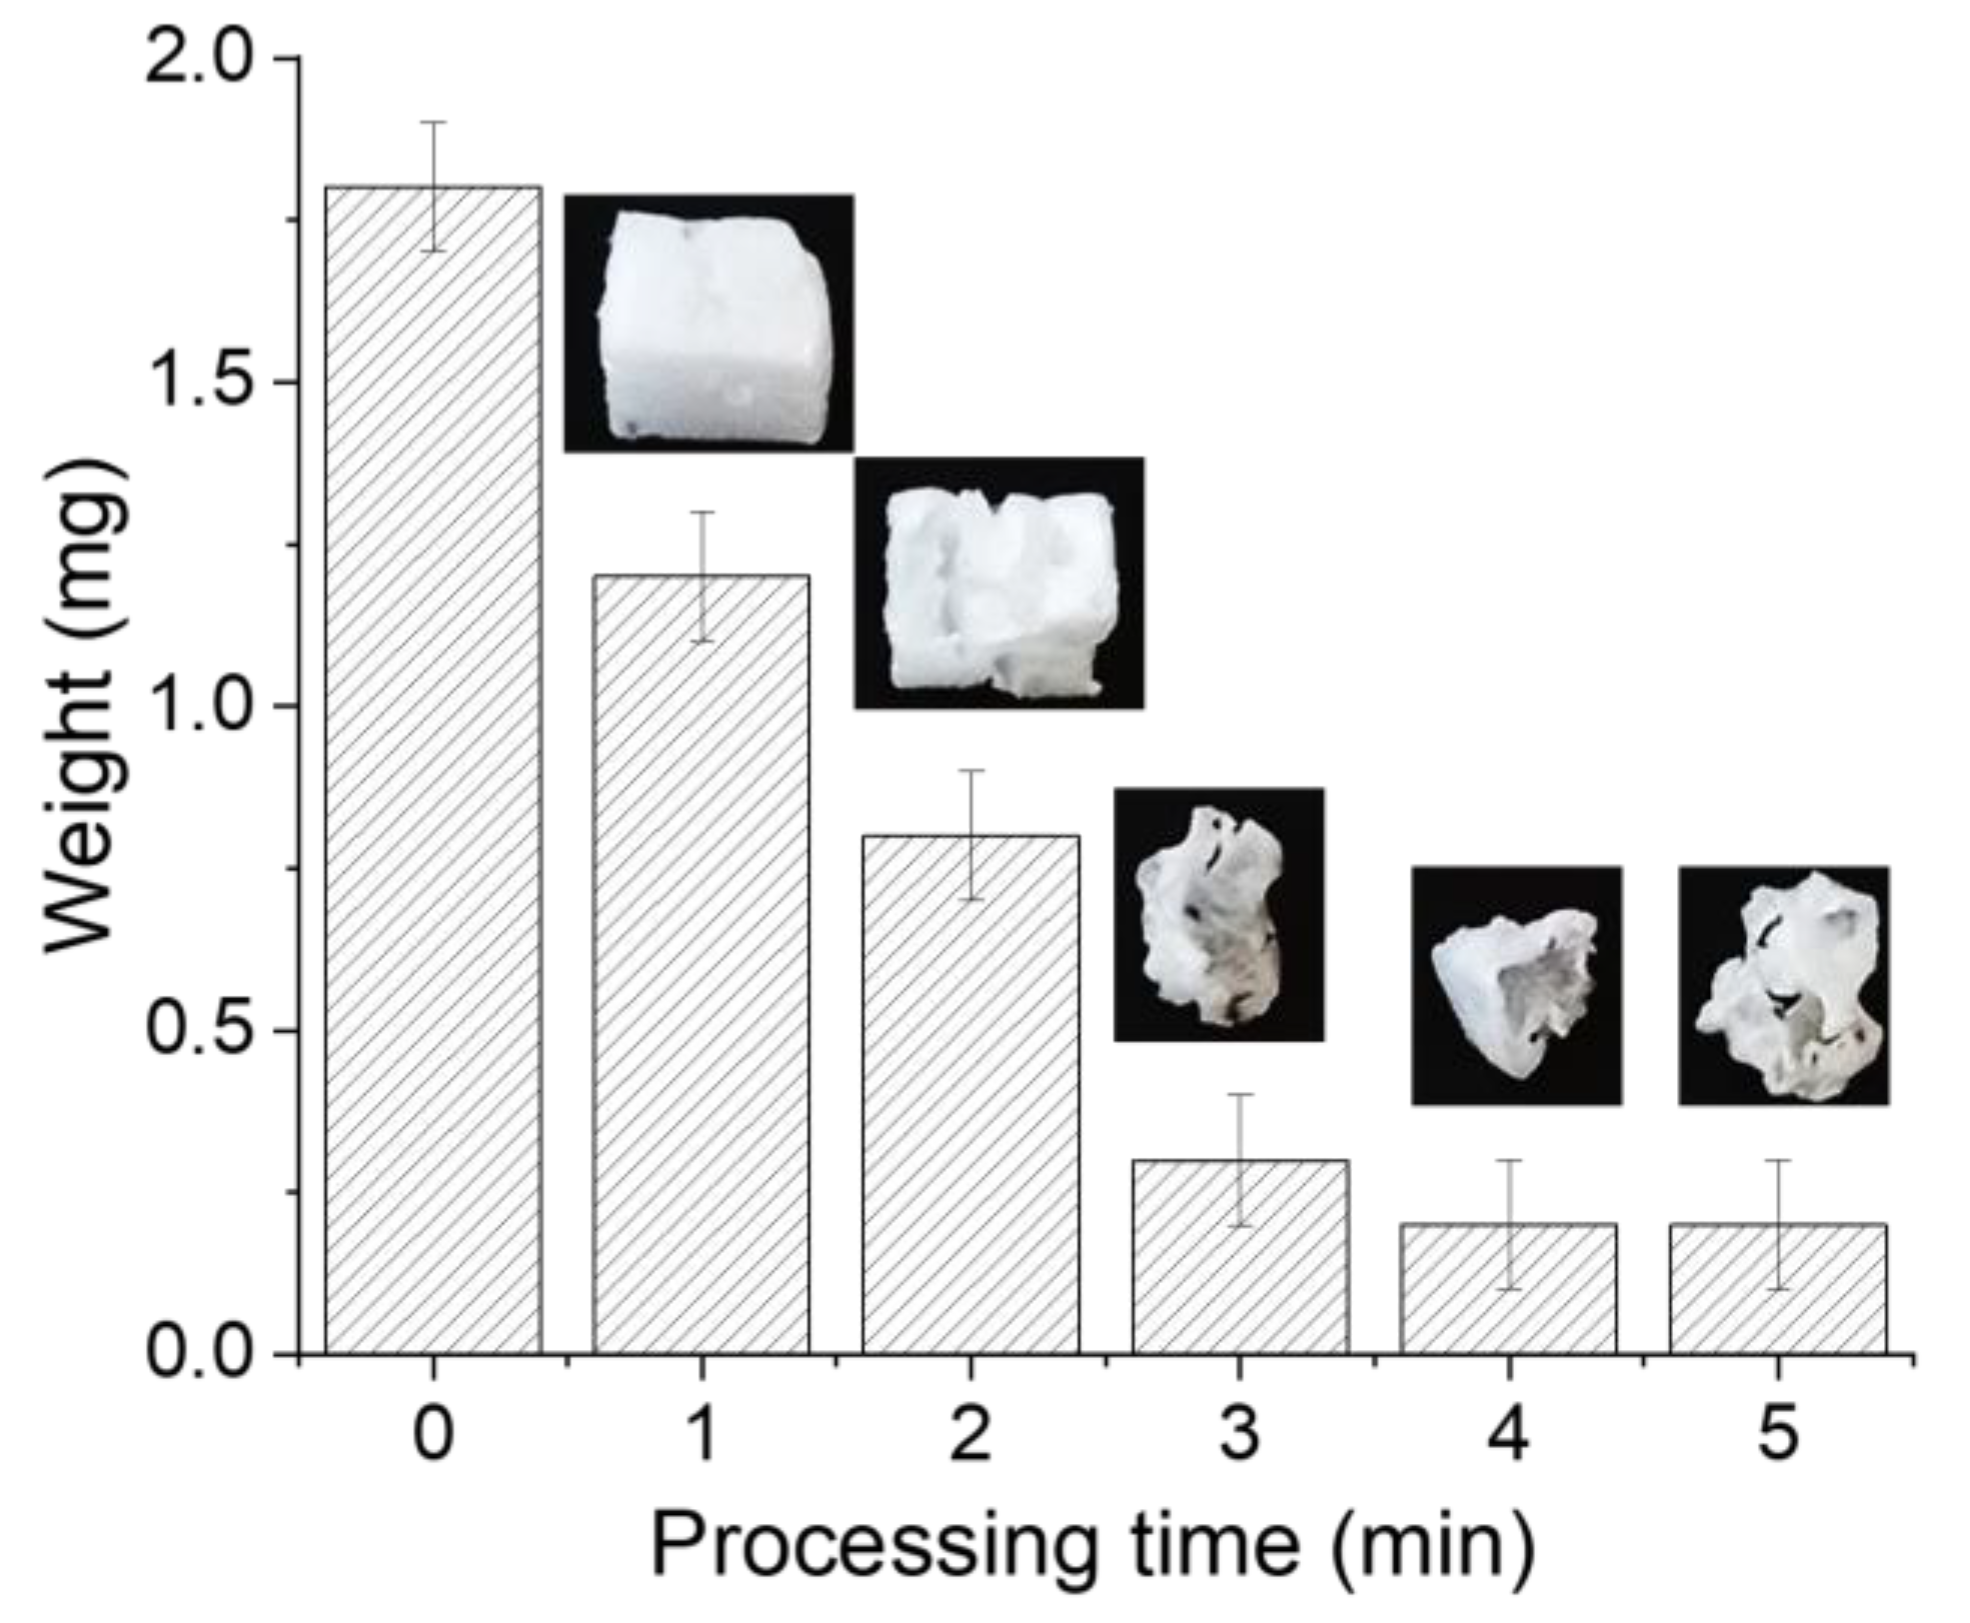
At this stage, it is important to establish the role of N2, OH, O, and H species in the degradation of PS. Based on the results, PS degradation seemingly takes place when the discharge is in steamer mode (i.e., Phases I, II, and III—N2 dominant). To confirm this statement, samples were processed for 1, 2, 3, 4, and 5 min, and variations in their weights were recorded. Figure 10 presents the variations in the weights of the PS samples as a function of the processing time, and it clearly shows that the weight decreases significantly during the first 3 min then remains almost constant. Indeed, beyond 3 min, the sample is no longer in direct contact with the discharge, which partially interrupts the degradation process. It can be deduced that the increase in water conductivity, thus, the transition to spark, locally melts/burns the PS sample. Just after the transition, the PS sample moves away from the discharge zone. Such a displacement can be attributed to the smaller size of the sample, electrostatic charge, gas heating, water recirculation, etc. On the other hand, refreshing the solution after every minute of processing did not influence the degradation, but the PS sample moved away after being reduced significantly. This suggests that its small size together with the possibility for it to be charged are responsible for the movement.
PS degradation is primarily attributed to short-lived highly reactive species, including electrons, ions, radicals, and photons, produced by the discharge in streamer mode and interacting with the PS surface. For instance, the production of a high average electron energy is achieved by the nanosecond discharge [40], as well as by the collision of the low-energy electrons with excited N2 species in the streamer [41]. Therefore, the bombardment of PS surface with energetic and reactive species may lead to the sublimation of PS. When the discharge switches to spark mode, the electron density increases, but the electron energy decreases due to the diminished amount of excited N2 species, as evidenced by the reduced molecular nitrogen emissions [30]. Consequently, the degradation of PS is significantly reduced in spark mode. The black points on the PS surface are observed at the end of the processing, i.e., in spark mode. This is expected, as this mode is characterized by a relatively high temperature.
In addition to the degradation induced by the short-lived species in the plasma, it is important to assess the role of long-lasting species in the solution. Therefore, an experiment was performed wherein the PS sample was introduced into plasma-activated water under the same conditions applied previously. A weight analysis reveals that the sample does not degrade, even after several days of immersion in the plasma-activated water. This is consistent with previous results showing the degradation of the plasma-exposed PS surface only, and it further confirms the insignificant role of aqueous solution species in PS degradation.
Based on our OES results and NMR (nuclear magnetic resonance) analysis of the solution (the analyses were performed four days after the end of the plasma treatment), a tentative mechanism of discharge-induced PS degradation is proposed. The OES data clearly show that no lines can be attributed to carbon (e.g., C2 Swan bands or CH which are easily detectable via emissions) during degradation. Moreover, solid particles are not observed in the water. This was confirmed by filtering the water after processing and by analyzing the solution via UV-Vis and dynamic light scattering. Meanwhile, the NMR spectrum (as shown in the Supplementary Material, Figure S1, Table S1) indicated that ethylbenzene (C8H10) is present in the aqueous solution in trace amounts. This molecule is seemingly produced via a sublimation process, and its properties (highly volatile, flammable, and with a density lower than that of water) are consistent with the low concentration detected in water [42]. It is therefore expected that the byproducts will be emitted in the gas phase; however, gas phase analysis is beyond the scope of this study.
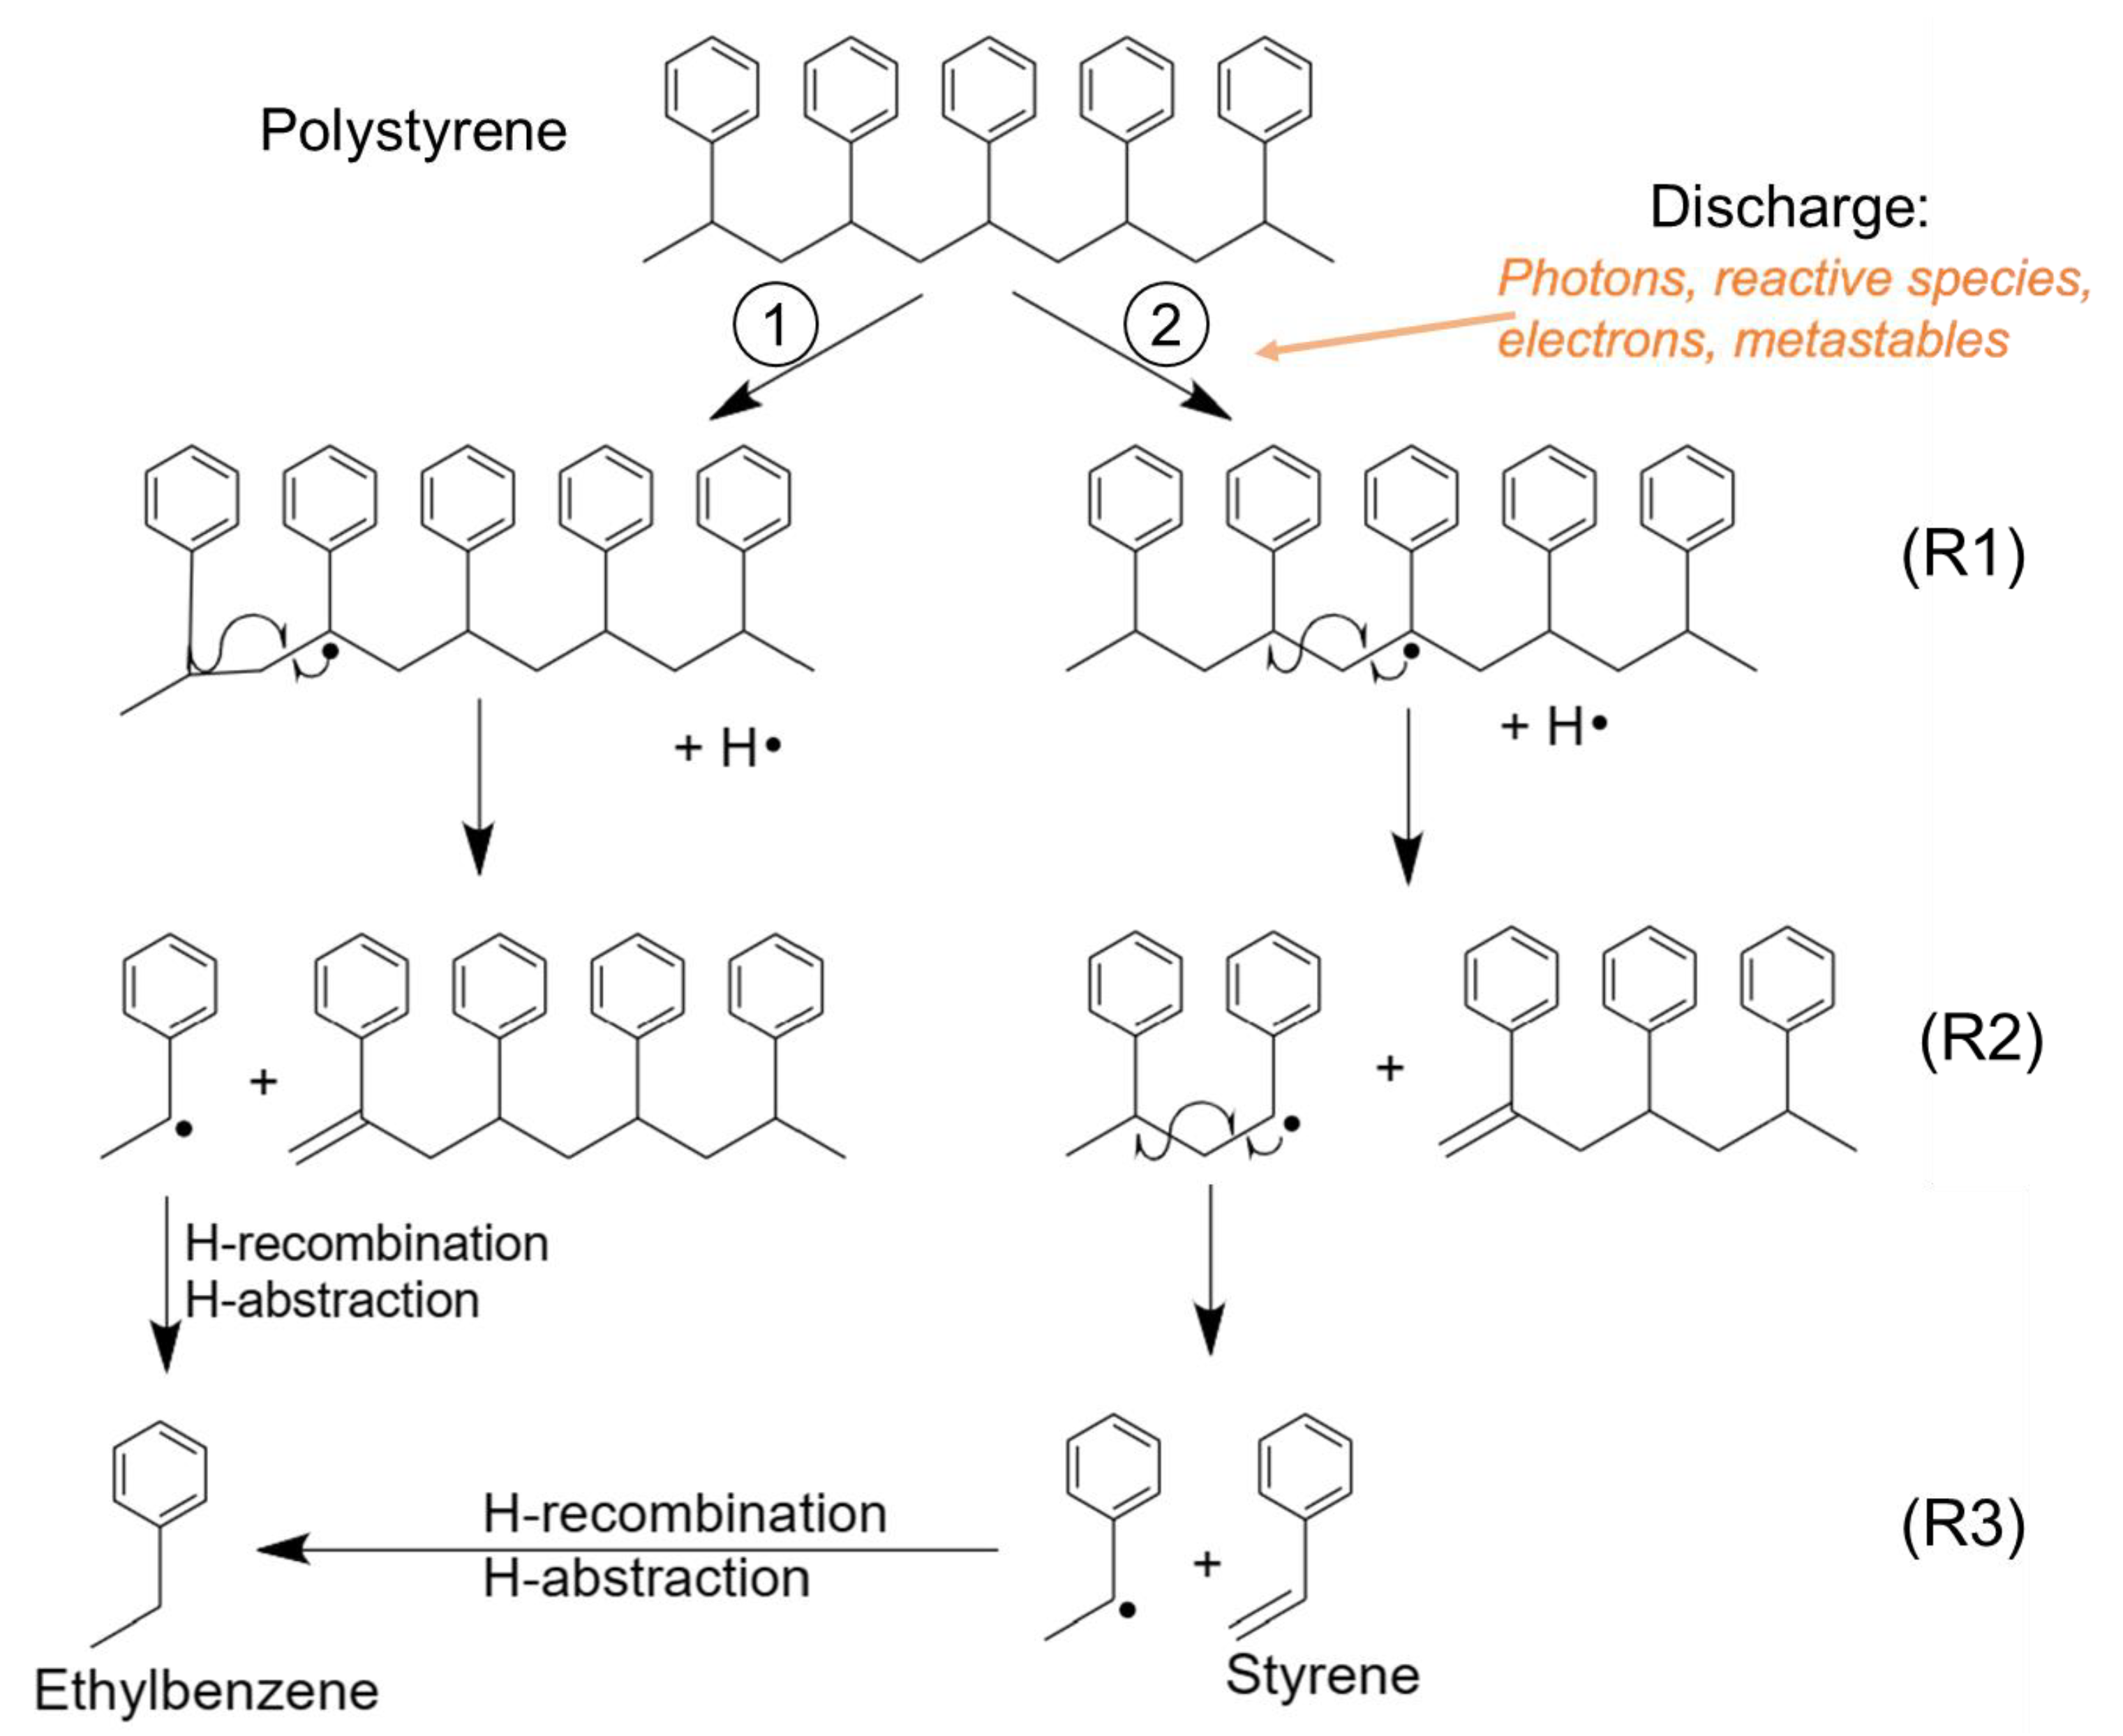
Numerous reaction mechanisms leading to C8H10 formation, particularly in the gas phase [22], have been reported in the literature. Based on these mechanisms and the emitting species in the discharge, a pathway of plasma-induced C8H10 production is proposed in Figure 11. Briefly, the energetic species released by the discharge (e.g., electrons (several eV of energy), UV photons, and metastable species (e.g., N2(A) at ~6.2 eV)) trigger the dissociation of C–H and C–C bonds (with dissociation energies of 4.25 and 3.6–3.7 eV, respectively), resulting in the formation of radicals that undergo scission reactions to give a polymer with an alkene group (R–C=CH2) and one with a benzyl radical (R2). Eventually, the ethylbenzyl radical is formed, and it recombines with a hydrogen radical or abstracts a hydrogen atom from the polymer to obtain ethylbenzene (R3).
This proposed mechanism is a first approximation, and further analyses, such as mass spectrometry/chromatography analyses of the gas phase as well as the liquid phase, are needed to confirm it. Furthermore, in the present study, almost all the parameters change with the processing time: the increase in water temperature (it influences the water evaporation rate and gas composition), water electrical conductivity (it influences the discharge mode), PS volume (it influences the plasma PS/liquid interactions), the movement of PS on the water’s surface, etc. In a future study, it is important to keep these parameters ‘fixed’ and simultaneously analyze the gas phase, plasma emissions, and water composition in order to propose a more detailed and validated degradation mechanism.
Although the present study provides advantages in the degradation of MP, further studies are required. In addition to the above-mentioned analyses, the feasibility of scaling up should be addressed. Scaling up may be proposed for various designs, such as an arrangement of multiple pins with a continuous flow of water containing MP.
4. Conclusions
In conclusion, this study examines the degradation of PS induced by repetitive nanosecond discharges in air in direct contact with water. The PS sample placed on the surface of water is directly exposed to the plasma discharges generated at 2, 5, or 10 kHz. The obtained results reveal that the degradation efficiency increases with increasing discharge frequency. Indeed, 83% of the PS sample’s weight is lost after 5 min of processing at 10 kHz. Electrical and optical diagnostic analyses of the 10 kHz discharge unveil an interesting transition from streamer-like to spark-like behavior after a few minutes of processing. This transition is primarily attributed to the increase in water electrical conductivity, which in turn is related to the accumulation of nitrates, nitrites, and other species. Our optical emission spectroscopy analysis shows that the spectra acquired in streamer mode are dominated by N2 emissions, whereas those acquired in spark mode are dominated by OH, H, and O lines. Based on FTIR characterization, no structural modification of the PS sample is induced by the plasma; however, a decrease in the global intensity suggests that a porous structure eventually develops. The NMR spectroscopy analysis reveals that only ethylbenzene is present in the processed water. A tentative mechanism of ethylbenzene formation from polystyrene degradation is proposed; however, future analyses of the gas phase via mass spectrometry and chromatography techniques are needed to support this mechanism. Overall, our findings provide valuable insight into the efficacy of repetitive nanosecond discharge for PS degradation, and they present a foundation for further investigations addressing the critical issue of plastic pollution.
Supplementary Materials
The following supporting information can be downloaded at: https://0-www-mdpi-com.brum.beds.ac.uk/article/10.3390/plasma7010004/s1, Figure S1. NMR spectrum of a discharge processed water that contains PS. The processing was performed under negative polarity voltage (V = −12 kV) at high frequency (10 kHz). The analysis was performed 4 days after processing; Table S1. NMR parameters for sample analysis and spectrum acquisition.
Author Contributions
Conceptualization, A.Z., C.R. and A.H.; methodology, A.Z., C.R. and A.H.; formal analysis, A.Z., C.R. and A.H.; investigation, A.Z., C.R. and A.H.; resources, A.H.; data curation, A.H. and A.Z.; writing—original draft preparation, A.Z.; writing—review and editing, A.Z., C.R. and A.H.; visualization, A.Z., C.R. and A.H.; supervision, C.R. and A.H.; project administration, A.H.; funding acquisition, A.H. All authors have read and agreed to the published version of the manuscript.
Funding
This research was funded by the Natural Sciences and Engineering Research Council of Canada (NSERC), grant number RGPIN-2023-03951.
Institutional Review Board Statement
Not applicable.
Informed Consent Statement
Not applicable.
Data Availability Statement
The data that supports the findings of this study are available within the article.
Conflicts of Interest
The authors declare no conflicts of interest.
References
- Blaga, A. Propriétés et comportement des matières plastiques. In Report: Digeste de la Construction au Canada Division des Recherches en Construction; Conseil national de recherches Canada: Ottawa, ON, Canada, 1974; p. 6. [Google Scholar] [CrossRef]
- Sources, Fate and Effects of Microplastics in the Marine Environment (Part 1). GESAMP. Available online: http://www.gesamp.org/publications/reports-and-studies-no-90 (accessed on 27 April 2023).
- UN Environment Program, from Pollution to Solution. Available online: https://wedocs.unep.org/xmlui/bitstream/handle/20.500.11822/36963/POLSOL.pdf (accessed on 1 October 2023).
- Wayman, C.; Niemann, H. The fate of plastic in the ocean environment—A mini review. Environ. Sci. Process. Impacts 2021, 23, 198–212. [Google Scholar] [CrossRef] [PubMed]
- Le Plastique en 10 Chiffres. National Geographic. Available online: https://www.nationalgeographic.fr/le-plastique-en-10-chiffres (accessed on 1 October 2023).
- Leslie, H.A.; van Velzen, M.J.M.; Brandsma, S.H.; Vethaak, A.D.; Garcia-Vallejo, J.J.; Lamoree, M.H. Discovery and quantification of plastic particle pollution in human blood. Environ. Int. 2022, 163, 107199. [Google Scholar] [CrossRef] [PubMed]
- Miranda, D.d.A.; de Carvalho-Souza, G.F. Are we eating plastic-ingesting fish? Mar. Pollut. Bull. 2016, 103, 109–114. [Google Scholar] [CrossRef] [PubMed]
- Fogašová, K.; Manko, P.; Oboňa, J. The first evidence of microplastics in plant-formed fresh-water micro-ecosystems: Dipsacus teasel phytotelmata in Slovakia contaminated with MPs. BioRisk 2022, 18, 133–143. [Google Scholar] [CrossRef]
- Li, L.; Xu, G.; Yu, H.; Xing, J. Dynamic membrane for micro-particle removal in wastewater treatment: Performance and influencing factors. Sci. Total Environ. 2018, 627, 332–340. [Google Scholar] [CrossRef] [PubMed]
- Ariza-Tarazona, M.C.; Villarreal-Chiu, J.F.; Barbieri, V.; Siligardi, C.; Cedillo-González, E.I. New strategy for microplastic degradation: Green photocatalysis using a protein-based porous N-TiO2 semiconductor. Ceram. Int. 2019, 45 Pt B, 9618–9624. [Google Scholar] [CrossRef]
- Dawson, A.L.; Kawaguchi, S.; King, C.K.; Townsend, K.A.; King, R.; Huston, W.M.; Nash, S.M.B. Turning microplastics into nanoplastics through digestive fragmentation by Antarctic krill. Nat. Commun. 2018, 9, 1001. [Google Scholar] [CrossRef]
- Sun, J.; Dai, X.; Wang, Q.; van Loosdrecht, M.C.M.; Ni, B.-J. Microplastics in wastewater treatment plants: Detection, occurrence and removal. Water Res. 2019, 152, 21–37. [Google Scholar] [CrossRef]
- Kim, S.; Sin, A.; Nam, H.; Park, Y.; Lee, H.; Han, C. Advanced oxidation processes for microplastics degradation: A recent trend. Chem. Eng. J. Adv. 2022, 9, 100213. [Google Scholar] [CrossRef]
- Deng, Y.; Zhao, R. Advanced Oxidation Processes (AOPs) in Wastewater Treatment. Curr. Pollut. Rep. 2015, 1, 167–176. [Google Scholar] [CrossRef]
- Shimao, M. Biodegradation of plastics. Curr. Opin. Biotechnol. 2001, 12, 242–247. [Google Scholar] [CrossRef] [PubMed]
- Liu, P.; Qian, L.; Wang, H.; Zhan, X.; Lu, K.; Gu, C.; Gao, S. New Insights into the Aging Behavior of Microplastics Accelerated by Advanced Oxidation Processes. Environ. Sci. Technol. 2019, 53, 3579–3588. [Google Scholar] [CrossRef] [PubMed]
- Kang, J.; Zhou, L.; Duan, X.; Sun, H.; Ao, Z.; Wang, S. Degradation of Cosmetic Microplastics via Functionalized Carbon Nanosprings. Matter 2019, 1, 745–758. [Google Scholar] [CrossRef]
- Zhou, L.; Wang, T.; Qu, G.; Jia, H.; Zhu, L. Probing the aging processes and mechanisms of microplastic under simulated multiple actions generated by discharge plasma. J. Hazard. Mater. 2020, 398, 122956. [Google Scholar] [CrossRef] [PubMed]
- Khan, S.; He, X.; Khan, H.M.; Boccelli, D.; Dionysiou, D.D. Efficient degradation of lindane in aqueous solution by iron (II) and/or UV activated peroxymonosulfate. J. Photochem. Photobiol. A Chem. 2016, 316, 37–43. [Google Scholar] [CrossRef]
- Kiendrebeogo, M.; Estahbanati, M.R.K.; Mostafazadeh, A.K.; Drogui, P.; Tyagi, R.D. Treatment of microplastics in water by anodic oxidation: A case study for polystyrene. Environ. Pollut. 2021, 269, 116168. [Google Scholar] [CrossRef]
- García-Muñoz, P.; Allé, P.H.; Bertoloni, C.; Torres, A.; de la Orden, M.U.; Urreaga, J.M.; Dziurla, M.-A.; Fresno, F.; Robert, D.; Keller, N. Photocatalytic degradation of polystyrene nanoplastics in water. A methodological study. J. Environ. Chem. Eng. 2022, 10, 108195. [Google Scholar] [CrossRef]
- Andreassen, E. Infrared and Raman spectroscopy of polypropylene. In Polymer Science and Technology Series; Polypropylene, J., Karger-Kocsis, Eds.; Springer: Dordrecht, The Netherlands, 1999; Volume 2, pp. 320–328. [Google Scholar] [CrossRef]
- Zhou, R.; Zhou, R.; Wang, P.; Xian, Y.; Mai-Prochnow, A.; Lu, X.P.; Cullen, P.J.; Ostrikov, K.; Bazaka, K. Plasma-activated water: Generation, origin of reactive species and biological applications. J. Phys. D Appl. Phys. 2020, 53, 303001. [Google Scholar] [CrossRef]
- Locke, B.R. Environmental Applications of Electrical Discharge Plasma with Liquid Water: A mini review. Int. J. Plasma Environ. Sci. Technol. 2012, 6, 194–203. [Google Scholar]
- Joshi, R.P.; Thagard, S.M. Streamer-Like Electrical Discharges in Water: Part II. Environmental Applications. Plasma Chem. Plasma Process. 2013, 33, 17–49. [Google Scholar] [CrossRef]
- Bartnik, A.; Fiedorowicz, H.; Jarocki, R.; Kostecki, J.; Szczurek, A.; Szczurek, M. Ablation and surface modifications of PMMA using a laser-plasma EUV source. Appl. Phys. B 2009, 96, 727–730. [Google Scholar] [CrossRef]
- Gilliam, M.; Farhat, S.; Zand, A.; Stubbs, B.; Magyar, M.; Garner, G. Atmospheric Plasma Surface Modification of PMMA and PP Micro-Particles: Plasma Modification Particles. Plasma Process. Polym. 2014, 11, 1037–1043. [Google Scholar] [CrossRef]
- Zhou, R.; Zhou, R.; Prasad, K.; Fang, Z.; Speight, R.; Bazaka, K.; Ostrikov, K. Cold atmospheric plasma activated water as a prospective disinfectant: The crucial role of peroxynitrite. Green. Chem. 2018, 20, 5276–5284. [Google Scholar] [CrossRef]
- Liu, D.X.; Liu, Z.C.; Chen, C.; Yang, A.J.; Li, D.; Rong, M.Z.; Chen, H.L.; Kong, M.G. Aqueous reactive species induced by a surface air discharge: Heterogeneous mass transfer and liquid chemistry pathways. Sci. Rep. 2016, 6, 23737. [Google Scholar] [CrossRef] [PubMed]
- Hamdan, A.; Ridani, D.A.; Diamond, J.; Daghrir, R. Pulsed nanosecond air discharge in contact with water: Influence of voltage polarity, amplitude, pulse width, and gap distance. J. Phys. D Appl. Phys. 2020, 53, 355202. [Google Scholar] [CrossRef]
- Hamdan, A.; Liu, T.C.; Profili, J.; El Rachidi, M.; Stafford, L. Interaction of a Pulsed Nanosecond Discharge in Air in Contact with a Suspension of Crystalline Nanocellulose (CNC). Plasma Chem. Plasma Process. 2023, 43, 849–865. [Google Scholar] [CrossRef]
- Lo, A.; Cessou, A.; Lacour, C.; Lecordier, B.; Boubert, P.; Xu, D.A.; Laux, C.O.; Vervisch, P. Streamer-to-spark transition initiated by a nanosecond overvoltage pulsed discharge in air. Plasma Sources Sci. Technol. 2017, 26, 045012. [Google Scholar] [CrossRef]
- Janda, M.; Machala, Z.; Niklová, A.; Martišovitš, V. The streamer-to-spark transition in a transient spark: A dc-driven nanosecond-pulsed discharge in atmospheric air. Plasma Sources Sci. Technol. 2012, 21, 045006. [Google Scholar] [CrossRef]
- Smith, B. The Infrared Spectra of Polymers III: Hydrocarbon Polymers. Spectroscopy 2021, 36, 22–25. [Google Scholar] [CrossRef]
- Minnes, R.; Nissinmann, M.; Maizels, Y.; Gerlitz, G.; Katzir, A.; Raichlin, Y. Using Attenuated Total Reflection–Fourier Transform Infra-Red (ATR-FTIR) spectroscopy to distinguish between melanoma cells with a different metastatic potential. Sci. Rep. 2017, 7, 4381. [Google Scholar] [CrossRef]
- Lo, A.; Cessou, A.; Boubert, P.; Vervisch, P. Space and time analysis of the nanosecond scale discharges in atmospheric pressure air: I. Gas temperature and vibrational distribution function of N2 and O2. J. Phys. D 2014, 47, 115201. [Google Scholar] [CrossRef]
- Lo, A.; Cessou, A.; Vervisch, P. Space and time analysis of the nanosecond scale discharges in atmospheric pressure air: II. Energy transfers during the post-discharge. J. Phys. D 2014, 47, 115202. [Google Scholar] [CrossRef]
- Lo, A.; Cléon, G.; Vervisch, P.; Cessou, A. Spontaneous Raman scattering: A useful tool for investigating the afterglow of nanosecond scale discharges in air. Appl. Phys. B 2012, 107, 229–242. [Google Scholar] [CrossRef]
- Lowke, J.J. Plasma predictions: Past, present and future. Plasma Sources Sci. Technol. 2013, 22, 023002. [Google Scholar] [CrossRef]
- Popov, N.A. Formation and development of a leader channel in air. Plasma Phys. Rep. 2003, 29, 695–708. [Google Scholar] [CrossRef]
- Iza, F.; Walsh, J.L.; Kong, M.G. From Submicrosecond- to Nanosecond-Pulsed Atmospheric-Pressure Plasmas. IEEE Trans. Plasma Sci. 2009, 37, 1289–1296. [Google Scholar] [CrossRef]
- Ethylbenzene Chemical Book. Available online: https://www.chemicalbook.com/ChemicalProductProperty_EN_CB4672779.htm#:~:text=Ethylbenzene%20is%20a%20colorless%2C%20volatile,Vapors%20are%20heavier%20than%20air (accessed on 1 October 2023).
Figure 1.
Scheme of the experimental setup.

Figure 2.
Temporal evolution of the discharge phases at −12 kV voltage amplitude and (a) 2, (b) 5, or (c) 10 kHz pulse frequency.
Figure 2.
Temporal evolution of the discharge phases at −12 kV voltage amplitude and (a) 2, (b) 5, or (c) 10 kHz pulse frequency.

Figure 3.
Temporal evolution of the voltage and current waveforms’ discharges generated in air in contact with water under negative polarity (V = −12 kV) and at different frequencies: (a) 2 kHz; (b) 5 kHz; and (c) 10 kHz.
Figure 3.
Temporal evolution of the voltage and current waveforms’ discharges generated in air in contact with water under negative polarity (V = −12 kV) and at different frequencies: (a) 2 kHz; (b) 5 kHz; and (c) 10 kHz.

Figure 4.
Optical emission spectra of the negative polarity (V = −12 kV), high-frequency (10 kHz) discharge recorded after (a) 3 min (streamer mode) and (b) 5 min (spark mode) of processing.
Figure 4.
Optical emission spectra of the negative polarity (V = −12 kV), high-frequency (10 kHz) discharge recorded after (a) 3 min (streamer mode) and (b) 5 min (spark mode) of processing.

Figure 5.
Standard camera images showing the degradation of PS at different processing frequencies and times.
Figure 5.
Standard camera images showing the degradation of PS at different processing frequencies and times.

Figure 6.
Time-dependent changes in the weights of PS samples processed at different frequencies.

Figure 7.
FTIR spectrum of untreated PS.

Figure 8.
FTIR spectra of PS surfaces processed at different frequencies for different times: (a) Aromatic –CH stretching mode and asymmetric/symmetric –CH2 stretching; (b) Aromatic C=C and C–C stretching; and (c) Aromatic out of plane and ring bending. Note that the acquisition parameters and the y-scale are the same for the different samples.

Figure 9.
Temporal evolution of the emission band intensities recorded under negative polarity voltage (V = −12 kV) at high frequency (10 kHz).
Figure 9.
Temporal evolution of the emission band intensities recorded under negative polarity voltage (V = −12 kV) at high frequency (10 kHz).

Figure 10.
Variations in the weights of PS samples processed at V = −12 kV and f = 10 kHz for different times.
Figure 10.
Variations in the weights of PS samples processed at V = −12 kV and f = 10 kHz for different times.

Figure 11.
Mechanism of ethylbenzene formation from polystyrene by-products.


Table 1.
Evolution of the conductivity and acidity of the solution after discharge processing at different frequencies.
Table 1.
Evolution of the conductivity and acidity of the solution after discharge processing at different frequencies.
| Frequency /Processing Time | Initial Values | 2 kHz /15 min | 5 kHz /10 min | 10 kHz /5 min |
|---|---|---|---|---|
| Conductivity (μS/cm) | 2 | 4 | 215 | 333 |
| Acidity (pH) | 5.6 | 4.2 | 3.7 | 3.2 |
Disclaimer/Publisher’s Note: The statements, opinions and data contained in all publications are solely those of the individual author(s) and contributor(s) and not of MDPI and/or the editor(s). MDPI and/or the editor(s) disclaim responsibility for any injury to people or property resulting from any ideas, methods, instructions or products referred to in the content. |
© 2024 by the authors. Licensee MDPI, Basel, Switzerland. This article is an open access article distributed under the terms and conditions of the Creative Commons Attribution (CC BY) license (https://creativecommons.org/licenses/by/4.0/).
Share and Cite
MDPI and ACS Style
Zamo, A.; Rond, C.; Hamdan, A. Polystyrene (PS) Degradation Induced by Nanosecond Electric Discharge in Air in Contact with PS/Water. Plasma 2024, 7, 49-63. https://0-doi-org.brum.beds.ac.uk/10.3390/plasma7010004
AMA Style
Zamo A, Rond C, Hamdan A. Polystyrene (PS) Degradation Induced by Nanosecond Electric Discharge in Air in Contact with PS/Water. Plasma. 2024; 7(1):49-63. https://0-doi-org.brum.beds.ac.uk/10.3390/plasma7010004
Chicago/Turabian StyleZamo, Aurélie, Catherine Rond, and Ahmad Hamdan. 2024. "Polystyrene (PS) Degradation Induced by Nanosecond Electric Discharge in Air in Contact with PS/Water" Plasma 7, no. 1: 49-63. https://0-doi-org.brum.beds.ac.uk/10.3390/plasma7010004