Article

Long-Term Effects of Repeated Prescribed Fire and Fire Surrogate Treatments on Forest Soil Chemistry in the Southern Appalachian Mountains (USA)

1
Department of Forest Resources and Environmental Conservation, Virginia Polytechnic Institute and State University, Blacksburg, VA 24061, USA
2
Department of Forestry and Environmental Conservation, Clemson University, Clemson, SC 29634, USA
3
USDA Forest Service, Southern Research Station, Clemson, SC 29634, USA
4
North Carolina Wildlife Resources Commission, Lawndale, NC 28090, USA
*
Author to whom correspondence should be addressed.
Submission received: 16 April 2020 / Revised: 22 May 2020 / Accepted: 4 June 2020 / Published: 6 June 2020
(This article belongs to the Special Issue Unravelling the Diverse Effects of Fire on Soil Processes)

Abstract

:
From 2001–2018, a series of fuel reduction and ecosystem restoration treatments were implemented in the southern Appalachian Mountains near Asheville, North Carolina, USA. Treatments consisted of prescribed fire (four burns), mechanical cutting of understory shrubs and mid-story trees (two cuttings), and a combination of both cutting and prescribed fire (two cuts + four burns). Soils were sampled in 2018 to determine potential treatment impacts for O horizon and mineral soil (0–10 cm depth) carbon (C) and nitrogen (N) and mineral soil calcium (Ca), magnesium (Mg), phosphorus (P), potassium (K), and pH. Results suggested that mean changes in O horizon C and N and mineral soil C, N, C:N, Ca, and P from 2001–2018 differed between the treatments, but only mineral soil C, N, C:N, and Ca displayed differences between at least one fuel reduction treatment and the untreated control. One soils-related restoration objective was mineral soil N reduction and the cut + burn treatment best achieved this result. Increased organic matter recalcitrance was another priority, but this was not obtained with any treatment. When paired with previously reported fuels and vegetation results from this site, it appeared that continued use of the cut + burn treatment may best achieve long-term management objectives for this site and other locations being managed for similar long-term restoration and fuels management objectives.

1. Introduction

Wildland fires may impact soil physical, biological, and chemical properties in a multitude of ways [1,2,3,4,5]. These impacts may be related to factors such as fire intensity, severity, and frequency; vegetative species composition; soil sampling period (i.e., time since fire occurred); soil property investigated (i.e., O horizon properties vs. mineral soil properties); and many other factors [4,5,6]. These variables differ greatly between most wildfires and prescribed fires in a given ecosystem, therefore, soil responses to wildfires and prescribed fires may also differ [2,6,7]. Generally, low-intensity, low-severity prescribed surface fires impact soils less than high-intensity, high-severity wildfires [3,7,8]. Likewise, harvesting practices have also been shown to impact soils variably depending upon factors such as harvesting method, amount of material harvested, amount of mineral soil exposed, and topography [9,10,11].
On the Green River Game Lands near Asheville, North Carolina, USA, in the southern Appalachian Mountains, fuel reduction and woodland restoration treatments consisting of prescribed fire only, mechanical cutting of mid-story and understory vegetation, and a combination of these two treatments were first implemented in 2001 as part of the National Fire and Fire Surrogate Study (FFSS) [12,13,14]. Historic forests of the Appalachian region, dominated by upland oaks (Quercus spp.), hickories (Carya spp.), and pines (Pinus spp.), were nitrogen (N)-limited [15,16]. These ectomycorrhizal species thrived in soils with low inorganic N content and highly recalcitrant organic matter [17]. Many locations within the Appalachian region would now be considered N-saturated as a result of industrialization and atmospheric N deposition [18]. Therefore, low total ecosystem N and recalcitrant organic matter were desired, soils-related, treatment outcomes [15].
O horizon and mineral soil (0–10 cm depth) carbon (C), N, and C:N and mineral soil calcium (Ca), magnesium (Mg), phosphorus (P), potassium (K), and pH were evaluated 1 to 2 years following the first implementation of these treatments on the Green River Game Lands [13]. O horizon C:N and mineral soil Ca differed between treatments. O horizon C:N was lower on the cut + burn treatment than all others and mineral soil Ca differed between the cut-only and cut + burn treatments and an untreated control. Two to four years post-treatment, however, differences between treatments for these variables were not present. Soil pH differed between the cut-only and untreated control treatments, but that difference was only 0.12. Therefore, the investigators suggested that treatment-related soil responses were time-sensitive and one treatment implementation could be expected to have little biological significance. Structural and functional restoration of this ecosystem was expected to require repeated treatments every 3–8 years and potentially higher intensity and severity prescribed burns [15].
Since 2001–2002, additional treatments have been conducted on the Green River Game Lands: four total burns for the burn-only treatment; two total cuts for the cut-only treatment; and two total cuts + 4 burns for the cut + burn treatment [14]. Recent fuels and vegetation research following the repeated use of these treatments at this site suggested that: (1) all fuel reduction and restoration treatments reduced one or more fuel types, (2) the burn-only and cut + burn treatments reduced most fuels and most likely decreased wildfire hazard best, (3) desired upland oak and pine regeneration and graminoid density and cover increased following cut + burn treatments, and (4) cut + burn treatments induced forest structural changes most consistent with restoration goals, but no treatment regime had fully achieved the desired woodland structure [12,14]. No additional soils research from this site has been published, however.
Given the long-term and repeated use of these fuel reduction and land management strategies in the southern Appalachian Mountains, we sought to determine potential long-term treatment-induced soil chemical changes at this site. In summer 2018, O horizon and mineral soil samples were collected. O horizon and mineral soil C, N, and C:N and mineral soil Ca, K, Mg, P, and pH were evaluated to determine changes in values of these properties since initial sampling was conducted in 2001. Based upon the additional treatments that have been conducted since 2001–2002, our hypotheses were: (1) mean differences in 2001 and 2018 O horizon and mineral soil C, N, and C:N values would differ most for the burn and cut + burn treatments (suggesting that the repeated use of these treatments has led to more N-limited soil conditions and more recalcitrant organic matter) and (2) mean differences in 2001 and 2018 mineral soil Ca, Mg, P, K, and pH values would be greatest for the cut + burn treatment.

2. Materials and Methods
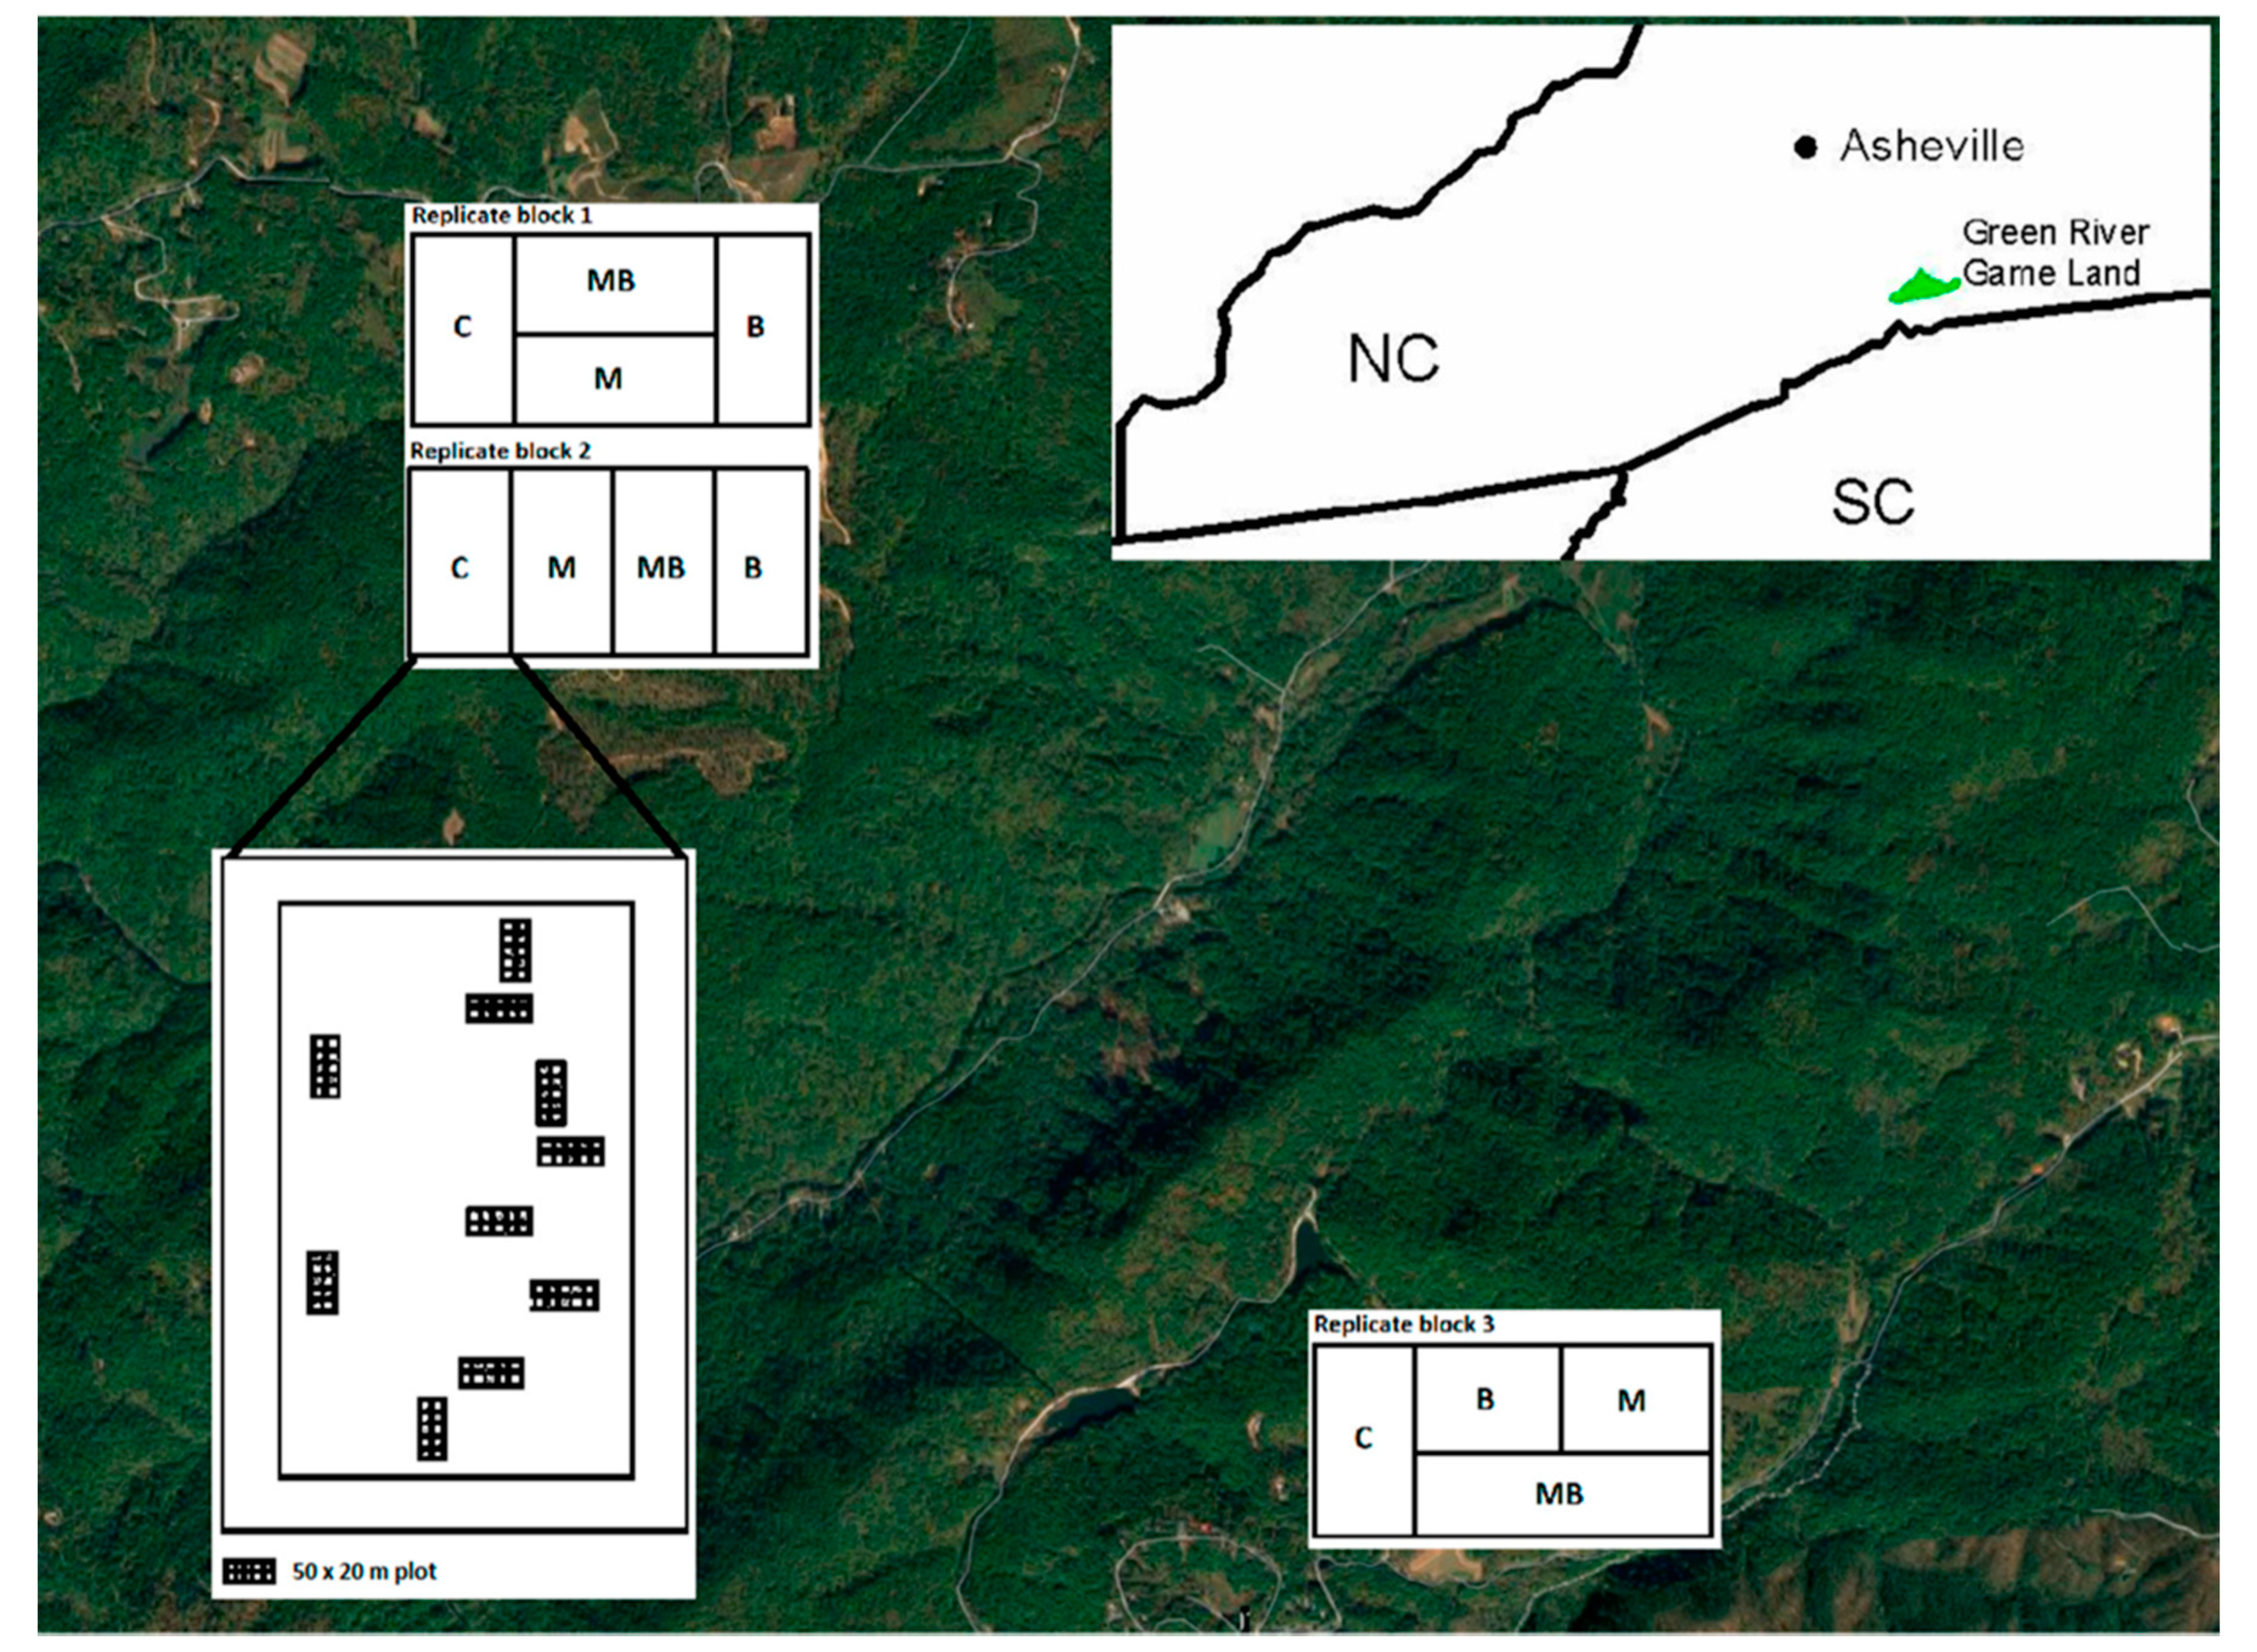
2.1. Study Site

This research was conducted on the Green River Game Lands in western North Carolina, USA (Figure 1). This property encompassed 5841 ha in Polk County, NC, near the cities of Asheville and Hendersonville. Elevation ranged from 350 m to 750 m [12]. The climate of the region was warm continental (mean annual precipitation = 1638 mm; mean annual temperature = 17.6°C) [15]. Oak species found on this property included chestnut (Quercus montana Willd.), northern red (Q. rubra L.), white (Q. alba L.), and black (Q. velutina Lam.). Pine species found on this property included loblolly, shortleaf (P. echinata Mill.), Virginia (P. virginiana Mill.), and eastern white (P. strobus L.). Common hardwood species included red maple (Acer rubrum L.), sweet birch (Betula lenta L.), American beech (Fagus grandifolia Ehrh.), yellow-poplar (Liriodendron tulipifera L.), and blackgum (Nyssa sylvatica Marshall). Predominant shrubs in the area were great rhododendron (Rhododendron maximum L.) and mountain laurel (Kalmia latifolia L.) [19]. Soils in the area were from colluvium and residuum from metamorphic parent materials, especially biotite gneiss and sillimanite-mica schist [15]. Most of the study area was occupied by soils of the Evard (fine, loamy, Typic Hapludults) and Cliffield soil series (loamy-skeletal, mixed, subactive, mesic Typic Hapludults) [13].

2.2. Experimental Design and Treatment Descriptions

Treatments for this study consisted of prescribed burn only, mechanical cutting only (cutting of all mountain laurel and rhododendron stems and all other woody stems >1.8 m tall and <10 cm diameter at breast height (DBH) to create a vertical fuel break), a combination of mechanical cutting + prescribed burning, and an untreated control [12]. The burn-only and cut-only treatments were designed to reduce fuels with 80% overstory survivability in the event of a wildfire occurring on an 80th percentile weather day [19]. For this study, a randomized complete block design was selected (4 treatments in 3 replicate blocks with blocks representative of separate, but similar geographic locations) (Figure 1). All replicates consisted of a contiguous block of land, which helped control variability among sites. Each stand in the 3 replicates was approximately 14 ha in size and basal area ranged from 21–31 m2 ha−1 prior to treatment. Stands selected for this study were approximately 80 to 120 years old and had at least 5 years without fire and 10 years without cutting prior to initial treatment installation [13].
The original cutting treatments were conducted for the cut-only and cut + burn treatments December 2001–February 2002. A second cutting operation for both treatments occurred January-February 2012 [9]. As of 2018, 4 dormant season prescribed burns had occurred in the burn-only and cut + burn units: February–March 2003, 2006, 2012, and 2015. These burns were ignited using aerial ignition (spot fire) or strip head fire techniques [14].

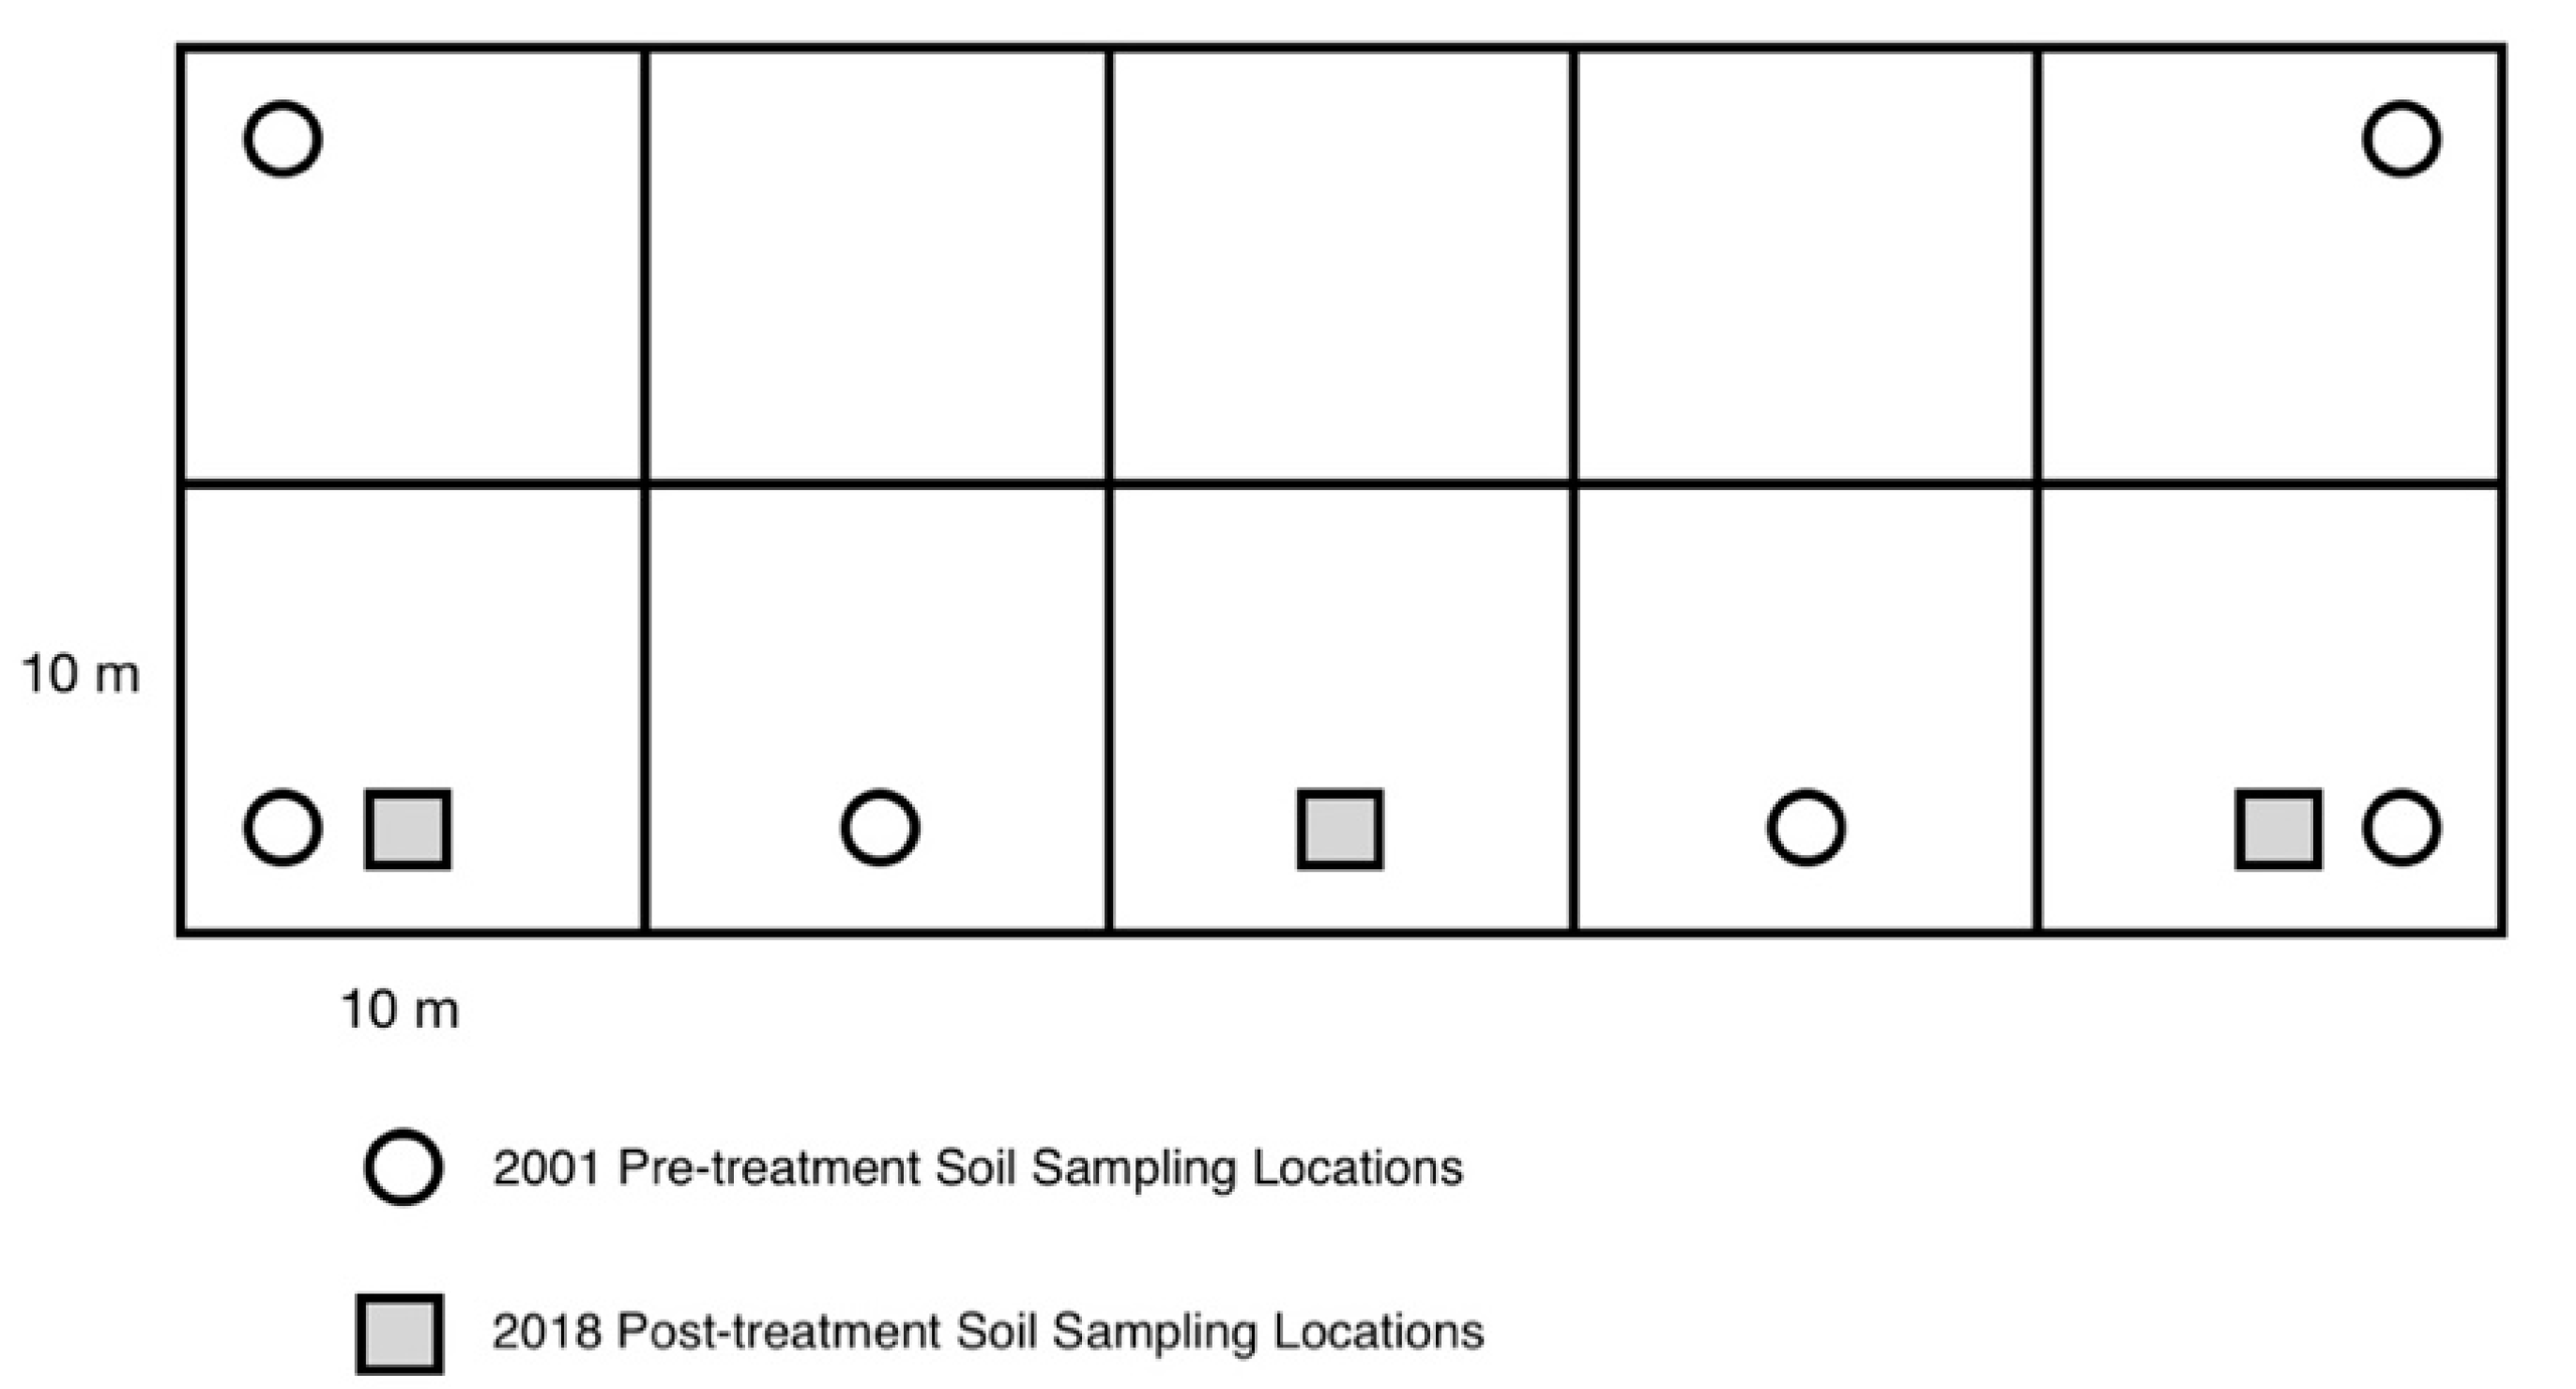
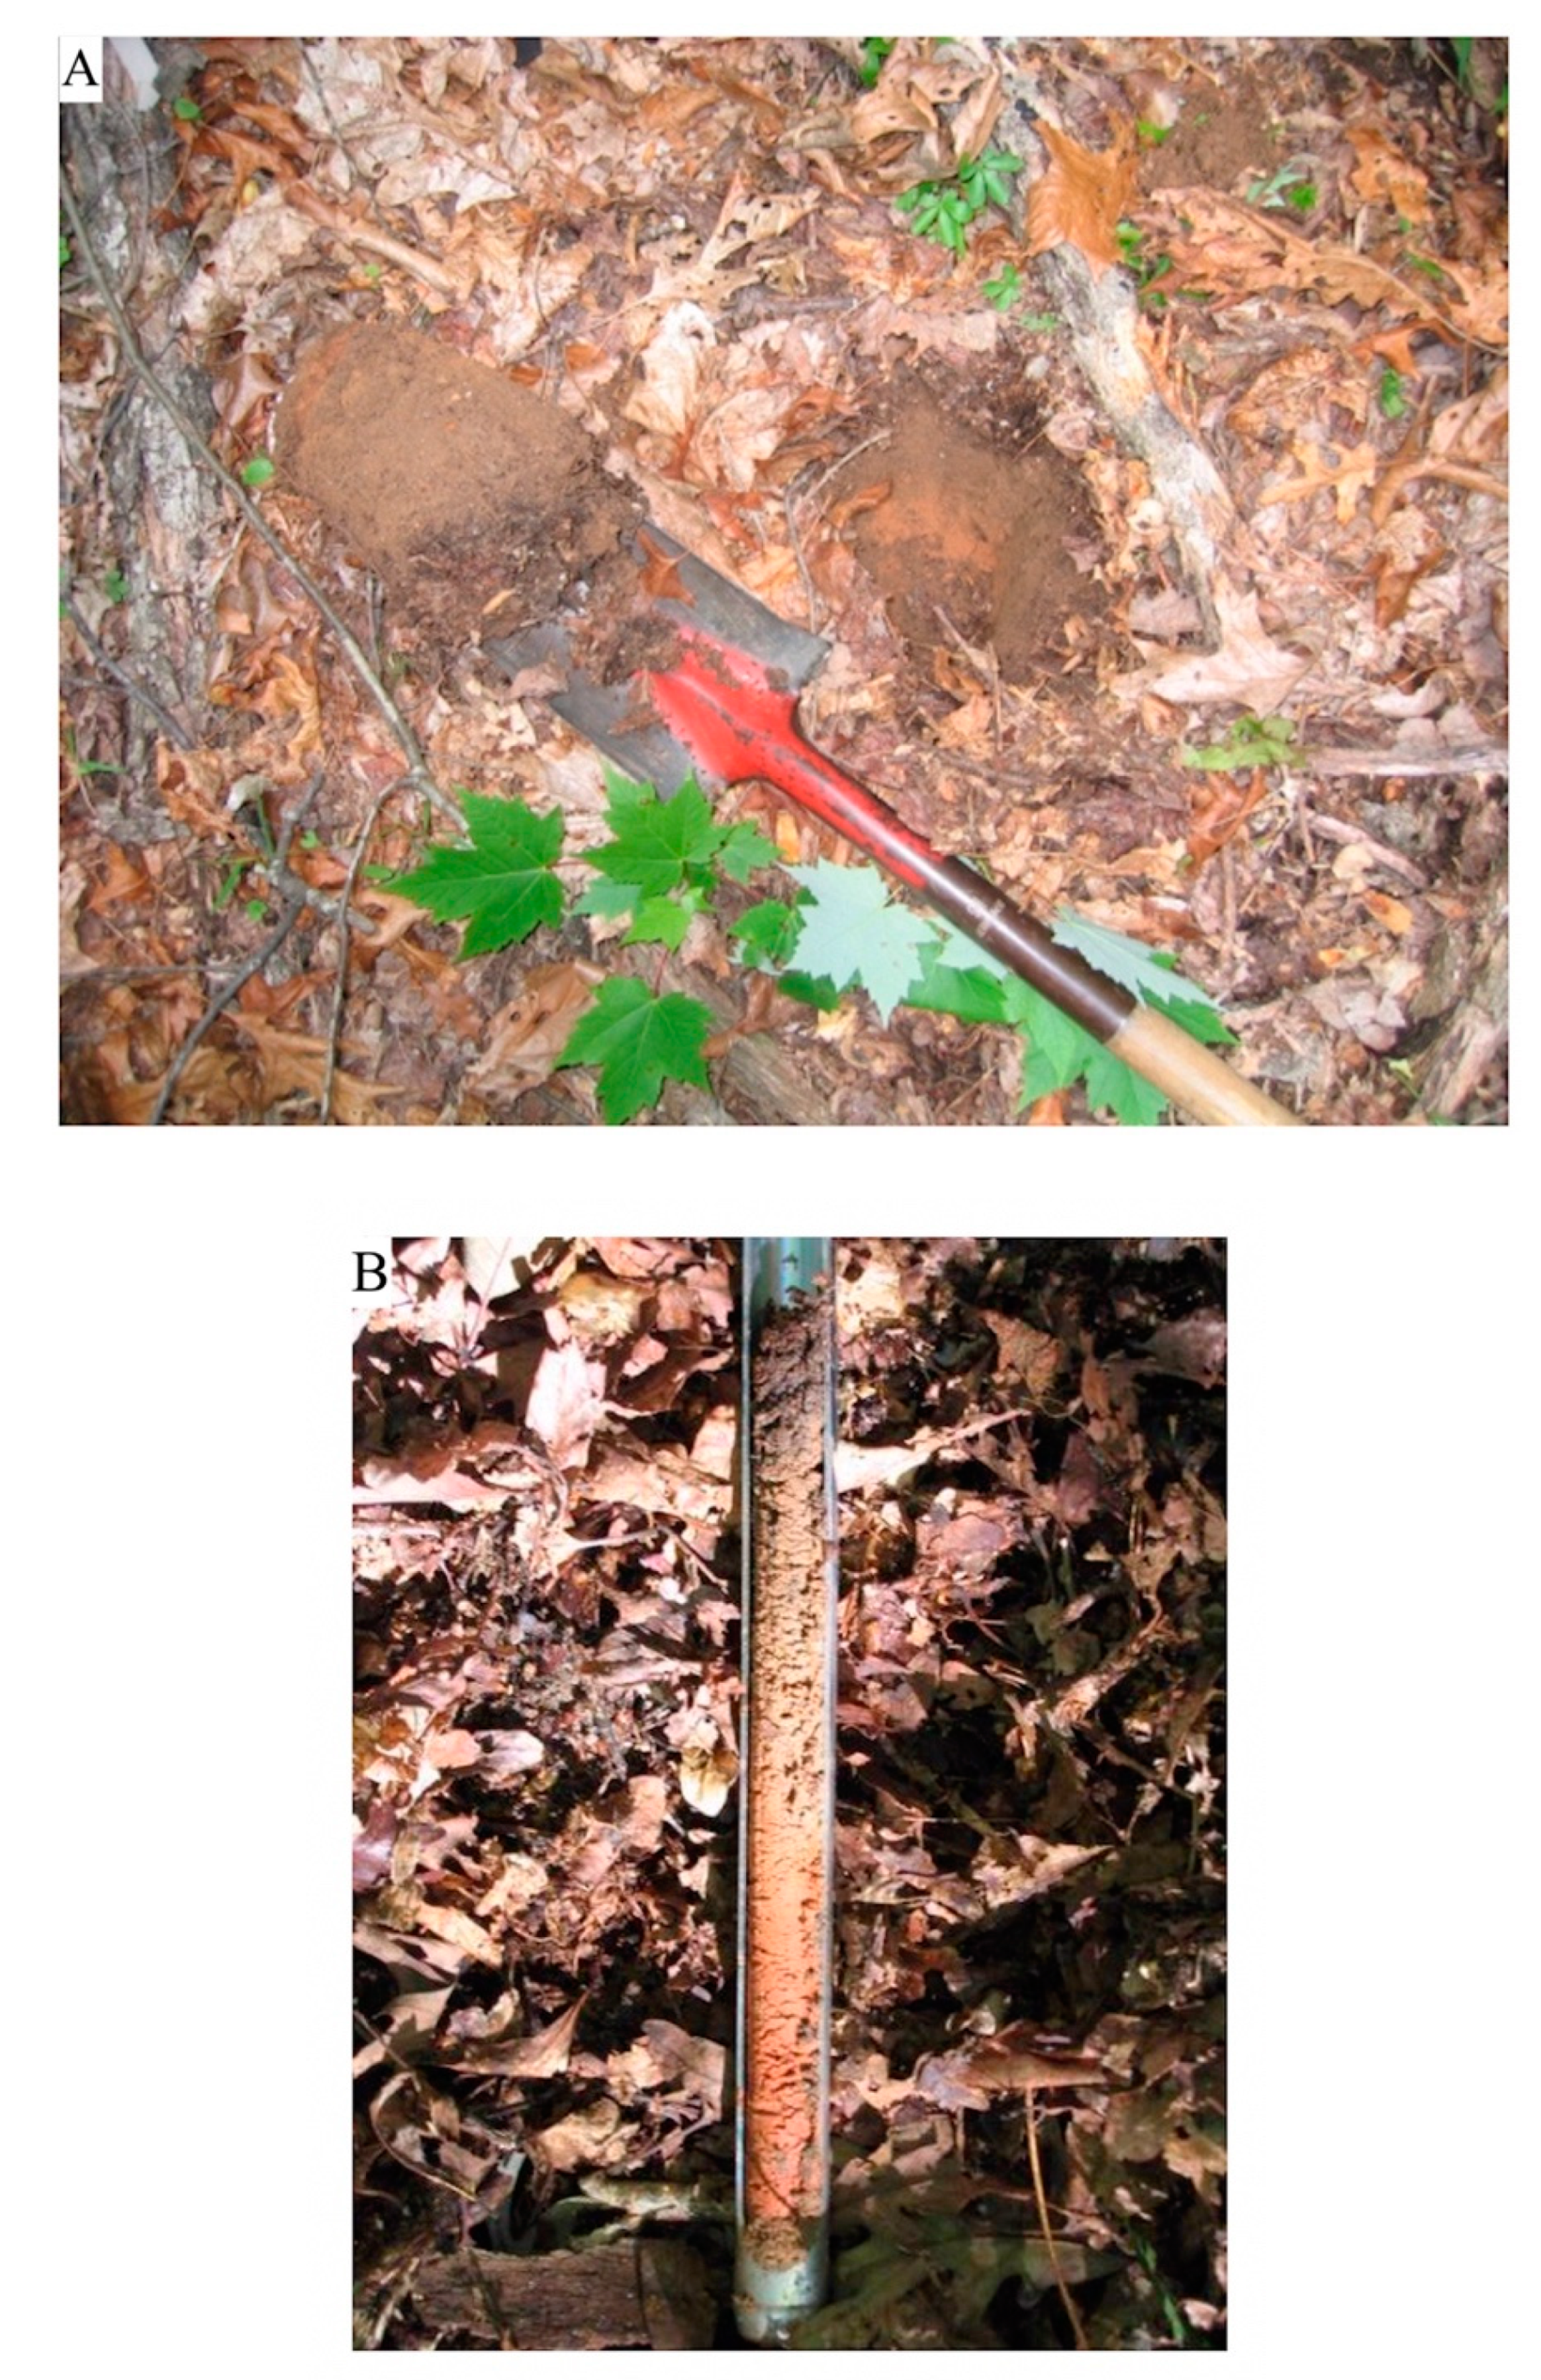
2.3. Soil Sampling, Processing, and Analyses

Ten randomly oriented 20 m × 50 m plots were established within each treatment-replicate block, resulting in 120 total treatment-replicate plots. These plots were permanently marked with rebar in each of the plot corners. Latitude and longitude coordinates were logged for each plot using GPS units. Within each plot, ten 10 m × 10 m subplots were created (Figure 2). In 2001, O horizon samples were taken from six 10 m × 10 m subplots within each of the 120 plots using a shovel (Figure 3a). Six mineral soil samples (0–10 cm depth) were collected directly below locations where the O horizon samples were obtained to evaluate mineral soil chemistry [13]. These plots were visited often and sampled for additional ecosystem components, therefore, the soil sampling locations within each plot were oriented to minimize potential disturbance from other sampling activities (Figure 2). All 120 plots were re-visited May–July 2018. Three O horizon grab samples were collected within 1 m of the 10 m × 10 m subplots in the 120 treatment-replicate plots. Three mineral soil samples (0–10 cm depth) were obtained in these exact locations using an Oakfield Model H soil probe (Oakfield Apparatus, Fond du Lac, WI, USA; inner diameter 2.06 cm) (Figure 3b).
During both sampling years, subplot samples were composited to create one O horizon sample and one mineral soil sample for each of the 120 treatment-replicate plots. Both forest floor and mineral soil samples were oven-dried at 65 °C for no less than 24 h. O horizon samples were ground using a Wiley mill in both 2001 and 2018. Mineral soil samples in 2001 were prepared using a Sawyer mill. In 2018, mineral soil samples were hand-sieved. Rock and root fragments were removed from samples during both years to include only fine earth.
The 2001 and 2018 O horizon and mineral soil chemical analyses were contracted to Brookside Analytical Laboratories in New Bremen, Ohio, USA, with the exception of the 2018 O horizon C, N, and C:N. These samples were analyzed on campus at Virginia Polytechnic Institute and State University in Blacksburg, VA, USA. Regardless of the year or lab location, similar methods were followed. O horizon and mineral soil C and N were determined by dry combustion and the resulting measurements were derived with the Perkin-Elmer 2400 Series II CHNS/O Analyzer [20]. Mineral soil calcium (Ca), magnesium (Mg), phosphorous (P), and potassium (K) concentrations were derived using Mehlich III methodology [21] and resulting analyses for each element were conducted using ICP-Optical Emission Spectrometry [22]. Soil pH was determined using a 1:1 soil to water solution [23].

2.4. Statistical Analyses

Sample sizes differed between treatments as a result of failed collections for a few plots in either sampling year (Table 1, Table 2 and Table 3). Outlier analyses were conducted, but no plot values were removed from the statistical analyses described in this section. Values for each treatment-replicate plot were entered into JMP Pro 14 (SAS Institute Inc., Cary, NC, USA). An analysis of variance (ANOVA) was conducted to determine differences between treatments during each sampling year. Differences between the 2018 and 2001 values were determined for each available treatment-replicate plot by subtracting the 2001 values from the 2018 values (subsequently referred to as ∆ values). An ANOVA was conducted to determine the significance of mean ∆ values between treatments. Additionally, mean differences between the 2018 and 2001 values were evaluated between the replications to evaluate spatial heterogeneity in soil chemical values. For each of these tests, least square means were determined and a Tukey’s HSD test was used to separate means when differences were detected. Differences were declared statistically significant at α = 0.05.
The authors noted that mineral soil C, N, C:N, Ca, and Mg ∆ values were not normally distributed when evaluated with the Kolmogorov–Smirnov test. Multiple data transformations (i.e., log, ln, square root, etc.) were not successful in resolving this issue. Non-parametric analyses were then conducted for these variables, but difference determinations between treatments were the same as those estimated using a normal distribution. Therefore, all results reported assume a normal distribution.

3. Results

3.1. O horizon Carbon, Nitrogen, and C:N

Pre-treatment O horizon C and N differed between the assigned treatments (p ≤ 0.0001) (Table 1), indicating the high degree of soil spatial heterogeneity present within this landscape. In 2018, differences were detected between O horizon N treatment means (p = 0.0042), but not O horizon C treatment means (p = 0.0695). Tukey’s HSD indicated O horizon N was greatest for the cut-only treatment (8.69 g kg−1) and differed only with the cut + burn (6.28 g kg−1) treatment, not the untreated control (7.96 g kg−1) or burn-only (7.12 g kg−1) treatments.
The mean ∆ values for O horizon C (p < 0.0001) and N (p = 0.0005) differed between treatments. Tukey’s HSD indicated the cut-only and burn-only mean ∆ values differed for both variables but did not differ from the cut + burn or untreated control treatments. The cut-only N reduction (2.83 g kg−1) accounted for 53% of the burn-only N reduction (5.32 g kg−1). The 2001 and 2018 O horizon C:N mean values and mean ∆ values did not differ between treatments for any of the statistical tests conducted (p > 0.0793 for all tests). The O horizon C:N mean ∆ values were positive for all of the fuel reduction and restoration treatments and negative for the untreated control. Although these were not statistically significant, this trend may be noteworthy as an indicator of potential increased organic matter recalcitrance. Mean ∆ values differed between the treatment replications for each of the O horizon variables (C p = 0.0002; N p = 0.0032; C:N p = 0.0122) (Table 2), further highlighting the spatial variability present for these soil properties.

3.2. Mineral Soil Carbon, Nitrogen, and C:N

Pre-treatment mineral soil C (p < 0.0001), N (p = 0.0057), and C:N (p < 0.0001) differed between the assigned treatments in 2001 (Table 1), again indicating the high degree of spatial heterogeneity present within this landscape. In 2018, mineral soil C (p = 0.0074) and N (p = 0.0412) differed between the treatments, but C:N did not (p = 0.6152). Mean mineral soil C in 2018 was highest for the cut-only treatment (32.68 g kg−1) and untreated control (32.49 g kg−1) and these values differed from the cut + burn (24.81 g kg−1) values, but not the burn-only (27.54 g kg−1) values. Mean mineral soil N was also highest for the untreated control (1.22 g kg−1) and this differed from the cut + burn (0.92 g kg−1), but not the burn-only (1.04 g kg−1) or cut-only (1.16 g kg−1) means.
Mean ∆ values differed between treatments for C, N, and C:N (p < 0.0001, p = 0.0040, and p = 0.0111, respectively) (Table 1). Tukey’s HSD indicated the cut + burn values differed from both the untreated control and burn-only values for each variable, but they did not differ from the cut-only values. Mineral soil C mean ∆ values were positive for the untreated control and burn-only treatments and the cut + burn and cut-only mean ∆ values were negative. Similarly, the burn-only N mean ∆ value was positive and the cut + burn and cut-only N mean ∆ values were negative. The untreated control N mean ∆ value was 0.0 g kg−1, however. The 2018 mean mineral soil N range was 0.92–1.22 g kg−1 N, a difference of only 0.30 g kg−1. Despite this narrow range and potentially high variability in inherent soil properties at individual sampling locations, the overall 0.42 g kg−1 N reduction from 2001–2018 for the cut + burn treatment was highest between the treatments (a 31% reduction in N between 2001–2018). Mean ∆ values for mineral soil C, N, and C:N differed between the treatment replications (C and N p ≤ 0.0001; C:N p = 0.0254) (Table 2), further highlighting the spatial variability present for these soil properties.

3.3. Mineral Soil Macronutrients and pH

Pre-treatment mineral soil P (p = 0.0006), K (p = 0.0144), and Ca (p = 0.0245) differed between the assigned treatments (Table 3). Differences between the 2018 treatment means were not detected for P, K, Ca, Mg, or pH (all p ≥ 0.1688) (Table 3). All mean ∆ values for these variables were negative. The reductions were substantial, accounting for approximately 50–57% P reductions and 41–73% Ca reductions, for example. Differences in sieving methods between 2001 (Sawyer mill) and 2018 (hand-sieved) may be related to both the direction and magnitude of these differences.
Mean ∆ values between treatments were detected for mineral soil Ca (p = 0.0116) and P (p = 0.0115) (Table 3). Tukey’s HSD suggested the Ca untreated control values differed from the cut + burn and cut-only values. The cut + burn Ca reduction was only 37% of the untreated control Ca reduction. Phosphorus mean ∆ values differed between the burn-only and cut-only treatments with the burn-only accounting for the greatest reduction. No mean ∆ value differences were detected between treatments for Mg (p = 0.6269), K (p = 0.4787), or pH (p = 0.3537) (Table 3). Magnesium (p = 0.0186) and K (p = 0.0003) mean ∆ values differed between the treatment replications (Table 2), evidence of the spatial variability present for these soil macronutrients.

4. Discussion

4.1. Temporal and Spatial Variability of Soil Properties and Fire Effects

Mean ∆ value differences between treatments were observed for O horizon C and N and mineral soil C, N, C:N, Ca, and P (Table 1 and Table 3). However, these differences existed only between some of the fuel reduction treatments, not the untreated control, for O horizon C and N (Table 1) and mineral soil P (Table 3). The cut + burn mean ∆ values differed between the untreated control and the cut-only treatment for mineral soil C and the untreated control and the burn-only treatment for both mineral soil N and C:N (Table 1). Both the cut + burn and cut-only Ca mean ∆ values differed from the untreated control (Table 3). The results for these variables suggested that changes induced by the periodic and repeated use of these treatments were greater than changes measured in the untreated control during this time period. When the 2018 ANOVA results were evaluated for these variables (Table 1), only mineral soil C and N for the cut + burn treatment differed significantly from the untreated control. Therefore, mineral soil C and N were significantly changed by the repeated use of the cut + burn treatment and these changes produced significantly altered mean values that differed from the untreated control mean values.
With this in mind, the cut + burn treatment enacted the most effective change toward one of the desired fuel reduction and ecosystem restoration goals: N limitation [15]. Not only was the change in mineral soil N from 2001–2018 greatest for the cut + burn treatment, but the resulting 2018 mineral soil N mean was also significantly different from the 2018 untreated control N mean. The reduction in mineral soil N for the cut + burn treatment did not differ from the cut-only or burn-only treatments, however. A second soils-related restoration priority for the Green River Game Lands was increased organic matter recalcitrance [15]. No treatment successfully obtained this result, however, as O horizon C:N did not differ significantly between treatments (Table 1). However, all fuel reduction mean ∆ values were positive and the untreated control mean ∆ value was negative, suggesting that O horizon C:N was higher in 2018 than 2001 for all treatments. Perhaps that is a non-significant, yet noteworthy trend. Mineral soil C:N mean ∆ values differed between the cut + burn treatment and the untreated control and burn-only treatments (Table 1). However, when the 2018 mean values were compared, no differences existed between treatments and the range in C:N values was 27.35–28.78, a difference of only 1.43 from highest to lowest. In this regard, any treatment-related C:N change most likely had little biological significance in the field and may be more related to inherent soil variability as opposed to actual treatment differences.
As noted in previous studies, soil physical, chemical, and biological properties vary spatially regardless of land uses or management regimes [2,3,4,5]. This was noted in our study with pre-treatment differences for many variables based upon the assigned treatment designations (Table 1 and Table 3) and mean ∆ value differences between replications (Table 2). These inherent differences were one primary reason mean ∆ values were selected for part of the statistical analyses included in this study. In order to accurately assess true, treatment-induced soil changes, pre-existing heterogeneity had to be addressed. Soil order (ultisols), species composition, landform, aspect, elevation, and disturbance history were similar for the forests selected as part of this study [12,13,14]. Despite this similarity, however, some soil chemical properties differed within the Green River Game Lands based upon spatial arrangement, independent of treatment-related effects.
Additionally, treatment effects on the Green River Game Lands were potentially impacted by time since disturbance. One to two years following the first implementation of these treatments, O horizon C:N (p = 0.0472) and mineral soil Ca (p = 0.0270) differed between treatments [13]. The cut + burn O horizon C:N was significantly lower than all other treatments and mineral soil Ca was lower on the cut-only and cut + burn treatments than the untreated control. Two to four years post-treatment, however, these variables did not differ between treatments, but soil pH was lower on the cut-only treatment than the untreated control (p = 0.0457). The 2018 samples were taken 3 years since the last prescribed burns occurred and 6 years since the last cutting operations were conducted. In 2018, mean O horizon (p = 0.0042) and mineral soil N (p = 0.0412) and mineral soil C (p = 0.0074) differed between treatments (Table 1). Of these variables in 2018, mineral soil C and N were the only ones that displayed differences between the untreated control and one of the fuel reduction treatments: the cut + burn treatment.
Inherently, however, the 2018 samples were also influenced not only by time since disturbance, but also treatment frequency. Four prescribed burns and two cutting operations have been conducted since 2001. Repeated treatment implementation is therefore reflected in the 2018 values and the subsequent mean ∆ values. Soils-related treatment effects vary not only as a result of time since treatment, but also as a result of treatment frequency [1,2]. In the case of wildland fire, they may also vary as a result of other fire behavior (i.e., fuels, weather, and topography) or fire regime (i.e., seasonality) factors [14,15,16]. This is particularly noteworthy when considering wildfire and prescribed fire impacts.
Most recently, C and N have received increased research attention as a result of increasing wildfire intensity and frequency in many locations globally. In a recent global meta-analysis, Pelligrini et al. [24] suggested that increased fire frequency, regardless of ignition source, may detrimentally impair soil C and N. These authors suggested that impacts in needleleaf forests may not agree with these trends, however. This would particularly apply to pine forests in the southern United States, an area heavily influenced by prescribed fires as opposed to wildfires. The Green River results and those from other prescribed fire studies (15,25,26) bear consideration in the interpretation of fire-related soil impacts, as well. Soil N may not be a limitation for all managed vegetative systems and structures in all locations globally [16,17,25,26]. Some management objectives, such as wildlife habitat management and hazardous fuel reduction, for example, necessitate different forest structures and species compositions [15,27]. Altered fire regimes, that may include more frequent and persistent prescribed fire ignitions to achieve desired management goals, may directly affect organisms as a primary soil-forming factor [28,29]. Therefore, soil chemical properties may also be altered as a product of management intent [29]. Furthermore, atmospheric N deposition and N saturation in some geographic locations may actually hamper management objectives because anthropogenic N enrichment may stifle any potential competitive advantages pyrophytic vegetation exhibit [15,16,17,18,25,26]. In a recent study of legumes in coastal longleaf pine (Pinus palustris L.) savannas in the southeastern United States, it was determined that leguminous biological N fixation did not adequately account for N losses as a result of repeated prescribed burning [25]. However, the authors found that soil N mineralization remained high and tree productivity was unrelated to N availability. This led the authors to question N limitation in these soils and also consider the impact of anthropogenic N sources that might enhance soil N. When soil results are presented as a result of anthropogenic natural resource management or natural disturbance, one should consider many factors, including but not limited to (1) the soil property in question, (2) soil type, (3) time of sampling (since treatment implementation), (4) treatment intensity, (5) method of soil analysis, (6) sampling depth, (7) primary soil forming factors, (8) spatial variability of sampling, and (9) overall management objectives. Caution should be taken when comparing wildfire and prescribed fire soil effects because fire intensity and severity may vary greatly between these fire types in a given ecosystem [30].
The Green River results offered meaningful comparisons with other prescribed fire studies globally. Where we observed decreased mineral soil C and N as a result of the cut + burn treatment, others have reported no treatment effects on nutrient cycling following cutting and burning in the southern Appalachian Mountains [31]. A lack of change in burn-only mineral soil C:N has been documented by others in oak systems [26,32,33]. In Coastal Plain pine forests, McKee [8] determined that mineral soil Ca increased at the 0–8 cm depth in Alabama (biennial, winter burns) and Florida (periodic and annual winter burns) as a result of long-term prescribed fire use. Similarly, Lavoie et al. [34] reported increased Ca, Mg, and K in mineral soils to the 0–5 cm depth 1–3 years after a single prescribed fire in a longleaf (Pinus palustris L.) and slash pine (Pinus elliottii Engelm.) forest in north central Florida. The authors suggested that increased Ca, Mg, and K in mineral soils might be related to leaching from the organic horizon as they noted decreased levels of these nutrients for the forest floor.
Soil P mean ∆ value differences noted at Green River were significant between the treatments and the largest loss was found in the burn-only treatment, which differed from the cut-only treatment (Table 2). Similar results were found as a result of burning in an Arkansas tallgrass prairie [35]. In southern Ohio oak forests, P losses were noted 4 years following prescribed burning, but the authors were not certain if this reduction was due to increased plant uptake post-fire or a change in the supply of organic matter and parent material [36]. Phosphorus has a lower relative volatilization temperature (774 °C) than other soil nutrients, such as Ca (1484 °C) [19]. Burning in Coastal Plain pine forests had little effect on long-term mineral soil P values in several research studies [8,37]. These varying results strengthen the discussion that pre-treatment soil conditions and factors such as initial base saturation, fire intensity, fire residence time, and time since fire can affect potential mineral soil P [5,6]. Mineral soil K, Mg, and pH did not differ between treatments at Green River (Table 2). This agreed with results from other studies in upland oak systems [32] and tallgrass prairies [35].

4.2. Management Implications

As noted previously, multiple applications of these treatments have now been completed on the Green River Game Lands [14]. Until 2018, however, no additional soil analyses had been completed as additional treatment installations occurred. Other properties have been evaluated, however, such as fuels, forest structure, and species composition. Waldrop et al. [12] investigated long-term fuel and vegetation dynamics on the Green River Game Lands following the repeated use of these treatments (two cuttings for the cut-only and cut + burn treatments; three burns for the burn-only and cut + burn treatments). Their investigation suggested that the burn-only treatment reduced canopy cover slightly and removed the shrub layer, while the cut + burn treatment produced a stand structure most like that of the desired open woodlands. This was achieved through delayed overstory mortality and a consistent top-killing of most shrub stems as repeated treatment implementations occurred. The burn-only and cut + burn treatments also led to increased oak regeneration and the reduction of most fuel components throughout the study. This fuel reduction in the burn-only and cut + burn treatments would most likely decrease the risk of future wildfire ignitions if the treatments were continued long-term. Additionally, the authors concluded that the burn-only and cut + burn treatments might also eventually produce the desired long-term structural conditions, but many repeated fires and/or fires occurring in different seasons would be necessary. In another investigation of vegetative dynamics at this location (two cuttings for the cut-only and cut + burn treatments; four burns for the burn-only and cut + burn treatments), Oakman et al. [14] determined that structural changes induced by the burn-only and cut + burn treatments resulted in the most favorable conditions for oak and pine regeneration. When comparing the two, the cut + burn treatment was most desired for oak and pine regeneration, however, because the burn-only treatment failed to significantly reduce undesired hardwood competition. Additionally, graminoid density and cover as additional components of the desired, open woodland structure increased most as a result of the cut + burn treatment.
As noted previously in this Discussion, mineral soil C and N results would agree with this assertion: the cut + burn treatment may best promote the desired treatment effects (Table 1). However, this is not uniform for every soil property investigated. For example, mean ∆ values for O horizon C and N were negative for all of the treatments, including the untreated control (i.e., the 2018 values were less than the 2001 values) (Table 1). Decreases in both were least for the cut-only treatment and most for the burn-only treatment. This may be most attributed to the natural process of combustion and volatilization of organic matter in the burn-only treatment [9]. Prescribed burns in this treatment predominantly consumed surface fuels as opposed to larger coarse woody debris that may have been present in the cut + burn treatment following the cutting practices [38]. Likewise, greater retention of C and N in the cut-only treatment might also be related to the increased fuel loads generated through the cutting practices [39,40]. These changes did not correlate with significant changes in O horizon C:N, however, suggesting that forest floor organic matter quality has remained relatively unchanged since this treatment regime was established.
It is additionally only speculative to suggest correlations between these soils results and the recent vegetation results mentioned above [12,14]. However, perhaps the mineral soil N reduction observed in the cut + burn treatment is related to a desired, increased presence of ectomycorrhizal trees and plants [15]. Without sampling both soils and vegetation during the same sampling periods and locations, this is only hypothesized, but this correlation could be meaningful. Therefore, future research at the Green River Game Lands should include statistical correlations between soils, fuels, and vegetation data collected at the same time. This comprehensive view may more fully inform managers and practitioners about the achievement of long-term restoration and fuel reduction objectives in light of complex ecosystem properties and responses. It should be noted that these results were collected in one geographic region in one predominant soil order. However, this soil order is generally thought to represent approximately 8–9% of Earth’s ice-free land surface, supporting approximately 18% of the world’s population [41] and the management practices evaluated have only increased in interest globally since this study began in 2001. Therefore, this long-term evaluation of soil responses to repeated treatments may serve as a valuable source of information for managers, practitioners, and researchers globally.
Additional treatment implementations may be needed to obtain and maintain the open woodland structure, species composition, soil chemistry, and hazardous wildfire fuel reduction desired at this site. A treatment frequency of 3–8 years has been recommended [15]. Fire behavior alterations may be needed to accelerate this process or potentially improve treatment success [12]. Such alterations might include continued dormant season burns at lower, acceptable relative humidity or increased days since precipitation, for example, to potentially increase fire intensity and severity [42]. Growing season burning might also promote enhanced fire behavior, but evidence for this is not conclusive at this time [43,44].

5. Conclusions

We studied southern Appalachian Mountain forest soils at the Green River Game Lands (North Carolina, USA) to determine if long-term and repeated applications of fuel reduction and ecosystem restoration treatments had substantive effects on forest soil chemistry from 2001–2018. O horizon and mineral soil (0–10 cm depth) C, N, C:N and mineral soil Ca, K, Mg, P, and pH were sampled and assessed. Changes in O horizon C and N and mineral soil C, N, C:N, Ca, and P over this time period differed between treatments. These long-term results did not align with treatment differences detected 1–2 and 2–4 years post-treatment for some variables, highlighting the time-sensitive nature of some soil responses. The change in mineral soil N from 2001–2018 was greatest for the cut + burn treatment and this result may most closely align with one of the restoration goals of promoting more N-limited mineral soils to support ectomycorrhizal, pyrophytic vegetation. However, changes in other soil parameters as a result of the treatments did not fully align with these results. When these soil results were combined with the results of other studies focused on the vegetation and fuels of the Green River Game Lands, it appeared that the continued use of these fuel reduction treatments every 3–8 years may be necessary to fully achieve this study site’s desired structure and function. Future fires of higher intensity might also accelerate the achievement of the specific restoration objectives that were targeted at this site and at similar locations throughout the Appalachian Region.

Author Contributions

Conceptualization, C.J.D., T.A.C., D.L.H., T.A.W., and D.M.S.; methodology, T.A.C., D.L.H., and T.A.W.; formal analysis, C.J.D., T.A.C., D.L.H., and W.M.A.; funding acquisition, T.A.C., D.L.H.; investigation, C.J.D. and T.A.C.; writing—original draft preparation, C.J.D. and T.A.C.; writing—review and editing, C.J.D., T.A.C., D.L.H., W.M.A., T.A.W., D.M.S.; visualization, C.J.D. and T.A.C. All authors have read and agreed to the published version of the manuscript.

Funding

Soil sampling in 2018 was supported by the USDA Forest Service Southern Research Station Joint Venture Agreement #15-JV-11330136-044. Soil processing and analyses in 2018 were paid for by Virginia Polytechnic Institute and State University.

Acknowledgments

The authors wish to acknowledge all of the individuals responsible for the initial vision and implementation of the National Fire and Fire Surrogate Study. This included numerous individuals working for the United States Department of Agriculture Forest Southern Research Station work unit located in Clemson, South Carolina, USA from 2000–2018. This research would not have been possible without their immense effort, enthusiasm, and passion. We also thank Gregg Chapman, Hannah Bailey, and Margaret Utecht for collecting soil samples during summer 2018 and Justin Loda and Yanran Wei for their assistance with the 2018 statistical analyses.

Conflicts of Interest

The authors declare no conflict of interest.

References

  1. Neary, D.G.; Ryan, K.C.; DeBano, L.F. Wildland Fire in Ecosystems: Effects of Fire on Soils and Water; General Technical Report RMRS-GTR-42; USDA Forest Service Rocky Mountain Research Station: Ogden, UT, USA, 2005; Volume 4, Available online: https://www.fs.fed.us/rm/pubs/rmrs_gtr042_4.pdf (accessed on 5 April 2020).
  2. Boerner, R.E.J. Soil, Fire, Water, and Wind: How the Elements Conspire in the Forest Context; General Technical Report NRS-P-1; USDA Forest Service Northern Research Station: Newtown Square, PA, USA, 2006; Available online: https://www.nrs.fs.fed.us/pubs/gtr/gtr_nrs-p1/boerner_p1_104.pdf (accessed on 6 April 2020).
  3. Nave, L.E.; Vance, E.D.; Swanston, C.W.; Curtis, P.S. Fire effects on temperate forest soil C and N storage. Ecol. Appl. 2011, 21, 1189–1201. [Google Scholar] [CrossRef] [PubMed] [Green Version]
  4. Santin, C.; Doerr, S.H. Fire effects on soils: The human dimension. Philos. Trans. R. Soc. B Biol. Sci. 2016, 371. [Google Scholar] [CrossRef] [PubMed] [Green Version]
  5. Alcañiz, M.; Outeiro, L.; Francos, M.; Ubeda, X. Effects of prescribed fire on soil properties: A review. Sci. Total Environ. 2017, 613, 944–957. [Google Scholar] [CrossRef] [PubMed]
  6. Coates, T.A.; Hagan, D.L.; Aust, W.M.; Johnson, A.; Keen, J.C.; Chow, A.T.; Dozier, J.H. Mineral soil chemical properties as influenced by long-term use of prescribed fire with differing frequencies in a southeastern Coastal Plain pine forest. Forests 2018, 9, 739. [Google Scholar] [CrossRef] [Green Version]
  7. Certini, G. Effects of fire on properties of forest soils: A review. Oecologia 2005, 143, 1–10. [Google Scholar] [CrossRef]
  8. McKee, W.H. Changes in Soil Fertility Following Prescribed Burning on Coastal Plain Pine Sites; Research Paper RE-234; USDA Forest Service Southern Forest Experiment Station: Asheville, NC, USA, 1982. [Google Scholar] [CrossRef]
  9. Stephens, S.L.; McIver, J.D.; Boerner, R.E.J.; Fettig, C.J.; Fontaine, J.B.; Hartsough, B.R.; Kennedy, P.L.; Schwilk, D.W. The effects of forest fuel-reduction treatments in the United States. Bioscience 2012, 62, 549–560. [Google Scholar] [CrossRef] [Green Version]
  10. Hartmann, M.; Howes, C.G.; VanInsberghe, D.; Yu, H.; Bachar, D.; Christen, R.; Nilsson, R.H.; Hallam, S.J.; Mohn, W.M. Significant and persistent impact of timber harvesting on soil microbial communities in northern coniferous forests. ISME J. 2012, 6, 2199–2218. [Google Scholar] [CrossRef] [Green Version]
  11. Wells, C.G.; Campbell, R.E.; DeBano, L.F.; Lewis, C.E.; Frederickson, R.L.; Franklin, E.C.; Froelich, R.C.; Dunn, P.H. Effects of Fire on Soil: A State-of-the-Knowledge Review; General Technical Report WO-7; USDA Forest Service Washington Office: Washington, DC, USA, 1979. [Google Scholar]
  12. Waldrop, T.A.; Hagan, D.L.; Simon, D.M. Repeated application of fuel reduction treatments in the southern Appalachian Mountains, USA: Implications for achieving management goals. Fire Ecol. 2016, 12, 28–47. [Google Scholar] [CrossRef] [Green Version]
  13. Coates, T.A.; Shelburne, V.B.; Waldrop, T.A.; Smith, B.R.; Hill, H.S., Jr.; Simon, D.M. Forest soil response to fuel reduction treatments in the southern Appalachian Mountains. In Proceedings of the 14th Biennial Southern Silvicultural Research Conference, Athens, GA, USA, 26 February–1 March 2007; Stanturf, J.A., Ed.; USDA Forest Service Southern Research Station: Asheville, NC, USA, 2010; pp. 283–287. Available online: https://www.srs.fs.fed.us/pubs/gtr/gtr_srs121/gtr_srs121_283.pdf (accessed on 7 April 2020).
  14. Oakman, E.C.; Hagan, D.L.; Waldrop, T.A.; Barrett, K. Understory vegetation responses to 15 years of repeated fuel reduction treatments in the southern Appalachian Mountains, USA. Forests 2019, 10, 350. [Google Scholar] [CrossRef] [Green Version]
  15. Boerner, R.E.J.; Coates, T.A.; Yaussy, D.A.; Waldrop, T.A. Assessing ecosystem restoration alternatives in Eastern deciduous forests: The view from belowground. Restor. Ecol. 2008, 16, 425–434. [Google Scholar] [CrossRef]
  16. Aber, J.D.; Nadelhoffer, P.; Steudler, P.; Melillo, J.M. Nitrogen saturation in northern forest ecosystems. Bioscience 1989, 39, 378–386. Available online: http://0-www-jstor-org.brum.beds.ac.uk/stable/1311067 (accessed on 7 April 2020). [CrossRef]
  17. Vogt, K.A.; Publicover, D.A.; Vogt, D.J. A critique of the role of ectomycorrhizas in forest ecology. Agric. Ecosyst. Environ. 1991, 35, 171–180. [Google Scholar] [CrossRef]
  18. Peterjohn, W.T.; Foster, C.J.; Christ, M.J.; Adams, M.B. Patterns of nitrogen availability within a forested watershed exhibiting symptoms of nitrogen saturation. For. Ecol. Manag. 1999, 119, 247–257. [Google Scholar] [CrossRef]
  19. Coates, T.A. Response of Forest Soil Resources to Fuel Reduction in the Southeastern Piedmont and Southern Appalachian Mountains. Master’s Thesis, Clemson University, Clemson, SC, USA, 2006. [Google Scholar]
  20. Nelson, D.W.; Sommers, L.E. Total carbon, organic carbon, and organic matter. In Methods of Soil Analysis, Part 3; Sparks, D.L., Page, A.L., Helmke, P.A., Loeppert, R.H., Soltanpour, P.N., Tabatabai, M.A., Sumner, M.E., Eds.; Soil Science Society of America: Madison, WI, USA, 1996; pp. 961–1010. Available online: https://dl.sciencesocieties.org/publications/books/abstracts/sssabookseries/methodsofsoilan3/961 (accessed on 8 April 2020).
  21. Mehlich, A. Mehlich 3 soil test extractant: A modification of the Mehlich 2 extractant. Commun. Soil Sci. Plan. 1984, 15, 1409–1416. [Google Scholar] [CrossRef]
  22. Boss, C.B.; Freeden, K.J. Concepts, Instrumentation and Techniques in Inductively Coupled Plasma Optical Emission Spectrometry, 3rd ed.; Perkin Elmer Life and Analytical Sciences: Sheldon, CT, USA, 2004. [Google Scholar]
  23. McLean, E.O. Soil pH and lime requirements. In Methods of Soil Analysis, Part 2. Chemical and Microbiological Properties; Page, A.L., Ed.; Soil Science Society of America: Madison, WI, USA, 1982; pp. 199–224. [Google Scholar]
  24. Pelligrini, A.; Ahlstrom, A.; Hobbie, S.; Reich, P.; Nieradzik, L.; Stayer, A.; Scharenbroch, B.; Jumpponen, A.; Anderegg, W.; Randerson, J.; et al. Fire frequency drives decadal changes in soil carbon and nitrogen in ecosystem productivity. Nature 2017, 553, 194–198. [Google Scholar] [CrossRef] [PubMed]
  25. Tierney, J.A.; Hedin, L.O.; Wurzburger, N. Nitrogen fixation does not balance fire-induced nitrogen losses in longleaf pine savannas. Ecology 2019, 100, e02735. [Google Scholar] [CrossRef]
  26. Taylor, Q.A.; Midgley, M.G. Prescription side effects: Long-term, high frequency controlled burning enhances nitrogen availability in an Illinois oak-dominated forest. For. Ecol. Manag. 2018, 411, 82–89. [Google Scholar] [CrossRef]
  27. Waldrop, T.A.; Goodrick, S.L. Introduction to Prescribed Fires in Southern Ecosystems; Science Update SRS-054; USDA Forest Service Southern Research Station: Asheville, NC, USA, 2012. Available online: https://www.srs.fs.usda.gov/pubs/41316 (accessed on 6 April 2020).
  28. Jenny, H. Factors of Soil Formation: A System of Quantitative Pedology; Dover Earth Science: North Chelmsford, MA, USA, 1941; p. 281. [Google Scholar]
  29. Coates, T.A.; Johnson, A.; Aust, W.M.; Hagan, D.L.; Chow, A.T.; Trettin, C. Forest composition, fuel loading, and soil chemistry resulting from 50 years of forest management in two southeastern Coastal Plain watersheds, USA. For. Ecol. Manag. 2010. in review. [Google Scholar]
  30. Hiers, J.K.; O’Brien, J.J.; Varner, J.M.; Butler, B.W.; Dickinson, M.; Furman, J.; Gallagher, M.; Godwin, D.; Goodrick, S.L.; Hood, S.M.; et al. Prescribed fire science: The case for a refined research agenda. Fire Ecol. 2020, 16, 11. [Google Scholar] [CrossRef] [Green Version]
  31. Knoepp, J.D.; Swank, W.T. Site preparation burning to improve southern Appalachian pine-hardwood stands: Nitrogen responses in soil, soil water, and streams. Can. J. For. Res. 1993, 23, 2263–2270. [Google Scholar] [CrossRef]
  32. Williams, R.J.; Hallgren, S.W.; Wilson, G.W.T. Frequency of prescribed burning in an upland oak forest determines soil and litter properties and alters the soil microbial community. For. Ecol. Manag. 2012, 265, 241–247. [Google Scholar] [CrossRef]
  33. Scharenbroch, B.C.; Nix, B.; Jacobs, K.A.; Bowles, M.L. Two decades of low-severity prescribed fire increases soil nutrient availability in a midwestern USA oak (Quercus) forest. Geoderma 2012, 183–184, 80–91. [Google Scholar] [CrossRef]
  34. Lavoie, M.; Starr, G.; Mack, M.C.; Martin, T.A.; Gholz, H.L. Effects of a prescribed fire on understory vegetation, carbon pools, and soil nutrients in a longleaf pine-slash pine forest in Florida. Nat. Areas J. 2010, 30, 82–94. [Google Scholar] [CrossRef]
  35. Brye, K.R. Soil physiochemical changes following 12 years of annual burning in a humid-subtropical tallgrass prairie: A hypothesis. Acta Oecol. 2006, 30, 407–413. [Google Scholar] [CrossRef]
  36. Boerner, R.E.J.; Brinkman, J.A.; Yaussy, D.A. Ecosystem restoration treatments affect soil physical and chemical properties in Appalachian mixed oak forests. In Proceedings of the 15th Central Hardwood Forest Conference, Knoxville, TN, USA, 21 February–1 March 2006; Buckley, D.S., Clatterbuck, W.K., Eds.; USDA Forest Service Southern Research Station e-General Technical Report e-GTR-SRS-101. USDA Forest Service Southern Research Station: Asheville, NC, USA, 2007; pp. 107–115. Available online: https://www.srs.fs.usda.gov/pubs/gtr/gtr_srs101/gtr_srs101-13.pdf (accessed on 5 April 2020).
  37. Waldrop, T.A.; Van Lear, D.H.; Lloyd, F.T.; Harms, W.R. Long-Term Studies of Prescribed Burning in Loblolly Pine Forests of the Southeastern Coastal Plain; General Technical Report SE-45; USDA Forest Service Southeastern Forest Experiment Station: Asheville, NC, USA, 1987. [Google Scholar] [CrossRef] [Green Version]
  38. Mohr, H.H.; Waldrop, T.A.; Rideout-Hanzak, S.; Phillips, R.J.; Flint, C.T. Effectiveness of Fire and Fire Surrogate Treatments for Controlling Wildfire Behavior in Piedmont Forests: A Simulation Study; General Technical Report SRS-GTR-71, 71-73; USDA Forest Service Southern Research Station: Asheville, NC, USA, 2004. Available online: https://www.fs.usda.gov/treesearch/pubs/6609 (accessed on 6 April 2020).
  39. Kawaguchi, H.; Yoda, K. Carbon-cycling changes during regeneration of a deciduous broadleaf forest after clear-cutting. II. Aboveground net production. Ecol. Res. 1989, 4, 271–286. [Google Scholar] [CrossRef]
  40. Knoepp, J.D.; Swank, W.T. Forest management effects on surface soil carbon and nitrogen. Soil Sci. Soc. Am. J. 1997, 61, 928–935. [Google Scholar] [CrossRef] [Green Version]
  41. Binkley, D.; Fisher, R.F. Ecology and Management of Forest Soils, 4th ed.; John-Wiley & Sons: Chichester, UK, 2013; pp. 8–20. [Google Scholar]
  42. Brose, P.H.; Dey, D.C.; Phillips, R.J.; Waldrop, T.A. A meta-analysis of the fire-oak hypothesis: Does prescribed burning promote oak reproduction in eastern North America? For. Sci. 2013, 59, 322–334. Available online: https://www.fs.usda.gov/treesearch/pubs/43818 (accessed on 7 April 2020). [CrossRef] [Green Version]
  43. Keyser, T.L.; Greenberg, C.H.; McNab, W.H. Season of burn effects on vegetation structure and composition in oak-dominated Appalachian hardwood forests. For. Ecol. Manag. 2019, 433, 441–452. [Google Scholar] [CrossRef]
  44. Van Lear, D.H.; Brose, P.H.; Keyser, P.D. Using prescribed fire to regenerate oaks. In Proceedings of the Workshop on Fire, People, and the Central Hardwoods Landscape, Richmond, KY, USA, 12–14 March 2000; Yaussy, D.A., Ed.; USDA Forest Service Northern Research Station General Technical Report GTR-NE-274. USDA Forest Service Northern Research Station: Newtown Square, PA, USA, 2000; pp. 97–102. Available online: https://www.fs.usda.gov/treesearch/pubs/23082 (accessed on 5 April 2020).
Figure 1. Location of replications 1, 2, and 3 utilized for this research study located on the Green River Green River Game Lands near Asheville, NC, USA [14].
Fire 03 00020 g001
Figure 2. Pre-treatment (2001) and post-treatment (2018) sampling locations for forest floor and mineral soil collection at the Green River Game Lands, Asheville, NC, USA.
Fire 03 00020 g002
Figure 3. (A) Shovel samples utilized for pre-treatment soil sampling and (B) Oakfield soil probe samples utilized for 2018 sampling on the Green River Game Lands, Asheville, NC, USA (ultisols).
Fire 03 00020 g003
Table 1. 2001 and 2018 O horizon and mineral soil carbon, nitrogen, and C:N values (±mean standard error) and their differences (∆) obtained on the Green River Game Lands near Asheville, NC, USA. Significant difference determinations for mean and mean ∆ values are bolded (α = 0.05) and Tukey’s HSD differences between treatments (across rows) are noted by letter distinctions.
ControlBurn-OnlyCut + BurnCut-OnlyTreatment p-Value
O Horizon
n29292929
2001 C (g kg−1)446.54 ± 7.16a457.20 ± 4.19a411.77 ± 9.76b414.35 ± 8.94b<0.0001
2018 C (g kg−1)281.53 ± 2.10a266.59 ± 17.17a248.67 ± 21.75a314.90 ± 15.31a0.0695
ΔC (g kg−1)−165.01 ± 22.98ab−190.61 ± 18.05b−163.10 ± 24.90ab−99.45 ± 17.29a<0.0001
2001 N (g kg−1)12.44 ± 0.27ab12.44 ± 0.19a11.10 ± 0.27c11.52 ± 0.28bc0.0001
2018 N (g kg−1)7.96 ± 0.53ab7.12 ± 0.48ab6.28 ± 0.48b8.69 ± 0.46a0.0042
ΔN (g kg−1)−4.48 ± 0.59ab−5.32 ± 0.54b−4.82 ± 0.63ab−2.83 ± 0.49a0.0005
2001 C:N36.21 ± 7.56a36.92 ± 5.33a37.33 ± 0.82a36.29 ± 0.86a0.6798
2018 C:N35.15 ± 1.29a38.56 ± 1.15a38.93 ± 1.11a37.11 ± 1.17a0.0793
ΔC:N−1.06 ± 1.02a1.64 ± 1.21a1.60 ± 1.00a0.82 ± 0.97a0.2286
Mineral Soil
n29272929
2001 C (g kg−1)26.17 ± 1.33b22.77 ± 0.87b33.20 ± 2.03a34.55 ± 1.68a<0.0001
2018 C (g kg−1)32.49 ± 2.52a27.54 ± 1.97ab24.81 ± 2.00b32.68 ± 2.10a0.0074
ΔC (g kg−1)6.32 ± 2.72a4.77 ± 0.09a−8.39 ± 2.52b−1.87 ± 2.33ab<0.0001
2001 N (g kg−1)1.22 ± 0.07ab1.06 ± 0.05b1.34 ± 0.08a1.41 ± 0.09a0.0057
2018 N (g kg−1)1.22 ± 0.10a1.04 ± 0.08ab0.92 ± 0.08b1.16 ± 0.08ab0.0412
ΔN (g kg−1)0.00 ± 0.11a0.02 ± 0.09a−0.42 ± 0.10b−0.25 ± 0.10ab0.0040
2001 C:N21.80 ± 0.62b21.99 ± 0.69b24.96 ± 0.65a25.13 ± 7.02a<0.0001
2018 C:N27.46 ± 1.19a27.38 ± 0.91a27.35 ± 0.47a28.78 ± 1.04a0.6152
ΔC:N5.66 ± 1.03a5.39 ± 0.90a2.39 ± 0.50b3.65 ± 0.74ab0.0111
Table 2. Mean differences in 2001 and 2018 (±mean standard error) O horizon and mineral soil variables for treatment replications on the Green River Game Lands near Asheville, NC, USA. Significant difference determination for mean Δ values are bolded (α = 0.05) and Tukey’s HSD differences between replications (across rows) are noted by letter distinctions.
Replication 1Replication 2Replication 3p-Value
n373840
O horizon ΔC (g kg−1)−105.86 ± 19.93a−209.81 ± 15.78b−148.44 ± 17.28a0.0002
O horizon ΔN (g kg−1)−3.28 ± 0.54a−5.58 ± 0.49b−4.24 ± 0.43ab0.0032
O horizon ΔC:N2.43 ± 0.92a−1.37 ± 0.85b12.06 ± 8.99ab0.0122
n393936
Mineral Soil ΔC (g kg−1)6.51 ± 2.51a−6.54 ± 1.88b0.45 ± 1.99a<0.0001
Mineral Soil ΔN (g kg−1)0.13 ± 0.09a−0.50 ± 0.08c−0.16 ± 0.07b< 0.0001
Mineral Soil ΔC:N2.83 ± 0.68b5.36 ± 0.76a4.58 ± 0.69ab0.0254
n393935
Mineral Soil ΔP (mg kg−1)−7.12 ± 0.48a−7.69 ± 0.44a−7.36 ± 0.61a0.6403
Mineral Soil ΔK (mg kg−1)−13.38 ± 1.88a−22.12 ± 1.92b−25.01 ± 2.36b0.0003
Mineral Soil ΔCa (mg kg−1)−134.19 ± 31.60a−198.15 ± 38.06a−157.57 ± 34.45a0.3606
Mineral Soil ΔMg (mg kg−1)−6.32 ± 2.10a−14.04 ± 1.43b−11.81 ± 2.42ab0.0186
Mineral Soil ΔpH−0.39 ± 0.05a−0.31 ± 0.03a−0.32 ± 0.03a0.3135
Table 3. 2001 (or 2002 for soil pH) and 2018 mineral soil (0–10 cm soil depth) calcium (Ca), magnesium (Mg), phosphorus (P), potassium (K), and pH values (± mean standard error) and their differences (Δ) obtained on the Green River Game Lands near Asheville, NC, USA. Significant difference determination for mean and mean Δ values are bolded (α = 0.05) and Tukey’s HSD differences between treatments (across rows) are noted by letter distinctions.
Soil PropertyControlBurn-OnlyCut + BurnCut-OnlyTreatment p-Value
n28272929
2001 P (mg kg−1)14.36 ± 0.50ab15.13 ± 0.49a13.19 ± 0.48bc12.45 ± 0.44c0.0006
2018 P (mg kg−1)6.39 ± 0.29a6.48 ± 0.41a6.31 ± 0.40a6.28 ± 0.31a0.9762
ΔP (mg kg−1)−7.97 ± 0.57ab−8.65 ± 0.42b−6.88 ± 0.67ab−6.17 ± 0.54a0.0115
2001 K (mg kg−1)55.61 ± 2.64ab57.15 ± 2.68a48.78 ± 1.97b50.47 ± 2.28ab0.0144
2018 K (mg kg−1)34.11 ± 2.61a35.33 ± 1.73a31.10 ± 1.87a31.28 ± 2.16a0.3713
ΔK (mg kg−1)−21.50 ± 3.17a−21.82 ± 2.27a−17.68 ± 2.20a−19.19 ± 2.38a0.4787
2001 Ca (mg kg−1)346.69 ± 45.71a311.85 ± 43.64a230.33 ± 29.43b183.48 ± 29.55b0.0245
2018 Ca (mg kg−1)92.42 ± 8.78a87.83 ± 5.73a135.96 ± 28.91a88.21 ± 7.07a0.1688
ΔCa (mg kg−1)−254.27 ± 45.34b−224.02 ± 42.85ab−94.37 ± 44.85a−95.27 ± 29.49a0.0116
2001 Mg (mg kg−1)34.33 ± 3.05a31.29 ± 1.43a30.52 ± 1.59a30.52 ± 1.66a0.3039
2018 Mg (mg kg−1)20.00 ± 2.46a19.75 ± 1.18a21.25 ± 3.71a20.04 ± 2.49a0.9898
ΔMg (mg kg−1)−14.33 ± 2.34a−11.54 ± 1.70a−9.27 ± 3.79a−10.48 ± 2.14a0.6269
2002 pH4.55 ± 0.05a4.58 ± 0.05a4.60 ± 0.03a4.58 ± 0.04a0.7455
2018 pH4.25 ± 0.06a4.24 ± 0.05a4.28 ± 0.06a4.17 ± 0.04a0.3110
ΔpH−0.30 ± 0.05a−0.34 ± 0.06a−0.32 ± 0.05a−0.41 ± 0.04a0.3537

