
Full-Scale Blast Tests on a Conventionally Designed Three-Story Steel Braced Frame with Composite Floor Slabs


Abstract
:1. Introduction
2. Problem Statement, Scope, and Objectives
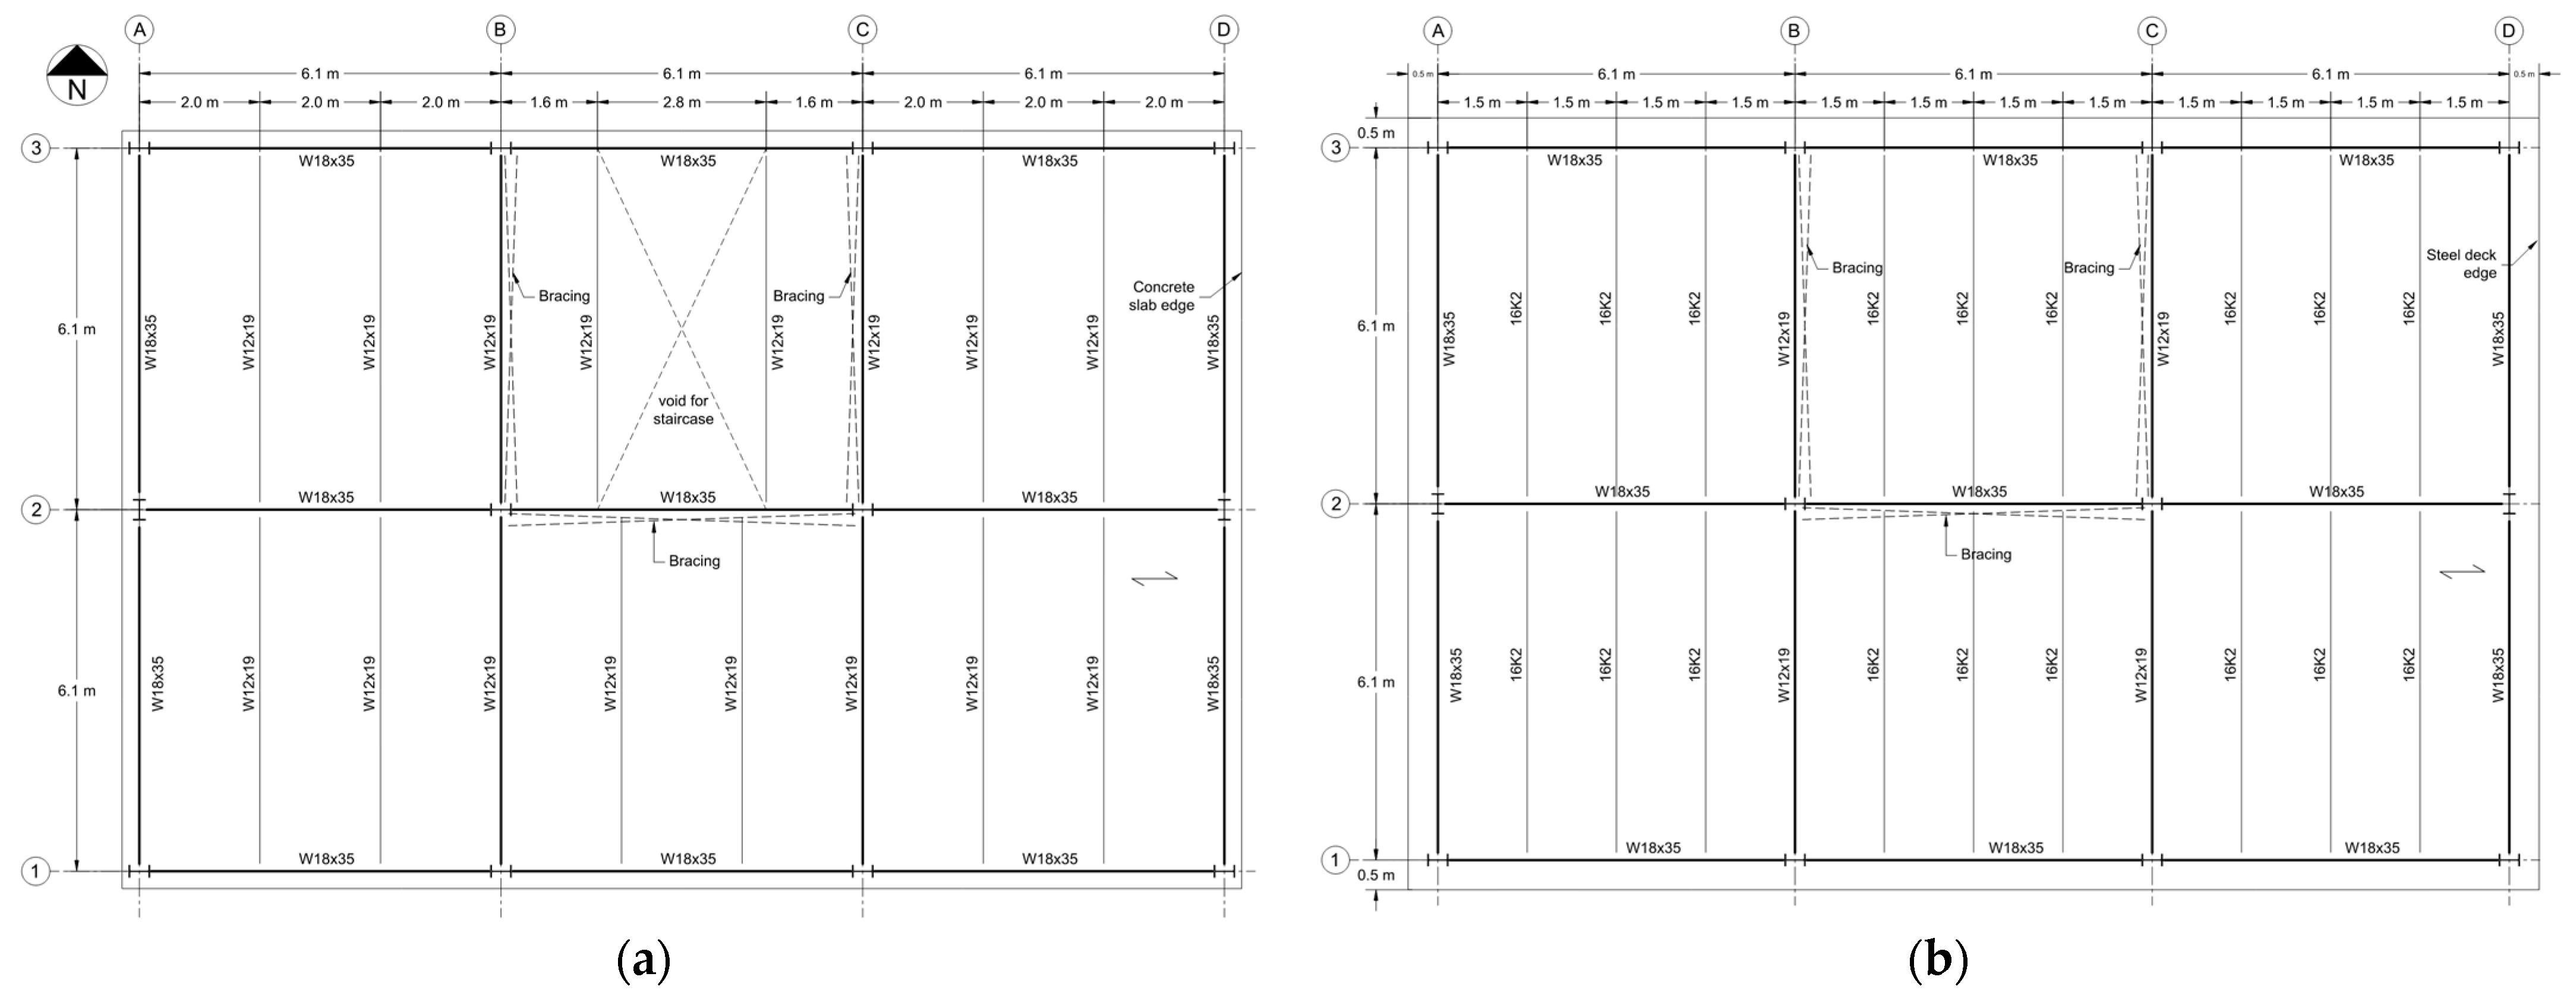
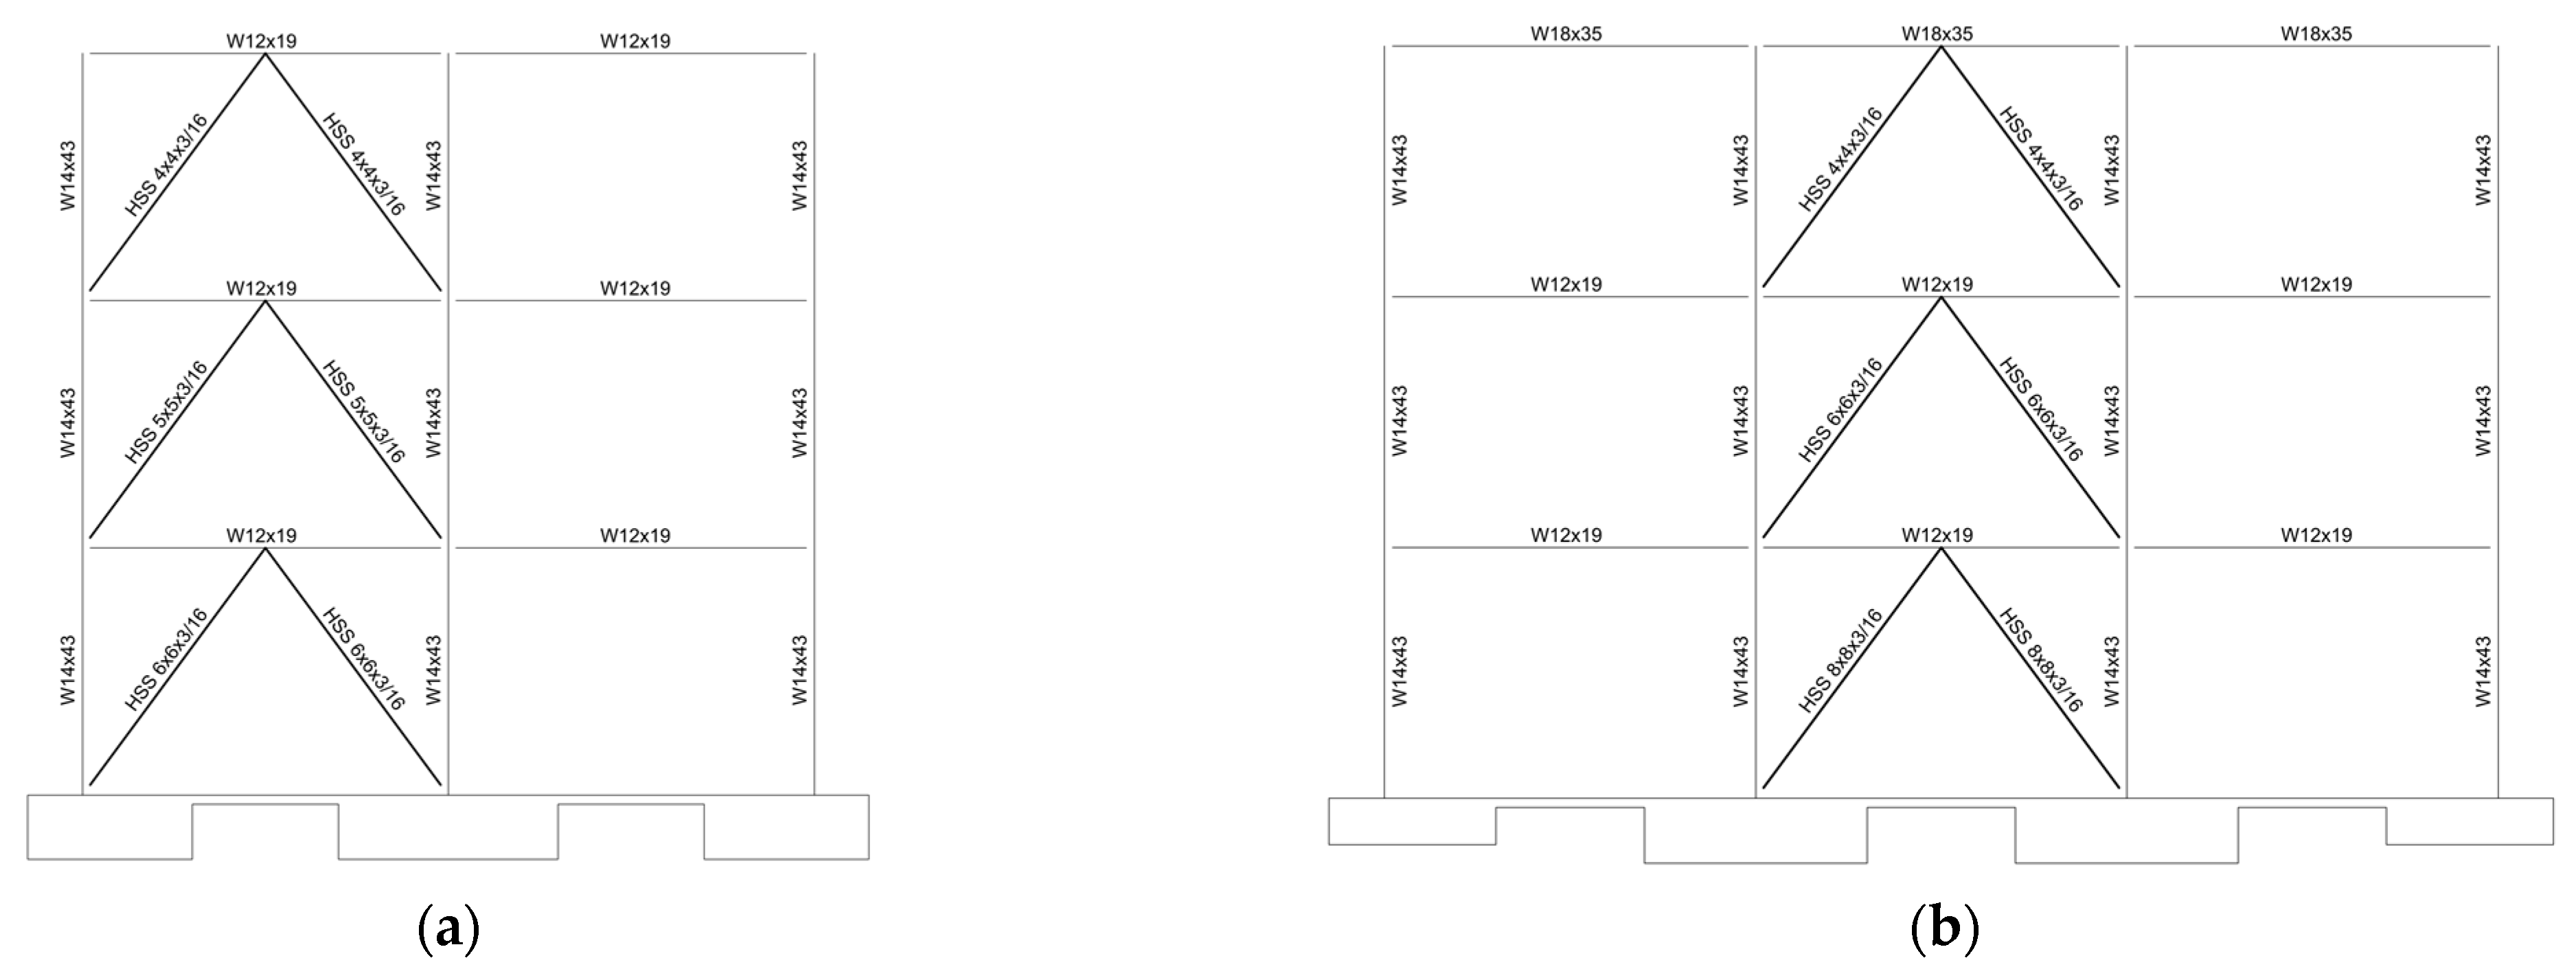
3. Description of Three-Story Steel Frame Test Structure
3.1. Choice of Test Structure
3.2. Design of Test Structure
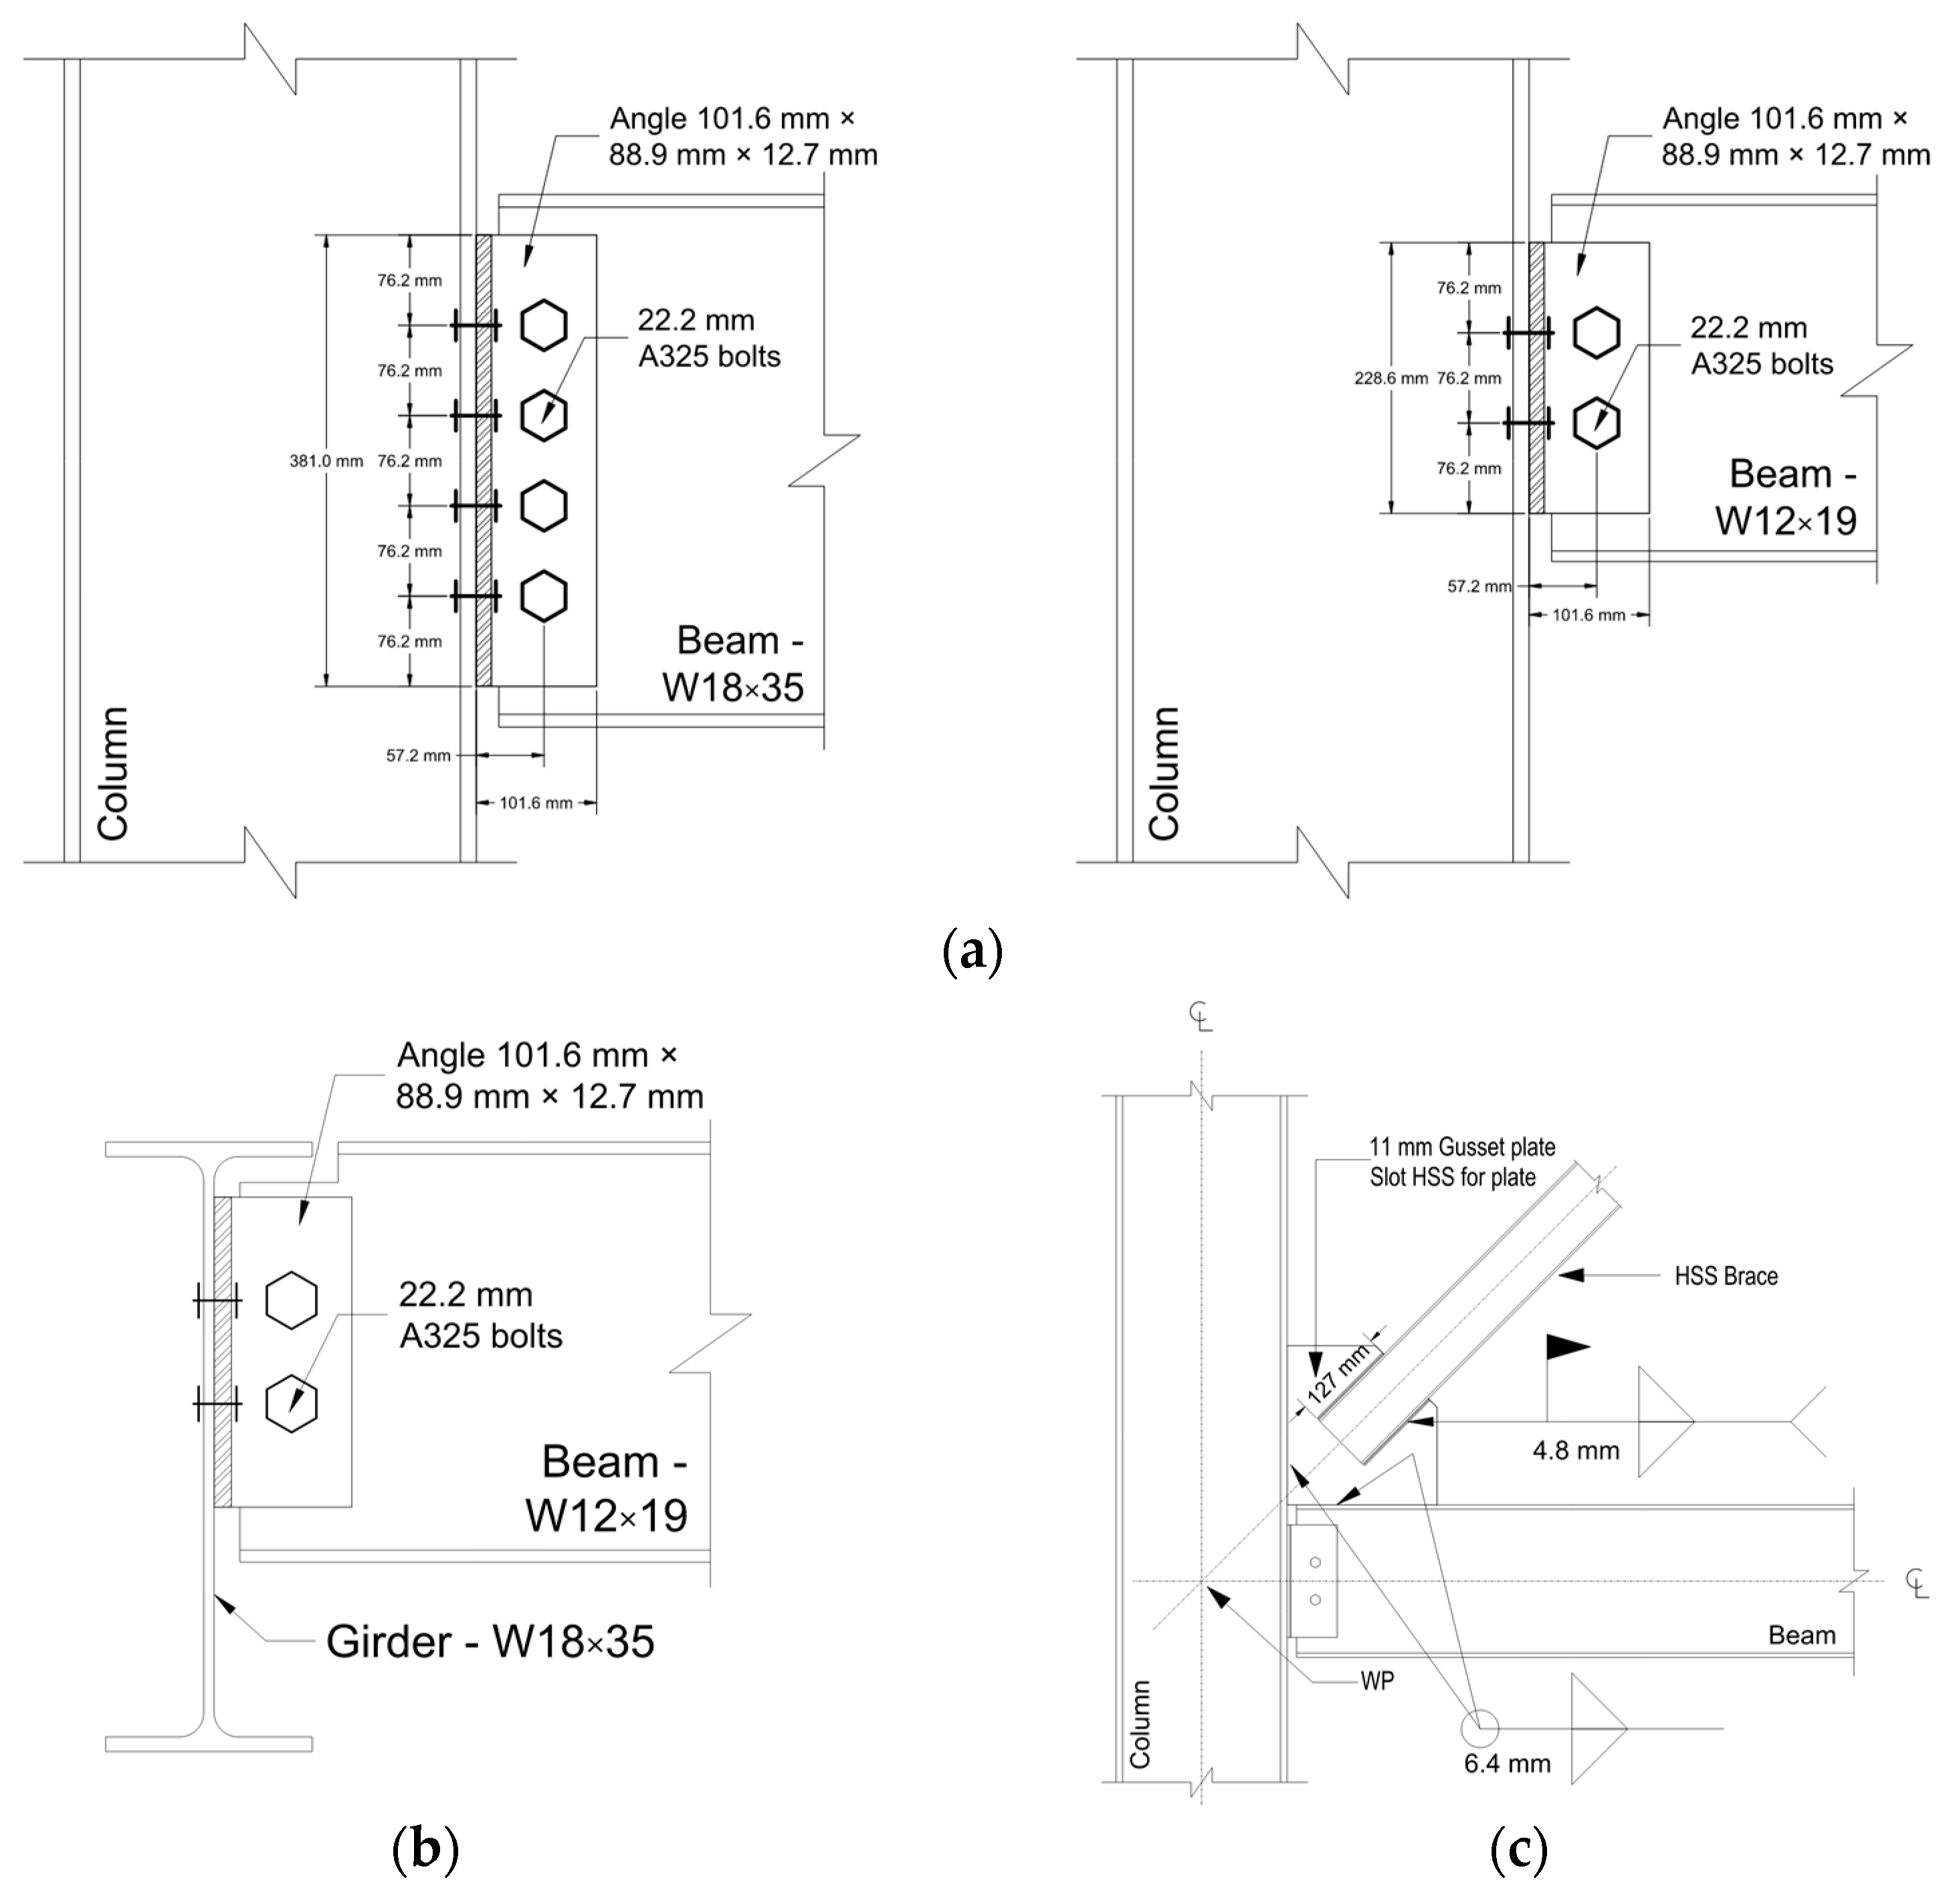
3.3. Structural Connection Details
3.4. Material Properties
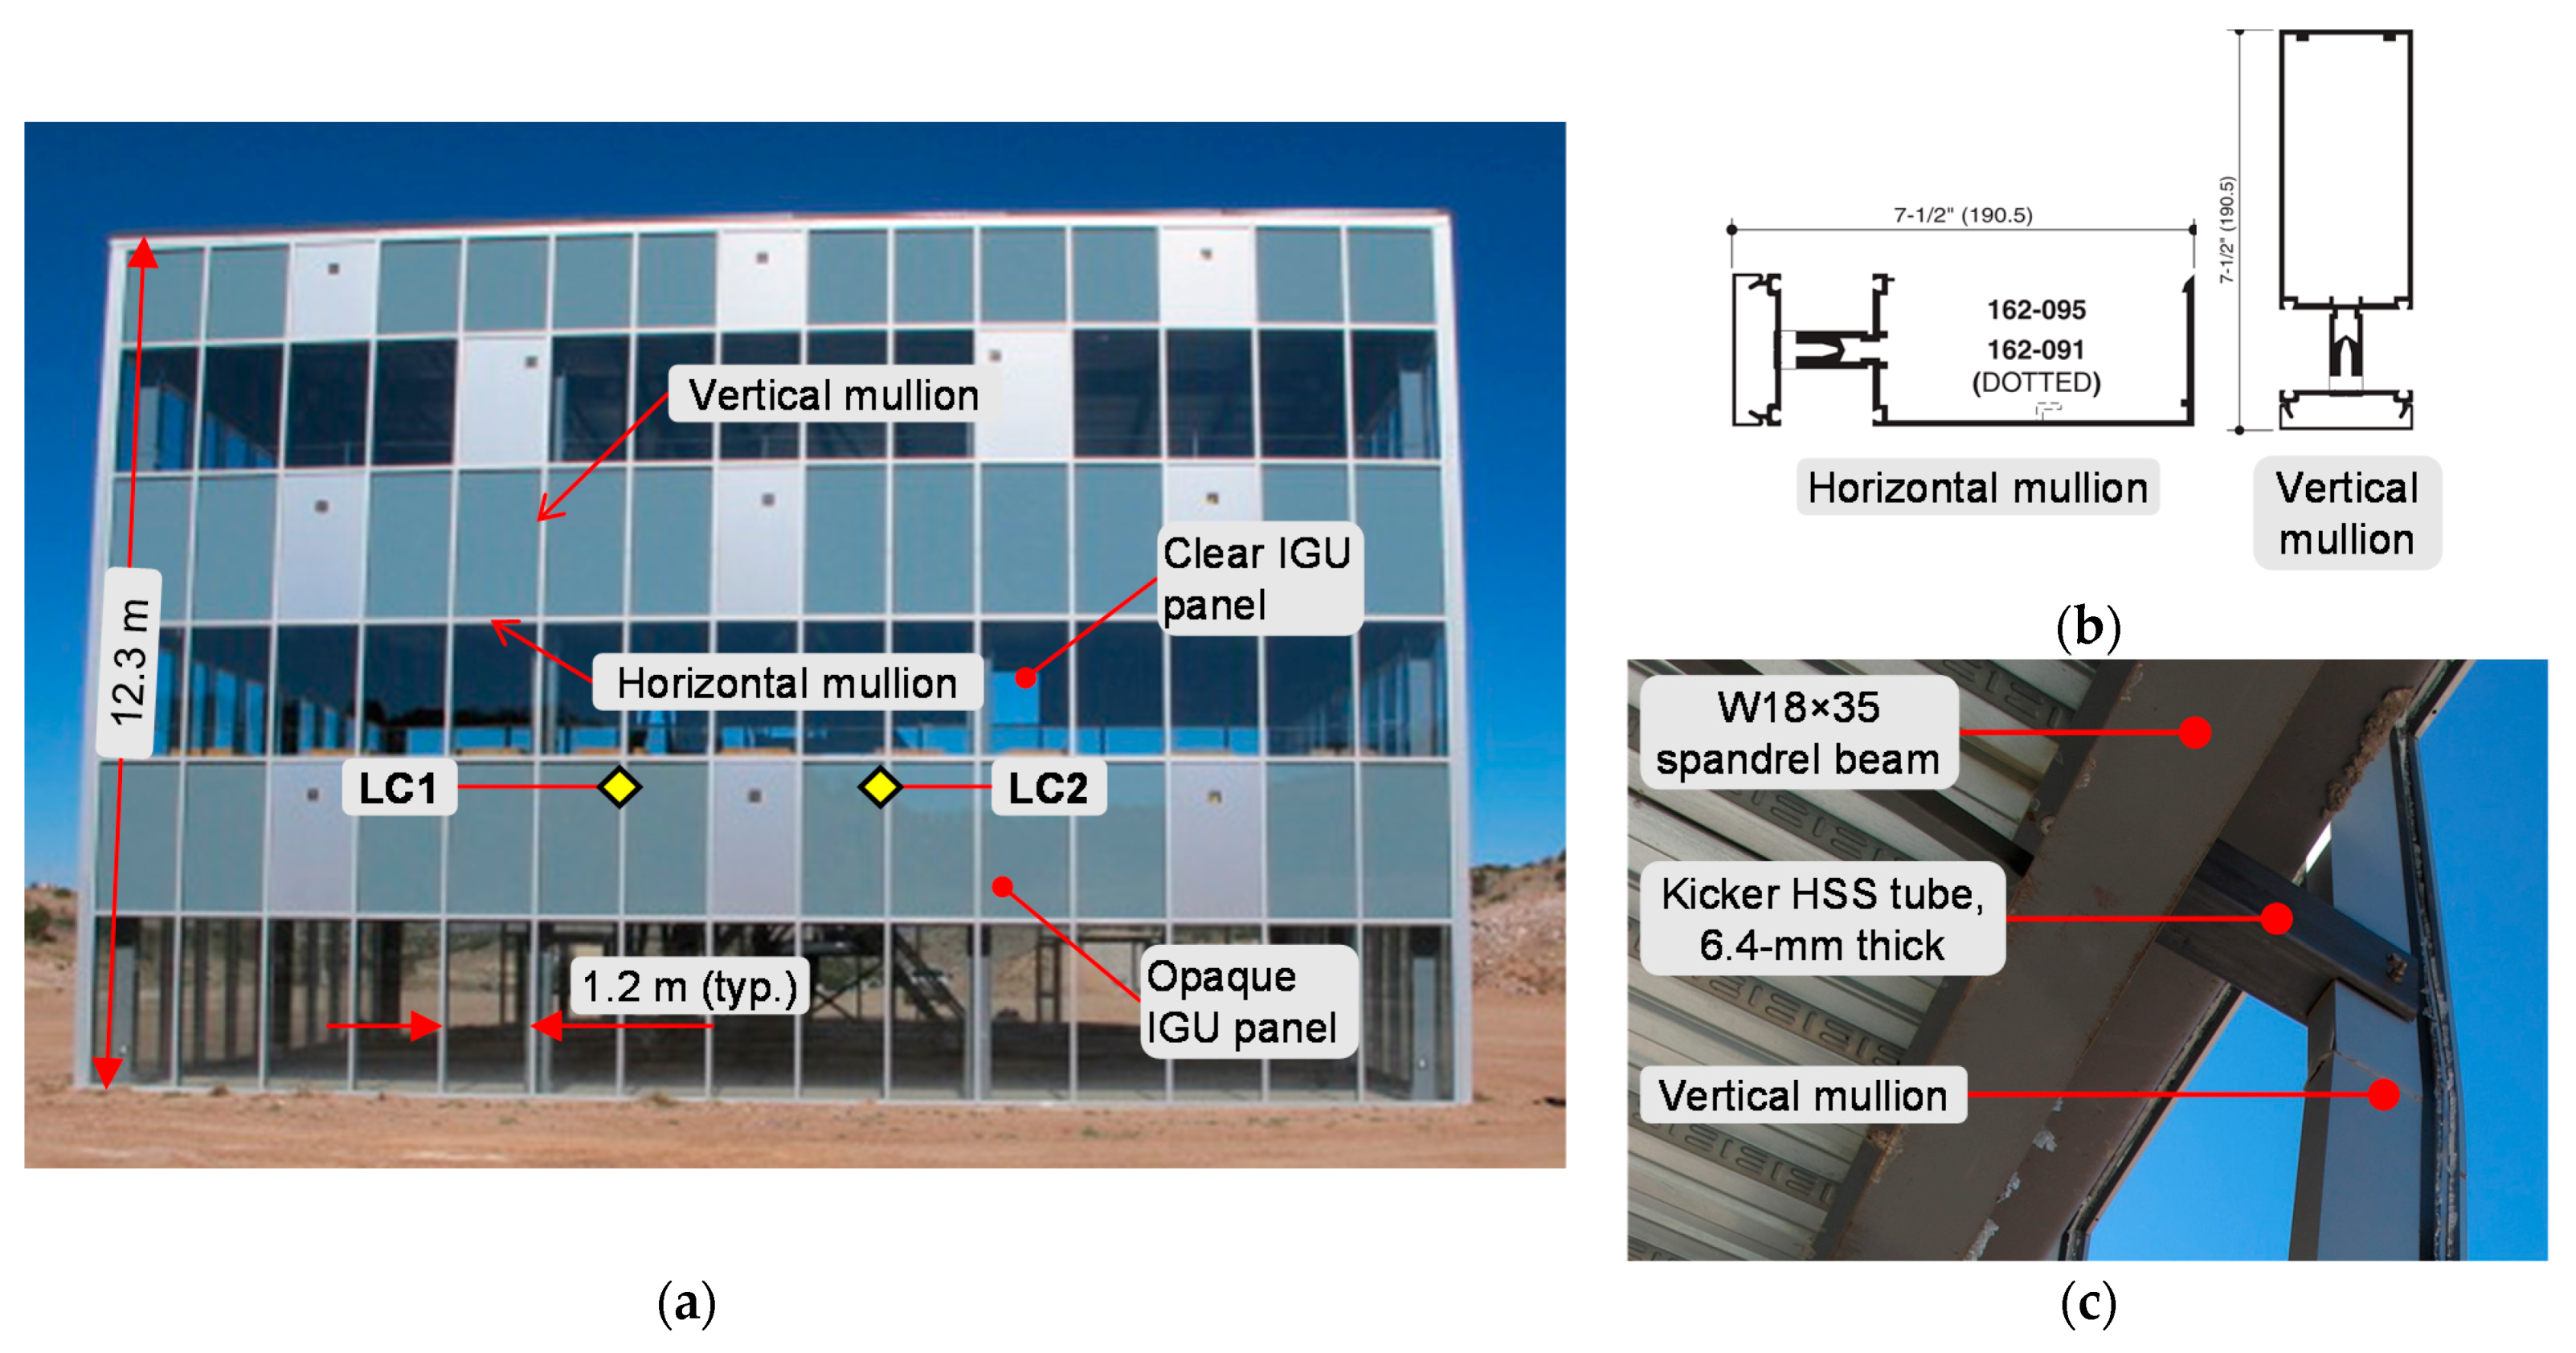
3.5. Conventional Façade Details
3.6. Blast-Resistant Façade Details
3.7. Instrumentation
- Pressure gauges (PG);
- Displacement gauges (DG);
- Strain gauges (SG) on selected key elements of the LFRS;
- Load cells (LC) on some façade-to-structure connection points.
3.8. Test Procedure
4. Response of Test Structure to Blast Load
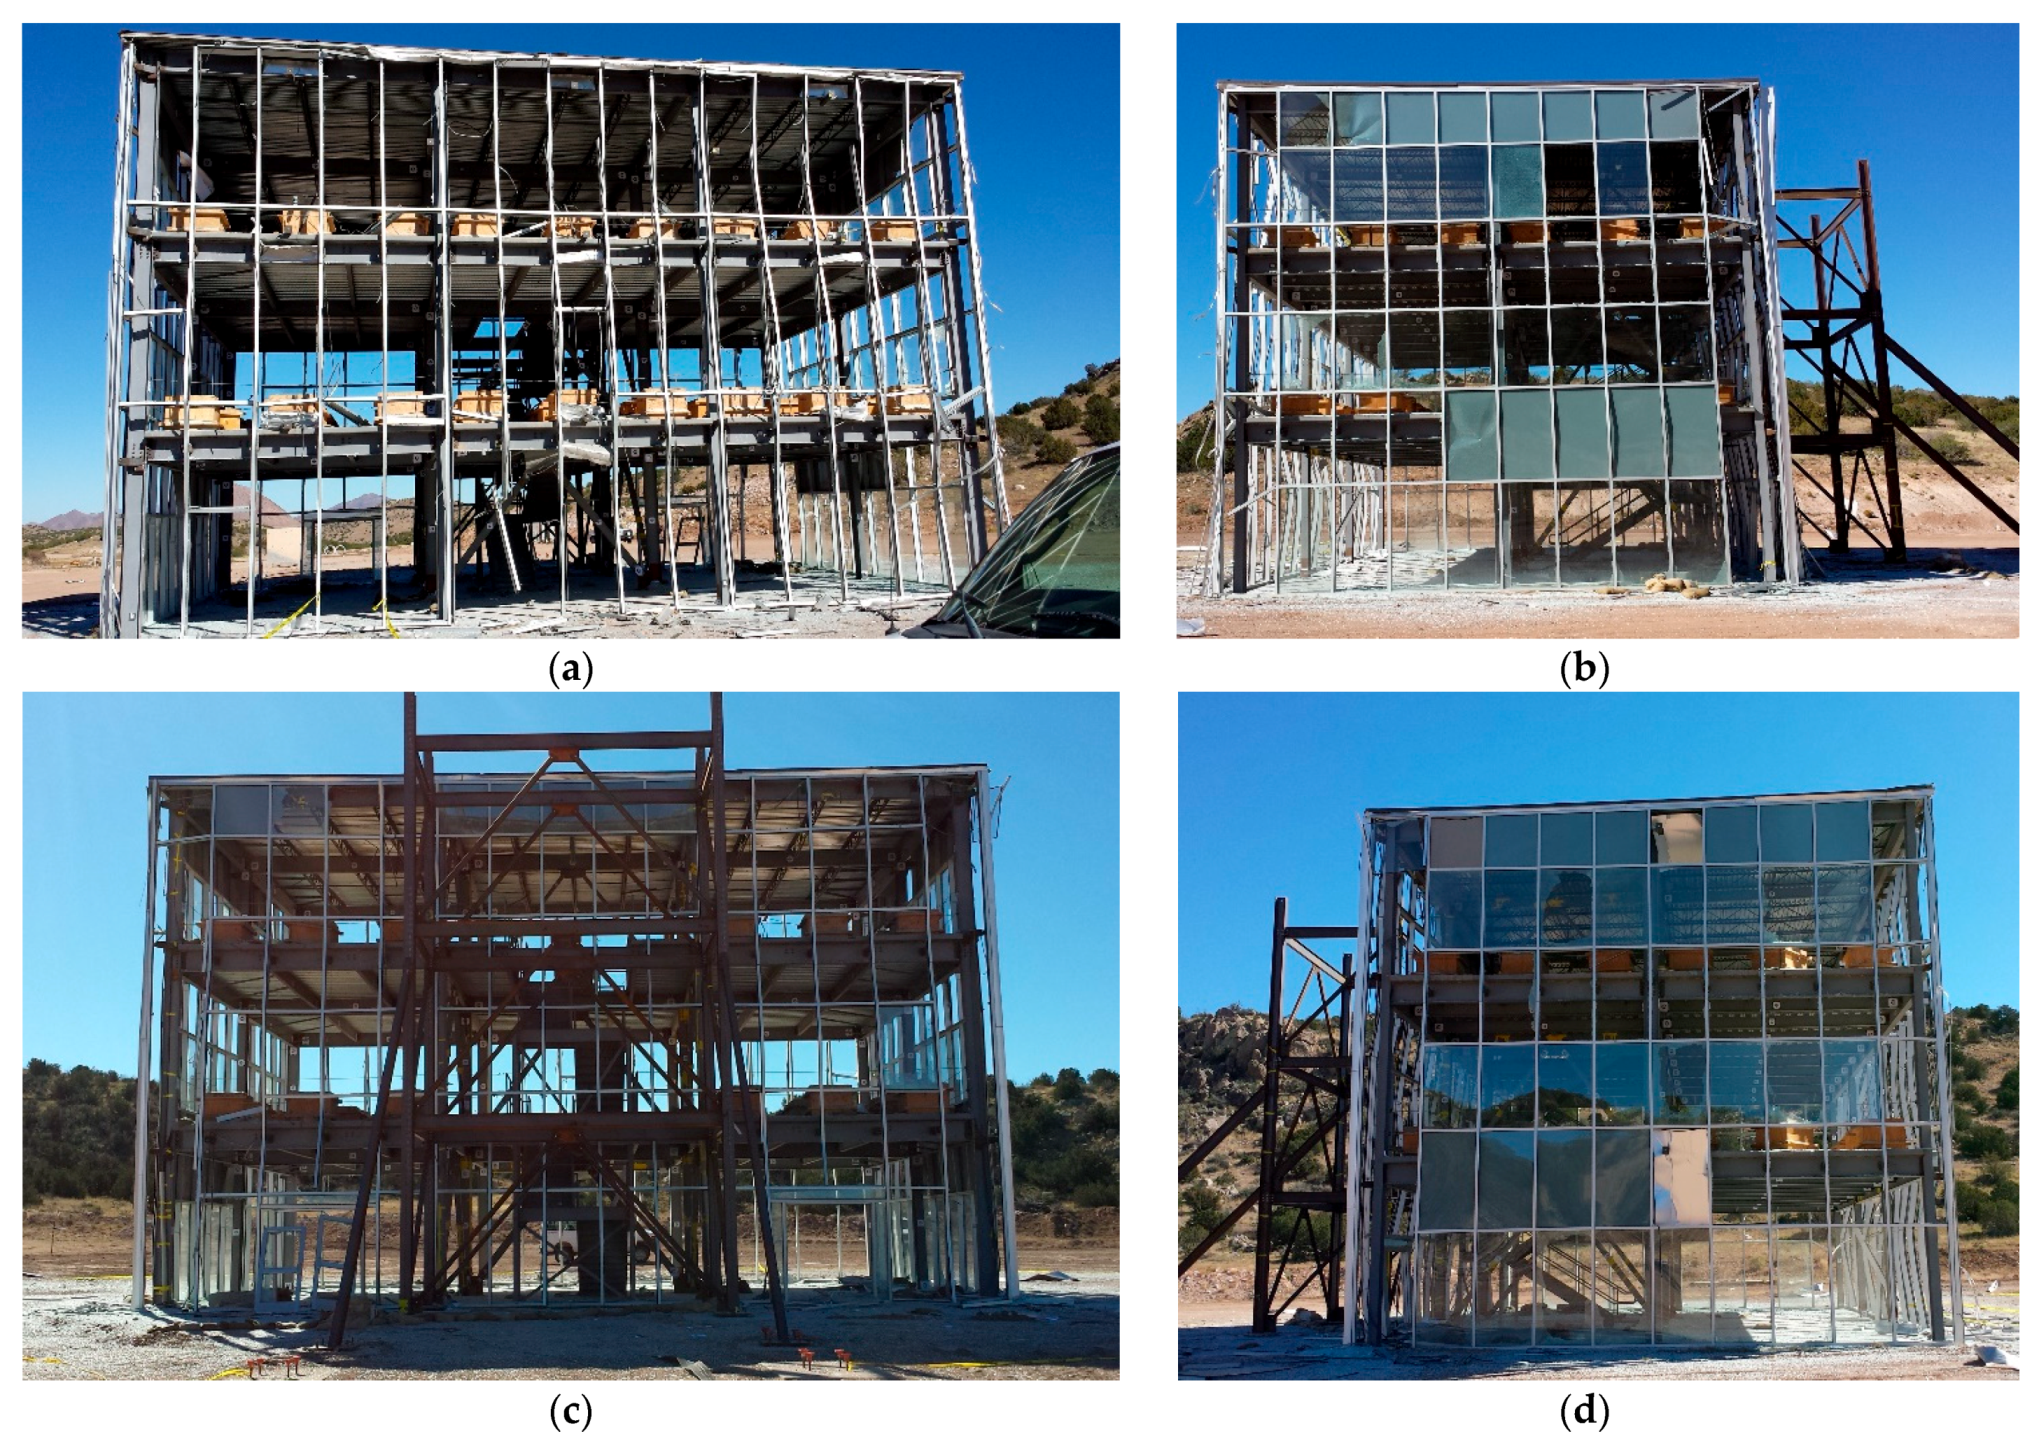
4.1. Blast Test 1 on Frame with Conventional Façade
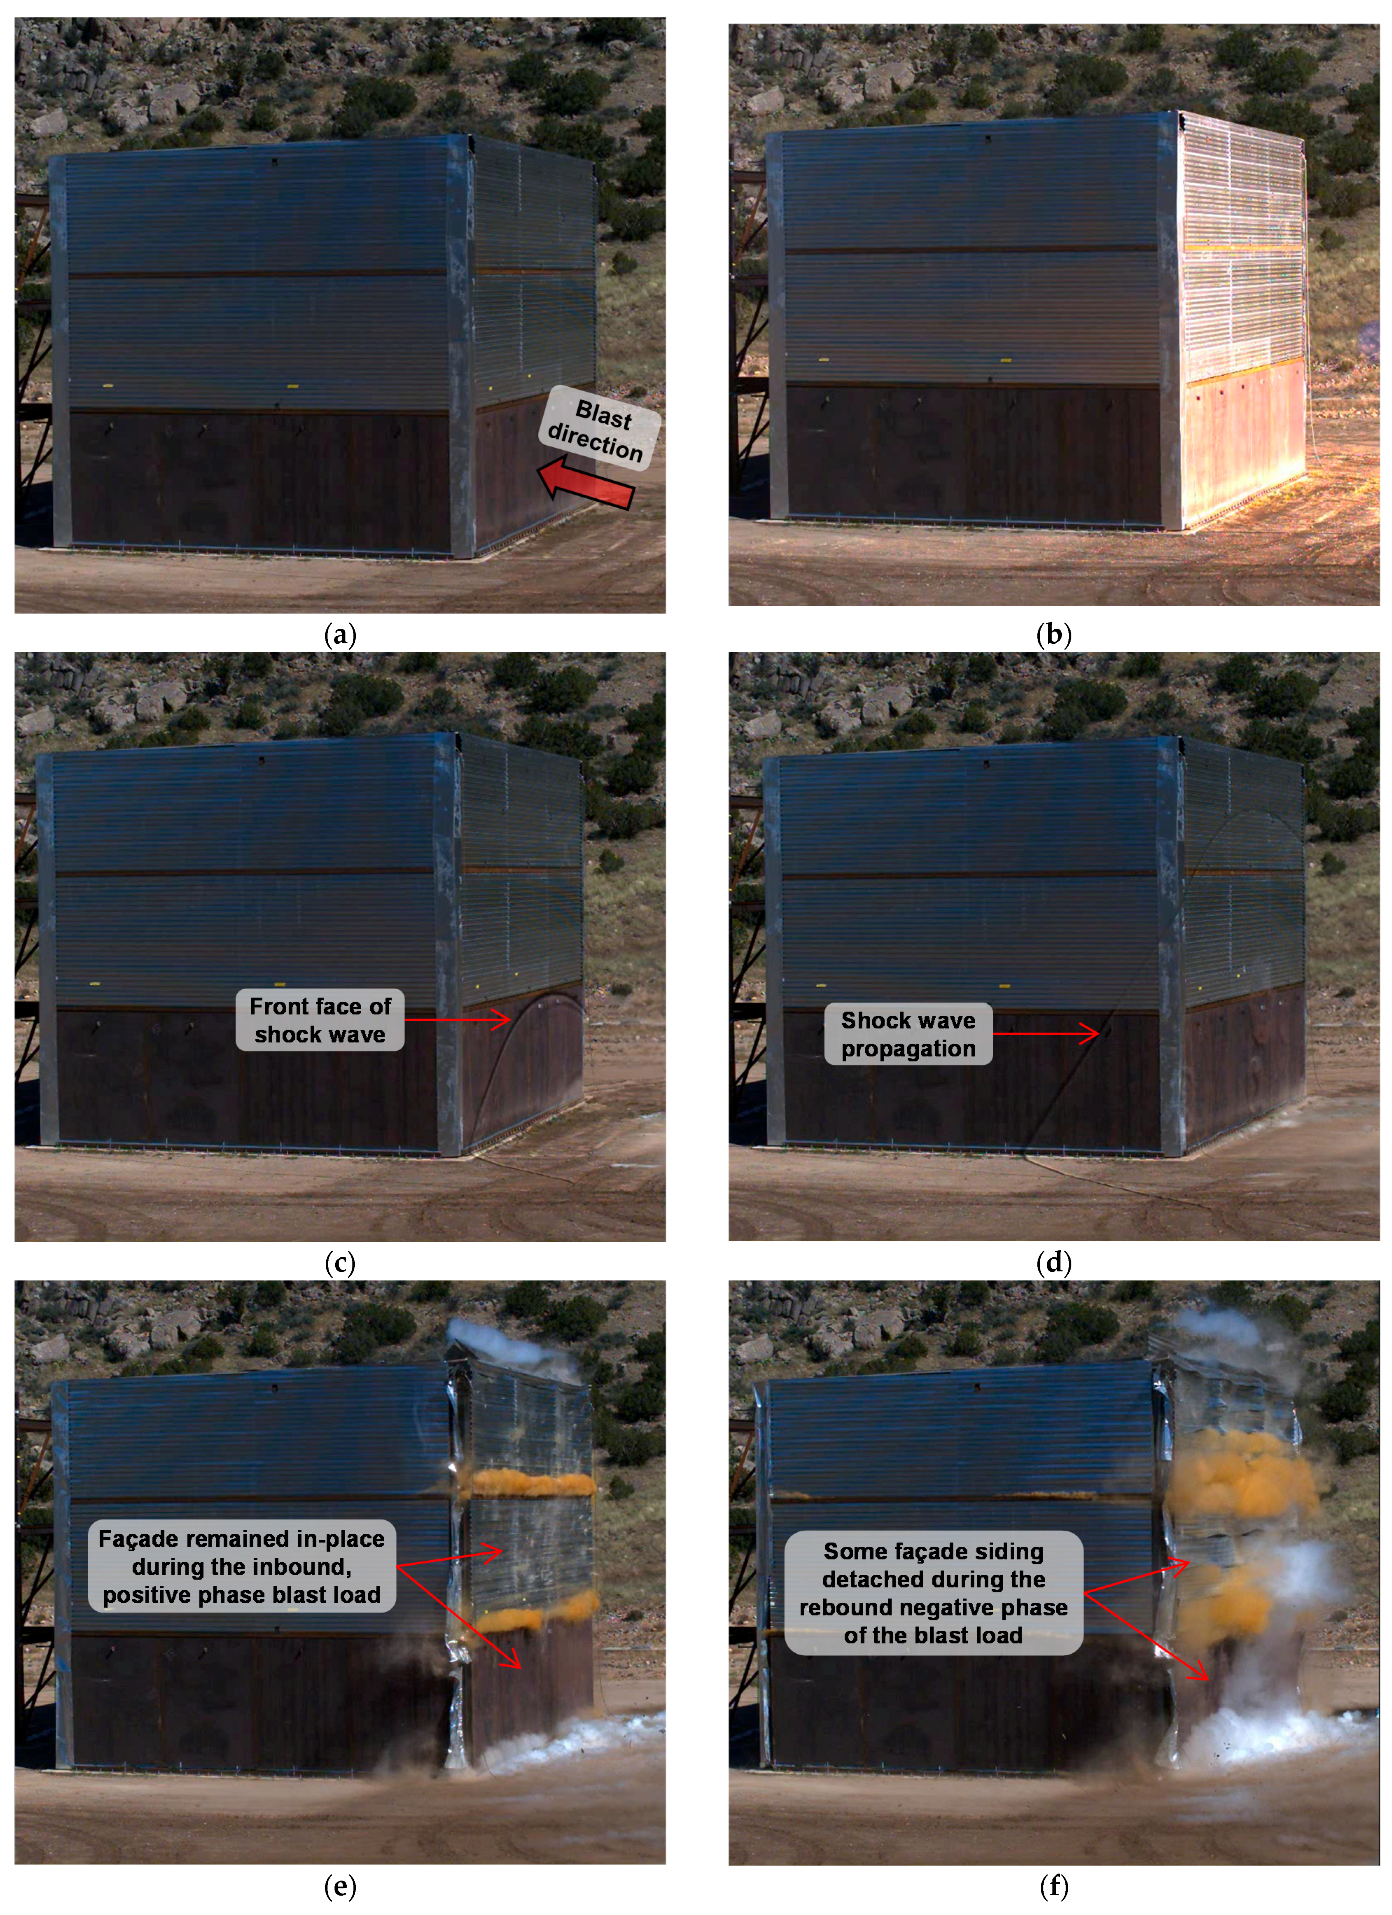
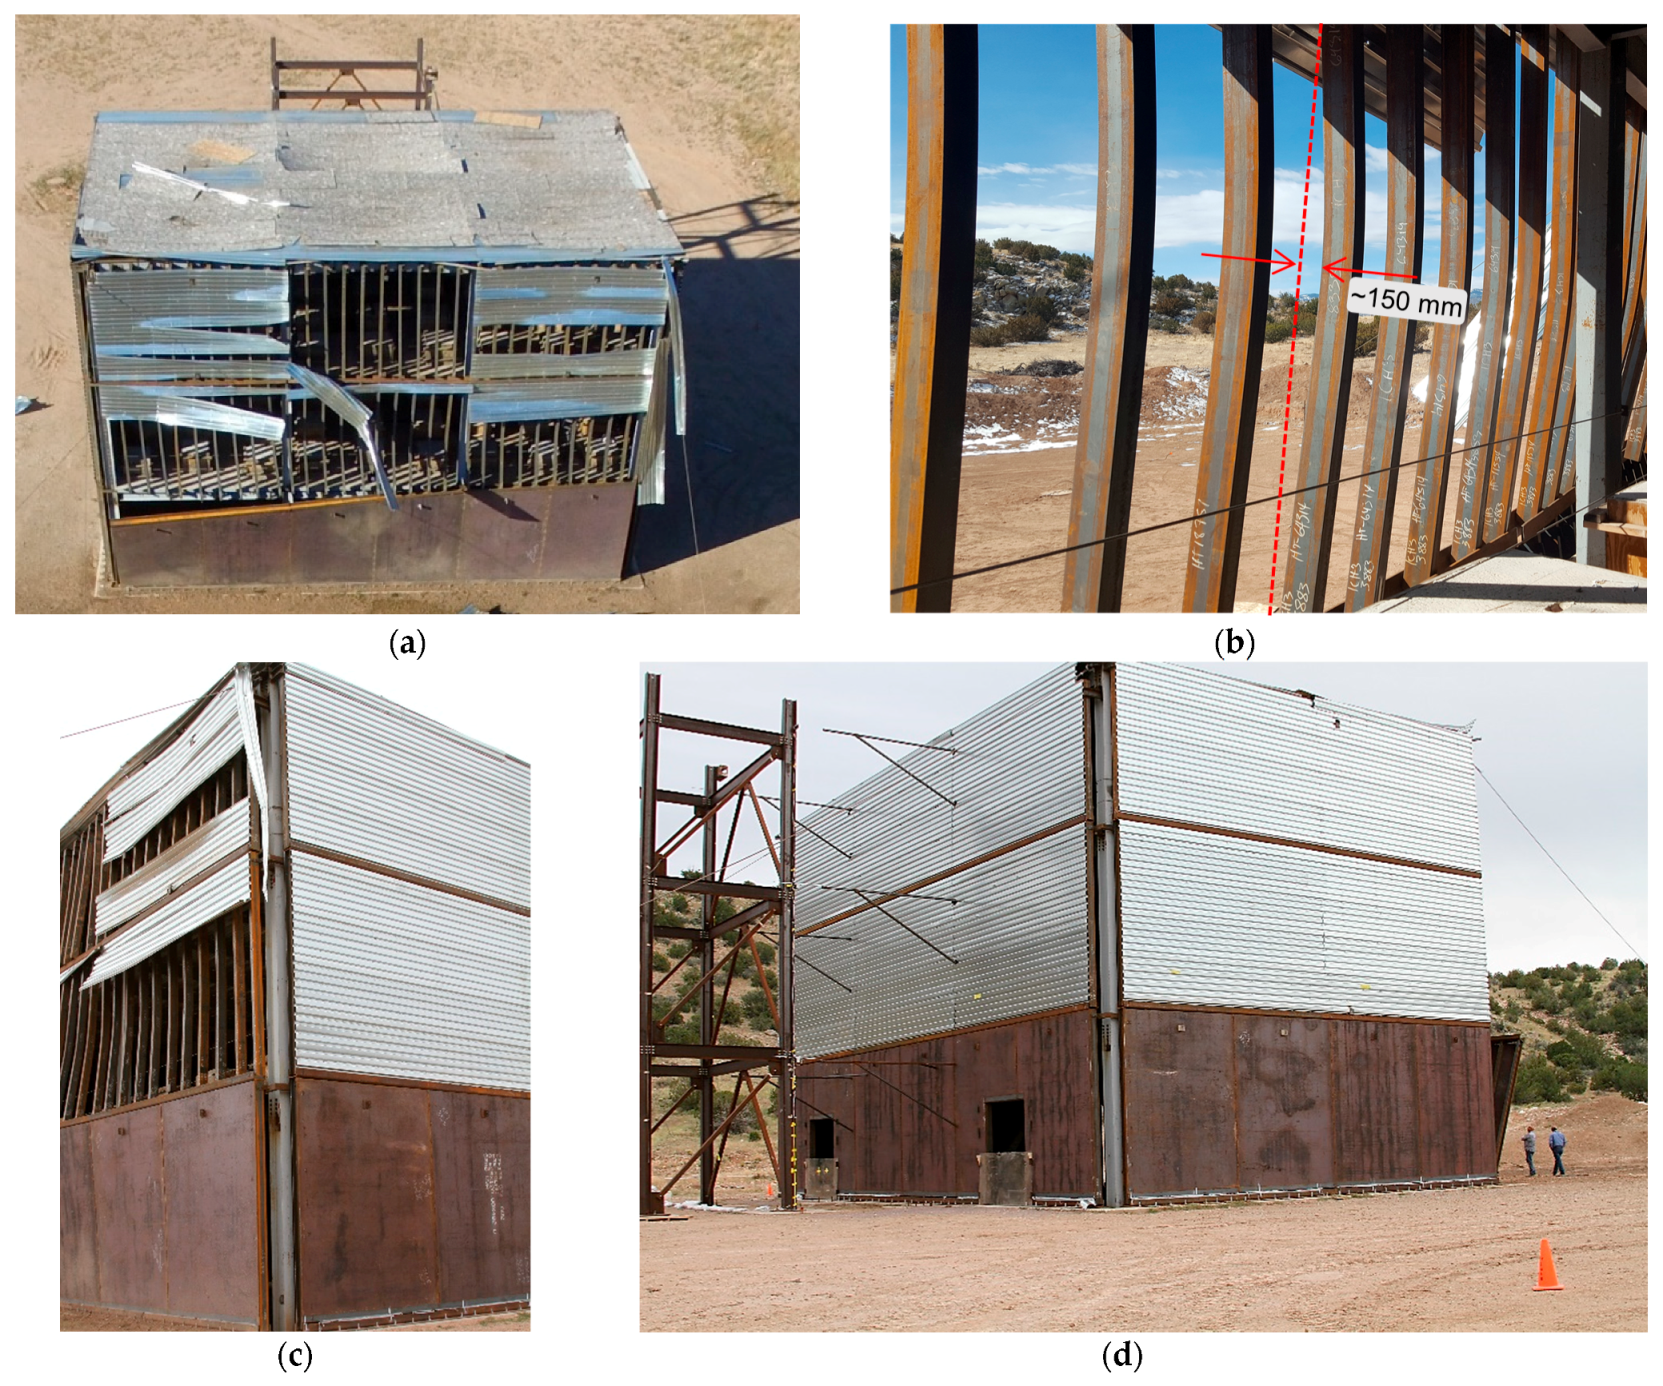
4.2. Blast Test 2 on Frame with Blast-Resistant Façade
4.3. Test 1 and Test 2 Response Comparison and Remarks
5. Research Limitations
- It was designed to resist only typical gravity load and wind loads for a basic wind speed of 51 m/s.
- No provisions for blast or earthquake loads were considered.
- The chevron brace configuration used for the LFRS was found to be one of the most vulnerable brace types under dynamic overload conditions, as suggested by McKay et al. [19].
- The size and number of stories of the structure were also chosen based on the findings of the study by McKay et al. [19]. In similar blast environments, larger structures with more stories are likely to perform better. Conversely, smaller structures with a smaller number of stories are expected to have heavy damage and are prone to total collapse.
- The structure was oriented relative to the applied blast load such that the wider, 18.3 m, face of the building (Figure 10) was the one directly loaded from the airblast, which resulted to higher blast impulse loads compared to having the airblast directly loading the narrower, 12.2 m, face of the building.
6. Summary and Conclusions
- During the first test, the early failure of the conventional façade limited the blast loads that were transferred to the building; hence, no signs of damage or failure were observed on the LFRS of the test frame. Nonetheless, the occupant survivability in that case was expected to be quite low, since most of the glazed façade shattered and debris penetrated the building.
- Due to the early failure of the glazed façade during the first test, the estimated reflected impulse that the non-blast-resistant glazed façade transferred to the structural frame of the building was estimated to be only 10% of the measured reflected impulse at the front face of the building.
- During the second test, the blast-resistant façade sustained the inbound blast pressure with plastic deformation that was within the target performance limit, thereby transferring a considerably higher load to the LFRS of the test frame.
- Owing to the higher dynamic reactions during the second test, the LFRS was partially compromised with some gusset plate connections of the braces completely rupturing.
- The inter-story drift ratios of both tests were compared with the drift ratio limits of ASCE 41-06 [31] for the different performance levels. The agreement between the code-based drift ratio limit and the expected level of damage was consistent with the damage levels observed in the two tests.
- Despite the partial compromise of the LFRS during the second test, the building did not show any signs that it was at a near-collapse state, indicating that the safety margin against collapse was relatively high and would allow evacuation after an attack. Pre- and post-test survey data suggested that the steel frame only had a residual permanent plastic deformation at the roof level of approximately 3 mm.
- Due to the partial damage of the LFRS during the second test, the building was not considered suitable for immediate occupancy until after its LFRS was fully repaired.
- While the building used for the test program was considered a worst-case scenario since its LFRS was designed for typical winds load only without any provisions for blast or seismic loads, other building configurations with concave shapes of similar size may exist that may have a less favorable response.
Author Contributions
Funding
Data Availability Statement
Acknowledgments
Conflicts of Interest
References
- Marchand, K.A.; Alfawakhiri, F. Facts for Steel Buildings: Blast and Progressive Collapse; AISC: Chicago, IL, USA, 2005. [Google Scholar]
- Single Degree of Freedom Structural Response Limits for Antiterrorism Design; U.S. Army Corps of Engineers, Protective Design Center: Omaha, NE, USA, 2008.
- Dusenberry, D.O. Handbook for Blast-Resistant Design of Buildings; Wiley: Hoboken, NJ, USA, 2010. [Google Scholar]
- Haynes, J.R., Jr.; Pekelnicky, R.G.; Woodson, S.C.; Poland, C.D. Blast-Resistance Benefits of Seismic Design—Phase 1 Study: Performance Analysis of Reinforced Concrete Strengthehing Systems Applied to the Murrah Fedetal Building Design; FEMA: Washington, DC, USA, 2005.
- Pekelnicky, R.G.; Woodson, S.C.; Sweeny, S.C.; Haynes, J.R., Jr.; Magallanes, J.; Bonneville, D.R.; Poland, C.D. Blast-Resistance Benefits of Seismic Design—Phase 2 Study: Performance Analysis of Structural Steel Strengthening Systems; FEMA: Washington, DC, USA, 2010.
- Hinman, E.E.; Hammond, D.J. Lessons from the Oklahoma City Bombing-Defense Design Techniques; ASCE: Reston, VA, USA, 1997. [Google Scholar]
- Liew, J.R. Survivability of steel frame structures subject to blast and fire. J. Constr. Steel Res. 2008, 64, 854–866. [Google Scholar] [CrossRef]
- Clough, L.G.; Clubley, S.K. Synergistic response of steel columns to explosive thermal and long duration blast loading. Eng. Struct. 2021, 245, 112944. [Google Scholar] [CrossRef]
- Al-Thairy, H. Behaviour and Failure of Steel Columns Subjected to Blast Loads: Numerical Study and Analytical Approach. Adv. Mater. Sci. Eng. 2018, 2018, 1–20. [Google Scholar] [CrossRef] [Green Version]
- Galal, M.A.; Bandyopadhyay, M.; Banik, A.K. Progressive Collapse Analysis of Three-Dimensional Steel–Concrete Composite Building due to Extreme Blast Load. J. Perform. Constr. Facil. 2020, 34, 04020021. [Google Scholar] [CrossRef]
- Nassr, A.A.; Razaqpur, A.G.; Tait, M.J.; Campidelli, M.; Foo, S. Experimental Performance of Steel Beams under Blast Loading. J. Perform. Constr. Facil. 2012, 26, 600–619. [Google Scholar] [CrossRef]
- Nassr, A.A.; Razaqpur, A.G.; Tait, M.J.; Campidelli, M.; Foo, S. Dynamic Response of Steel Columns Subjected to Blast Loading. J. Struct. Eng. 2014, 140, 04014036. [Google Scholar] [CrossRef]
- Figuli, L.; Bedon, C.; Zvaková, Z.; Jangl, Š.; Kavický, V. Dynamic analysis of a blast loaded steel structure. Procedia Eng. 2017, 199, 2463–2469. [Google Scholar] [CrossRef] [Green Version]
- Tyas, A.; Warren, J.A.; Bennett, T.; Fay, S. Prediction of clearing effects in far-field blast loading of finite targets. Shock. Waves 2011, 21, 111–119. [Google Scholar] [CrossRef]
- Yussof, M.M.; Silalahi, J.H.; Kamarudin, M.K.; Chen, P.-S.; Parke, G.A.R. Numerical Evaluation of Dynamic Responses of Steel Frame Structures with Different Types of Haunch Connection Under Blast Load. Appl. Sci. 2020, 10, 1815. [Google Scholar] [CrossRef] [Green Version]
- Weli, S.S.; Vigh, L.G. Blast Performance Evaluation of Steel Moment-Resisting Frame Equipped with Smart Bolted Connection. J. Perform. Constr. Facil. 2021, 35, 04021050. [Google Scholar] [CrossRef]
- Nourzadeh, D.; Humar, J.; Braimah, A. Comparison of Response of Building Structures to Blast Loading and Seismic Excitations. Procedia Eng. 2017, 210, 320–325. [Google Scholar] [CrossRef]
- Ibrahim, Y.E.; Nabil, M. Assessment of structural response of an existing structure under blast load using finite element analysis. Alex. Eng. J. 2019, 58, 1327–1338. [Google Scholar] [CrossRef]
- McKay, A.; Bazan, M.; Gomez, M.; Marchand, K. Steel Frame Structure Performance in Blast Environments—Task 2 Analysis and Final Reporting; Protection Engineering Consultants: San Antonio, TX, USA, 2011. [Google Scholar]
- ASCE. Minimum Design Loads for Buildings and Other Structures (ASCE 7-10); ASCE/SEI 7-10; ASCE: Reston, VA, USA, 2010; Available online: https://www.asce.org/asce-7/ (accessed on 1 September 2021).
- ANSI/AISC. Specification for Structural Steel Buildings (ANSI/AISC 360-10); American Institute of Steel Construction (AISC): Chicago, IL, USA, 2010. [Google Scholar]
- Vulcraft. Vulcraft Steel Roof and Floor Deck; Vulcraft: Ancaster, ON, Canada, 2008. [Google Scholar]
- ASTM International. ASTM A992/A992M-11, Standard Specification for Structural Steel Shapes; ASTM International: West Conshohocken, PA, USA, 2011. [Google Scholar]
- ASTM International. ASTM A500/A500M-10, Standard Specification for Cold-Formed Welded and Seamless Carbon Steel Structural Tubing in Rounds and Shapes; ASTM International: West Conshohocken, PA, USA, 2010. [Google Scholar]
- ASTM International. ASTM A36/A36M-08, Standard Specification for Carbon Structural Steel; ASTM International: West Conshohocken, PA, USA, 2008. [Google Scholar]
- ASTM International. ASTM A653/A653M-10, Standard Specification for Steel Sheet, Zinc-Coated (Galvanized) or Zinc-Iron Alloy Coated (Galvannealed) by Hot-Dip Process; ASTM International: West Conshohocken, PA, USA, 2010. [Google Scholar]
- ASTM International. ASTM A325-10, Standard Specification for Structural Bolts, Steel, Heat Treated, 120/105 KSI Minimum Tensile Strength; ASTM International: West Conshohocken, PA, USA, 2010. [Google Scholar]
- ASTM International. ASTM A615/A615M-09, Standard Specification for Deformed and Plain Carbon-Steel Bars for Concrete Reinforcement; ASTM International: West Conshohocken, PA, USA, 2009. [Google Scholar]
- International Code Council. International Building Code (IBC); International Code Council: Falls Church, VA, USA, 2006. [Google Scholar]
- Product Catalogue for 1600 WALL SYSTEMTM1/SYSTEMTM2 CURTAIN WALL. (n.d.). Available online: www.kawneer.com (accessed on 1 September 2021).
- ASCE. Seismic Rehabilitation of Existing Buildings (ASCE 41-06); ASCE/SEI 41-06; ASCE: Reston, VA, USA, 2007. [Google Scholar]


| Gauge Set | Gauge ID 1 | Floor | Peak Inbound Response 2 | |
|---|---|---|---|---|
| Deflection (mm) | Time 3 (ms) | |||
| 1 | DG1 | 2nd | 10 | 128 |
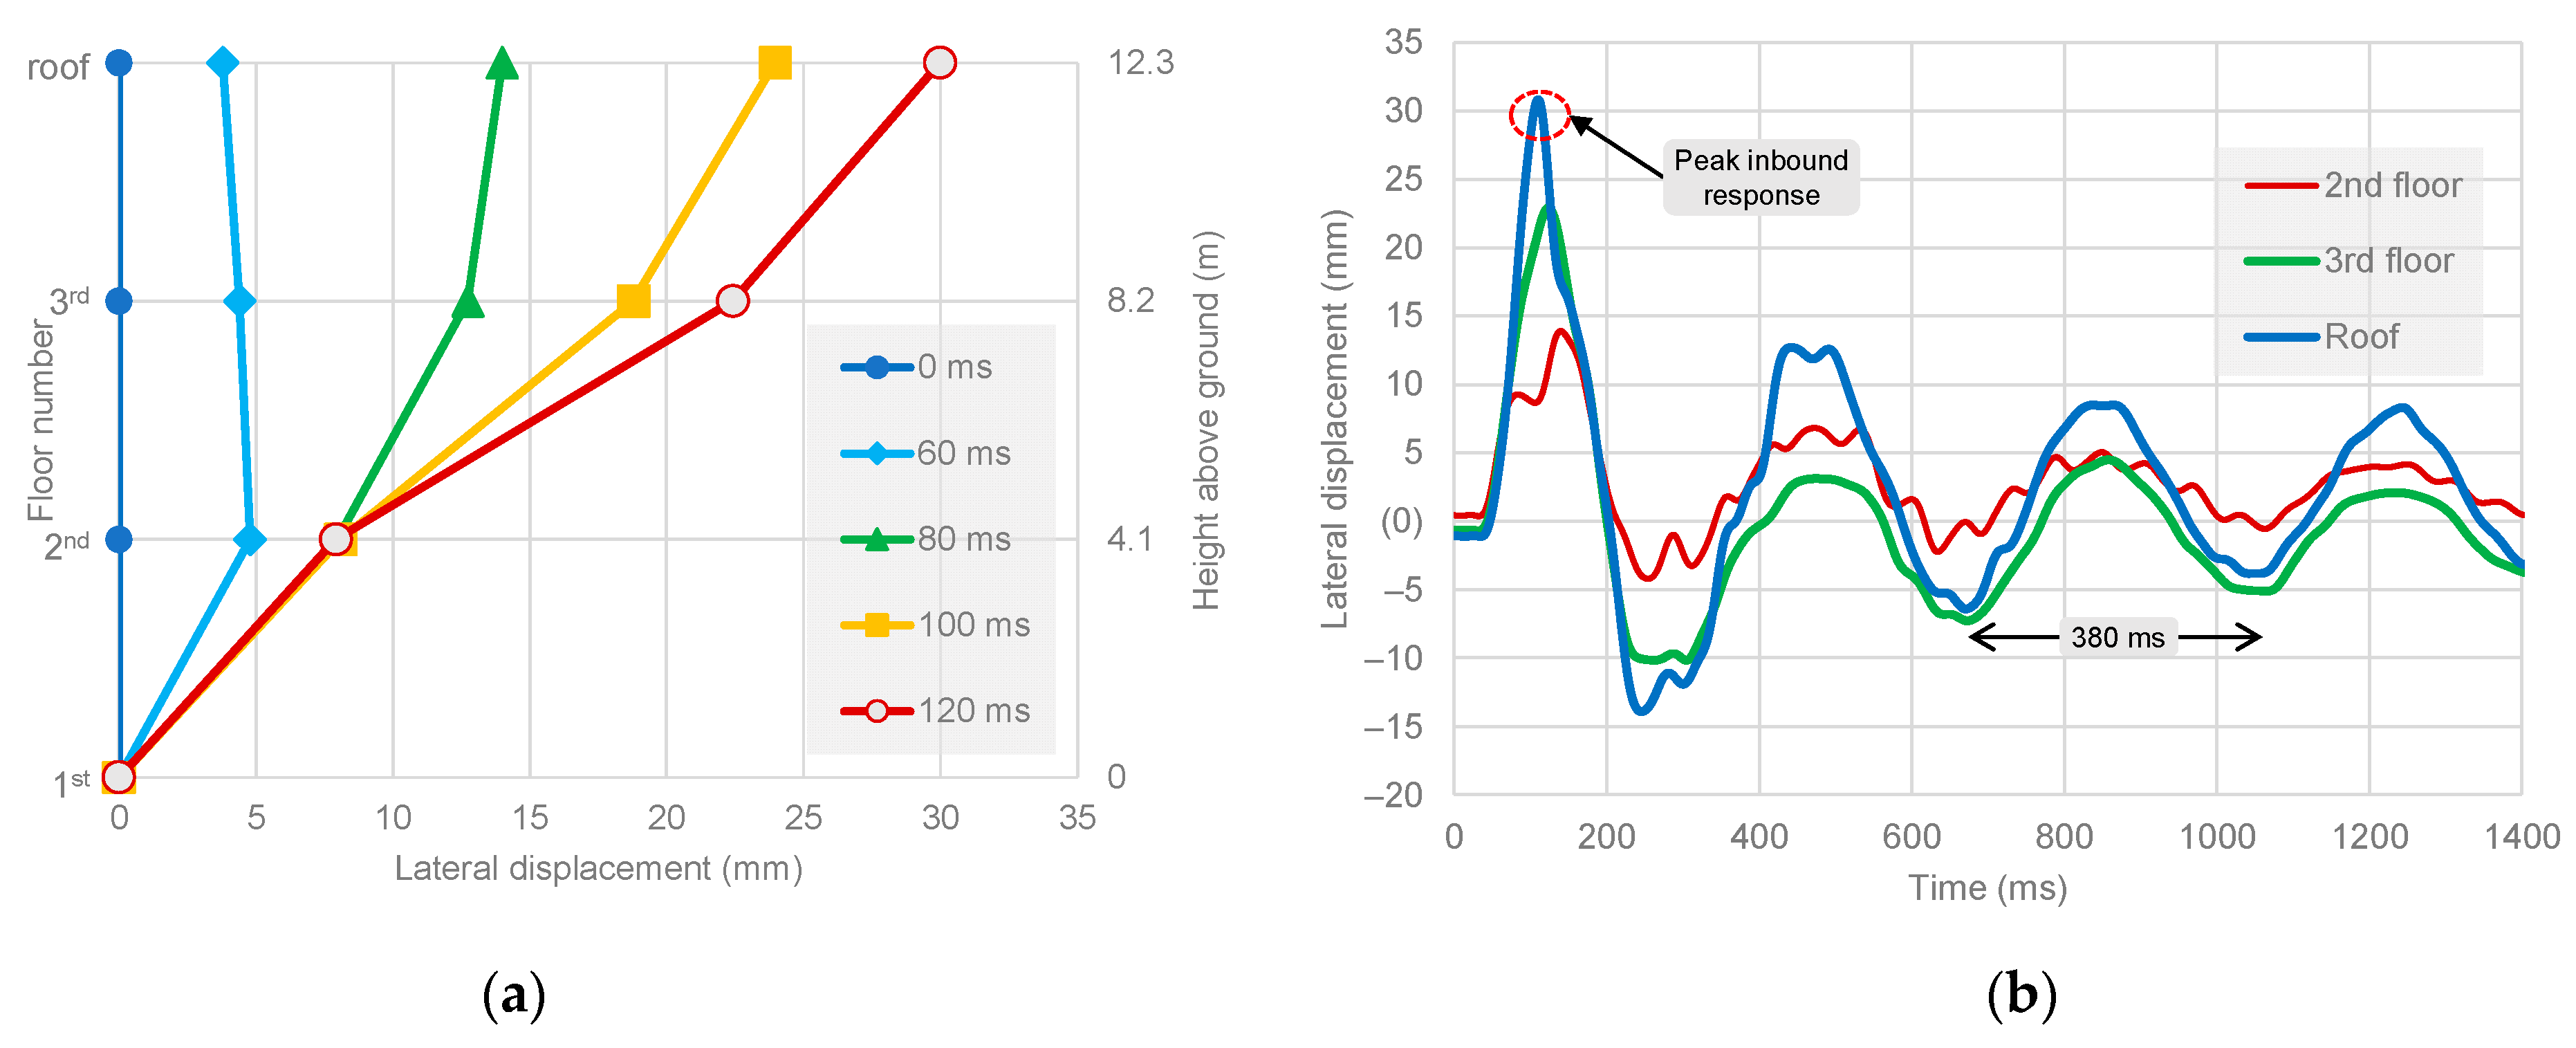
| DG2 | 3rd | 23 | 121 | |
| DG3 | roof | 33 | 116 | |
| 2 | DG4 | 2nd | 15 | 141 |
| DG5 | 3rd | 23 | 121 | |
| DG6 | roof | 33 | 115 | |
| 3 | DG7 | 2nd | 15 | 140 |
| DG8 | 3rd | 20 | 141 | |
| DG9 | roof | 33 | 126 | |
| Floor Level | Avg. Peak Inbound Deflection (mm) | Inter-Story Deflection (mm) | Inter-Story Drift Ratio 1 |
|---|---|---|---|
| roof | 33 | 11 | 0.3% |
| 3rd | 22 | 8 | 0.2% |
| 2nd | 14 | 14 | 0.3% |
| 1st (ground floor) | 0 | - | - |
| Floor | Gauge ID 1 | Brace Member Size | Brace Cross−Sectional Areaz (mm2) | Braces along Column Line B | Braces along Column Line C | ||
|---|---|---|---|---|---|---|---|
| Measured Peak Force 2 (kN) | Estimated Peak Force per Brace 3 (kN) | Measured Peak Force 2 (kN) | Estimated Peak Force per Brace 3 (kN) | ||||
| 1st | SG1 (SG13) | HSS6 × 6 × 3/16 | 2568 | −377 | −402 | −676 | −545 |
| SG2 (SG14) | 2568 | −426 | −415 | ||||
| SG3 (SG15) | HSS6 × 6 × 3/16 | 2568 | 460 | 459 | 462 | 479 | |
| SG4 (SG16) | 2568 | 457 | 496 | ||||
| 2nd | SG5 (SG17) | HSS5 × 5 × 3/16 | 2116 | −395 | −426 | −465 | −443 |
| SG6 (SG18) | 2116 | −457 | −420 | ||||
| SG7 (SG19) | HSS5 × 5 × 3/16 | 2116 | 421 | 423 | 409 | 413 | |
| SG8 (SG20) | 2116 | 424 | 416 | ||||
| 3rd | SG9 (SG21) | HSS4 × 4 × /3/16 | 1665 | −216 | −215 | −122 | −164 |
| SG10 (SG22) | 1665 | −215 | −206 | ||||
| SG11 (SG23) | HSS4 × 4 × /3/16 | 1665 | 172 | 178 | 183 | 173 | |
| SG12 (SG24) | 1665 | 184 | 164 | ||||
| Gauge Set | Gauge ID 1 | Floor | Peak Inbound Response 2 | |
|---|---|---|---|---|
| Deflection (mm) | Time 3 (ms) | |||
| 1 | DG1 | 2nd | 56 | 174 |
| DG2 | 3rd | 74 | 140 | |
| DG3 | roof | 79 | 123 | |
| 2 | DG4 | 2nd | 58 | 186 |
| DG5 | 3rd | 84 | 143 | |
| DG6 | roof | 86 | 123 | |
| 3 | DG7 | 2nd | 58 | 163 |
| DG8 | 3rd | 81 | 143 | |
| DG9 | roof | 89 | 123 | |
| Floor Level | Avg. Peak Inbound Deflection (mm) | Inter-Story Deflection (mm) | Inter-Story Drift Ratio 1 |
|---|---|---|---|
| roof | 86 | 7 | 0.2% |
| 3rd | 79 | 21 | 0.5% |
| 2nd | 58 | 58 | 1.4% |
| 1st (ground floor) | 0 | - | - |
| Floor | Gauge ID 1 | Brace Member Size | Brace Cross−Sectional Area (mm2) | Braces along Column Line B | Braces along Column Line C | ||
|---|---|---|---|---|---|---|---|
| Measured Peak Force 2 (kN) | Estimated Peak Force per Brace 3 (kN) | Measured Peak Force 2 (kN) | Estimated Peak Force per Brace 3 (kN) | ||||
| 1st | SG1 (SG13) | HSS6 × 6 × 3/16 | 2568 | −1241 | −974 | −654 | −681 |
| SG2 (SG14) | 2568 | −707 | −707 | ||||
| SG3 (SG15) | HSS6 × 6 × 3/16 | 2568 | 814 | 796 | 841 | 827 | |
| SG4 (SG16) | 2568 | 778 | 814 | ||||
| 2nd | SG5 (SG17) | HSS5 × 5 × 3/16 | 2116 | −498 | −514 | × | −730 |
| SG6 (SG18) | 2116 | −529 | −730 | ||||
| SG7 (SG19) | HSS5 × 5 × 3/16 | 2116 | 507 | 465 | × | n/a | |
| SG8 (SG20) | 2116 | 423 | × | ||||
| 3rd | SG9 (SG21) | HSS4 × 4 × /3/16 | 1665 | −280 | −294 | × | −347 |
| SG10 (SG22) | 1665 | −307 | −347 | ||||
| SG11 (SG23) | HSS4 × 4 × /3/16 | 1665 | 245 | 249 | 503 | 405 | |
| SG12 (SG24) | 1665 | 254 | 307 | ||||
| Avg. Peak Inbound Deflection (mm) | Difference | ||
|---|---|---|---|
| Floor 1 | Test 1—Conventional Glazed Facade | Test 2—Blast-Resistant Facade | |
| roof | 33 | 86 | 260% |
| 3rd | 22 | 79 | 360% |
| 2nd | 14 | 58 | 415% |
| Floor | Brace Member Size | Estimated Peak Force per Brace 1 (kN) | |||||
|---|---|---|---|---|---|---|---|
| Braces along Column Line B | Braces along Column Line C | ||||||
| Test 1 | Test 2 | Difference | Test 1 | Test 2 | Difference | ||
| 1st | HSS6 × 6 × 3/16 | −402 | −974 | 240% | −545 | −681 | 125% |
| HSS6 × 6 × 3/16 | 459 | 796 | 175% | 479 | 827 | 175% | |
| 2nd | HSS5 × 5 × 3/16 | −426 | −514 | 120% | −443 | −730 | 165% |
| HSS5 × 5 × 3/16 | 423 | 465 | 110% | 413 | no good data | --- | |
| 3rd | HSS4 × 4 × /3/16 | −215 | −294 | 140% | −164 | −347 | 210% |
| HSS4 × 4 × /3/16 | 178 | 249 | 140% | 173 | 405 | 235% | |
Publisher’s Note: MDPI stays neutral with regard to jurisdictional claims in published maps and institutional affiliations. |
© 2021 by the authors. Licensee MDPI, Basel, Switzerland. This article is an open access article distributed under the terms and conditions of the Creative Commons Attribution (CC BY) license (https://creativecommons.org/licenses/by/4.0/).
Share and Cite
Hadjioannou, M.; McKay, A.E.; Benshoof, P.C. Full-Scale Blast Tests on a Conventionally Designed Three-Story Steel Braced Frame with Composite Floor Slabs. Vibration 2021, 4, 865-892. https://0-doi-org.brum.beds.ac.uk/10.3390/vibration4040049
Hadjioannou M, McKay AE, Benshoof PC. Full-Scale Blast Tests on a Conventionally Designed Three-Story Steel Braced Frame with Composite Floor Slabs. Vibration. 2021; 4(4):865-892. https://0-doi-org.brum.beds.ac.uk/10.3390/vibration4040049
Chicago/Turabian StyleHadjioannou, Michalis, Aldo E. McKay, and Phillip C. Benshoof. 2021. "Full-Scale Blast Tests on a Conventionally Designed Three-Story Steel Braced Frame with Composite Floor Slabs" Vibration 4, no. 4: 865-892. https://0-doi-org.brum.beds.ac.uk/10.3390/vibration4040049