Figure 1.
Comparison of ramified microglia to glia and pyramidal cells in cortical grey matter layer III to supplement the extracted description from Table 1 [
1]. (
A) Depicts an astrocyte (AC) with electron lucent cytoplasm with a neuronal pyramidal (PYR) cell immediately adjacent. (
B) Depicts a ramified microglial cell (rMGC) with its highly electron-dense cytoplasm and nucleus outlined by white dashed line. (
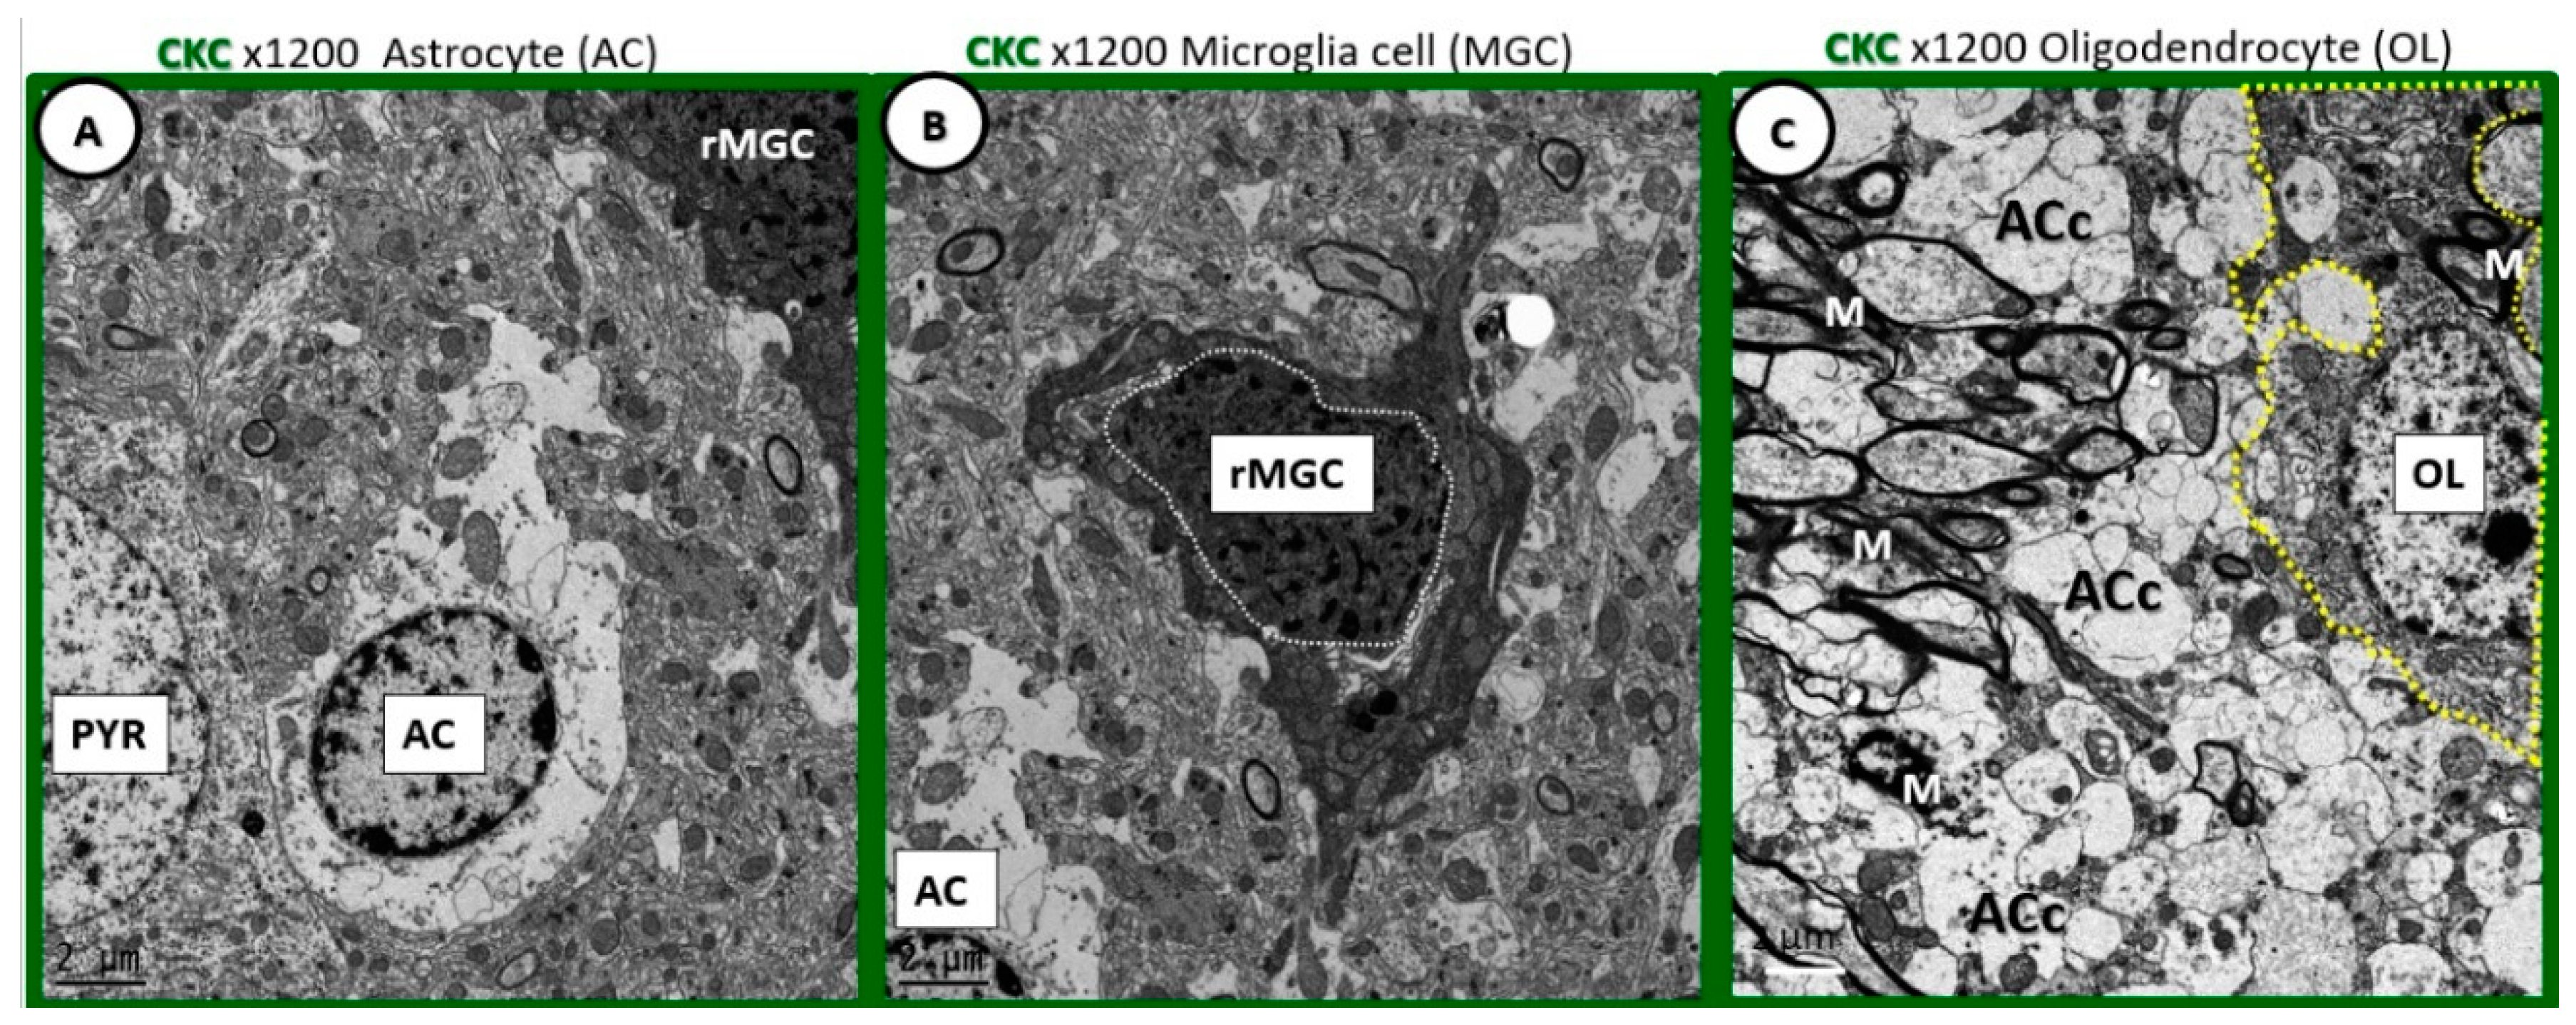
C) Depicts just a partial image of an oligodendrocyte (OL) in the transition zone between the cortical grey matter and white matter. Note the ramified cytoplasmic extensions. Microglia are the smallest of the glia cells and their cytoplasm is the most electron-dense of the neurovascular unit (NVU) cells and brain cortical grey matter. In their nonactivated phenotypic state, they have elongated cytoplasmic process in ramified form. They have an extensive endoplasmic reticulum, Golgi body system and contain multiple mitochondria. Their cytoplasmic processes are known to be capable of extending and contracting. They have a unique morphology of their nuclei with an outer stippled chromatin at its neurolemma and a more stippled diffuse chromatin electron-dense appearance of the central nuclei. Magnification 1200×; bar = 2 μm.
Figure 1.
Comparison of ramified microglia to glia and pyramidal cells in cortical grey matter layer III to supplement the extracted description from Table 1 [
1]. (
A) Depicts an astrocyte (AC) with electron lucent cytoplasm with a neuronal pyramidal (PYR) cell immediately adjacent. (
B) Depicts a ramified microglial cell (rMGC) with its highly electron-dense cytoplasm and nucleus outlined by white dashed line. (
C) Depicts just a partial image of an oligodendrocyte (OL) in the transition zone between the cortical grey matter and white matter. Note the ramified cytoplasmic extensions. Microglia are the smallest of the glia cells and their cytoplasm is the most electron-dense of the neurovascular unit (NVU) cells and brain cortical grey matter. In their nonactivated phenotypic state, they have elongated cytoplasmic process in ramified form. They have an extensive endoplasmic reticulum, Golgi body system and contain multiple mitochondria. Their cytoplasmic processes are known to be capable of extending and contracting. They have a unique morphology of their nuclei with an outer stippled chromatin at its neurolemma and a more stippled diffuse chromatin electron-dense appearance of the central nuclei. Magnification 1200×; bar = 2 μm.
![Neuroglia 01 00021 g001]()
Figure 2.
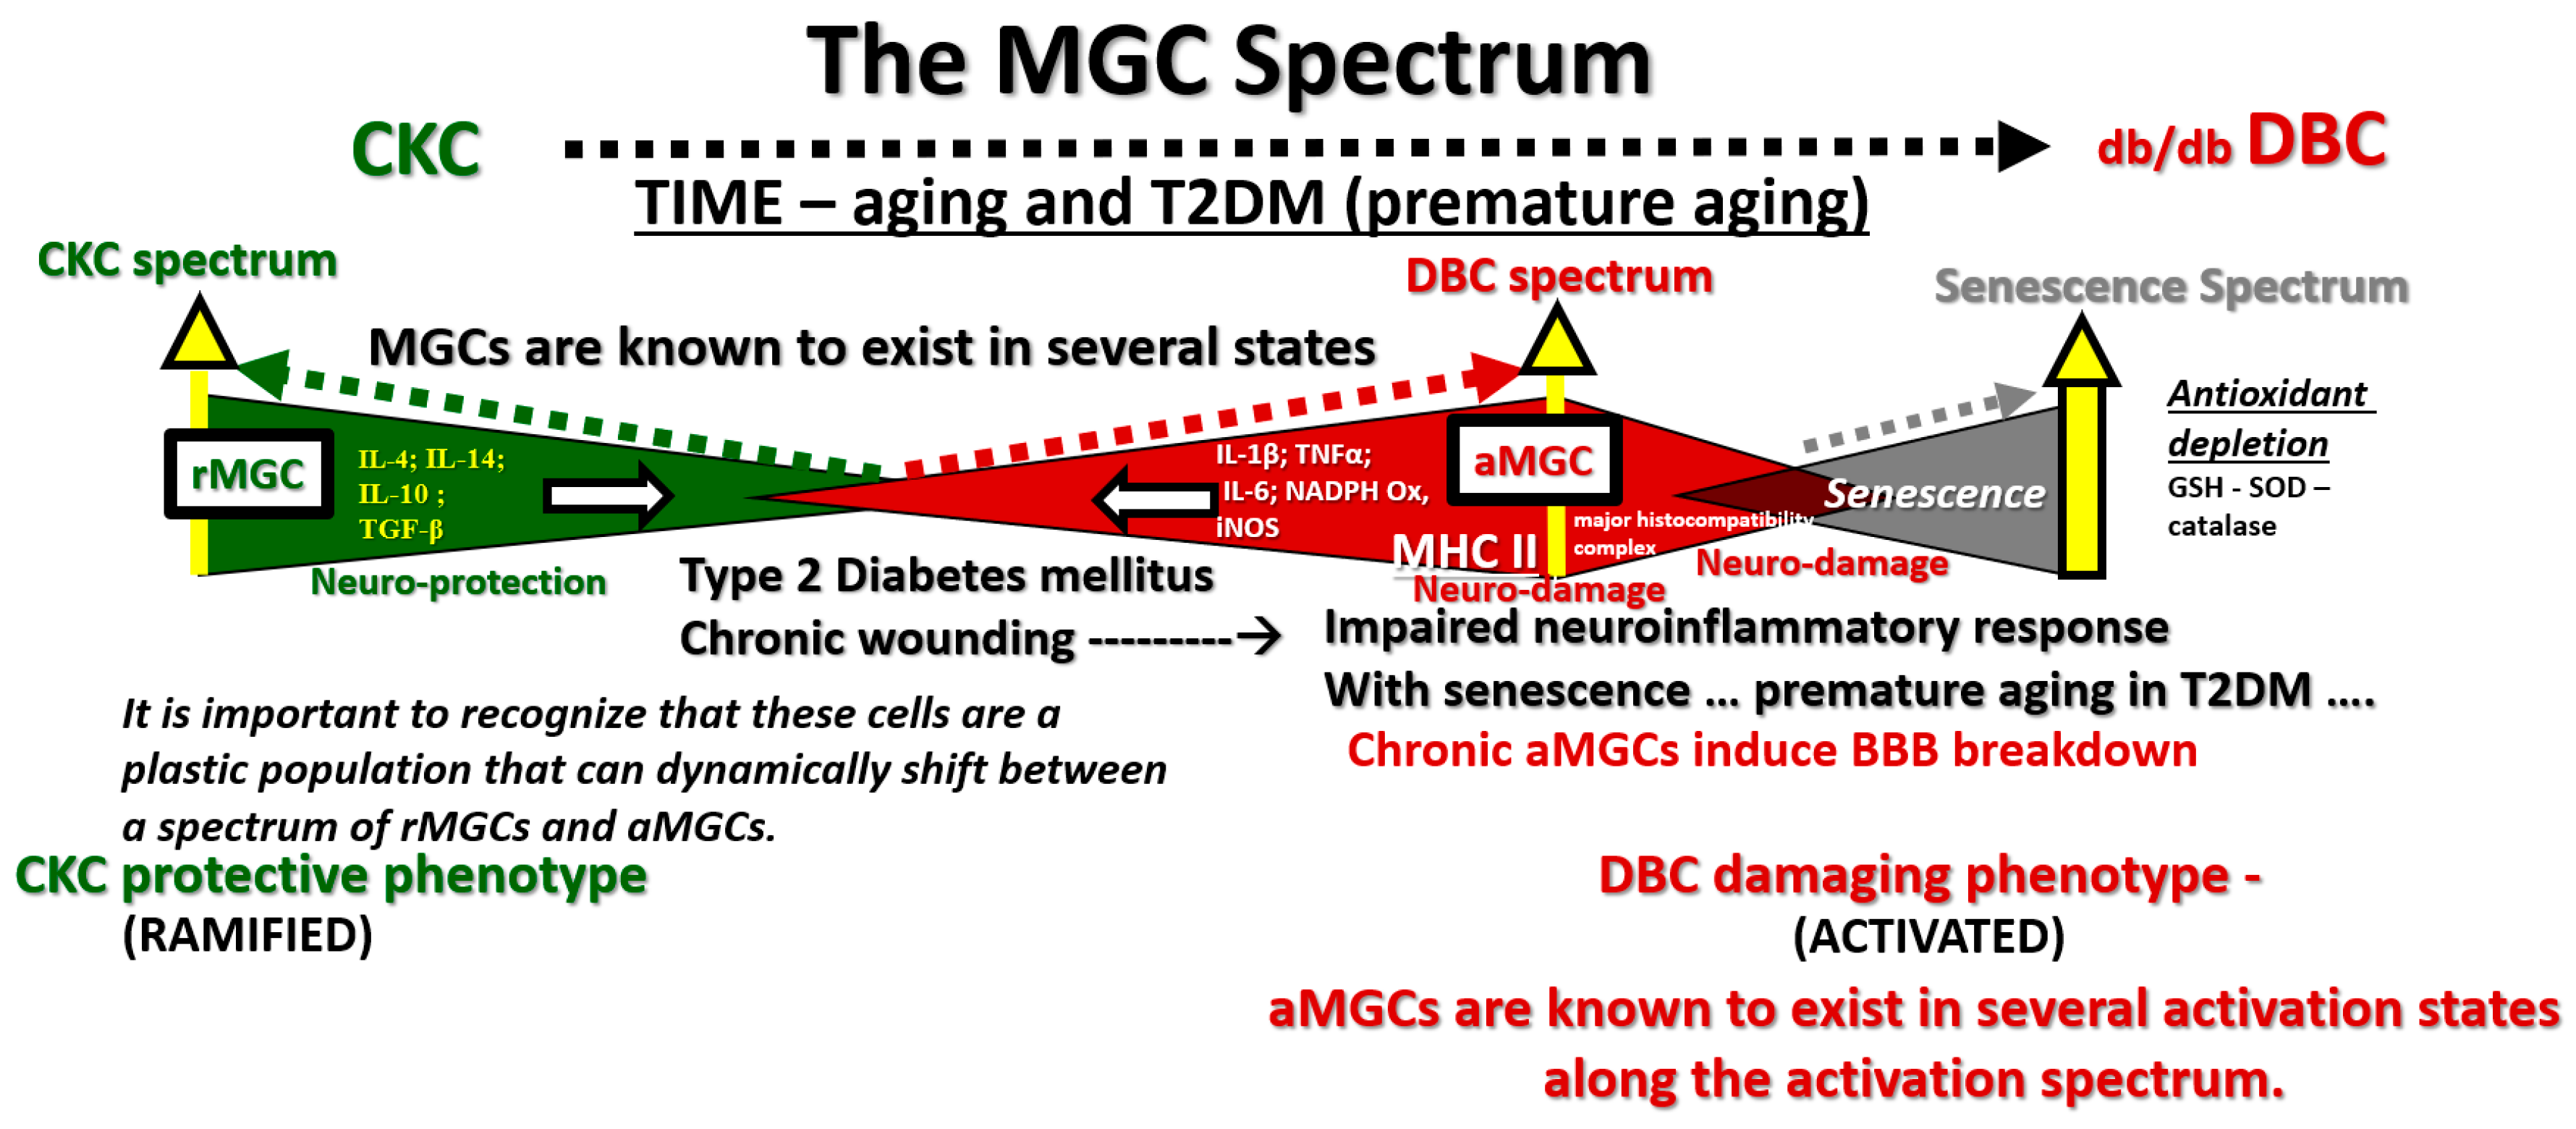
Microglia spectrum phenotypes in type 2 diabetes mellitus (T2DM). The microglia cell(s) (MGC) are very unique and capable of undergoing a marked diversity of morphological and functional phenotypic remodeling change as they pass along a spectrum of phenotypes from the ramified MGC (rMGC) (green colorization) on the far left-hand side of this cartoon to the chronically activated-amoeboid microglia cells (aMGC) (red colorization) on the right hand in addition to some microglia progressing to a senescent type of MGC on the far right (grey colorization), which may implicate advanced aging. Note the various cytokines profiles associated with each of the rMGC and the aMGC phenotypes. In our age-matched nondiabetic control C57BL/KsJ (CKC) models, the predominate MGC would be rMGC and in the DBC models the predominant microglia would be aMGC since we are only studying the ultrastructural phenotypic ultrastructural remodeling changes. Note that in health or homeostasis we demonstrate that the MGC may be in a flux or spectral change between rMGCs and more activated/amoeboid MGCs. The regions between open arrows may even represent a range of homeostasis between rMGCs and versatile aMGCs phenotypes, while the dashed lines suggest multiple spectral morphologic phenotypes. IL-1β: interleukin 1 beta; IL-14: interleukin 14; IL-10: interleukin 10; TGF-β: Transforming growth factor beta; TNFα: tumor necrosis factor alpha; IL-6: interleukin 6; NADPH Ox: reduced nicotinamide adenine dinucleotide phosphate; Inos: inducible nitric oxide synthase; GSH: glutathione; SOD: superoxide dismutase.
Figure 2.
Microglia spectrum phenotypes in type 2 diabetes mellitus (T2DM). The microglia cell(s) (MGC) are very unique and capable of undergoing a marked diversity of morphological and functional phenotypic remodeling change as they pass along a spectrum of phenotypes from the ramified MGC (rMGC) (green colorization) on the far left-hand side of this cartoon to the chronically activated-amoeboid microglia cells (aMGC) (red colorization) on the right hand in addition to some microglia progressing to a senescent type of MGC on the far right (grey colorization), which may implicate advanced aging. Note the various cytokines profiles associated with each of the rMGC and the aMGC phenotypes. In our age-matched nondiabetic control C57BL/KsJ (CKC) models, the predominate MGC would be rMGC and in the DBC models the predominant microglia would be aMGC since we are only studying the ultrastructural phenotypic ultrastructural remodeling changes. Note that in health or homeostasis we demonstrate that the MGC may be in a flux or spectral change between rMGCs and more activated/amoeboid MGCs. The regions between open arrows may even represent a range of homeostasis between rMGCs and versatile aMGCs phenotypes, while the dashed lines suggest multiple spectral morphologic phenotypes. IL-1β: interleukin 1 beta; IL-14: interleukin 14; IL-10: interleukin 10; TGF-β: Transforming growth factor beta; TNFα: tumor necrosis factor alpha; IL-6: interleukin 6; NADPH Ox: reduced nicotinamide adenine dinucleotide phosphate; Inos: inducible nitric oxide synthase; GSH: glutathione; SOD: superoxide dismutase.
![Neuroglia 01 00021 g002]()
Figure 3.
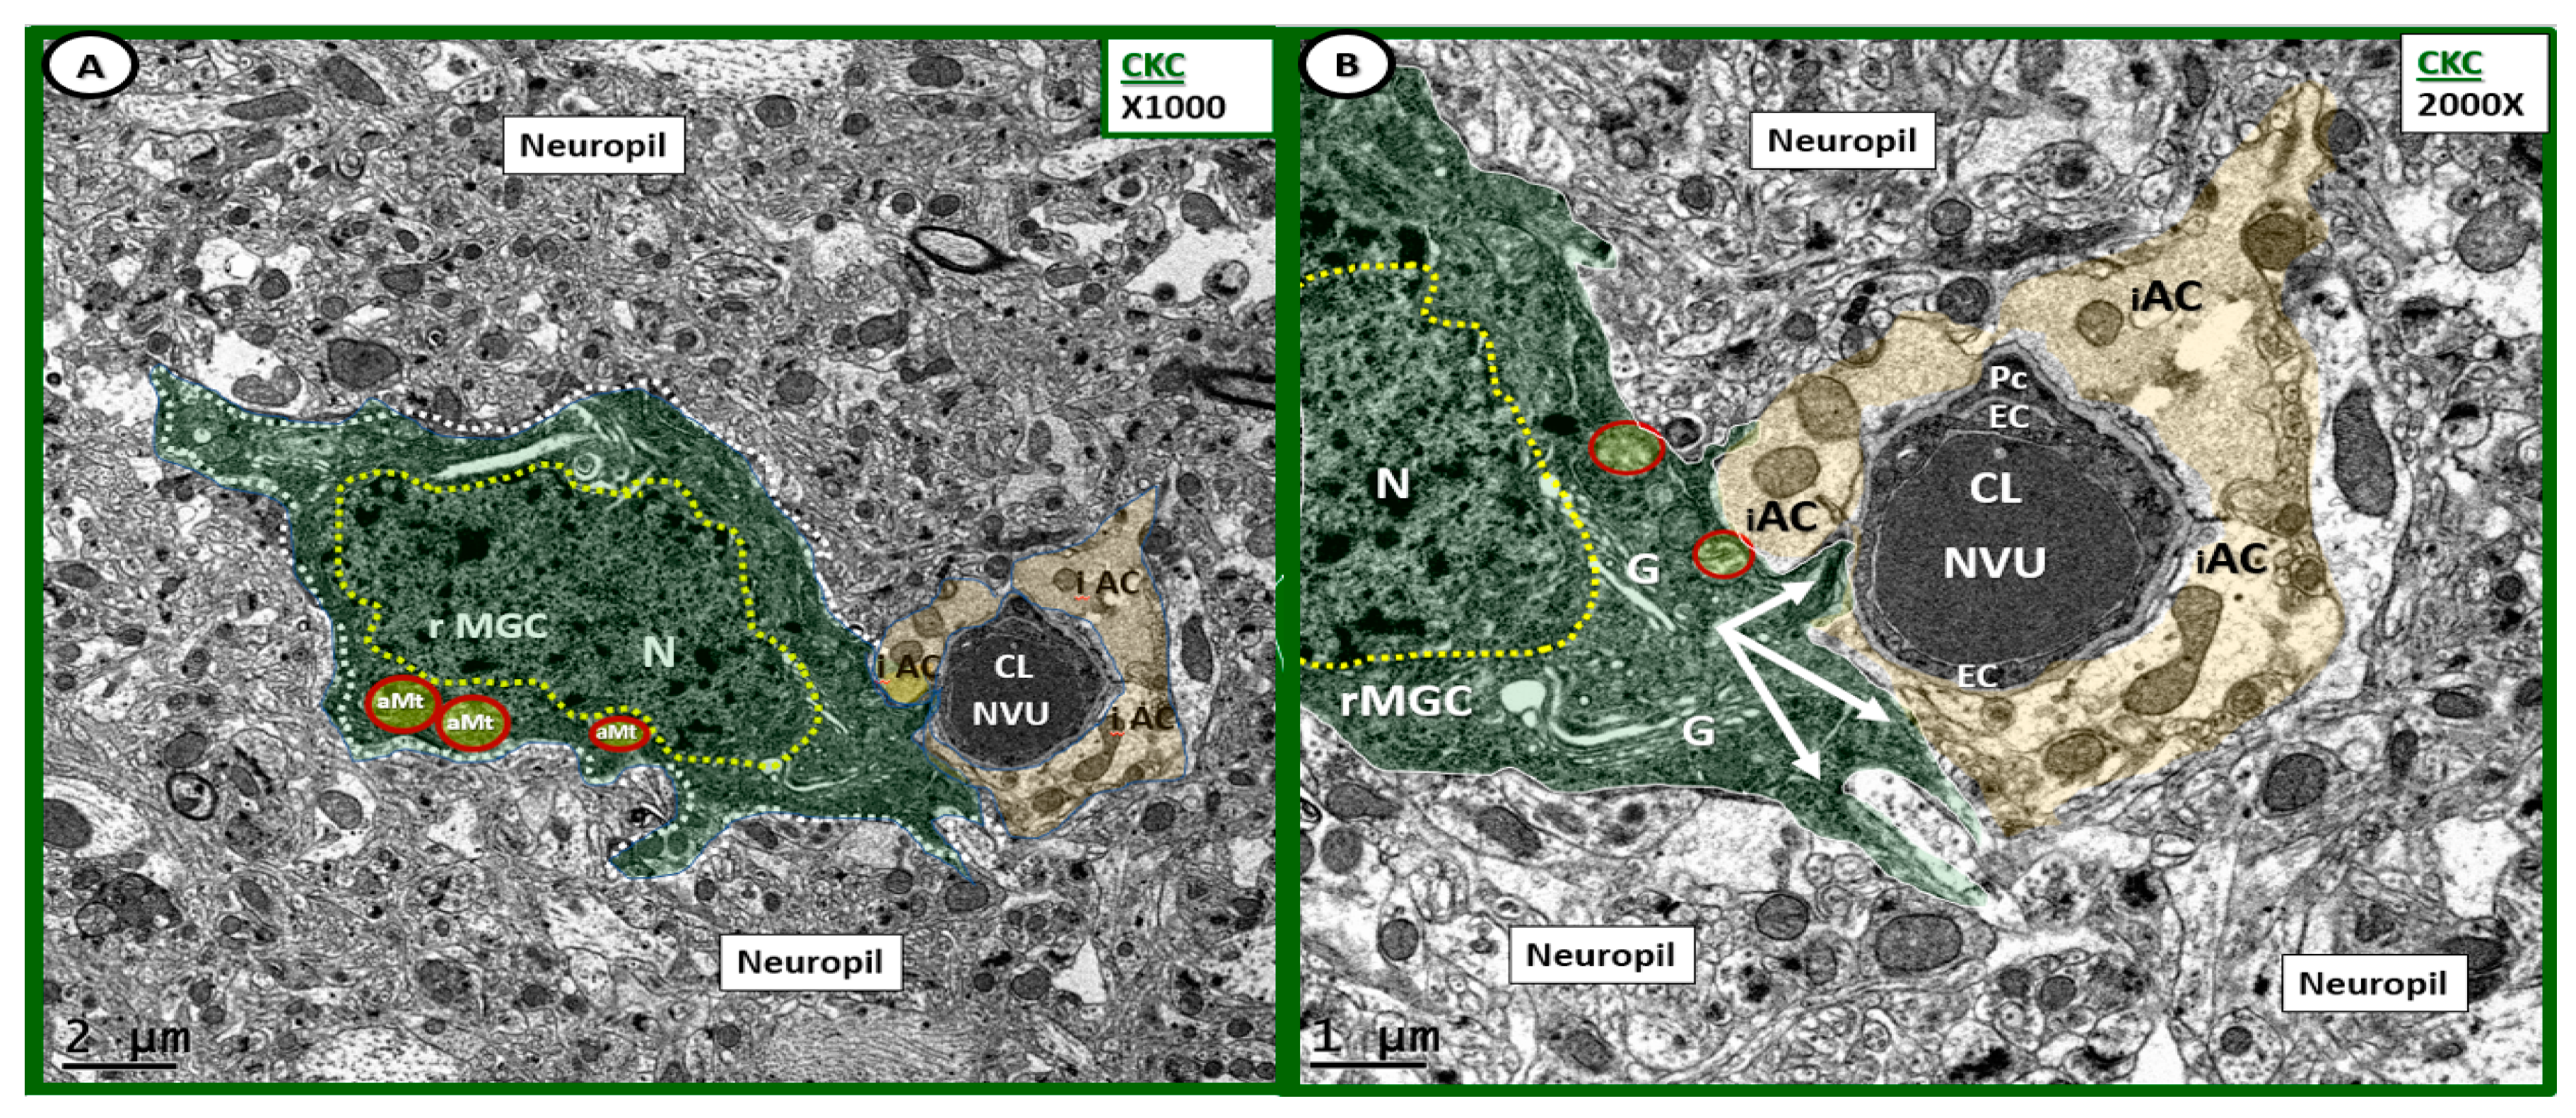
Ramified microglia as a part of the neurovascular unit in control CKC models. (A,B) Depict the normal ultrastructure of the ramified microglia cells in the control CKC models at different magnifications. (A) Depicts a ramified microglia cell (rMGC) phenotype surveilling the NVU. Note how the rMGC cytoplasmic processes (pseudo-colored green) appear to slide in between the intact astrocytes (pseudo-colored golden iAC) in panel (A,B) as if surveilling or probing the NVU (arrows in panel (B) for danger or damage signals. Ramified MGCs are known to have a stippled outer chromatin electron density and also a diffuse inner stippled chromatin arrangement. Also, note the aberrant Mt (aMt) numbering 3 in panel (A) and two in panel (B) (pseudo-colored yellow with red outline), which are in contrast to the multiple aMt in the DBC depicted later. (A) Magnification ×1000; scale bar = 2 μm; (B) Magnification ×2000; scale bar = 1 μm. Cl: capillary lumen; EC: endothelial cell; G: Golgi body; iAC: intact astrocyte; N: nucleus: Pc: pericyte.
Figure 3.
Ramified microglia as a part of the neurovascular unit in control CKC models. (A,B) Depict the normal ultrastructure of the ramified microglia cells in the control CKC models at different magnifications. (A) Depicts a ramified microglia cell (rMGC) phenotype surveilling the NVU. Note how the rMGC cytoplasmic processes (pseudo-colored green) appear to slide in between the intact astrocytes (pseudo-colored golden iAC) in panel (A,B) as if surveilling or probing the NVU (arrows in panel (B) for danger or damage signals. Ramified MGCs are known to have a stippled outer chromatin electron density and also a diffuse inner stippled chromatin arrangement. Also, note the aberrant Mt (aMt) numbering 3 in panel (A) and two in panel (B) (pseudo-colored yellow with red outline), which are in contrast to the multiple aMt in the DBC depicted later. (A) Magnification ×1000; scale bar = 2 μm; (B) Magnification ×2000; scale bar = 1 μm. Cl: capillary lumen; EC: endothelial cell; G: Golgi body; iAC: intact astrocyte; N: nucleus: Pc: pericyte.
![Neuroglia 01 00021 g003]()
Figure 4.
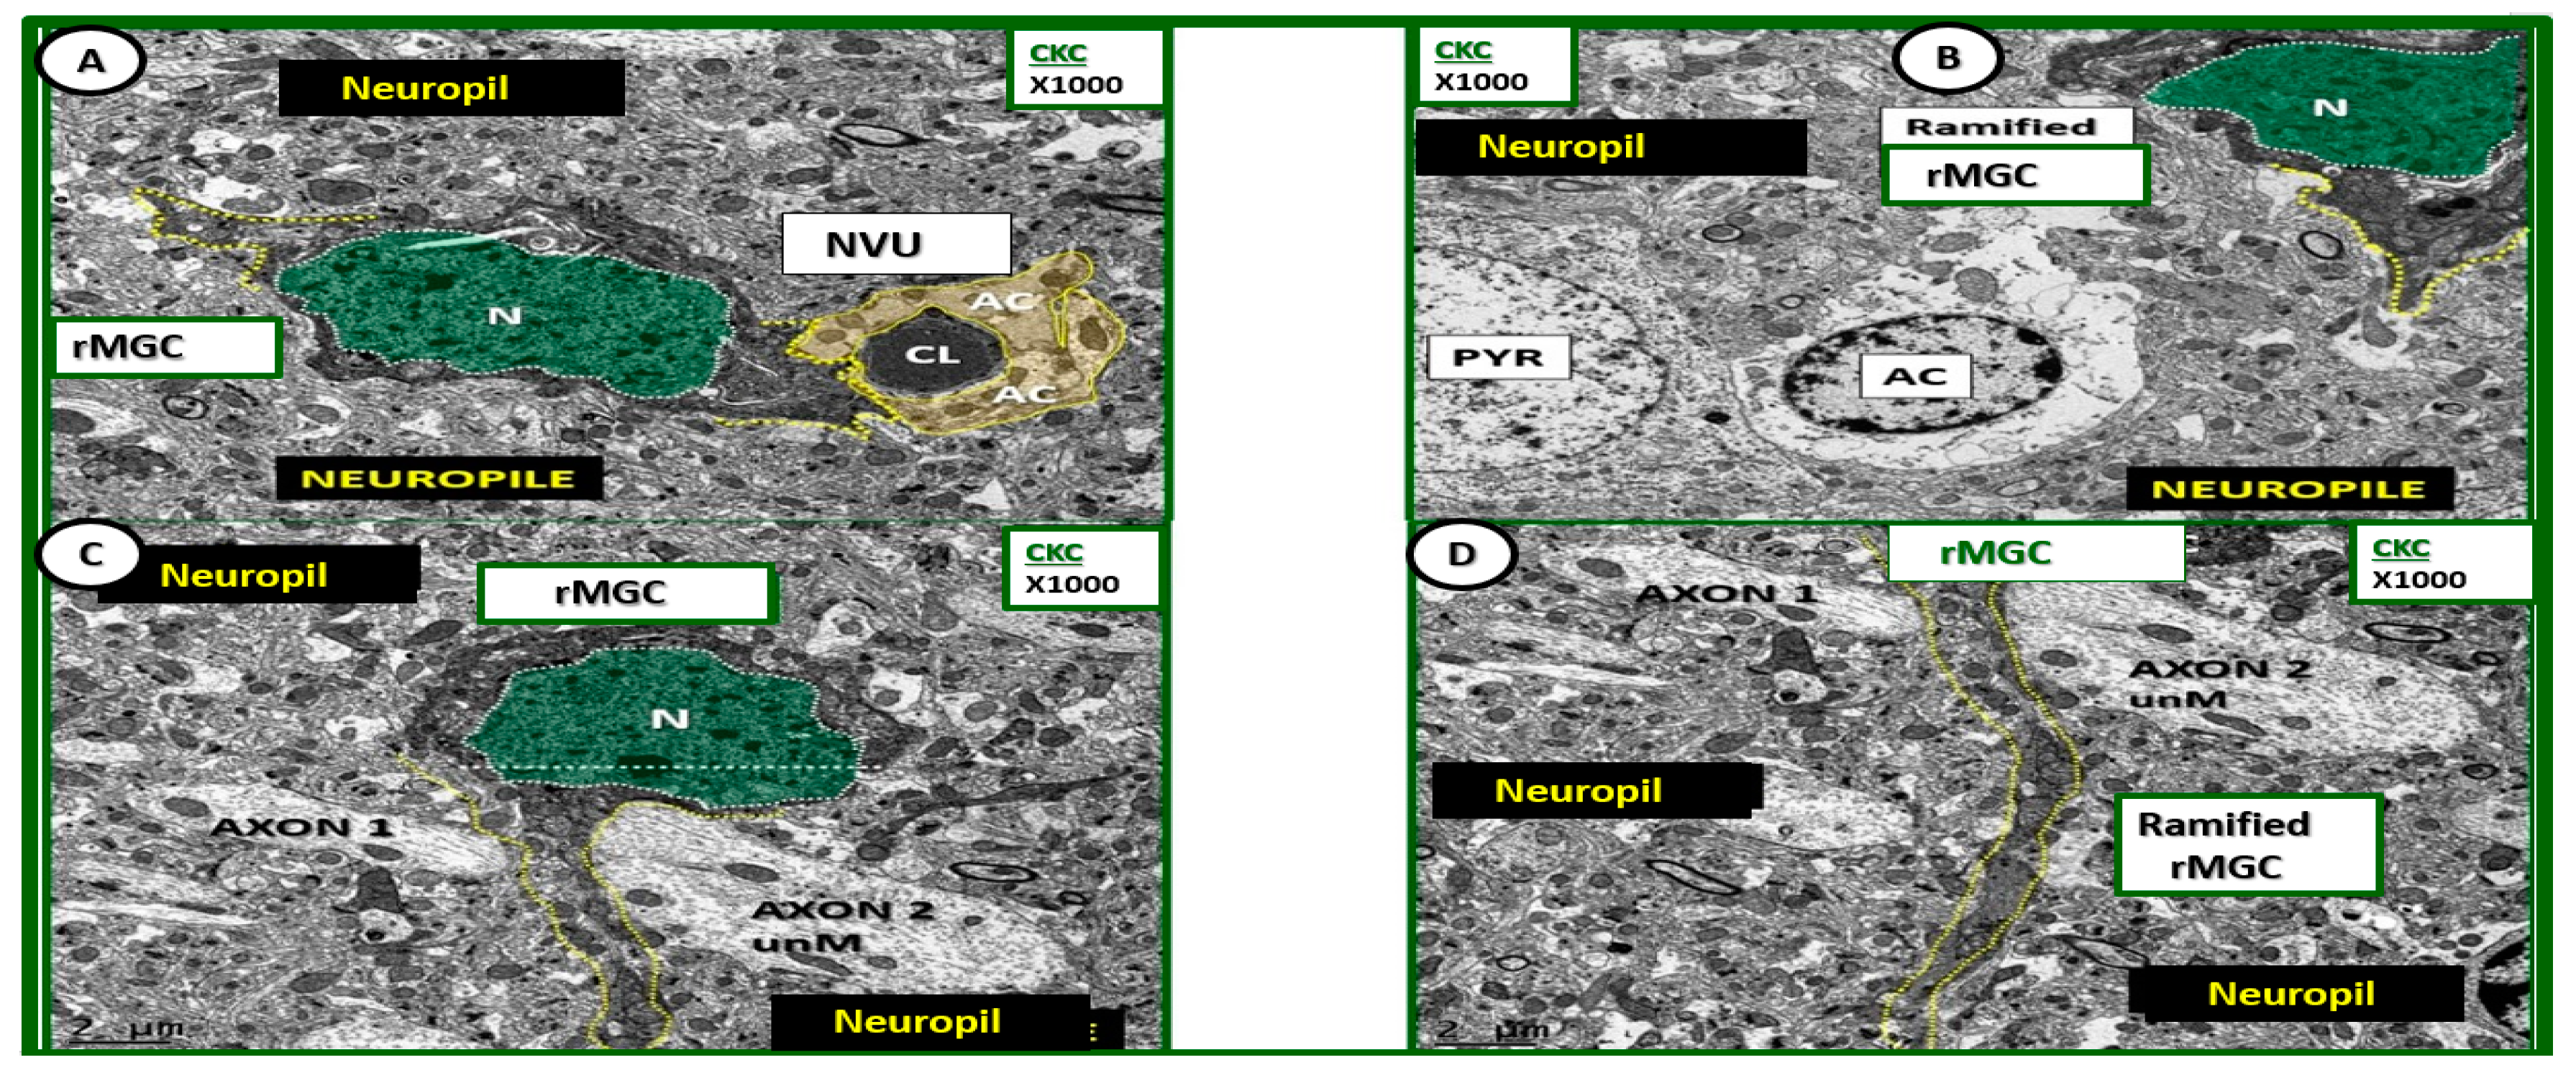
Ultrastructure of ramified microglia in control CKC models. (A–D) Depict the normal ultrastructure of the ramified microglia (rMGC) in nondiabetic control CKC models. Ramified microglia typically have elongated cytoplasmic processes (yellow-dashed lines) and they typically have a large prominent nucleus (N) (pseudo-colored green and outlined with white-dashed line). Note the diffuse electron-dense chromatin pattern that will undergo extensive chromatin condensation-clumping in activated microglia of diabetic DBC models depicted later. Magnification ×1000; scale bar = 2 μm. AC: astrocyte; CL: capillary lumen; NVU: neurovascular unit; PYR: pyramidal cell.
Figure 4.
Ultrastructure of ramified microglia in control CKC models. (A–D) Depict the normal ultrastructure of the ramified microglia (rMGC) in nondiabetic control CKC models. Ramified microglia typically have elongated cytoplasmic processes (yellow-dashed lines) and they typically have a large prominent nucleus (N) (pseudo-colored green and outlined with white-dashed line). Note the diffuse electron-dense chromatin pattern that will undergo extensive chromatin condensation-clumping in activated microglia of diabetic DBC models depicted later. Magnification ×1000; scale bar = 2 μm. AC: astrocyte; CL: capillary lumen; NVU: neurovascular unit; PYR: pyramidal cell.
Figure 5.
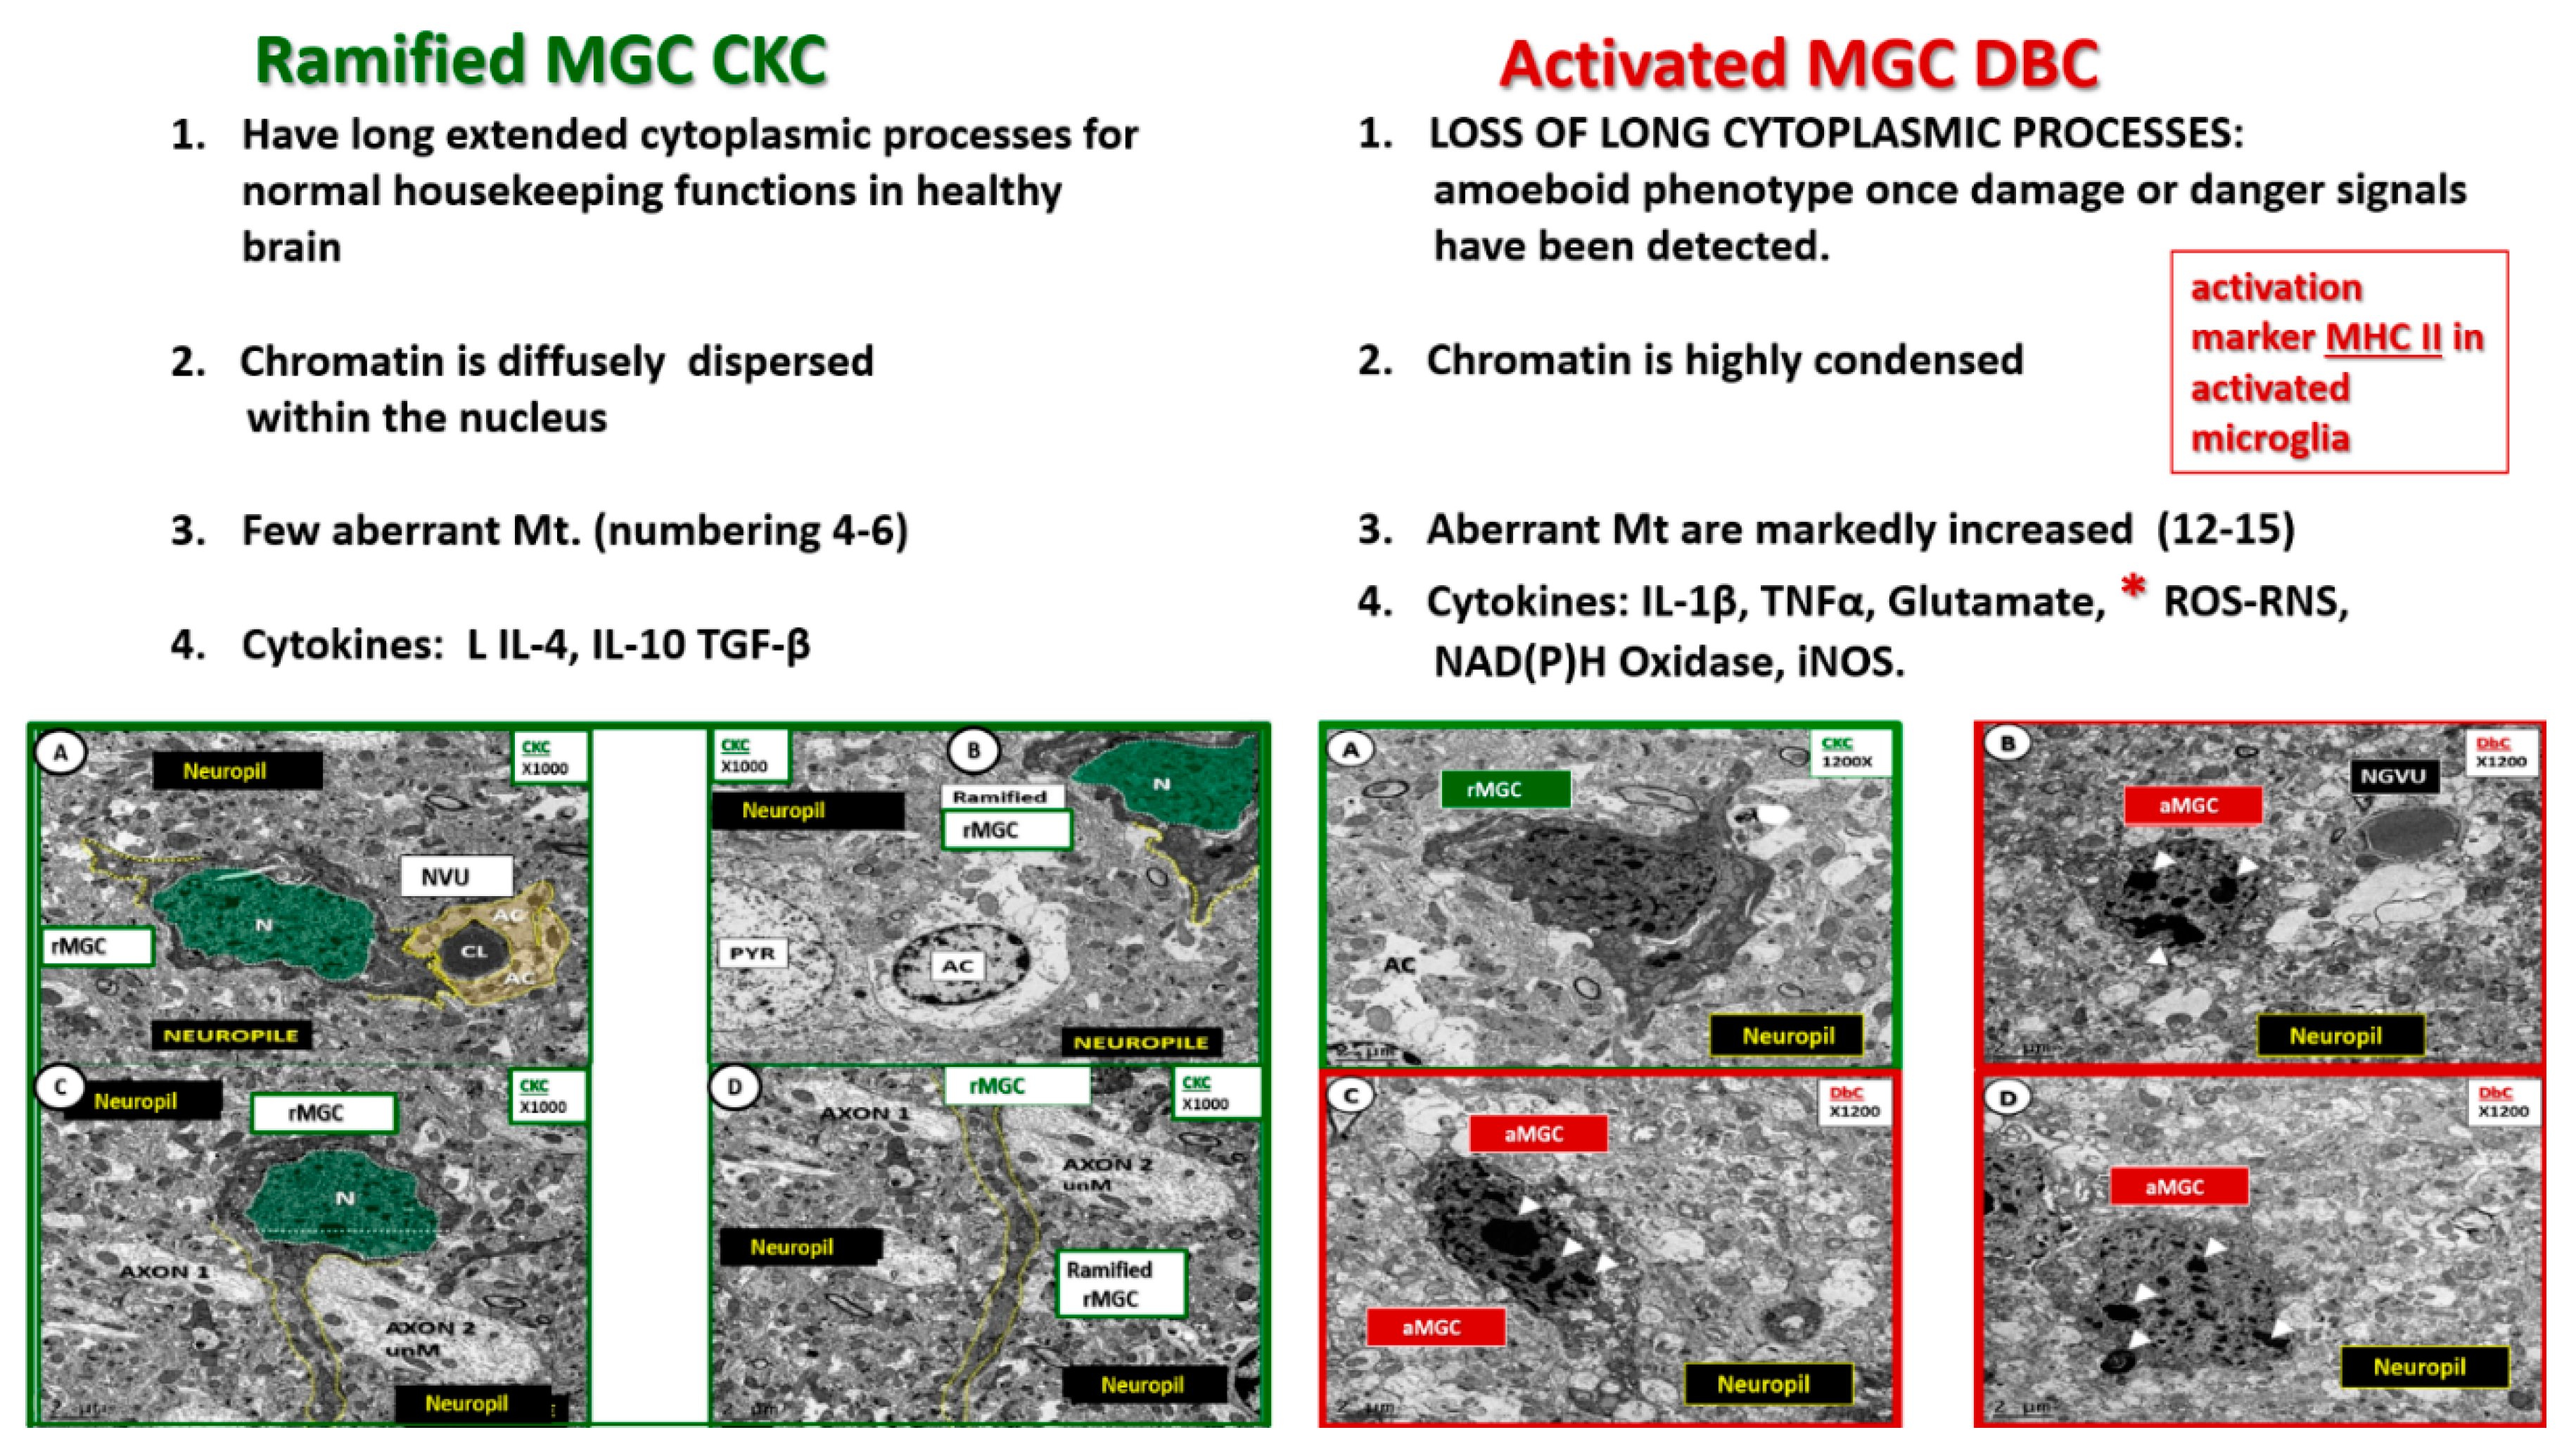
Comparison of ramified MGC to an activated MGC in control CKC and diabetic DBC models. (A–D) Depict the ramified (rMGC) (colorized with green nucleus) to demonstrate at low magnification the different morphology of the rMGC as compared to the activated aMGC DBC model (B–D). One notes the aMGC assumes a more amoeboid morphology in the DBC model (B–D) on the right outlined in red as compared to the CKC models on the left with CKC with ramified cytoplasmic extensions (outlined with yellow dashed lines). Also note that the nuclear chromatin is condensed, aggregated/clumped in the DBC models on right when compared to the diffuse nuclear chromatin in the CKC on the left. Importantly, note the major differences between the CKC and DBC in the upper 1–4 numbered major differences between CKC rMGC and DBC aMGC. The low magnification in these images is unable to demonstrate or appreciate the differences in mitochondria in these images. Magnification ×1000 (A–D in CKC) and ×1200 (A–D in DBC); Scale bar = 2 μm.
Figure 5.
Comparison of ramified MGC to an activated MGC in control CKC and diabetic DBC models. (A–D) Depict the ramified (rMGC) (colorized with green nucleus) to demonstrate at low magnification the different morphology of the rMGC as compared to the activated aMGC DBC model (B–D). One notes the aMGC assumes a more amoeboid morphology in the DBC model (B–D) on the right outlined in red as compared to the CKC models on the left with CKC with ramified cytoplasmic extensions (outlined with yellow dashed lines). Also note that the nuclear chromatin is condensed, aggregated/clumped in the DBC models on right when compared to the diffuse nuclear chromatin in the CKC on the left. Importantly, note the major differences between the CKC and DBC in the upper 1–4 numbered major differences between CKC rMGC and DBC aMGC. The low magnification in these images is unable to demonstrate or appreciate the differences in mitochondria in these images. Magnification ×1000 (A–D in CKC) and ×1200 (A–D in DBC); Scale bar = 2 μm.
![Neuroglia 01 00021 g005]()
Figure 6.
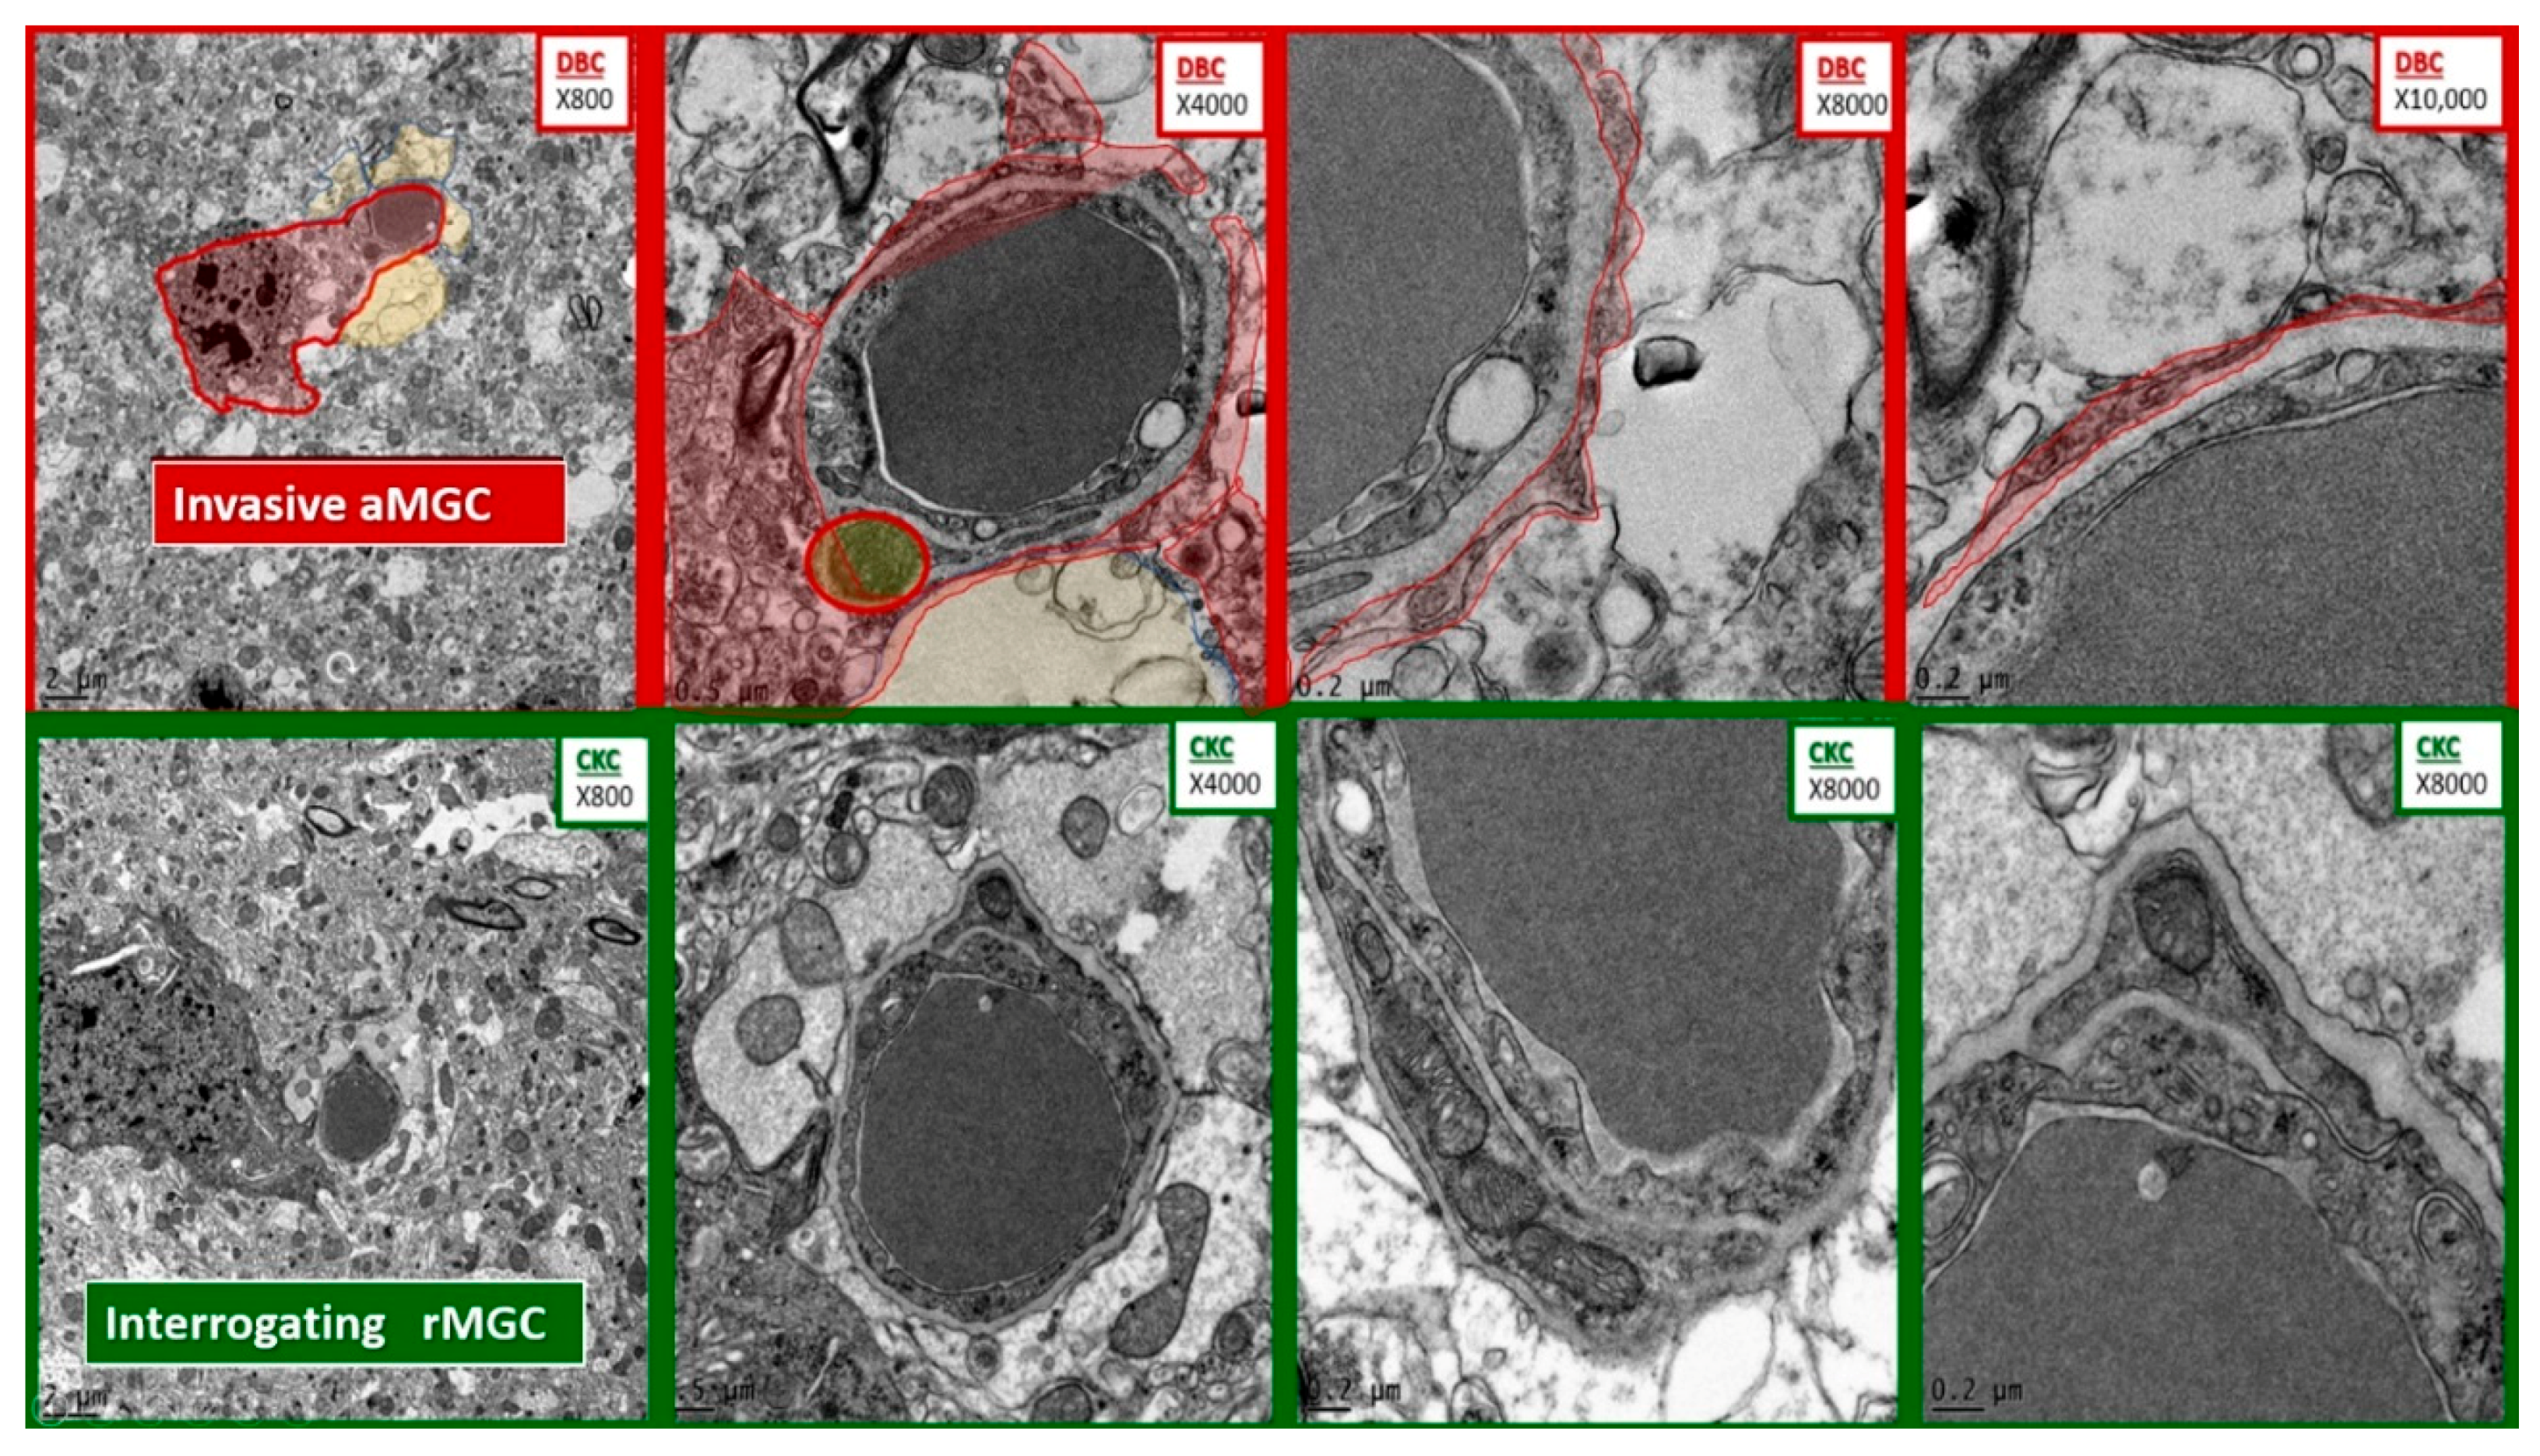
Comparison of microglia invasion in the diabetic DBC and interrogation in control CKC models. The top four panels depict the invasiveness of an activated microglial cell (aMGC) (pseudo-colored red) with marked chromatin clumping–aggregation invading a NUV with capillary lumen in progressively increased magnifications from left to right. Note the thin rim of the aMGC cytoplasmic extensions as it approaches the NVU and begins to encircle the enclosed endothelial and pericyte basement membrane with early detachment of the normally adherent intact astrocyte. In some images they will result in the complete astrocyte detachment and retraction from the NVU. Magnifications at the top right of each image and scale bars are indicated in the lower left of each panel. In the lower four panels of comparable magnifications note how the rMGC is only undergoing an interrogating function and does not invade the NVU.
Figure 6.
Comparison of microglia invasion in the diabetic DBC and interrogation in control CKC models. The top four panels depict the invasiveness of an activated microglial cell (aMGC) (pseudo-colored red) with marked chromatin clumping–aggregation invading a NUV with capillary lumen in progressively increased magnifications from left to right. Note the thin rim of the aMGC cytoplasmic extensions as it approaches the NVU and begins to encircle the enclosed endothelial and pericyte basement membrane with early detachment of the normally adherent intact astrocyte. In some images they will result in the complete astrocyte detachment and retraction from the NVU. Magnifications at the top right of each image and scale bars are indicated in the lower left of each panel. In the lower four panels of comparable magnifications note how the rMGC is only undergoing an interrogating function and does not invade the NVU.
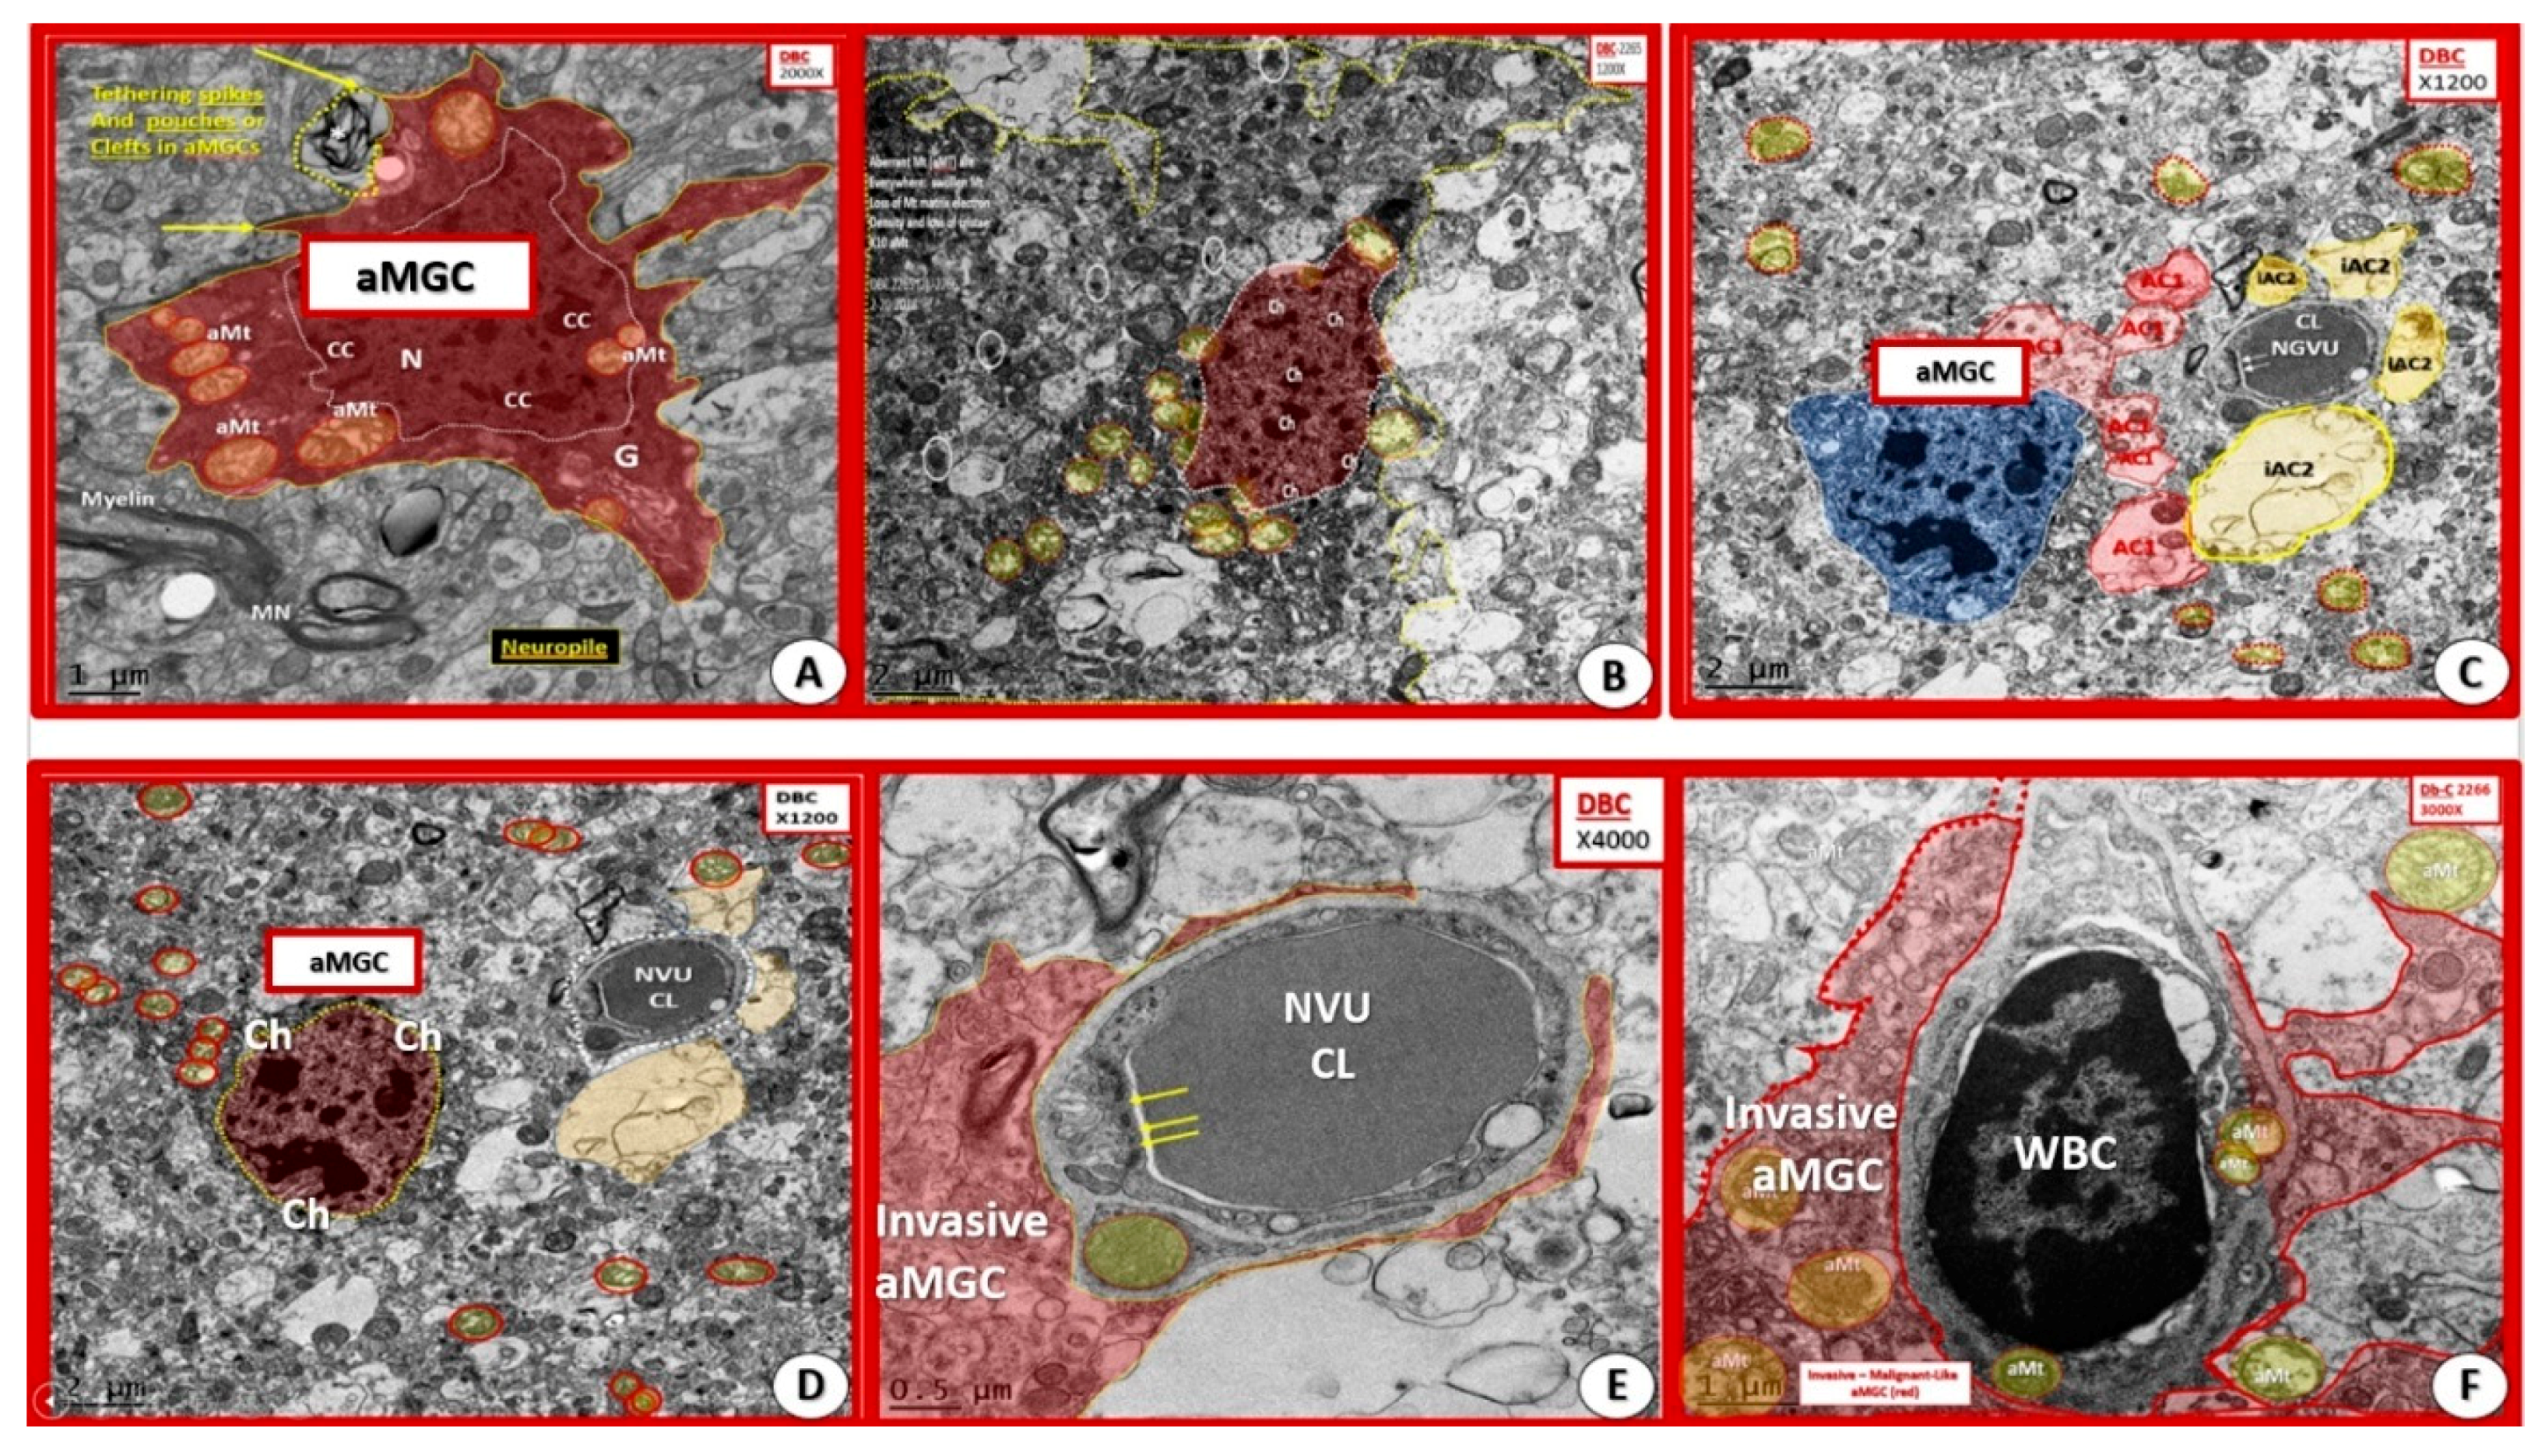
Figure 7.
Activated microglia become invasive of the neurovascular unit in diabetic DBC models. Panels (C–F) depict how activated MGCs (aMGCs) become invasive to the NVU in DBC models. In contrast to the CKC ramified MGC (rMGC), which are surveilling, aMGC (pseudo-colored red except for the ‘frown-faced’ aMGC (pseudo-colored blue)) nucleus in (C). Panel F depicts a mononuclear white blood cell (lymphocyte) (WBC) adherent to the luminal NVU endothelial cell. Magnification ×2000 (A); ×1200 (B–D); ×4000 (E); ×3000 (F) with varying scale bars lower left of each panel.
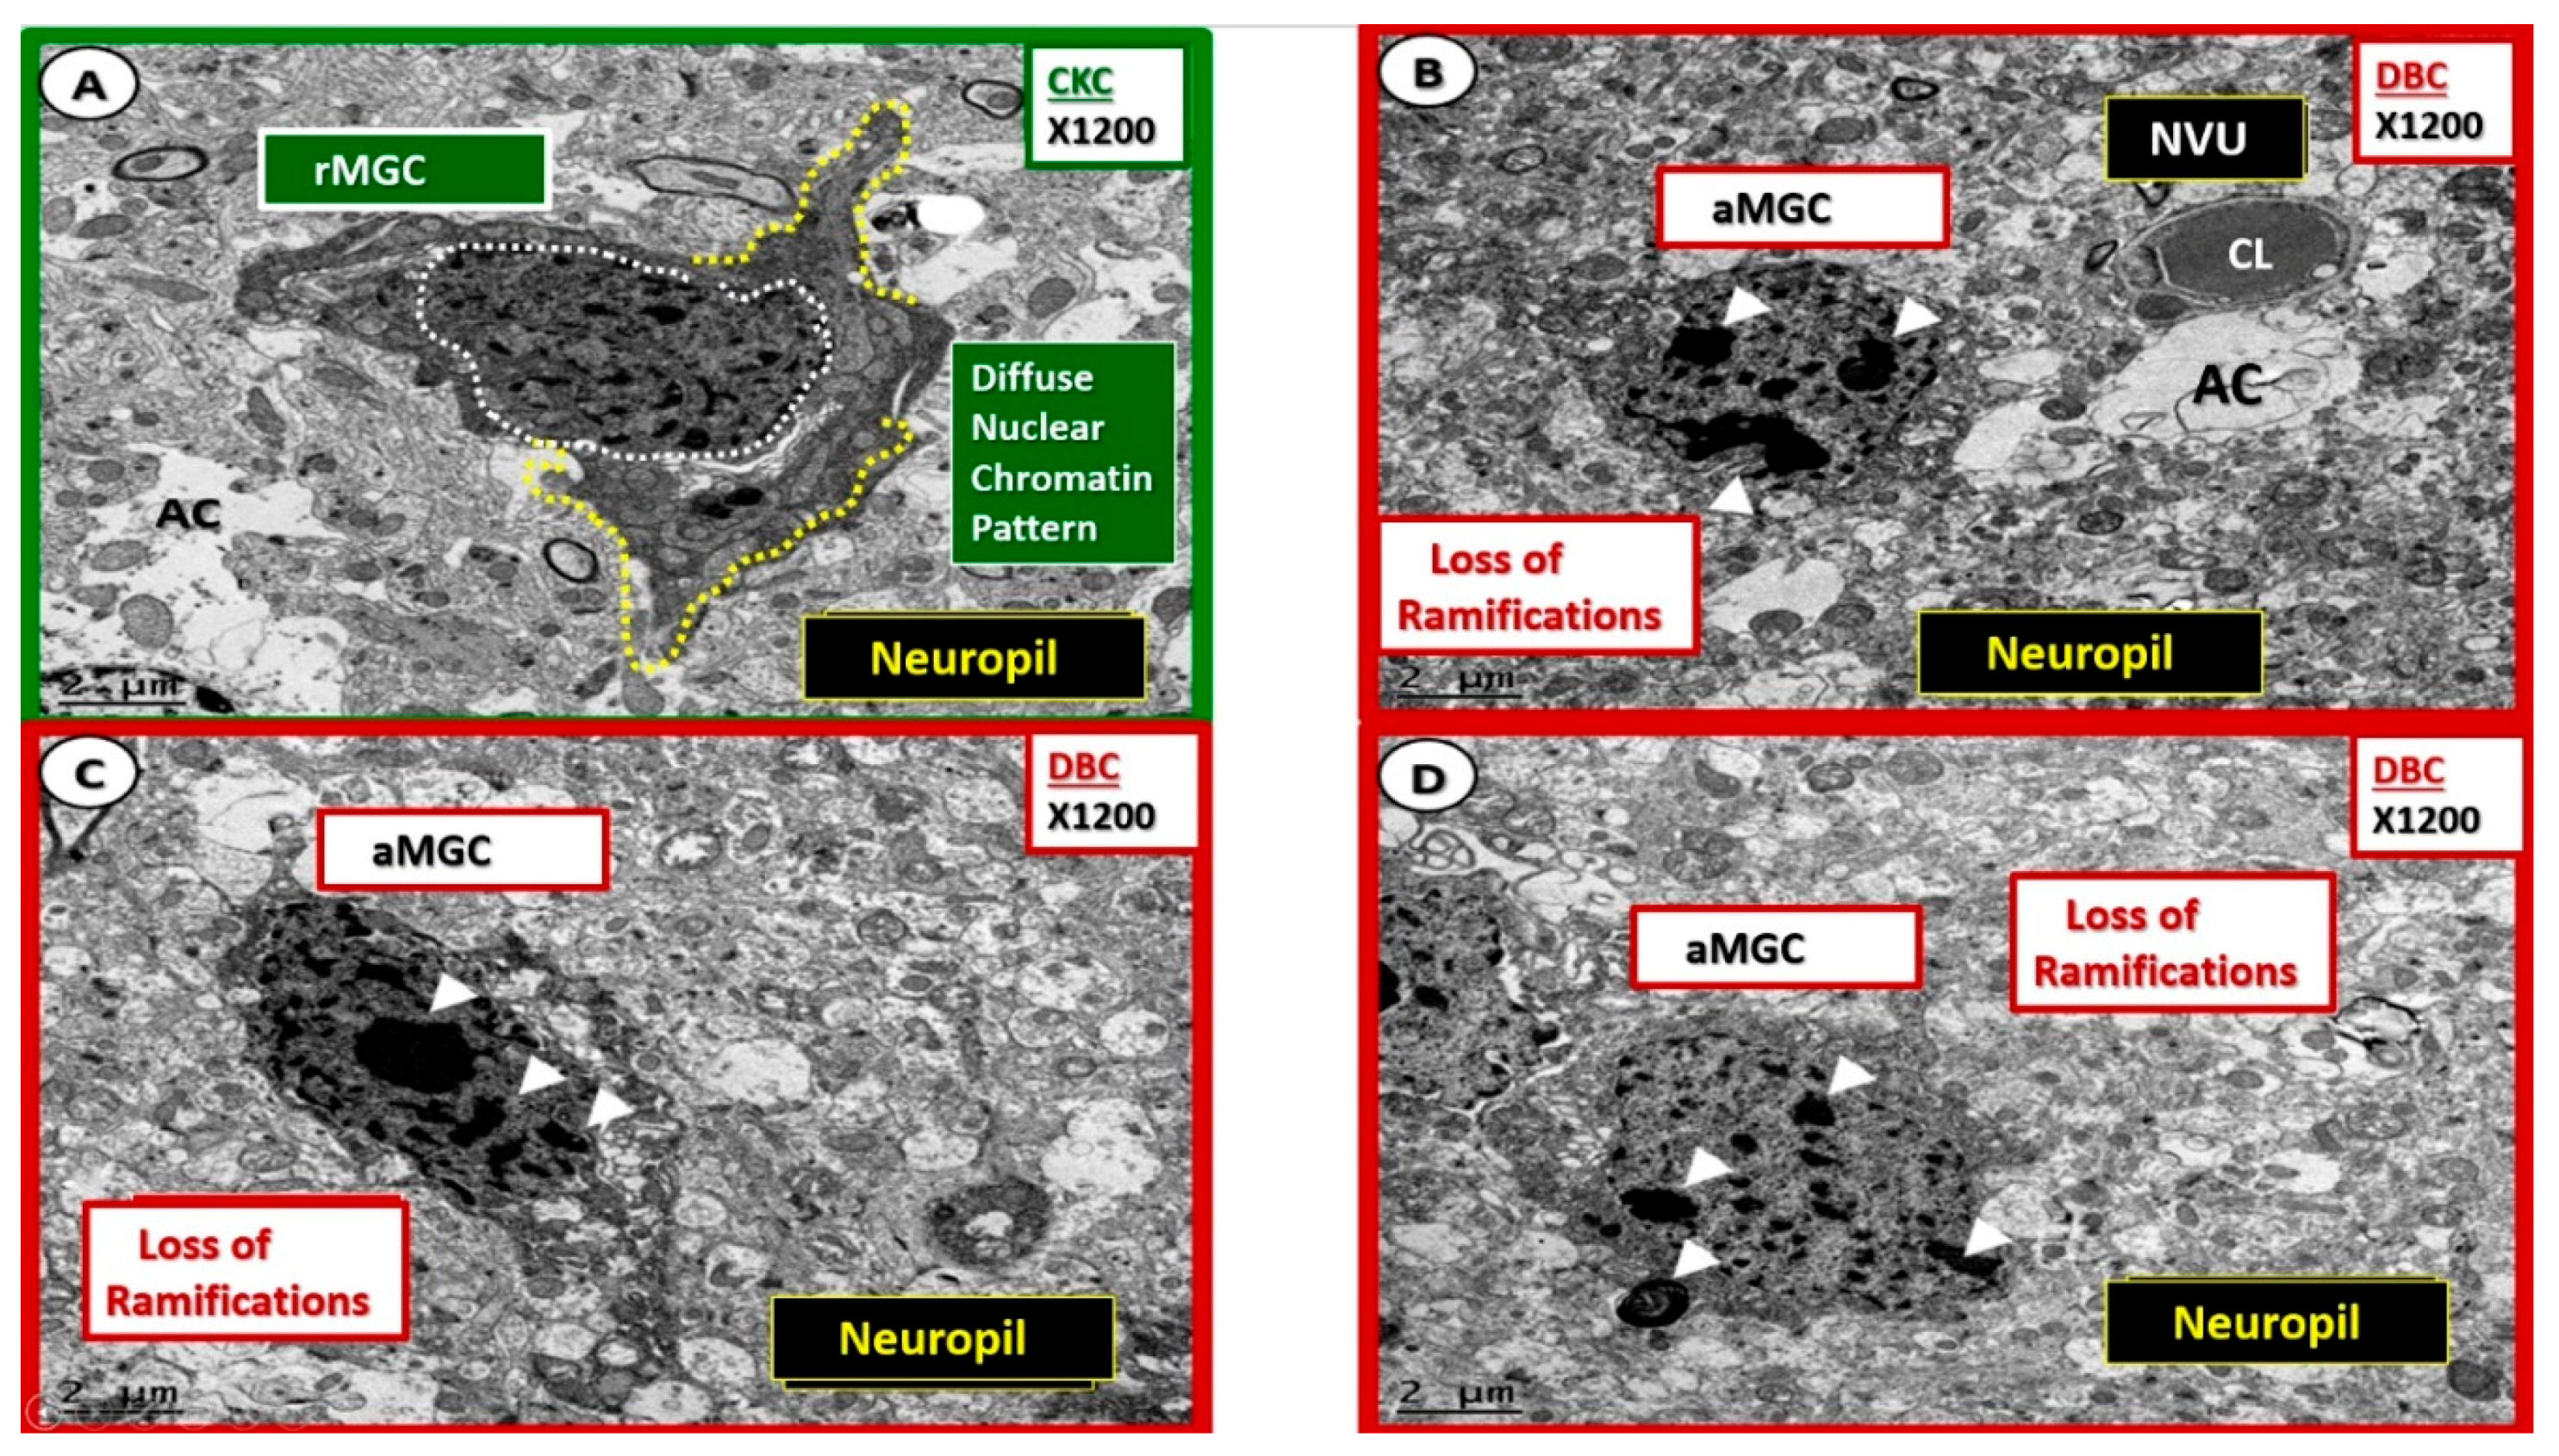
Figure 8.
Nuclear chromatin condensation of activated microglia in diabetic DBC models. (A) Depicts the appearance of the nucleus with diffuse nuclear chromatin pattern (outlined in white dashed lines) and ramified cytoplasmic extensions (yellow dashed lines). Panels (B–D) demonstrate a distinct phenotypic nuclear chromatin condensation (arrowheads) within the nuclei of the activated microglia cells (aMGC) in the diabetic DBC as compared to the ramified microglia cells (rMGC) in control nondiabetic CKC models. Specifically, note the unusual ‘frown-faced’ nuclei in panel B due to nuclear chromatin condensation. Magnification ×1200; scale bar = 2 μm. CL: capillary lumen; NVU: neurovascular unit.
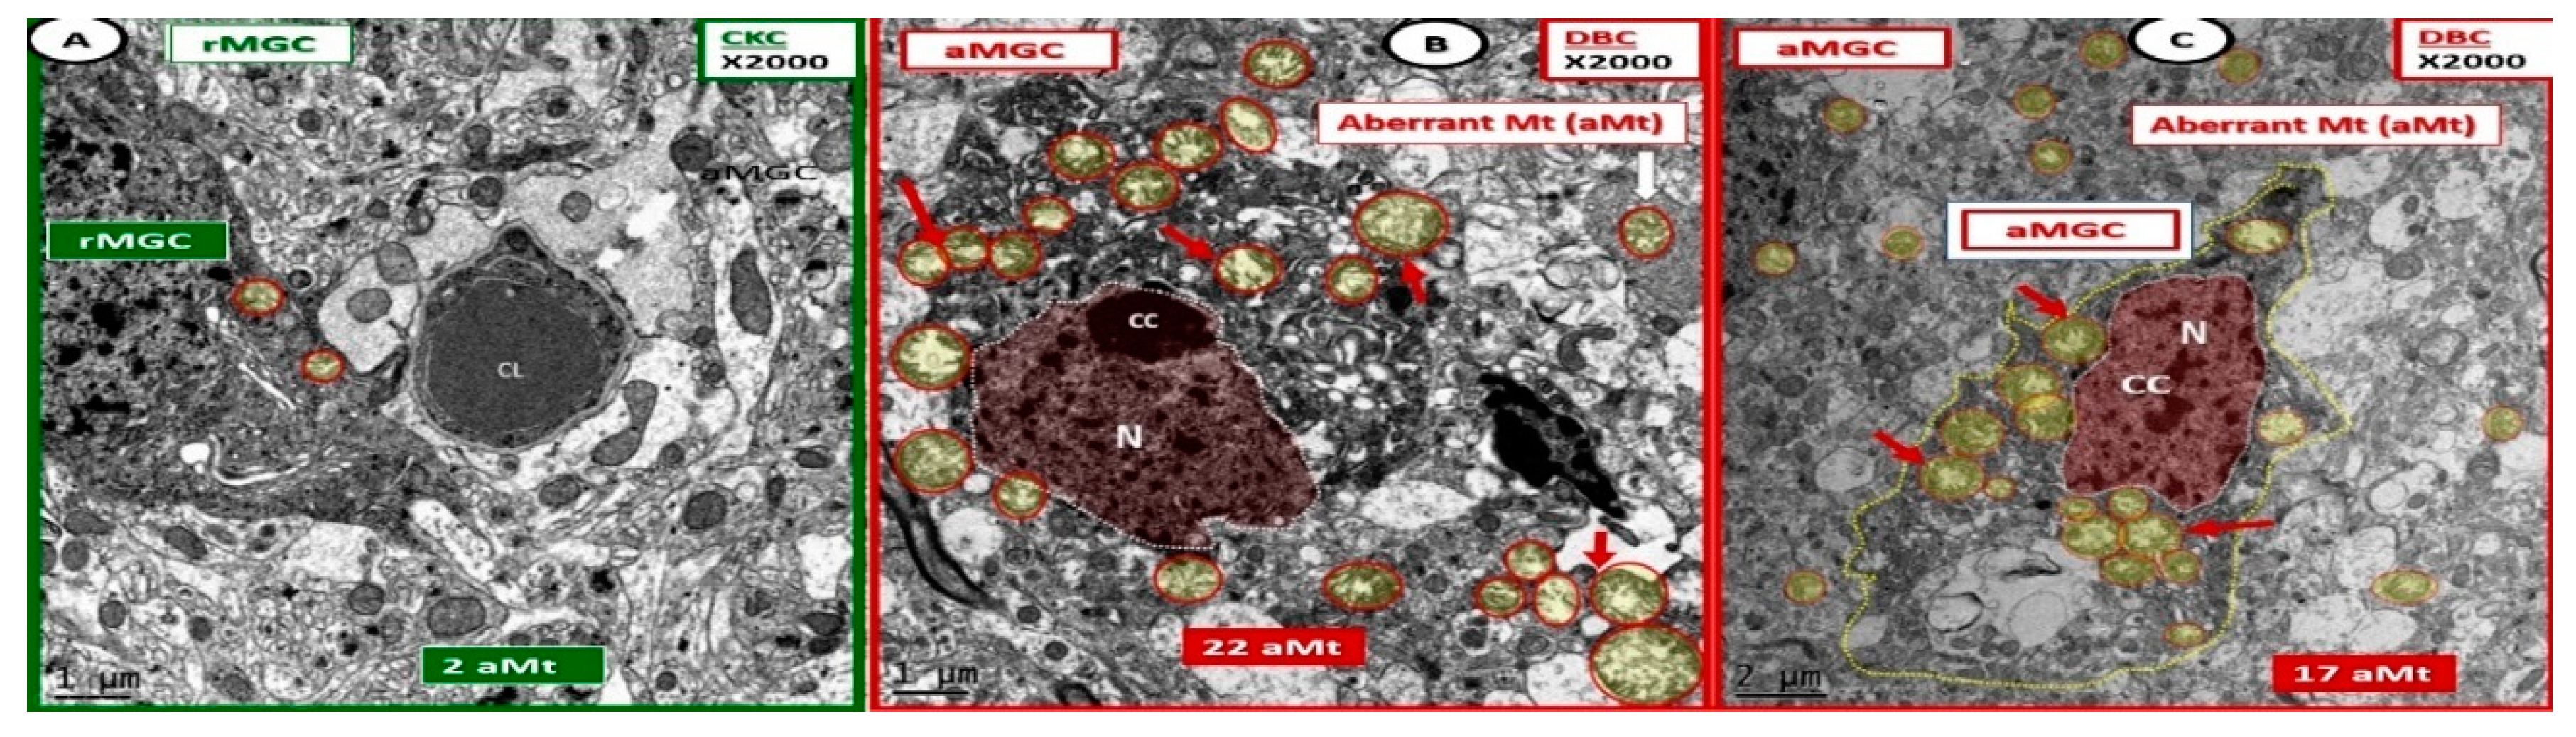
Figure 9.
Activated microglia cells depict aberrant mitochondria in diabetic DBC models. Panels (B,C) illustrate the pseudo-colored red nuclei of activated microglia cells (aMGC) and the aberrant mitochondria (aMt) (pseudo-colored yellow with encircling red lines) (arrows) that are markedly increased in number and demonstrate marked mitochondrial (Mt) swelling with loss of electron-dense Mt matrix and crista as compared to control CKC model (Panel A) in diabetic DBC. Aberrant Mt will also be observed in other neurovascular unit cells and neurons in later images. Also, some aMGCs were extremely dark as in panel (B). However, all MGC are dark when compared to other glia and neurons. Magnification ×2000; bar = 1 μm in panels (A,B) and bar = 2 μm in panel (C). CC: chromatin condensation; CL: capillary lumen; N: nucleus.
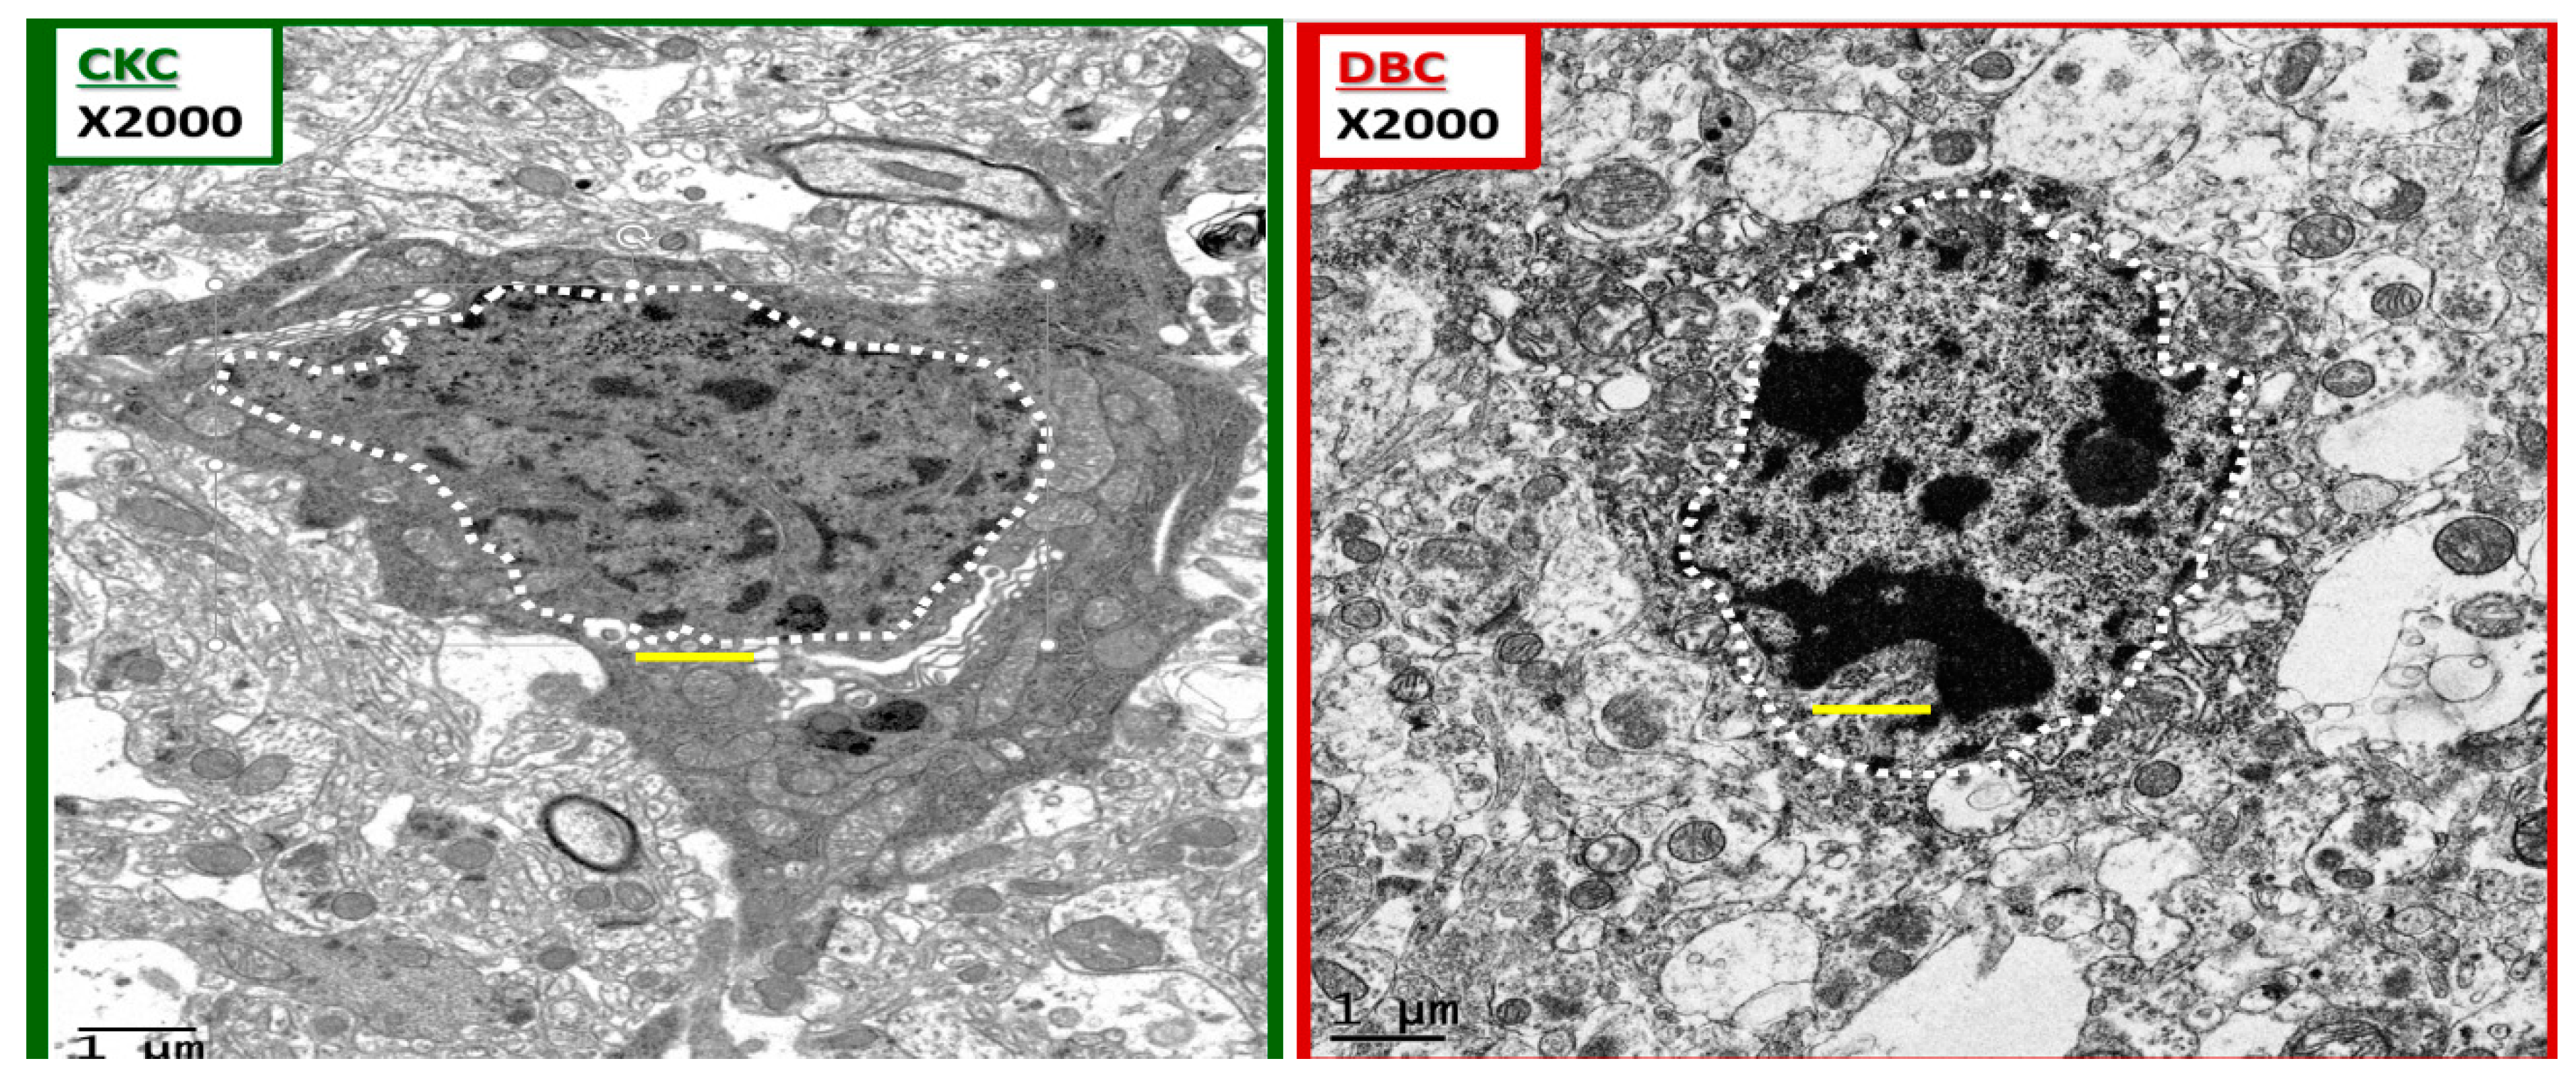
Figure 10.
Chromatin condensation in the diabetic DBC. The above images depict ramified and amoeboid-activated microglia in a side-by-side comparison. A ramified microglia (rMGC) on the left with a stippled outer chromatin at the neurolemma and a diffuse stippling of chromatin within the core of the nucleus in the control CKC. In contrast, the amoeboid-activated microglia (aMGC) on the right depicts marked nuclear chromatin condensation in the DBC. Note that in the aMGC of the diabetic DBC the nuclear chromatin condensation–compaction volume is markedly greater than in the nondiabetic control rMGC CKC models. Magnification ×2000; scale bar = 1 μm and was copied and placed within the nuclei to appreciate the sizes of the chromatin.
Figure 11.
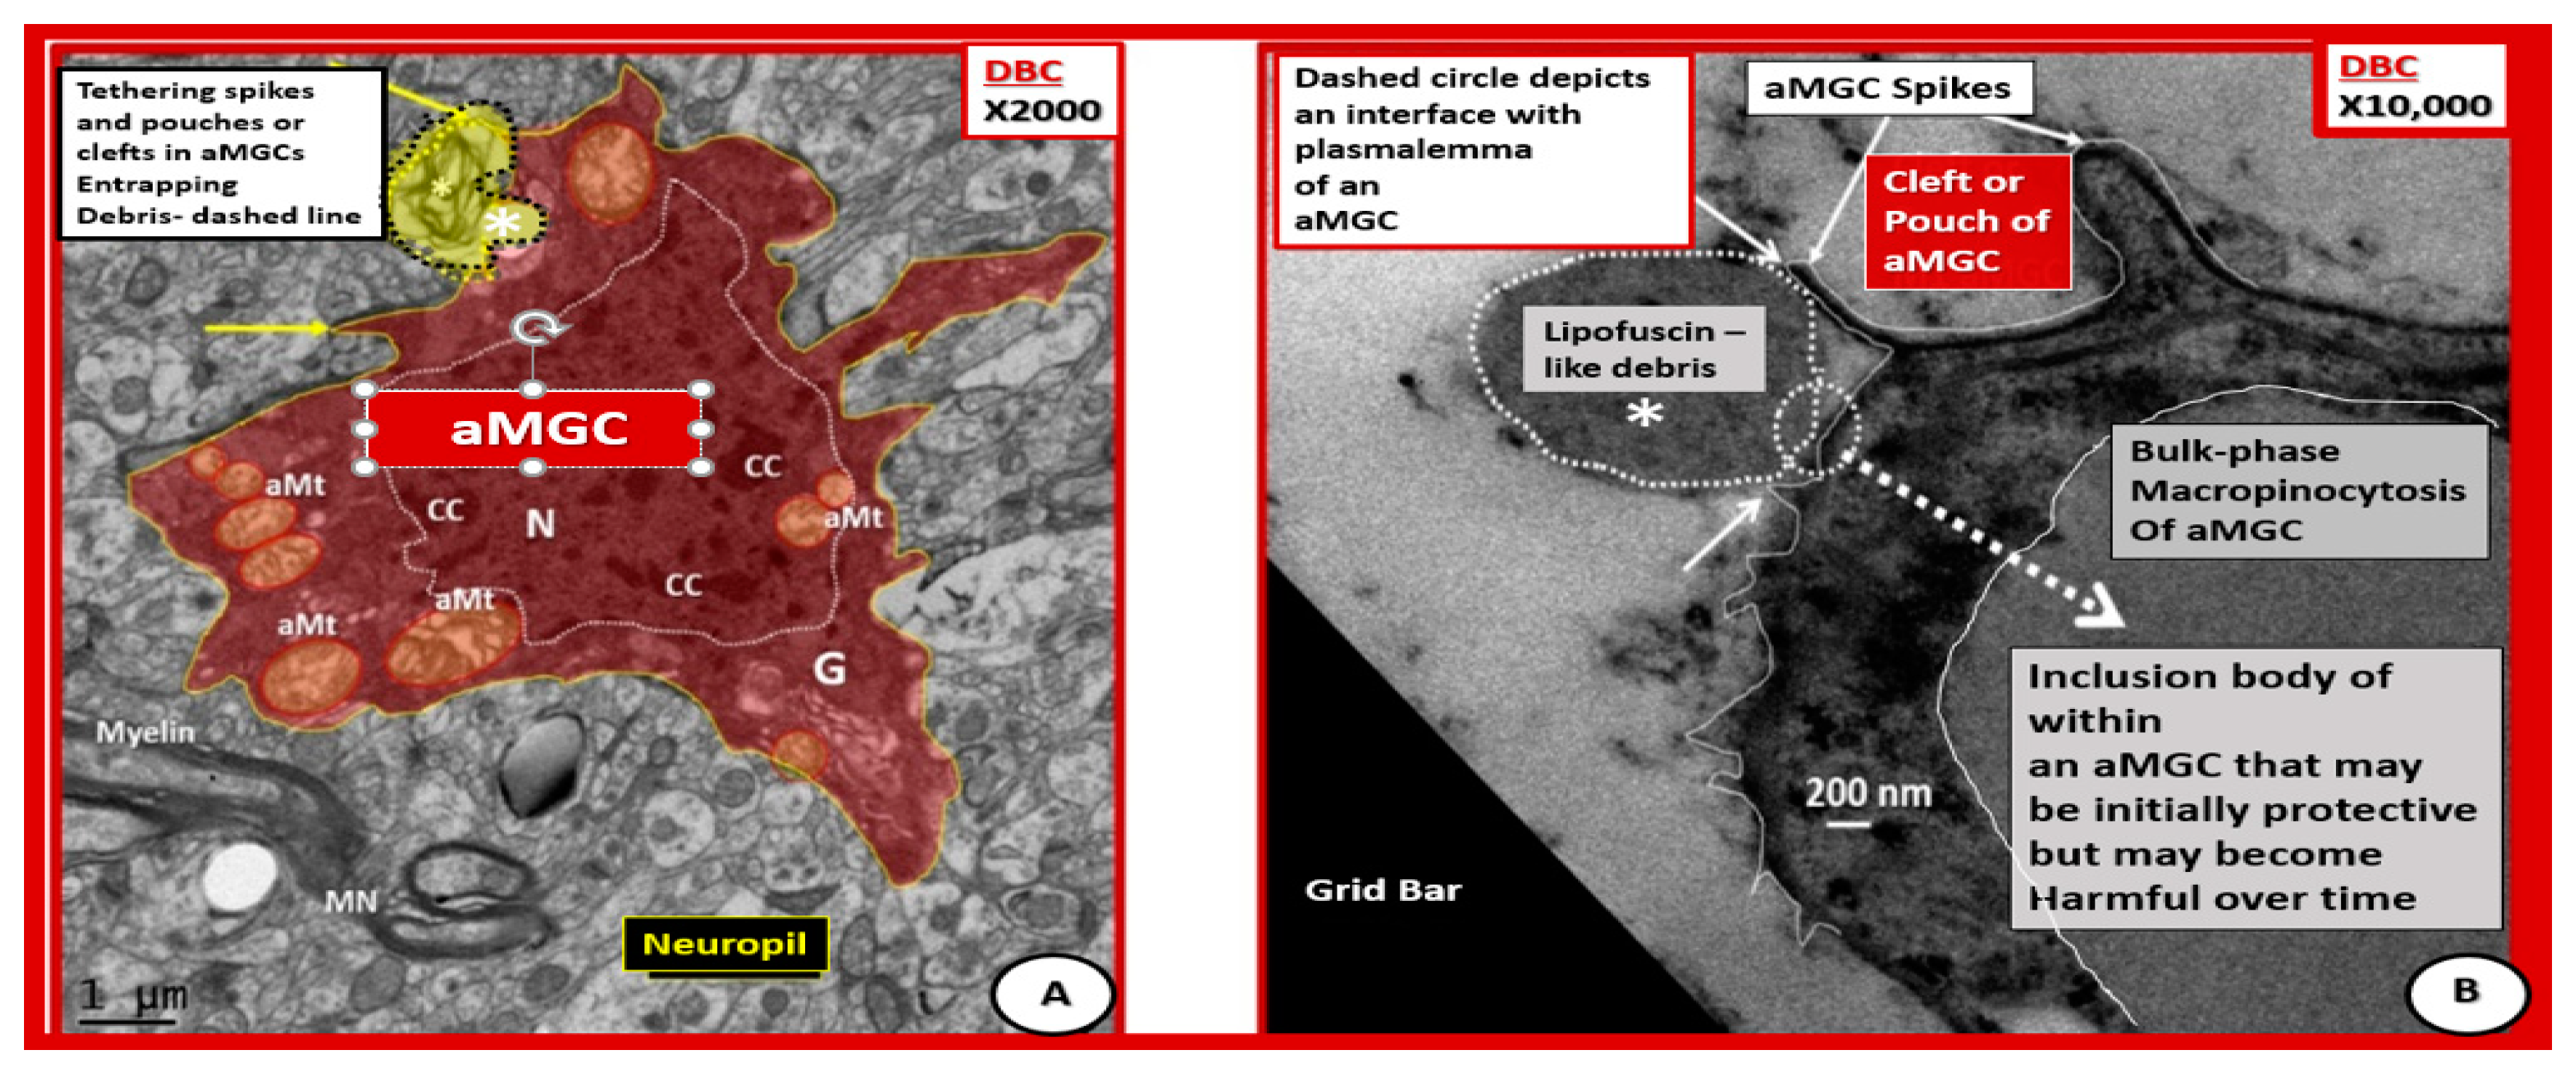
Activated microglia with aberrant mitochondria and tethering spikes and pouches in diabetic DBC. (A) Depicts a pseudo-colored red aMGC. (B) Depicts a high magnification of a portion of an outer cytoplasmic MGC phagocytosing lipofuscin-like debris. In (A), the plasma membrane appears to be taking up a residual body (dashed line with yellow color) and uptake of lipofuscin-like debris (white dashed line) in (B). Panel (A) depicts spikes (arrows) and pouches or clefts and aberrant mitochondria (aMt) (pseudo-colored yellow with red outer lines). Panel B illustrates bulk phase macropinocytosis of lipofuscin-like debris across the plasma membrane and appears to be being deposited within the cytoplasm of an aMGC. These two aMGCs are different cells but both are within the cerebral cortical grey matter in layer III and demonstrate the important process of phagocytosis. Note the prominent chromatin condensation (CC) within the nucleus. Panel A magnification ×2000; bar = 1μm. Panel B magnification ×10,000; bar = 200 nm. G = Golgi apparatus; MN = myelinated neuron.
Figure 11.
Activated microglia with aberrant mitochondria and tethering spikes and pouches in diabetic DBC. (A) Depicts a pseudo-colored red aMGC. (B) Depicts a high magnification of a portion of an outer cytoplasmic MGC phagocytosing lipofuscin-like debris. In (A), the plasma membrane appears to be taking up a residual body (dashed line with yellow color) and uptake of lipofuscin-like debris (white dashed line) in (B). Panel (A) depicts spikes (arrows) and pouches or clefts and aberrant mitochondria (aMt) (pseudo-colored yellow with red outer lines). Panel B illustrates bulk phase macropinocytosis of lipofuscin-like debris across the plasma membrane and appears to be being deposited within the cytoplasm of an aMGC. These two aMGCs are different cells but both are within the cerebral cortical grey matter in layer III and demonstrate the important process of phagocytosis. Note the prominent chromatin condensation (CC) within the nucleus. Panel A magnification ×2000; bar = 1μm. Panel B magnification ×10,000; bar = 200 nm. G = Golgi apparatus; MN = myelinated neuron.
![Neuroglia 01 00021 g011]()
Figure 12.
Activated microglia cells are associated with chromatin condensation and invasiveness of the neurovascular unit in the diabetic DBC Models. Panels (A–F) depict an activated ‘frown-faced’ activated/amoeboid microglia cell (aMGC) and follows it through progressively increased magnifications to demonstrate how the aMGC invades the NVU and associates with early astrocyte (AC) detachment. Additionally, note how the blood brain barrier (BBB) tight and adherent junctions (TJ/AJ) are attenuated via interruption of the normally continuous TJ/AJ of the BBB in panel (F). Also note in panel (F) that the aMGC of the ‘frown-faced’ microglia with marked chromatin condensation appears to not only invade but may also lift and promote the early separation of the intact AC from the basement membrane of the NVU inferiorly and superiorly. CL: capillary lumen.
Figure 13.
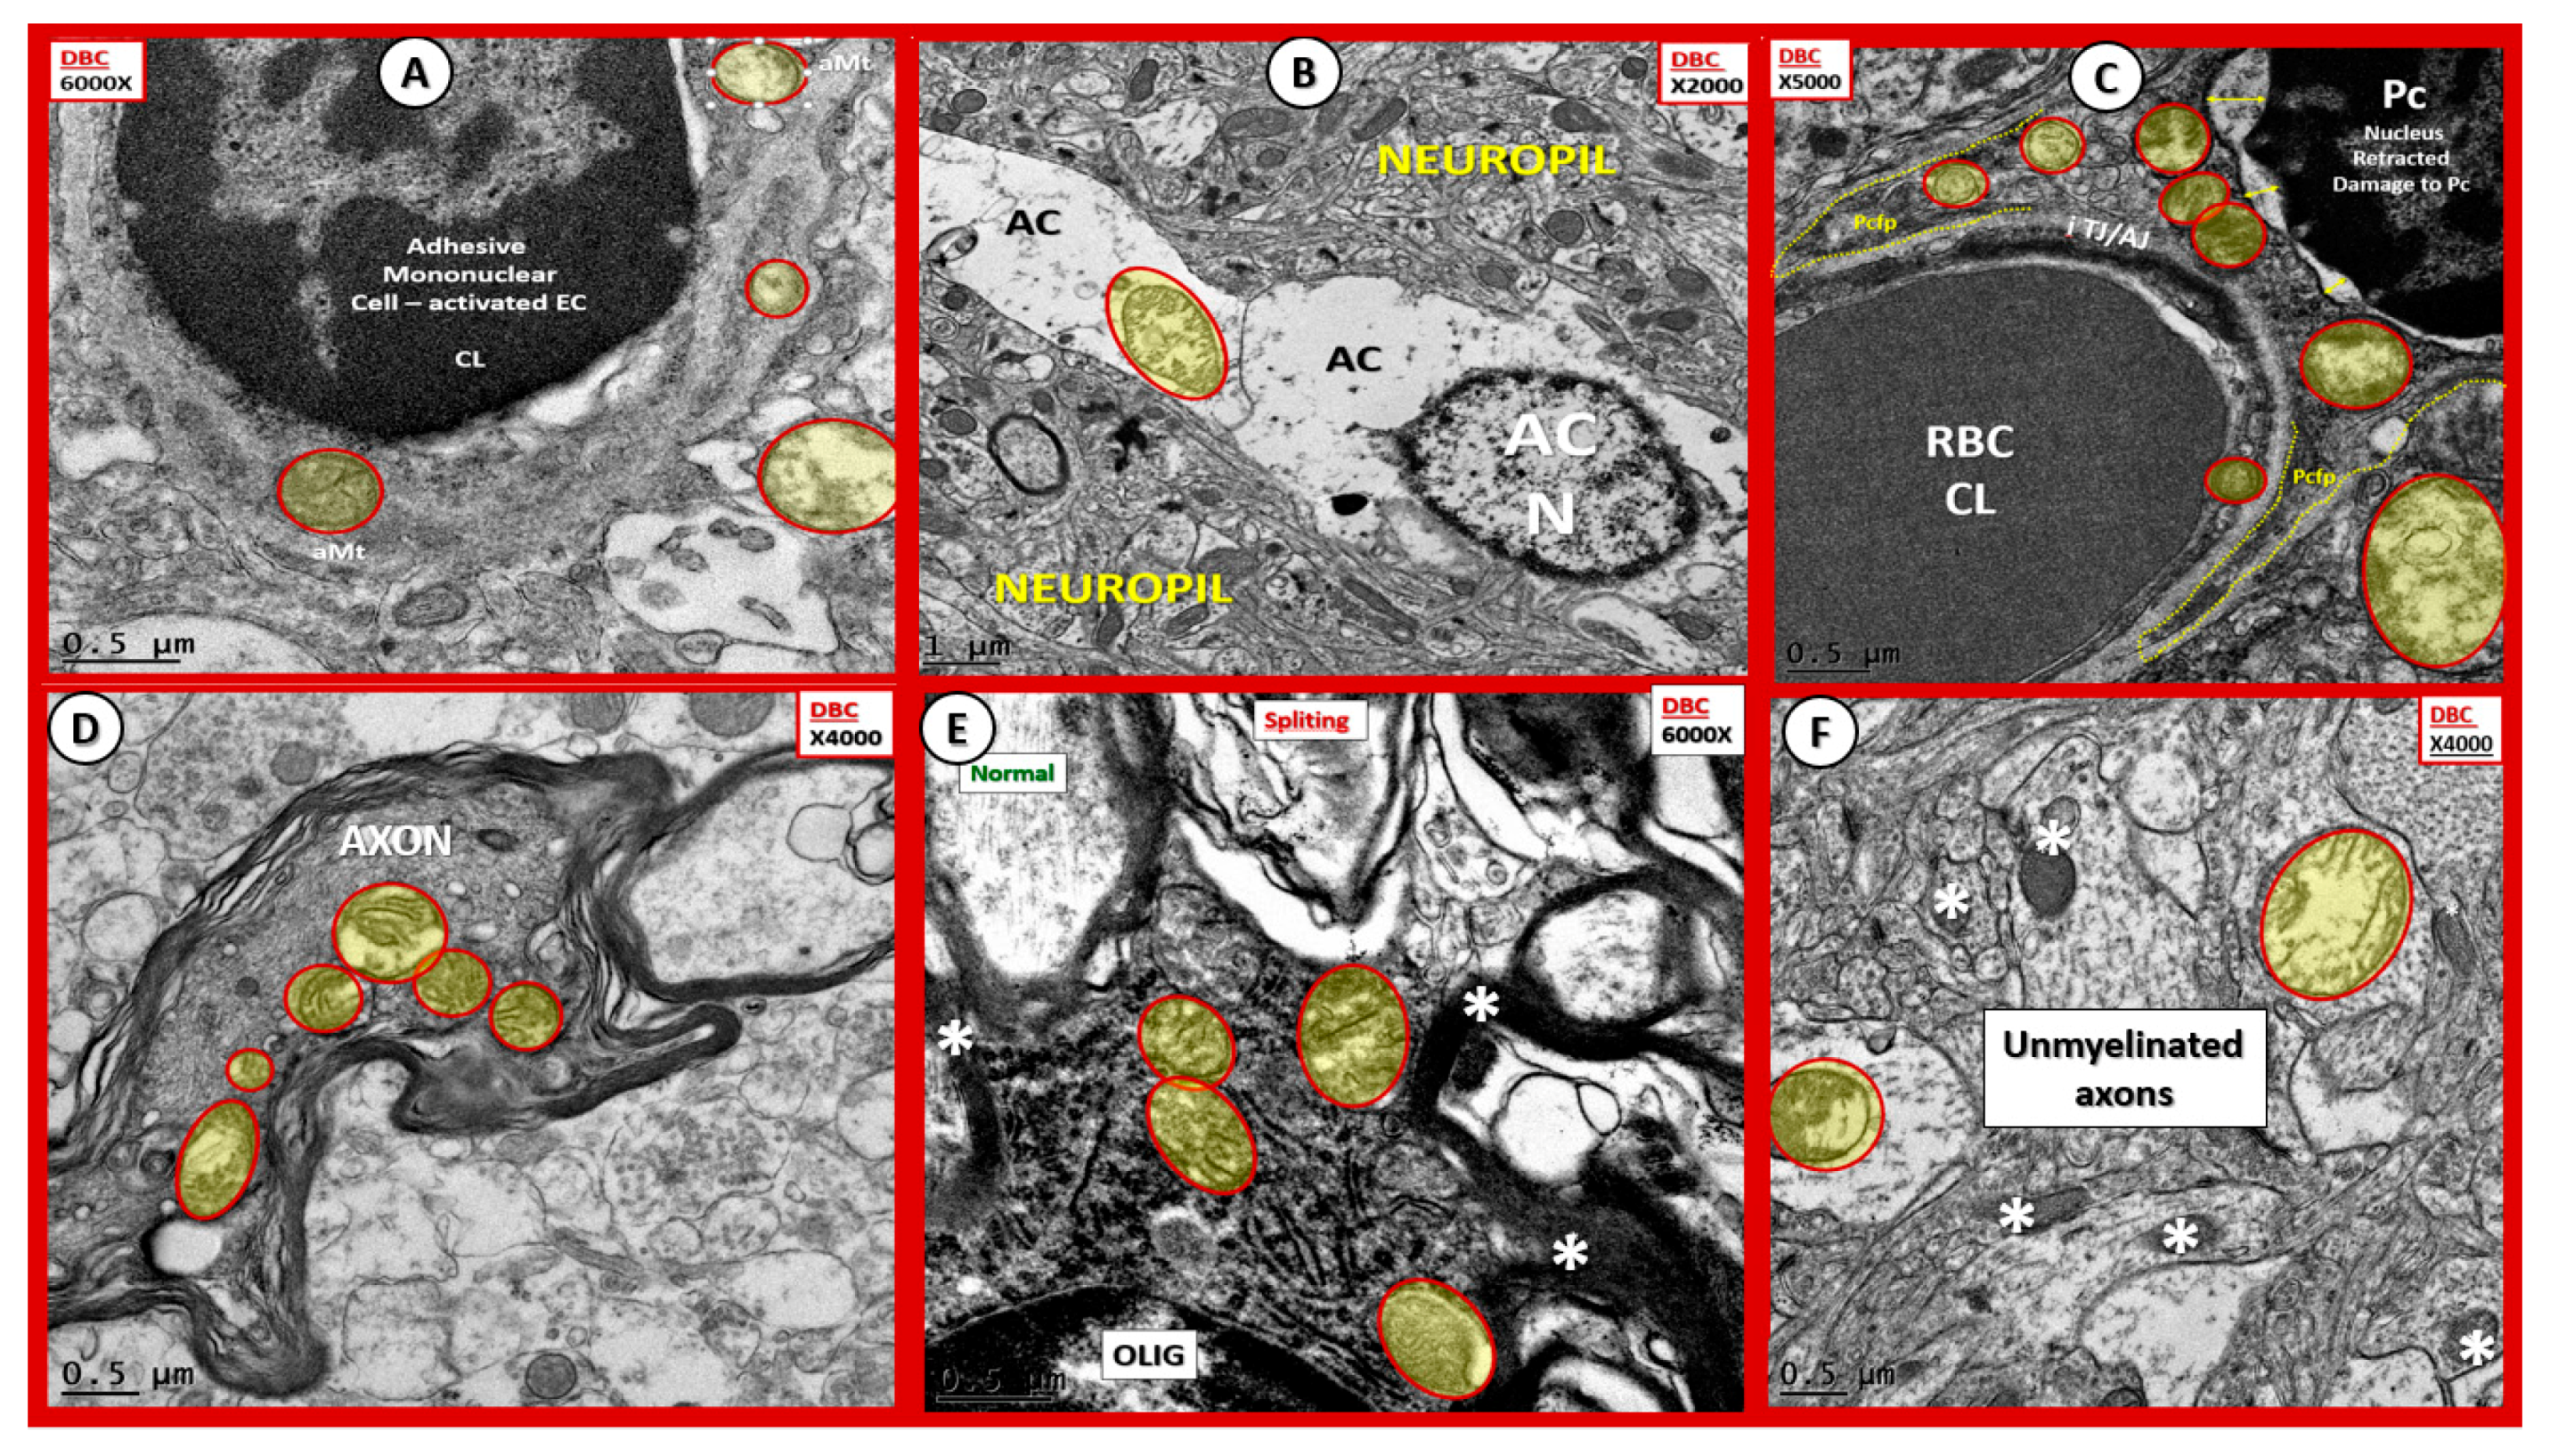
Aberrant mitochondria in endothelial cells, pericytes and foot processes, astrocytes, oligodendrocytes, myelinated and unmyelinated neurons. Panels (A–F) demonstrate that aberrant mitochondria (aMt) are found to be present in multiple cells in addition to activated microglia cells (aMGCs). The aMt are pseudo-colored in each of these panels (yellow outlined in red lines) in order to allow rapid recognition. Panels (B,F) are especially important since they demonstrate the aMt characterized by swollen mitochondria (Mt), loss of electron-dense Mt matrix and crista. Panel (A) illustrates the aMt within the endothelial cells and surrounding aMGC. Panel (B) depicts aMt in ACs. Panel (C) demonstrates aMt in pericytes and foot processes (Pc and Pcfp). Panel (D) depicts aMt in a dysmyelinated neuronal axon. Panel (E) depicts aMt in an oligodendrocyte and Panel (F) illustrates aMt in an AC to the left and an unmyelinated axon on the right within the neuropil. Magnifications are noted in the upper part of each panel and scale bars are located at the lower left-hand side of all panels. Scale bars = 0.5 μm in all images except for panel (B) with scale bar = 1 μm.
Figure 13.
Aberrant mitochondria in endothelial cells, pericytes and foot processes, astrocytes, oligodendrocytes, myelinated and unmyelinated neurons. Panels (A–F) demonstrate that aberrant mitochondria (aMt) are found to be present in multiple cells in addition to activated microglia cells (aMGCs). The aMt are pseudo-colored in each of these panels (yellow outlined in red lines) in order to allow rapid recognition. Panels (B,F) are especially important since they demonstrate the aMt characterized by swollen mitochondria (Mt), loss of electron-dense Mt matrix and crista. Panel (A) illustrates the aMt within the endothelial cells and surrounding aMGC. Panel (B) depicts aMt in ACs. Panel (C) demonstrates aMt in pericytes and foot processes (Pc and Pcfp). Panel (D) depicts aMt in a dysmyelinated neuronal axon. Panel (E) depicts aMt in an oligodendrocyte and Panel (F) illustrates aMt in an AC to the left and an unmyelinated axon on the right within the neuropil. Magnifications are noted in the upper part of each panel and scale bars are located at the lower left-hand side of all panels. Scale bars = 0.5 μm in all images except for panel (B) with scale bar = 1 μm.
![Neuroglia 01 00021 g013]()
Figure 14.
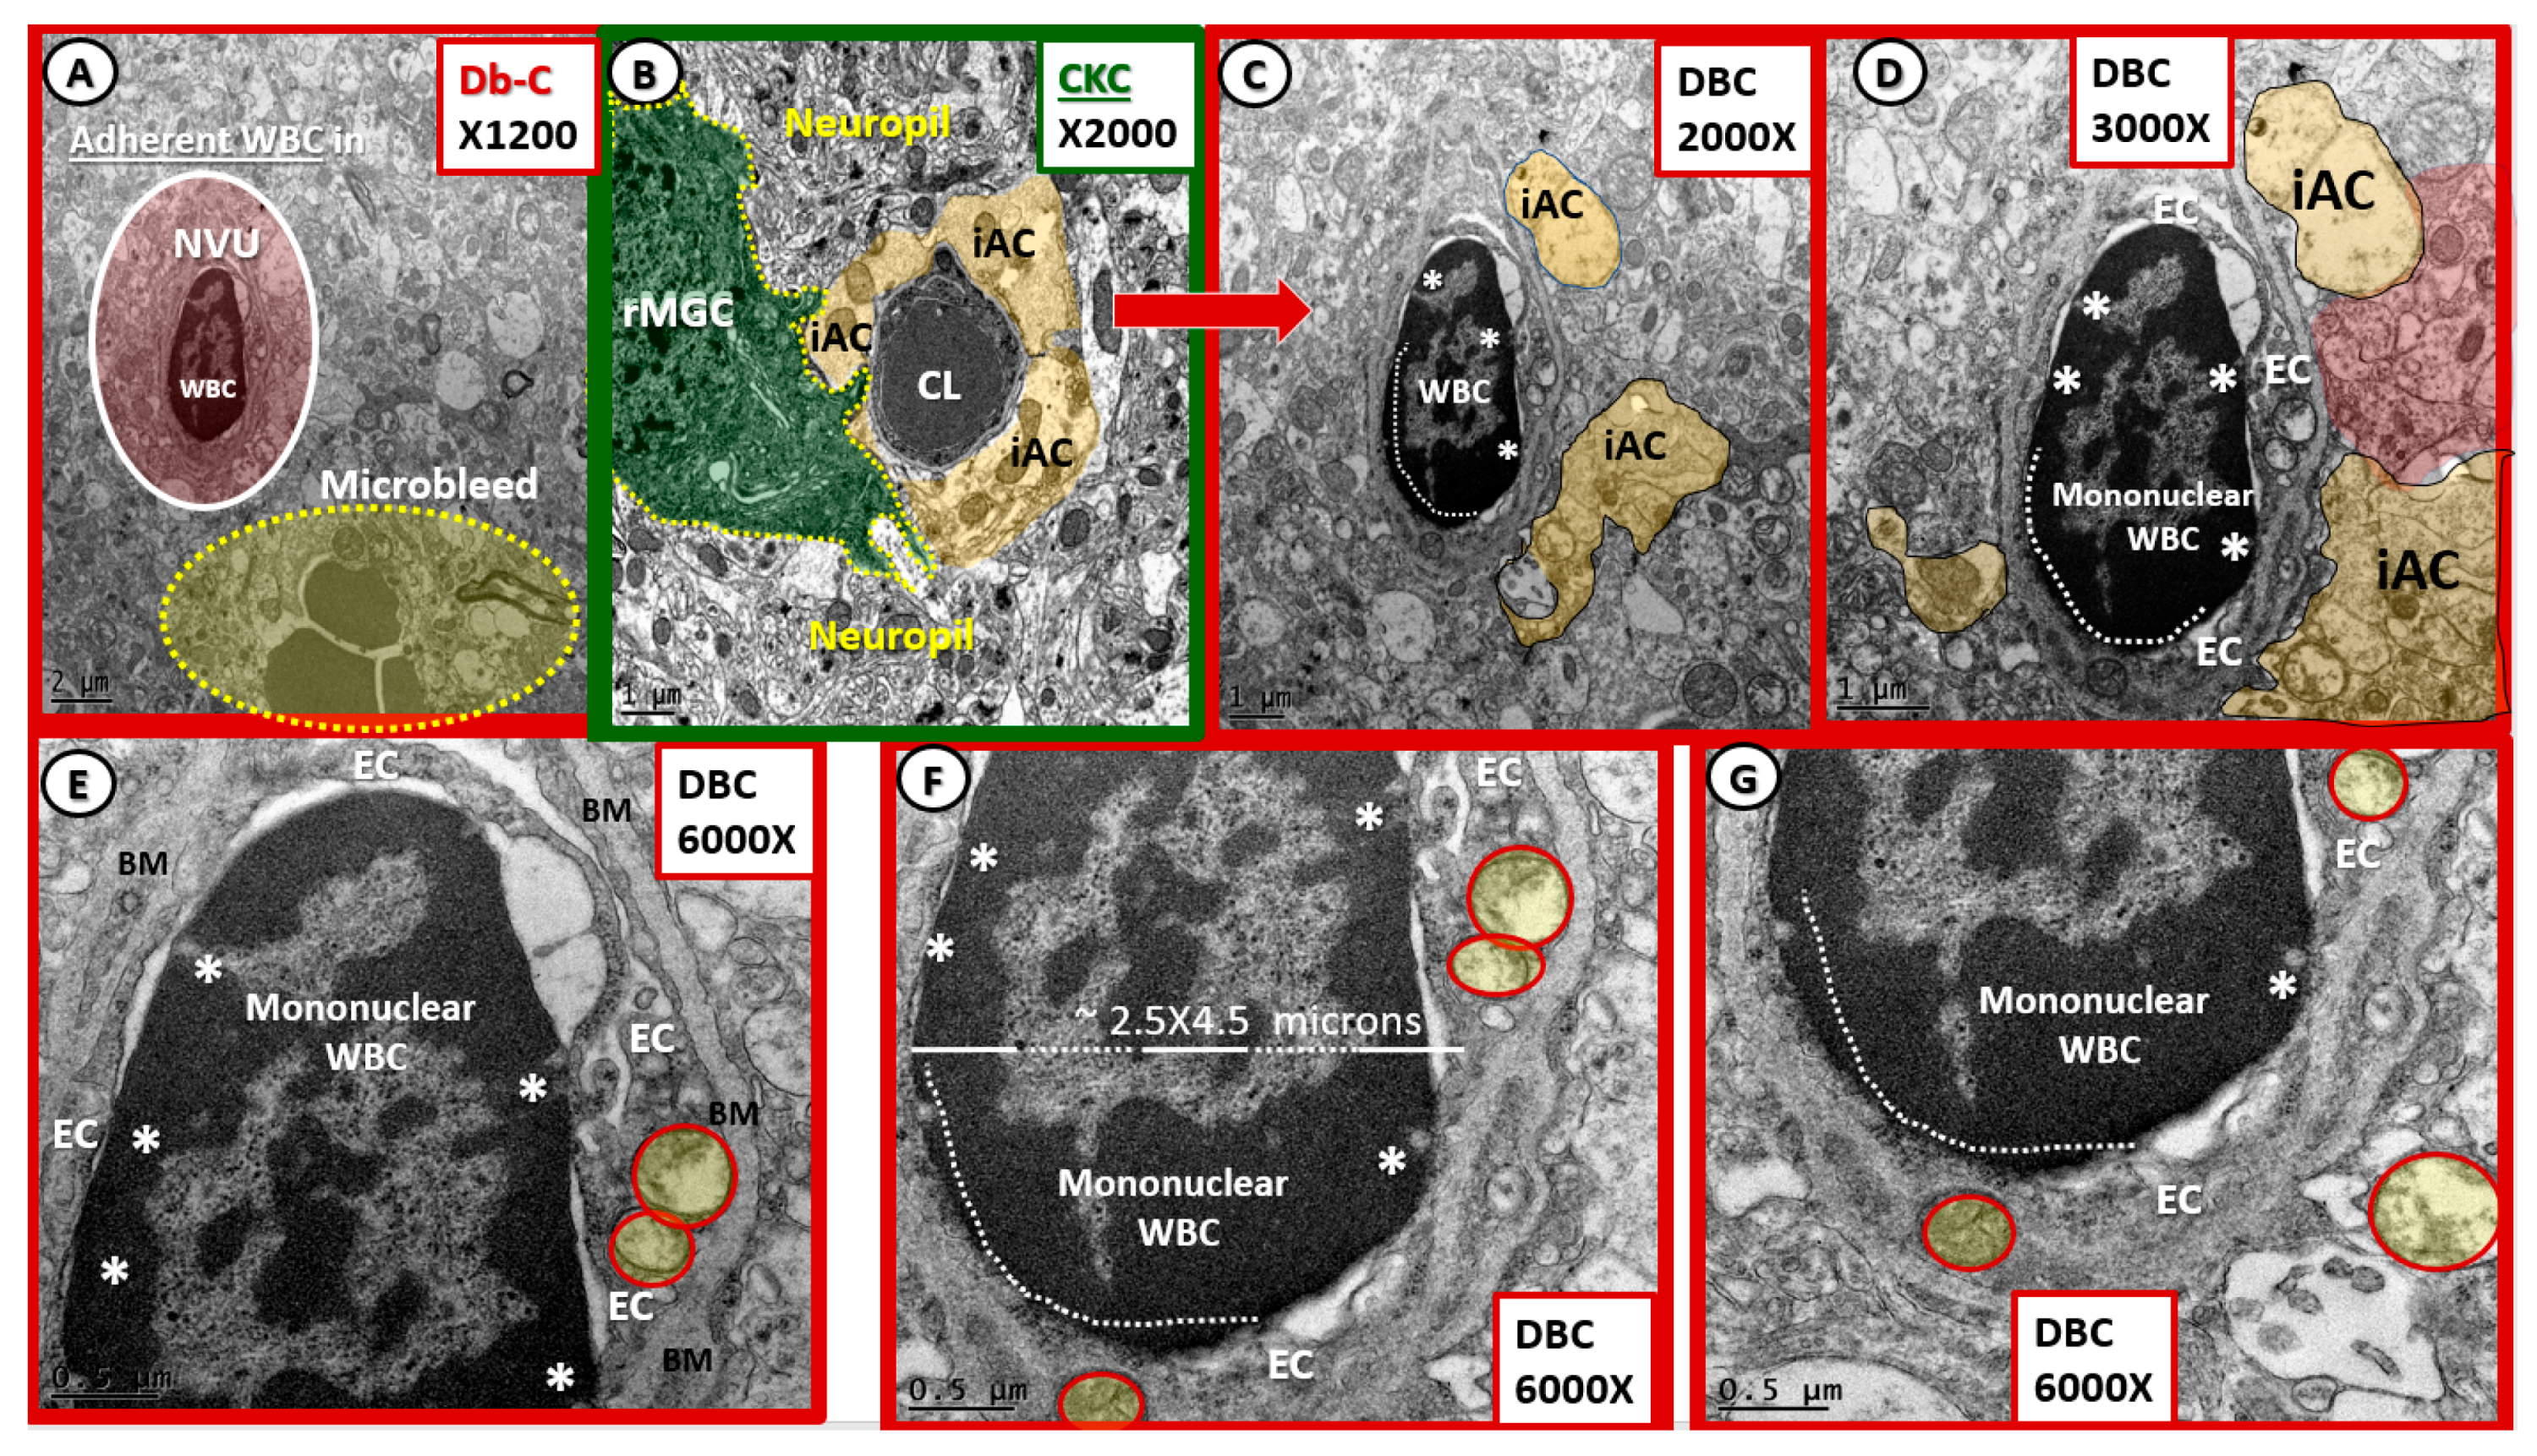
Compilation of white blood cell adherence in diabetic DBC models. Panels (A,C–G) depict multiple increasing magnifications of a white blood cell (WBC) adhering to the luminal activated endothelial cell (EC). Panel B demonstrates a surveilling ramified microglia (rMGC) and note how it is only surveilling the NVU for danger or damage signals. Also note the intact golden halo of astrocyte end feet surrounding the NVU. This is in contrast to the reactive-activated (aMGC), which appears to be invading the NVU. Note that in higher magnified images in panels (E–G) that the ECs also have aberrant mitochondria (depicted as yellow cores with encircling red lines). Also, note in (C,D) that there are some remaining intact astrocytes (iAC) to the right of the NVU (pseudo-colored golden); however to the left, note the absence of iACs adjacent to the outer basement membrane (BM) of the EC and pericyte of the NVU. Panel A depicts not only the adherence of a WBC to the activated EC but also depicts a region of microbleeds (encircled pseudo-colored yellow with yellow dashed line and the abnormal NVU with adherent WBC enclosed in a white line oval with pseudo-colored red interior. Panels (C–G) depict adhesion sites (asterisks) with a dashed line where the adherence appears to be continuous. The adherent mononuclear WBC cell is too small (2.5 × 4.5 μm) to be a monocyte and because of the thinned nearly absent cytoplasm is morphologically considered to represent a lymphocyte. Varying magnifications are present in the identifying boxes and the scale bars are present in the lower left of each image. 2;1;1;1 μm (panels (A–D) respectively) and 0.5 μm (panels (E,G) respectively).
Figure 14.
Compilation of white blood cell adherence in diabetic DBC models. Panels (A,C–G) depict multiple increasing magnifications of a white blood cell (WBC) adhering to the luminal activated endothelial cell (EC). Panel B demonstrates a surveilling ramified microglia (rMGC) and note how it is only surveilling the NVU for danger or damage signals. Also note the intact golden halo of astrocyte end feet surrounding the NVU. This is in contrast to the reactive-activated (aMGC), which appears to be invading the NVU. Note that in higher magnified images in panels (E–G) that the ECs also have aberrant mitochondria (depicted as yellow cores with encircling red lines). Also, note in (C,D) that there are some remaining intact astrocytes (iAC) to the right of the NVU (pseudo-colored golden); however to the left, note the absence of iACs adjacent to the outer basement membrane (BM) of the EC and pericyte of the NVU. Panel A depicts not only the adherence of a WBC to the activated EC but also depicts a region of microbleeds (encircled pseudo-colored yellow with yellow dashed line and the abnormal NVU with adherent WBC enclosed in a white line oval with pseudo-colored red interior. Panels (C–G) depict adhesion sites (asterisks) with a dashed line where the adherence appears to be continuous. The adherent mononuclear WBC cell is too small (2.5 × 4.5 μm) to be a monocyte and because of the thinned nearly absent cytoplasm is morphologically considered to represent a lymphocyte. Varying magnifications are present in the identifying boxes and the scale bars are present in the lower left of each image. 2;1;1;1 μm (panels (A–D) respectively) and 0.5 μm (panels (E,G) respectively).
![Neuroglia 01 00021 g014]()
Figure 15.
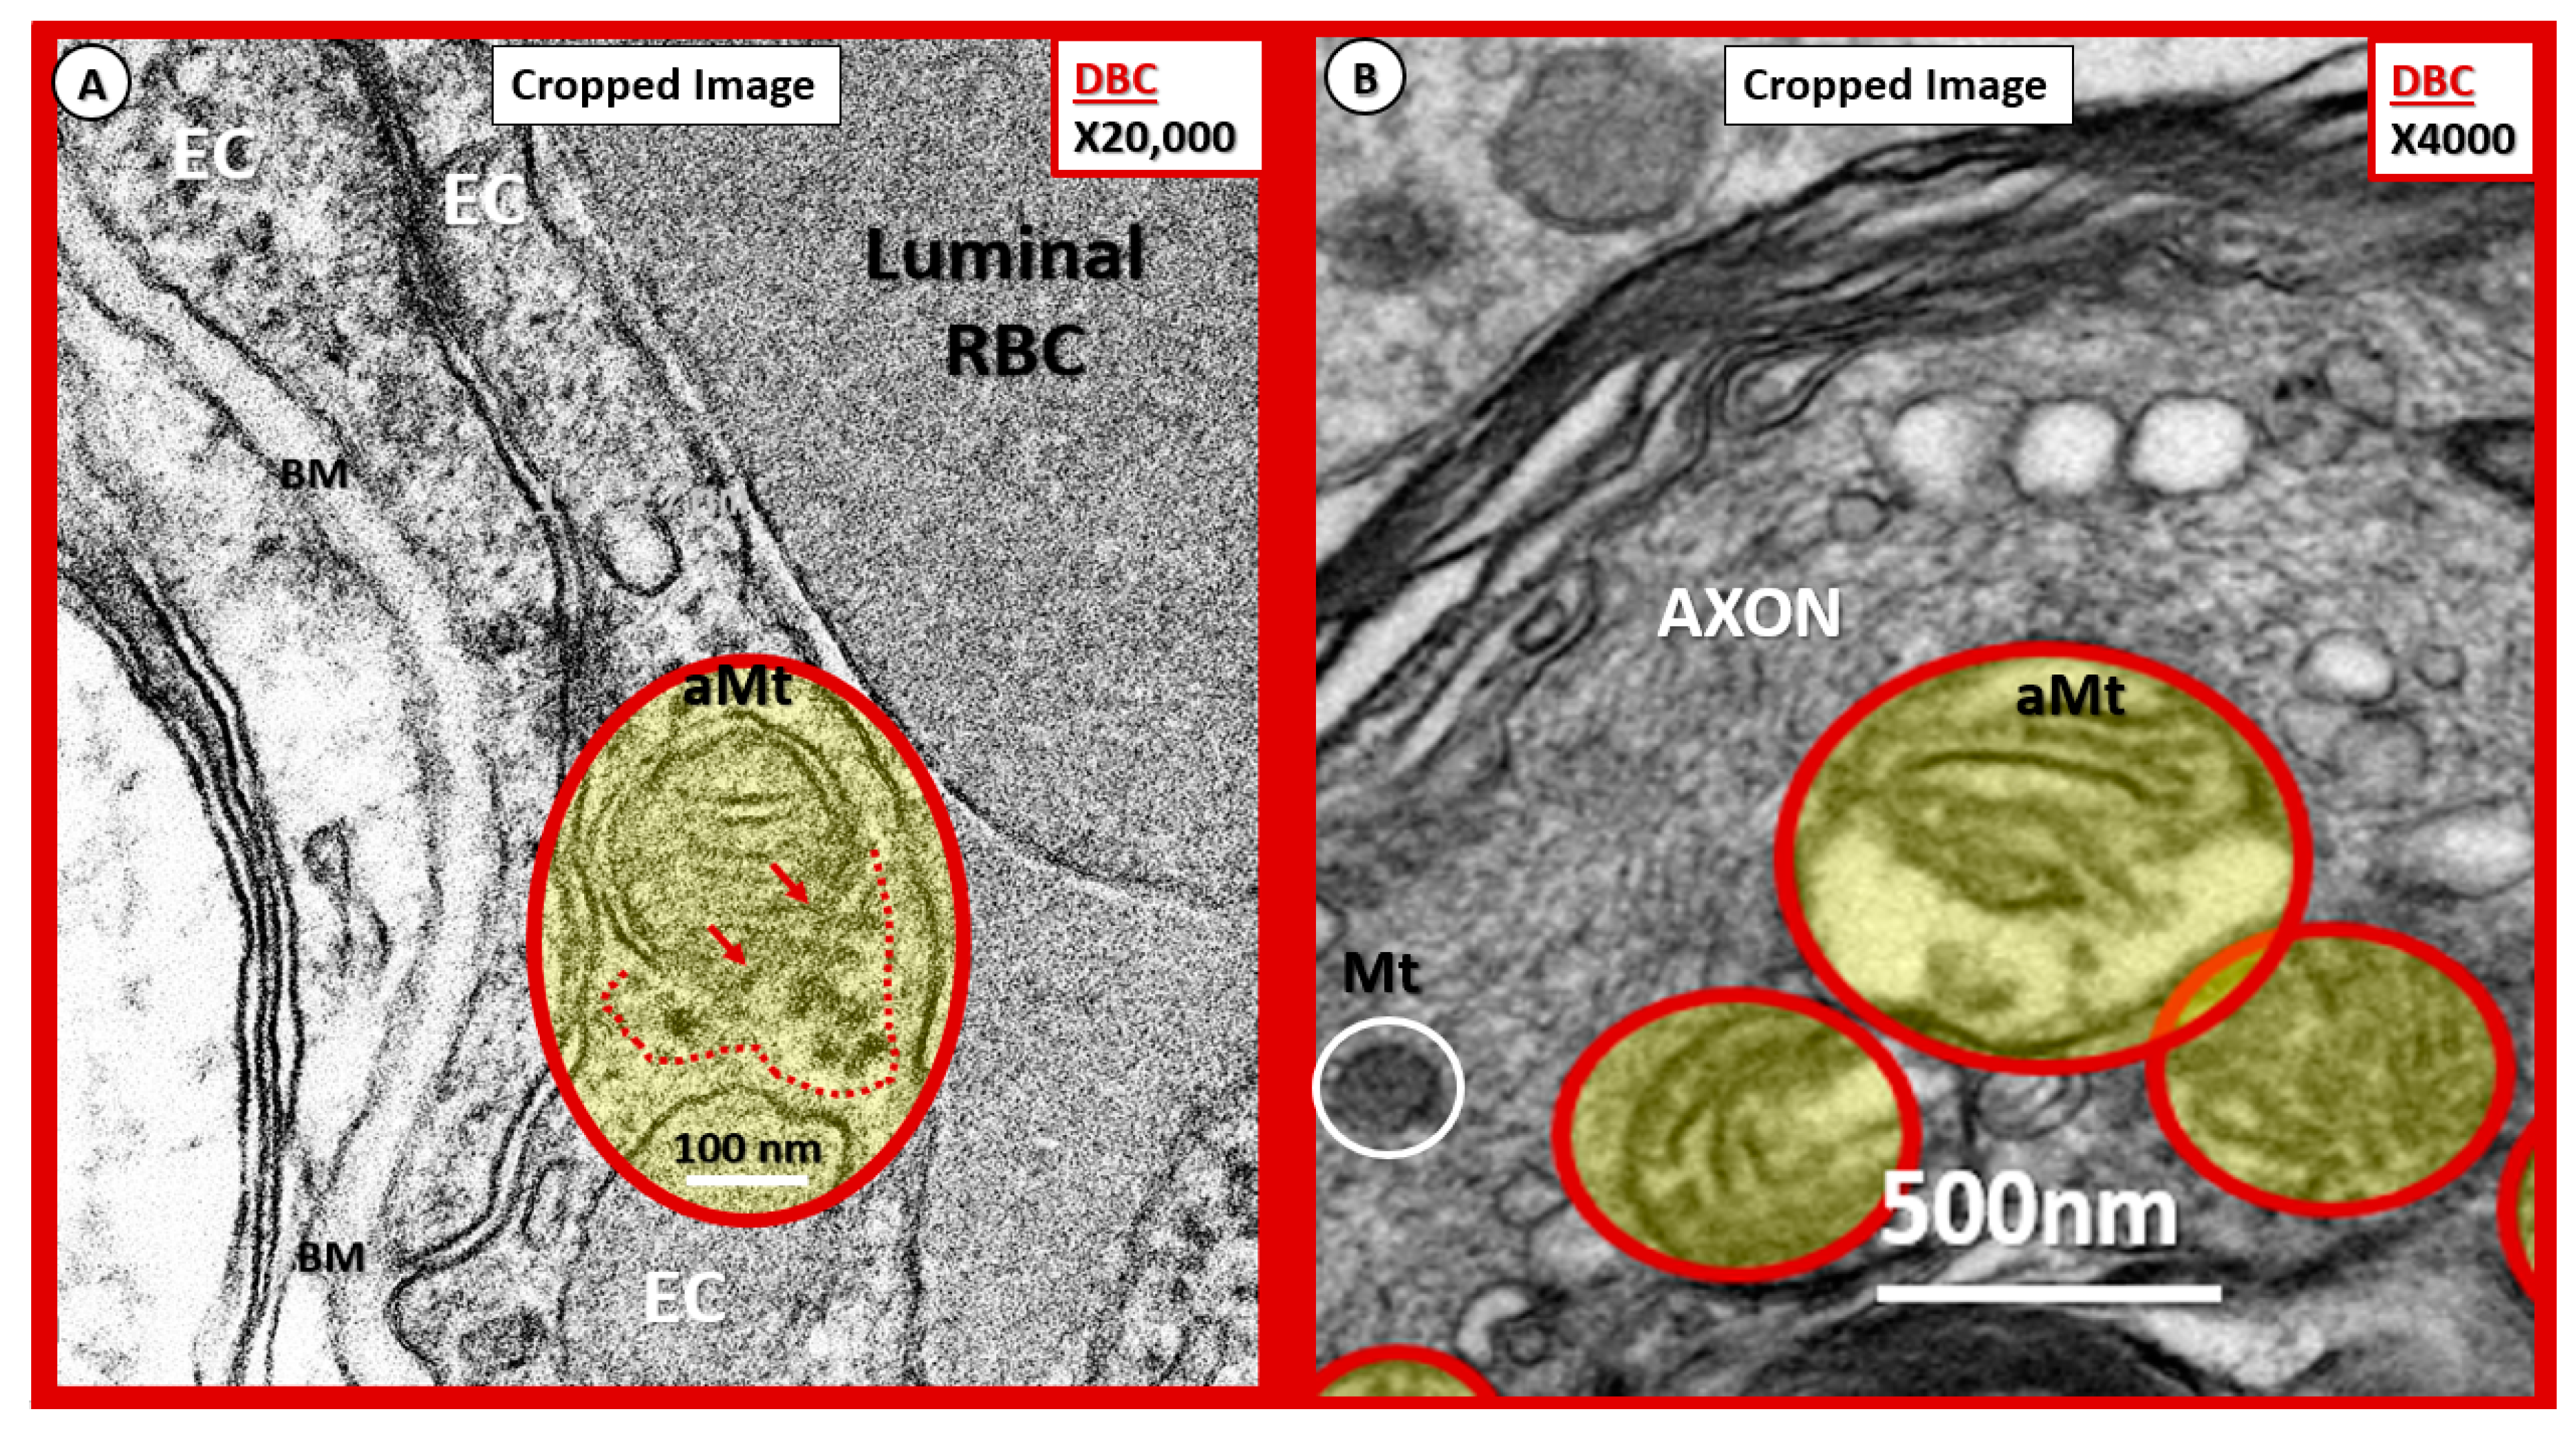
Possible mechanisms for the development of aberrant mitochondria (aMt) in the diabetic DBC models. (A,B) Illustrate possible Mt herniation with loss of Mt matrix proteins and crista with intact scale bars. Panel (A) original magnification ×20,000 with intact scale bar = 100 nm. Panel (B) original magnification ×4000 with intact scale bar = 500 nm. (A) depicts the loss of Mt matrix proteins and crista with protein aggregation into the surrounding EC cytoplasm in the aMt possibly via herniation (pseudo-colored yellow with encircling red line). Note that the outer Mt and inner Mt membranes appear to be disrupted allowing it contents to herniate outward or leak into the surrounding EC cytoplasm (arrows and red dashed lines). Interestingly, note the interruption of tight junction/adherens junction (TJ/AJ electron-dense staining where there are overlapping ECs in (A). Panel (B) also demonstrates three aMt with the superior aMt demonstrating possible herniation in a dysmyelinated neuronal axon (pseudo-colored yellow with encircling red line). Importantly, note the adjacent normal electron-dense Mt (encircled white) with electron-dense matrix and smaller size as compared to the aMt in this myelinated axon. aMt: Aberrant mitochondria; BM: Basement membrane; EC: endothelial cell; Mt: mitochondria; RBC: red blood cell.
Figure 15.
Possible mechanisms for the development of aberrant mitochondria (aMt) in the diabetic DBC models. (A,B) Illustrate possible Mt herniation with loss of Mt matrix proteins and crista with intact scale bars. Panel (A) original magnification ×20,000 with intact scale bar = 100 nm. Panel (B) original magnification ×4000 with intact scale bar = 500 nm. (A) depicts the loss of Mt matrix proteins and crista with protein aggregation into the surrounding EC cytoplasm in the aMt possibly via herniation (pseudo-colored yellow with encircling red line). Note that the outer Mt and inner Mt membranes appear to be disrupted allowing it contents to herniate outward or leak into the surrounding EC cytoplasm (arrows and red dashed lines). Interestingly, note the interruption of tight junction/adherens junction (TJ/AJ electron-dense staining where there are overlapping ECs in (A). Panel (B) also demonstrates three aMt with the superior aMt demonstrating possible herniation in a dysmyelinated neuronal axon (pseudo-colored yellow with encircling red line). Importantly, note the adjacent normal electron-dense Mt (encircled white) with electron-dense matrix and smaller size as compared to the aMt in this myelinated axon. aMt: Aberrant mitochondria; BM: Basement membrane; EC: endothelial cell; Mt: mitochondria; RBC: red blood cell.
![Neuroglia 01 00021 g015]()
Figure 16.
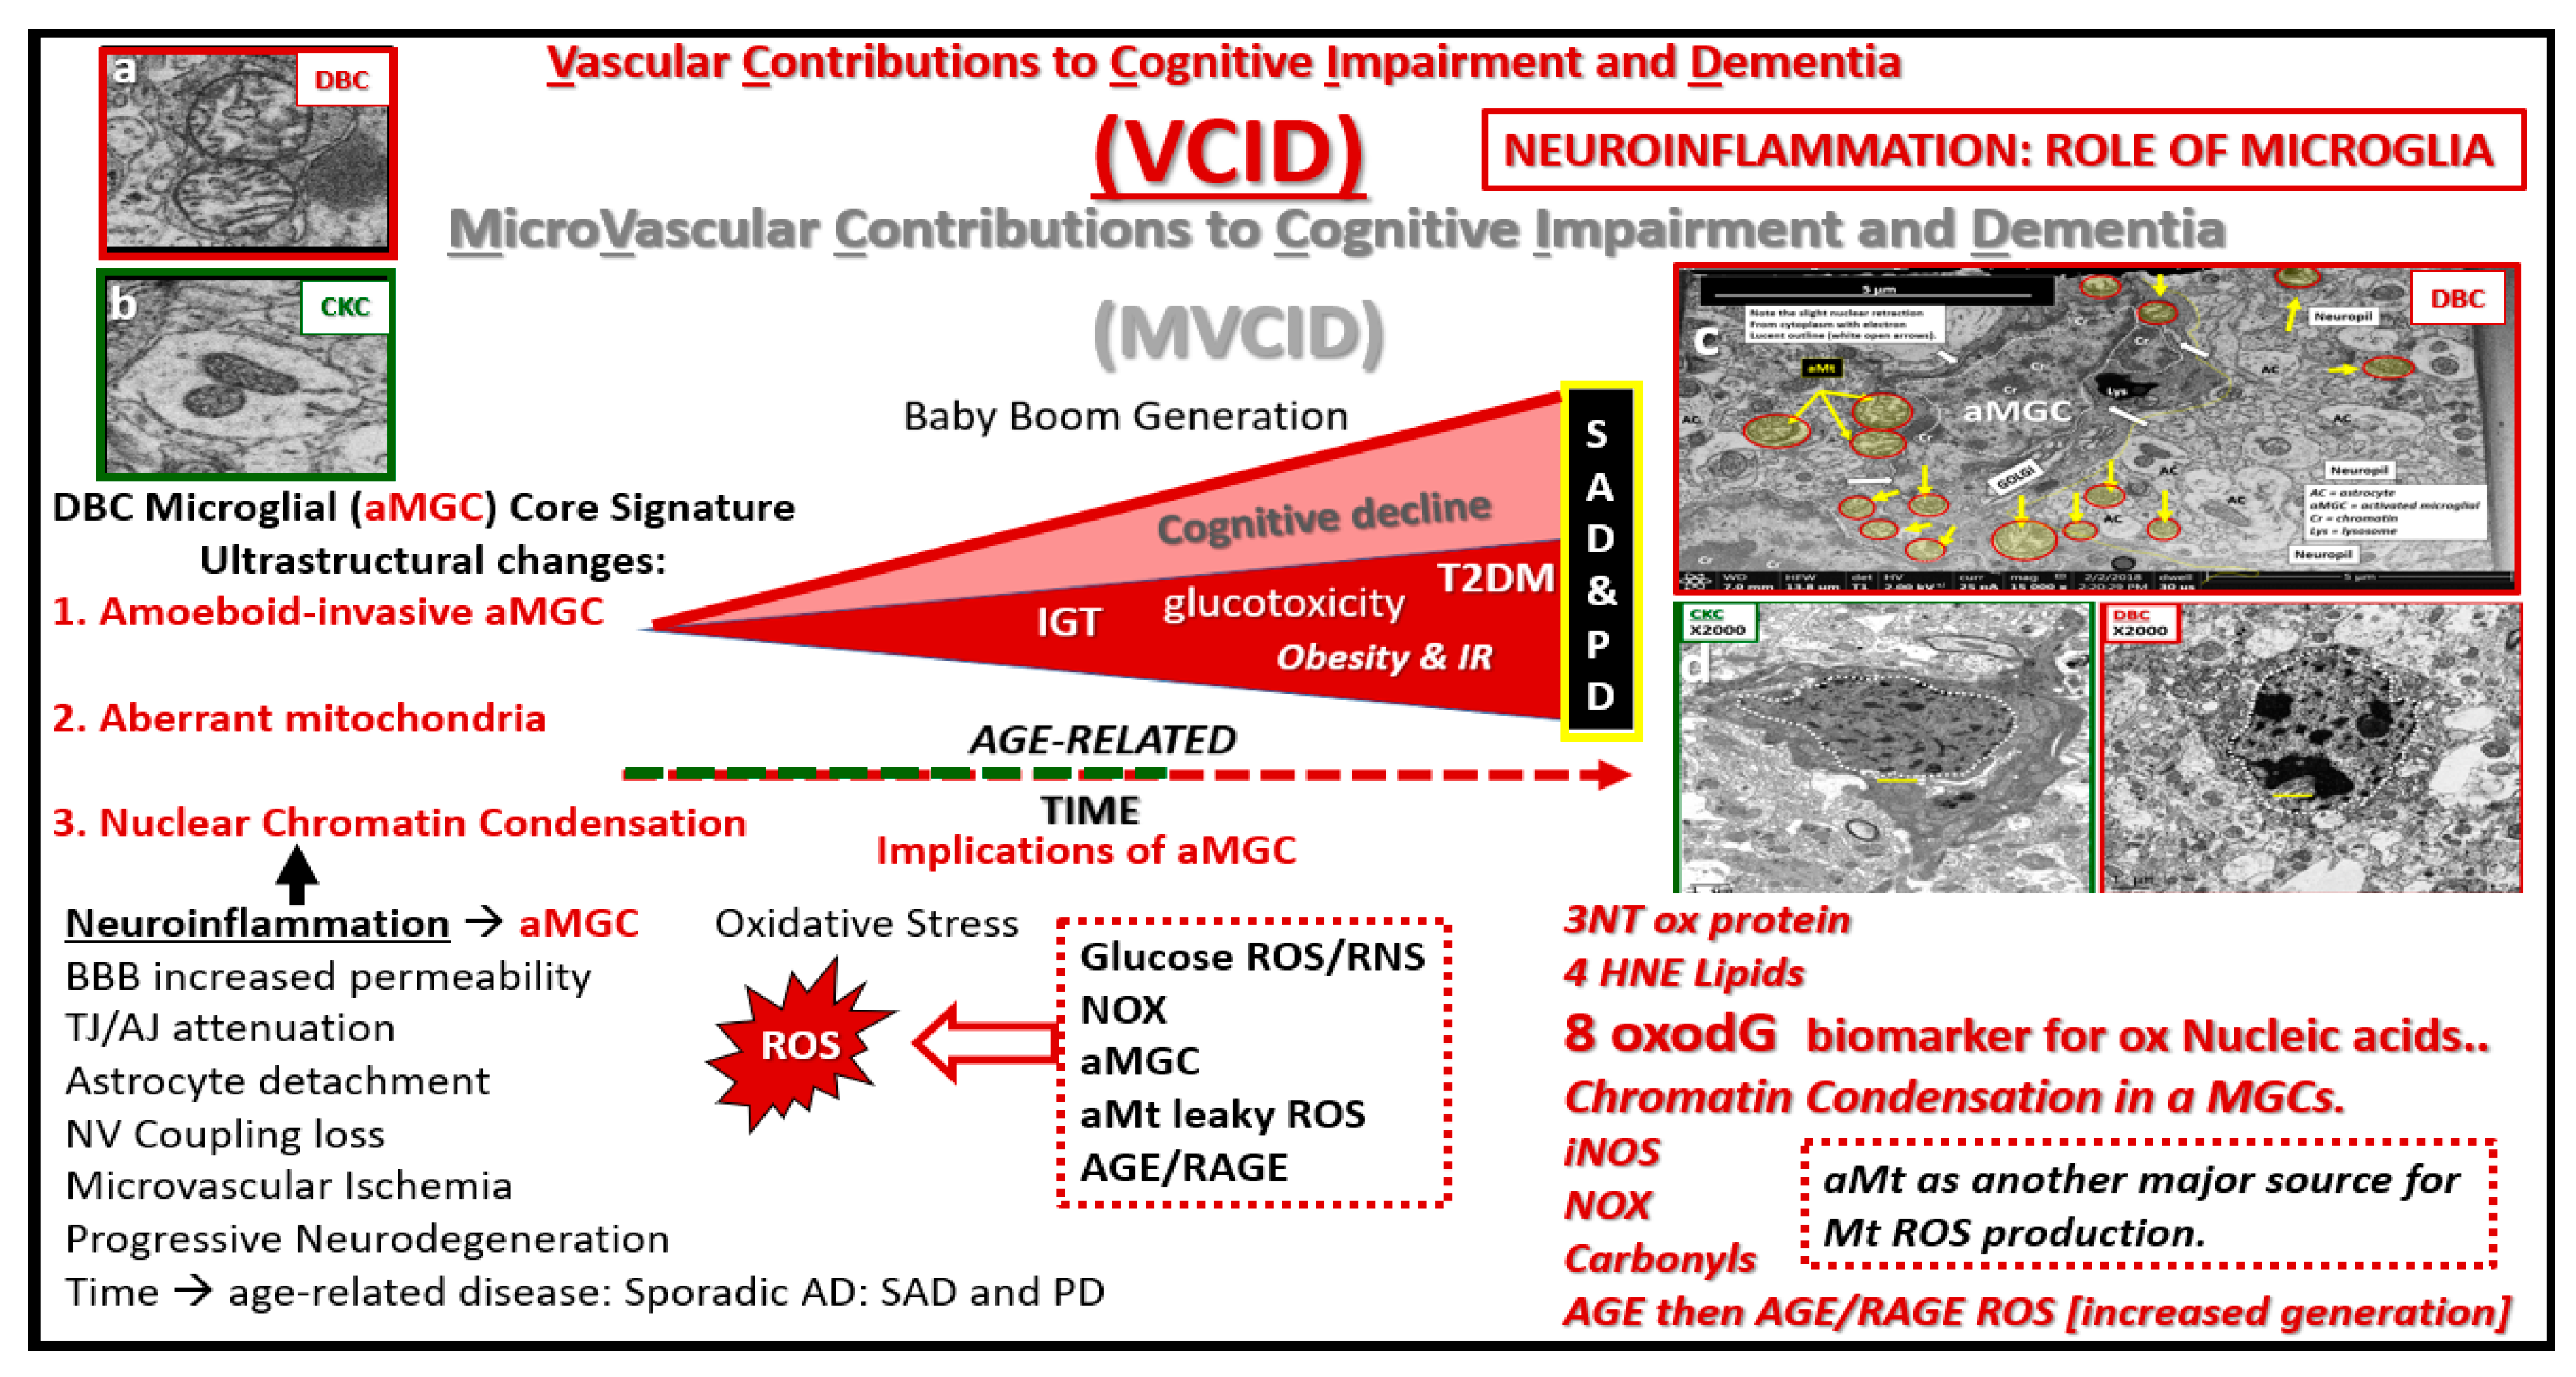
Microvascular contribution to cognitive impairment and dementia. This cartoon image with transmission electron microscopic image inserts (a–d) depict impaired glucose tolerance (IGT), obesity and insulin resistance (IR) in diet-induced obesity (DIO) as the disease process progresses to increased glucotoxicity to overt type 2 diabetes mellitus (T2DM) in humans and our DBC models and may be associated with increasing cognitive impairment and dementia. As previously discussed, this is associated with a plethora of morphological ultrastructural multicellular remodeling changes and abnormalities, which include activated-amoeboid microglia cells (aMGC) (insert c) that may be associated with increased synthesis and secretion of functional toxic cytokines and chemokines in the DBC models. These abnormalities may contribute to neurodegeneration in addition to aMGC nuclear chromatin condensation (insert d) and leaky aberrant Mt (aMt) (insert a). These aMGCs may be associated and contribute to neuroinflammation, which may lead to the development of microvascular contributions to cognitive impairment and dementia (MVCID) and furthermore, may contribute to the development of sporadic Alzheimer’s disease (SAD) and sporadic Parkinson’s disease (PD). AGE = advanced glycation end products; BBB: Blood brain barrier; DIO: Diet-induced obesity; Inos: Inducible nitric oxide synthase; NOX = NADPH Ox (reduced nicotinamide adenine dinucleotide phosphate); NV: Neurovascular; RAGE: Receptor for advanced glycation endproducts; ROS: Reactive oxygen species; TJ/AJ: Tight junctions/adherens junctions; 3NT: 3 nitrotyrosine; 4HNE: 4 hydroxynonenal; 8oxodG: 8-Oxo-2′-deoxyguanosine, which are biomarkers of oxidative stress for proteins, lipids, nucleic acids respectively.
Figure 16.
Microvascular contribution to cognitive impairment and dementia. This cartoon image with transmission electron microscopic image inserts (a–d) depict impaired glucose tolerance (IGT), obesity and insulin resistance (IR) in diet-induced obesity (DIO) as the disease process progresses to increased glucotoxicity to overt type 2 diabetes mellitus (T2DM) in humans and our DBC models and may be associated with increasing cognitive impairment and dementia. As previously discussed, this is associated with a plethora of morphological ultrastructural multicellular remodeling changes and abnormalities, which include activated-amoeboid microglia cells (aMGC) (insert c) that may be associated with increased synthesis and secretion of functional toxic cytokines and chemokines in the DBC models. These abnormalities may contribute to neurodegeneration in addition to aMGC nuclear chromatin condensation (insert d) and leaky aberrant Mt (aMt) (insert a). These aMGCs may be associated and contribute to neuroinflammation, which may lead to the development of microvascular contributions to cognitive impairment and dementia (MVCID) and furthermore, may contribute to the development of sporadic Alzheimer’s disease (SAD) and sporadic Parkinson’s disease (PD). AGE = advanced glycation end products; BBB: Blood brain barrier; DIO: Diet-induced obesity; Inos: Inducible nitric oxide synthase; NOX = NADPH Ox (reduced nicotinamide adenine dinucleotide phosphate); NV: Neurovascular; RAGE: Receptor for advanced glycation endproducts; ROS: Reactive oxygen species; TJ/AJ: Tight junctions/adherens junctions; 3NT: 3 nitrotyrosine; 4HNE: 4 hydroxynonenal; 8oxodG: 8-Oxo-2′-deoxyguanosine, which are biomarkers of oxidative stress for proteins, lipids, nucleic acids respectively.
![Neuroglia 01 00021 g016]()


