Article

Reversal of Forest Soil Acidification in the Northeastern United States and Eastern Canada: Site and Soil Factors Contributing to Recovery

1
Natural Resources Canada–Canadian Forest Service 1219 Queen St. E., Sault Ste. Marie, ON P6A 2E5, Canada
2
U.S. Geological Survey New York Water Science Center, 425 Jordan Road, Troy, NY 12180, USA
3
School of Forest Resources, University of Maine, Deering Hall, Orono, ME 04469-5722, USA
4
Direction de la Recherche Forestière, Ministère des Forêt, de la Faune et des Parcs du Québec, Complexe Scientifique, 2700 Einstein Street, Quebec City, QC G1P 3W8, Canada
5
Hubbard Brook Experimental Forest, USDA Forest Service, Northern Research Station, 234 Mirror Lake Road, North Woodstock, NH 03262, USA
*
Author to whom correspondence should be addressed.
Submission received: 25 June 2020 / Revised: 7 August 2020 / Accepted: 18 August 2020 / Published: 27 August 2020

Abstract

:
As acidic deposition has decreased across Eastern North America, forest soils at some sites are beginning to show reversal of soil acidification. However, the degree of recovery appears to vary and is not fully explained by deposition declines alone. To assess if other site and soil factors can help to explain degree of recovery from acid deposition, soil resampling chemistry data (8- to 24-year time interval) from 23 sites in the United States and Canada, located across 25° longitude from Eastern Maine to Western Ontario, were explored. Site and soil factors included recovery years, sulfate (SO42−) deposition history, SO42− reduction rate, C horizon pH and exchangeable calcium (Ca), O and B horizon pH, base saturation, and exchangeable Ca and aluminum (Al) at the time of the initial sampling. We found that O and B horizons that were initially acidified to a greater degree showed greater recovery and B horizon recovery was further associated with an increase in recovery years and lower initial SO42− deposition. Forest soils that seemingly have low buffering capacity and a reduced potential for recovery have the resilience to recover from the effects of previous high levels of acidic deposition. This suggests, that predictions of where forest soils acidification reversal will occur across the landscape should be refined to acknowledge the importance of upper soil profile horizon chemistry rather than the more traditional approach using only parent material characteristics.

1. Introduction

One of the initial environmental concerns expressed about acidic deposition was the potential cumulative effect of long-term pollutant loading on soil acidity and nutrient levels and the consequences of these soil changes on forest health and productivity [1,2,3]. As noted by Johnson et al. [4], the term soil acidification has often been used when describing decreases in soil pH and base saturation, increases in base cation leaching, decreases in exchangeable base cations and/or increases in exchangeable aluminum (exAl) by mobilization from the soil. While related in some respects, these soil properties can respond differently to increasing or decreasing acid inputs depending on inherent site and soil conditions. For example, increased base cation leaching does not necessarily lead to decreases in pH and base saturation if biological cycling, atmospheric deposition or mineral weathering can counter leaching losses by providing inputs to affected soil horizons. Conversely, while increased deposition of hydrogen ion (H+) and sulfate (SO42−) can reduce pH and base saturation, site differences in inorganic SO42− adsorption and desorption [5] can limit base cation leaching losses.
Berden et al. [6] synthesized results from some of the earliest soil resampling studies from Northern, Central and Western Europe that were conducted to determine the impacts of acidic deposition on forests. Several studies reported 0.2 to 1.5 unit decreases in forest soil pH from the mid 1900′s up until the early 1980′s. Researchers in Germany also found significant declines in soil exchangeable calcium (exCa) and magnesium (exMg), and increases in exAl over similar time periods [7,8]. In North America, Linzon and Temple [9] documented pH declines for A and B horizons of one soil series in central Ontario between 1960 and 1978. A retrospective study using plots established in the Adirondack Mountains of New York showed declines in exCa concentrations in surface soil horizons from the early 1930′s to 1984 and between 1984 and the mid 2000′s [10,11,12]. Other studies across Eastern Canada and the United States confirmed decreases in soil pH, base saturation, and concentrations of exCa and exMg and increases in exAl concentrations due to acidic deposition from the 1960′s to the 1990′s [13], the 1970′s to the early 2000′s [14,15,16], the 1980′s to the early 2000′s [17,18,19] and the 1990′s to the early 2010′s [20].
Acidic deposition across Europe and Eastern North America has declined since the early 1980′s in line with declines in sulphur (S) and nitrogen (N) emissions brought about by pollution control policies [21,22,23,24]. After decades of acidification, forest soils have begun to show signs of recovery. In the first soil resampling study to document recovery in North America, Lawrence et al. [25] reported increased pH and decreased exAl concentrations between 1992/93 and 2003/04 for Oa horizons at several red spruce stands in the Northeastern United States. Other studies that executed soil resampling across multiple sites in North America and Europe have generally reported greater recovery in the forest floor and upper mineral soil compared to deeper horizons, and at sites where soils were resampled in the 2000′s to the early 2010′s [26,27,28,29]. These studies seem to indicate that after a lag period, declining acidic deposition is now leading to decreased soil acidity, and in many cases, decreases in precipitation S and N have been linked directly to the degree of recovery.
It is generally acknowledged that the most important factors that control a soils’ ability to buffer acidic inputs, and its recovery from acidification at any particular site, are the chemical characteristics of the bedrock and surficial geological deposits [30,31]. In relation to base cation leaching loss, soils low in secondary iron and aluminum oxide minerals with high pH have lower SO42− adsorption capacities, and soils with high N content that exceeds biological need for N, are susceptible to base cation loss [32]. Other site factors that can influence soil acidification processes include the position of the pedon along the catena (topography), soil porosity (texture and structure), hydrologic characteristics of the terrain (profile depth and surface characteristics), and the amount of nutrient biocycling related to forest type and developmental stage [26,31]. To generalize, sites with shallow, coarse textured glacial deposits and parent materials with low buffering capacity are more at risk of acidification than sites with deeper, fine textured deposits and calcareous parent materials with high buffering capacity [30,31,32].
In Lawrence et al. [26], we resampled O and B horizons at 27 forested sites across Eastern Canada and the Northeastern United States over intervals of 8 to 24 years with the second sampling in the mid to late 2000′s. Soils at most sites exhibited some evidence of recovery from acidic deposition with decreases in exAl in O horizons, and increased pH in O and B horizons. Exchangeable Ca concentrations showed the fewest number of differences from initial to final sampling for both horizons, but base saturation decreased significantly in B horizons at one-third of the sites. While we also found that increasing percent reduction in SO42− deposition over the time period between samplings led to increased levels of recovery in the O horizon (i.e., increasing ratios of initial to final base saturation and exCa, and decreasing exAl ratios), the relationships were driven by relatively few sites. Three resampling studies were conducted in experimental watersheds at Bear Brook, Maine, where SO42− input decreases ranged from only 5.7–9.8% due to annual experimental aerial additions of (NH4)2SO4 fertilizer. The objective of these studies was to maintain N and S inputs at levels comparable to heavily impacted areas in the Eastern United States from the early 1980′s, levels prior to ambient deposition decreases over the re-sampling period. The largest decrease in SO42− deposition (76%) occurred at the Wawa (Ontario, Canada) site. This site was immediately downwind of an iron ore sintering plant that began provincially ordered controls on sulfur dioxide (SO2) emissions in the mid-1980s and was completely closed in 1998. It is possible that the actual deposition decrease at this site was greater than that estimated from the regional air and precipitation monitoring network.
In this study, we extend the work of Lawrence et al. [26] by examining the soil resampling data from 19 of the original 27 sites, and four new sites in the Adirondack region of New York. The main objectives of this study were to: (a) compare soil recovery indices to site and soil properties that we would expect to be critical to soil recovery; and (b) determine which measurements are most useful to predict recovery and if there were thresholds in site and soil properties that determined whether sites recovered or not. We used recovery years, initial SO42− deposition, SO42− reduction rate and soil chemical properties collected at each site as variables to explain why there were different degrees of recovery across this region.

2. Materials and Methods

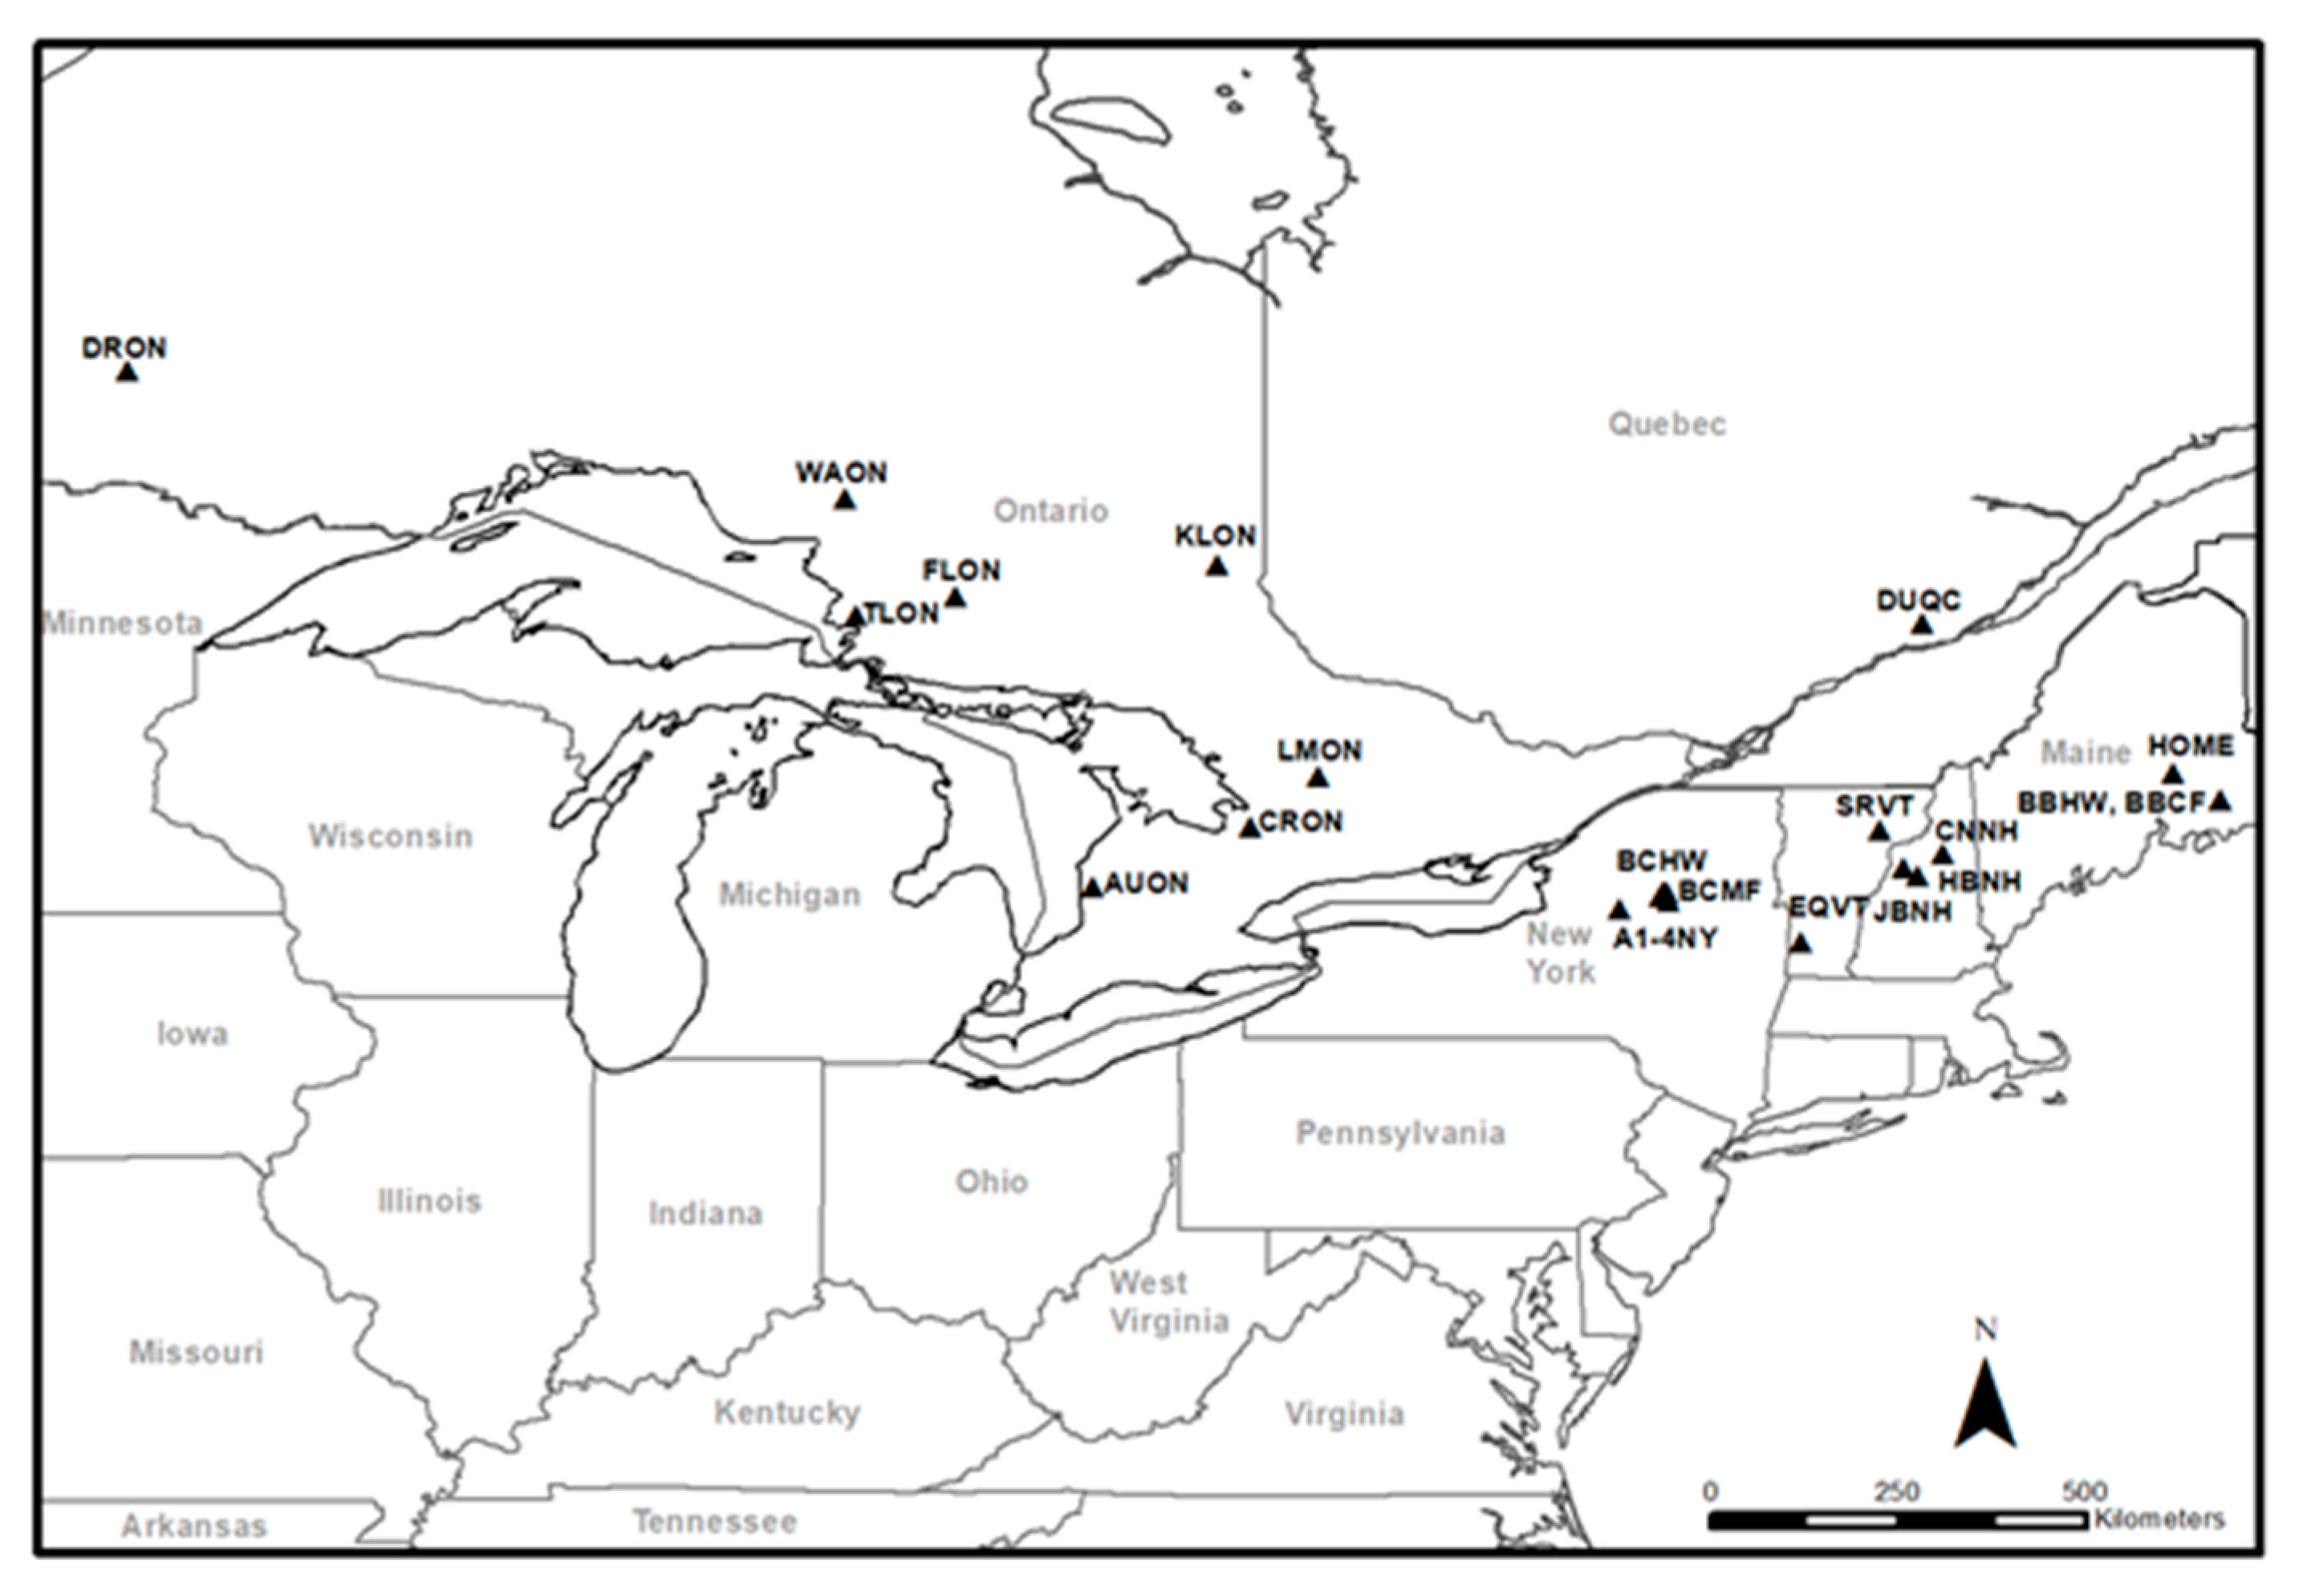
2.1. Study Sites, Experimental Design and Field Sampling

The 23 study sites are located in Maine, Vermont, New Hampshire and New York [33] in the United States and Quebec and Ontario in Canada, spanning 68° W to 93°W longitude (Figure 1). For this study, we did not include the three Bear Brook, Maine sites that were part of Lawrence et al. [26] because the SO42− inputs at these sites were experimentally maintained at elevated levels by fertilizer additions. As shown previously, while recovery was linked to declines in SO42− deposition, not all sites with similar deposition declines recovered to the same degree. As our goal was to evaluate additional variables that could further explain and predict site specific response to decreases in acidic deposition, we included chemical properties of the C horizon (parent material) at each site. An additional five of the 27 sites in Lawrence et al. [26] did not have these data so they were also not included in this study. The forests at the sites represent a range of mature, upland stands situated in glacial terrain; 14 northern hardwood, six softwood and three mixed northern hardwood/softwood stands (Table 1). Most of the study sites have well-developed Spodosol (Podzol) soil profiles (19 sites), with Alfisol (Luvisolic) (2 sites) and Inceptisol (Brunisol) (2 sites) also represented. Soils textures (B horizon) are loamy sands to silty clays, with surface horizons including mull, moder and mor forest floors (Figure 2). The study sites had annual precipitation ranging from 706 to 1703 mm year−1 and annual mean temperatures from 1.8 to 7.8 °C (Table 1). Sites in the eastern part of the region generally receive higher annual precipitation than those to the west.
The initial soil sampling and the subsequent final resampling at each site were led by the same five investigators and can be grouped into seven distinct projects, each with a similar experimental design.
The consistency of investigators ensured that the initial sampling sites could be exactly re-located and the initial sampling protocol could be repeated, both elements of critical importance to measure changes in soil chemical properties over time [34]. The number of pits sampled at each site ranged from 4 to 28 (Table 1) and the soil resampling had lengths of time from 8 to 24 years between initial and final sampling (Figure 3). With the varied intervals between sampling, the initial sampling years and final sampling years ranged from 1985 to 2004, and 2003 to 2017, respectively (Figure 3). Index soil horizons, O (LFH) (either Oe [F], Oa [H], or combined Oe [F]/Oa [H]), and upper B horizons were sampled in each soil pit at initial and final sampling. The C horizon at each site was sampled at the initial sampling date by excavating one additional soil pit to 1 m depth or to bedrock, if 1 m depth could not be reached.
Wet-only precipitation SO42− deposition was determined for each soil resampling site using data from either regional air and precipitation monitoring networks in Canada [36] and the United States [37], or site- specific measurements in the case of BBCF, BBHW and DUQC. For soil resampling sites in the United States, deposition at the closest National Atmospheric Deposition Program (NADP) station was used (http://nadp.slh.wisc.edu/ntn/; accessed 1 June 2020). In Ontario, where soil resampling sites were more distant from air and precipitation monitoring stations, SO42− deposition was calculated by distance weighting deposition from several proximate Canadian Air and Precipitation Monitoring Network (CAPMoN) stations (https://www.canada.ca/en/environment-climate-change/services/air-pollution/monitoring-networks-data/canadian-air-precipitation.html; accessed 1 June 2020. Initial SO42− deposition (kg·ha−1) at each site was calculated as the mean of the 4 years prior to the initial soil sampling and SO42− reduction rate (kg·ha−1 yr−1) was determined as the slope of the decrease in deposition from four years prior to the initial sampling to the year of final sampling for all sites except one (DUQC) that only had deposition data starting from the year of initial sampling. Initial SO42− deposition covered a broad range from 6.4 to 29.3 kg·ha−1 with nine sites having deposition greater than 23 kg·ha−1, eight of these being the sites where soils were sampled initially in the 1980′s (Figure 3). Adirondack site 29012 (A4NY) had high deposition when initially sampled in 2004 (25.8 kg·ha−1), but this site had extremely high SO42− deposition from 1981 to 1984 (mean value 36.6 kg·ha−1). The five sites with initial deposition less than 15 kg·ha−1 included Adirondack 27020 (A1NY), 28014 (A2NY) and 28030 (A3NY), sampled in 2004 and the DRON and HOME sites. While the A4NY site maintained high SO42− deposition into the early 2000′s, it had a rapid decline to its final sampling in 2017 resulting in a SO42− reduction rate of 1.26 kg·ha−1·year−1, compared to a relatively narrow range of 0.32 to 0.74 kg·ha−1·year−1 for 21 of the 23 sites (Figure 3). The most westerly site DRON had the lowest initial SO42− deposition and SO42− reduction rate, 6.4 kg·ha−1 and 0.08 kg·ha−1·year−1, respectively.

2.2. Laboratory Analysis

In the same way as the field sampling protocols, both the initial and final chemical analyses for each site were conducted with the oversight of the same investigator. This approach ensured that the analyses of both samplings were done in the same laboratory facility and that each laboratory method was meticulously repeated. Samples were analyzed for pH in 0.01 mol·L−1 CaCl2 by glass electrode. Exchangeable Ca, Mg, K, Na were determined in unbuffered 1 mol·L−1 NH4Cl solution and exAl in either 1 mol·L−1 NH4Cl or 1 mol·L−1 KCl. Solution concentrations were determined by inductively coupled plasma (ICP) emission spectrometry. Base saturation was calculated as the sum of base cations divided by the cation exchange capacity determined as either the exchangeable acidity plus the sum of exchangeable bases or NH4 replacement methods. Within each of the seven projects researchers also had archived samples from the initial sampling that were reanalyzed at the same time as the final samples. For some sites, all of the initial samples were available to reanalyze and the recent analyses were utilized in this study rather than the initial analyses. For other sites, only a subset of the initial samples was reanalyzed and the comparability of the analyses were confirmed, or, when differences were detected, regression relationships were used to adjust the initial analyses for those samples where analyses were not repeated. As a further check on analyses comparability, forest soil reference samples (Oa [F] and B horizons) were distributed to four of the five laboratories in this study and an additional 11 laboratories across the Eastern United States and Canada [38]. Replicate analyses of the reference samples were conducted in each laboratory as part of their regular sample runs. The results were not different among laboratories, with variability among the laboratories being as low as variability in replicate analyses within laboratories for exCa, exMg, exK, exNa, exAl and pH [38]. All data from the Adirondack sites are available in U.S. Geological Survey data release [33].

2.3. Calculations and Statistical Analysis

To explore site and soil variables potentially driving differences in the degree of soil recovery across sites, all analyses were run separately on O and B soil horizon data in the statistical computing software R v4.0.0 [39]. Mean initial and final soil chemistry values were first calculated for each site. For variables used as recovery indices (i.e., exCa, exAl, pH and base saturation), response ratios (RRs, the ratio of the soil chemistry value at final sampling to that of the soil chemistry value at initial sampling) were calculated to quantify the magnitude of the soil change effect for each site. Response ratios were used by Lawrence et al. [26] to investigate the link between changes in SO42− deposition and soil chemical changes. The critical elements to ensure the reliability of the ratio are the repeatability of field sampling of soil horizons and chemical analyses at the two sampling times. Recovery indices were then calculated as the natural logarithm of the response to linearize the ratios and provide a more normal sampling distribution [40] as follows:
Recovery   index = lnRR = ln ( Mean . final Mean . initial )
To assess associations between all recovery and site and soil properties simultaneously across sites, redundancy analysis (RDA) was run using the vegan package 2.5–6 [41] to constrain recovery indices by hypothesized explanatory variables (i.e., initial exCa, exAl, base saturation and pH, C-horizon initial exCa and pH, years between initial and final sampling [recovery years], initial SO42− deposition, and SO42− deposition reduction rate) in ordinal space. RDA was chosen over other multivariate ordination techniques because it is a hybrid of principal components analysis and multiple regression that is based on linear relationships and therefore compliments hierarchical partitioning (HP) well [42]. HP was then run to assess which individual explanatory variables best explained differences in recovery. HP was run for each recovery index using the hier.part package [43]. HP moves away from single model inferences by calculating independent and joint contributions of each explanatory variable based on the average of all possible model combinations [44]. The significance of the explanatory variables independent contributions was calculated based on a negative log-likelihood randomization test (n = 1000). Finally, correlations between key explanatory variables identified by HP and recovery indices were plotted and assessed to identify the strength of the associations along with any potential thresholds related to soil recovery. Prior to analyses, data transformations were applied to O, B and C horizon initial exCa, O and B horizon initial exAl, and recovery years to meet normality assumptions and reduce the influence of outliers. In addition, multicollinearity was assessed using the VIF function in the car package [45]. Initial base saturation and exCa in the B horizon were the only explanatory variables found to have potential problems with collinearity (VIF > 10). However, multicollinearity is not a problem because HP separates out independent and joint contributions of each explanatory variable [46], and when we ran RDA with and without B horizon initial base saturation, the results were the same. Therefore, B horizon initial base saturation was kept in the RDA to maintain consistency with HP.

3. Results

The 23 sites displayed a broad range in soil chemical properties with C horizon pH ranging from 4.12 to 7.83, base saturation from 4.1 to 100%, exCa from 0.02 to 12.9 cmolc·kg−1 and exAl from less than 0.1 to 4.4 cmolc·kg−1 (Figure 4). Chemical properties of B horizons at the initial sampling had similar wide ranges, generally mirrored the C horizon site order from lowest to highest for each chemical property and were significantly correlated to C horizon properties for pH (r = 0.893), base saturation (r = 0.758), exCa (r = 0.810) and exAl (r = 0.659). Four sites (BBCF, DUQC, BCMF, BBHW) had initial B horizon pH values less than 3.5 and two sites (AUON, EQVT) had initial pH values greater than 5.0 (Figure 4). Initial O horizon chemical properties were significantly correlated to C horizon properties for pH (r = 0.793), base saturation (r = 0.652) and exCa (0.597) but to a lesser degree than the B horizon. Initial O horizon exAl was not significantly correlated to C horizon exAl (r = 0.312). AUON, CRON and EQVT sites consistently had the highest initial pH, base saturation and exCa, and the lowest exAl for C, B and O horizons across all the sites (Figure 4). The B horizon at TLON had relatively high exCa (3.8 cmolc·kg−1) and base saturation (47.3%), and HBNH, DUQC and JBNH sites had higher exAl, (5.6, 6.3 and 10.8 cmolc·kg−1, respectively), when compared to sites with similar C horizon chemistry.
Recovery indices also showed a wide range of values across the study sites (Figure 5). Indices were less than 0, indicating decreased exAl from the initial to final sampling in O and B horizon, for 95% and 65% of the study sites, respectively (Figure 5). Base saturation and pH recovery indices for O horizons were positive for 79% and 58% of the sites, respectively, but this pattern reversed with B horizon base saturation lnRR greater than 0 for 39% of the sites and pH lnRR greater than 0 for 70% of the sites. ExCa recovery indices showed the least number of positive values for study sites with 42% and 48% for O and B horizons, respectively.
Site and soil variables explained 70.9% of the variability in O horizon soil chemical property recovery indices (Figure 6). Redundancy analysis axis 1 (RDA1) explained 40.9% of the variation across recovery indices and was most strongly loaded by O horizon initial exAl (+) and O horizon initial exCa (−) (biplot scores > 0.5). Base saturation lnRR, and exCa lnRR were positively constrained by RDA1 across soil resampling sites, and exAl lnRR was negatively constrained. Redundancy analysis axis 2 (RDA2) explained 30.0% of the variation across recovery indices and was most strongly loaded by O horizon initial pH (−). ExAl lnRR was negatively constrained and pH lnRR was positively constrained by RDA2 across soil resampling sites. Independent contributions of each site and soil explanatory variable for O horizon recovery indices based on hierarchical partitioning are shown in Figure 7. Statistically significant contributions include O horizon initial exAl explaining the most variation in O horizon exCa lnRR (41.5%) and base saturation lnRR (44.5%) (Figure 8). O horizon initial pH explained the most variation in O horizon exAl lnRR (27.5%) and pH lnRR (42.6%). Recovery years was also found to have a significant independent contribution to exAl lnRR (10.9%).
RDA1 and RDA2 axes of site and soil variables explained 63.2% of the variability in B horizon soil chemical property recovery indices (Figure 9). RDA1 explained 32.5% of the variation across recovery indices and was most strongly loaded by initial SO42− deposition (+) (biplot scores > 0.5). Base saturation lnRR and exCa lnRR were negatively constrained by RDA1 across soil resampling sites. RDA2 explained 30.7% of the variation across recovery indices and was most strongly loaded by B horizon initial exCa (+) and recovery years (−). ExAl lnRR was positively constrained and pH lnRR was negatively constrained by RDA2 across sites. Statistically significant independent contributions to B horizon recovery indices included initial SO42− deposition explaining the most variation in B horizon exCa lnRR (46.7%) and base saturation lnRR (41.1%) (Figure 10 and Figure 11). B horizon initial base saturation had significant independent contributions to B horizon exAl lnRR (23.2% highest contribution). Recovery years and initial pH were found to have significant independent contributions to pH lnRR (30.1 and 28.2%, respectively) and recovery years was also associated with exAl lnRR (19.8%).

4. Discussion

A comparison of 23 sites in Eastern Canada and the Northeastern United States enabled an evaluation of acidification recovery by resampling forest soils from a broad range of forest types and soil chemistries with a relatively consistent decrease in S deposition across the region. Across our sampling sites, soil chemical changes indicating recovery from acidification were associated with initial horizon chemistry to a greater degree than to the chemistry of the parent material.
An increase in pH from initial to final sampling in O and B horizons was associated with the initial pH of those horizons. For O horizons initial sampling pH ranged from 2.3 to 3.9 for 18 of the sites with the EQVT site having a pH of 6.0. Lower pH values resulted in increased pH at the final sampling and using the regression relationship between initial pH and pH lnRR for our sites, O horizon pH was recovering below a threshold initial pH of 3.5 (Figure 8), and B horizon pH was recovering below a threshold initial pH of approximately 5.0 (Figure 11). While most of our data for both O and B horizons were in the lower end of these pH ranges, higher pH values for a few sites included in the study provide some indication of response with less acidic initial soil conditions. Long-term soil monitoring programs in Europe executed across sites with a range of parent material and soil pH have shown soil pH increases over similar resampling periods to our study due to decreasing acidic deposition. In Austrian forests, Jandl et al. [47] sampled soils in 1987 and again in 2007 at 139 sites, 30% of the sites on calcareous bedrock and 70% on silicatic bedrock. Organic horizons (Oa+Oe [FH]) and upper mineral soils showed increases to a greater degree on the more acidic parent material with the largest increase in the FH horizon. Kirk et al. [48] resampled the upper 15 cm of soil at 555 sites in deciduous and coniferous woodlands in England and Wales from the late 1970′s to the early 2000′s, a period with a 50% decrease in rainfall acidity. With an average resampling interval of 22 years they showed that the largest pH increases were for soils where the initial distilled water pH was less than 5.5. They noted that pH increases after declines in acidic deposition would not necessarily occur in soils where acid buffering processes were dominated by carbonate dissolution (less than pH 7.0) or cation exchange (pH 5.5 to 7.0), but more likely at pH values of less than 5.5 where dissolution of aluminosilicate minerals is the primary weathering mechanism for increasing soil pH. An increase in the number of recovery years was also linked to pH recovery in the B horizons of our study. The largest increases in pH were in Ontario and Quebec, where sites were sampled 20 or more years after the initial sampling. This result supports hypotheses related to acidification recovery and the results of several long-term soil resampling studies that suggest that there will be a lag time between decreases in acidic deposition and the recovery of soil chemical properties [25,48].
Our analyses showed an association between initial O horizon pH and the degree of soil recovery as reflected by exAl concentrations. Sites with more acidic O horizons showed decreased exAl and the threshold pH where exAl decreased from initial to final sampling was 3.5, similar to the threshold for increasing O horizon pH (Figure 8). This relationship is not unexpected as organic matter solubility would increase with the decreases in deposition and previously complexed Al would be available to leach deeper into the soil profile decreasing O horizon exAl. The increase in organic matter solubility in the O horizon has been attributed to increased pH [26], but may be more a function of decreased ionic strength, which has also occurred with decreased deposition levels. In that process, pH increases in the lower pH soils could be driven by increased H+ consumption by weak organic anions exposed as organic matter disaggregated [49]. In essence, the relationships of initial O horizon pH to pH and exAl recovery indices are coupled, based on chemical changes in this horizon resulting from reduced deposition. As with the O horizon pH lnRR relationship, the EQVT site provided a higher pH value than the other sites, which in this case showed the only increase in exAl. While the chemical explanation for this trend seems plausible and we have no reason to remove the EQVT site from our analysis, it is worth noting that it is driving the relationship between initial pH and exAl lnRR. When the EQVT point was excluded the relationship becomes negative and non-significant. Thin O horizons at two other sites (AUON and CRON) with high initial B and C horizon pH, base saturation and exCa, and low exAl similar to EQVT, were not able to be sampled. Additional O horizon data with initial pH values between 4 and 6 would be useful to validating this relationship. For B horizons, the initial horizon base saturation was the key variable to determining exAl response to decreasing deposition. According to the initial base saturation and exAl recovery index regression relationship for our study sites (Figure 11), B horizons with less than 20% initial base saturation showed recovery with decreases in exAl. The identification of this threshold supports the results of Lawrence et al. [26], who noted the dynamic nature of Al in low base saturation B horizons due to the shift from Ca to Al dominance of soil cation exchange capacity below 20% base saturation [50]. The sites with low base saturation B horizons that were more predisposed to increased Al mobilization due to increased precipitation acidity appear to be the sites that are exhibiting the greatest decrease in exAl as precipitation acidity has decreased. The influence of the high initial base saturation and large increase in exAl at the EQVT site with resampling was strongly influencing this relationship. Removal of this site from the analysis resulted in a significant negative relationship between B horizon initial base saturation and exAl lnRR. Similar to the EQVT initial O horizon pH, we believe that the B horizon chemistry at this site provides insight into soil chemistry changes at sites that represent the high end of the range in initial soil chemical properties across this region. Regardless, as reported by Lawrence et al. [26] most of the sites in our study with initial base saturations less than 20% were experiencing recovery with decreases in B horizon exAl. As with B horizon pH, an increase in the number of recovery years also led to greater recovery with decreased B horizon exAl.
Initial O horizon exAl was the primary explanatory variable associated with exCa and base saturation recovery indices across our study sites. Initial exAl values above a threshold value of approximately 5 cmolc·kg−1 resulted in increases in exCa from initial to final sampling. The parallel relationship of initial exAl to base saturation can be partly attributed to increases in exCa and previously discussed decreases in O horizon exAl. The HBNH site had an extremely high initial exAl concentration (29.9 cmolc·kg−1, range of other sites 0 to 12 cmolc·kg−1) and the largest increase in exCa and base saturation at the final sampling. The high initial exAl at HBNH facilitated the development of soil recovery response relationships across a broader range of soil chemical properties than represented by the other sites. When the HBNH site was removed from the analysis, these relationships remained positive but became non-significant. Most previous forest soil resampling studies in this region were executed at sites with exAl concentrations either below or just above the 5 cmolc·kg−1 recovery threshold determined from the regression relationship for our sites, and in most cases, these resampling studies reported no increases in exCa or base saturation. McHale et al. [51] found no exCa or base saturation recovery for O horizons that had initial exAl of 3.3 and 4.3 cmolc·kg−1 at two watersheds in the Catskills region of New York that were resampled in the early 2010′s. Siemion et al. [28] did show increased exCa at the non-glaciated Young Womens Creek site in Pennsylvania (initial exAl 3.2 cmolc·kg−1) but no recovery trends for two other sites in New York and New Hampshire (initial exAl 3.3 and 3.1 cmolc·kg−1, respectively). They attributed greater recovery at Young Womens Creek to higher initial atmospheric deposition S and N concentrations at this site and a sampling time frame that spanned the period from the highest to lowest deposition. In contrast to these two studies, Lawrence et al. [25] resampled soils in red spruce stands at six sites across the Northeastern United States with initial O horizon exAl concentrations that were all above our recovery threshold of 5 cmolc·kg−1, ranging from 5.8 to 8.0 cmolc·kg−1. Only one of the six sites, with an initial O horizon exAl concentration of 6.4 cmolc·kg−1, showed significant increases in O horizon exCa and base saturation from 1992/1993 to 2004. Largely due to the coniferous canopies, all of these sites had relatively deep forest floor horizons that generated large amounts of natural organic acidity that may have slowed recovery responses. This was recently determined to be the reason for slowed recovery at the BCMF site in a related study [52]. Overall, these results for exCa and base saturation are similar to those for pH and exAl recovery in that O horizons with initially more acidic soil chemical properties were shown to recover to a greater degree than less acidified O horizons.
An explanation for the negative relationship between B horizon recovery of exCa concentrations and base saturation with initial site SO42− deposition is unclear. Sites with an initial SO42− deposition of less than approximately 16 kg SO42− ha−1 showed increased exCa and base saturation at the final sampling (Figure 11). One possibility is that greater recovery was occurring at sites where SO42− deposition was on a downward trajectory prior to the initial sampling, and the sampling period coincided with the continuing soil recovery, or perhaps even corresponded to an enhanced recovery stage. An example of this situation included the A1NY, A2NY and A3NY sites which were not sampled until 2004, when SO42− deposition had declined from a high of 25 kg SO42− ha−1 in the early 1980′s to an average of 13.4 kg SO42− ha−1 for the four years prior to initial sampling. This explanation does not seem applicable to the two sites with the lowest initial SO42− deposition, DRON and HOME (6.4 and 12.5 kg SO42− ha−1, respectively) that were first sampled in 1985 and 1992, respectively. One would expect that these sites located at the western and eastern edges of our study range, outside of the areas of highest regional acidic deposition, would have been influenced to a lesser degree in terms of changing soil properties due to acidification. A second possibility relates to the lag time between recovery of B horizon exCa and base saturation and decreases in acidic deposition. It is plausible that even with consistent declines in SO42− deposition across all sites, sites with the highest initial deposition are taking longer to recover. This finding seems to support and reinforce the interpretation by Lawrence et al. [26] that the redistribution of Ca by biocycling from B horizons to surface organic horizons, limiting B horizon recovery, may be a component of the first stage of forest soil recovery. It remains to be seen, if at the current rates of deposition, mineral weathering will eventually lead to increased base cation concentrations in the deeper part of the soil profile as projected by the conceptual model of acidification recovery.
The lack of prediction value of the parent material chemistry in our study does not necessarily indicate that parent material is not of primary importance to the potential for recovery. In these relatively young and coarse textured soils, the C horizon extractable chemistry (pH and salt-extractable cations) is mostly controlled by organic matter present in the lower soil profile [53] and not necessarily reflective of mineral weathering or other processes that control the acid and base cation release so important to recovery from acidification. Further, the role of hydrological pathways and the movement of weathering products into the solum has been shown to be an integral factor in recovery, with soils influenced by shallow groundwater contributions from upslope showing greater recovery than soils influenced only by vertical soil water percolation [29]. Nutrient cycling processes related to forest type and age such as litterfall, fine root decomposition and N retention are other factors that could play a role in soil acidification recovery [25,26] were not considered in our study. While parent material mineralogy, hydrological pathways and nutrient cycling processes could be better predictors of acidification recovery, these types of information are currently not readily available for many research sites such as those in our study or available generally across forest landscapes in this region.

5. Conclusions

Our soil resampling study identified key site and soil factors that were associated with forest soil recovery from acidification caused by atmospheric deposition in the Northeastern United States and Eastern Canada. We had anticipated that C horizon soil chemical properties such as pH and exCa concentrations would be associated with soil recovery indices, but our results indicated that soil chemical properties of O and B horizons at the initial sampling time were better predictors of soil response to declining deposition. More acidified O horizons with higher exAl concentrations and lower pH values showed increased exCa, base saturation and pH, and decreased exAl concentrations over the range of recovery years for sites in our study. B horizon acidification recovery was associated with low initial B horizon pH and base saturation but also to initial site SO42− deposition and the number of recovery years between the initial and final sampling. Using the broad range of soil chemical properties across our study sites, we were able to explore empirical recovery thresholds. O horizons with initial pH values less than 3.5 and exAl concentrations less than 5 cmolc·kg−1, and B horizons with initial pH values less than 5.0, base saturations less than 20% and initial site SO42− deposition less than 16 kg·ha−1 showed recovery. All of these results suggest that soils that would be considered to have low buffering capacity and seemingly have a reduced potential for recovery have the resilience to recover from the effects of previous high levels of acidic deposition. Further, the results of our study indicate that predictions of where forest soil acidification reversal will occur across the landscape should be refined to acknowledge the importance of upper soil profile horizon chemistry rather than only parent material characteristics. That commonly measured upper horizon chemistry provides a good predictor of recovery is very useful as it can be broadly applied. Continued forest soil resampling studies and re-measurement of chemical properties are necessary to track ecosystem response to changing deposition and to evaluate the efficacy of pollution control policy.

Author Contributions

Conceptualization, P.H., C.E., G.L., I.F., R.O. and S.B.; Data curation, P.H., C.E., G.L., I.F., R.O. and S.B.; Formal analysis, P.H. and C.E; Funding acquisition, P.H., G.L., I.F., R.O. and S.B.; Methodology, P.H., C.E., G.L., I.F., R.O. and S.B.; Writing—original draft, P.H. and C.E; Writing—review & editing, P.H., C.E., G.L., I.F., R.O. and S.B. All authors have read and agreed to the published version of the manuscript.

Funding

Funding was provided by Natural Resources Canada−Canadian Forest Service, the New York State Energy Research and Development Authority and the U.S. Geological Survey. Additional funding for the soil resampling was provided by Northeastern States Research Cooperative through a grant to the Northeastern Soil Monitoring Cooperative (http://www.uvm.edu/~nesmc/index.html).

Acknowledgments

We thank Mark David, University of Illinois, for providing archived soil samples, and James Shanley, U.S. Geological Survey, for facilitating sampling at Sleepers River, VT. We also thank the Equinox Preservation Trust for permission to sample at Mount Equinox, VT. The Hubbard Brook Experimental Forest is maintained and operated by the U.S. Forest Service, Northern Research Station, Newtown Square, PA. The Turkey Lakes Watershed is operated and maintained by the Canadian Departments of Natural Resources, Environment and Climate Change and Fisheries and Oceans in cooperation with the Ontario Ministry of Natural Resources and Forestry. We thank Olivia Fraser and four anonymous reviewers for their constructive comments on earlier versions of this manuscript. Any use of trade, firm, or product names is for descriptive purposes only and does not imply endorsement by the U.S. Government.

Conflicts of Interest

The authors declare no conflict of interest.

References

  1. Engstrom, A.; Backstrand, G.; Stenram, H. Air Pollution across National Boundaries: The Impact on the Environment of Sulfur in Air and Precipitation, Report Editor; Royal Ministry for Foreign Affairs: Stockholm, Sweden, 1971.
  2. Odén, S. The acidity problem-an outline of concepts. Water Air Soil Pollut. 1976, 6, 137–166. [Google Scholar] [CrossRef]
  3. Abrahamsen, G. Effects of acidic deposition on forest soil and vegetation. Phil. Trans. R. Soc. Lond. 1984, 305, 369–392. [Google Scholar]
  4. Johnson, D.W.; Turner, J.; Kelly, J.M. The effects of acid rain on forest nutrient status. Water Resour. Res. 1982, 18, 449–461. [Google Scholar] [CrossRef]
  5. Harrison, R.B.; Johnson, D.W.; Todd, D.E. Sulfate adsorption and desorption reversibility in a variety of forest soils. J. Environ. Qual. 1989, 18, 419–426. [Google Scholar] [CrossRef]
  6. Berden, M.; Nilsson, S.I.; Rosen, K.; Tyler, G. Soil Acidification Extent, Causes and Consequences. An Evaluation of Literature Information and Current Research [Acid Neutralizing Capacity, Proton Sources, Proton Budgets, Biological and Chemical Consequences, Incl. Natural Soil Acidification Processes; Rapport-Naturvaardsverket: Solna, Sweden, 1987. [Google Scholar]
  7. Ulrich, B.; Mayer, R.; Khanna, P.K. Chemical changes due to acid precipitation in a loess-derived soil in central Europe. Soil Sci. 1980, 130, 193–199. [Google Scholar] [CrossRef]
  8. Grimm, R.; Rehfuess, K.E. Kurzfristige Veranderungen von Bodenreaktien und Kationenaustauscheigenschaften in einen Meliorationsversuch zu Kiefer (Pinus sylv. L.) auf Podsol-Pseudogley in der Oberpfalz. Allg. Forst Jagdztg. 1986, 157, 205–213. [Google Scholar]
  9. Linzon, S.N.; Temple, P.J. Soil Resampling and PH Measurements after an 18-Year Period in Ontario. Proc. Int. Conf. on Ecological Impact of Acid Precipitation; SNSF Project: Sandefjord, Norway, 1980; pp. 176–177. [Google Scholar]
  10. Johnson, A.H.; Andersen, S.B.; Siccama, T.G. Acid rain and soils of the Adirondacks. 1. Changes in pH and available calcium, 1930–1984. Can. J. Res. 1994, 24, 39–45. [Google Scholar] [CrossRef]
  11. Johnson, A.H.; Moyer, A.J.; Bedison, J.E.; Richter, S.L.; Willig, S.A. Seven decades of calcium depletion in organic horizons of Adirondack forest soils. Soil Sci. Soc. Am. J. 2008, 72, 1824–1830. [Google Scholar] [CrossRef]
  12. Bedison, J.E.; Johnson, A.H. Seventy-four years of calcium loss from forest soils of the Adirondack Mountains, New York. Soil Sci. Soc. Am. J. 2010, 74, 2187–2195. [Google Scholar] [CrossRef]
  13. Bailey, S.W.; Horsley, S.B.; Long, R.P. Thirty years of change in forest soils of the Allegheny Plateau, Pennsylvania. Soil Sci. Soc. Am. J. 2005, 69, 681–690. [Google Scholar] [CrossRef] [Green Version]
  14. Johnson, D.W.; Henderson, G.S.; Todd, D.E. Changes in nutrient distribution in forests and soils of the Walker Branch Watershed, Tennessee, over an eleven-year period. Biogeochemistry 1988, 5, 275–293. [Google Scholar] [CrossRef]
  15. Trettin, C.F.; Johnson, D.W.; Todd, D.E. Forest nutrient and carbon pools at the Walker Branch Watershed: Changes during a 21-year period. Soil Sci. Soc. Am. J. 1999, 63, 1436–1448. [Google Scholar] [CrossRef] [Green Version]
  16. Johnson, D.W.; Todd, D.E.; Trettin, C.F.; Mulholland, P.J. Decadal changes in potassium, calcium, and magnesium in a deciduous forest soil. Soil Sci. Soc. Am. J. 2008, 72, 1795–1805. [Google Scholar] [CrossRef] [Green Version]
  17. Watmough, S.A.; Dillon, P.J. Major element fluxes from a coniferous catchment in central Ontario, 1983–1999. Biogeochemistry 2004, 67, 369–398. [Google Scholar] [CrossRef]
  18. Warby, R.A.F.; Johnson, C.E.; Driscoll, C.T. Continuing acidification of organic soils across the northeastern USA: 1984–2001. Soil Sci. Soc. Am. J. 2009, 73, 274–284. [Google Scholar] [CrossRef]
  19. Miller, D.E.; Watmough, S.A. Soil acidification and foliar nutrient status of Ontario’s deciduous forest in 1986 and 2005. Environ. Pollut. 2009, 157, 664–672. [Google Scholar] [CrossRef] [PubMed]
  20. Sanderson, T.M.; Barton, C.; Cotton, C.; Karathanasis, T. Long-term evaluation of acidic atmospheric deposition on soils and soil solution chemistry in the Daniel Boone National Forest, USA. Water Air Soil Pollut. 2017, 228, 403. [Google Scholar] [CrossRef]
  21. United States Environmental Protection Agency (USEPA). Clean Air Act (CAA) Amendments; USEPA: Washington, DC, USA, 1990; pp. 7401–7671.
  22. Government of Canada. Canadian Environmental Protection Act (CEPA); Minister of Justice Canada: Ottawa, ON, Canada, 1999. [Google Scholar]
  23. Vet, R.; Artz, R.S.; Carou, S.; Shaw, M.; Ro, C.U.; Aas, W.; Baker, A.; Bowersox, V.C.; Dentener, F.; Galy-Lacaux, C.; et al. A global assessment of precipitation chemistry and deposition of sulfur, nitrogen, sea salt, base cations, organic acids, acidity and pH, and phosphorus. Atmos. Environ. 2014, 93, 3–100. [Google Scholar] [CrossRef]
  24. International Joint Commission (IJC); Canada-US Air Quality Committee. Canada, United States Air Quality Agreement: Progress Report 2016; Minister of Environment and Climate Change Canada: Ottawa, ON, Canada, 2017. [Google Scholar]
  25. Lawrence, G.B.; Shortle, W.C.; David, M.B.; Smith, K.T.; Warby, R.A.F.; Lapenis, A.G. Early indications of soil recovery from acidic deposition in US red spruce forests. Soil Sci. Soc. Am. J. 2012, 76, 1407–1417. [Google Scholar] [CrossRef] [Green Version]
  26. Lawrence, G.B.; Hazlett, P.W.; Fernandez, I.J.; Ouimet, R.; Bailey, S.W.; Shortle, W.C.; Smith, W.T.; Antidormi, M.R. Declining acidic deposition begins reversal of forest-soil acidification in the northeastern U.S. and eastern Canada. Environ. Sci. Technol. 2015, 49, 13103–13111. [Google Scholar] [CrossRef]
  27. Berger, T.W.; Türtscher, S.; Berger, P.; Lindebner, L. A slight recovery of soils from Acid Rain over the last three decades is not reflected in the macro nutrition of beech (Fagus sylvatica) at 97 forest stands of the Vienna Woods. Environ. Pollut. 2016, 216, 624–635. [Google Scholar] [CrossRef] [PubMed] [Green Version]
  28. Siemion, J.; McHale, M.R.; Lawrence, G.B.; Burns, D.A.; Antidormi, M. Long-term changes in soil and stream chemistry across an acid deposition gradient in the northeastern United States. J. Environ. Qual. 2018, 47, 410–418. [Google Scholar] [CrossRef] [PubMed]
  29. Fraser, O.L.; Bailey, S.W.; Ducey, M.J. Decadal change in soil chemistry of northern hardwood forests on the White Mountain National Forest, New Hampshire, USA. Soil Sci. Soc. Am. J. 2019, 83, S96–S104. [Google Scholar] [CrossRef]
  30. Norton, S.A. Geologic factors controlling the sensitivity of aquatic ecosystems to acidic precipitation. In Atmospheric Sulfur Deposition: Environmental Input and Health Effects; Shriner, D.S., Richmond, C.R., Lindberg, S.E., Eds.; Ann Arbor Science Pub. Inc.: Ann Arbor, MI, USA, 1979; pp. 521–531. [Google Scholar]
  31. Hendry, R.; Galloway, J.N.; Norton, S.A.; Schofield, C.L.; Burns, D.A.; Schaffer, P.W. Sensitivity of the eastern United States to acid precipitation impacts on surface waters. In Ecological Impact of Acid Precipitation, Proceedings of the International Conference, Sandefjord, Norway, 11–14 March 1980; Drablos, D., Tollan, A., Eds.; US Department of Energy and Environment, Brookhaven National Laboratory: Upton, NY, USA, 1980; pp. 216–217. [Google Scholar]
  32. Johnson, D.W.; Hornbeck, J.W.; Kelly, J.M.; Swank, W.T.; Todd, D.E. Regional patterns of soil sulfate accumulation: Relevance to ecosystem sulfur budgets. In Atmospheric Sulfur Deposition: Environmental Impact and Health Effects; Shriner, D.S., Richmond, C.R., Lindberg, S.E., Eds.; Ann Arbor Science: Ann Arbor, MI, USA, 1980; pp. 507–520. [Google Scholar]
  33. Lawrence, G.B.; Antidormi, M.R.; McDonnell, T.C.; Sullivan, T.J.; Bailey, S.W. Adirondack New York soil chemistry data, 1992–2017: USA. Geol. Surv. Data Release 2020. [Google Scholar] [CrossRef]
  34. Lawrence, G.B.; Fernandez, I.J.; Hazlett, P.W.; Bailey, S.W.; Ross, D.S.; Villars, T.R.; Quintana, A.; Ouimet, R.; McHale, M.R.; Johnson, C.E.; et al. Methods of soil resampling to monitor changes in the chemical concentrations of forest soils. J. Vis. Exp. 2016. [Google Scholar] [CrossRef] [Green Version]
  35. McKenney, D.W.; Hutchinson, M.F.; Papadopol, P.; Lawrence, K.; Pedlar, J.; Campbell, K.; Milewska, E.; Hopkinson, R.F.; Price, D.; Owen, T. Customized spatial climate models for North America. Bull. Am. Meteorol. Soc. 2011, 92, 1611–1622. [Google Scholar] [CrossRef]
  36. CAPMoN Canadian Air and Precipitation Monitoring Network. Available online: https://www.canada.ca/en/environment-climate-change/services/air-pollution/monitoring-networks-data/canadian-air-precipitation.html (accessed on 1 June 2020).
  37. NADP National Atmospheric Deposition Program. Available online: http://nadp.slh.wisc.edu/ (accessed on 1 June 2020).
  38. Ross, D.; Bailey, S.; Briggs, R.; Curry, J.; Fernandez, I.; Fredriksen, G.; Goodale, C.; Hazlett, P.; Heine, P.; Johnson, C.; et al. Inter-laboratory variation in the chemical analysis of acidic forest soil reference samples from Eastern North America. Ecosphere 2015, 6, 73. [Google Scholar] [CrossRef]
  39. R Core Team. R: A Language and Environment for Statistical Computing; R Foundation for Statistical Computing: Vienna, Austria, 2020; Available online: https://www.R-project.org (accessed on 28 July 2020).
  40. Hedges, L.V.; Gurevitch, J.; Curtis, P.S. The meta-analysis of response ratios in experimental ecology. Ecology 1999, 80, 1150–1156. [Google Scholar] [CrossRef]
  41. Oksanen, J.; Blanchet, F.G.; Friendly, M.; Kindt, R.; Legendre, P.; McGlinn, D.; Minchin, P.R.; O’Hara, R.B.; Simpson, J.L.; Solymos, P.; et al. Vegan: Community Ecology Package, R package version 2.5–6. 2019. Available online: https://CRAN.R-project.org/package=vegan (accessed on 28 July 2020).
  42. Bertini, S.C.B.; Azevedo, L.C.B.; de Mendes, I.C.; Cardoso, E.J.B.N. Hierarchical partitioning for selection of microbial and chemical indicators of soil quality. Pedobiologia 2014, 57, 293–301. [Google Scholar] [CrossRef]
  43. MacNally, R.; Walsh, C.J. Hierarchical partitioning public-domain software. Biodivers. Conserv. 2004, 13, 659–660. Available online: https://0-search-proquest-com.brum.beds.ac.uk/openview/6f19c4d612b6cf75b106c479e7084a58/1 (accessed on 28 July 2020).
  44. Chevan, A.; Sutherland, M. Hierarchical partitioning. Am. Stat. 1991, 45, 90–96. [Google Scholar]
  45. Fox, J.; Weisberg, S. An {R} Companion to Applied Regression, 3rd ed.; Sage: Thousand Oaks, CA, USA, 2019; Available online: https://socialsciences.mcmaster.ca/jfox/Books/Companion/ (accessed on 28 July 2020).
  46. Olea, P.P.; Mateo-Tomás, P.; de Frutos, Á. Estimating and modelling bias of the hierarchical partitioning public-domain software: Implications in environmental management and conservation. PLoS ONE 2010, 5, e11698. [Google Scholar] [CrossRef] [PubMed] [Green Version]
  47. Jandl, R.; Smidt, S.; Mutsch, F.; Fürst, A.; Zechmeister, H.; Bauer, H.; Dirnböck, T. Acidification and nitrogen eutrophication of Austrian forest soils. Appl. Environ. Soil Sci. 2012, 2012. [Google Scholar] [CrossRef]
  48. Kirk, G.J.D.; Bellamy, P.H.; Lark, R.M. Changes in soil pH across England and Wales in response to decreased acid deposition. Glob. Chang. Biol. 2010, 16, 3111–3119. [Google Scholar] [CrossRef]
  49. Cincotta, M.M.; Perdrial, J.M.; ALibenson, A.S.; Landsman-Gerjoi, M.; Perdrial, N.; Armfield, J.; Adle, T.; Shanley, J. Soil aggregates as a source of dissolved organic carbon to streams: An experimental study on the effect of solution chemistry on water extractable carbon. Front. Environ. Sci. 2019, 7, 172. [Google Scholar] [CrossRef] [Green Version]
  50. Reuss, J.O. Implications of the calcium-aluminum exchange system for the effect of acid precipitation on soils. J. Environ. Qual. 1983, 12, 591–595. [Google Scholar] [CrossRef]
  51. McHale, M.R.; Burns, D.A.; Siemion, J.; Antidormi, M.R. The response of soil and stream chemistry to decreases in acid deposition in the Catskill Mountains, New York, USA. Environ. Pollut. 2017, 229, 607–620. [Google Scholar] [CrossRef] [PubMed]
  52. Lawrence, G.B.; Scanga, S.E.; Sabo, R.D. Recovery of soils from acidic deposition may exacerbate nitrogen export from forested watersheds. J. Geophys. Res. Biogeosci. 2020, 125, e2019JG005036. [Google Scholar] [CrossRef] [Green Version]
  53. Hazlett, P.W.; Curry, J.M.; Weldon, T.P. Assessing decadal change in mineral soil cation chemistry at the Turkey Lakes Watershed. Soil Sci. Soc. Am. J. 2011, 75, 287–305. [Google Scholar] [CrossRef]
Figure 1. Location of soil resampling sites in Eastern Canada and the Northeastern United States.
Soilsystems 04 00054 g001
Figure 2. Example (A) hardwood and (B) softwood profiles showing forest floor and upper mineral soil morphologies of soil resampling sites in Eastern Canada and the Northeastern United States.
Soilsystems 04 00054 g002
Figure 3. SO42− reduction rate and initial SO42− deposition at soil resampling sites in Eastern Canada and the Northeastern United States. Values on the left represent the number of recovery years for each site (i.e., number of years between initial and final soil sampling), and values on the right represent year of initial and final soil sampling.
Soilsystems 04 00054 g003
Figure 4. (A) Initial pH, (B) base saturation, (C) exchangeable Ca and (D) exchangeable Al in the C, B and O horizons for soil resampling sites in Eastern Canada and the Northeastern United States. Pearson’s r values marked with * indicate significance at p < 0.05 or NS (not significance).
Soilsystems 04 00054 g004
Figure 5. Recovery indices (ln [final sampling/initial sampling]) for (A) pH, (B) base saturation, (C) exchangeable Ca and (D) exchangeable Al for the B and O horizons for soil resampling sites in Eastern Canada and the Northeastern United States.
Soilsystems 04 00054 g005
Figure 6. Redundancy analysis showing the relationship between soil recovery indices (light grey) and explanatory variables (black) for the O horizon of 19 soil resampling sites in Eastern Canada and the Northeastern United States. Points (x) represent the soil resampling sites.
Soilsystems 04 00054 g006
Figure 7. Independent contribution (%) of each explanatory variable for O horizon soil recovery indices based on hierarchical partitioning. +/− signs denote direction of significant contribution (p < 0.05) based on a negative log-likelihood randomization test (n = 1000).
Soilsystems 04 00054 g007
Figure 8. Correlation of O horizon (A) initial pH and pH lnRR, (B) initial pH and exAl lnRR, (C) initial exAl and exCa lnRR and (D) initial exAl and BS lnRR for 19 soil resampling sites in Eastern Canada and the Northeastern United States.
Soilsystems 04 00054 g008
Figure 9. Redundancy analysis showing the relationship between soil recovery indices (light grey) and explanatory variables (black) for the B Horizon of 23 soil resampling sites in Eastern Canada and the Northeastern United States. Points (x) represent the soil resampling sites.
Soilsystems 04 00054 g009
Figure 10. Independent contribution (%) of each explanatory variable for B horizon soil recovery indices based on hierarchical partitioning. +/− signs denote direction of significant contribution (p < 0.05) based on a negative log-likelihood randomization test (n = 1000).
Soilsystems 04 00054 g010
Figure 11. Correlation of B horizon (A) initial pH and pH lnRR, (B) initial BS and exAl lnRR, (C) initial SO42− deposition and exCa lnRR and (D) initial SO42− deposition and BS lnRR for 23 soil resampling sites in Eastern Canada and the Northeastern United States.
Soilsystems 04 00054 g011
Table 1. Location, site characteristics and sampling description for soil resampling sites in Eastern Canada (Cdn) and the Northeastern United States (US). Ordered from east to west.
State/Province, LocationSite CodeForest TypeSoil Type (US Great Group)Soil Type (Cdn Great Group)Pits SampledSoil Texture a B HorizonAnnual Precipitation b (mm)Annual Mean Temperature b (°C)
MaineBear BrookBBCFspruceHaplorthodHumo-ferric podzol10SL12566.9
MaineBear BrookBBHWnorthern hardwoodHaplorthodHumo-ferric podzol10SL12566.9
MaineHowlandHOMEmixed softwoodHaplorthodHumo-ferric podzol12SL11806.4
New Hampshire, Crawford NotchCNNHspruceHaplorthodHumo-ferric podzol12SL17031.8
QuebecDuchesnayDUQCnorthern hardwoodHaplorthodHumo-ferric podzol4SL13413.8
New HampshireHubbard BrookHBNHnorthern hardwoodHaplorthodHumo-ferric podzol4SL12815.6
New HampshireJeffers BrookJBNHnorthern hardwoodHaplorthodHumo-ferric podzol4SL14344.0
VermontSleepers RiverSRVTnorthern hardwoodHaplorthodHumo-ferric podzol4SL12954.5
Vermont Mount EquinoxEQVTnorthern hardwoodDystrudeptDystric brunisol4SL13835.9
New York Adirondack 28014A2NYnorthern hardwoodHaplorthodHumo-ferric podzol15SL13424.4
New YorkBuck CreekBCMFspruce, northern hardwoodHaplorthodHumo-ferric podzol28SL12584.8
New YorkBuck CreekBCHWnorthern hardwoodHaplorthodHumo-ferric podzol28SL12584.8
New YorkAdirondack 28030A3NYnorthern hardwoodHaplorthodHumo-ferric podzol15SL11965.2
New YorkAdirondack 27020A1NYnorthern hardwoodHaplorthodHumo-ferric podzol15SL13054.6
New YorkAdirondack 29012A4NYsoftwood, hardwoodHaplorthodHumo-ferric podzol15SL12596.4
OntarioLittle Margaret LakeLMONnorthern hardwoodHapludalfGray brown luvisol25SiL10805.3
Ontario CraighurstCRONnorthern hardwoodEutrusteptMelanic brunisol25SL9686.6
OntarioKirkland LakeKLONboreal jack pineHaplorthodHumo-ferric podzol25SiS7433.1
OntarioAuburnAUONnorthern hardwoodHapludalfGray brown luvisol25SiC9917.8
OntarioFlame LakeFLONboreal jack pineHaplorthodHumo-ferric podzol25SCL8963.1
OntarioTurkey LakesTLONnorthern hardwoodHaplohumodFerro-humic podzol25SiL10693.3
OntarioWawaWAONboreal jack pineHaplorthodHumo-ferric podzol25LS8382.0
OntarioDrydenDRONboreal jack pineHaplorthodHumo-ferric podzol25SiS7062.6
a Soil texture: C = clay, SiC = silty clay, CL = clay loam, SiCL = silty clay loam, SCL = sandy clay loam, L = loam, SL = sandy loam, SiL = silt loam, Si = silt, SiS = silty sand, LS = loamy sand. b Climate data from climate surfaces model, annual mean values 2001–2010 [35].

