Article

Soil Organic Carbon Stabilization: Influence of Tillage on Mineralogical and Chemical Parameters

1
Dipartimento di Scienze del Suolo, della Pianta e degli Alimenti, University of Bari, Via Amendola 165/A, 70126 Bari, Italy
2
Dipartimento di Scienze della Terra e Geoambientali, University of Bari, Via Orabona 4, 70125 Bari, Italy
*
Author to whom correspondence should be addressed.
Submission received: 4 August 2020 / Revised: 17 September 2020 / Accepted: 19 September 2020 / Published: 22 September 2020

Abstract

:
The interaction of organic carbon (OC) with clay minerals and amorphous iron and aluminum oxides, especially in the finest soil fractions (<20 μm), represents a good method for its stabilization, and different tillage practices can improve or reduce the persistence of OC in soils. This study investigates the effects of conventional (CT) and no (NT) tillage and soil depth (0–30, 30–60, and 60–90 cm) on the soil organic carbon (SOC) in four soil size fractions and its interactions with clay minerals and amorphous oxides. To identify the mineralogical composition of the four soil size fractions isolated from each soil, the X-ray powder diffraction (XRPD) technique was used with near infrared (NIR) spectroscopy, while the X-ray fluorescence (XRF) technique was used to determine the chemical composition of soil fractions. The higher OC content found in the finest soil fraction is related to its higher content of clay minerals and amorphous oxides. The SOC content is similar among CT and NT treatments as well as the mineralogical composition and the amount of amorphous oxides, suggesting that more than ten years of different tillage did not influence those parameters.

1. Introduction

Soil organic matter (SOM) consists of a heterogeneous mixture of organic compounds with highly variable composition, different inherent stabilities and turnover rates [1]. The importance of SOM is due to its physical, chemical and biological properties capable of improving the performance of a soil. In particular, SOM provides a reservoir of nutrients such as N, P and S, improves soil structural stability, influences the retention of water and thermal properties, modifies the cation exchange capacity, reduces the change of soil pH through buffering capacity, complexes cations and reduces the availability of toxic compounds [2].
Kaiser and Guggenberger [3] and Kögel-Knabner et al. [4] showed that the stability of organic matter (OM) in soils can be affected by the formation of various organo-mineral associations between SOM particles and the surfaces of clay minerals, i.e., phyllosilicates [5] and metallic oxides [6], especially the amorphous ones [7]. The effects of these interactions are an increased carbon (C) mean residence time, up to millennial time periods [8]. In particular, the stability of OM depends on surface functional groups, specific surface area and porosity of the minerals involved in this kind of interaction [8,9]. In fact, a large proportion of OM is entrapped among clay layers, and therefore the soils dominated by 2:1 phyllosilicates are more efficient in stabilizing OC than those dominated by 1:1 phyllosilicates [10,11]. Generally, clay fractions can stabilize OC by direct adsorption and entrapment in microaggregates [12], or by encrustation of clay particles around OM [13]. Another important mechanism for stabilization and long-term protection of soil organic carbon (SOC) is the interaction with reactive mineral phases, such as aluminium or iron oxides and/or hydroxides [4,14,15]. The most common interactions that occur among SOC and soil oxides or hydroxides are the electrostatic attraction and the ligand exchange between hydroxyl groups on the oxides and carboxyl or hydroxyl groups within the organic matter [16]. In addition, SOM affects the cycling of redox-active elements such as iron or manganese [17] because reduced humic substances can transfer electrons abiotically to terminal electron acceptors such as high valence metals [18]. Among the oxides, the amorphous ones are considered more effective than crystalline ones in stabilizing soil aggregates containing the OC, even at low concentrations [19]. The dynamics of carbon in the soil cannot ignore the microbial community that, on the one hand, removes carbon through respiration, while on the other increases SOC through its own mortal remains. The microbial component also facilitates the formation of microaggregates that stabilize a certain amount of carbon in the soil [13].
Particle size fractionation can separate fractions with different phyllosilicate mineralogy [20] thus providing further insights into the possible role of each size fraction in OC stabilization.
The dynamics of SOC is also influenced by tillage practices and soil depth, as demonstrated by the observation that continuous tillage can inhibit the formation of microaggregates responsible for the stabilization of OM [21,22].
The monitoring of the effects of different soil managements is a crucial aspect, and the employment of rapid, precise and quantitative measurements could help to more easily characterize soil physical, chemical and mineralogical properties [23,24]. Currently, X-ray powder diffraction (XRPD) analysis is used for the mineralogical characterization of different soil fractions. XRPD and X-ray fluorescence (XRF) data provide, together, information on the mineralogical and chemical composition of complex mixtures found in soils [25]. Near-infrared (NIR) reflectance spectroscopy can support conventional analytical methods, and could be considered an inexpensive and precise method to estimate the mineralogical composition of a soil, in particular to detect kaolinite, montmorillonite and illite [26,27,28], easily integrable with X-ray techniques. Various authors have also shown the effectiveness of NIR reflectance spectroscopy in estimating soil physical and mineralogical characteristics [29,30,31].
In the present work, we sought to investigate the effects of twelve years of opposite tillages (conventional vs. no tillage) on the mineralogical and elemental composition of macro- and microaggregates, their size and distribution among three depths, using advanced spectroscopic techniques such as NIR, XRPD and XRF. Furthermore, we studied the effects of the different soil managements on the relationships between mineral components and organic matter for its stabilization.

2. Materials and Methods

2.1. Study Area and Experimental Design

A two-year rotation of durum wheat with fava bean was established in 2005 at the experimental station of Policoro, a farm belonging to the University of Bari, placed at an altitude of 15 m above sea level, at latitude 40°10′20″ N and longitude 16°39′04″ E. Several treatments, replicated three times in 30 × 30 m plots and regarding different tillage and fertilization methods, were introduced in a split block design. After twelve years from the beginning of the experiment (2017), at the end of the durum wheat cycle and after the removal of the aboveground crop residues, soil samples of three layers (0–30, 30–60 and 60–90 cm depth) were collected from no tillage (NT) and conventional tillage (CT) plots using the grid sampling scheme. The soil was classified as silt loam type according to the Soil Survey Staff [32]. A full description of soil managements is reported by De Mastro et al. [33].

2.2. Particle Size Physical Fractionation and Soil Organic Matter Removal

The soil samples were gently crushed and passed through a 2 mm sieve to obtain the fine fraction. Four particle size fractions were separated by ultrasonic dispersion and wet sieving, using the fractionation method described by De Mastro et al. [22]. This method is based on the physical procedure of Bornemann et al. [34] for the fractionation of macro- (A: 2000–250 μm) and microaggregate fractions (B: 250–53 μm), and coarse silt-sized (C: 53–20 μm) and free fine silt plus clay fractions (D: <20 μm). Before the determination of the chemical properties of the inorganic components of soil fractions, samples were finely milled in a ball mill and SOM removed through chemical oxidation with H2O2 (1:10 w/v) by shaking (180 rpm) each separate soil fraction for 20 min at room temperature and by centrifuging the solution for 15 min at 3000 rpm. After removing supernatant, the procedure was repeated twice and fractions were washed twice with distilled water [35]. The samples were dried at 35 °C and equilibrated to room temperature for a few minutes in a desiccator.

2.3. Mineralogical and Chemical Analyses of Particle Size Fractions

The mineral phase analysis was carried out by XRPD using a PANalytical X’Pert pro Materials Research Diffractometer according to the methods by Schulz [36] and Shaw et al. [37], modified by Laviano [38].
Elemental composition analysis was performed by the wavelength dispersive XRF technique using a PANalytical AXIOS-Advanced XRF spectrometer on pressed powder samples. They were treated with elvacite solubilized in acetone and then pressed using a hydraulic press at about 15 tons. Major elements, expressed as oxides, and the trace element concentrations were determined according to Franzini et al. [39,40,41] and Leoni and Saita [42].
Amorphous Al, Fe and Mn oxides were extracted from each size fraction according to the method reported by Schwertmann et al. [43], and quantified with inductively coupled plasma optical emission spectrometry (Thermo Scientific, ICAP 6000 Series).

2.4. Spectroscopic Analyses of Particle Size Fractions

Soil fraction samples were dried at 35 °C, transferred to the 3 cm diameter compression cell, surface leveled and analyzed using the Nicolet Antaris II FT-NIR Analyzer (Thermo Fisher Scientific). Each spectrum was recorded from 4000 to 10,000 cm−1 with a resolution of 16 cm−1 under continuous sample rotation. The window of each sample cup was carefully cleaned by a gentle stream of compressed air after each measurement. Spectra were processed using TQ Analyst 8 instrument software (Thermo Electron Corporation, Waltham, MA, USA).

2.5. Statistical Analysis

All analyses performed on soil fractions were conducted in triplicate. Data were analyzed using R software (version 3.2.3), testing first their normal distribution and their homoscedasticity, and later performing analysis of variance (two-way ANOVA), Tukey’s test and correlations.

3. Results and Discussion

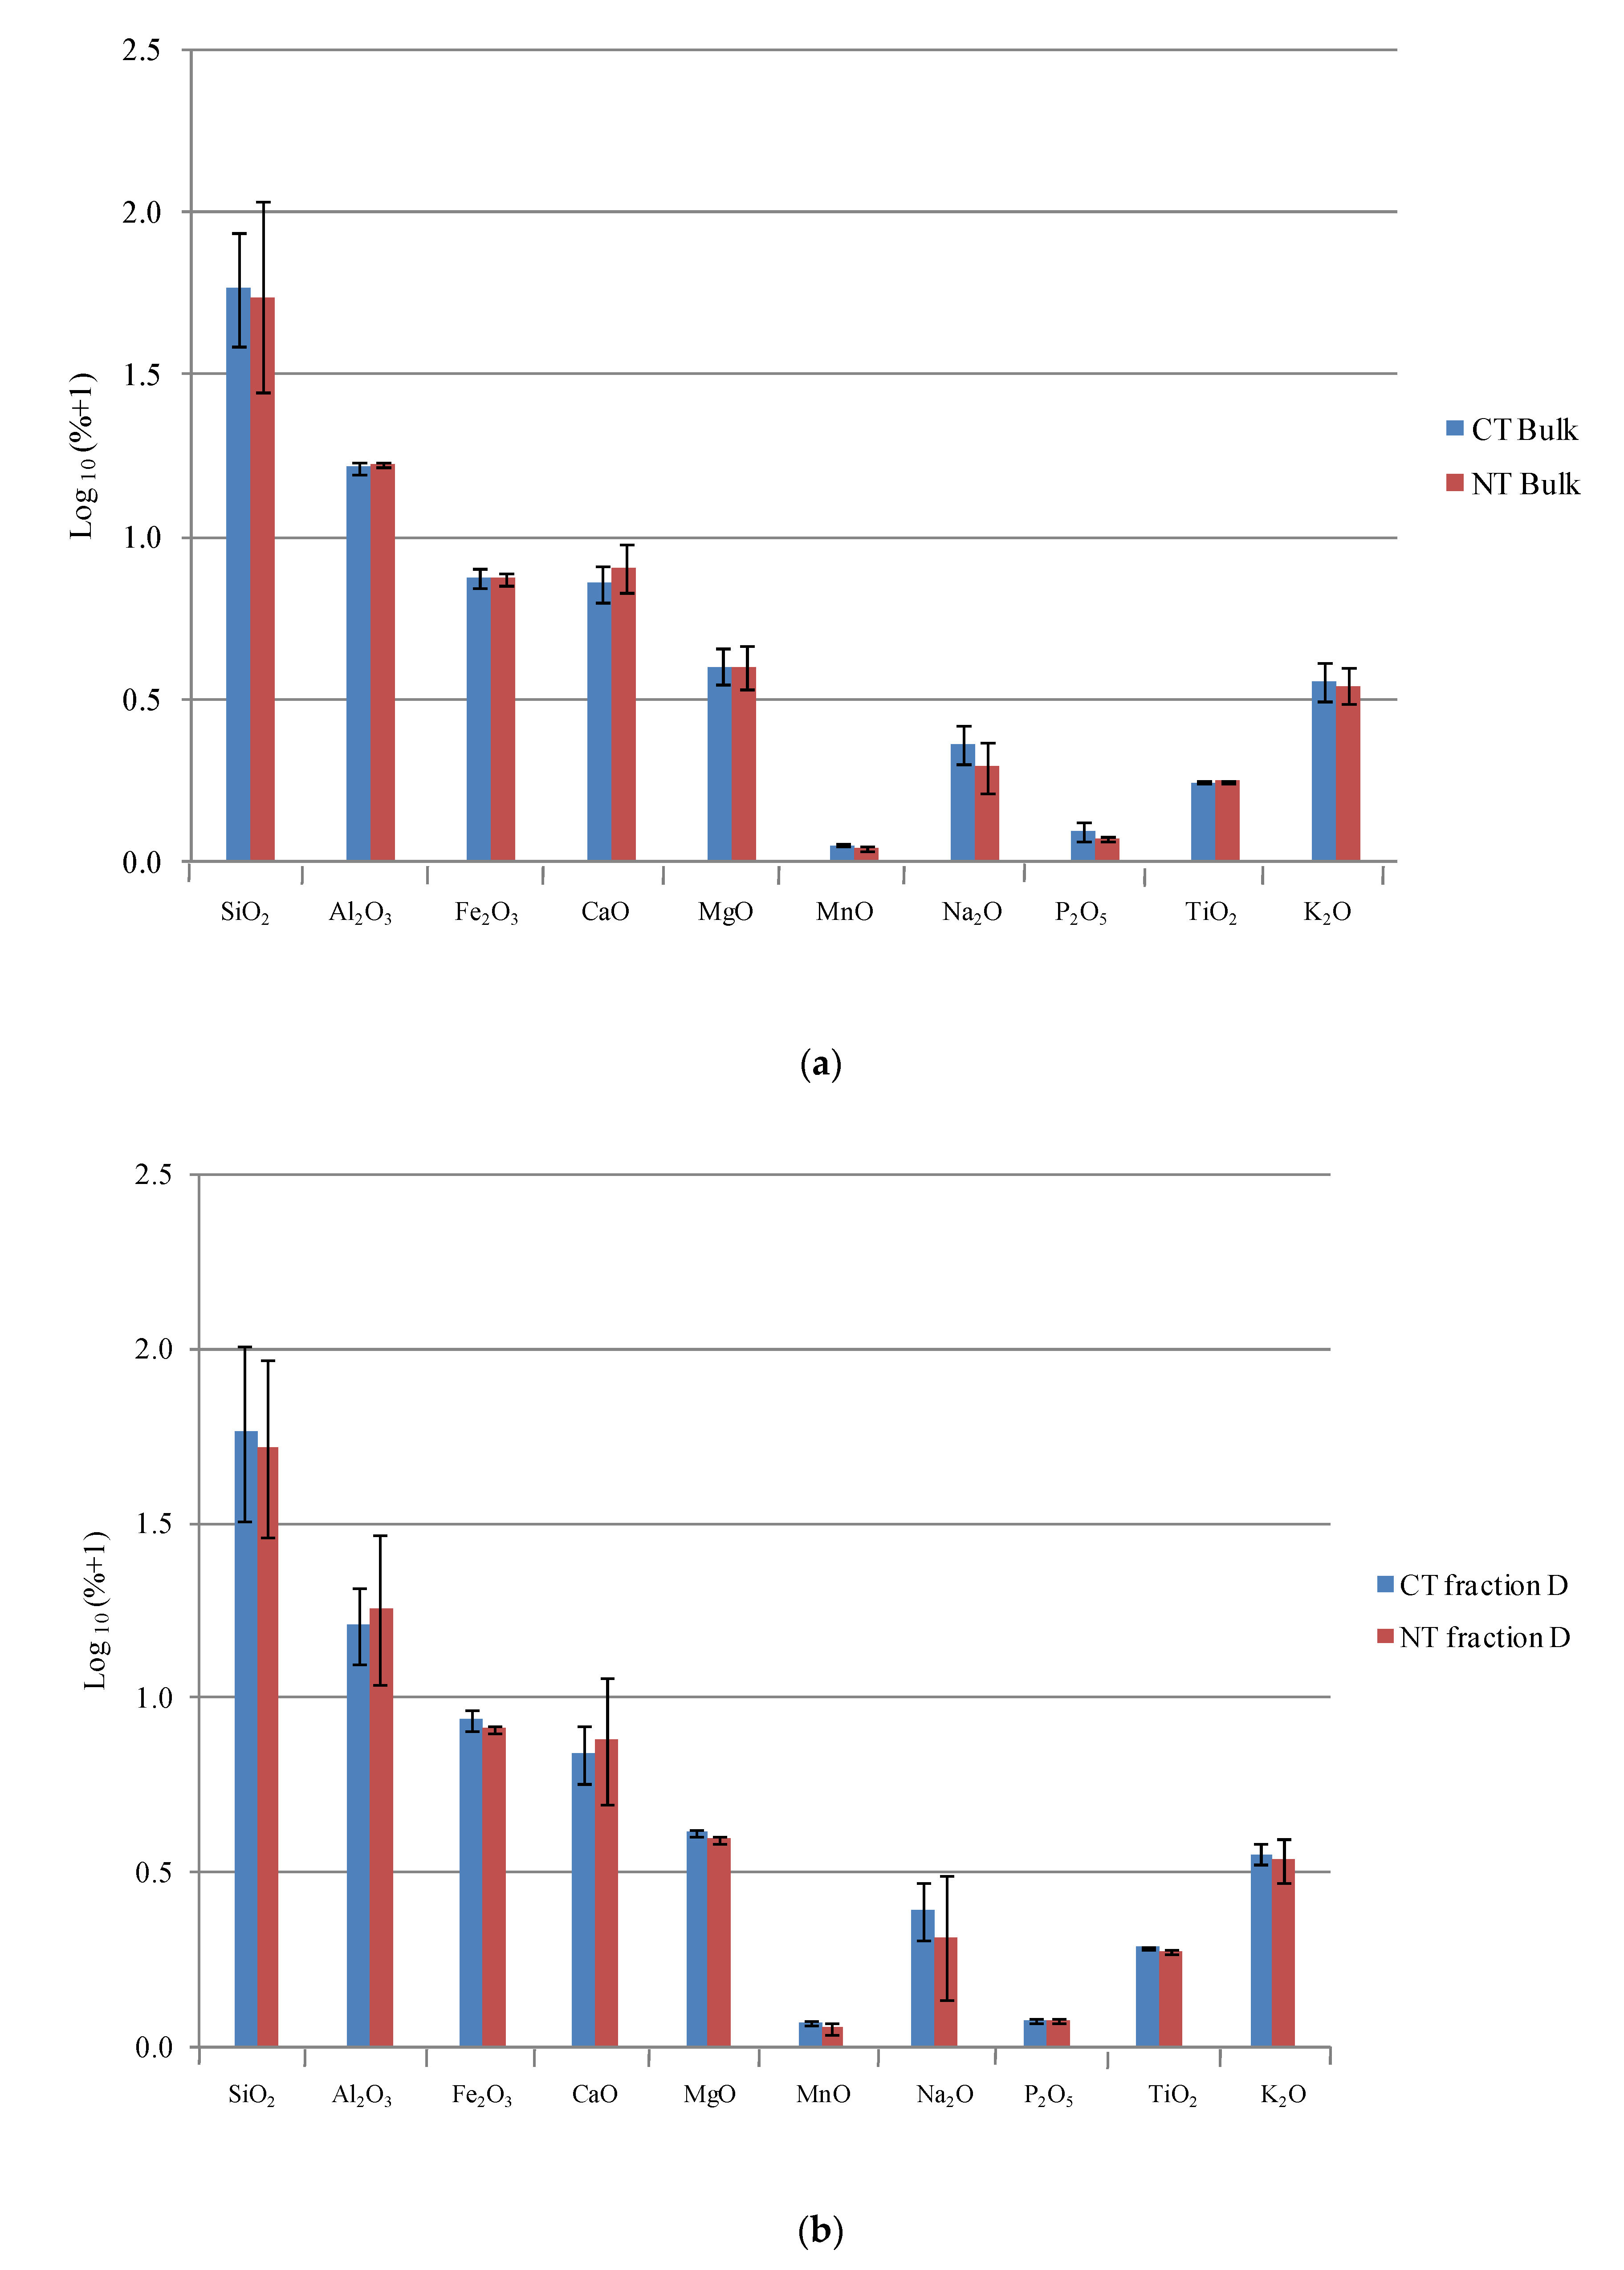
3.1. Elemental and Mineralogical Analyses

Figure 1 shows the elemental composition of 0–30 cm bulk soil and the corresponding D fractions under NT and CT treatments.
Since no significant difference was observed between the two soil managements studied, Table 1 reports the analysis of variance and mean values of the major and trace elements subdivided by soil depth and size fractions of the sole NT treatment. The same parameters of the CT treatment are reported in Table S1, Supplementary Material.
The SiO2, Al2O3 and Fe2O3 were the most represented compounds, with concentrations similar to those found by Summa et al. [44] in a study conducted on soils of Basilicata. No significant difference was observed in the aforementioned oxides across the bulk soil profile, possibly due to expandable clay minerals in the fine fraction (60–80% of the total), which can determine pedoturbation phenomena or mixing of the soils and minimal horizonation [45]. Such pedoturbation was also very visually evident, with soil cracking during dry periods.
The highest amount of Al2O3, Fe2O3 and K2O was found in the D fraction, and the lowest in the A fraction, while a similar content of each oxide was found in B and C fractions. The higher K2O content in the finest fraction could be ascribed to the higher illite content in the same fraction. An opposite trend was observed for CaO, whose content was the highest in the A fraction and the lowest in the D fraction. The loss of ignition (LOI) range was 8.5–14.2% for D and C fractions, which is in agreement with the expected values due to the loss of the constitution water of minerals and carbonates [46]. The Si/Al molar ratio decreased from 7.6 in the A fraction to 2.8 in the D fraction, in agreement with the increasing layer silicate contents [46].
The analysis of variance and mean values of the mineralogical composition, subdivided by soil depth and size fractions of the sole NT treatment, are summarized in Table 2 since, even for those parameters, we did not find significant differences between the soil managements. Table S2, Supplementary Material, reports the mineralogical composition of the CT treatment.
Layer silicates identified by XRPD were micas (illite + muscovite), chlorite (Ch), smectite (Sm) and secondarily kaolinite (Kln), while other minerals like quartz (Qz), feldspars (Fsp) and calcite (Cal) were found too. No significant difference was observed in mineralogical composition across the profile, with the only exception of Cal, significantly increasing with depth, in line with that reported by Owliaie and colleagues [47]. Greater differences were evident by comparing size fractions in terms of Sm, Kln and Ch content, for which increased percentages were evident with decreasing fraction sizes. In particular, Cal dominated the mineralogical composition of the A fraction, according to its lithogenic origin, and strongly correlated with the content of CaO (r = 0.997). Qz was primarily associated with coarse fractions, and the presence of microquartz in B and C fractions also suggested the fragmentation of quartz grains as a result of the soil evolution [48]. The slightly higher content of Kln in the D fraction pointed toward its pedogenic origin, as often reported in well-developed soils of Mediterranean environments [49]. With the exception of Sr, trace elements, being part of clay minerals, were positively correlated with clay minerals (r = 0.91), while Sr was positively correlated with calcite (r = 0.97), due to its Ca vicariant nature.
The NIR spectroscopy confirmed the results of the mineralogical analysis. Almost all spectra (Figure 2) showed a band at about 7060 cm−1 that can be ascribed to stretching and bending vibrations of water [50] and hydroxyl bonds of clay [28,51]. Bishop et al. [51] also found this band in dehydrated montmorillonite spectra, confirming the contribution of clay minerals in its relative intensity. Generally speaking, Ca-montmorillonite, a clay mineral commonly present in soils, shows characteristic absorption bands around 7143 cm−1 and 4545 cm−1, due to the OH stretching vibration and OH stretching and bending vibrations, respectively, while absorption due to the OH group, ascribable to the presence of free water, is found at about 5263 cm−1 [26]. Clay minerals of the type 1:1 (kaolinite) and illite are spectrally active in the NIR region too. In kaolinite, the absorption bands around 7143 cm−1 and 4545 cm−1, due to the OH groups of the crystal lattice, are relatively strong, while the signal at 5263 cm−1 is very weak, due to the reduced surface area and the smaller amount of water absorbed. Illite has absorptions at 7143 cm−1, 5263 cm−1 and 4545 cm−1, but the latter band is weak compared to that of smectite. Illite also exhibits additional absorption around 4274 and 4090 cm−1 [27]. These bands can diagnose illite from smectite, however, they are very weak, and the former band especially can be mistaken for absorption due to the presence of organic matter. Our NIR spectra (Figure 2) showed the peak at around 4250 cm−1, confirming a higher content of illite, while the pronounced band at around 5230 cm−1 indicated the low presence of clay minerals 1:1. In fact, Ben-Dor et al. [28] found that the spectrum of illite showed peaks of almost the same intensity at about 7143 cm−1 and 5263 cm−1, while the spectrum of Ca-montmorillonite showed a more pronounced peak at around 5230 cm−1 and the kaolinite peak was only outlined. In our experiment, no difference was observed among B and C fraction spectra, confirming their similar content of clay minerals. In all spectra, peaks of the D fractions were more evident at the three examined depths (Figure S1, Supplementary Material), as demonstrated by their mineralogical composition (Table 2). A substantial difference between NT and CT treatments was evident only in the A fraction: the peak at about 5263 cm−1 was more pronounced in the first soil layer under NT, and in the intermediate and deepest soil layer under CT (Figure S2, Supplementary Material). This difference could be reasonably ascribed to the fate of free water, which remained in the soil surface under NT, while it infiltrated deeper layers under CT.
The analysis of variance and mean values of amorphous oxides subdivided by soil depth, size fractions (C and D) and tillage are reported in Table 3.
In general, a low amount of amorphous oxides was found, and this result was ascribed to the soil pH of 7.6. In fact, Al-oxyhydroxides are involved in soil organic matter cycling in acidic soils, while Fe-oxyhydroxides in soil with neutral pH values [52]. No significant difference was observed between the two tillage managements examined as well as across the soil profile, while levels of amorphous oxides in the D fraction were significantly higher than those in the C fraction. This latter result was also reported in a previous paper [46], in which a similar trend was observed for Al, which showed a higher content both in the upper and in the deepest soil layers, and a lower content in the intermediate one. Many previous studies showed a positive correlation among amorphous oxides and organic carbon in soils, possibly ascribable to the formation of inner-sphere complexes through co-precipitation in sediments [53] or of organo-mineral complexes [54,55] or due to ligand exchange [14]. In particular, Spielvogel et al. [56] reported that amorphous oxides can be responsible for the association with microbial sugars in clay fractions.

3.2. Interactions between Inorganic and Organic Components of the Soil

Figure 3 shows the analysis of variance of OC subdivided by soil depth, tillage and size of fractions.
The OC content of A and B fractions was very low (8.9 and 17.9 mg kg−1, respectively), therefore, we have considered only the C and D fractions. The highest OC content was recorded in the upper soil layer and decreased significantly with depth. Although the different tillage management did not influence the OC content significantly, the D fraction showed a significantly higher OC quantity with respect to the C one, according to the greater content of clay minerals in the former fraction. Previous papers reported a positive correlation between the OC content and clay minerals, especially the 2:1 phyllosilicates [57], because they are involved in OC stabilization [13,58,59,60]. Additionally, in the present study, a significant positive correlation was found between the OC and the clay minerals (r = 0.73), even if those interactions can be very sensitive to environmental changes [61,62], and to the specific surface charge of clay minerals [7,46]. In our study, the content of clay minerals was slightly higher in the deepest layer of soil, whereas the OC content was higher in the upper soil layer. This result could be ascribed to the presence of fresh residues in the surface layer, still decaying and not interacting with the clay minerals, while in the deepest layers, the OC was more associated with the clay minerals. The latter ones are more abundant with depth [63] and, since the deepest layers are not affected by the tillage, the formation and stabilization of organo-mineral complexes can occur more easily [7].
Crystalline Fe and Al oxides possess reactive surface sites onto which OC can be adsorbed and, in fact, positive correlations have been found between these minerals and OC [64], and these oxides are considered more efficient in OC stabilization than clay minerals [65]. In fact, they are characterized by dense surface hydroxyl groups, micropores and small mesopores that represent adsorptive sites for the functional groups of organic matter [3,51,66]. Our results confirmed a slightly higher correlation between OC and crystalline Fe and Al oxide content (r = 0.76) with respect to OC and clay mineral content (r = 0.73).
Amorphous Fe, Al and Mn oxides (Table 3) have higher specific surface area and hydroxyl site densities than crystalline ones and represent a better way to stabilize SOC [6]. Higher content of these oxides, found in the smallest particle size fraction, can adsorb a higher amount of OC. Accordingly, we observed that the correlation between OC and amorphous oxide content was even higher (r = 0.86) than that with crystalline ones, and no significant correlations were observed among amorphous oxides and soil depth and tillage management.
In general, the capacity of a soil to stabilize the OC depends on the combined effect of silicates and oxides, and this effect can be strongly variable according to the quality and quantity of minerals and their resulting surface charge [46]. For example, Saidy et al. [67] demonstrated that ferrihydrite and goethite can increase the sorption capacity of kaolinite, but no effect of goethite was observed when illite dominated.

4. Conclusions

The SOC content did not change significantly after twelve years of experimentation regardless of the tillage and this result could be reasonably ascribed to the removal of crop residues at the end of each crop cycle. The tillage did not influence the mineralogical and chemical compositions of the particle size fractions isolated from different soil depths, while the amorphous oxide content was slightly higher, but not significantly different, from that of the NT condition. As expected, the OC content was higher in the finest soil fractions because of their higher content of clay minerals and amorphous oxides responsible for the stabilization of OC. The NIR spectroscopy analysis provided information about the quality of the main minerals present in the different soil size fractions, especially illite and kaolinite, and showed a higher presence of clay minerals in the finest soil fraction, confirming X-ray data. Additionally, NIR spectroscopy analysis provided information on the free water content of soil, demonstrating the persistence in the first layer in the NT condition and the percolation in deeper layers with tillage practices. In the present study, different tillage did not modify the OC content or the mineralogical composition of the soil, suggesting a possible replacement of CT with NT. Finally, we propose that NIR spectroscopy analysis, generally employed for agricultural, pharmaceutical and food products, could also be considered suitable for integration into the traditional mineralogical analysis of soil.

Supplementary Materials

The following are available online at https://0-www-mdpi-com.brum.beds.ac.uk/2571-8789/4/3/58/s1, Figure S1: Near infrared reflectance (NIR) spectra of each fraction and tillage management along the soil profile. Figure S2: Near infrared reflectance (NIR) spectra of each fraction and soil depth of the two tillage managements. Table S1: Analysis of variance and mean values of the major elements (wt %) and some trace elements (ppm) subdivided by soil depth and size fractions under CT treatment. Table S2: Analysis of variance and mean values of the mineralogical composition subdivided by soil depth and size fractions under CT treatment.

Author Contributions

Conceptualization, G.B., F.D.M., A.T. and C.C. Methodology, G.B., F.D.M., A.T., M.P. and C.C. Software, G.B., F.D.M., A.T., M.P. and C.C. Validation, G.B., F.D.M., A.T., M.P. and C.C. Formal analysis, F.D.M. and M.P. Investigation, F.D.M. Resources, G.B. and C.C. Data curation, G.B. and A.T. Writing—original draft preparation, A.T. Writing—review and editing, G.B., F.D.M., A.T., M.P. and C.C. Visualization, G.B. and C.C. Supervision, G.B. Project administration, G.B. Funding acquisition, G.B. All authors have read and agreed to the published version of the manuscript.

Funding

This research received no external funding.

Acknowledgments

The authors wish to thank Rocco Laviano of the Dipartimento di Scienze della Terra e Geoambientali, and Ignazio Allegretta of the Dipartimento di Scienze del Suolo, della Pianta e degli Alimenti, University of Bari for their valuable suggestions. The authors acknowledge the Apulia region for using scientific instrumentation acquired with the RELA-VALBIOR project.

Conflicts of Interest

The authors declare no conflict of interest.

References

  1. Kölbl, A.; Kögel-Knabner, I. Content and composition of free and occluded particulate organic matter in a differently textured arable Cambisol as revealed by solid-state13C NMR spectroscopy. J. Plant Nutr. Soil Sci. 2004, 167, 45–53. [Google Scholar] [CrossRef]
  2. Baldock, J.A.; Skjemstad, J.O. Soil organic carbon/soil organic matter. In Soil Analysis: An Interpretation Manual; Peverill, K.I., Sparrow, L.A., Reuter, D.J., Eds.; CSIRO Publishing: Collingwood, Australia, 1999; pp. 159–170. [Google Scholar]
  3. Kaiser, K.; Guggenberger, G. Mineral surfaces and soil organic matter. Eur. J. Soil Sci. 2003, 54, 219–236. [Google Scholar] [CrossRef]
  4. Kögel-Knabner, I.; Guggenberger, G.; Kleber, M.; Kandeler, E.; Kalbitz, K.; Scheu, S.; Eusterhues, K.; Leinweber, P. Organo-mineral associations in temperate soils: Integrating biology, mineralogy, and organic matter chemistry. J. Plant Nutr. Soil Sci. 2008, 171, 61–82. [Google Scholar] [CrossRef]
  5. Pronk, G.J.; Heister, K.; Kögel-Knabner, I. Is turnover and development of organic matter controlled by mineral composition? Soil. Biol. Biochem. 2013, 67, 235–244. [Google Scholar] [CrossRef]
  6. Wiseman, C.L.S.; Püttmann, W. Interactions and mineral phases in the preservation of soil organic matter. Geoderma 2006, 134, 109–118. [Google Scholar] [CrossRef]
  7. Han, L.; Sun, K.; Jin, J.; Xing, B. Some concepts of soil organic carbon characteristics and mineral interaction from a review of literature. Soil Biol. Biochem. 2016, 94, 107–121. [Google Scholar] [CrossRef]
  8. Baldock, J.; Skjemstad, J. Role of the soil matrix and minerals in protecting natural organic materials against biological attack. Org. Geochem. 2000, 31, 697–710. [Google Scholar] [CrossRef]
  9. Kaiser, K.; Guggenberger, G. The role of DOM sorption to mineral surfaces in the preservation of organic matter in soils. Org. Geochem. 2000, 31, 711–725. [Google Scholar] [CrossRef]
  10. Six, J.; Conant, R.T.; Paul, E.A.; Paustian, K. Stabilization mechanisms of soil organic matter: Implications for C-saturation of soils. Plant Soil 2002, 241, 155–176. [Google Scholar] [CrossRef]
  11. Feng, W.; Plante, A.F.; Six, J. Improving estimates of maximal organic carbon stabilization by fine soil particles. Biogeochemistry 2013, 112, 81–93. [Google Scholar] [CrossRef]
  12. Huang, X.; Jiang, H.; Li, Y.; Ma, Y.; Tang, H.; Ran, W.; Shen, Q. The role of poorly crystalline iron oxides in the stability of soil aggregate-associated organic carbon in a rice–wheat cropping system. Geoderma 2016, 279, 1–10. [Google Scholar] [CrossRef]
  13. Totsche, K.U.; Amelung, W.; Gerzabek, M.H.; Guggenberger, G.; Klumpp, E.; Knief, C.; Lehndorff, E.; Mikutta, R.; Peths, S.; Prechtel, A.; et al. Microaggregates in soils. J. Plant Nutr. Soil Sci. 2018, 181, 104–136. [Google Scholar] [CrossRef]
  14. Kleber, M.; Mikutta, R.; Torn, M.; Jahn, R. Poorly crystalline mineral phases protect organic matter in acid subsoil horizons. Eur. J. Soil Sci. 2005, 56, 717–725. [Google Scholar] [CrossRef]
  15. Steffens, M.; Rogge, D.M.; Mueller, C.W.; Hoschen, C.; Lugmeier, J.; Kolbl, A.; Kogel-Knabner, I. Identification of distinct functional microstructural domains controlling C storage in soil. Environ. Sci. Technol. 2017, 51, 12182–12189. [Google Scholar] [CrossRef] [PubMed]
  16. Gu, B.; Schmitt, J.; Chen, Z.; Liang, L.; McCarthy, J.F. Adsorption and desorption of natural organic matter on iron oxide: Mechanisms and models. Environ. Sci. Technol. 1994, 28, 38–46. [Google Scholar] [CrossRef]
  17. Wu, C.-Y.; Zhuang, L.; Zhou, S.-G.; Yuan, Y.; Yuan, T.; Li, F.-B. Humic substance-mediated reduction of iron (III) oxides and degradation of 2,4-D by an alkaliphilic bacterium, Corynebacterium humireducens MFC-5. Microb. Biotechnol. 2013, 6, 141–149. [Google Scholar] [CrossRef]
  18. Gu, B.; Chen, J. Enhanced microbial reduction of Cr(VI) and U(VI) by different natural organic matter fractions. Geochim. Cosmochim. Acta 2003, 67, 3575–3582. [Google Scholar] [CrossRef]
  19. Duiker, S.W.; Rhoton, F.E.; Torrent, J.; Smeck, N.E.; Lal, R. Iron(hydr)oxide crystallinity effects on soil aggregation. Soil Sci. Soc. Am. J. 2003, 67, 606–611. [Google Scholar] [CrossRef]
  20. Hubert, F.; Caner, L.; Meunier, A.; Ferrage, E. Unraveling complex b2 μm clay mineralogy from soils using X-ray diffraction profile modeling on particle-size subfractions: Implications for soil pedogenesis and reactivity. Am. Mineral. 2012, 97, 384–398. [Google Scholar] [CrossRef]
  21. Wagai, R.; Kajiura, M.; Uchida, M.; Asano, M. Distinctive roles of two aggregate binding agents in allophanic Andisols: Young carbon and poorly-crystalline metal phases with old carbon. Soil Syst. 2018, 2, 29. [Google Scholar] [CrossRef]
  22. De Mastro, F.; Cocozza, C.; Brunetti, G.; Traversa, A. Chemical and spectroscopic investigation of different soil fractions as affected by soil management. Appl. Sci. 2020, 10, 2571. [Google Scholar] [CrossRef]
  23. Xie, X.-L.; Pan, X.-Z.; Sun, B. Visible and near-infrared diffuse reflectance spectroscopy for prediction of soil properties near a copper smelter. Pedosphere 2012, 22, 351–366. [Google Scholar] [CrossRef]
  24. Zhang, D.; Zhou, Z.; Zhang, B.; Du, S.; Liu, G. The effects of agricultural management on selected soil properties of the arable soils in Tibet, China. Catena 2012, 93, 1–8. [Google Scholar] [CrossRef]
  25. Pantenburg, F.J.; Beier, T.; Hennrich, F.; Mommsen, H. The fundamental parameter method applied to X-ray fluorescence analysis with synchrotron radiation. Nucl. Instrum. Methods Phys. Res. Sect. B 1992, 68, 125–132. [Google Scholar] [CrossRef]
  26. Hunt, G.R.; Salisbury, J.W. Visible and near infrared spectra of minerals and rocks. I. Silicate minerals. Mod. Geol. 1970, 1, 283–300. [Google Scholar]
  27. Post, J.L.; Noble, P.N. The near-infrared combination band frequencies of dioctahedral smectites, micas, and illites. Clay Miner. 1993, 41, 639–644. [Google Scholar] [CrossRef]
  28. Ben-Dor, E.; Irons, J.R.; Epema, G.F. Soil reflectance. In Remote Sensing for the Earth Sciences: Manual of Remote Sensing; Rencz, A.N., Ed.; Wiley: New York, NY, USA, 1999; pp. 111–188. [Google Scholar]
  29. Shepherd, K.D.; Walsh, M.G. Development of reflectance spectral libraries for characterization of soil properties. Soil Sci. Soc. Am. J. 2002, 66, 988–998. [Google Scholar] [CrossRef]
  30. Cozzolino, D.; Morón, A. The potential of near-infrared reflectance spectroscopy to analyse soil chemical and physical characteristics. J. Agric. Sci. 2003, 140, 65–71. [Google Scholar] [CrossRef]
  31. Sorensen, L.K.; Dalsgaard, S. Determination of clay and other soil properties by near infrared spectroscopy. Soil Sci. Soc. Am. J. 2005, 69, 159–167. [Google Scholar] [CrossRef]
  32. Soil Survey Staff. Keys to Soil Taxonomy, 12th ed.; USDA-Natural Resources Conservation Service: Washington, DC, USA, 2014.
  33. De Mastro, F.; Brunetti, G.; Traversa, A.; Cocozza, C. Effect of crop rotation, fertilization and tillage on main soil properties and its water extractable organic matter. Soil Res. 2019, 57, 365–373. [Google Scholar] [CrossRef]
  34. Bornemann, L.; Welp, G.; Amelung, W. Particulate organic matter at the field scale: Rapid acquisition using MID-Infrared spectroscopy. Soil Sci. Am. J. 2010, 74, 1147–1156. [Google Scholar] [CrossRef]
  35. Margenot, A.J.; Calderón, F.J.; Magrini, K.A.; Evans, R.J. Application of DRIFTs, 13 C NMR, and PY-MBMS to characterize the effects of soil science oxidation assays on soil organic matter composition in a Mollic Xerofluvent. Appl. Spectr. 2017, 71, 1506–1518. [Google Scholar] [CrossRef] [PubMed]
  36. Shultz, L.G. Quantitative interpretation of mineralogical composition from X-ray and chemical data or Pierre Shale. U.S. Geol. Surv. Profess. Paper 1964, 391-c, 1–31. [Google Scholar]
  37. Shaw, D.B.; Stevenson, R.G.; Weaver, C.E.; Bradley, W.F. Interpretation of X-ray diffraction data. In Procedure in Sedimentary Petrology; Carver, R.E., Ed.; Wiley and Sons: New York, NY, USA, 1971; pp. 554–557. [Google Scholar]
  38. Laviano, R. Analisi mineralogica quantitativa di argille mediante diffrattometria di raggi X. In Atti Workshop “Procedure di Analisi di Materiali Argillosi”; ENEA, Ed.; ENEA: Rome, Italy, 1987; pp. 215–234. [Google Scholar]
  39. Franzini, M.; Leoni, L.; Saitta, M. A simple method to evaluate the matrix effects in X-ray fluorescence. X-ray Spectrom. 1972, 1, 151–154. [Google Scholar] [CrossRef]
  40. Franzini, M.; Leoni, L.; Saitta, M. Determination of the X-Ray Mass Absorption Coefficient by measurement of the AgKα Compton Scattered Radiation. X-Ray Spectrom. 1976, 5, 84–87. [Google Scholar] [CrossRef]
  41. Franzini, M.; Leoni, L.; Saitta, M. Enhancement Effects in X-ray fluorescence analysis of rocks. X-ray Spectrom. 1976, 5, 208–211. [Google Scholar] [CrossRef]
  42. Leoni, L.; Saitta, M. X-ray fluorescence analysis of 29 trace elements in rock and mineral standards. Rend. Soc. It. Mineral. Petrogr. 1976, 32, 497–510. [Google Scholar]
  43. Schwertmann, U. Differenzierung der Eisenoxide des Bodensdurch Extraktion mitsaurer Ammonium oxalat-Losung. Z. Pflanz. Bodenk. 1964, 105, 194–202. [Google Scholar] [CrossRef]
  44. Summa, V.; Tateo, F.; Medici, L.; Giannossi, M.L. The role of mineralogy, geochemistry and grain size in badland development in Pisticci (Basilicata, Southern Italy). Earth Surf. Process Landform 2007, 32, 980–997. [Google Scholar] [CrossRef]
  45. Akmad, N. Pedogenesis and soil taxonomy. In The Soil Orders, Volume 2; Wilding, L.P., Smeck, N.E., Hall, G.F., Eds.; Elsevier: New York, NY, USA, 1983; pp. 91–123. [Google Scholar]
  46. Brunetti, G.; Mezzapesa, G.N.; Traversa, A.; Bonifacio, E.; Farrag, K.; Senesi, N.; D’Orazio, V. Characterization of clay- and silt-sized fractions and corresponding humic acids along a Terra Rossa soil profile. CLEAN 2016, 44, 1–10. [Google Scholar] [CrossRef]
  47. Owliaie, H.R. Micromorphology of Pedogenic Carbonate Features in Soils of Kohgilouye, Southwestern Iran. J. Agric. Sci. Technol. 2012, 14, 225–239. [Google Scholar]
  48. Dubroeucq, D.; Volkoff, B. From Oxisols to Spodosols and Histosols: Evolution of the soil mantles in the Rio Negro basin (Amazonia). Catena 1998, 32, 245–280. [Google Scholar] [CrossRef]
  49. Sandler, A. Clay Distribution over the Landscape of Israel: From the Hyper-Arid to the Mediterranean Climate Regimes. Catena 2013, 110, 119–132. [Google Scholar] [CrossRef]
  50. Comino, F.; Ayora-Cañada, M.J.; Aranda, V.; Díaz, A.; Domínguez-Vidal, A. Near-infrared spectroscopy and X-ray fluorescence data fusion for olive leaf analysis and crop nutritional status determination. Talanta 2018, 188, 676–684. [Google Scholar] [CrossRef]
  51. Bishop, J.L.; Pieters, C.M.; Edwards, J.O. Infrared spectroscopic analyses on the nature of water in montmorillonite. Clay Clay Miner. 1994, 42, 702–716. [Google Scholar] [CrossRef]
  52. Heckman, K.; Throckmorton, H.; Horwath, W.R.; Swanston, C.W.; Rasmussen, C. Variation in the molecular structure and radiocarbon abundance of mineral-associated organic matter across a lithosequence of forest soils. Soil Syst. 2018, 2, 36. [Google Scholar] [CrossRef]
  53. Lalonde, K.; Mucci, A.; Ouellet, A.; Gelinas, Y. Preservation of organic matter in sediments promoted by iron. Nature 2012, 483, 198–200. [Google Scholar] [CrossRef] [PubMed]
  54. Wagai, R.; Mayer, L.M. Sorptive stabilization of organic matter in soils by hydrous iron oxides. Geochim. Cosmochim. Acta 2007, 71, 25–35. [Google Scholar] [CrossRef]
  55. Xue, B.; Huang, L.; Huang, Y.; Kubar, K.A.; Li, X.; Lu, J. Straw management influences the stabilization of organic carbon by Fe (oxyhydr)oxides in soil aggregates. Geoderma 2020, 358, 113987. [Google Scholar] [CrossRef]
  56. Spielvogel, S.; Prietzel, J.; Kogel-Knabner, I. Soil organic matter stabilization in acidic forest soils is preferential and soil type—Specific. Eur. J. Soil Sci. 2008, 59, 674–692. [Google Scholar] [CrossRef]
  57. Chenu, C.; Virto, I.; Plante, A.; Elsass, F. Clay-Size organo-mineral complexes in temperate soils. In Carbon Stabilization by Clays in the Environment; Laird, D., Cervini-Silva, J., Eds.; Clay Minerals Society: Chantilly, VA, USA, 2009; pp. 119–135. [Google Scholar]
  58. Torn, M.S.; Trumbore, S.E.; Chadwick, O.A.; Vitousek, P.M.; Hendricks, D.M. Mineral control of soil organic carbon storage and turnover. Nature 1997, 389, 170–173. [Google Scholar] [CrossRef]
  59. Rasmussen, C.; Southard, R.J.; Horwath, W.R. Mineral control of organic carbon mineralization in a range of temperate conifer forest soils. Glob. Change Biol. 2006, 12, 834–847. [Google Scholar] [CrossRef]
  60. Kramer, M.; Sanderman, J.; Chadwick, O.A.; Chorover, J.; Vitousek, P.M. Long-term carbon storage through retention of dissolved aromatic acids by reactive particles in soil. Glob. Chang. Biol. 2012, 18, 2594–2605. [Google Scholar] [CrossRef]
  61. Velde, B. Introduction to Clay Minerals: Chemistry, Origins, Uses and Environmental Significances; Chapman and Hall: London, UK, 1992. [Google Scholar]
  62. Khormali, F.; Abtahi, A. Origin and distribution of clay minerals in calcareous arid and semi-arid soils of Fars Province, southern Iran. Clay Miner. 2003, 38, 511–527. [Google Scholar] [CrossRef]
  63. Rumpel, C.; Kögel-Knabner, I. Deep soil organic matter-a key but poorly understood component of terrestrial C cycle. Plant Soil 2011, 338, 143–158. [Google Scholar] [CrossRef]
  64. Kaiser, K.; Guggenberger, G. Sorptive stabilization of organic matter by microporous goethite: Sorption into small pores vs. surface complexation. Eur. J. Soil Sci. 2007, 58, 45–59. [Google Scholar] [CrossRef]
  65. Chorover, J.; Amistadi, M.K. Reaction of forest floor organic matter at goethite, birnessite and smectite surfaces. Geochim. Cosmochim. Acta 2001, 65, 95–109. [Google Scholar] [CrossRef]
  66. Huang, X.; Feng, C.; Zhao, G.; Ding, M.; Kang, W. Carbon sequestration potential promoted by oxalate extractable iron oxides through organic fertilization. Soil Sci. Soc. Am. J. 2018, 81, 1359–1370. [Google Scholar] [CrossRef]
  67. Saidy, A.R.; Smernik, R.J.; Baldock, J.A.; Kaiser, K.; Sanderman, J. The sorption of organic carbon onto differing clay minerals in the presence and absence of hydrous iron oxide. Geoderma 2013, 209, 15–21. [Google Scholar] [CrossRef]
Figure 1. Major element concentrations, expressed as log10 (percentage + 1) of no tillage (NT) and conventional tillage (CT) treatments at 0–30 cm depth. (a) Bulk soils; (b) D fractions. Error bars indicate standard deviations of three laboratory replicates.
Soilsystems 04 00058 g001
Figure 2. Near infrared reflectance (NIR) spectra of all soil fractions isolated from different tillage treatments at three soil depths.
Soilsystems 04 00058 g002
Figure 3. Concentration of organic carbon as a function of soil depth (A), size fractions (B) and tillage (C). Error bars indicate standard deviations of three laboratory replicates. Different letters indicate statistically significant differences according to Tukey’s test at the 0.05 level.
Soilsystems 04 00058 g003
Table 1. Analysis of variance and mean values of the major elements (wt %) and some trace elements (ppm) subdivided by soil depth and size fractions under NT treatment.
SiO2TiO2Al2O3Fe2O3MnOMgOCaONa2OK2OP2O5LOISi/AlRbSrYZrNb
% ppm
Size***********************n.s.********************
Depth***n.s.n.s.n.s.n.s.**n.s.n.s.n.s.n.s.n.s.***n.s.**
Size
Bulk 50.3 bc
(0.79)
0.77 d
(0.00)
15.6 c
(0.05)
6.4 c
(0.00)
0.13 ab
(0.00)
2.9 b
(0.00)
8.3 a
(0.07)
0.8 b
(0.00)
2.4 c
(0.00)
0.1 a
(0.00)
12.3 a
(0.12)
3.2 a
(0.01)
97 c
(2.3)
206 a
(28.43)
22 d
(0.13)
144 b
(12.35)
15.0 d
(0.05)
A25.5 a
(0.40)
0.16 a
(0.00)
3.4 a
(0.01)
2.4 a
(0.00)
0.09 a
(0.00)
1.8 a
(0.00)
35.9 c
(0.33)
0.3 a
(0.00)
0.5 a
(0.00)
0.3 a
(0.00)
29.5 b
(0.29)
7.6 b
(0.03)
23 a
(0.55)
546 b
(75.34)
6 a
(0.04)
36 a
(3.08)
3 a
(0.01)
B52.9 bc
(0.83)
0.41 b
(0.00)
11.2 b
(0.04)
4.4 b
(0.01)
0.12 ab
(0.00)
2.6 ab
(0.00)
14.0 b
(0.13)
1.1 c
(0.00)
1.8 b
(0.00)
0.1 a
(0.00)
11.1 a
(0.11)
4.7 a
(0.02)
59 b
(1.42)
220 a
(30.36)
10 b
(0.06)
58 a
(4.97)
7 b
(0.02)
C56.1 bc
(0.88)
0.54 c
(0.00)
12.7 b
(0.05)
4.8 b
(0.01)
0.11 ab
(0.00)
2.7 ab
(0.00)
10.4 ab
(0.09)
1.3 c
(0.00)
1.8 b
(0.00)
0.1 a
(0.00)
9.5 a
(0.09)
4.4 a
(0.02)
64 b
(1.54)
207 a
(28.6)
16 c
(0.10)
128 b
(10.98)
10 c
(0.03)
D48.2 b
(0.76)
0.84 d
(0.00)
17.0 c
(0.06)
6.8 c
(0.01)
0.14 b
(0.00)
3.0 b
(0.00)
7.8 a
(0.07)
0.7 b
(0.00)
2.4 c
(0.00)
0.1 a
(0.00)
12.9 a
(0.12)
2.8 a
(0.01)
106 c
(2.5)
220 a
(30.36)
25 d
(0.15)
155 b
(13.30)
17 e
(0.06)
Depth
0–3048.9 b
(0.60)
0.57 b
(0.00)
12.2 a
(0.03)
5.1 a
(0.00)
0.12 a
(0.00)
2.5 a
(0.00)
13.4 a
(0.09)
0.9 b
(0.00)
1.8 a
(0.00)
0.2 a
(0.00)
14.2 a
(0.11)
4.5 a
(0.03)
72 a
(1.33)
250 a
(26.75)
17 b
(0.08)
118 b
(7.84)
11 b
(0.03)
30–6046.7 ab
(0.56)
0.55 ab
(0.00)
11.9 a
(0.03)
5.0 a
(0.00)
0.12 a
(0.00)
2.5 a
(0.00)
15.3 ab
(0.11)
0.8 ab
(0.00)
1.8 a
(0.00)
0.2 a
(0.00)
15.0 a
(0.12)
4.4 a
(0.03)
69 a
(1.28)
276 a
(29.53)
16 ab
(0.07)
104 ab
(6.91)
10 a
(0.03)
60–9044.2 a
(0.54)
0.51 a
(0.00)
11.8 a
(0.03)
4.8 a
(0.00)
0.12 a
(0.00)
2.8a
(0.00)
17.1 b
(0.12)
0.7 a
(0.00)
1.7 a
(0.00)
0.1 a
(0.00)
16.0 a
(0.12)
4.8 a
(0.03)
68 a
(1.26)
320 a
(34.24)
15 a
(0.07)
90 a
(5.98)
10 a
(0.03)
The values in each column of the fractions size or the soil depth followed by a different letter are significantly different according to Tukey’s test. * Significant at p ≤ 0.05; ** significant at p ≤ 0.01; *** significant at p ≤ 0.001; n.s.: not significant.
Table 2. Analysis of variance and mean values of the mineralogical composition subdivided by soil depth and size fractions under NT treatment.
SmIll + MsKlnChQzCalKfs + PlΣC.M.
%
Size*************n.s.***
Depthn.s.n.s.n.s.n.s.n.s.*n.s.n.s.
Size
Bulk11 c19 b5 c19 cd21 a13 a12 a54 c
A2 a2 a0 a7 a 18 a64 b8 a10 a
B6 ab 16 b1 ab12 ab29 ab20 a16 a35 b
C5 ab19 b1 ab16 bc34 b15 a10 a40 b
D11 c19 b4 bc23 d20 a12 a12 a56 c
Depth
0–305 a15 a2 a17 a27 a22 a12 a39 a
30–609 a14 a2 a15 a25 a25 ab11 a39 a
60–907 a17 a2 a14 a22 a28 b10 a39 a
The values in each column of the fraction size and the soil depth followed by a different letter are significantly different according to Tukey’s test. * Significant at p ≤ 0.05; ** significant at p ≤ 0.01; *** significant at p ≤ 0.001; n.s.: not significant. Sm: smectite; Ill + Ms: illite + muscovite; Kln: kaolinite; Ch: chlorite; Qz: quartz; Cal: calcite; Kfs + Pl: K-feldspar + plagioclase; C.M.: clay minerals.
Table 3. Analysis of variance and mean values of amorphous oxides subdivided by soil depth, size fractions (C and D) and tillage.
AlFeMn
ppm
Depthn.s.n.s.n.s.
Tillagen.s.n.s.n.s.
Size********
Depth
0–30704 a545 a212 a
30–60450 a474 a161 a
60–90679 a466 a121 a
Tillage
NT539 a454 a141 a
CT716 a535 a189 a
Size
C238 a211 a97 a
D1017 b779 b232 b
The values in each column followed by a different letter are significantly different according to Tukey’s test. ** significant at p ≤ 0.01; *** significant at p ≤ 0.001; n.s.: not significant.

